Article

Design and Crushing Characteristics of Double-Rotor Vertical-Shaft-Impact Sand-Making Machine

1
School of Mechanical and Electrical Engineering, Xuzhou University of Technology, Xuzhou 221018, China
2
School of Mechatronic Engineering, China University of Mining and Technology, Xuzhou 221116, China
3
National Key Laboratory of intelligent Mining Equipment Technology, China University of Mining and Technology, Xuzhou 221116, China
*
Authors to whom correspondence should be addressed.
Processes 2025, 13(9), 2974; https://doi.org/10.3390/pr13092974
Submission received: 21 July 2025 / Revised: 12 September 2025 / Accepted: 15 September 2025 / Published: 18 September 2025
(This article belongs to the Section Process Control and Monitoring)

Abstract

The traditional vertical-shaft-impact sand-making machine has the problems of uneven discharge particles and discharge port wear. To solve these problems, the influence of the main structural parameters (number of impact rotors, angle of impact plates, angle of anvil, and number of teeth on the anvil) on sand production is researched through orthogonal testing and polar analysis. The results show that the parameters’ degrees of influence on the sand production rate are as follows: the angle of impact plates, the number of impact plates, the angle of the anvil, and the number of teeth on the anvil. The double rotor exhibits the best crushing effect when the number of impact rotors is six, the angle of the impact plate is 0°, the angle of the anvil plate is 0°, and the number of teeth on the anvil plate is 89. By taking the working speed of the double rotors as a factor, an equal-level uniform design table is constructed for the double-rotor crushing system. Polynomial regression analysis shows that the best crushing effect occurs when the accelerating rotor speed is 1200 r/min and the impact rotor speed is 585 r/min. Finally, the crushing characteristics of the double-rotor vertical-shaft-impact sand-making machine are simulated and analyzed to obtain the kinetic energy distribution of particles in the crushing chamber. The kinetic energy of particles in the main crushing area is determined, and the wear pattern of the discharge port and parts is identified.

1. Introduction

Sand and gravel aggregates are fundamental materials for infrastructure projects related to construction, roads, and water conservancy. National demand for sand and gravel resources continues to grow, while the supply of natural river sand is gradually decreasing. Manufactured sand and gravel have become the primary sources of construction sand. Traditional vertical-shaft-impact sand-making machines perform only one main impact crushing event, which easily results in an uneven discharge particle size. Furthermore, the residual kinetic energy of uncrushed particles directly acts on the discharge port, causing unnecessary wear.
As a key component of the vertical-shaft-impact sand-making machine, the rotor participates in directly crushing particles, provides acceleration for incoming material, and supplies kinetic energy for collisions between particles and the anvil plate. Scholars both domestically and internationally have conducted in-depth research on rotors and their components. The Crusher Company in Ohio, USA [1] developed a vertical-shaft impact crusher with a rotor automatic balancing system, allowing only the replacement of worn parts instead of the entire assembly. Cemco [2] produced the Turbo175 vertical-shaft impact crusher, where the number of guide plates installed can be selected according to production needs, and the impact speed can be adjusted by changing the distance between the guide plate and the impact plate. Impact Service Corp [3] designed a 130-type vertical-shaft crusher utilizing a higher turntable, increasing the feed particle size and rotor speed. Oliveira et al. [4] analyzed the energy distribution during particle collisions inside the rotor using EDEM, finding that rock-on-rock mode can extend the machine’s service life. Li Zhenmin [5] proposed synchronous crushing, where the velocity of material immediately after the first impact crushing process is utilized for the second impact crushing process, allowing the material to achieve higher impact speeds while saving 50% energy. Grunditz et al. [6] studied the motion trajectory of material inside the rotor, discovering that synchronous vertical-shaft impact crushers offer advantages over traditional rotors in terms of yield, service life, and energy efficiency. Luo Man et al. [7] investigated the influence of rotor speed, feed rate, particle radius, and bed-to-hammer spacing on sand production yield in vertical-shaft impact (VSI) crushers through simulation experiments. Duan Derong et al. [8] elucidated particle kinematics within the rotor, revealing that under stable operating conditions, particle velocity increases with radial distance, with approximately 80% of particles attaining maximum velocity. They further demonstrated that velocity variations significantly govern particle–particle interactions. Bwalya Murray M. et al. [9] employed the Discrete Element Method (DEM) to conduct comparative numerical simulations of single-rotor versus dual-rotor impact crushers. Feng Feifei et al. [10], through EDEM post-processing analysis, established that both the force distribution and motion trajectory of the rotor split cone are predominantly governed by particle normal forces. Grunditz Simon et al. [11] developed an energy-based breakage theory modeling framework for VSI crushers, enabling prediction of product output across varying rotor tip speeds. Hakan Dündar [12] further substantiated that particle size reduction performance in VSI crushers is primarily determined by rotor tip speed rather than particle morphology. Feng Feifei et al. [13] established a wear model for predicting the wear value of the split cone and verified its validity. Wu Canhui et al. [14,15] proposed a rotational impact breakage distribution characterization method, observing that an increased rotor speed induces a unimodal sub-particle size distribution in crushed products with progressively larger peak sizes. Their subsequent work implemented a coupled CFD-DEM approach, uncovering region-specific distributions of collision energy and frequency within particle swarms in the crushing chamber, thereby providing a theoretical foundation for energy-optimized crusher design. Guo Jianbo et al. [16] integrated the DEM with the Ab-t10 breakage model to establish a multivariate nonlinear regression model, correlating crusher chamber geometry with performance metrics using Response Surface Methodology (RSM). Kuang Dumin et al. [17] presented a particle breakage simulation method based on the Discrete Element Method (DEM) framework. The proposed approach successfully reproduces both the macro-scale shear response and particle breakage characteristics of crushable particle assemblies. Chen Zeren et al. [18,19] similarly combined DEM and RSM to quantify the effects of the mantle shaft angle, concave angle, eccentricity angle, and rotational speed on operational performance, subsequently achieving multi-objective optimization via genetic algorithms. Wang Chonghui et al. [20] demonstrated that VSI rotor speed modulates aggregate particle size and crack density through input power variation while revealing mineral composition’s influence on particle shape–collision behavior correlations. Fang Huaiying et al. [21] validated the reliability of DEM-simulated particle motion characteristics within stone powder separators. Juliana Segura-Salazar [22] applied the Whiten model to establish a mathematical modeling framework for vertical shaft impact crushers.
Through domestic and international research, it was found that existing vertical-shaft-impact sand-making machines have a low sand production rate. The discharge often requires screening to separate oversized particles for secondary crushing, necessitating the addition of a return flow line, increasing production costs, and easily causing dust pollution. Additionally, during the crushing process in existing machines, some particles directly impact the discharge port, wasting residual kinetic energy and causing wear on discharge port components. To solve the aforementioned problems, this paper first establishes a feed particle model and uses the discrete element simulation method to analyze the working characteristics of a single-rotor crushing system in a vertical-shaft-impact sand-making machine. It investigates the distribution of particle mass and kinetic energy, exploring the locations of residual particle kinetic energy within the crushing chamber. Secondly, a secondary impact device is added below the rotor at the location where particle kinetic energy is concentrated. This utilizes the residual kinetic energy of particles after the first impact, increasing the momentum for the second impact, thereby enhancing the turbulence of the particle flow in the crushing chamber, improving the probability of inter-particle collisions, and boosting the crushing efficiency of the sand-making machine. Finally, the crushing characteristics of the impact device are studied to obtain structural parameters, yielding a higher sand production rate and a rotational speed scheme with lower energy consumption. A wear simulation analysis of the relevant structural crushing system is conducted to clarify the wear locations of various components, providing guidance for improving the wear resistance and impact resistance of the sand-making machine.

2. Double-Rotor Structural Design

As shown in Figure 1, which illustrates the structure of the impact rotor and anvil plate, four structural factors affect the sand production rate of the double-rotor crushing system: the number of impact plates on the rotor, the angle of the impact plates, the angle of the anvil plate, and the number of teeth on the anvil plate. To study the influence of these four structural factors, a model of the double-rotor crushing system for a vertical-shaft-impact sand-making machine was developed in SolidWorks 2021. Based on the orthogonal experimental design method, the value range for each factor was determined, resulting in a four-factor, four-level table of structural parameters for the double-rotor crushing system, as presented in Table 1.
In the orthogonal table design, a, b, c, and d represent the factors influencing the sand production rate of the sand-making machine: the number of impact plates (G), the angle of impact plates (α), the angle of the anvil plate (β), and the number of teeth on the anvil plate (T). The subscript numbers 1, 2, 3, and 4 for a, b, c, and d represent the levels corresponding to each structural factor, i.e., the experimental value for that factor. Based on common orthogonal table header designs, the orthogonal table was designed as shown in Table 2.
Double-rotor crushing structures were modeled in SolidWorks 2021 based on the different factor combinations listed in Table 2. These models were then imported into EDEM software 2023, and simulations were conducted under consistent operating conditions, including the same feed rate, accelerating rotor speed, and impact rotor speed. The sand production rates for each combination were statistically evaluated to determine the primary and secondary influences of the various factors on the crushing system, as well as the trends between the factors and the performance indicator. To minimize the influence of the initial unstable state on the test results, the sand production rate over time was compared for each double-rotor configuration. The average sand production rate after 6 s was used as the final value for each scheme. Among all the schemes, Scheme 13 achieved the highest sand production rate at 80.03%, whereas Scheme 4 yielded the lowest at 75.85%, representing a difference of 4.18%.
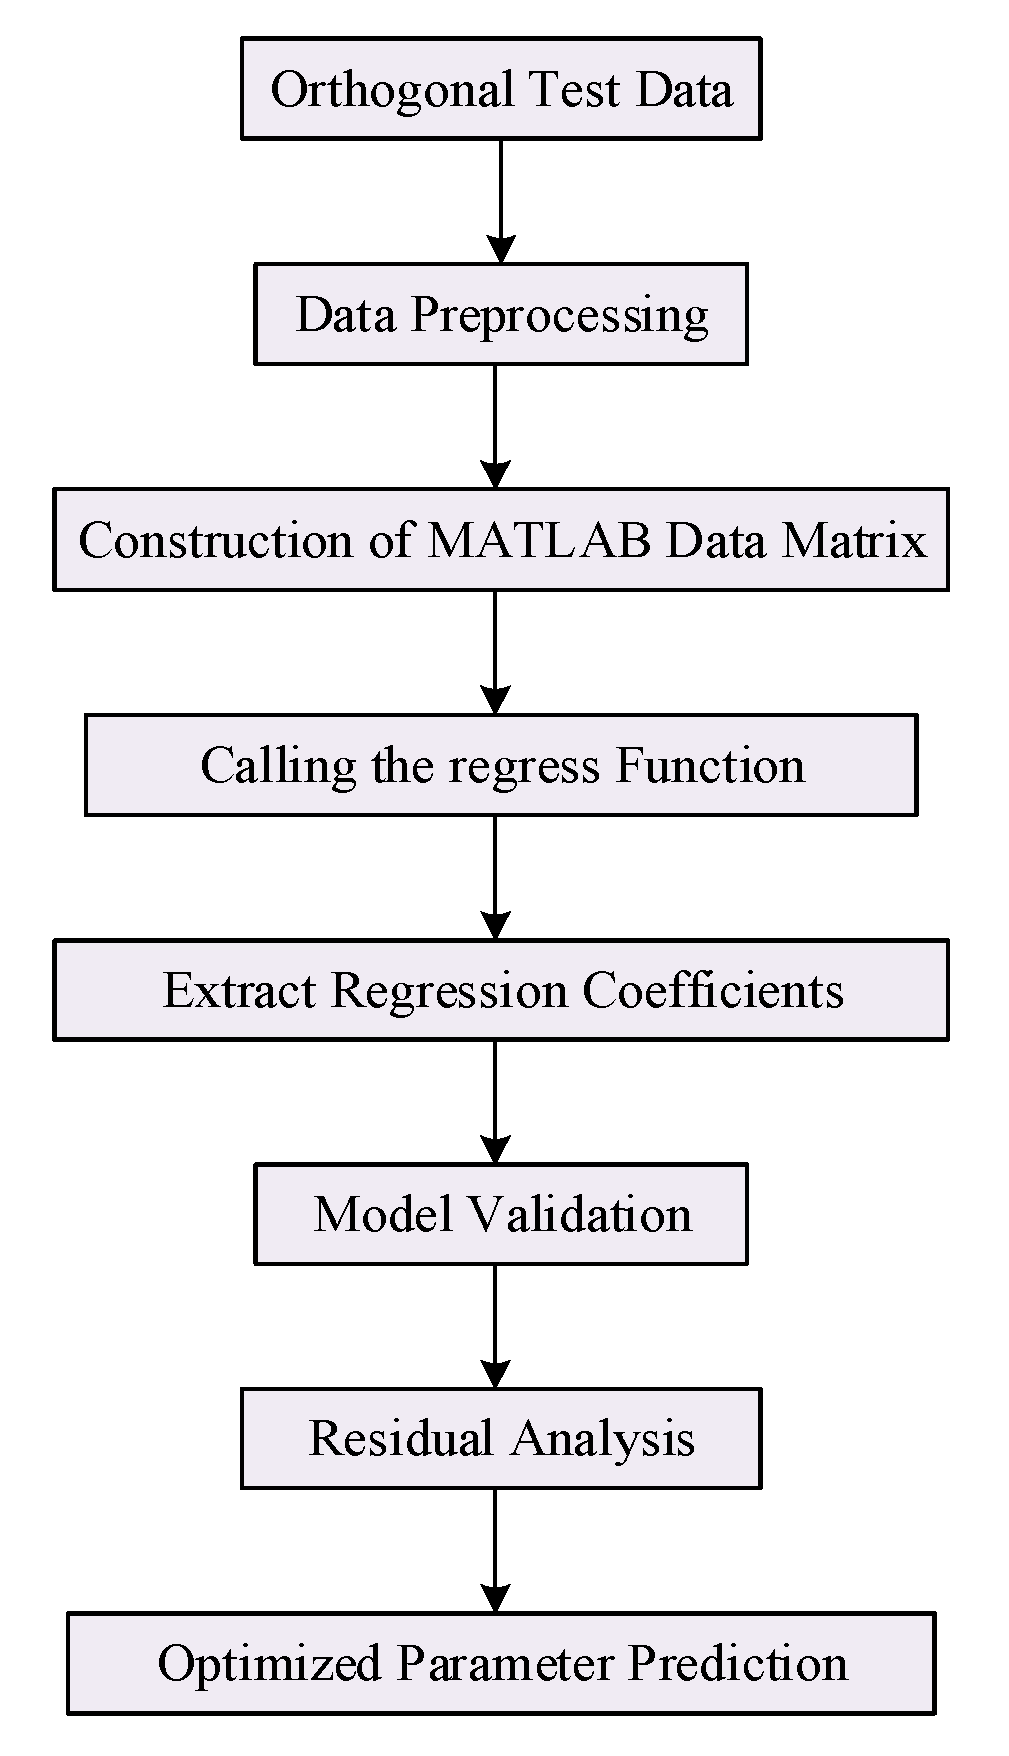
The data from the above 16 sets of tests were calculated and compiled into Table 2, obtaining the sand production rate of the crushing system under different structural parameters for the impact rotor and anvil plate. The range analysis method was used to solve for the range, intuitively analyzing the primary and secondary influences of different factors on the crushing effect of material particles. The flowchart for constructing the regression model is shown in Figure 2.
The range reflects the extent of a factor’s influence on the test indicator and is calculated as the difference between the maximum and minimum average values across the levels of that factor column. Table 2 includes a blank column, the range analysis of which was employed to validate the reasonableness of the other structural factors, interactions, and experimental errors. The computed range for the blank column was only 0.28, significantly lower than those of the selected structural factors, indicating that the experimental factors chosen for this test were appropriate. By comparing the range values in Table 2, the order of influence of the double-rotor structural parameters on the sand production rate of the crushing system, from greatest to least, is as follows: the angle of impact plates, the number of impact plates, the angle of the anvil plate, and the number of teeth on the anvil plate. A smaller angle of impact plates leads to a higher sand production rate. Using five impact plates results in a better sand production effect. The angle of the anvil plate and the number of teeth on the anvil plate do not have a significant influence on the double-rotor crushing system, causing only minor variations in the sand production rate.
To obtain the structural parameters of the double-rotor crushing system with a relatively high sand production rate, the MATLAB 2023 software’s regress function was used to perform a multiple nonlinear regression analysis of the structural parameters and sand production rate of each scheme. The functional relationship between the sand production rate of the crushing system and the four structural factors (number of impact plates, angle of impact plates, inclination angle of the anvil plate, and number of teeth on the anvil plate) was obtained, as shown in Equation (1).
Y = 59.6659 + 1.7375 X 1 0.0951 X 2 0.1839 X 3     + 0.3572 X 4 0.1450 X 1 2 + 0.0005 X 2 2     + 0.0115 X 3 2 0.0012 X 4 2
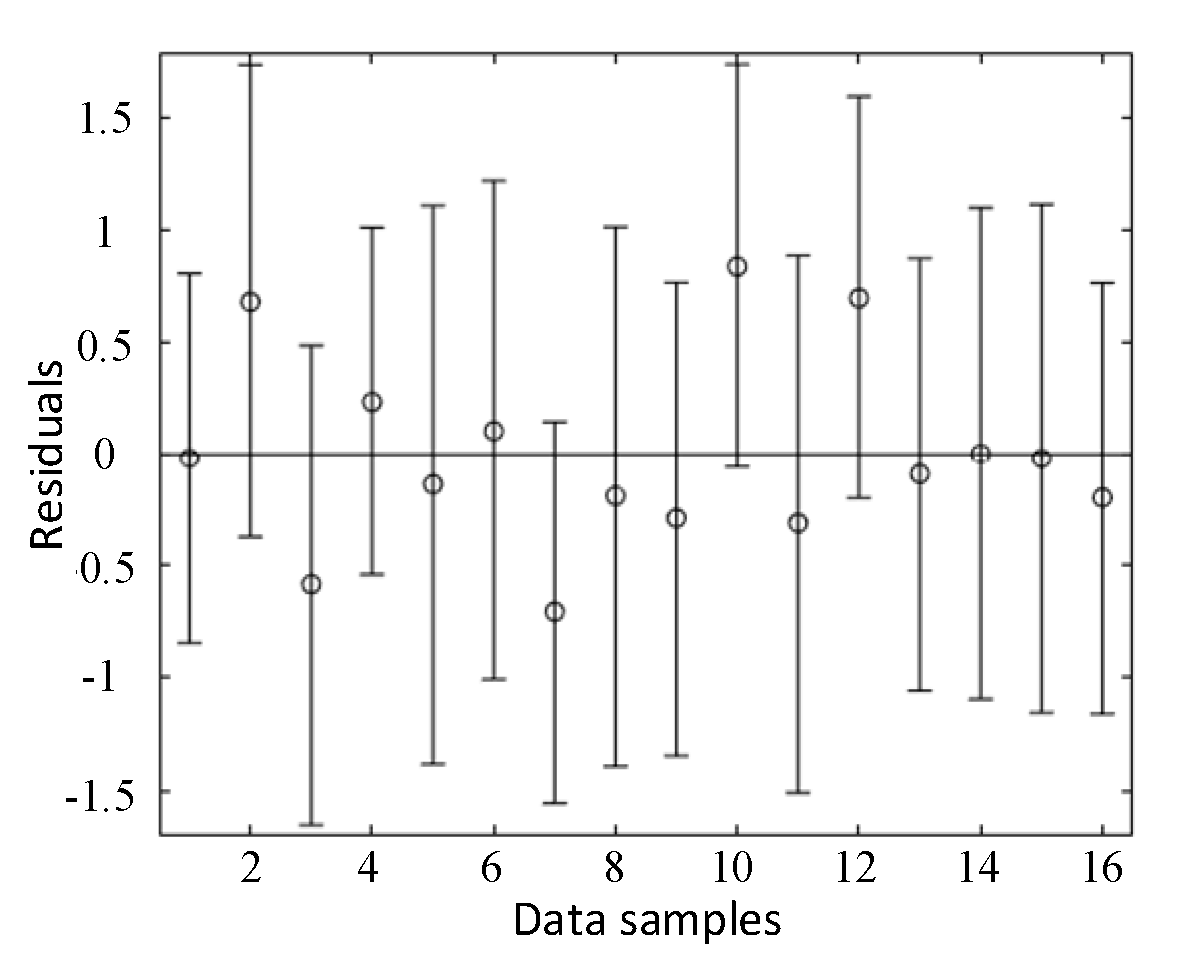
where Y is the sand production rate of the double-rotor crushing system, X1 represents the number of impact plates, X2 represents the angle of impact plates, X3 represents the inclination angle of the anvil plate, and X4 represents the number of teeth on the anvil plate. Taking the four structural parameters as optimization objects and the sand production rate of the double-rotor structure crushing system as the evaluation index, the values that maximize Y were found to be X1 = 6, X2 = 0, X3 = 0, and X4 = 89. The residual plot of the regression analysis for the orthogonal test results is shown in Figure 3. The residuals for all schemes are less than ±1.5, indicating that the equation fitting is effective and the established regression model is valid. Furthermore, the coefficient of determination (R2) for the regression model is 0.92, and the adjusted R2 value is 0.89, indicating that the equation fitting is highly effective and the established regression model is statistically significant.
Among the total of 16 orthogonal test results in Table 3, the parameter combination of Scheme 4 resulted in the worst sand production rate for the double-rotor crushing system, while Scheme 13 resulted in the best. Table 4 compares the parameter combinations of Scheme 4 and Scheme 13 and the optimized combination obtained from Equation (1).
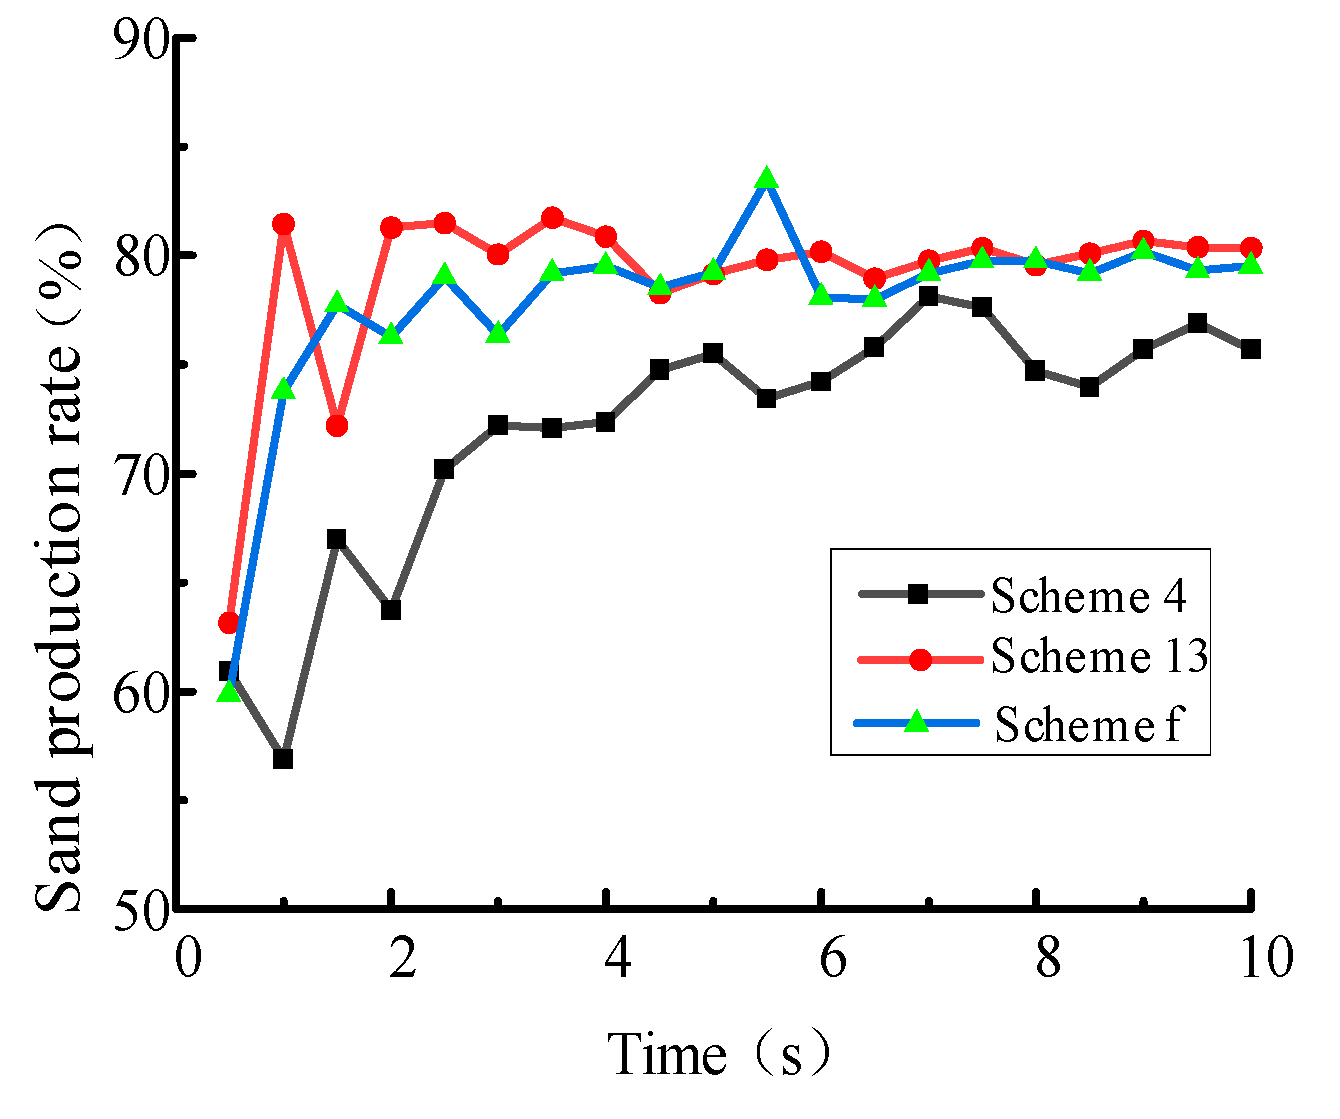
Based on the optimized structural parameters of the double-rotor crushing system, the corresponding geometric model was established and imported into EDEM software 2023. Keeping the other simulation conditions unchanged, a crushing simulation was performed, and the relationship between the sand production rate and time before and after optimization was statistically analyzed. As shown in Figure 4, the sand production rate of the crushing system after optimization of the double-rotor structure is close to that of the optimal combination in the orthogonal test (Scheme 13), and the sand production effects of both are significantly better than those observed when using Scheme 4.
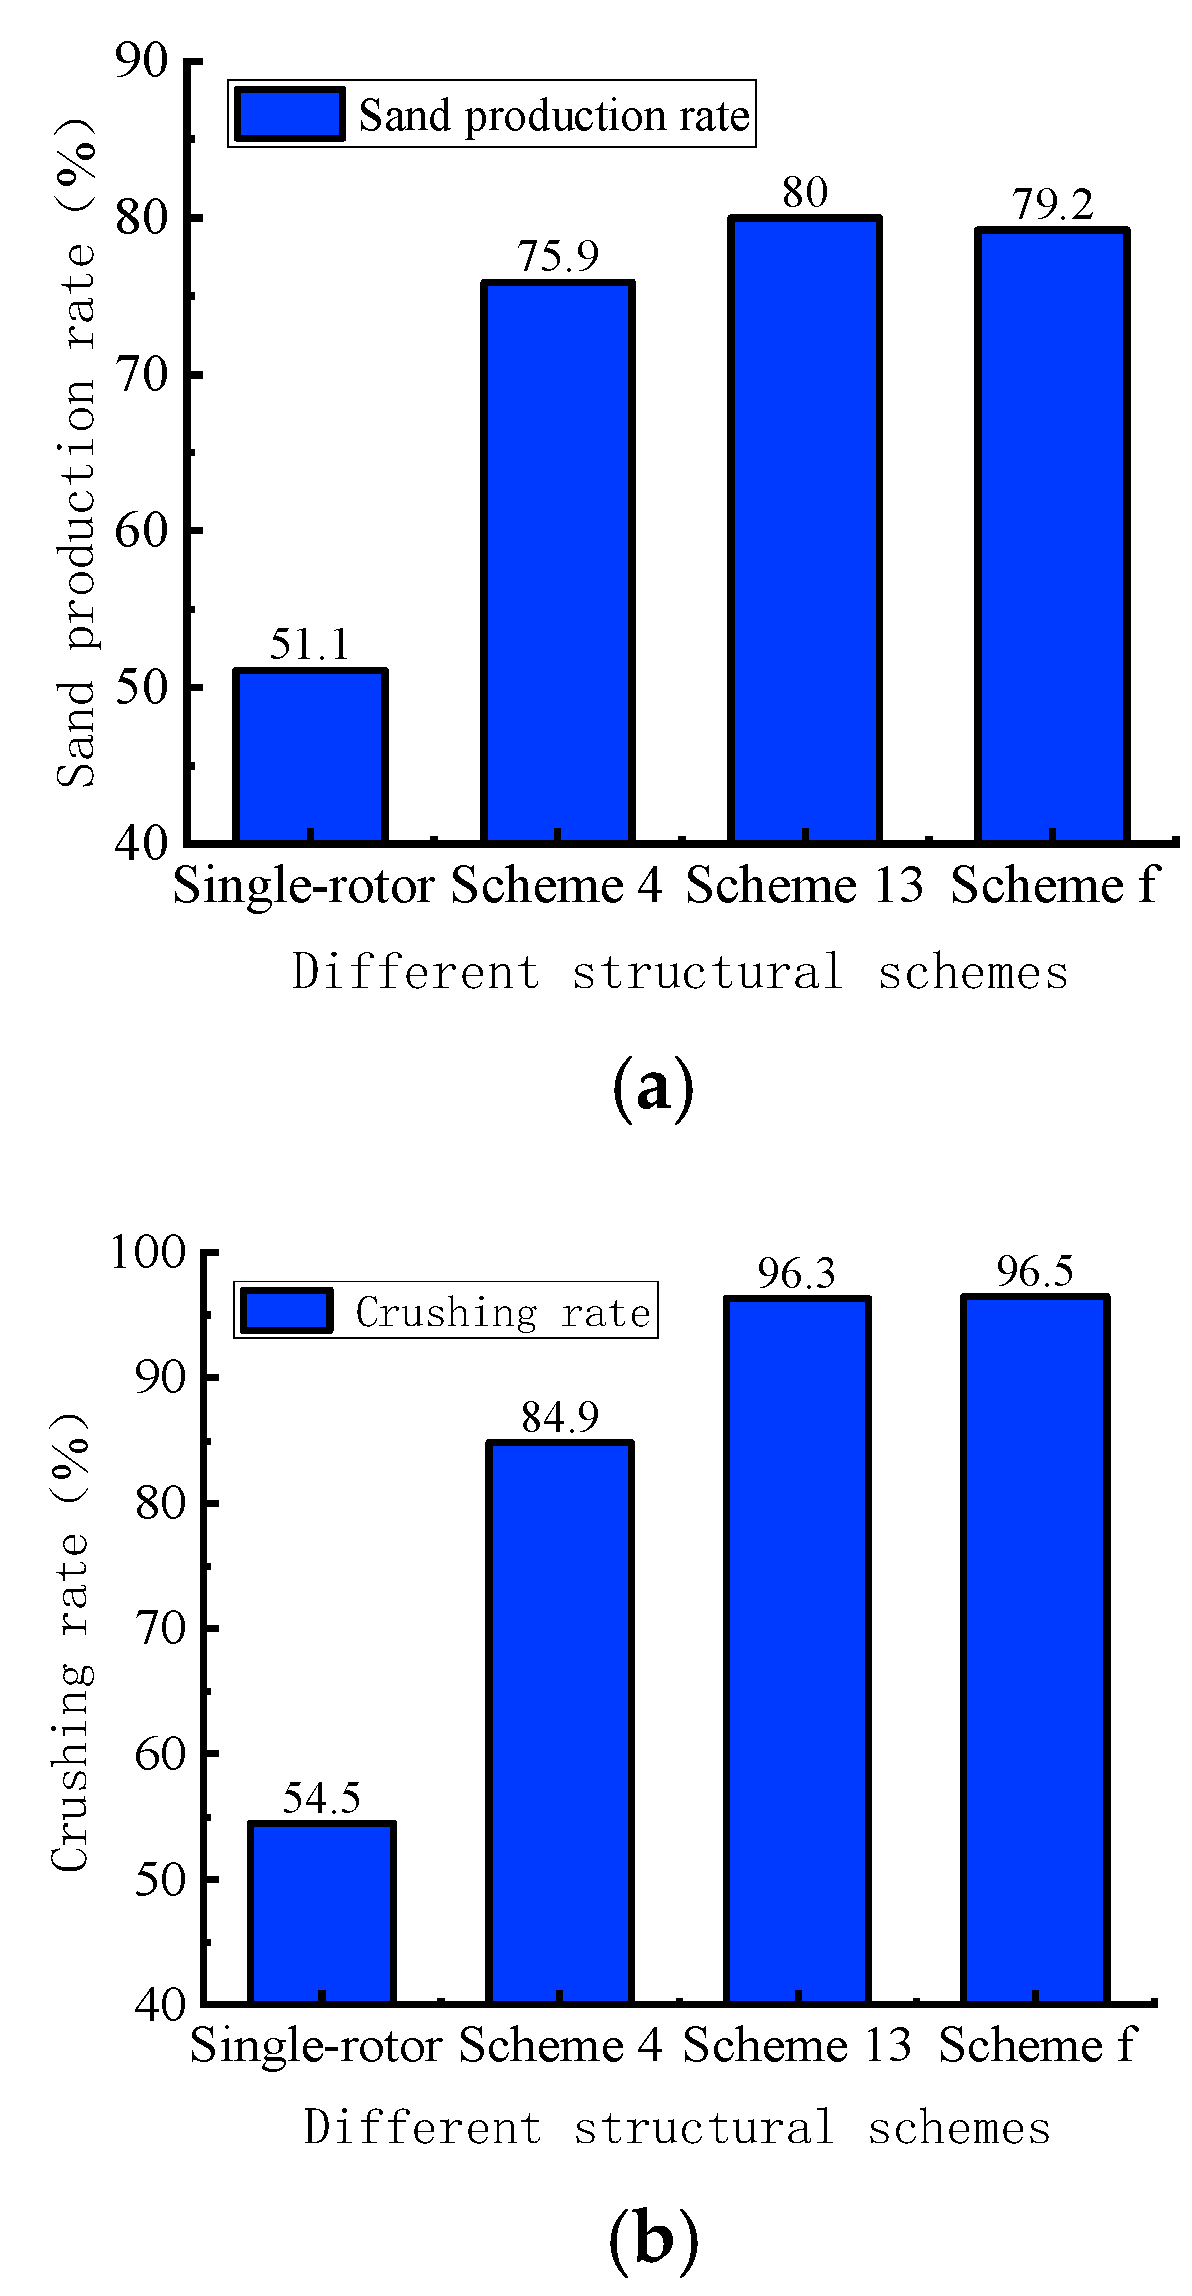
To intuitively analyze the improvement effect of the double-rotor structure on sand production, the sand production rates of the three schemes in Table 4 were compared with that of a single rotor at a stable operating state after 6 s of operation. The single-rotor speed was 1000 r/min, and the feed rate was the same for both single and double rotors. The sand production rate comparison is shown in Figure 5a.
Compared to the sand production rate of 51.1% achieved by the single-rotor (accelerating rotor) crushing system operating at 1000 r/min, the double-rotor system operating at 1000 r/min (accelerating rotor) and 600 r/min (impact rotor) demonstrates a significantly higher sand production rate. Even Scheme 4 of the orthogonal test, which had the lowest sand production rate among all double-rotor configurations, still exceeded the performance of the single-rotor system by 24.8%.
However, when comparing the optimized Scheme f with Scheme 13 (the best-performing combination from the orthogonal test), it was observed that the sand production rate of Scheme f was lower than that of Scheme 13, which contradicts the predictions of the regression analysis. This discrepancy arises because the structural optimization of the double-rotor system enhances its crushing capability, leading not only to an increase in the mass of particles with a size of 4.75 mm but also to a more pronounced increase in the mass of fine particles below 0.15 mm. According to the formula for the sand production rate, if the growth rate of particles below 4.75 mm is slower than that of particles below 0.15 mm, the overall sand production rate may actually decrease.
To better evaluate crushing performance, the concept of crushing rate was introduced. It is defined as the total mass of particles below 4.75 mm divided by the total mass in the outlet statistical area, multiplied by 100%. As illustrated in Figure 5b, the crushing rate of Scheme f is indeed higher than that of Scheme 13, confirming the validity of the above analysis.

3. Double-Rotor Optimal Speed Analysis

As is known from Section 2, the sand production rate does not continuously increase with the enhancement of the system’s crushing capability, because excessive crushing capability will lead to an increased dust content, causing a decrease in the sand production rate and energy waste. Therefore, it is necessary to study the optimal speed of the double-rotor structure to obtain a speed scheme with strong crushing capability and high energy utilization. Based on the speed range of traditional vertical-shaft-impact sand-making machines and the simulation crushing results of the double-rotor structure crushing system, the levels for the speeds of the two rotors were selected as follows: 500 r/min, 600 r/min, 700 r/min, 800 r/min, 900 r/min, 1000 r/min, 1100 r/min, and 1200 r/min. According to the uniform design rules, the equal-level uniform design table U8*(85) was chosen, as shown in Table 5.
According to the usage table of this uniform design table, the two columns with the least deviation when selecting two factors were chosen to formulate the test plan, as shown in Table 6.
Columns 1 and 3 from the uniform design table were combined to arrange the tests, where the deviation was the smallest at only 0.1445. By integrating Table 5 and Table 6 and the level values taken by the two rotors, a table was formulated for the uniform design test plan for the double-rotor structure crushing system, as shown in Table 6.
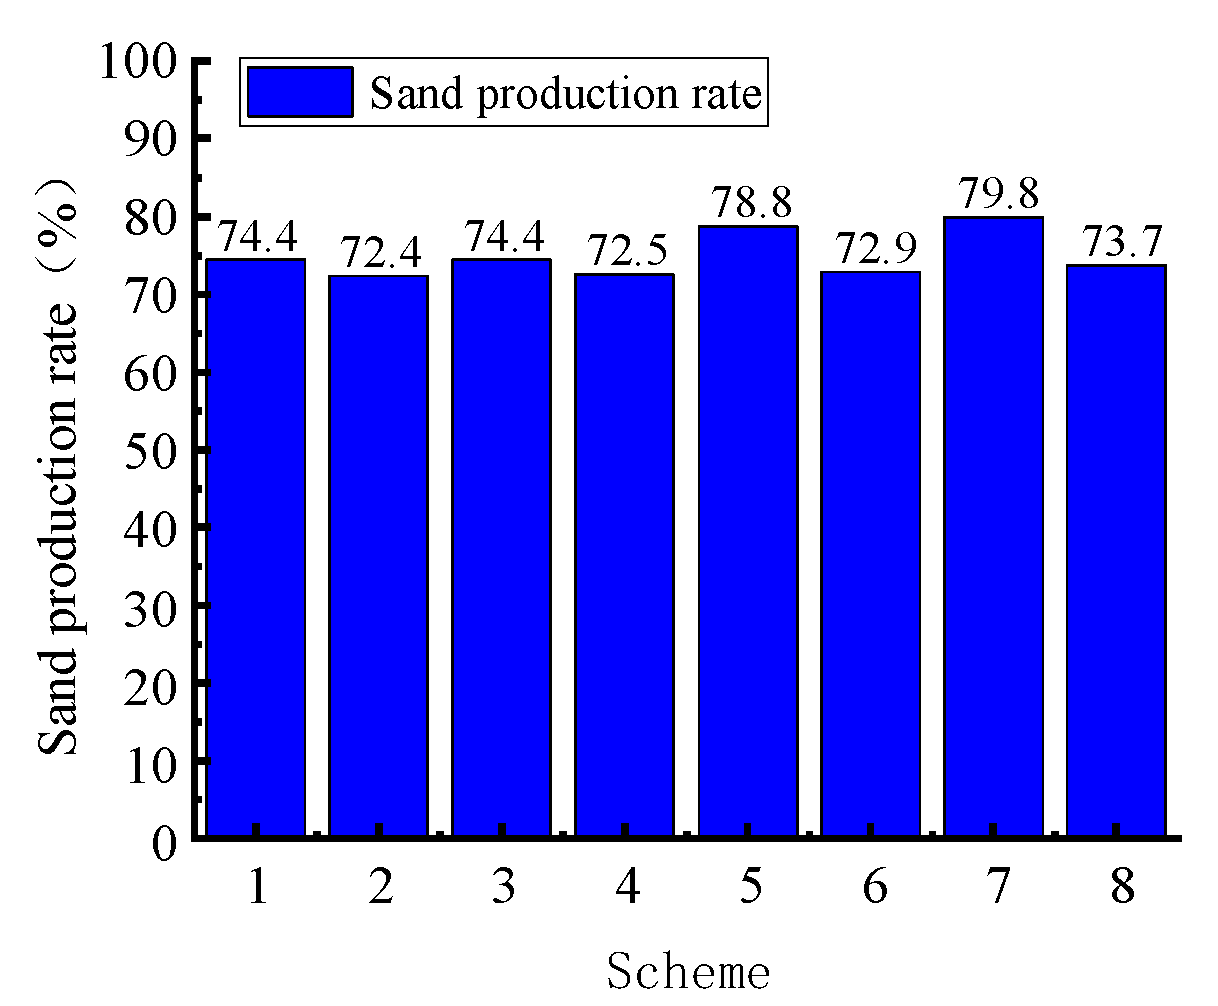
Using the optimized structural parameter model of the double-rotor structure crushing system, the speeds of the particle accelerating rotor and impact rotor were adjusted in EDEM according to the design schemes in Table 6. Keeping other simulation parameters consistent with Section 2, simulations for different speed schemes of the double-rotor structure crushing system were conducted. The average sand production rate sampled after 3 s for each scheme was taken as the final sand production rate for that speed scheme, as shown in Figure 6.
Figure 6 shows that the sand production rates during the stable operation of the schemes range between 70% and 80%. Among them, Scheme 7 (accelerating rotor speed of 1200 r/min; particle impact rotor speed of 600 r/min) has the highest sand production rate and the lowest total power consumption. This is because higher speeds lead to stronger crushing capability in the double-rotor crushing system.
To obtain the relationship between the energy consumption for producing a unit mass of sand and the double-rotor speeds, multiple nonlinear regression analysis was performed using the regress function in MATLAB 2023. The functional relationship between sand production energy consumption and double-rotor speeds was obtained, as shown in Equation (2).
Z = 199320 33.4 K 1 533.7 K 2     + 0.0065 K 1 2 + 0.4558 K 2 2
where Z is the sand production energy consumption of the double-rotor crushing system, K1 represents the accelerating rotor speed, and K2 represents the impact rotor speed. Residual analysis of the regression process showed that the residual intervals all passed through the origin, indicating good fitting of the equation and a valid regression model. Taking the double-rotor speeds as optimization objects and the sand production energy consumption of the double-rotor structure crushing system as the evaluation index, the values that minimize Z within the selected rotor speed range were found to be K1 = 1200 r/min and K2 = 585 r/min.
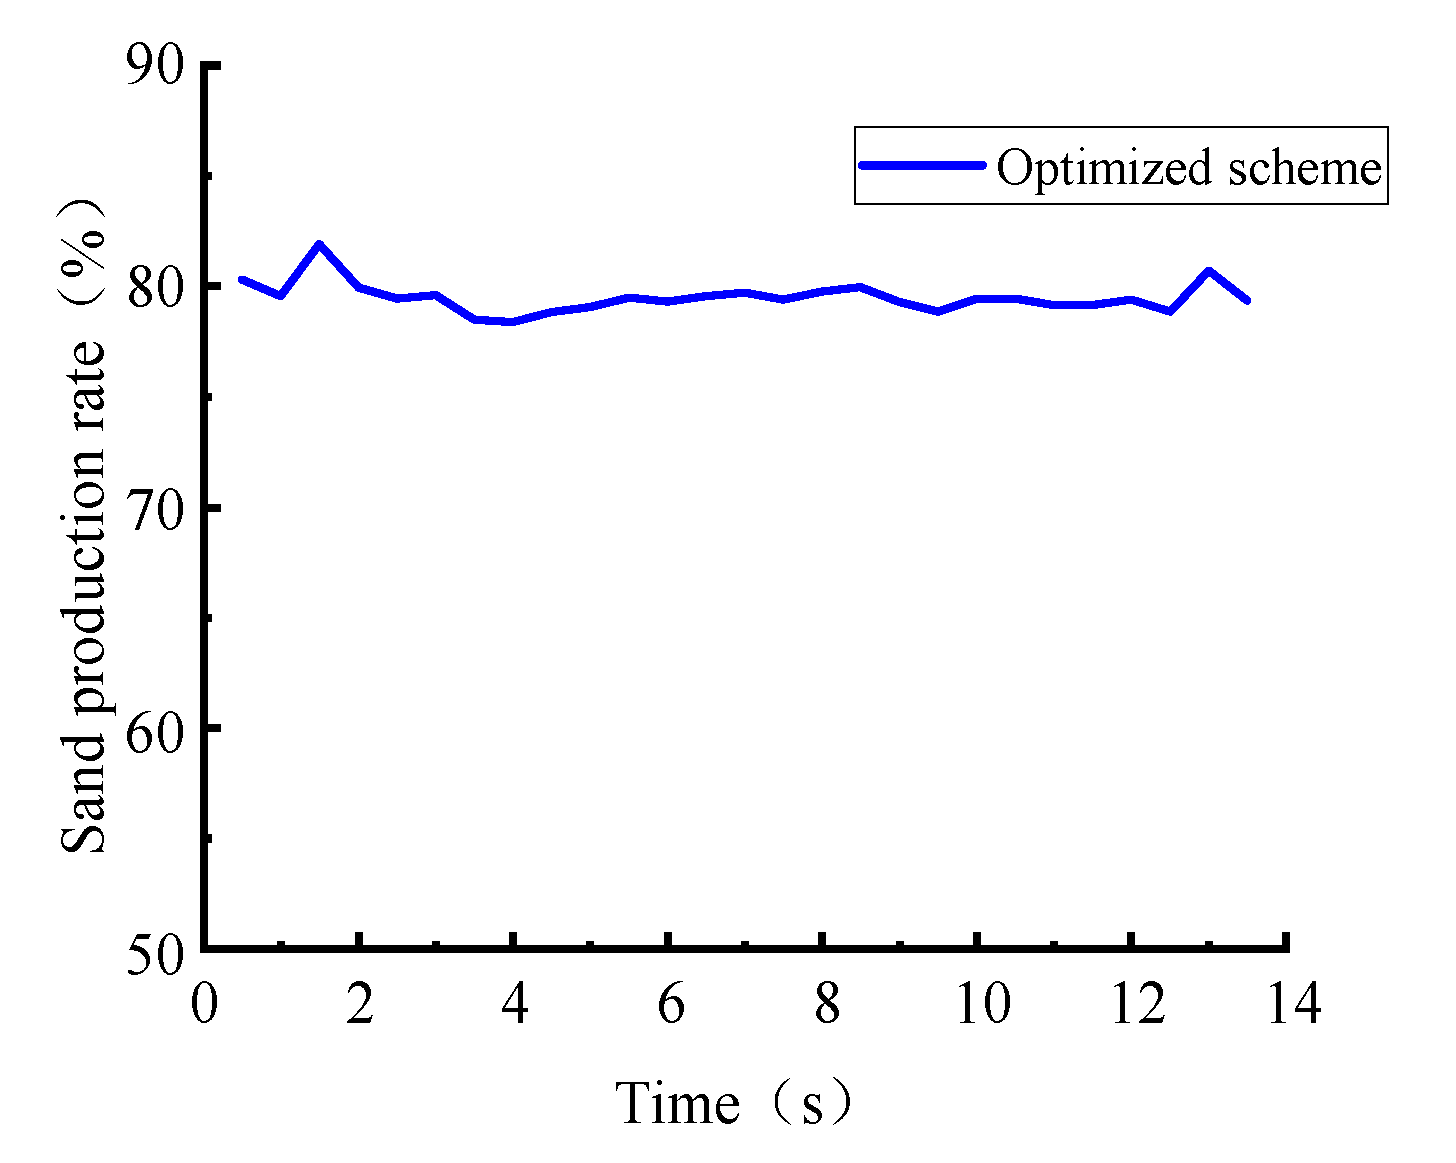
To verify the speed optimization results, a simulation analysis of the double-rotor structure crushing system was conducted with an accelerating rotor speed of 1200 r/min and an impact rotor speed of 585 r/min. The curve of the sand production rate versus time was obtained, as shown in Figure 7. Similarly, the average sand production rate after 3 s for each sampling time was taken as the final sand production rate for the scheme. The optimized sand production rate value was 79.33%, consistent with the test results.

4. Crushing Characteristics Analysis

4.1. Kinetic Energy of Particles in Main Crushing Area

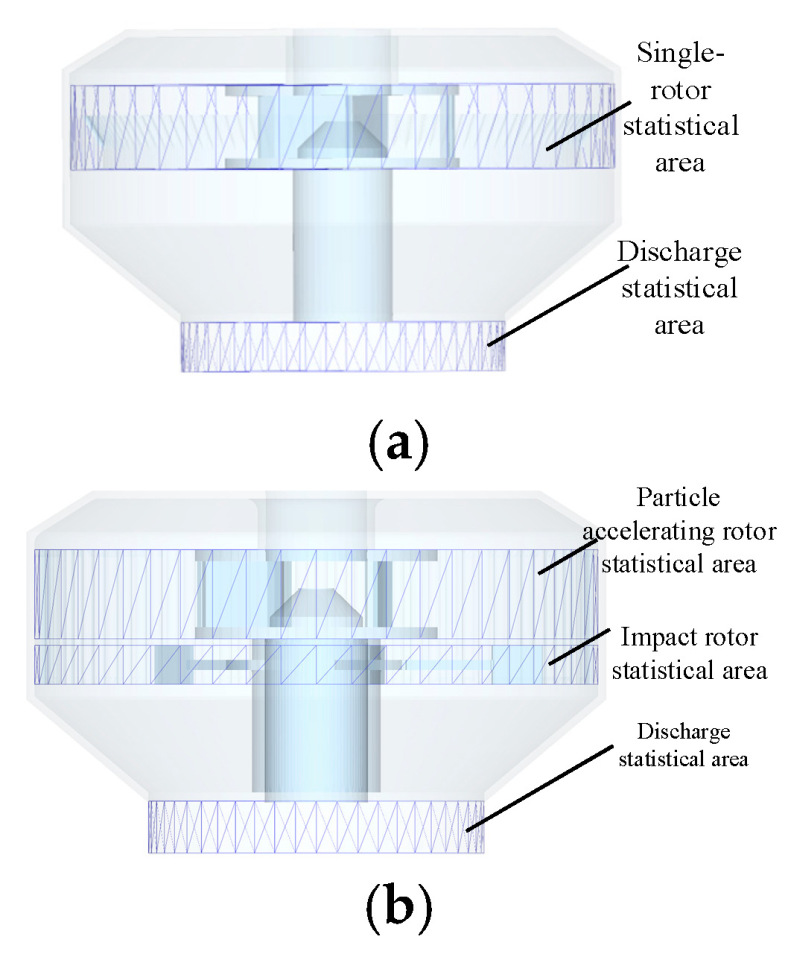
The statistical zone for the single-rotor vertical-shaft-impact sand-making machine was defined. This zone is a cylindrical region where the upper top surface coincides with the top surface of the rotor, the lower bottom surface coincides with the bottom surface of the rotor, and the cylinder diameter matches the inner wall of the crushing chamber. The statistical zones for the double-rotor vertical-shaft-impact sand-making machine were determined as follows: The statistical zone for the particle accelerating rotor is consistent with that of the single-rotor machine. The statistical zone for the impact rotor is a cylindrical region with the axial height of the impact plate being its height and the inner diameter of the crushing chamber being its diameter. As shown in Figure 8, each statistical zone precisely contains its corresponding rotor.
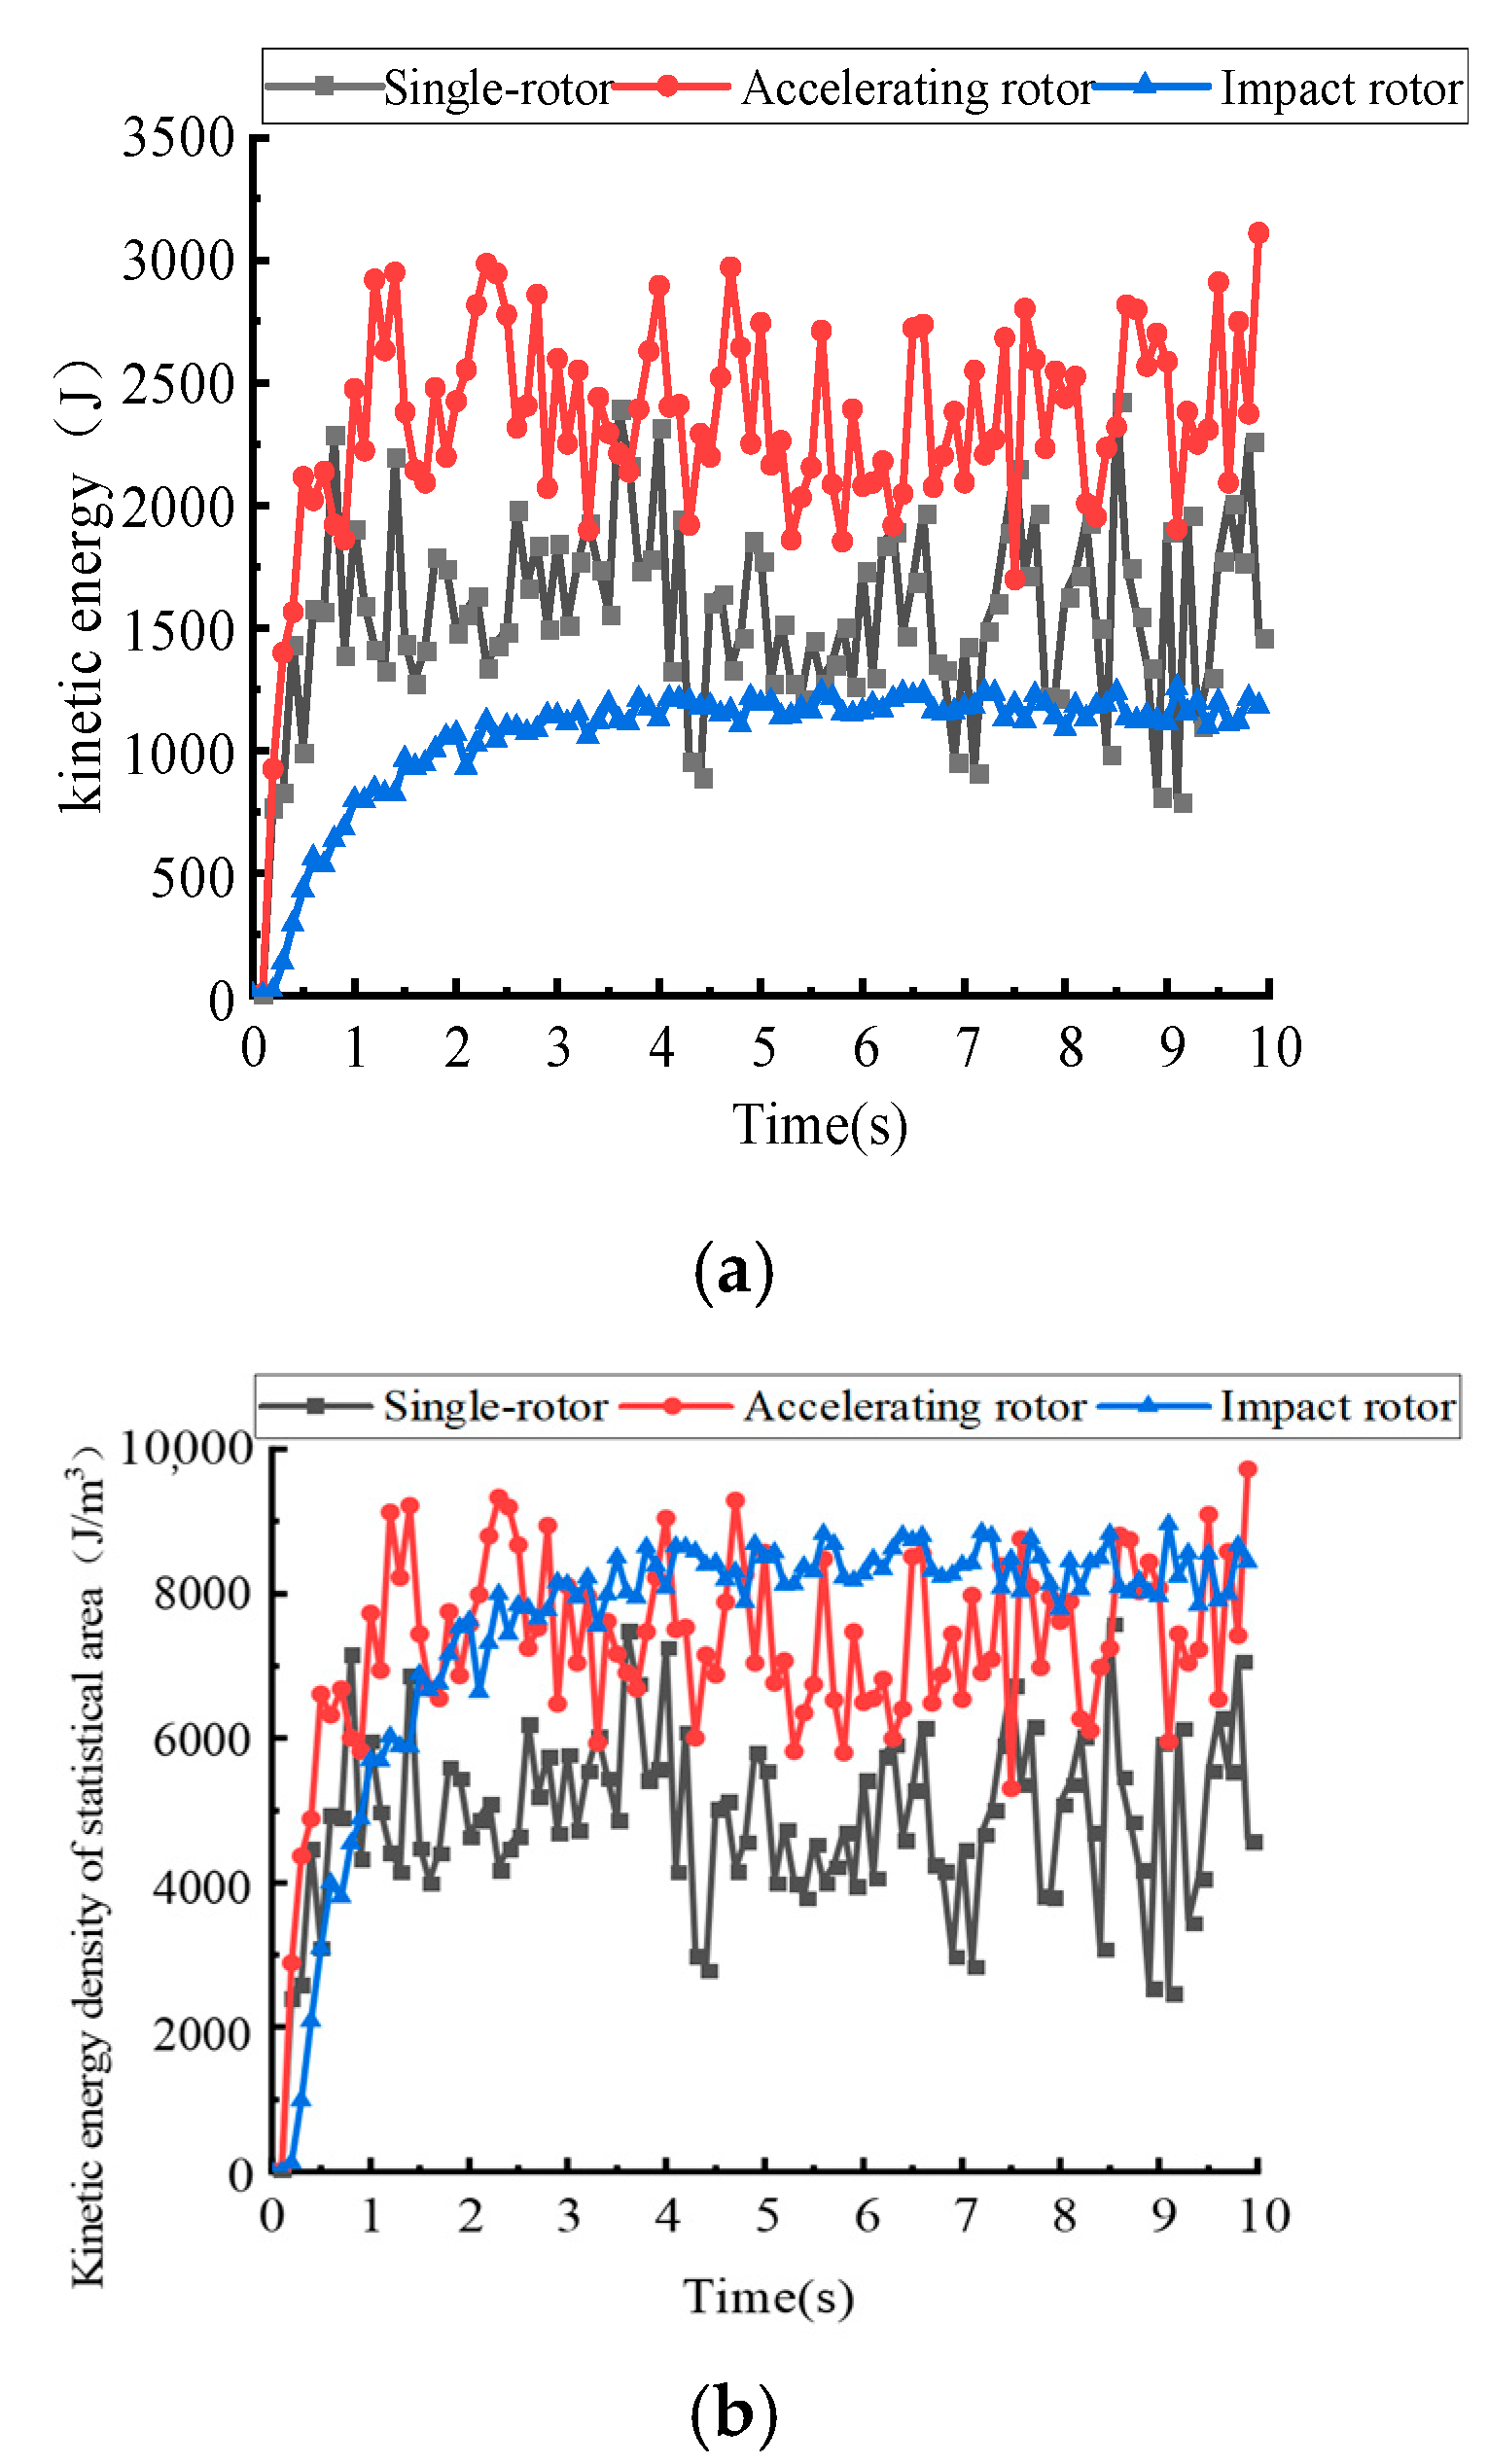
The feed rate for both the single-rotor and double-rotor crushing systems was set to 50 t/h. The particle accelerating rotor speed for both was 1200 r/min, and the impact rotor speed was 585 r/min. Other simulation parameters remained consistent with Section 3. The variation in crushing particle kinetic energy within the corresponding rotor statistical zone over a simulation time of 10 s was statistically analyzed, as shown in Figure 9a.
Comparing the relationship of particle kinetic energy distribution over time between the accelerating rotor statistical zone and the impact rotor statistical zone, it was found that the particle kinetic energy in the accelerating rotor zone reached a stable state faster, and its kinetic energy was far greater than that in the impact rotor zone. Furthermore, the particle kinetic energy in the impact rotor zone fluctuated less with simulation time, indicating that the impact rotor experiences a relatively stable impact load. Comparing the particle kinetic energy in the single-rotor statistical zone and the accelerating rotor statistical zone, it was found that under the same rotor type and speed, adding the impact rotor and changing the anvil plate height resulted in significantly higher particle kinetic energy in the accelerating rotor statistical zone than in the single-rotor zone. This is consistent with the design purpose of the double-rotor structure crushing system, namely, introducing the impact rotor enhances the turbulence of particle movement in the crushing chamber, reflecting some particles back into the particle-accelerating rotor crushing area.
Dividing the particle kinetic energy in each statistical zone by its corresponding volume yields the relationship between kinetic energy density and time for each zone, as shown in Figure 9b. Comparing the distribution of particle kinetic energy density over time between the particle accelerating rotor statistical zone and the single-rotor statistical zone, since the volumes of the two zones are the same, their kinetic energy density distribution over time is consistent with kinetic energy. The particle kinetic energy density in the accelerating rotor statistical zone is significantly greater than that in the single-rotor zone. However, when comparing the particle kinetic energy between the accelerating rotor and impact rotor statistical zones in the double-rotor crushing system, because the volume of the impact rotor statistical zone is smaller, its particle kinetic energy density is greater than that in the accelerating rotor statistical zone.

4.2. Discharge Port Wear Analysis

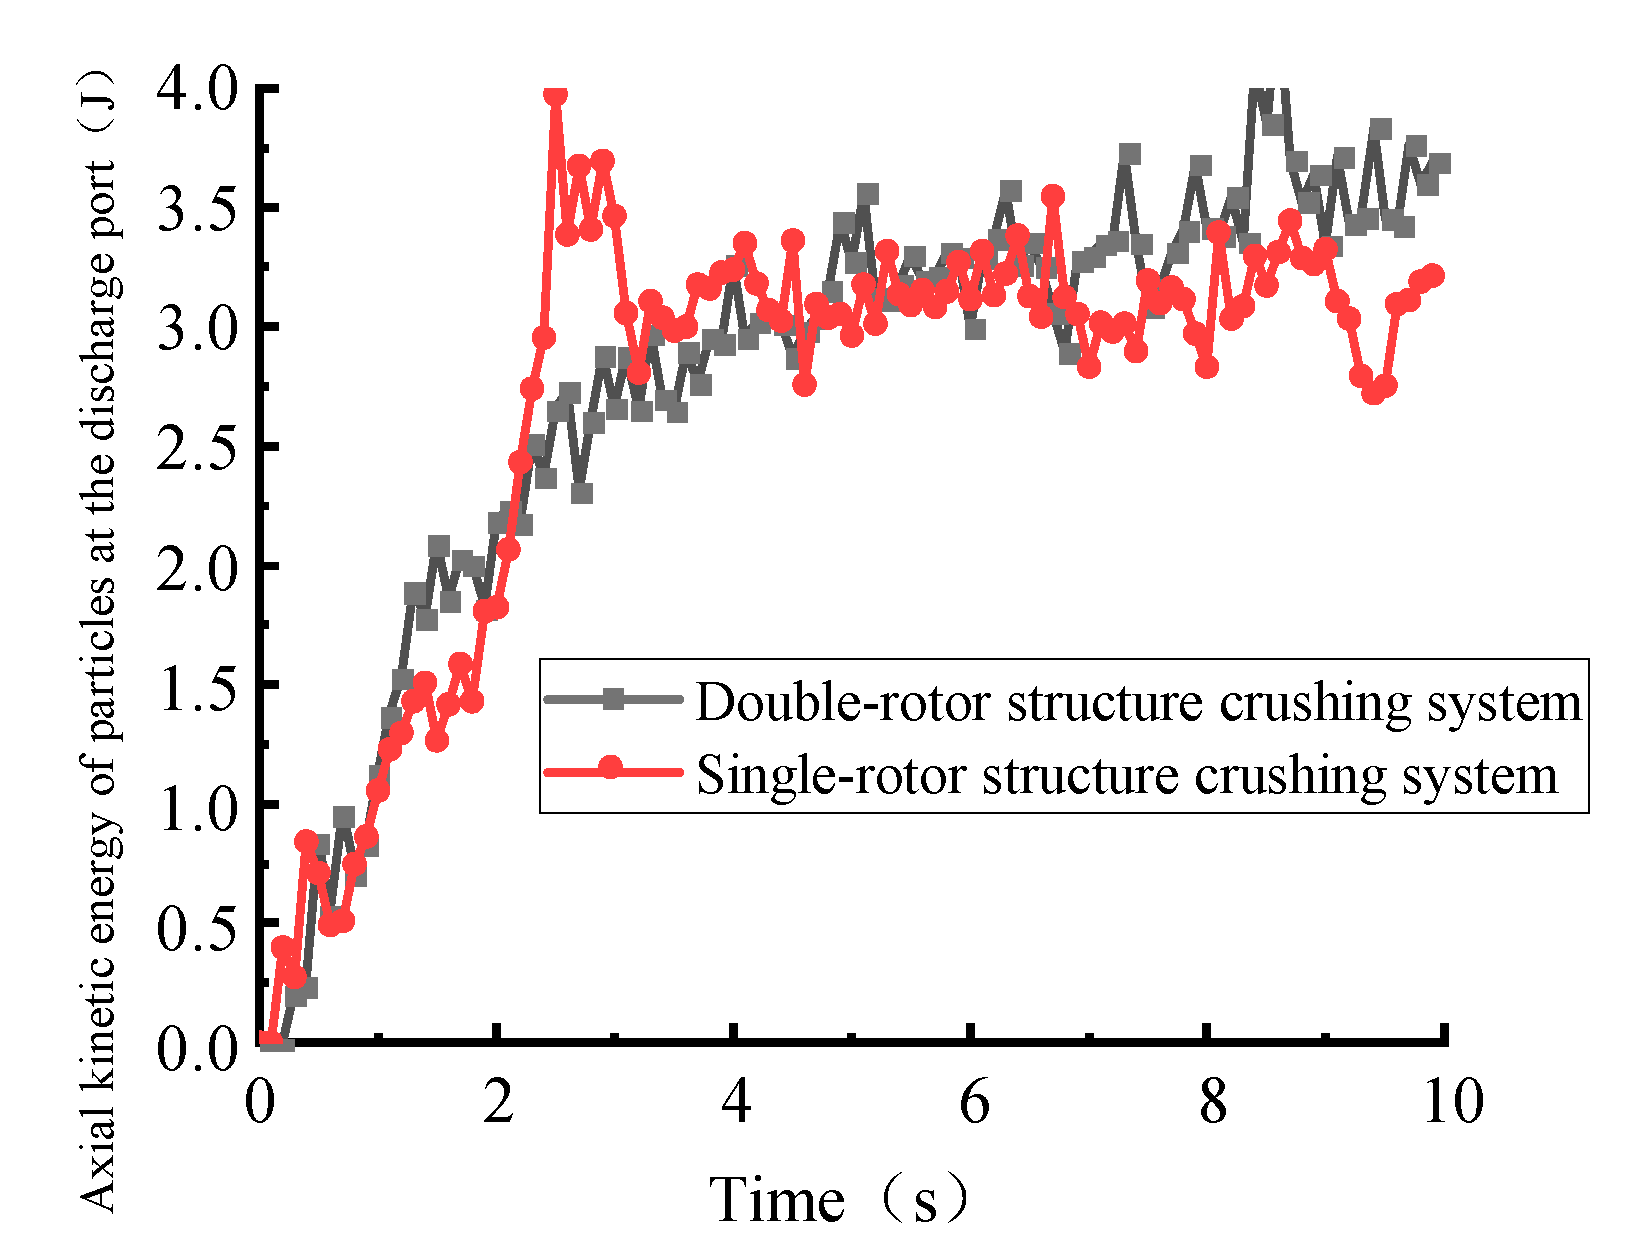
Since the energy from particle collisions on the discharge port mainly comes from particle kinetic energy, analyzing the kinetic energy of particles at the discharge port can reflect its wear. Particle motion in non-axial directions can increase the probability of collision and grinding with other particles, enhancing crushing efficiency. Axial motion, however, directly discharges the particles from the crushing system, causing significant kinetic energy waste. Therefore, to explore the wear of the discharge ports in the single-rotor and double-rotor structure crushing systems of the vertical-shaft-impact sand-making machine, the relationship between the axial kinetic energy at the discharge port and time for both systems was statistically analyzed, as shown in Figure 10.
When examining the axial kinetic energy at the discharge port and its relation to the simulation time for the single-rotor structure crushing system, it was found to be similar to its mass discharge rate over time, both peaking around 2.5 s, followed by a slight decrease in axial kinetic energy and then oscillating in a stable state. For the double-rotor crushing system, the axial kinetic energy of particles at the discharge port gradually tends towards an oscillating stable state over time. Since the two curves are close, directly comparing the axial kinetic energy of particles at the discharge ports of the two crushing systems is difficult. Therefore, the average value of the axial kinetic energy of particles at the discharge port over the simulation time was calculated. The average axial kinetic energy for the double-rotor vertical-shaft-impact sand-making machine was 3.53 J, while for the single-rotor system, it was 3.87 J. Under this working condition, the axial kinetic energy of particles at the discharge port of the double-rotor crushing system is slightly lower than that of the single-rotor system, but the reduction is not significant.

4.3. Component Wear Analysis

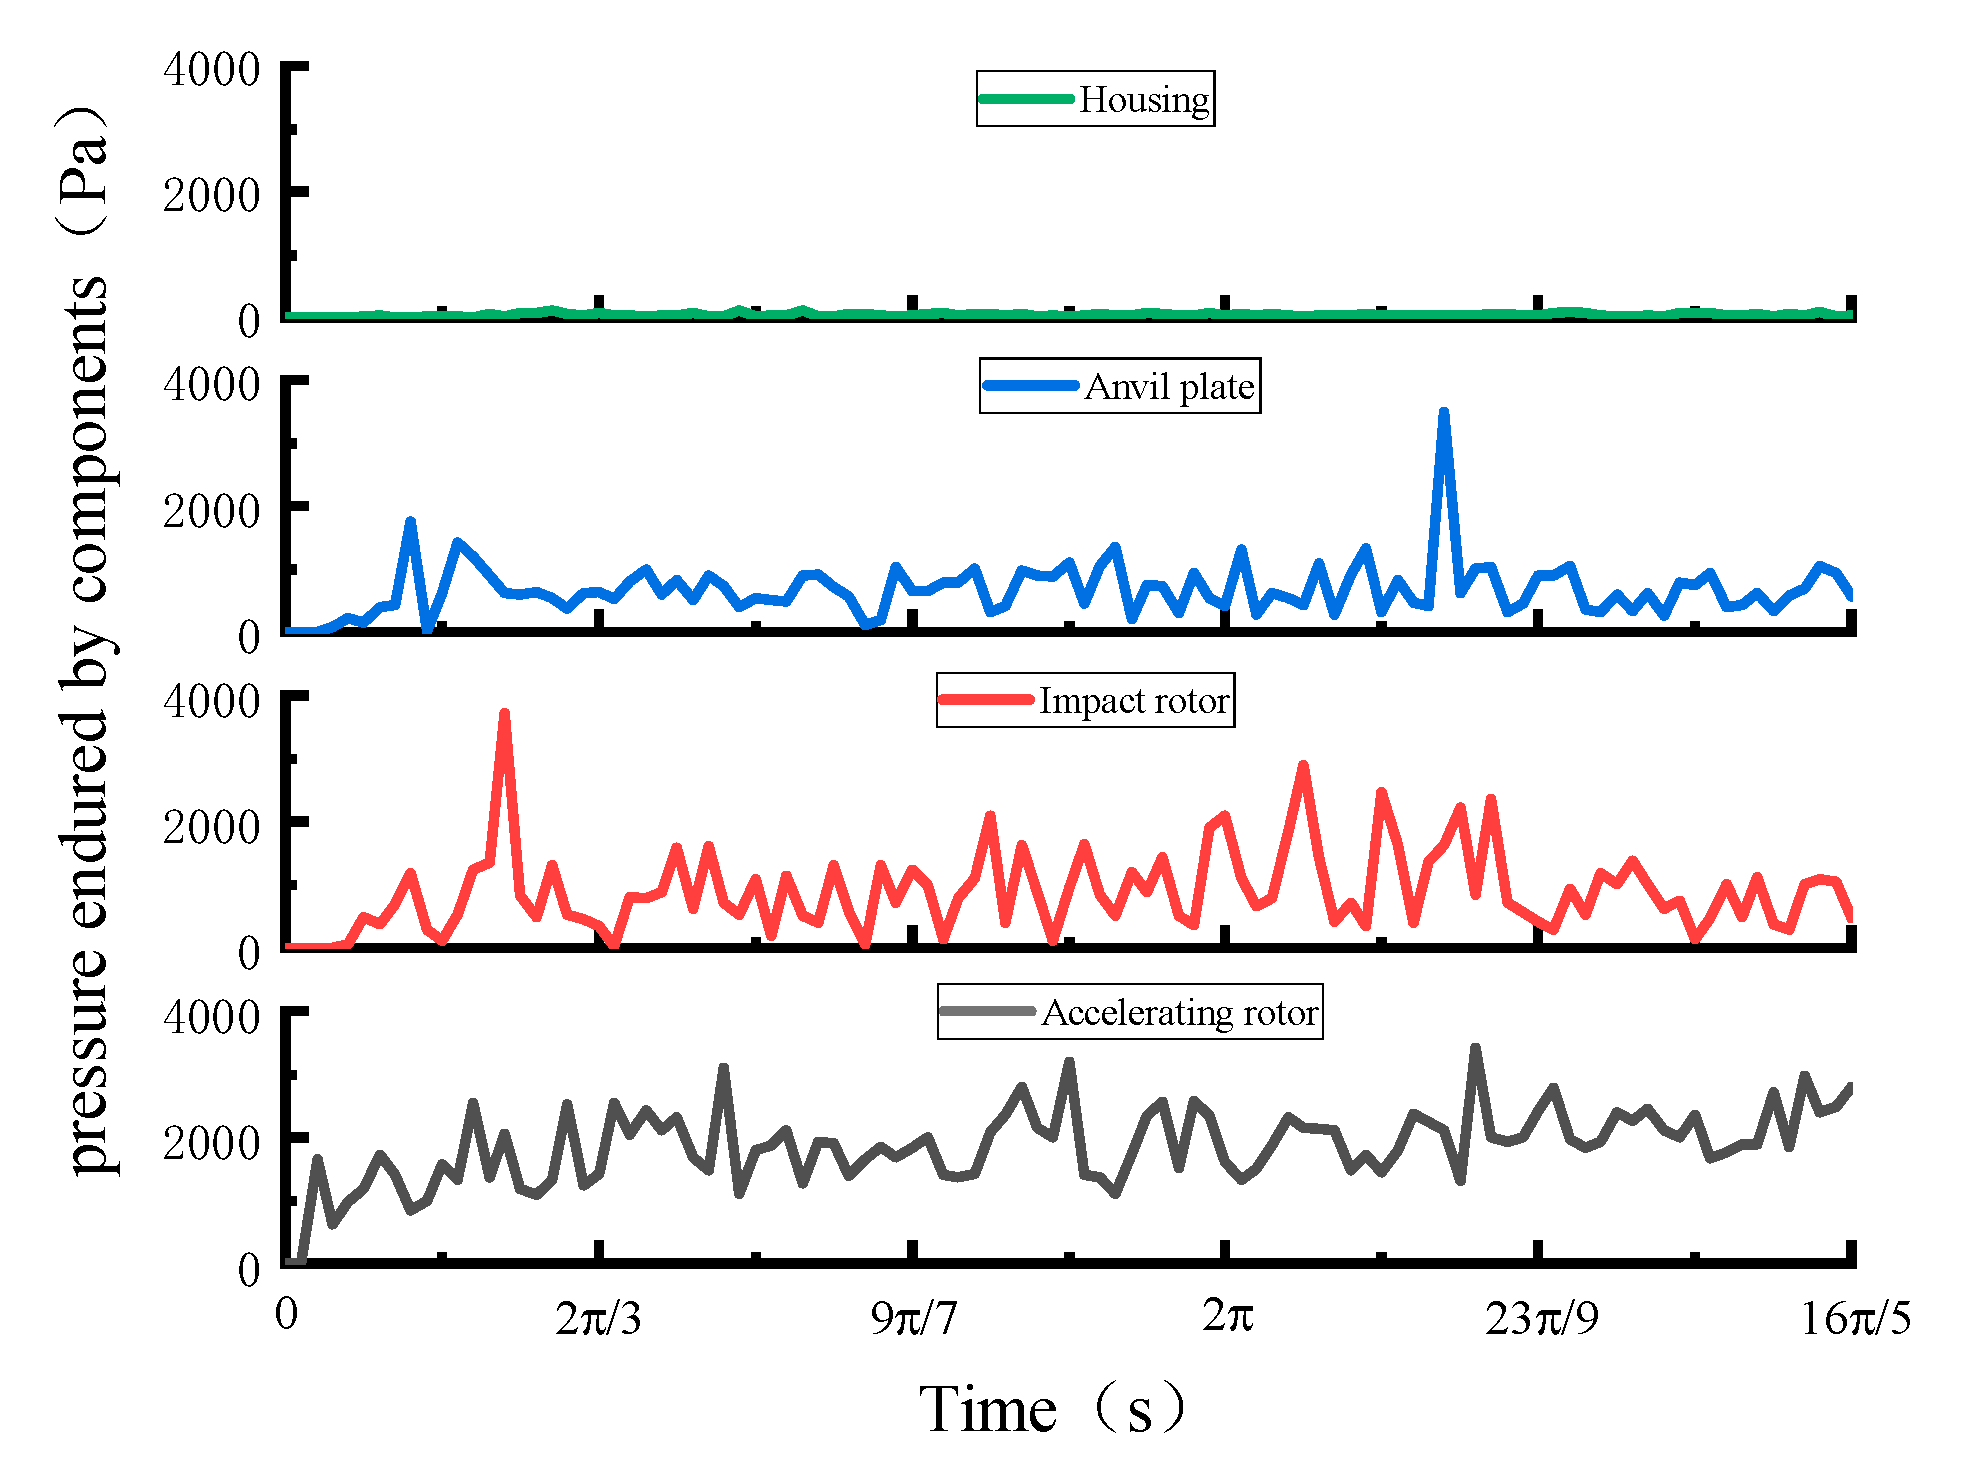
To investigate the wear of various components in the double-rotor structure crushing system, the optimized model was used. Simulation results for component wear were analyzed under a feed rate of 50 t/h, a particle accelerating rotor speed of 1200 r/min, and a particle impact rotor speed of 585 r/min. The pressure endured by each component over simulation time is shown in Figure 11.
When comparing the pressure endured by each component over time, it was found that in the double-rotor structure crushing system of the vertical-shaft-impact sand-making machine, the particle accelerating rotor endures the highest pressure, followed by the particle impact rotor and the anvil plate, while the housing endures the smallest and most stable pressure. Additionally, the pressure endured by the particle accelerating rotor, impact rotor, and anvil plate changes significantly and frequently during operation, requiring these components to withstand substantial impact loads. Therefore, when selecting processing materials, the particle accelerating rotor, impact rotor, and anvil plate should be made of materials that are more wear-resistant and impact-resistant than the housing.
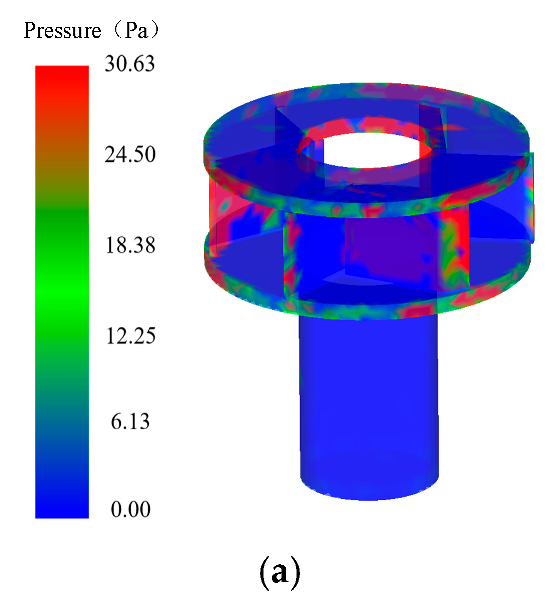
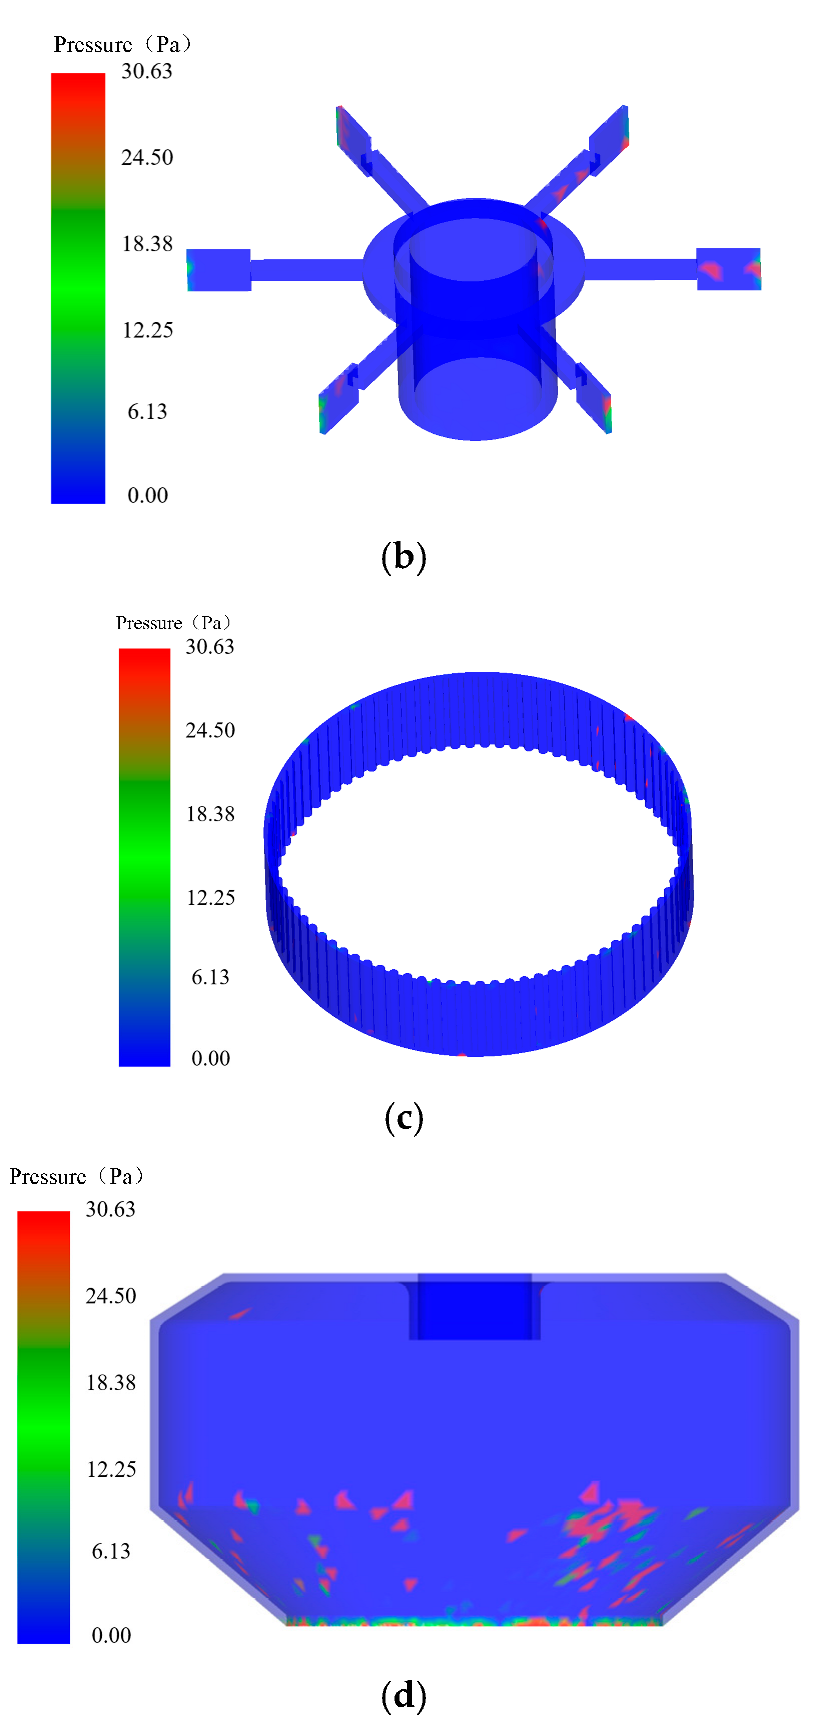
To further clarify the wear locations of each component, the EDEM post-processing module was used to analyze the pressure on each component during the simulation. The obtained wear-prone patterns for each component are as follows: (1) Wear on the particle accelerating rotor is the most widespread, ranging from the feed inlet on the rotor’s top plate to the flow channel of the guide plates and to the outer side of the accelerating rotor, showing relatively severe wear. (2) Severe pressure on the impact rotor is mainly concentrated on the impact plates. (3) Pressure on the anvil plate is mainly randomly distributed across the entire tooth surface. (4) Due to the anvil plate shielding the main force on its inner wall, pressure on the crushing system’s housing is mainly concentrated around the discharge port at the lower part of the housing. The pressure conditions on each component are shown in Figure 12. Wear-prone locations can be strengthened by methods such as spraying wear-resistant coatings or heat treatment to improve service life.

5. Conclusions

To address the issues of uneven discharge particle sizes and discharge port wear in traditional vertical-shaft-impact sand-making machines, a double-rotor structure was proposed. The number of impact rotors, the angle of the impact plates, the angle of the anvil plate, and the number of teeth on the anvil plate were selected as structural factors. Four levels were defined for each factor, and a four-factor, four-level orthogonal experimental design was developed, resulting in 16 sets of crushing simulations. Using the sand production rate as the evaluation metric, a range analysis revealed the following order of influence of the structural parameters on sand production: the angle of impact plates exerted the most significant influence, followed by the number of impact plates, and then the angle of the anvil plate, with the number of teeth on the anvil plate having the smallest effect. The optimal crushing performance was achieved with six impact rotors, an impact plate angle of 0°, an anvil plate angle of 0°, and 89 teeth on the anvil plate.
Furthermore, the working speeds of the two rotors were incorporated as factors in an equal-level uniform design. The energy consumption per unit of sand production was calculated for the crushing system, and polynomial regression analysis was employed to identify the speed combination yielding the lowest energy consumption. The results showed that energy consumption was minimized when the accelerating rotor speed was 1200 r/min and the impact rotor speed was 585 r/min.
An analysis of particle kinetic energy in the main crushing zone revealed a substantial increase, confirming that the impact rotor enhances particle breakage. Simulation of the forces acting on the components of the double-rotor crushing system indicated that wear severity decreased in the following sequence: the accelerating rotor experienced the most wear, followed by the impact rotor and the anvil plate, and finally, the housing. These findings offer valuable guidance for improving the wear and impact resistance of each component in a targeted manner.

Author Contributions

Conceptualization, Q.W. and X.W.; methodology, Z.T. and H.S.; software, H.S. and Z.C.; validation, F.X., Z.T., and Q.W.; data curation, X.W. and H.S.; writing—original draft preparation, Q.W.; writing—review and editing, X.W. and H.S.; project administration, X.W. and H.S. All authors have read and agreed to the published version of the manuscript.

Funding

This research was funded by the Natural Science Foundation of the Jiangsu Higher Education Institutions grant number (22KJA460013) and the APC was funded by Xiangfan Wu.

Data Availability Statement

The data presented in this study are available upon request from the corresponding author.

Conflicts of Interest

The authors declare no conflicts of interest.

References

  1. Al-Khasawneh, Y. Development and Testing of a Novel Mathematical-physical Model for the Design of Ring Armor for the Vertical Shaft Impact Crushers. Miner. Eng. 2021, 170, 106994. [Google Scholar] [CrossRef]
  2. Feifei, F.; Jinfa, S.; Jie, Y.; Junxu, M. Correlation between the Angle of the Guide Plate and Crushing Performance in Vertical Shaft Crushers. Shock Vib. 2022, 2022, 9991855. [Google Scholar]
  3. Boettcher, A.-C.; Beusen, D.; Lueddecke, A.; Overbeck, A.; Schilde, C.; Kwade, A. Single and Multiple Breakage Events in Fine Particle Breakage Testing with a Rigidly-mounted Roll Mill. Miner. Eng. 2022, 178, 107390. [Google Scholar] [CrossRef]
  4. Oliveira, A.L.R.; Rodriguez, V.A.; De Carvalho, R.M.; Powell, M.; Tavares, L. Mechanistic Modeling and Simulation of a Batch Vertical Stirred Mill. Miner. Eng. 2020, 156, 106487. [Google Scholar] [CrossRef]
  5. Zhenmin, L.; Weihao, C.; Wei, Z.; Zhang, X.; Wen, B. Theoretical, Numerical, and Experimental Study on the Synchronization in a Vibrator-pendulum Coupling System. Arch. Civ. Mech. Eng. 2022, 22, 157. [Google Scholar]
  6. Grunditz, S. Modeling of Vertical Shaft Impact Crushers. 2021. Available online: https://research.chalmers.se/publication/523453/file/523453_Fulltext.pdf (accessed on 1 April 2021).
  7. Luo, M.; Yang, H.J.; Fang, Y.H. An Investigation on Sand Production of Vertical Shaft Impact Crusher Using EDEM. Adv. Mater. Res. 2014, 3381, 1226–1230. [Google Scholar] [CrossRef]
  8. Duan, R.D.; Wang, S.; Zhao, F.; Su, D.N. Analysis of Particle Motion in Vertical Shaft Impact Crusher Rotor. Adv. Mater. Res. 2011, 1168, 54–57. [Google Scholar] [CrossRef]
  9. Bwalya, M.M.; Ngonidzashe, C. Numerical Simulation of a Single and Double-Rotor Impact Crusher Using Discrete Element Method. Minerals 2022, 12, 143. [Google Scholar] [CrossRef]
  10. Feng, F.; Shi, J.; Yang, J.; Ma, J. Study on Wear form of Split Cone of Vertical Shaft Impact Crusher. J. Sci. Res. Rep. 2020, 26, 13–20. [Google Scholar] [CrossRef]
  11. Simon, G.; Gauti, A.; Erik, H.; Evertsson, M. Fit-for-Purpose VSI Modelling Framework for Process Simulation. Minerals 2020, 11, 40. [Google Scholar]
  12. Dündar, H. Rotor Speed-Size Reduction Relationship In A Vertical Shaft Impact Crusher. Bilimsel Madencilik Derg. 2018, 3, 189–196. [Google Scholar] [CrossRef]
  13. Jie, Y.; Feifei, F.; Junxu, M.; Shi, J. Wear Law and Parameter Optimization Study on the Split Cone of a Vertical Shaft Impact Crusher. Math. Probl. Eng. 2021, 2021, 9976571. [Google Scholar] [CrossRef]
  14. Wu, C.; Zhao, L.; Cao, Z. Collision Energy Analysis within the Vertical Shaft Impact Crusher Based on the Computational Fluid Dynamics-Discrete Element Method. ACS Omega 2024, 9, 7967–7975. [Google Scholar] [CrossRef]
  15. Wu, C.; Zhao, L.; Cao, Z. The Crushing Distribution Morphology of a Single Particle Subjected to Rotary Impact. ACS Omega 2024, 9, 31464–31476. [Google Scholar] [CrossRef] [PubMed]
  16. Guo, J.; Wang, G.; Sun, G.; Wang, S.; Guan, W.; Chen, Z. DEM simulation and optimization of crushing chamber shape of gyratory crusher based on Ab-t10 model. Miner. Eng. 2024, 209, 108606. [Google Scholar] [CrossRef]
  17. Kuang, D.M.; Long, Z.L.; Ogwu, I.; Chen, Z. A discrete element method (DEM)-based approach to simulating particle breakage. Acta Geotech. 2021, 17, 2751–2764. [Google Scholar] [CrossRef]
  18. Zeren, C.; Guoqiang, W.; Duomei, X.; Cui, D. Simulation and optimization of crushing chamber of gyratory crusher based on the DEM and GA. Powder Technol. 2021, 384, 36–50. [Google Scholar] [CrossRef]
  19. Chen, Z.; Wang, G.; Xue, D.; Bi, Q. Simulation and optimization of gyratory crusher performance based on the discrete element method. Powder Technol. 2020, 376, 93–103. [Google Scholar] [CrossRef]
  20. Chonghui, W.; Hainian, W.; Markus, O.; Hasan, M.R.M. Investigation on the morphological and mineralogical properties of coarse aggregates under VSI crushing operation. Int. J. Pavement Eng. 2020, 22, 1611–1624. [Google Scholar] [CrossRef]
  21. Fang, H.; Yang, J.; Song, Y.; Huang, W.; Chen, J. Simulation and experimental study on the stone powder separator of a vertical shaft impact crusher. Adv. Powder Technol. 2020, 31, 1013–1022. [Google Scholar] [CrossRef]
  22. Segura-Salazar, J.; Barrios, P.G.; Rodriguez, V.; Tavares, L.M. Mathematical modeling of a vertical shaft impact crusher using the Whiten model. Miner. Eng. 2017, 111, 222–228. [Google Scholar] [CrossRef]
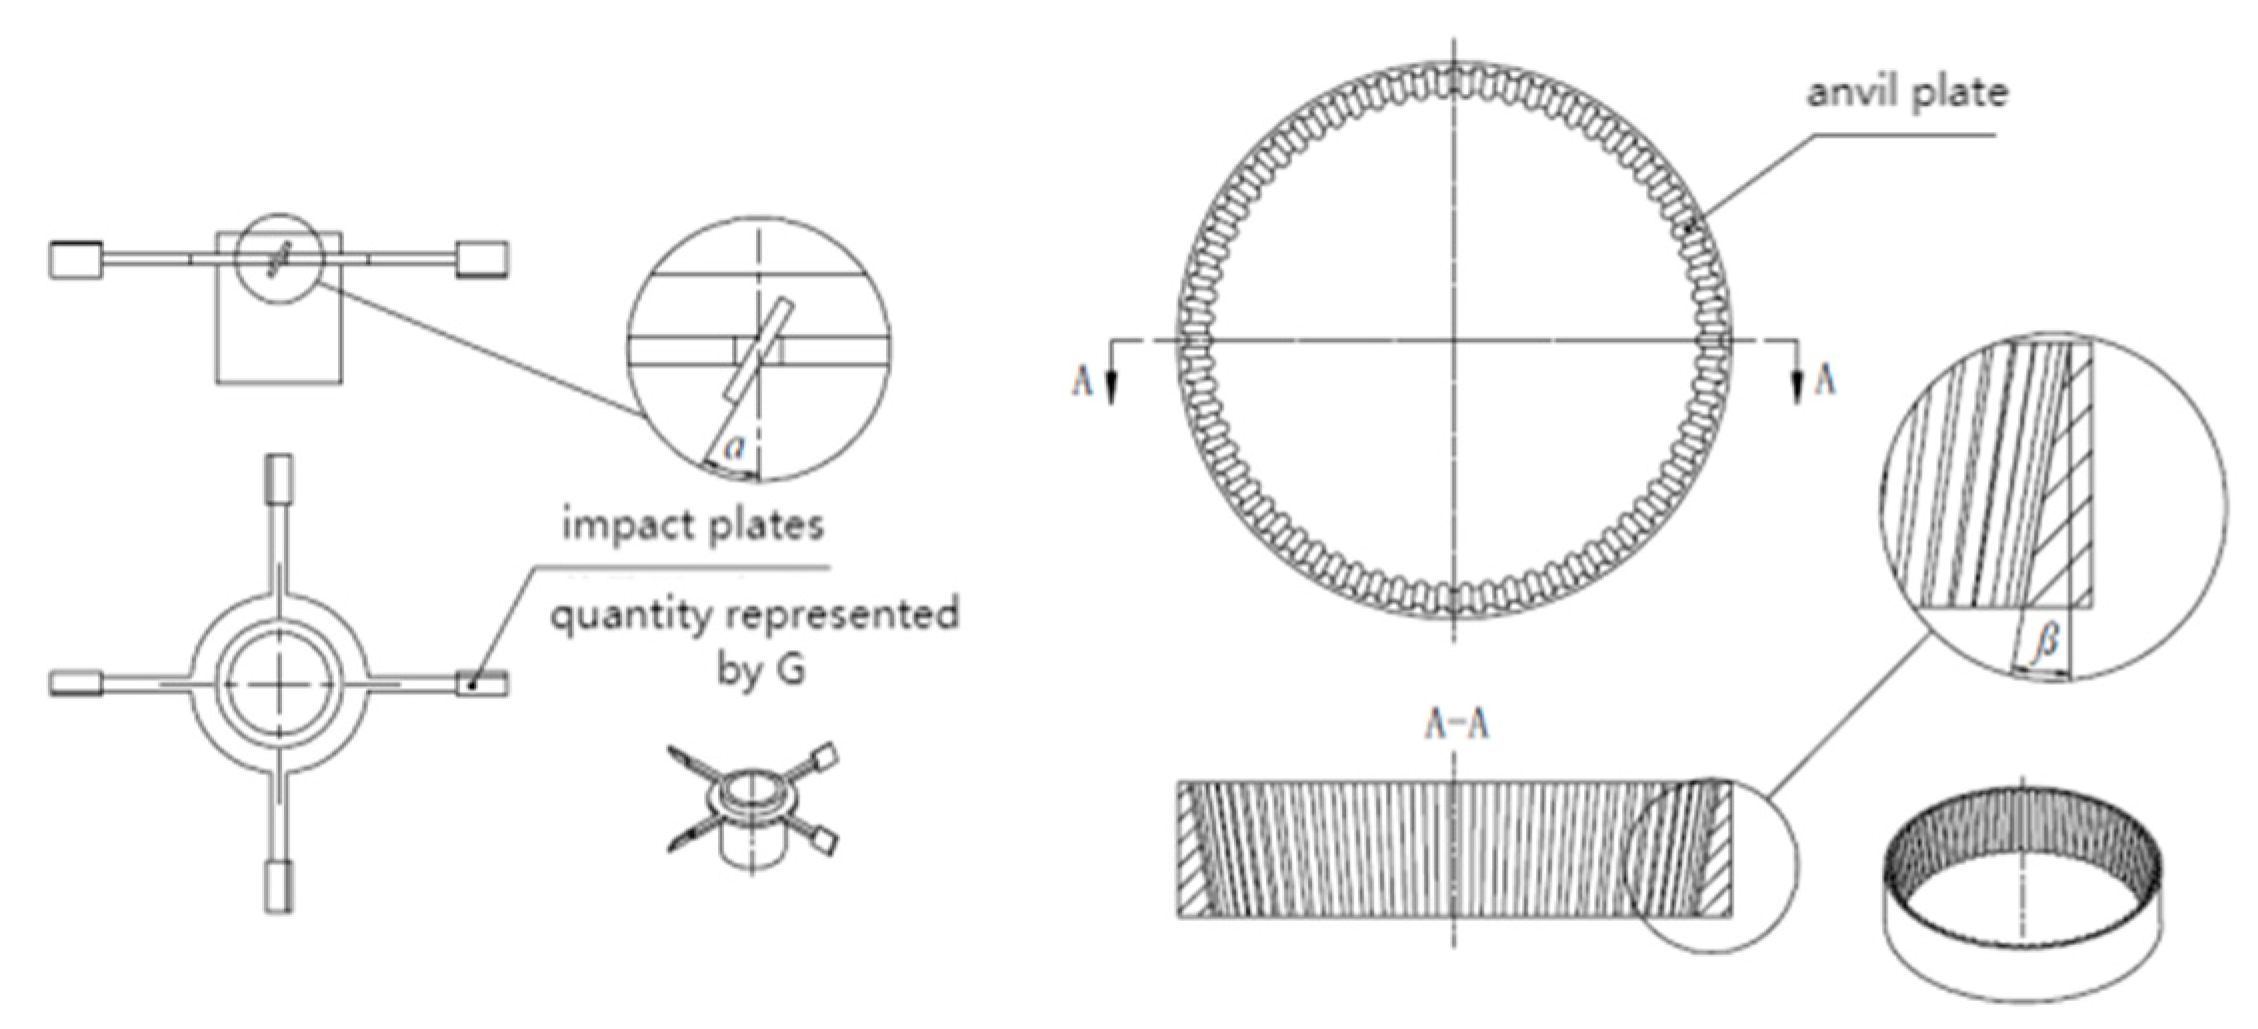
Figure 1. Schematic diagram of structural parameters for counterattack rotor and cutting board.
Processes 13 02974 g001
Figure 2. Flowchart for constructing the regression model.
Processes 13 02974 g002
Figure 3. Regression analysis residual plot of orthogonal experimental results.
Processes 13 02974 g003
Figure 4. The relationship between the sand formation rate and time before and after optimizing the dual-rotor structure.
Processes 13 02974 g004
Figure 5. Crushing results of different structural schemes. (a) Sand production rate; (b) crushing rate.
Processes 13 02974 g005
Figure 6. Average sand formation rate under different rotational speed schemes.
Processes 13 02974 g006
Figure 7. Relationship between sand formation rate and time after optimization of working speed.
Processes 13 02974 g007
Figure 8. Schematic diagram of dual-rotor statistical area and discharge statistical area. (a) Single rotor; (b) double rotor.
Processes 13 02974 g008
Figure 9. Schematic diagram of kinetic energy distribution in the rotor statistical area. (a) Kinetic energy; (b) kinetic energy density.
Processes 13 02974 g009
Figure 10. Relationship between axial kinetic energy and simulation time of discharge ports in different crushing systems.
Processes 13 02974 g010
Figure 11. The pressure and time relationship of each component in the dual-rotor crushing system.
Processes 13 02974 g011
Figure 12. Pressure cloud images of various components in the dual-rotor crushing system. (a) Particle accelerating rotor; (b) particle impact rotor; (c) anvil plate; (d) housing.
Processes 13 02974 g012aProcesses 13 02974 g012b
Table 1. Table of horizontal factors affecting the speed of the double-rotor structure crushing system.
Level FactorG/(pcs)α/(°)β/(°)T/(pcs)
130070
2415380
3530690
464510100
Table 2. Orthogonal test results of dual-rotor structure crushing system.
SchemeG/(pes)α/(°)β/(°)C/(mm)Blank ColumnSand Production Rate (%)
130070178.88
2315380278.43
3330690376.06
434510100475.85
540390479.86
64150100379.06
74301070275.84
8445680176.11
9506100279.72
105151090179.72
11530080477.96
12545370377.06
13601080380.03
14615670478.20
156303100177.98
16645090277.58
I77.3179.6278.3777.5078.17
II77.7278.8578.3378.1377.89
III78.6276.9677.5278.3178.05
IV78.4576.6577.8678.1577.97
Range1.312.200.850.810.28
Table 3. The combinations of structural parameters of the dual-rotor crushing system before and after optimization.
G/(pcs)α/(°)β/(°)C/(mm)
Scheme 4 Parameters34510100
Scheme 13 Parameters601080
Optimized Parameters60089
Table 4. Eight-level and five-factor uniform design table.
Test No.Column No.
12345
112478
224857
336336
448715
551284
663663
775142
887521
Table 5. Usage table of uniform design table showing eight levels and five factors.
Number of FactorsColumn No.Deviation
213 0.1445
3134 0.2000
412350.2709
Table 6. Plan for uniform design test of crushing system.
Column No.Rotational Speed (r/min)
Accelerating RotorImpact Rotor
1500800
26001200
3700700
48001100
5900600
610001000
71100500
81200900
Disclaimer/Publisher’s Note: The statements, opinions and data contained in all publications are solely those of the individual author(s) and contributor(s) and not of MDPI and/or the editor(s). MDPI and/or the editor(s) disclaim responsibility for any injury to people or property resulting from any ideas, methods, instructions or products referred to in the content.