Article

Optimal Placement and Sizing of Reactive Power Compensation Devices in Power Grids with High Penetration of Distributed Generation

1
Electric Power Research Institute, State Grid Shanghai Municipal Electric Power Company, Shanghai 200437, China
2
School of Electrical Engineering, Chongqing University, Chongqing 400044, China
*
Author to whom correspondence should be addressed.
Processes 2025, 13(9), 2953; https://doi.org/10.3390/pr13092953
Submission received: 15 August 2025 / Revised: 4 September 2025 / Accepted: 12 September 2025 / Published: 16 September 2025
(This article belongs to the Section Energy Systems)

Abstract

To address voltage stability challenges in power grids with high penetration of distributed generation (DG), this paper proposes an optimal configuration method for reactive power compensation devices. Voltage-weak nodes are first identified using a novel short-circuit ratio (SCR) index. An average electrical distance metric is then introduced to determine optimal installation nodes by computing distances between candidate nodes and weak nodes. Subject to constraints on maximum compensation capacity and allowable DG disconnection limits, MATLAB simulations validate the optimal configuration. Case studies on modified IEEE 9, 14 and 39 bus systems confirm the method’s efficacy: DG tripping due to low-/high-voltage ride-through failures is effectively mitigated, with minimum fault voltage increasing by 0.05–0.08 p.u. and voltage recovery time reduced by 0.15–0.8 s.

1. Introduction

As a significant form of new energy generation, distributed generation holds broad development prospects [1,2]. Sustained socio-economic growth necessitates the accelerated construction of robust smart grids. Taking distributed photovoltaic (PV) generation as an example, China’s cumulative installed capacity of distributed PV reached 157.6 GW by the end of 2022, accounting for 40.2% of the total PV installed capacity, with distributed PV contributing 58.5% of the newly grid-connected PV capacity in 2022 [3,4].
The large-scale integration of distributed generation alters the voltage stability characteristics of power grids [5]. DG systems typically connect at low voltage levels to structurally weak points in the system [6]. During severe grid faults, significant voltage fluctuations at DG connection points can cause low-voltage or high-voltage ride-through failures and subsequent disconnection, jeopardizing the secure and stable operation of the grid [7,8]. Large-scale DG integration induces bidirectional power flow and reduces system inertia, causing voltage deviations. This triggers failures during N-1 faults, leading to DG disconnections that compromise grid security. DG integration challenges traditional grid operation modes and stability, particularly regarding voltage stability. Characteristics such as intermittent and stochastic power output from DG systems can induce voltage fluctuations, deviations, and even local voltage imbalances. These issues not only compromise grid security but also adversely affect power supply quality for end-users [9]. Therefore, optimizing the configuration of reactive power compensation devices in grids with large-scale DG integration is urgently needed to provide reactive power and voltage support, thus ensuring secure and stable grid operation.
Consequently, reactive power compensation for grids with large-scale DG systems is imperative. Reactive compensation devices fall into two main categories: series compensation and shunt compensation. Series compensation, commonly used in Europe and the US, enhances line transmission capacity by controlling impedance parameters. By contrast, shunt compensation predominates in China for voltage control. Shunt compensation is further divided into system compensation and load compensation. System compensation improves stability, enhances transmission capacity, reduces losses, and optimizes reactive power flow, and it is typically applied to AC transmission/distribution systems. Load compensation improves voltage quality and power factor, targeting end-user loads. Load compensation includes static and dynamic methods.
Static compensation employs capacitor/reactor banks at load points to balance three-phase loads. While structurally simple, cost-effective, and beneficial for static stability, its reactive power output decreases during voltage sags, potentially worsening system voltage during transient instability. Transient voltage instability primarily stems from localized reactive power shortages during rapid load increases or high proportions of induction motor loads [10]. Thus, even with sufficient static reactive reserves, systems may face voltage collapse risks following faults or operations. For large receiving-end systems, static compensation alone is inadequate for meeting operational security requirements.
Current research extensively investigates voltage characteristics and reactive power configurations after integrating traditional renewable energy plants. Existing static reactive optimization primarily targets synchronous grids, aiming to reduce losses, improve voltage profiles, enhance stability, and lower costs. Reactive compensation device configuration becomes critical for ensuring stable system operation [10]. References [11,12] addresses challenges in traditional reactive power optimization methods—long computation times and uncertain convergence under large-scale DG integration. It proposes a generalized master–slave splitting algorithm considering transient voltage security constraints for collaborative optimization. References [13,14] highlight that transient over-voltage issues in sending-end systems caused by AC/DC faults restrict HVDC transmission limits and hinder renewable energy absorption. Reference [15] presents a dynamic reactive power planning method using trajectory sensitivity and singular value decomposition for site selection and capacity optimization. Reference [16] introduces a transient voltage stability index to guide compensation device placement via compensation sensitivity. However, research on reactive optimization post-large-scale DG integration remains limited, necessitating deeper study incorporating DG disconnection behaviors under various faults. Unlike traditional grids, distributed generation poses two key challenges: (1) output depends on uncontrollable natural conditions, exhibiting unpredictability and instability; and (2) grid connection relies on power electronic converters, which lack mechanical inertia and involve complex, multi-timescale control logic, introducing operational challenges [17,18]. Existing studies focus on centralized renewables or ignore DG disconnection behaviors. Critical gaps remain: (1) heuristic device placement lacks electrical distance metrics; and (2) static compensation fails transient stability.
This paper proposes an optimal configuration method for reactive power compensation devices addressing voltage stability issues post-large-scale DG integration. First, voltage-weak nodes are identified using the SCR index. An average electrical distance metric is then introduced. Compensation device installation nodes are determined by calculating between candidate nodes and weak nodes. Finally, under constraints of maximum compensation capacity and allowable DG disconnection, the optimal configuration is derived via MATLAB R2023b simulations. Testing on modified IEEE 9, 14 and 39 bus systems validates the method’s feasibility. Our work bridges these gaps through three innovations: (1) an SCR < 2.0 threshold for weak node identification, validated on IEEE systems; (2) an average electrical distance metric replacing heuristic placement; (3) chance-constrained programming integrating DG disconnection limits with confidence level.

2. Short-Circuit Ratio Index

The short-circuit ratio (SCR) measures the relative strength of the AC system in supporting converter bus voltage during faults. A higher SCR indicates stronger support and a lower risk of commutation failures [19]. First, DG partitions i(i = 1, 2, … m) are defined based on current and projected developments. The New Energy SCR is calculated for each DG to identify weak nodes:
S C R i = S SC i P dN i
where SCRi is the ratio of short-circuit capacity; SSCi is the short-circuit capacity of nodes i distributed power sources and PdNi is the rated capacity of nodes i distributed power sources. Nodes with SCRi < 2 are deemed weak and recorded in set R = {i, j, …}.

2.1. Multi-Infeed HVDC Systems

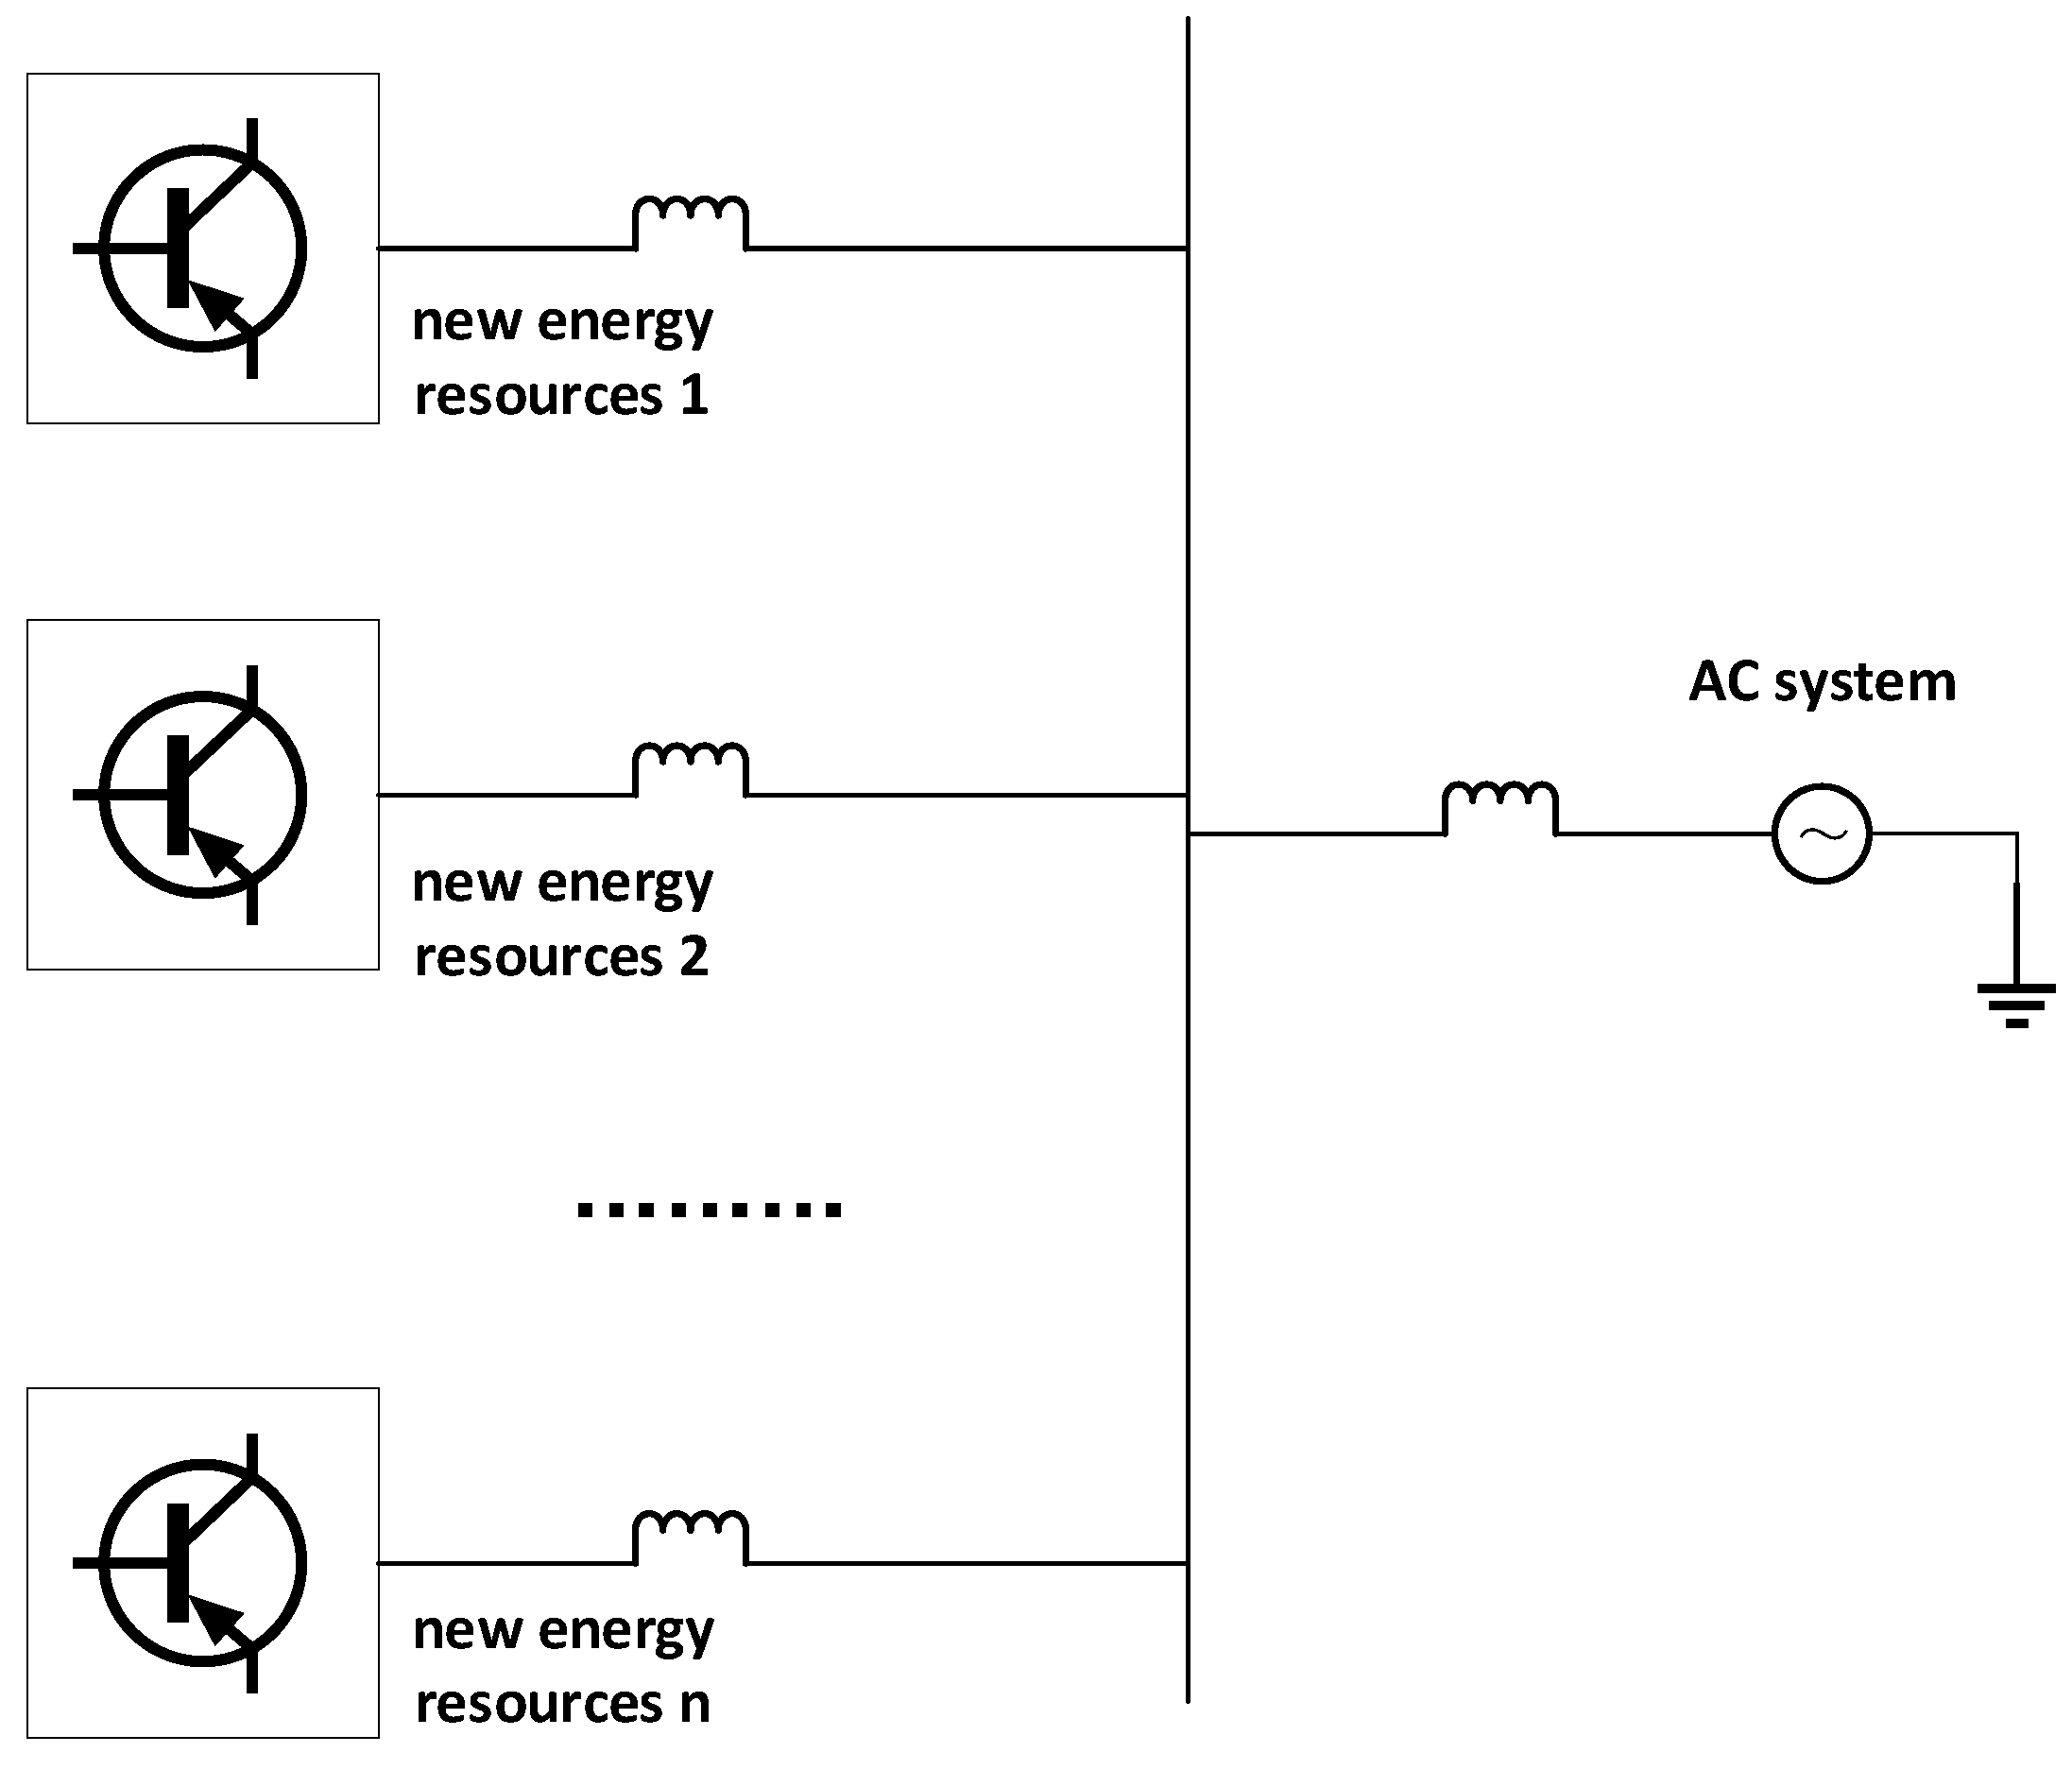
For systems with multiple HVDC infeed points concentrated in one receiving-end grid, as in Figure 1, single-infeed SCR calculations fail to account for interactions between DC systems, yielding overly optimistic results. The Multi-Infeed Short-Circuit Ratio (MISCR) incorporates these interactions [20]:
M I S C R j = S sc i P deq i = | U s i I sc i | P dN i + j , j i M I I F j i × P dN j
where Ssci is the short-circuit capacity at node i (product of rated voltage Usi and three-phase short-circuit current ISci). Pdeqi is the equivalent DC rated power at node i. PdNi and PdNj are the rated powers of inverter stations at nodes i and j, respectively. MIIFji is the Multi-Infeed Interaction Factor.
The MIIFji between nodes i and j is defined as the ratio of voltage change at node jUj) to that at node iUi) during a symmetrical inductive ground fault or reactor switching causing a 1% voltage drop at node i under rated conditions [21]:
M I I F j i = Δ U j Δ U i = Δ U j 1 % U i 0
where Ui0 is the pre-fault voltage at node i; ΔUj, ΔUi and Ui0 are per-unit values.

2.2. Multiple Renewable Plants Systems

For systems with multiple renewable (wind/PV) plants connected to the same grid, as in Figure 2, the traditional SCR is insufficient. The Equivalent Short-Circuit Ratio (ESCR) evaluates the electrical strength of multi-converter systems. A low ESCR indicates a weak system with high instability risk.
ESCR calculation is based on the observation of voltage disturbances. The Wind/PV Interaction Factor (WPIF) quantifies voltage changes at node i caused by perturbations at node j [22]:
W P I F i j = Δ v i Δ v j
where Δvi is the voltage change at node i induced by a voltage fluctuation Δvj at node j. WPIF approaches 0 for distant nodes and 1 for closely coupled nodes.
When multiple wind/PV plants connect to the same AC grid with close electrical proximity, the short-circuit capacity at grid interconnection points is significantly lower than at collector buses. Considering adjacent plant influences, the ESCR is defined as follows [22]:
E S C R = S i P W F i + j W P I F j i × P W F i
where Si is the short-circuit capacity at the point of interconnection i, PWFi is the active power output of the wind/PV plant at i and ∑(WPIFji × PWFj) represents the cumulative impact of adjacent plants.

3. Selection of Installation Nodes for Reactive Compensation Devices

Compensation effectiveness generally improves with shorter electrical distance to reactors. Therefore, the optimal installation node should minimize the average electrical distance to all weak nodes. First, the node impedance matrix ZB is formed:
Z B = Y B 1 = Z 11 Z 12 Z 1 n Z 21 Z 22 Z 2 n Z n 1 Z n 2 Z n n .
where YB−1 is the inverse of the nodal admittance matrix. The average electrical distance metric Dk for candidate node k to weak nodes in set R = {i, j, …} is defined as follows:
D k = i R Z k k + Z i i 2 Z k i n u m ( R )
where Zki is the element in row k, column i of ZB, and num(R) is the number of weak nodes. Dk is computed for all candidate nodes. The node with the smallest Dk is selected for compensation device installation.

4. Optimization Method for Reactive Compensation Device Configuration

A typical fault set is established based on grid specifics, including critical N-1 and N-2 permanent faults for lines and transformers.
MATLAB simulations analyze optimal installation nodes. Dynamic reactive devices (SVC (GE Renewable Energy, Paris, France), STATCOM (Liaoning Rongxin Xingye Power Technology Co., Ltd, Anshan, China)) are installed at optimal nodes, and variations in total DG disconnection under different faults are assessed. For device k, capacity is increased from 0 to Skm. The capacity SN.max, where further increases no longer reduce total DG disconnection under typical faults, is identified as optimal.
Constraints include the maximum allowable DG disconnection Pcut.max and maximum device capacity SN.max to control costs:
P c u t P c u t . max
S k m S N . max
The optimization objective function minimizes cost while satisfying constraints:
min F = λ P c u t + μ j = 1 N m S j
where λ is the penalty coefficient for DG disconnection, and μ is the penalty coefficient for compensation device capacity.
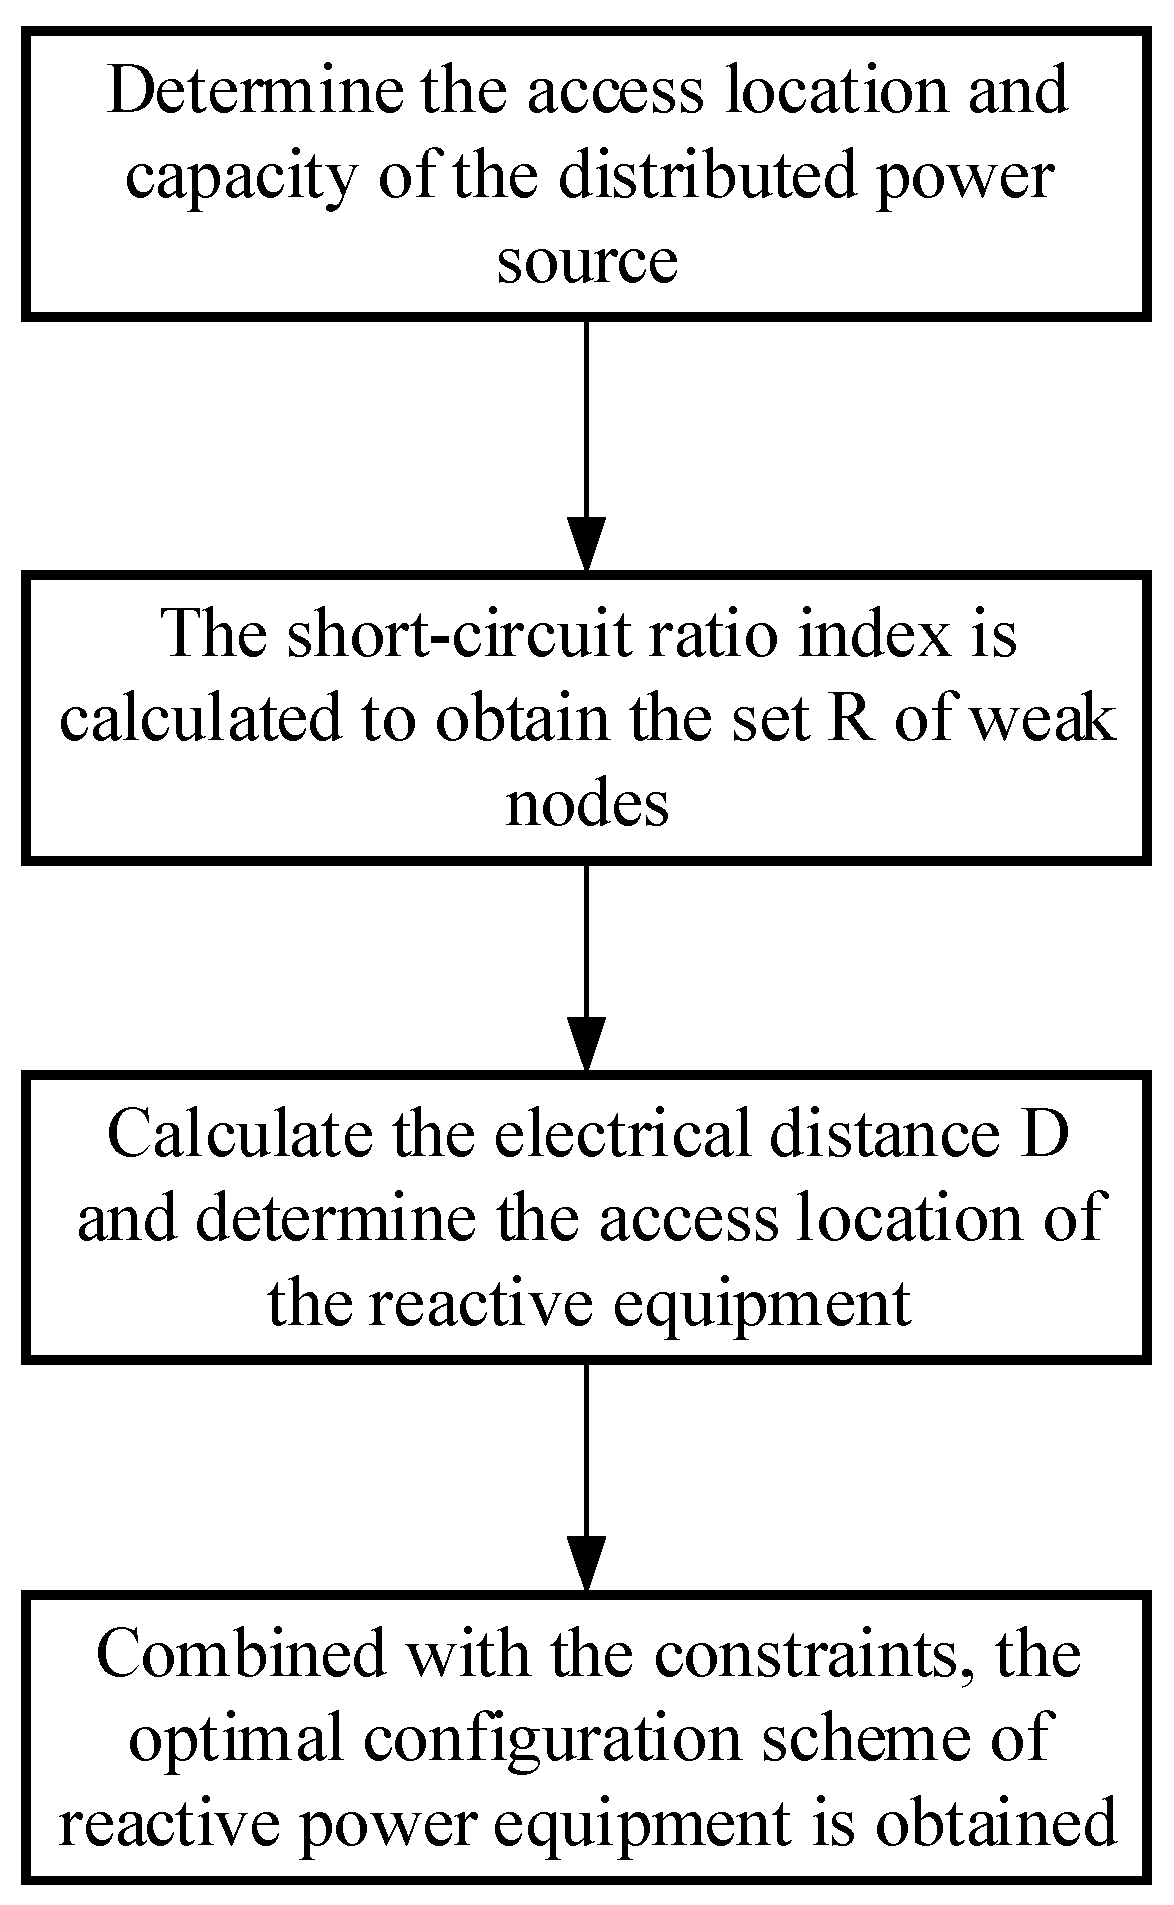
The overall process is shown in Figure 3.

4.1. Chance-Constrained Programming

Chance-constrained programming handles constraints containing random variables, allowing solutions that may violate constraints with low probability while ensuring feasibility above a specified confidence level [23]:
min f ¯ s . t . Pr { f ( x , ξ ) f ¯ } β Pr { g i ( x , ξ ) 0 } α i = 1 , 2 , , m
where f(x,ξ) is the objective function, x is the decision vector, ξ is a random vector, gi(x,ξ) are stochastic constraint functions, Pr{⋅} denotes probability and α, β are confidence levels. f ¯ is the minimum value of f(x,ξ) achievable with probability ≥ β.

4.2. Constraints

Equality Constraints (Power Flow Equations) are calculated as follows:
P i δ = U i δ j i U j δ ( G i j δ cos θ i j δ + B i j δ sin θ i j δ ) Q i δ = U i δ j i U j δ ( G i j δ sin θ i j δ B i j δ cos θ i j δ )
where Piδ, Qiδ are active/reactive power injections at node i, respectively; Uiδ, Ujδ are voltages; θijδ is the voltage phase difference and Gijδ, Bijδ are line conductance/susceptance, respectively.
Inequality Constraints (Chance-Constrained) are calculated as follows:
Pr ( U i , min δ U i δ U i , max δ ) β 1 δ Pr ( S l , min δ S l δ S l , max δ ) β 2 δ
where U i , min δ , U i , max δ are voltage limits; β 1 δ is the voltage confidence level; S l , min δ , S l , max δ are line power flow limits and β 2 δ is the line flow confidence level.
Device Output and Capacity Constraints are calculated as follows:
P w , min δ P w δ P w , max δ Q w , min δ Q w , max δ Q w , max δ P p v , min δ P p v δ P p v , max δ Q p v , min δ Q p v , max δ Q p v , max δ Q c i , min δ Q c i δ Q c i , max δ Q l i , min δ Q l i δ Q l i , max δ
where Q c i , max δ and Q c i , min δ represent the upper and lower limits of the capacitor capacity allowed to be installed at node i, respectively; Q l i , max δ and Q l i , min δ represent the upper and lower limits of the reactor capacity allowed to be installed at node i, respectively; P w , max δ and P w , min δ represent the upper and lower limits of the active power output of the wind turbine, respectively; Q w , max δ and Q w , min δ represent the upper and lower limits of the reactive power output of the wind turbine, respectively; P p v , max δ and P p v , min δ represent the upper and lower limits of the active power output of the photovoltaic system, respectively, and Q p v , max δ and Q p v , min δ represent the upper and lower limits of the reactive power output of the photovoltaic system, respectively.
Assuming that node voltages and line flows follow normal distributions, the cumulative distribution functions Y ( U i δ ) , Y ( S l δ ) obtained via point-estimation methods allow the rewriting of Equation (13) as follows:
Y ( U i , max δ ) Y ( U i , min δ ) β 1 δ Y ( S l , max δ ) Y ( S l , min δ ) β 2 δ
Penalty functions embed constraint violations into the objective:
min F δ = min [ f δ + λ 1 i = 1 M P ( U i δ ) + λ 2 l = 1 n b P ( S l δ ) ]
where λ1, λ2 are penalty coefficients, and M is node count. Penalty terms are calculated as follows:
P ( U i δ ) = β 1 δ [ Y ( U i , max δ ) ] Y ( U ι , max δ ) < β 1 δ 0 , Y ( U ι , max δ ) β 1 δ
P ( S l δ ) = β 2 δ Y S l , max δ , Y S l , max δ < β 2 δ 0 , Y S l , max δ β 2 δ

4.3. Reactive Power Allocation Capacity

This study employs switchable capacitors as the primary reactive power compensation measure. Considering potential over-voltage conditions during system light-load operations, switchable reactors are concurrently adopted as supplementary compensation devices. The unit compensation capacity of individual capacitor banks and reactor units is predetermined.
The configuration principle for reactive power compensation equipment is established as follows: When the system operates under minimum load conditions, an Optimal Power Flow algorithm is solved. Should the optimal solution yield a negative reactive power compensation value at any node, inductive reactive power compensation must be provided at that node, with capacity equal to the absolute value of the calculated deficit. Conversely, if the solution yields a positive value, capacitive reactive power compensation should be implemented. This fundamental principle for determining compensation type based on the sign of the OPF-derived reactive power compensation value applies equally under maximum load conditions and normal load conditions.
Given the variation in the required installed compensation capacity across different loading scenarios, the methodology for determining the final system planning scheme and investment cost calculation is specified: Reactive power planning schemes are computed separately for each distinct load level. For each node, the maximum required compensation capacity identified across all load-level analyses is selected as the final planned capacity for that node. This capacity selection approach minimizes the total investment cost for reactive power compensation equipment while ensuring adequate reactive support across all operational scenarios.

5. Case Study Analysis

5.1. System Analysis

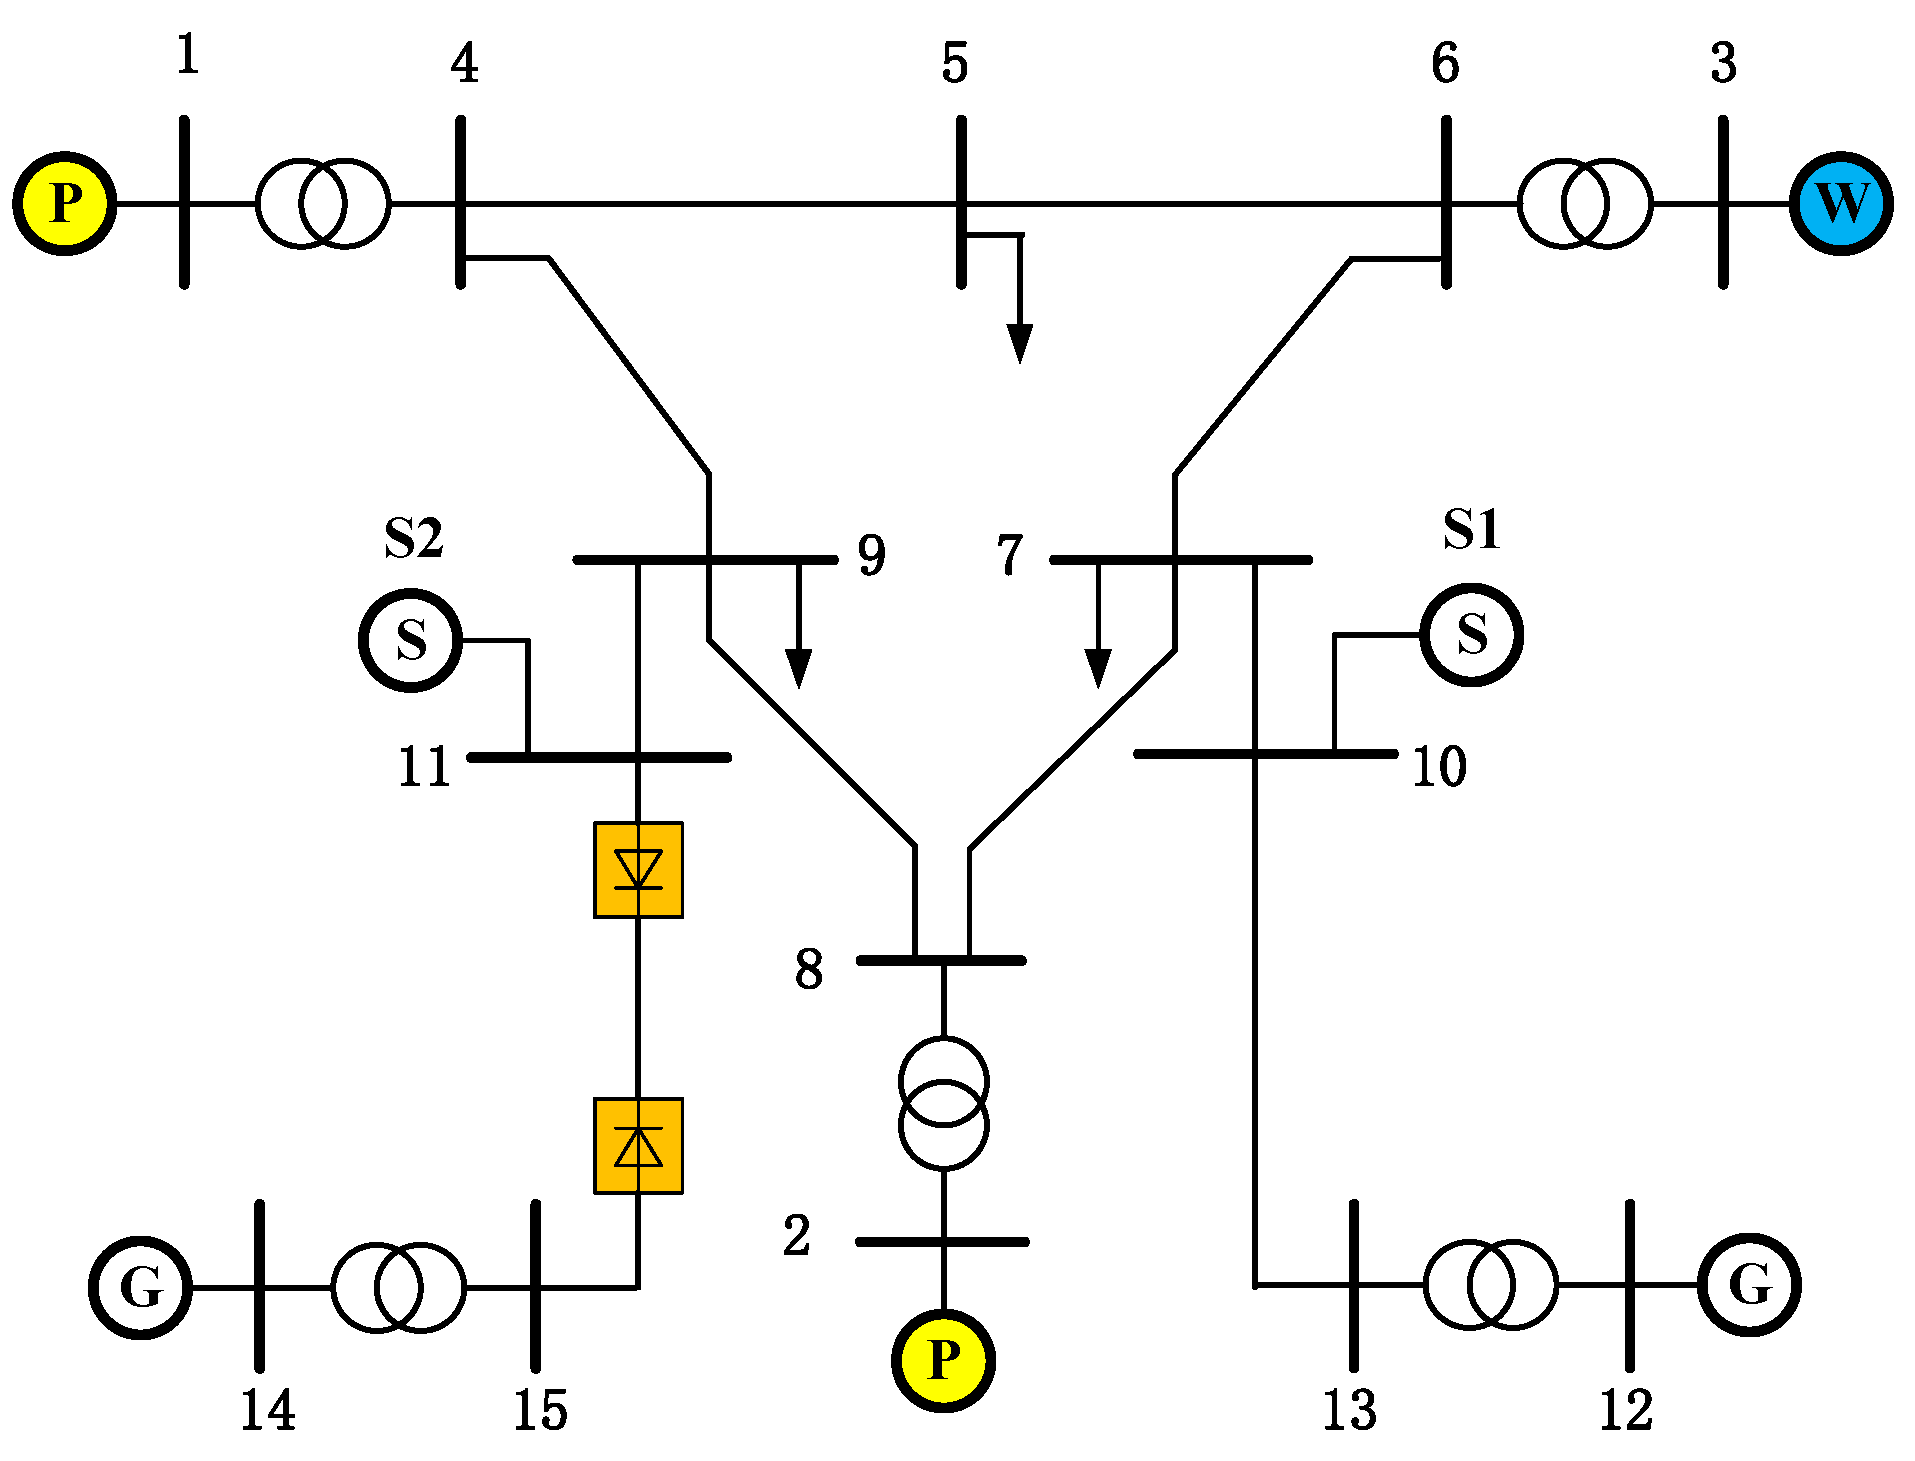
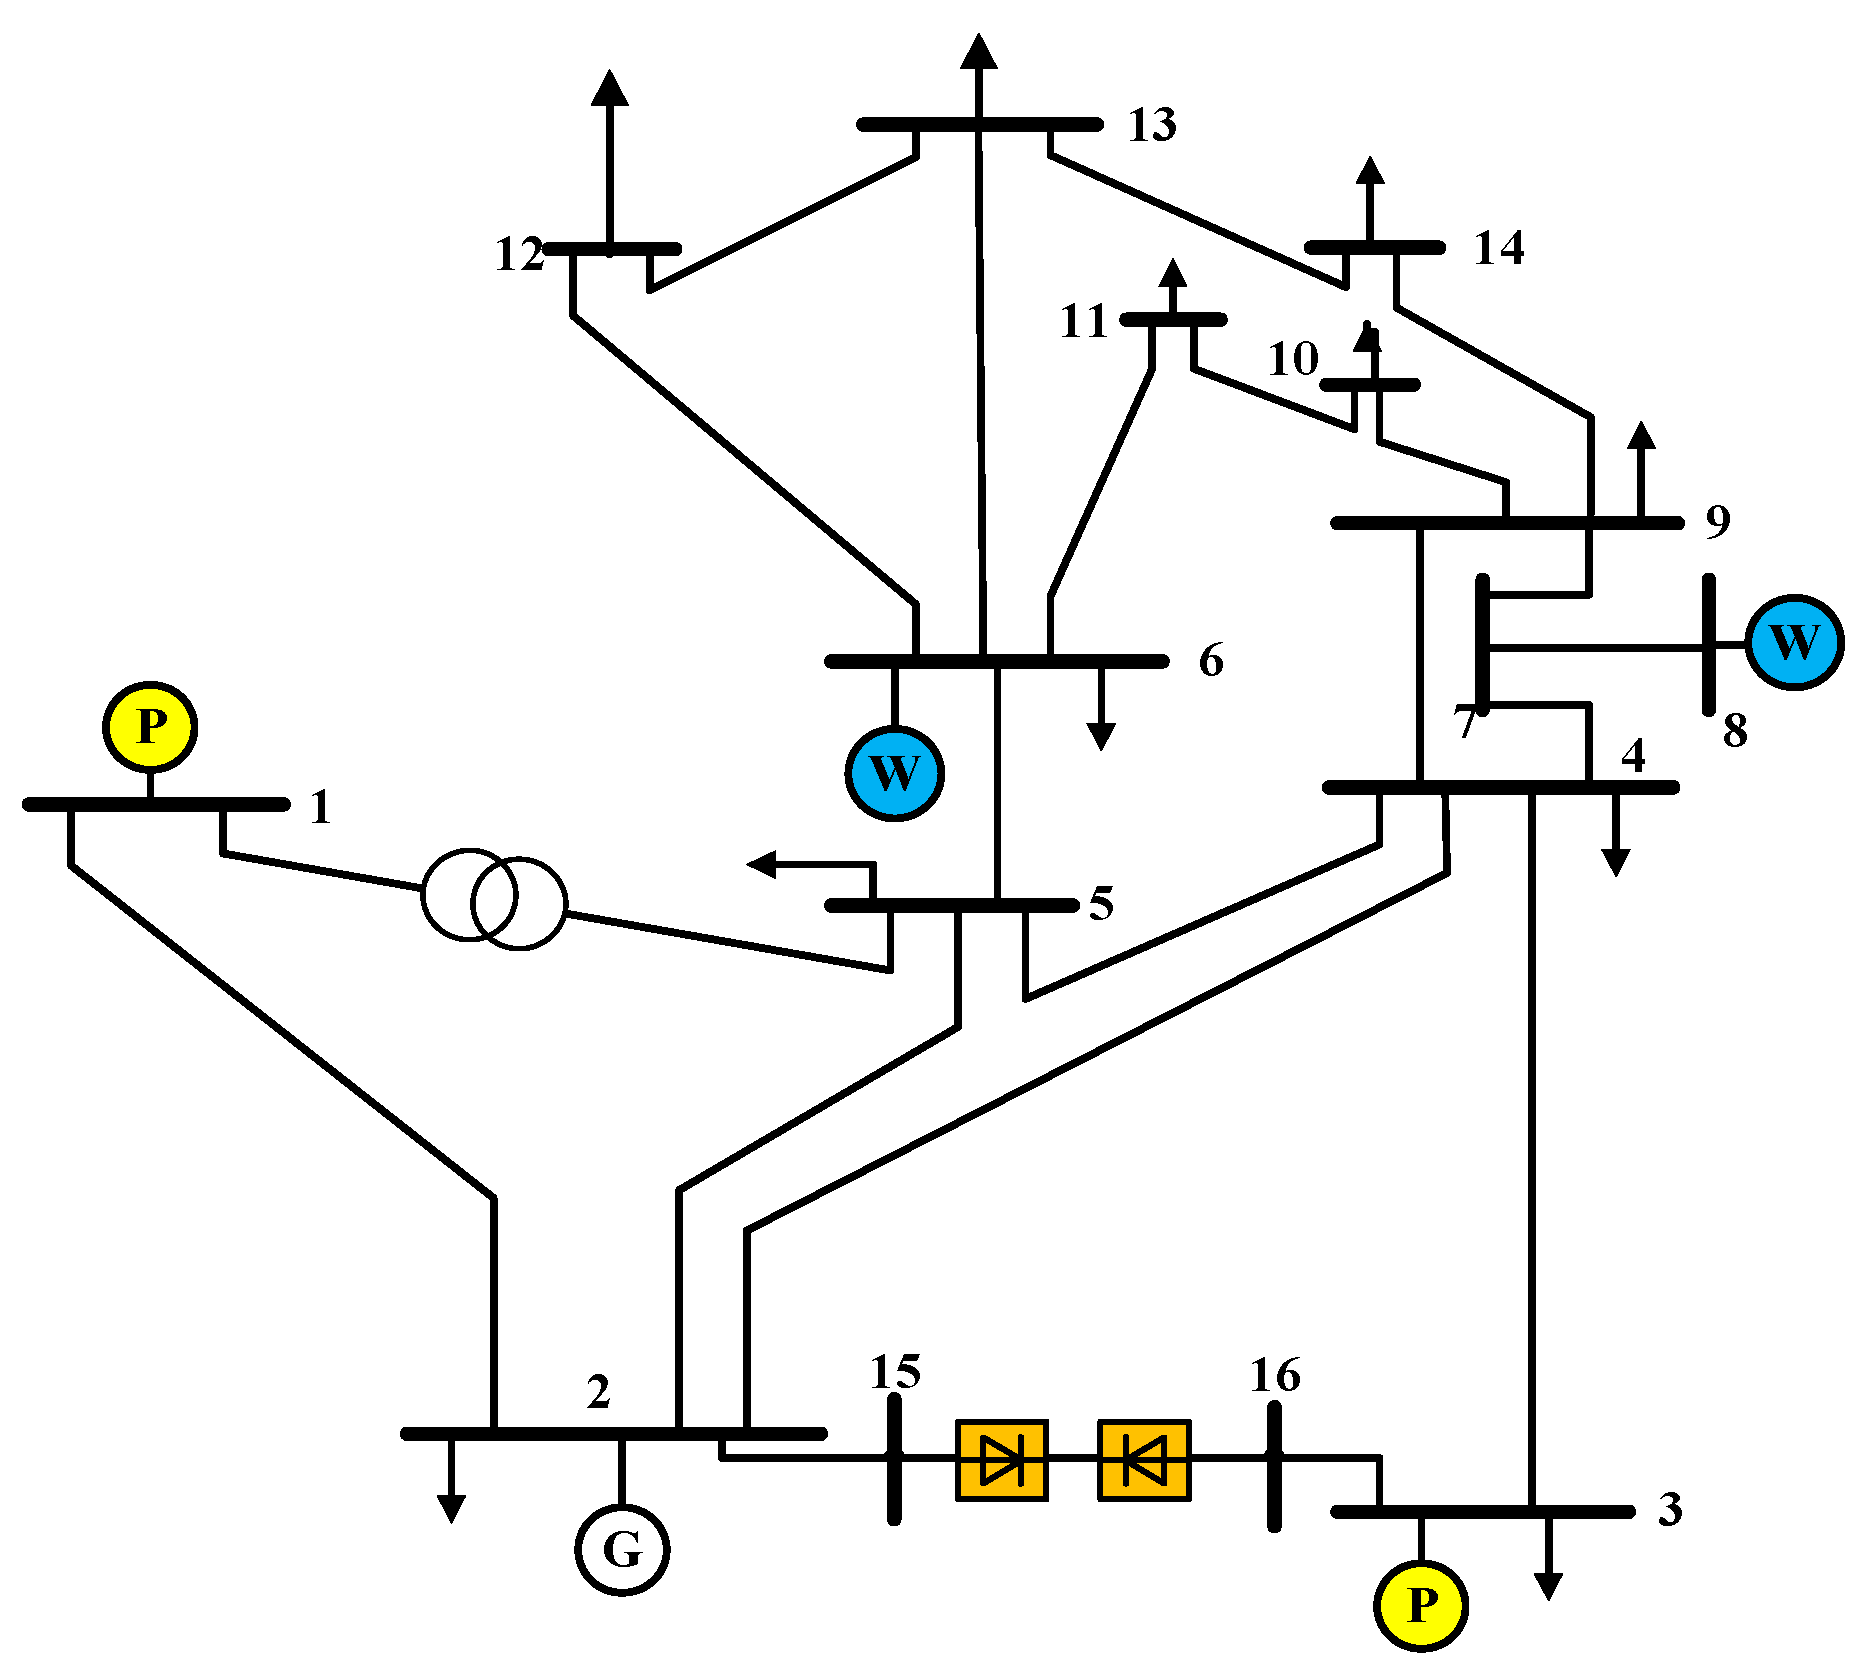
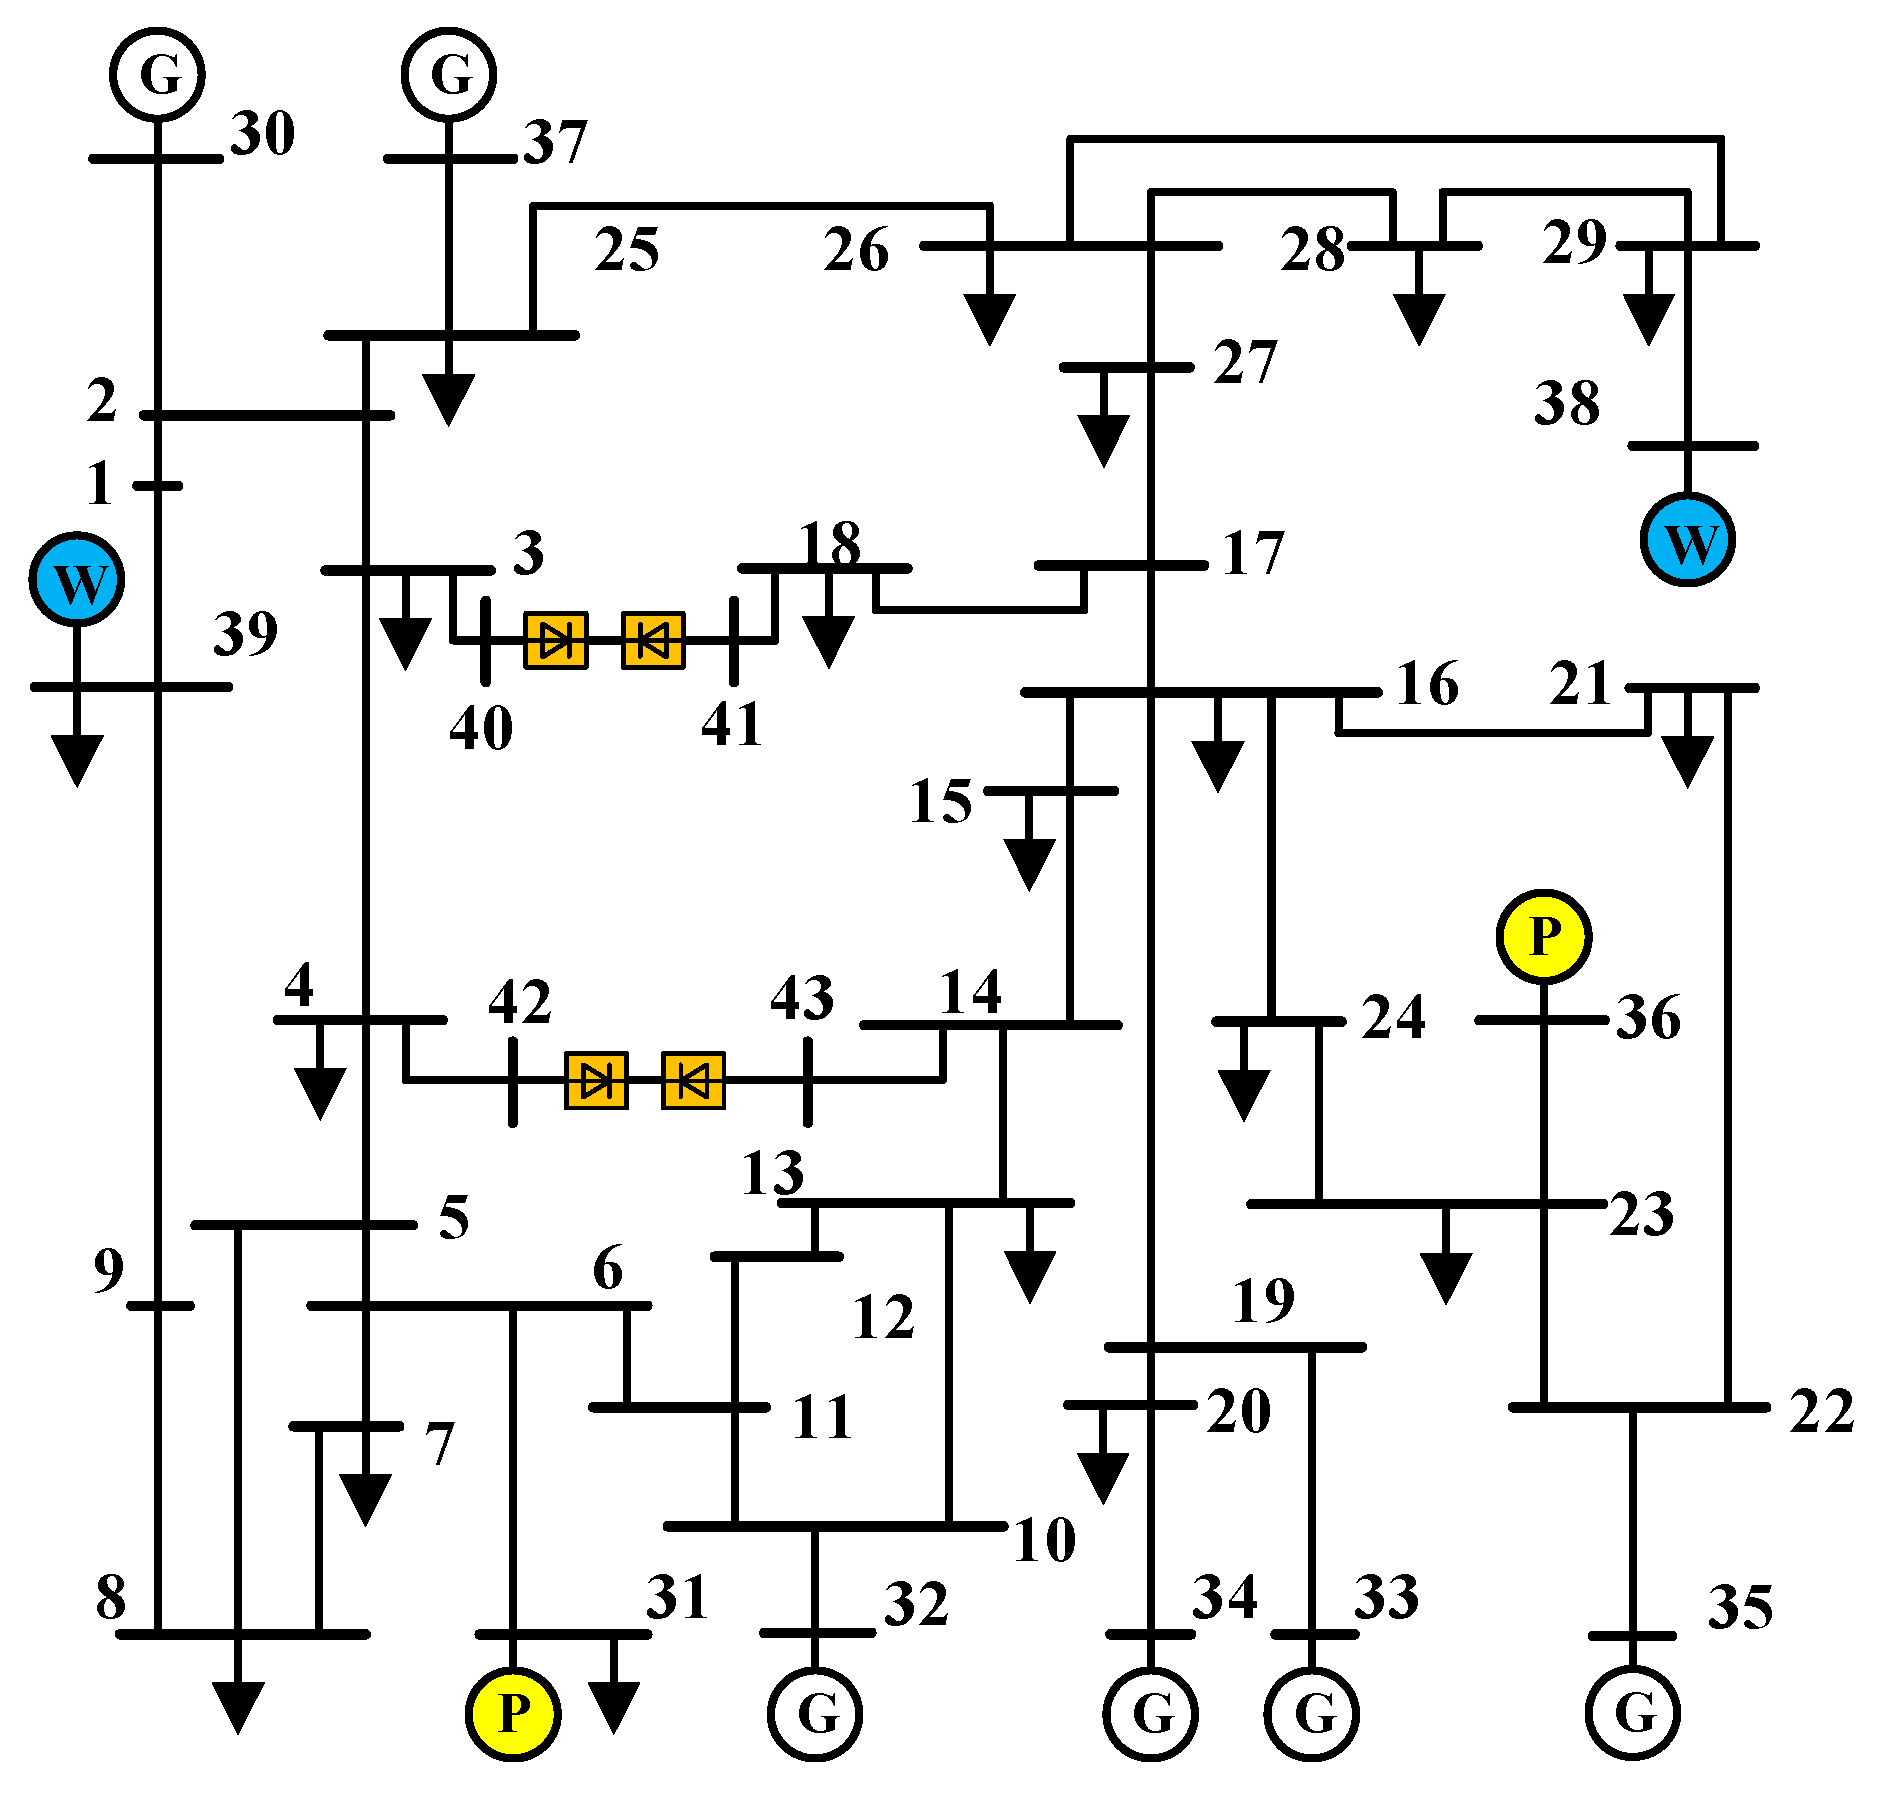
To validate the effectiveness of the proposed method, this study employs modified IEEE 9, 14 and 39 bus systems. Selected transmission lines were converted to DC links, and conventional generators were replaced with wind turbines and photovoltaic systems. Pre-selected reactive compensation installation buses were Bus 1, Bus 2 and Bus 3. System configurations are shown in Figure 4, Figure 5 and Figure 6, with short-circuit ratios (SCR) provided in Table 1, Table 2 and Table 3.
SCR calculations revealed Bus 3 (SCR = 1.456 < 2.0) as a voltage-weak node. The average electrical distances in the improved IEEE 9 bus system between the candidate compensation buses and the weak node are shown in Table 4.
As demonstrated in Table 1 and Table 4, Bus 3 is identified as the optimal reactive compensation location for the improved IEEE 9 bus system.
The voltage-weak nodes identified were Bus 6 (SCR = 1.245) and Bus 8 (SCR = 1.365), both below the 2.0 threshold. The average electrical distances in the improved IEEE 14 bus system are shown in Table 5.
As shown in Table 2 and Table 5, Bus 2 is optimal for reactive compensation in the improved IEEE 14 bus system.
The voltage-weak nodes identified were Bus 38 (SCR = 1.432) and Bus 39 (SCR = 1.356). The average electrical distances in the improved IEEE 39 bus system are shown in Table 6.
As demonstrated in Table 3 and Table 6, Bus 1 is optimal for reactive compensation in the improved IEEE 39 bus system.

5.2. Validation Results

Validation was performed using MATLAB (fault duration: 0.1–0.2 s) with 150 Mvar switchable capacitor banks.
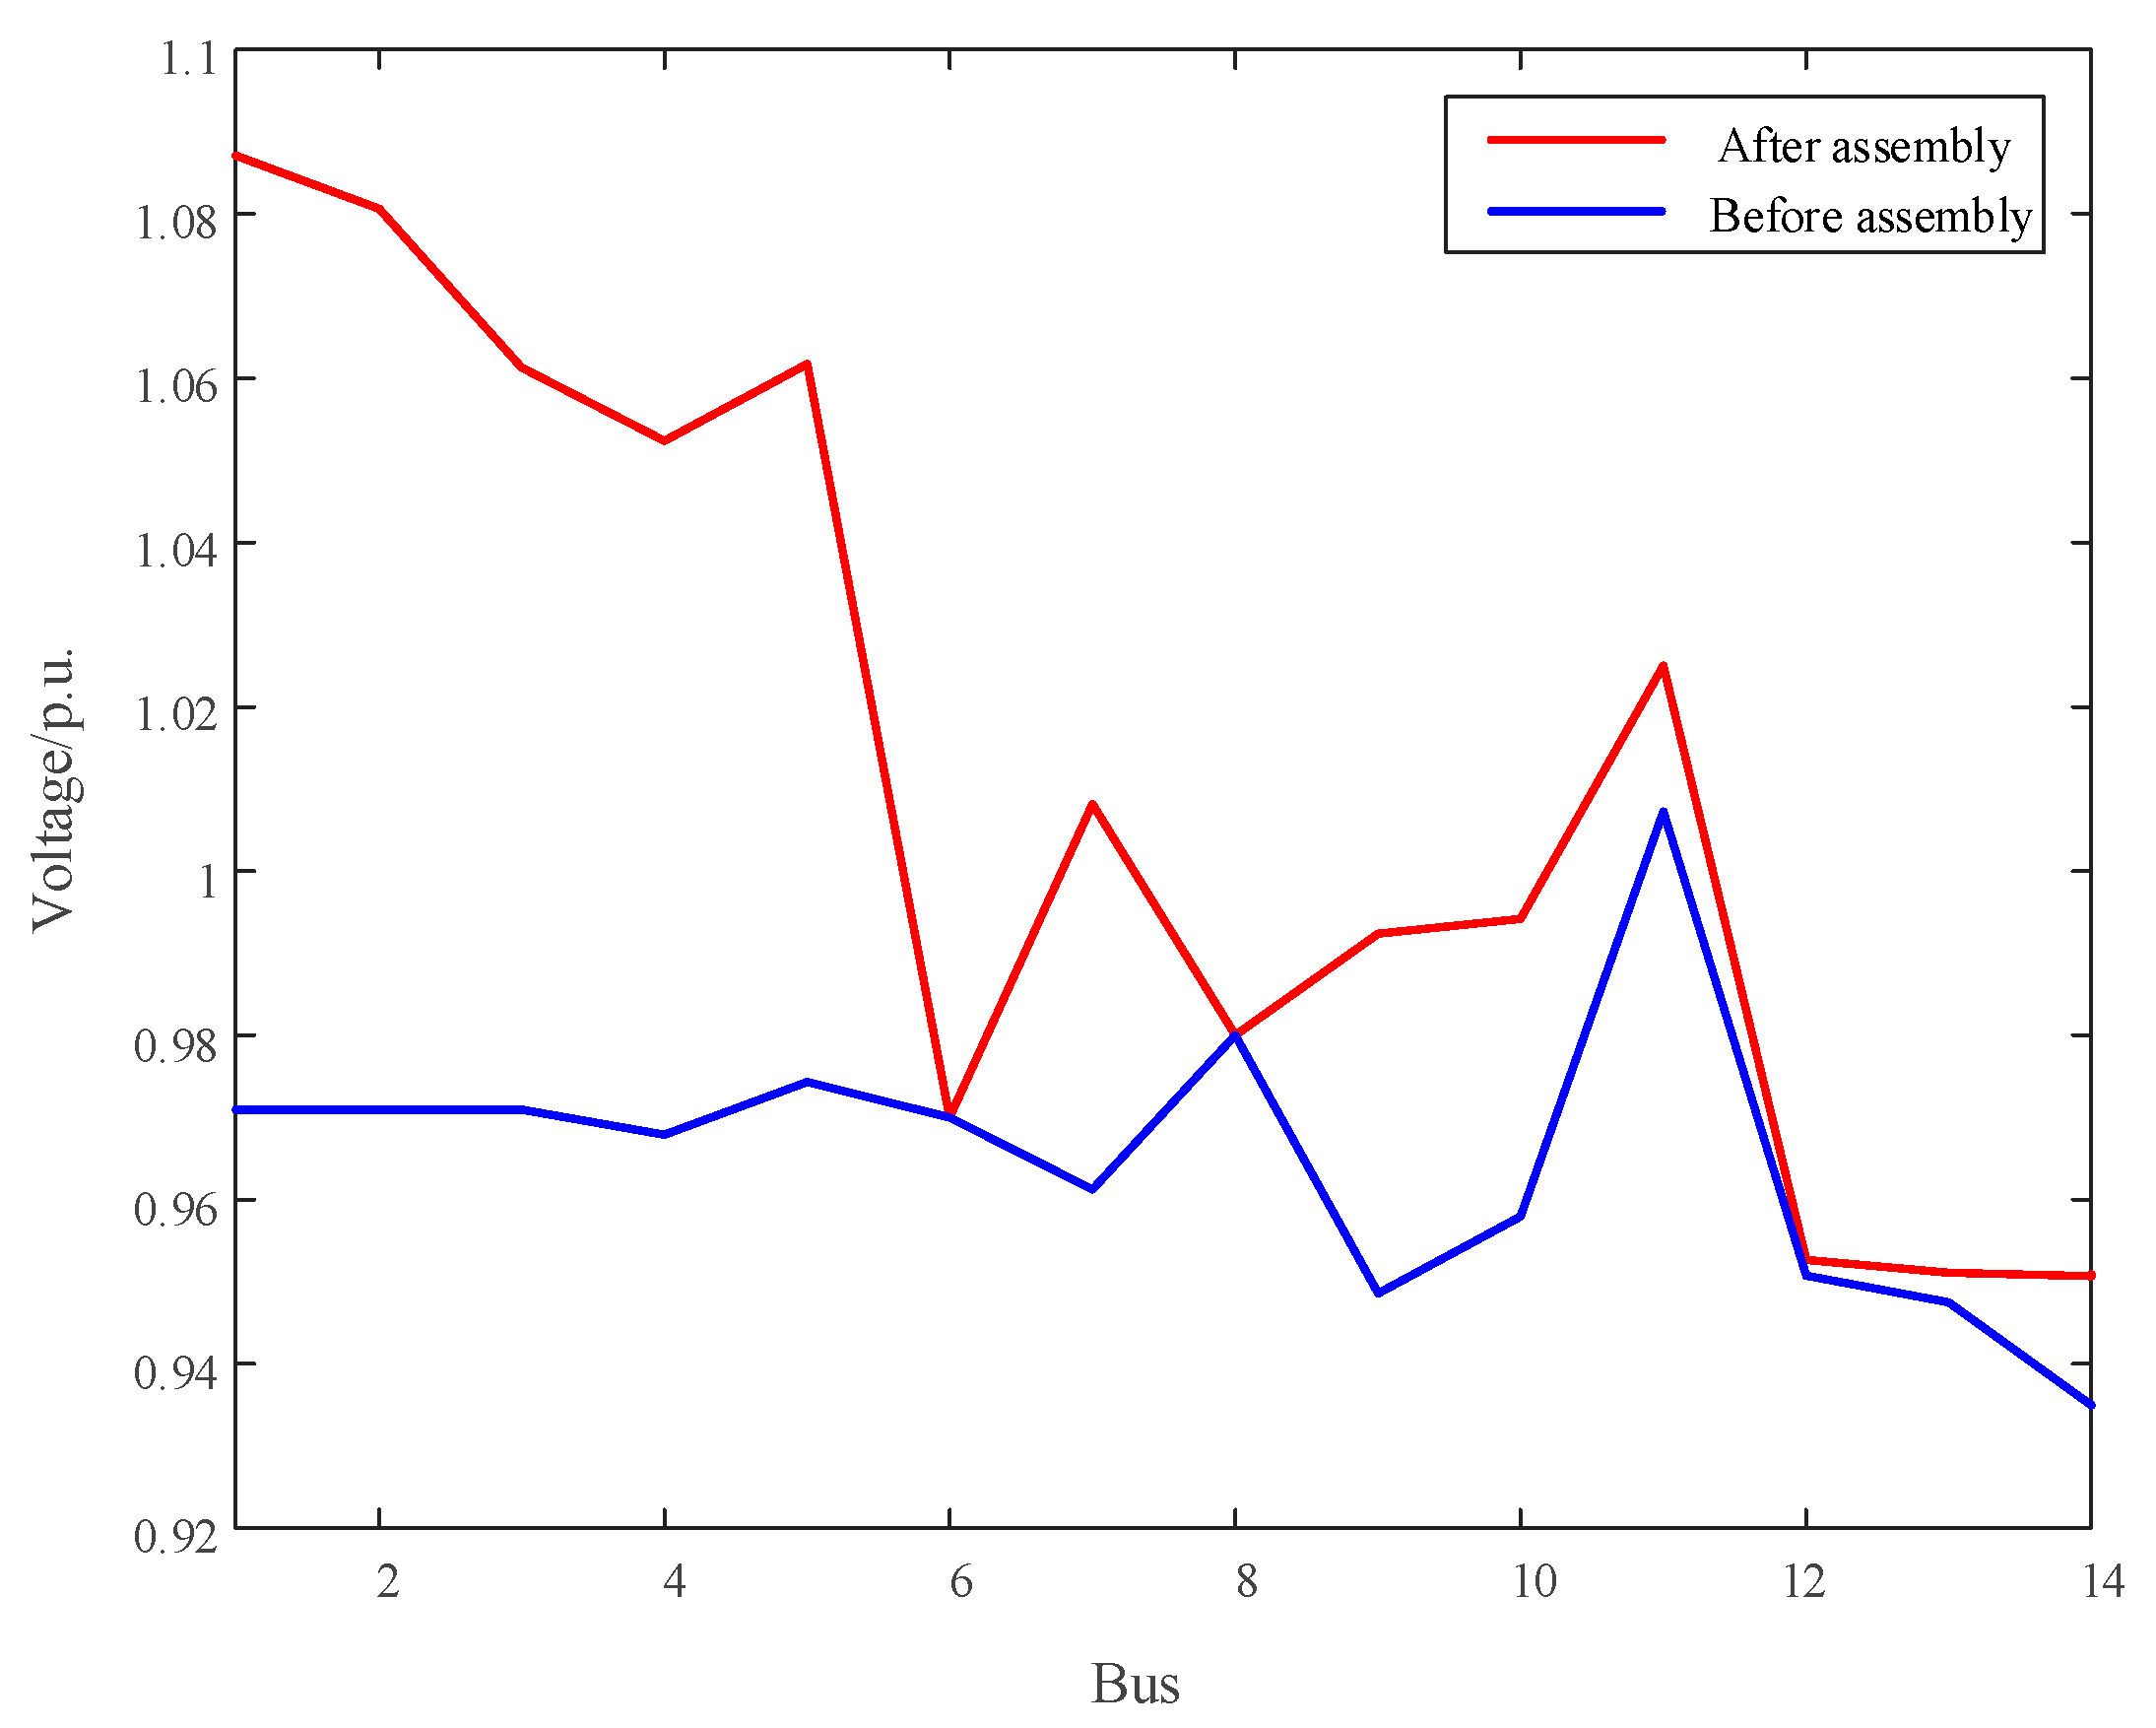
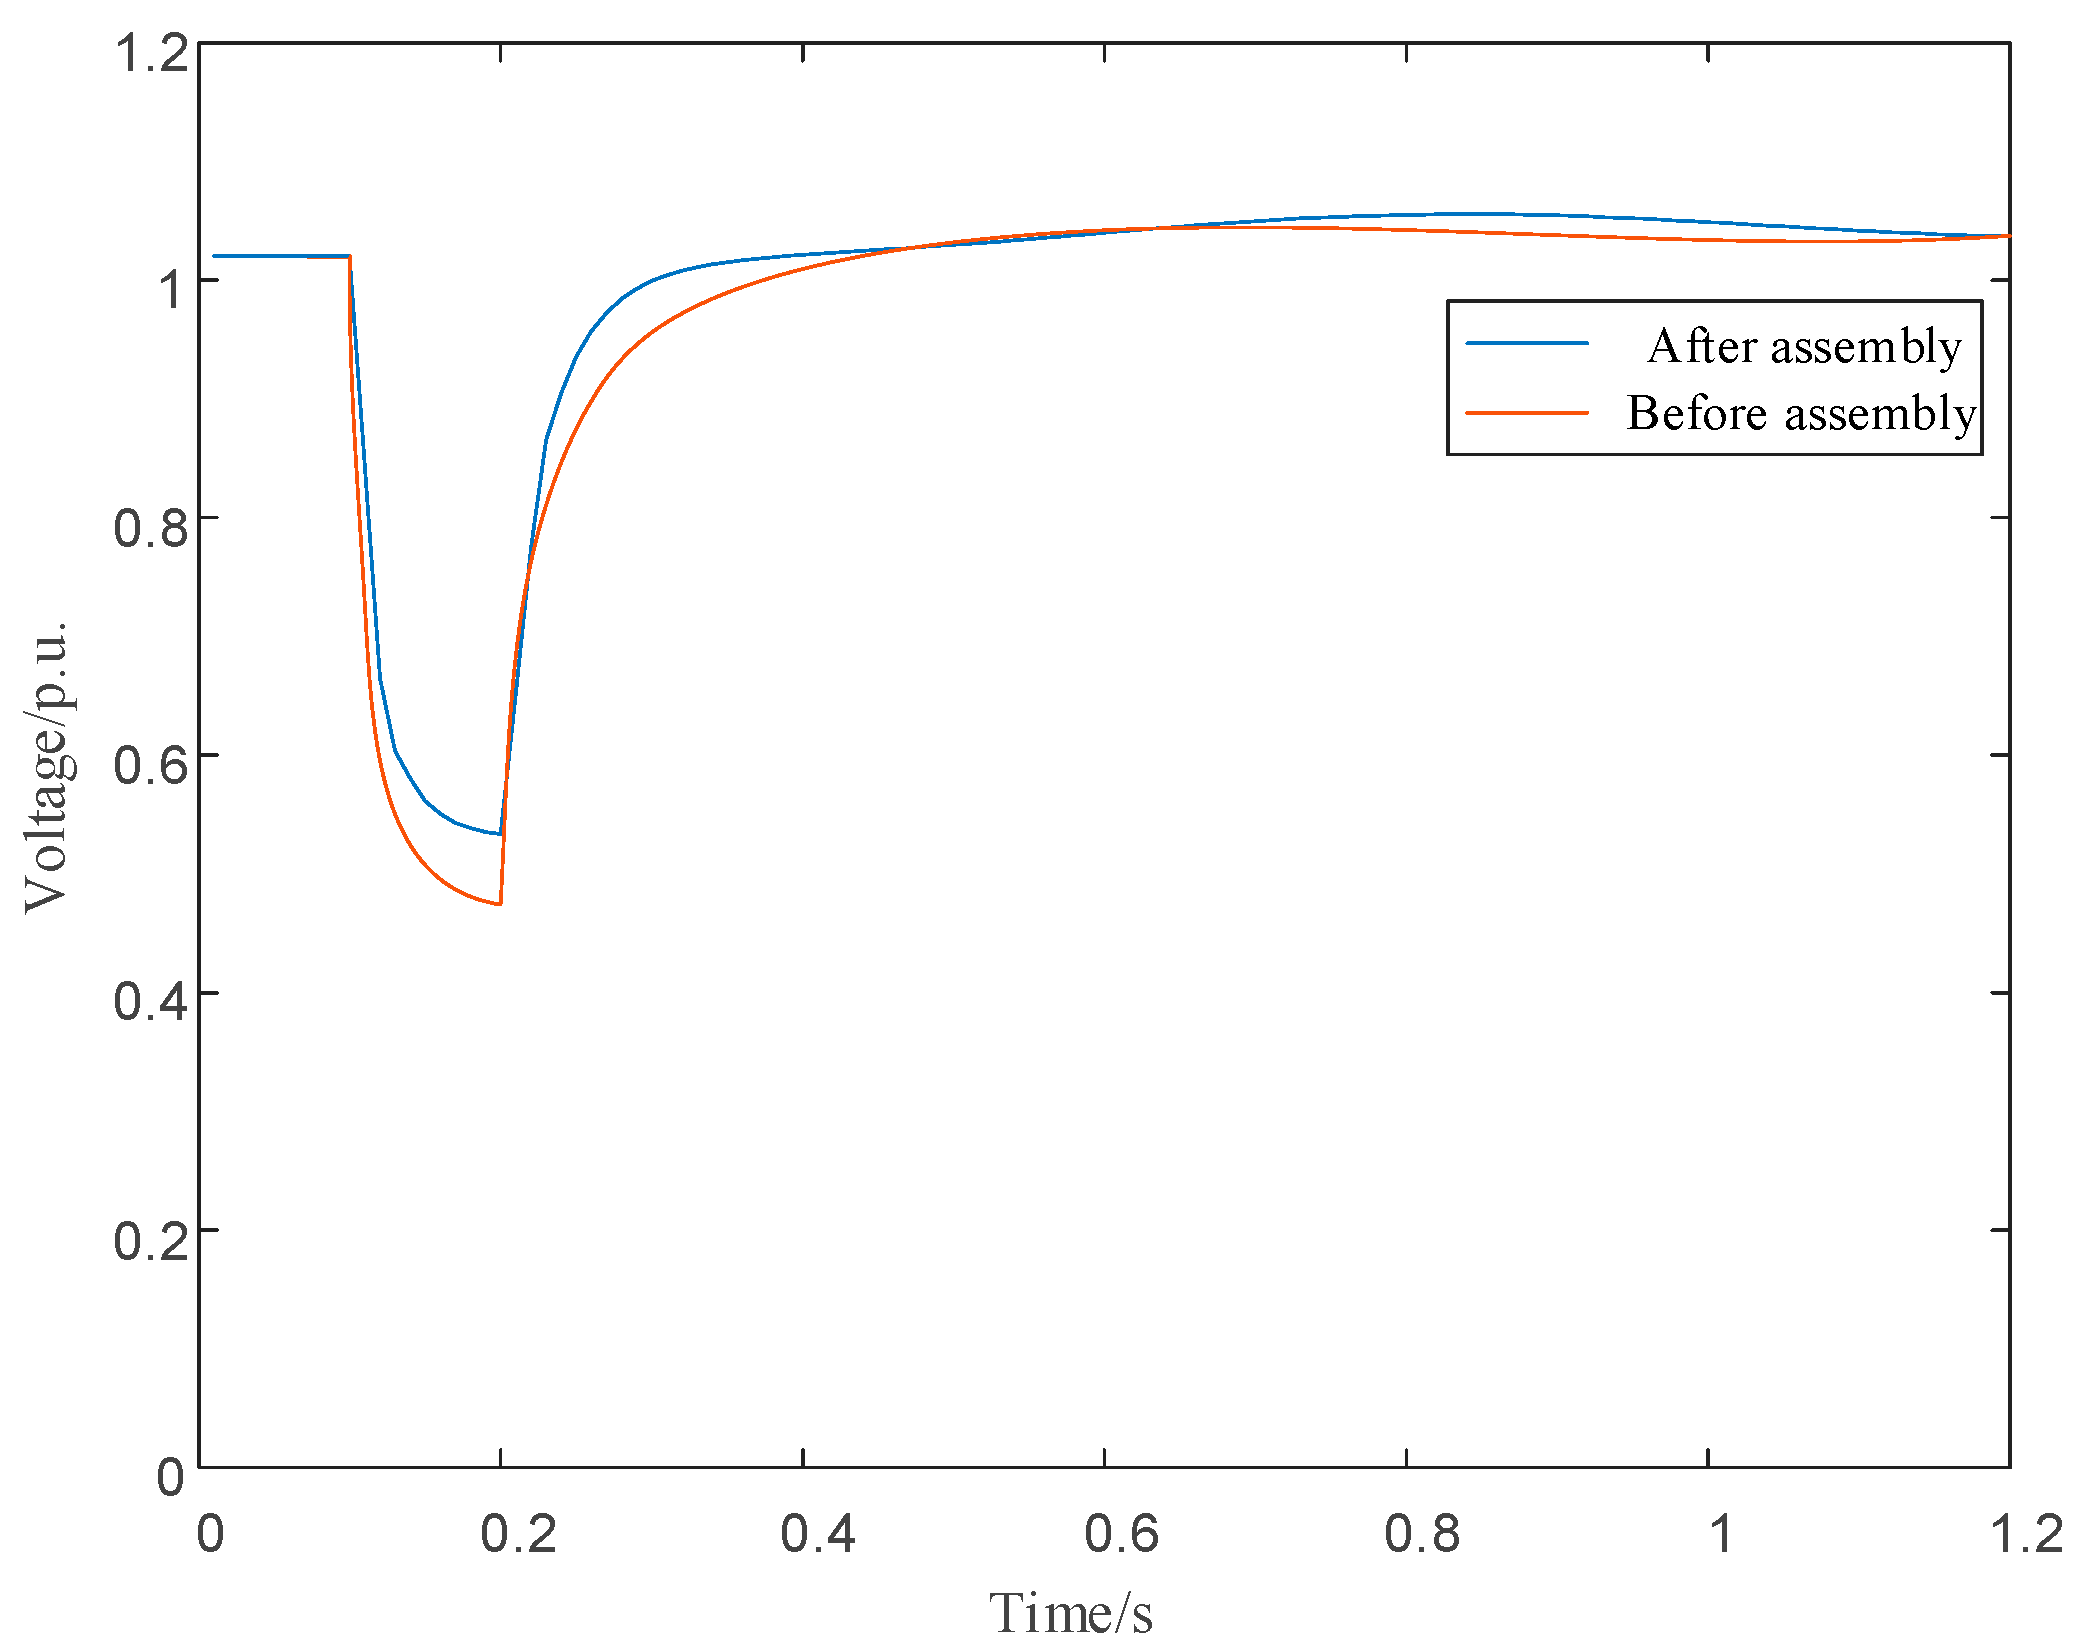
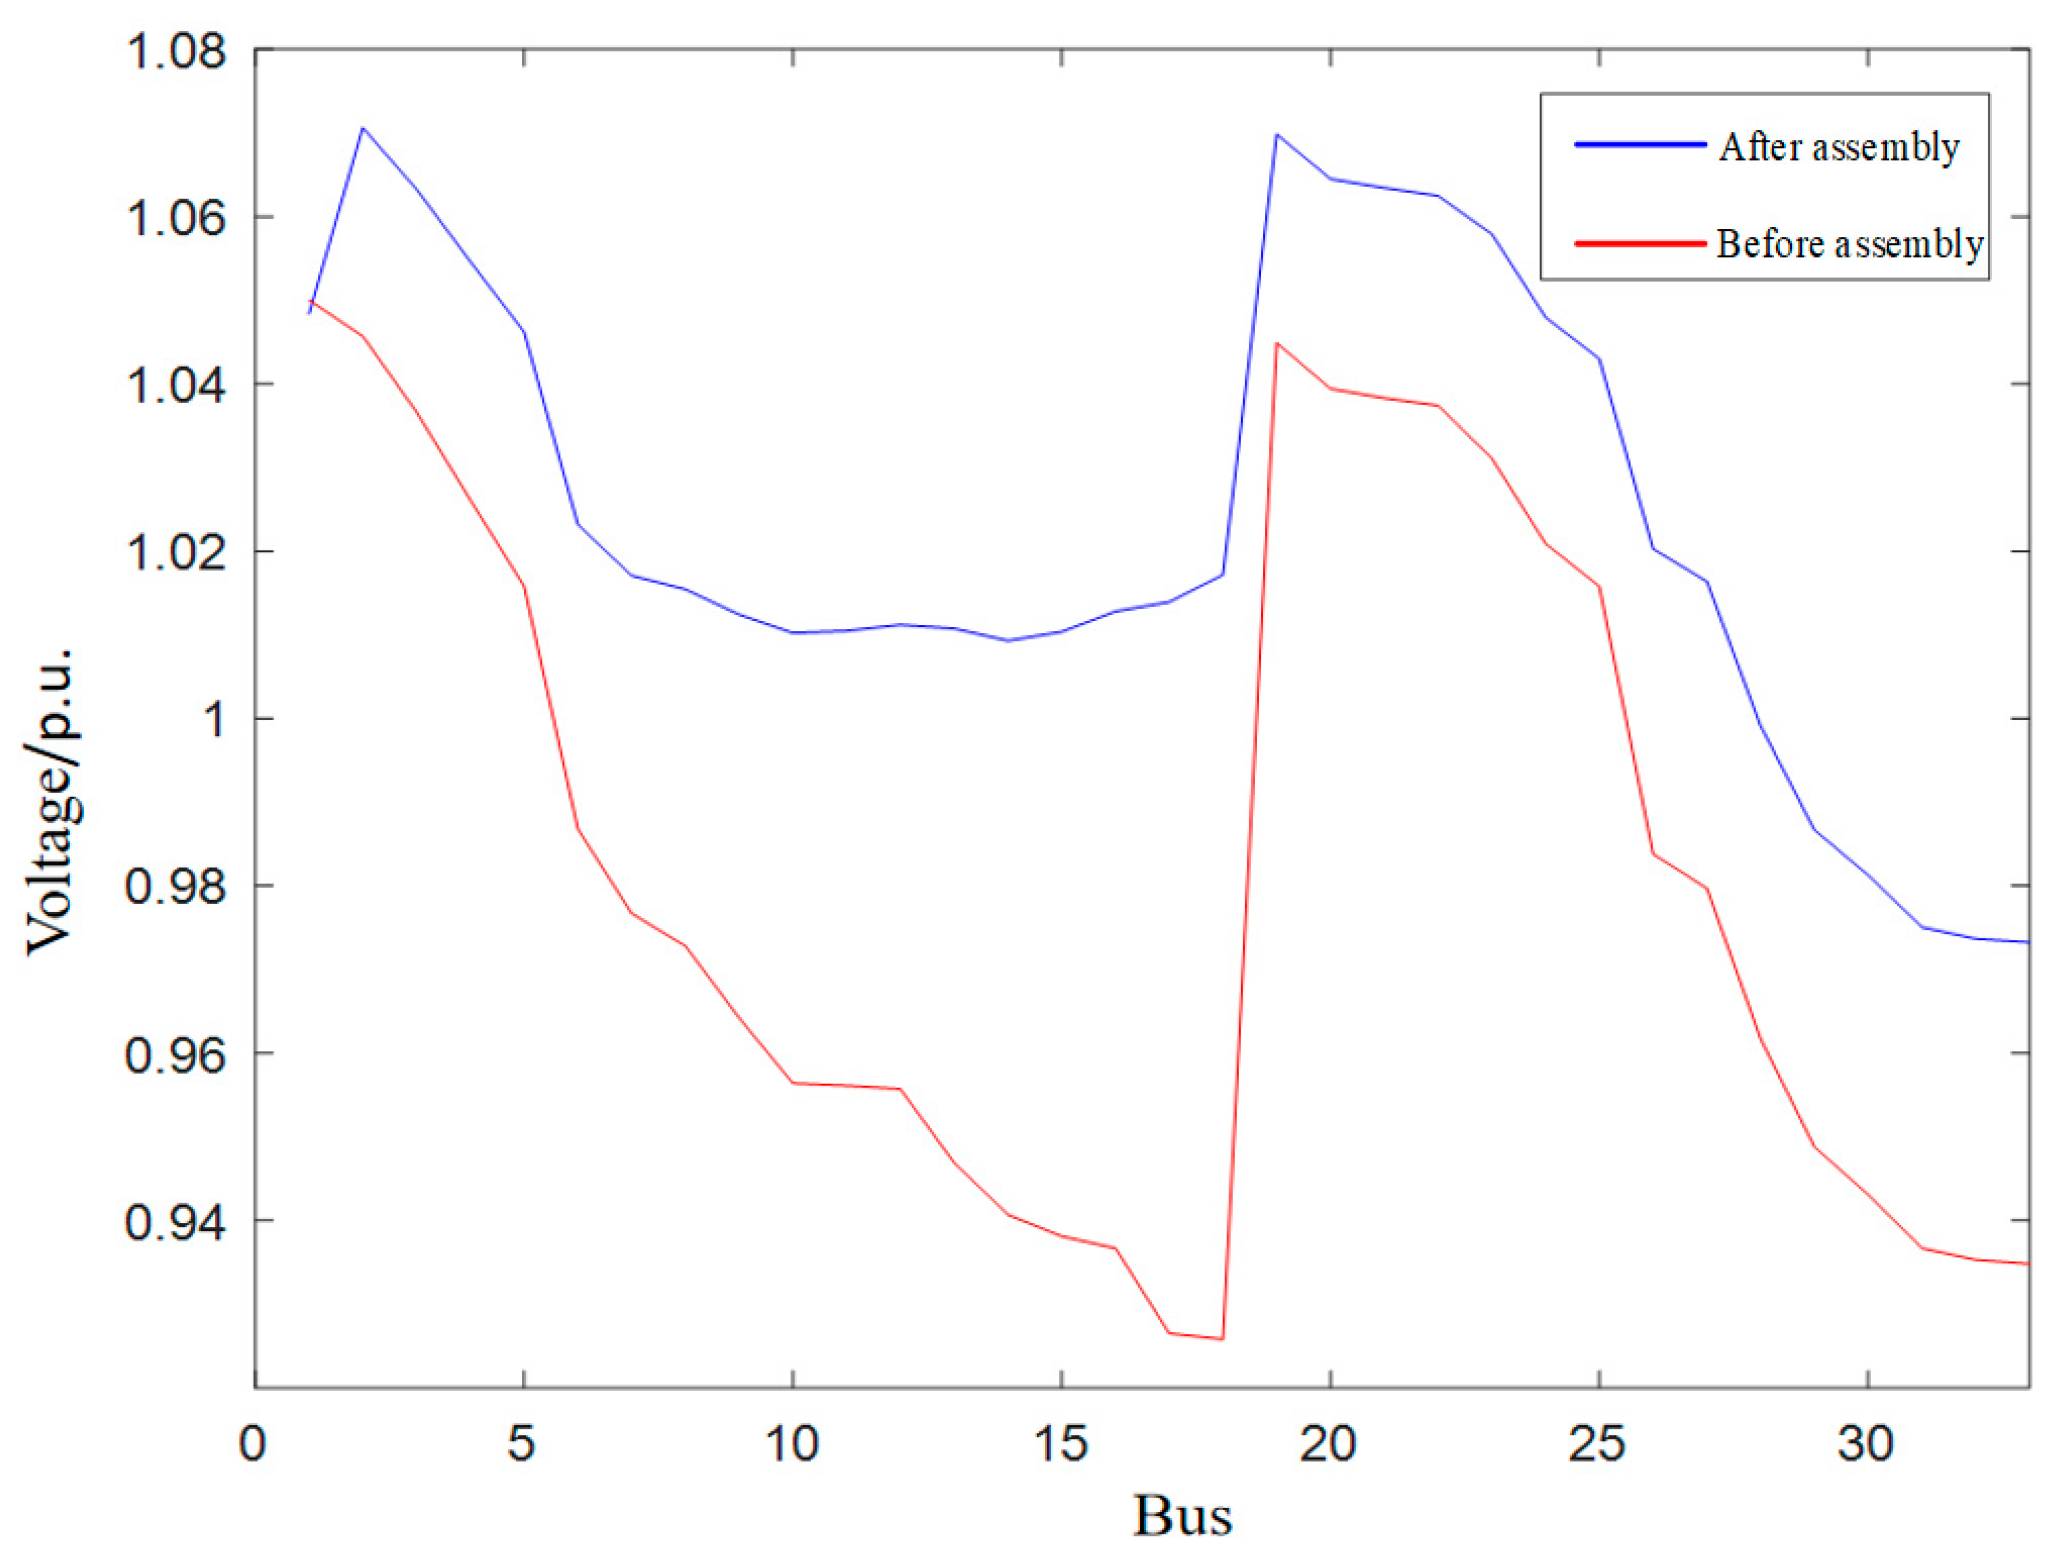
After the installation of a 50 Mvar capacitor bank at Bus 3, the voltage response at Bus 6 demonstrated significant improvement. During the fault event, the minimum voltage increased from 0.50 p.u. to 0.55 p.u., while the steady-state voltage rose from 0.95 p.u. to 1.00 p.u. The voltage stabilization time was reduced by approximately 0.8 s. Additionally, voltage fluctuation amplitudes at other buses were correspondingly diminished, resulting in a marked enhancement of the overall voltage stability of the system, as depicted in Figure 7. Comparative analysis of the voltage profiles pre- and post-device optimization reveals that the duration required for Bus 6’s voltage to recover to steady-state conditions was substantially shortened. Post-optimization, the voltage stability across all buses improved significantly, as illustrated in Figure 8.
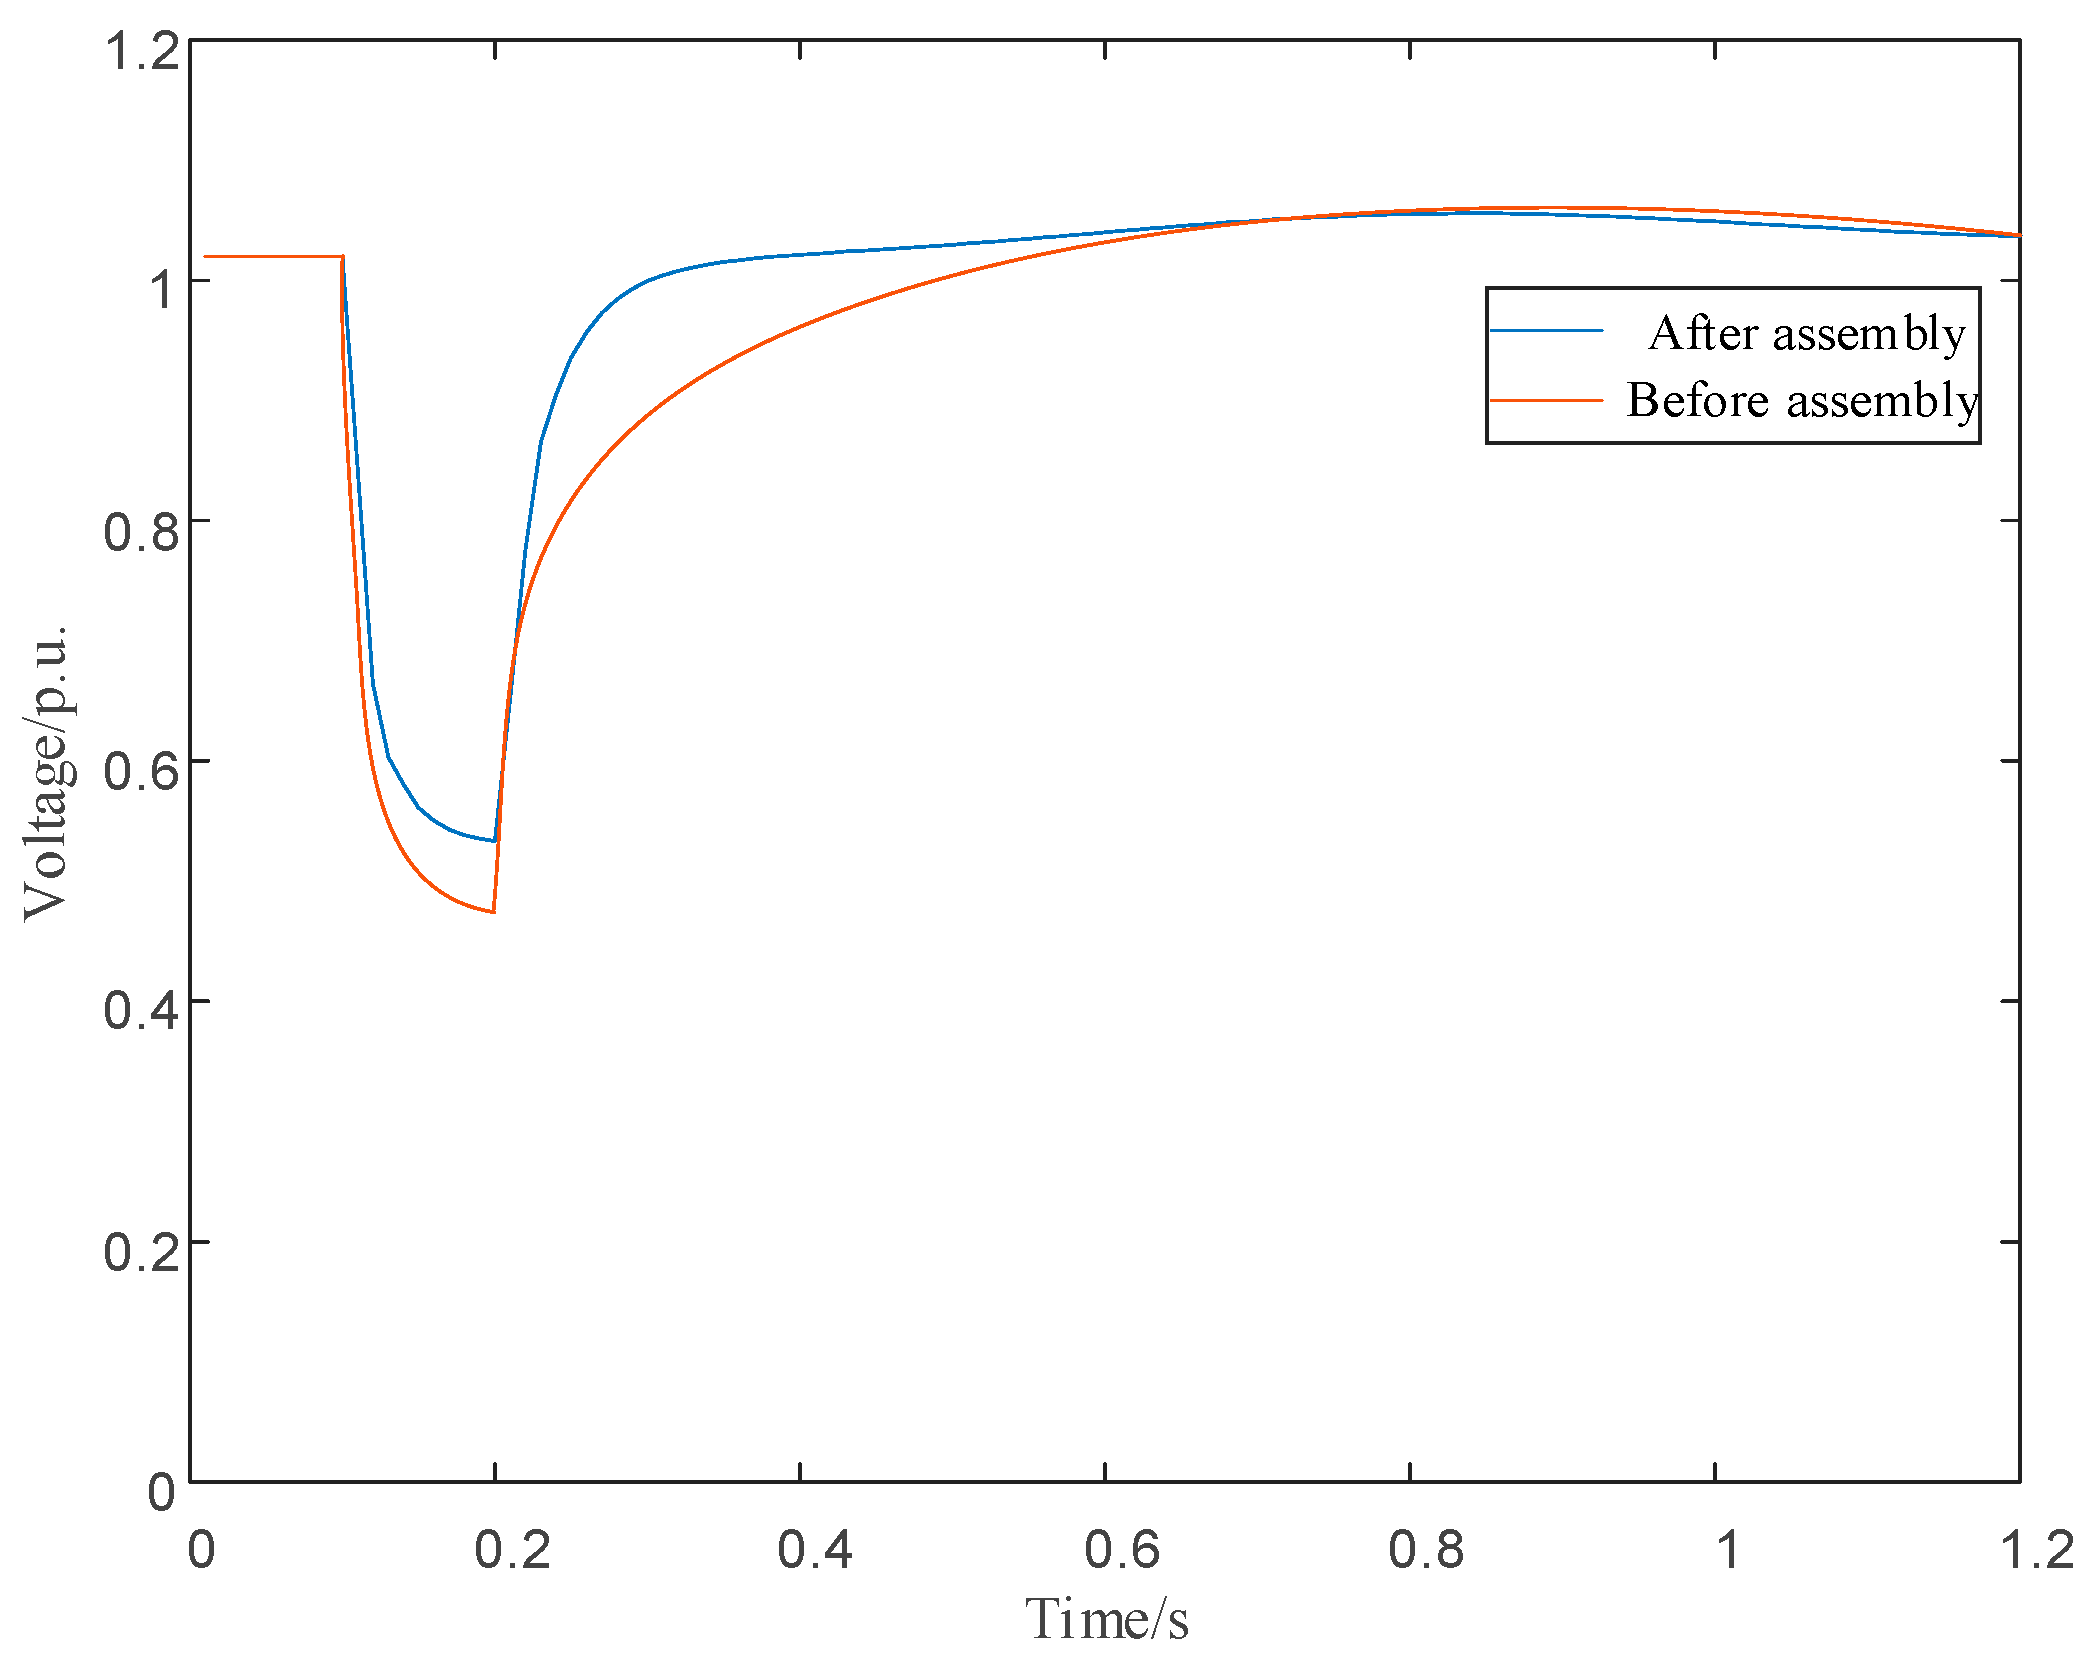
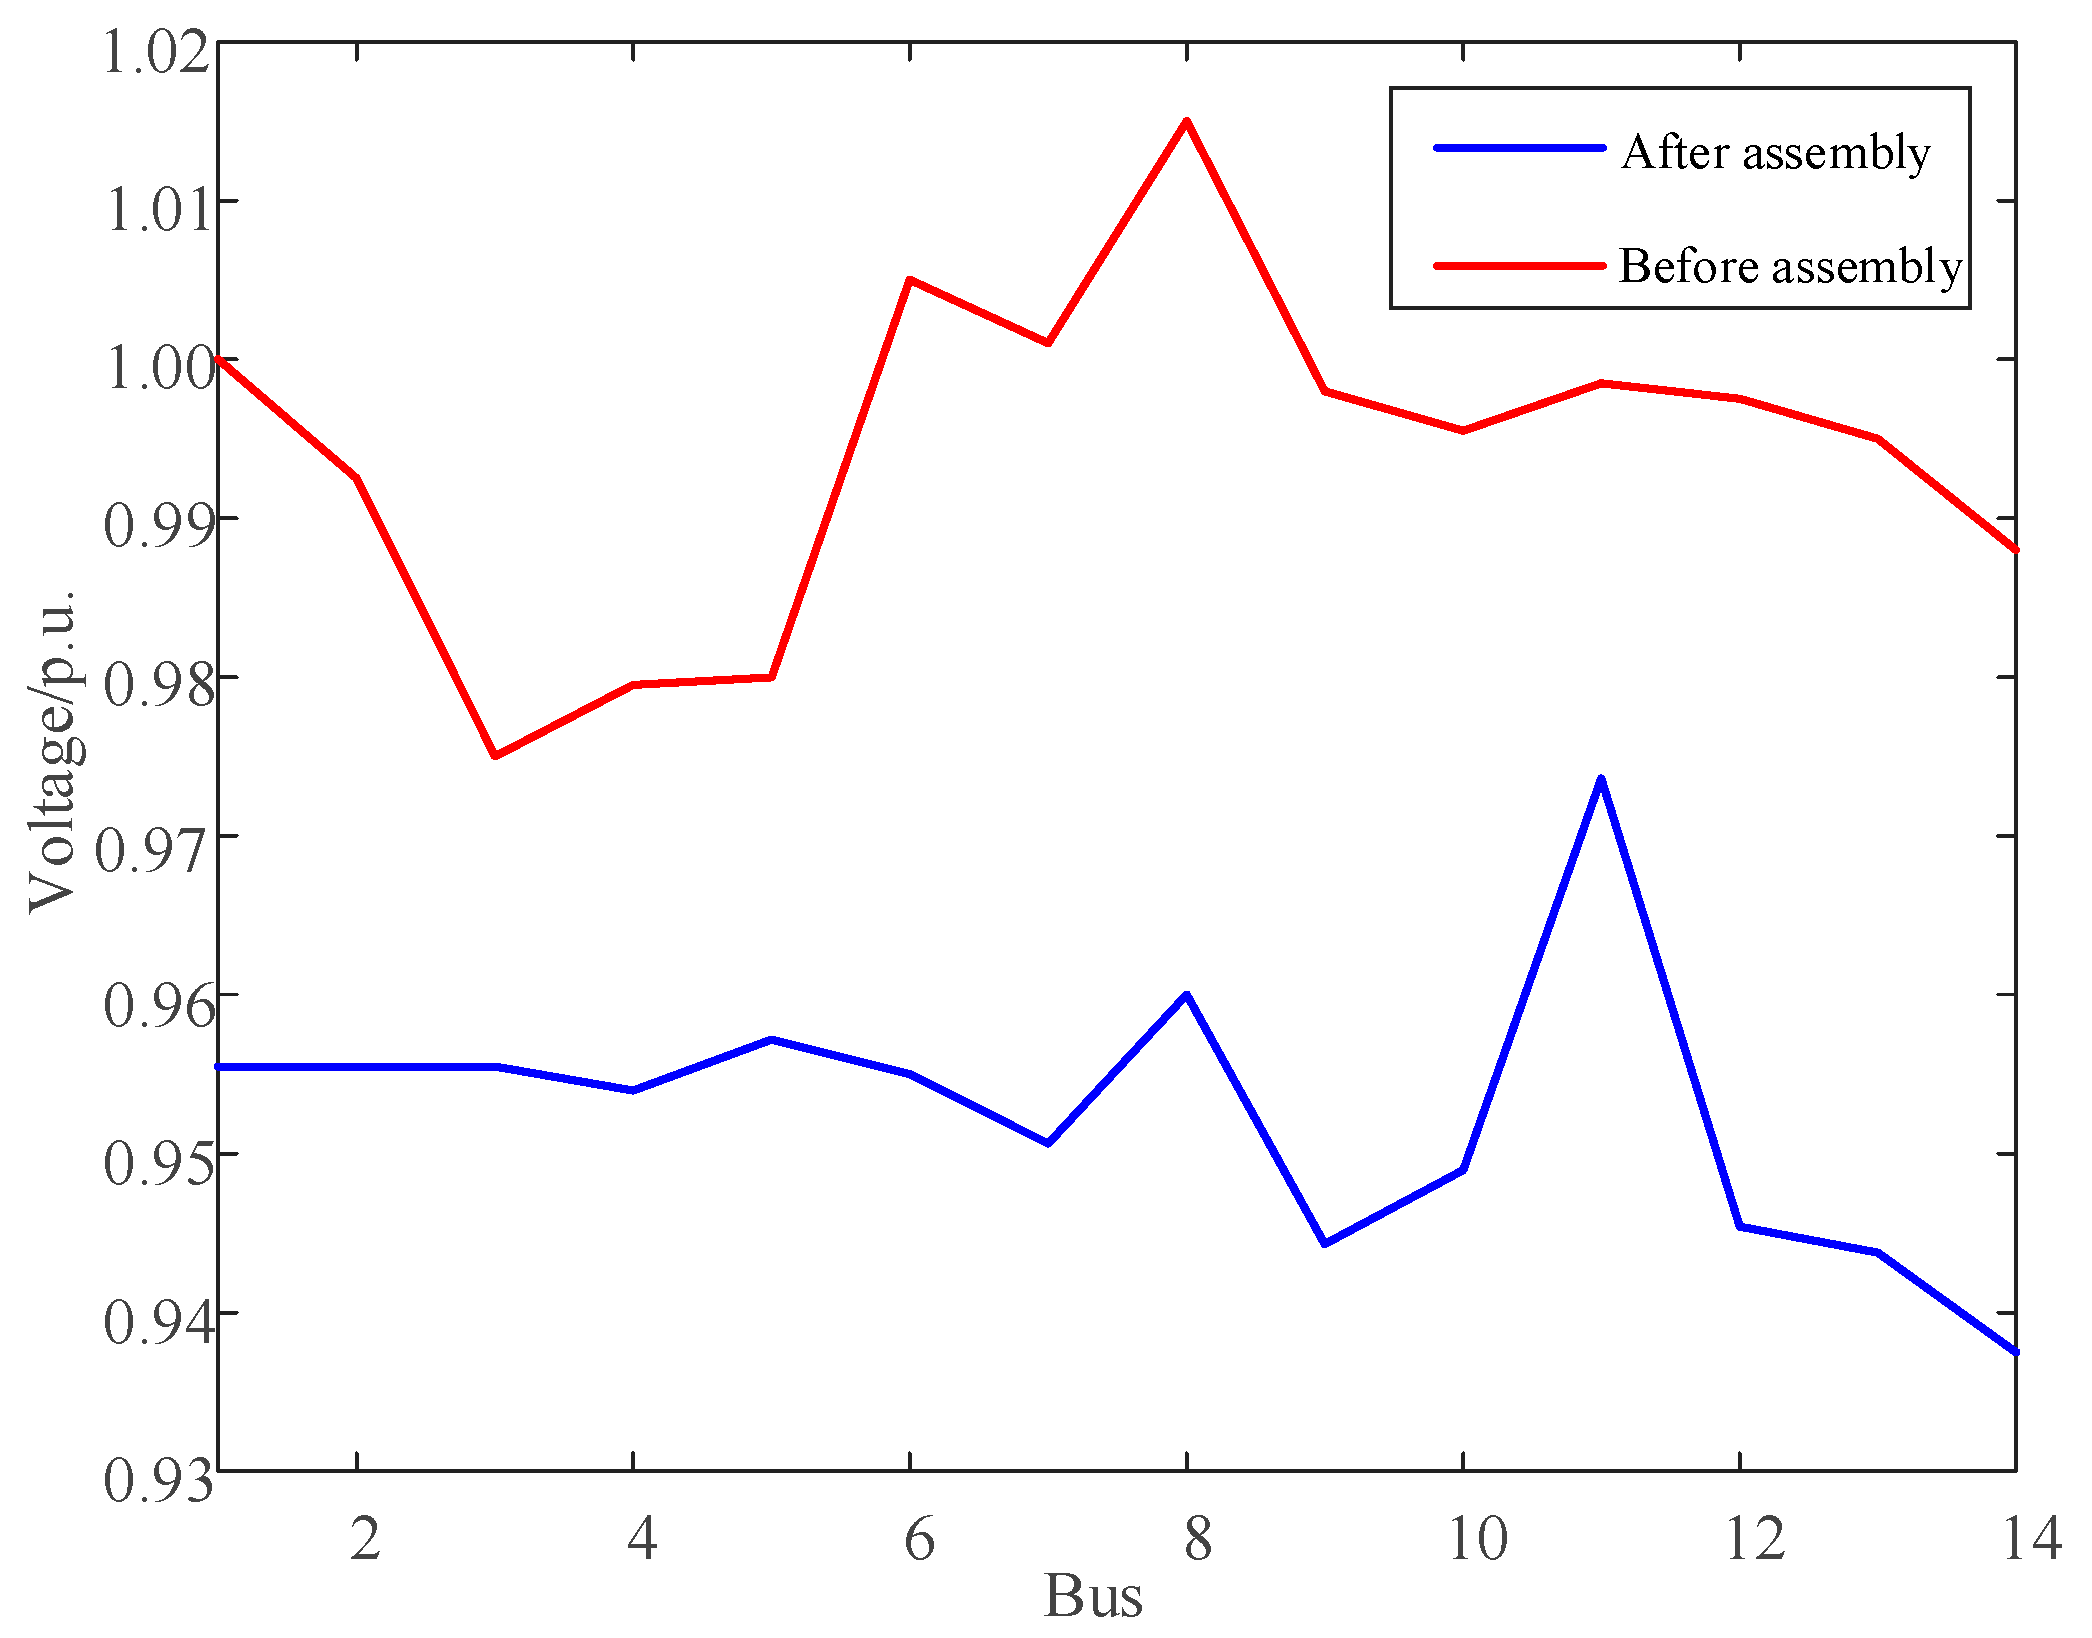
Following the activation of a 75 Mvar capacitor bank at Bus 2, the voltage profile at Bus 6 demonstrated significant improvement. During the fault event, the minimum voltage increased from 0.50 p.u. to 0.58 p.u., while the voltage stabilization time was reduced by approximately 0.2 s. Additionally, voltage fluctuation amplitudes at other buses were correspondingly diminished, resulting in a marked enhancement of the overall voltage stability of the system, as depicted in Figure 9. Comparative analysis of voltage profiles pre- and post-device optimization reveals that the duration required for Bus 6’s voltage to recover to steady-state conditions was substantially shortened. Post-optimization, the voltage stability across all buses improved significantly, as illustrated in Figure 10.
Following the activation of a 150 Mvar capacitor bank at Bus 1, the voltage profile at Bus 6 demonstrated significant improvement. During the fault event, the minimum voltage increased from 0.50 p.u. to 0.58 p.u., while the voltage stabilization time was reduced by approximately 0.15 s. Additionally, voltage fluctuation amplitudes at other buses were correspondingly diminished, resulting in a marked enhancement of the overall voltage stability of the system, as depicted in Figure 11. Comparative analysis of voltage profiles pre- and post-device optimization reveals that the duration required for Bus 6’s voltage to recover to steady-state conditions was substantially shortened. Post-optimization, the voltage stability across all buses improved significantly, as illustrated in Figure 12.
The practical implications of these voltage improvements are critical for grid compliance and operational resilience. The 0.05–0.08 p.u. increase in minimum fault voltage ensures that voltage nadirs remain safely above the IEEE 1547 LVRT threshold of 0.15 p.u. during severe disturbances, preventing unnecessary DG disconnections. For example, at Bus 6 in the IEEE 9 bus system, as shown in Figure 7, the pre-compensation voltage dipped to 0.50 p.u., risking violation, while the post-compensation voltage was sustained at 0.55 p.u., achieving compliance margins. Simultaneously, the 0.15–0.8 s reduction in voltage recovery time minimizes transient over-voltage and under-voltage durations, reducing protection relay misoperation risks during fault recovery. As demonstrated in the IEEE 39 bus system, with the results depicted in Figure 11, the voltage stabilized within 1.2 s versus a 2.0 s baseline, ensuring that the protective devices operate within design tolerances. Consequently, these improvements collectively reduced fault-induced DG disconnections, directly enhancing grid resilience.
This methodology effectively elevates voltage levels at all buses, thereby enhancing the system’s short-circuit ratio. Validation on modified IEEE 9, 14 and 39 bus test systems via MATLAB simulations confirms that the proposed approach achieves rapid convergence and significantly improves bus voltages, resulting in enhanced system stability. In summary, this method provides an effective solution for optimizing the configuration of compensation devices.

6. Conclusions

This study addresses voltage stability challenges in power grids with large-scale distributed generation integration by proposing an optimal reactive power compensation configuration method. The approach employs short-circuit ratio criteria to identify voltage-weak nodes and utilizes the average electrical distance metric to determine optimal compensation locations. Validation through MATLAB simulations confirms the efficacy of the proposed configuration scheme. Case studies using modified IEEE 9, 14 and 39 bus test systems demonstrate effective resolution of under-/over-voltage compensation configuration problems. Following severe grid faults, this method enhances distributed generation fault ride-through capability, ensuring the secure and stable operation of highly integrated power systems. Key quantitative findings demonstrate significant improvements: minimum fault voltage increased by 0.05–0.08 p.u. across test systems, and voltage recovery time reduced by 0.15–0.8 s. These enhancements were achieved through three core innovations: an SCR < 2.0 threshold for precise weak node identification, an average electrical distance metric optimizing placement efficacy, and chance-constrained programming integrating disconnection limits.
Future research will extend this methodology to ultra-large-scale DG integration in multi-area hybrid AC/DC grids, develop real-time adaptive compensation strategies for renewable intermittency and optimize cost–stability tradeoffs with energy storage systems. These advancements will provide comprehensive solutions for modern grid stability while bridging theoretical frameworks and practical implementations. The integration of artificial intelligence algorithms and real-time optimization techniques will develop dynamic reactive compensation strategies to address intermittency and volatility challenges in renewable generation. Cost–stability tradeoff analysis will further optimize equipment configuration economics. Synergistic optimization with energy storage systems and demand response technologies will explore multi-energy coordination approaches, providing theoretical and practical support for modern grid stability. These advancements will offer comprehensive solutions for increasingly complex grid operating environments while enhancing practical applicability.

Author Contributions

Conceptualization, T.N.; Methodology, N.F., J.Y., Y.F. and Y.L.; Software, J.Y.; Validation, N.F. and J.Y.; Formal analysis, N.F.; Data curation, Y.Z.; Writing—original draft, T.N. and J.Y.; Writing—review & editing, T.N. and J.Y.; Supervision, T.N. All authors have read and agreed to the published version of the manuscript.

Funding

This research was funded by State Grid Corporation of China Technology Project (Research on optimization and evaluation technology of AVC control strategy of urban power grid under the trend of power electronics), grant number 520940230004.

Data Availability Statement

The original contributions presented in this study are included in the article. Further inquiries can be directed to the corresponding author.

Conflicts of Interest

Author Nan Feng, Jun Yan, Yufan Zhang, Yuyao Feng was employed by the company Electric Power Research Institute, State Grid Shanghai Municipal Electric Power Company. The remaining authors declare that the research was conducted in the absence of any commercial or financial relationships that could be construed as a potential conflict of interest.

References

  1. Shyamal, P.; Krishna, M.; Sukumar, K. Distributed control of distributed energy resources in active power distribution system for local power balance with optimal spectralclustering. IEEE Trans. Power Syst. 2022, 58, 5395–5408. [Google Scholar] [CrossRef]
  2. Zhang, C.; Dou, X.; Wang, L.; Dong, Y.; Ji, Y. Distributed cooperative voltage control for grid-following and grid-forming DGs in islanded microgrids. IEEE Trans. Power Syst. 2022, 38, 589–602. [Google Scholar] [CrossRef]
  3. Wang, Y.C.; Zhang, S.; Lin, Z.Z.; Jiang, C.W.; Tang, L.; Wen, F.S. Market mechanisms and implementation methodsfor distributed sources and loads participating in ancillary services. Autom. Electr. Power Syst. 2023, 47, 3–16. [Google Scholar] [CrossRef]
  4. Hao, W.; Meng, Z.; Zhang, Y.; Xie, B.; Peng, P.; Wei, J. Carrying capacity evaluation of multipledistributed power supply access to the distribution network with the background of a new power system. Power Syst. Prot. Control 2023, 51, 23–33. [Google Scholar] [CrossRef]
  5. Zhang, S.; Gu, W.; Zhang, X.; Chung, C.Y.; Yu, R.; Lu, S.; Palma-Behnke, R. Analysis for integrated energy system: Benchmarking methods and implementation. Energy Internet 2024, 1, 63–80. [Google Scholar] [CrossRef]
  6. Fan, Y.; Chen, N.; Zhao, Y.; Ding, X.; Zhang, R.; Zhang, X. Review of methodology and best practice of power system restoration plan. Energy Internet 2024, 1, 123–140. [Google Scholar] [CrossRef]
  7. Safari, Z.; Javareshk, S.M.A.N.; Pourbagheri, M.; Niaemanesh, M.; Pakseresht, M. Congestion Management in Distribution Network: An Exploration of Distributed Generation and Demand Response Programs by Using the MOPSO Algorithm. In Proceedings of the 2023 27th International Electrical Power Distribution Networks Conference (EPDC), Mashhad, Iran, 12–15 June 2023; pp. 173–177. [Google Scholar] [CrossRef]
  8. Bayati, N.; Savaghebi, M. A Transient Component-Based Technique for Fault Detection in Distributed Generation Systems. In Proceedings of the 2022 IEEE 13th International Symposium on Power Electronics for Distributed Generation Systems (PEDG), Kiel, Germany, 26–29 June 2022; pp. 1–5. [Google Scholar] [CrossRef]
  9. Yuan, L.; Sun, Y.; Liu, Z.; Shao, C.; Liu, B. Influence and Optimization of Low-voltage Distributed Photovoltaic Reactive Power in Active Distribution Network Based on the Power Flow Reverse Point. Shandong Electr. Power 2023, 50, 11–19+41. [Google Scholar] [CrossRef]
  10. Li, S.; Qiao, Y.; Xu, M.; Wu, L.; Lu, Z.; Xian, W. Hierarchical multi-objective safety margin optimization of renewable energy island collecting delivery system by VSC-HVDC. Power Syst. Technol. 2020, 44, 4513–4520. [Google Scholar] [CrossRef]
  11. Xue, L.; Niu, T.; Fang, S.; Chen, J. Master-Slave Cooperative Dynamic Reactive Power Optimization Method Considering Transient Voltage Security of High Proportion of Wind Power. Autom. Electr. Power Syst. 2023, 47, 57–66. [Google Scholar] [CrossRef]
  12. Hong, L.; Wu, M.; Wang, Y.; Shahidehpour, M.; Chen, Z.; Yan, Z. MADRL-Based DSO-Customer Coordinated Bi-Level Volt/VAR Optimization Method for Power Distribution Networks. IEEE Trans. Sustain. Energy 2024, 15, 1834–1846. [Google Scholar] [CrossRef]
  13. Wang, Y.; Zhu, J.; Li, Y.; Hu, J.; Ma, S.; Wang, T. Wang, Study on AC Transient Overvoltage Suppression of LCC-HVDC Sending End System Based on DC Current Control Optimization. In Proceedings of the 2023 8th Asia Conference on Power and Electrical Engineering (ACPEE), Tianjin, China, 14–16 April 2023; pp. 2419–2424. [Google Scholar] [CrossRef]
  14. Yin, C.; Li, F. Analytical expression on transient overvoltage peak value of converter buscaused by DC faults. IEEE Trans. Power Syst. 2021, 36, 2741–2744. [Google Scholar] [CrossRef]
  15. Ibrahim, T.M.S.; De Rubira, T.T.; Del Rosso, A.; Patel, M.; Guggilam, S.; Mohamed, A.A. Alternating Optimization Approach for Voltage-Secure Multi-Period Optimal Reactive Power Dispatch. IEEE Trans. Power Syst. 2022, 37, 3805–3816. [Google Scholar] [CrossRef]
  16. Zhu, K.; Li, L.; Xu, Y.; Zhang, T.; Zhou, L. Multi-Connection Based Scalable Video Streaming in UDNs: A Multi-Agent Multi-Armed Bandit Approach. IEEE Trans. Wirel. Commun. 2022, 21, 1156–1169. [Google Scholar] [CrossRef]
  17. Wu, D. Research on New Energy Development Planning Technology. In Proceedings of the 2024 3rd Asian Conference on Frontiers of Power and Energy (ACFPE), Chengdu, China, 25–27 October 2024; pp. 638–642. [Google Scholar] [CrossRef]
  18. Zhang, Y.; Yin, C.; Li, F.; Han, L.; Liu, J.; Shi, Y. A simultaneous commutation failure assessment method considering reactive powerand voltage characteristics in multi-infeed HVDC systems. Power Syst. Prot. Control 2024, 52, 170–187. [Google Scholar] [CrossRef]
  19. Zhang, Z.; Wang, W.; Yu, X.; Zhou, Y.; Zhang, W. Research on optimization method of new energy grid-connected output of the receiving power grid based on short-circuit ratio constraint. Renew. Energy Resour. 2023, 41, 1658–1664. [Google Scholar] [CrossRef]
  20. Huang, Q.; Cao, S.; Wu, Y.; Lin, X.; Wei, F.; Yang, D.; Cui, T. A New Multi-Infeed Short Circuit Ratio Index Taking into Account the Amplitude and Phase Characteristics of New Energy. Proc. CSEE 2024, 44, 5960–5973. [Google Scholar] [CrossRef]
  21. Dong, X.; Li, G.; Qiao, R.; Liu, S.; Kan, C. Urban Distribution Network Dynamic Reactive Power Optimization Considering Electrical Vehicle Station. Shandong Electr. Power 2024, 51, 1–9. [Google Scholar] [CrossRef]
  22. IEEE Std 1547-2018; IEEE Standard for Interconnection and Interoperability of Distributed Energy Resources with Associated Electric Power Systems Interfaces. IEEE: Piscataway, NJ, USA, 2018; pp. 1–138. [CrossRef]
  23. Rayati, M.; Bozorg, M.; Cherkaou, R.; Carpita, M. Distributionally Robust Chance Constrained Optimization for Providing Flexibility in an Active Distribution Network. IEEE Trans. Smart Grid 2022, 13, 2920–2934. [Google Scholar] [CrossRef]
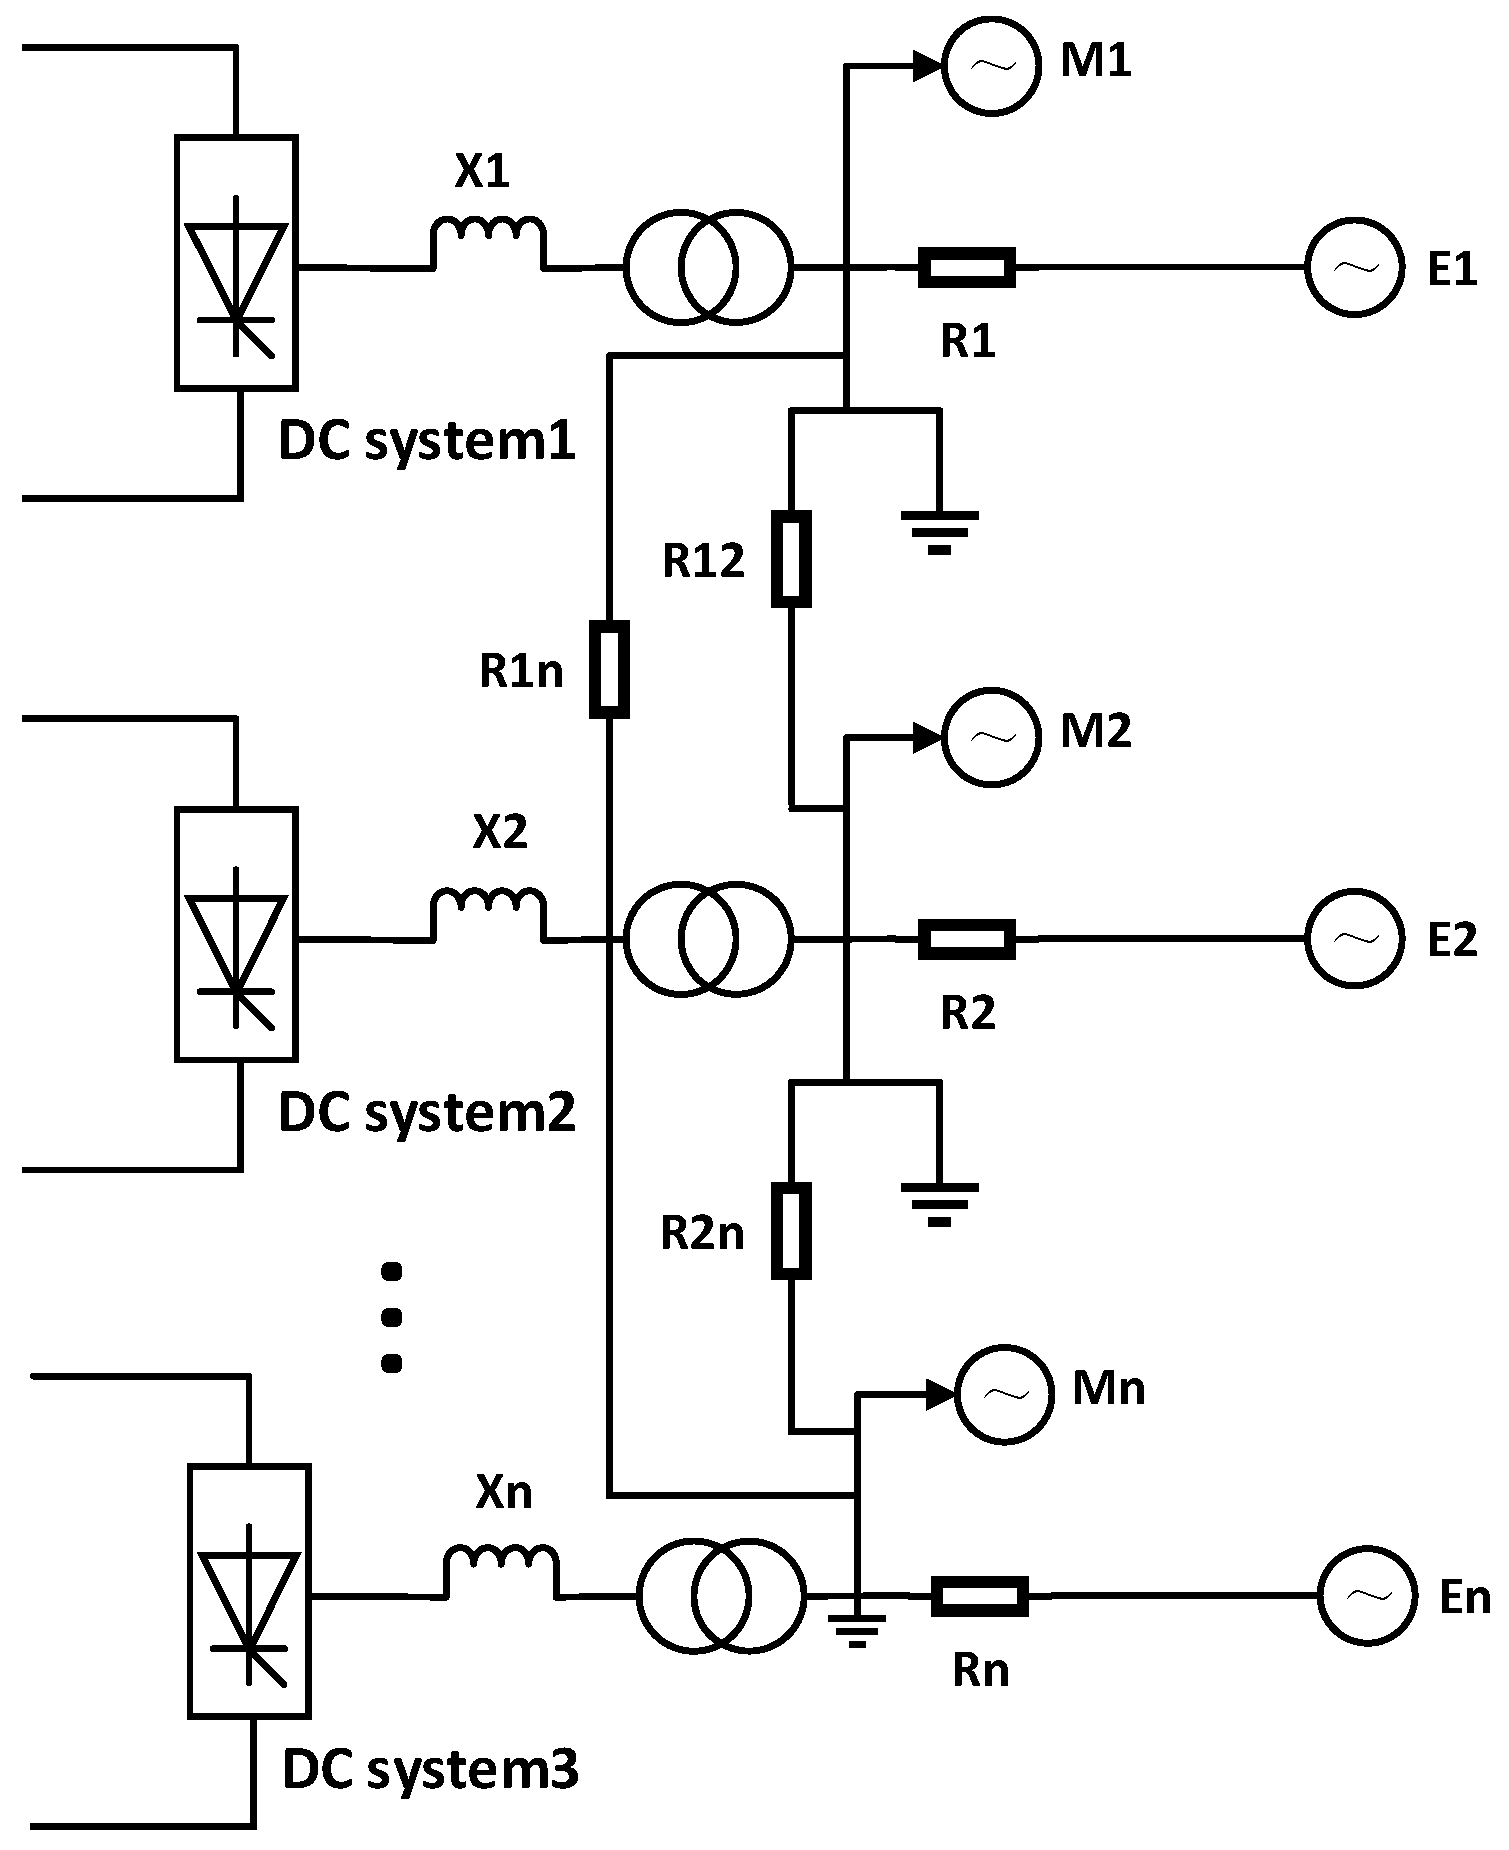
Figure 1. Multi-DC centralized feed system.
Processes 13 02953 g001
Figure 2. Wind power grid connected system.
Processes 13 02953 g002
Figure 3. Flow chart of optimal configuration method of reactive power compensation device.
Processes 13 02953 g003
Figure 4. Improved IEEE 9 bus system structure diagram, G stands for generator, W for wind power, P for photovoltaic, S for dynamic compensation equipment, and orange for direct current.
Processes 13 02953 g004
Figure 5. Improved IEEE 14 bus system structure diagram.
Processes 13 02953 g005
Figure 6. Improved IEEE 39 bus system structure diagram.
Processes 13 02953 g006
Figure 7. Improved Bus 6 voltage of IEEE 9 bus system.
Processes 13 02953 g007
Figure 8. Improved voltage curve comparison of IEEE 9 bus system optimization algorithm.
Processes 13 02953 g008
Figure 9. Improved Bus 6 voltage of IEEE 14 bus system.
Processes 13 02953 g009
Figure 10. Improved voltage curve comparison of IEEE 14 bus system optimization algorithm.
Processes 13 02953 g010
Figure 11. Improved Bus 6 voltage of IEEE 39 bus system.
Processes 13 02953 g011
Figure 12. Improved voltage curve comparison of IEEE 39 bus system optimization algorithm.
Processes 13 02953 g012
Table 1. Improved IEEE 9 bus system circuit ratio.
BusSCRBusSCR
Bus 12.156Bus 91.785
Bus 22.037Bus 102.012
Bus 31.456Bus 111.874
Bus 42.135Bus 121.984
Bus 52.564Bus 132.121
Bus 61.795Bus 142.254
Bus 72.125Bus 152.214
Bus 81.845
Table 2. Improved IEEE 14 bus system circuit ratio.
BusSCRBusSCR
Bus 12.178Bus 92.231
Bus 22.037Bus 102.090
Bus 32.009Bus 112.186
Bus 42.184Bus 122.232
Bus 52.245Bus 132.091
Bus 61.245Bus 142.270
Bus 72.066Bus 152.121
Bus 81.365Bus 162.200
Table 3. Improved IEEE 39 bus system circuit ratio.
BusSCRBusSCRBusSCR
Bus 12.178Bus 162.207Bus 312.027
Bus 22.037Bus 172.195Bus 322.024
Bus 32.009Bus 182.293Bus 332.193
Bus 42.184Bus 192.169Bus 342.192
Bus 52.245Bus 202.189Bus 352.290
Bus 62.006Bus 212.074Bus 362.140
Bus 72.066Bus 222.043Bus 372.111
Bus 82.063Bus 232.231Bus 381.432
Bus 92.219Bus 242.090Bus 391.356
Bus 102.056Bus 252.186Bus 402.048
Bus 112.126Bus 262.232Bus 411.982
Bus 122.132Bus 272.091Bus 422.079
Bus 132.298Bus 282.270Bus 432.145
Bus 142.236Bus 292.121
Bus 152.122Bus 302.200
Table 4. Improved IEEE 9 bus system average electrical distance between pre-selected installation positions.
BusInitial Value
Bus 10.1548
Bus 20.1546
Bus 30.412
Table 5. Improved IEEE 14 bus system average electrical distance between pre-selected installation positions.
BusInitial Value
Bus 10.1542
Bus 20.1246
Bus 30.1620
Table 6. Improved IEEE 39 bus system average electrical distance between pre-selected installation positions.
BusInitial Value
Bus 10.1330
Bus 20.1387
Bus 30.2820
Disclaimer/Publisher’s Note: The statements, opinions and data contained in all publications are solely those of the individual author(s) and contributor(s) and not of MDPI and/or the editor(s). MDPI and/or the editor(s) disclaim responsibility for any injury to people or property resulting from any ideas, methods, instructions or products referred to in the content.