Article

Superstructure Optimization Based on Hierarchical Accelerated Branch and Bound Algorithm and Its Application in Feedstock Scheduling

College of Automation (College of Artificial Intelligence), Control Science and Engineering, Shahe Campus, Beijing Information Science and Technology University, No. 55 Taihang Road, Changping District, Beijing 102206, China
*
Author to whom correspondence should be addressed.
Processes 2025, 13(9), 2936; https://doi.org/10.3390/pr13092936
Submission received: 16 August 2025 / Revised: 8 September 2025 / Accepted: 11 September 2025 / Published: 15 September 2025

Abstract

As modern petrochemical systems tend towards larger scales, process structures become more complex and highly integrated. The interaction and overall complexity between the operations of each unit are constantly increasing, and the solution process is becoming increasingly complex. The superstructure generated by P-graph theory can reduce the generation of redundant structures, and the accelerated branch and bound algorithm can efficiently explore a vast solution space. However, this algorithm can only solve single-objective optimization problems. This article mainly focuses on the multi-objective optimization problem of the chemical process flow, with reduced production costs and the mitigation of environmental pollution being the main considerations. A novel algorithm framework based on an improved accelerated branch and bound method and incorporating the core idea of Analytic Hierarchy Process (AHP) was proposed, aiming to improve the high computational cost of traditional methods and solve the problem of high modeling costs in multi-objective optimization. The feedstock scheduling of ethylene is used to verify the effectiveness and superiority of the proposed method, with low-cost and carbon emission solutions being easily selected. This article provides a reference for the study of superstructures in chemical production processes. The experimental results show that with a small increase in energy consumption costs, the optimal solution obtained by our algorithm can reduce carbon emissions by 1.27% compared to the original solution, and reduce 2/3 of the modeling workload.

1. Introduction

As an important component of the global economy, the chemical industry not only provides a large amount of production materials and employment opportunities for society, but also plays an irreplaceable role in promoting technological progress and social development. However, while the chemical industry brings economic benefits, it is also one of the main industrial sources of greenhouse gas emissions [1]. With the increasing global emphasis on environmental protection and sustainable development, the chemical industry is facing enormous pressure to reduce carbon emissions, reduce energy consumption, and improve resource utilization efficiency. Modern chemical production processes are usually very complex, involving numerous unit operations and material flows. The complexity of the process makes optimization of the production process particularly important. In order to achieve low-carbon production, low consumption, and efficient transformation in the chemical industry, the optimization of chemical process flows is necessary [2]. For example, thermal integration is actually designed to achieve energy-saving effects in chemical processes [3,4]. Therefore, modeling, analyzing, and optimizing chemical processes through scientific methods while ensuring process safety and product quality has become a hot and difficult issue in the current field of chemical engineering research.
An important component of process system synthesis is process network synthesis (PNS) [5]. Process network synthesis is very important in dealing with optimal decision-making problems and n-best problem [6]. Ali et al. used a combination of process network synthesis and machine learning as a decision-making tool for urban solid waste management [7]. The process system synthesis methods in process system synthesis include intuitive inference, hierarchical decomposition, mathematical programming, and pinch analysis [8,9]. And in addition to the above methods, Daoutidis et al. explored the integration of machine learning in PNS and focused on applications such as agent modeling, process optimization, and design space exploration [10]. However, the optimization of the hierarchical decomposition factor system sequence in the hierarchical decomposition method may miss the global optimal solution. Intuitive inference and pinch analysis methods cannot achieve trade-offs between subsystems at different levels. Therefore, achieving the global optimum of process system synthesis is very difficult. At the same time, the interpretability of solutions using artificial intelligence and machine learning methods is relatively poor. The commonly used method in process synthesis is mathematical programming, which is mainly based on mathematical optimization models for system synthesis. Compared to the above methods, mathematical models representing multi-level influencing factors in a system can obtain the global optimal design and have a certain degree of interpretability.
However, as process networks become increasingly complex, the complexity of corresponding mathematical models also increases. Subsequently, several problems arise, including an increase in the number of redundant structures in the superstructure, a nonlinear increase in the model, and long development cycles for models, etc. Friedler et al. introduced a special directed binary graph called a Progress graph (P-graph) to solve the previous problem, which can achieve better trade-offs between subsystems at different levels [11]. P-graph simplifies the decision-making process, improves the efficiency and effectiveness of strategy formulation, and has become an important research direction in the field of process systems engineering [12,13,14,15]. Aviso et al. fuzzified the drought level and applied the fuzzy P-graph method to solve the problem of seeking the optimal operational adjustment solution in wind energy systems under drought conditions [16]. Pimentel et al. set the goal of maximizing the value of the industry chain and studied whether the price of sugarcane was stable by targeting lactic acid as the main product in their research. By simulating the parameters of various operating units, a research model was ultimately integrated using the P-graph theory [17]. P-graph is becoming increasingly popular in addressing sustainability and green development issues [18,19]. At the same time as the final production cost, considerable economic benefits were achieved. Bertok et al. applied the P-graph method to seek the optimal process design network for producing ethanol and acetone from grains [20]. The Branch and Bound (BB) algorithm in the P-graph framework obtains the solution space by analyzing the problem. Then, the feasible solutions in the solution space are partially enumerated, and finally a series of optimal feasible solutions are obtained [21]. The Mixed-Integer Nonlinear Programming (MINLP) model is commonly used to describe strict superstructure models that include both integer and continuous variables. The ABB (Accelerated Branch and Bound) algorithm utilizes the BB algorithm to solve mixed-integer nonlinear programming models, establishing search trees and new custom boundaries at each node to remove uninteresting regions and reduce the decision space [22]. Additionally, the ABB algorithm can simultaneously obtain optimal and suboptimal solutions when solving problems. The current optimization problems in chemical processes face challenges such as multi-objectivity and high complexity. However, traditional methods are not particularly effective in solving these problems. We consider combining AHP and ABB algorithms to solve these problems.
The Analytic Hierarchy Process (AHP) is also widely used in the analysis of the chemical industry. Bakhtari et al. used the hierarchical relationship between the challenges of Industry 4.0 development as a standard, analyzed their interactions and main obstacles, and focused their attention on achieving solutions [23]. Ba et al. conducted a scoring analysis of pipelines using the Analytic Hierarchy Process [24]. In order to solve multi-objective optimization problems, multiple modeling of the superstructure model is required when applying the ABB algorithm [25]. As a multi-criteria decision-making method, AHP can effectively guide and quantify subjective judgments, playing an important role in multi-objective decision-making [26]. This article combines the accelerated branch and bound algorithm with the analytic hierarchy process to solve optimization problems in chemical processes, in order to avoid redundant modeling and simplify the algorithm flow. This combination has to some extent solved the challenges faced by today’s industrial systems, such as high integration, strong complexity, and multiple influencing variables. This is especially for the numerous redundant structural challenges and multi-objective optimization problems that exist in the production process.
Based on the above characteristics of the ABB and AHP algorithms, we plan to combine the two algorithms to achieve more efficient and accurate multi-objective optimization results in highly complex chemical processes. The process optimization problem solved under our proposed new algorithm framework not only saves modeling costs, but also fully considers the objectives of multi-objective optimization.
The remainder of this paper is organized as follows. Section 2 describes the proposed methodology. The experiment data, results and analysis are presented in Section 3. Finally, Section 4 summarizes the conclusions of this paper.

2. Materials and Methods

2.1. P-Graph Theory

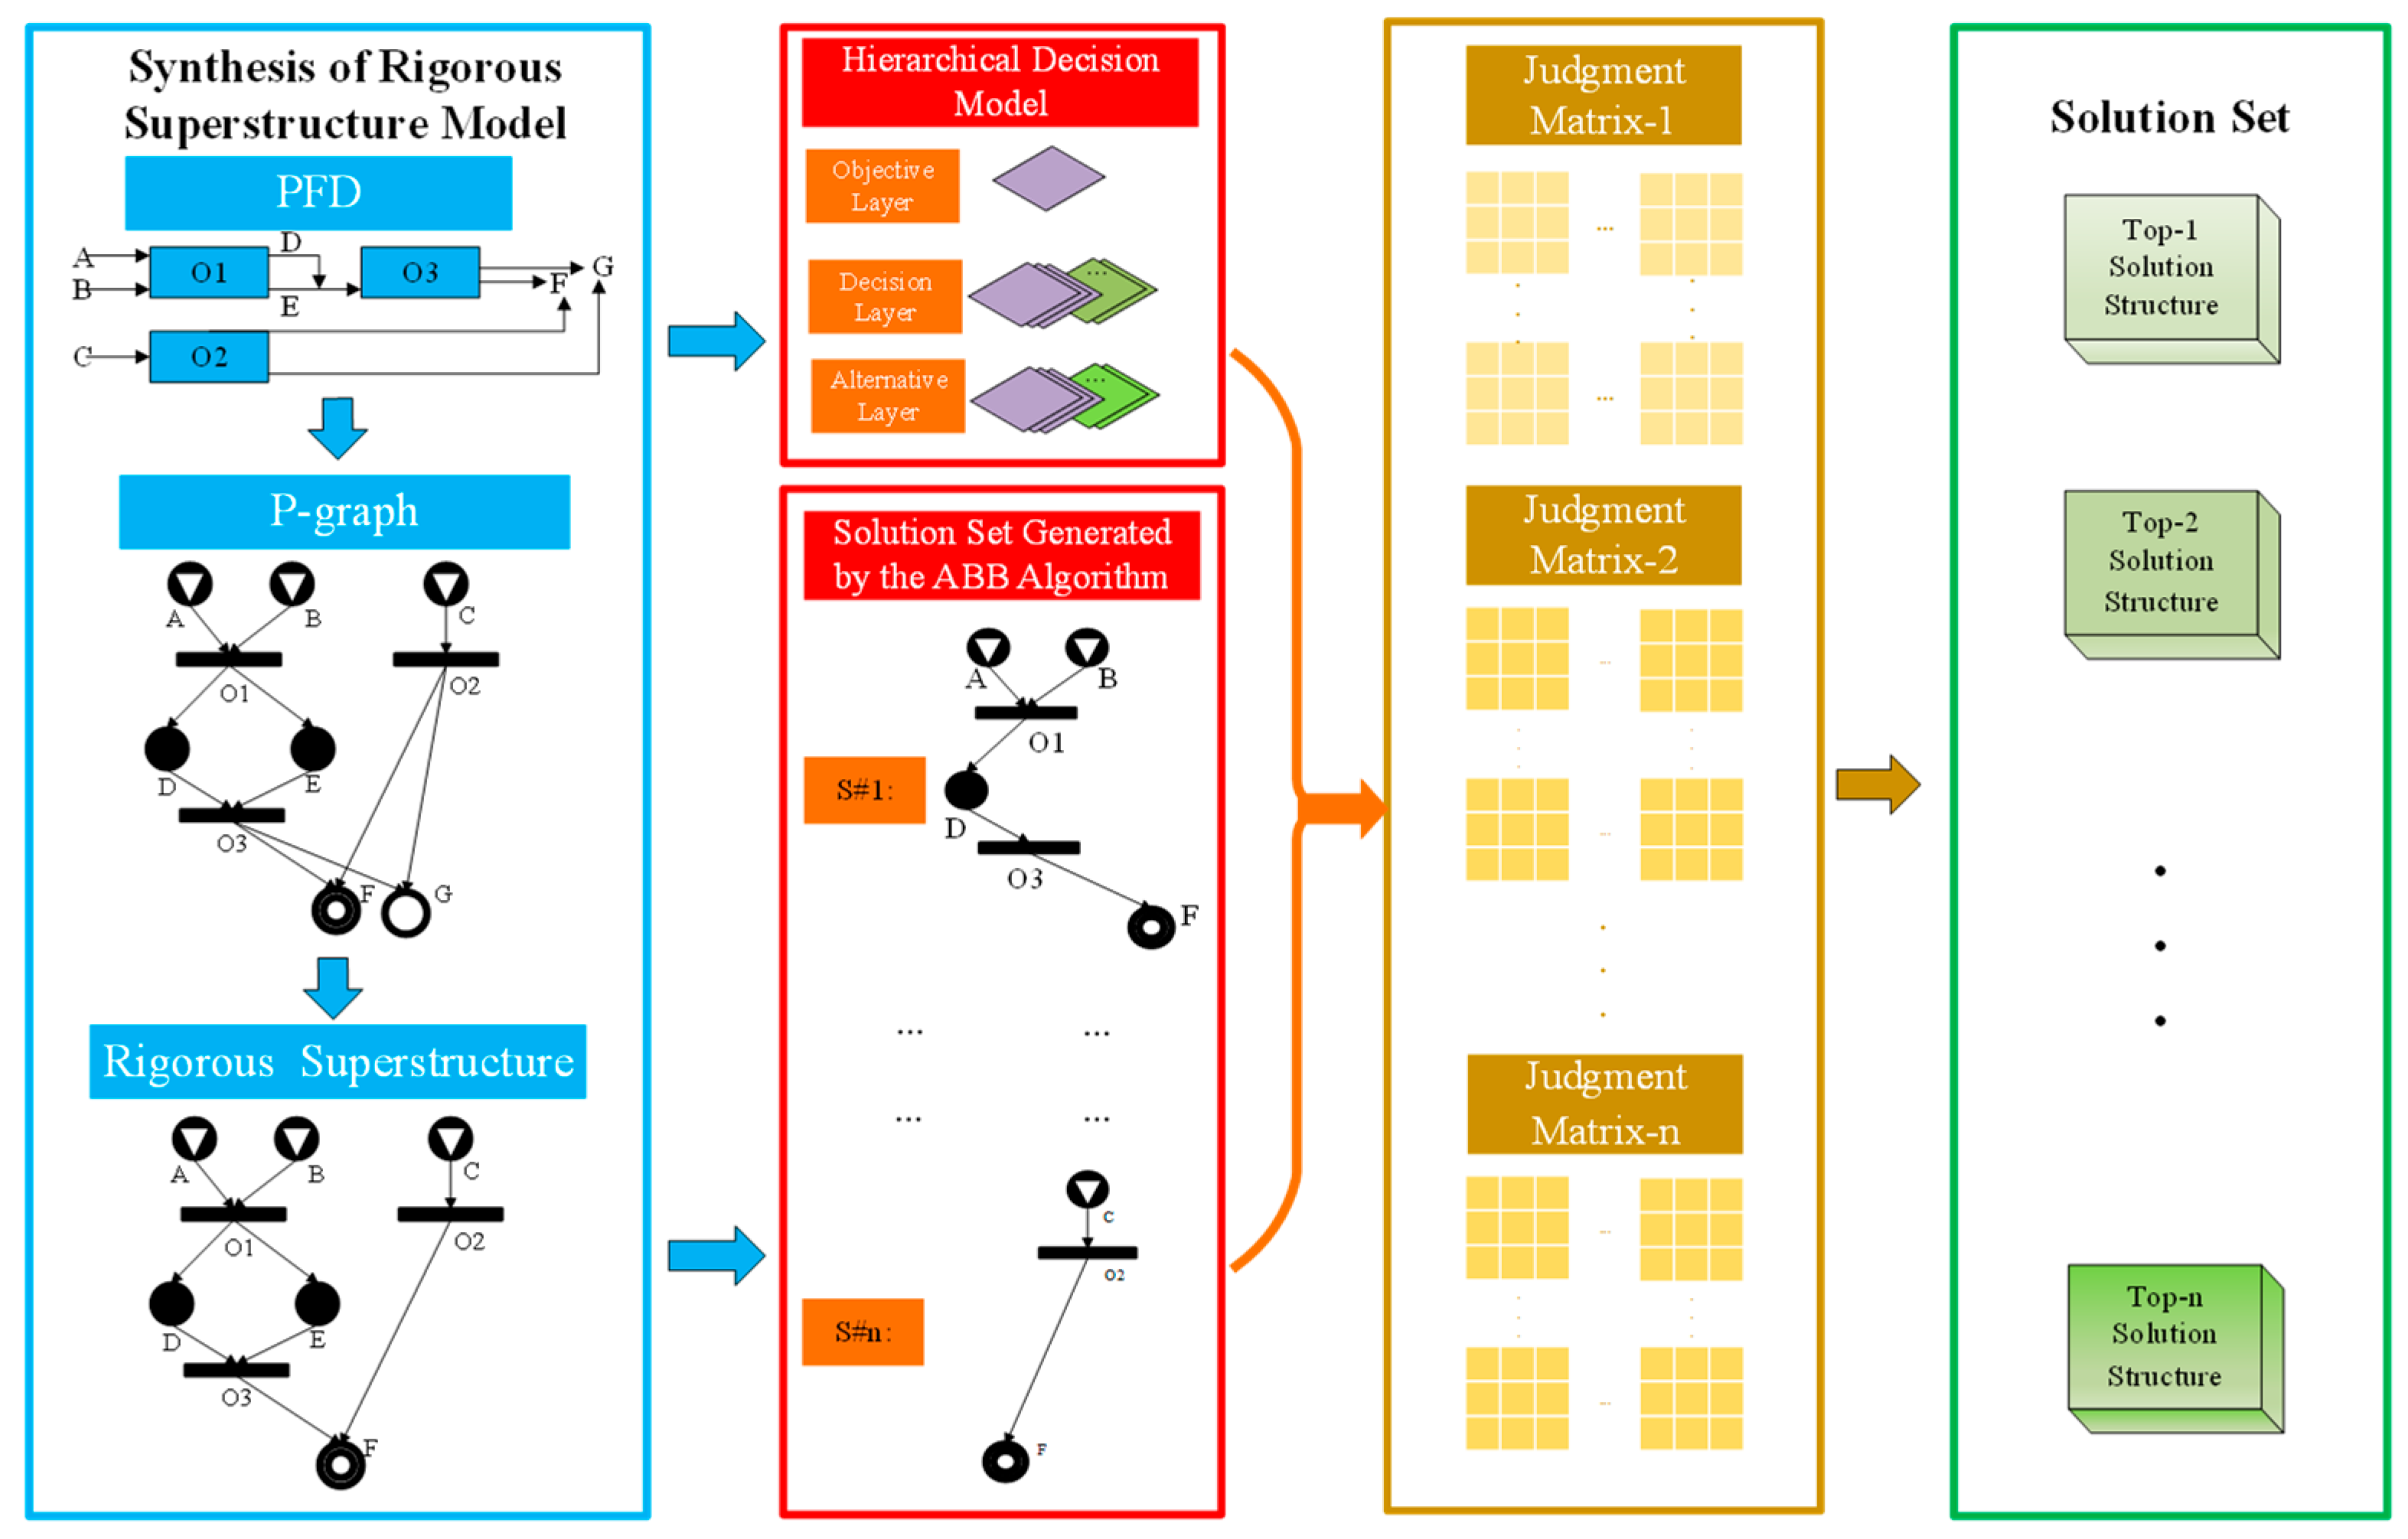
The basic idea of the superstructure model is to decompose a large system into multiple subsystems or components, and accurately describe the interactions between these components. A component can be a physical component, functional unit, individual, or any other distinguishable entity. Superstructure models typically use graph theory to describe the structure and connectivity relationships of a system. The graphical representation can intuitively understand the structure and behavior of the system, and can also apply methods from graph theory to analyze and interpret the model. P-graph is a special type of directed graph used to represent and solve combinatorial optimization problems in process synthesis [27,28]. P-graph consists of nodes and directed edges, where nodes represent process units such as reactors, separation towers, etc. Among them, directed edges represent the flow of materials, and directed edges are the flow paths of materials. The node pointing to another node represents the flow of materials from one process unit to another. All nodes in the P-graph must be connected to ensure that materials can flow from one process unit to another, and each process unit in the P-graph can only appear once. P-graph theory can represent all possible networks and provide information on their structural feasibility for relevant case studies [29,30,31]. The P-Graph Studio software (http://p-graph.org, Version: 5.2.5.0, vendor: University of Pannonia, Veszprém, Hungary) for P-graph applications is already a mature and widely used model building platform that enables researchers to apply P-graphs. The superstructure is transformed into a P-graph by constructing a process flow diagram (PFD), as shown in Figure 1.
P-graph theory defines four sets, namely P (Product), M (Material), R (Raw material), and O (Operating Unit). P represents the product that needs to be obtained; R represents the raw materials required for the production of the product; M represents the intermediate products obtained in the production process of the product and O represents the operating unit in the production process. The Superstructure in Figure 1 is very intuitive, where A, B, and C are the raw materials or some initial state for producing product F. D and E are intermediate products or intermediate states in the production process. O1, O2, O3, O4 are operating units in the production process, which can represent equipment or heating, cooling, and other operations. In order to solve the problem of structural redundancy in practical engineering, Friedler et al. added 5 axioms on the basis of P-graph representation; the following 5 axioms greatly reduce the solution space of P-graph methods [32]:
(1)
The topological network of the structure must include every element in the product set P;
(2)
If a material is in the output set of the operating unit, then this material cannot be in the raw material set;
(3)
All operating units in the topology structure of the process network need to be explained;
(4)
Any element in the operating unit and product set must have at least one path connected;
(5)
Material must be interconnected with at least one operating unit.
In addition, P-graph theory also integrates algorithms such as MSG (Maximum Structure Generation), SSG (Solution Structure Generation), and ABB. The solving of the process synthesis problem based on P-graph theory has become more convenient. This paper applies the P-graph theory to the feedstock scheduling of ethylene production. The material content produced is virtually represented as the operating unit of the superstructure model. The framework also provides a reference for other optimization problems in chemical processes, and when solving such problems, virtual data can be added to P-graph modeling.

2.2. Accelerated Branch and Bound

The ABB algorithm is a process optimization method that improves the branch and bound (BB) deterministic algorithm. This algorithm uses the BB algorithm to solve the MINLP problem, without deviating from the maximum structure generated by MSG. The ABB will automatically arrange the optimization process structure. The ABB algorithm has significant differences from traditional branch and bound methods. The general BB algorithm is ineffective in solving mixed-integer programming models for synthesis problems. This is because the BB algorithm generates too many free variables and does not fully utilize the structural characteristics of the process system. For the process synthesis problem of superstructure optimization, with the help of strict superstructures, the ABB algorithm wisely utilizes the structural characteristics of process synthesis and does not contain any redundant process structures. The steps of the ABB algorithm are as follows:
(1)
Set the root node as the initial structural space and initialize the current optimal solution to infinity.
(2)
Calculate the objective function value for each possible structure and determine the objective function value for each structure based on the objective function.
(3)
Compare the objective function values of each structure and update the current optimal solution to the structure with the minimum objective function value.
(4)
Perform branching operations on the structural space based on the current optimal solution. Calculate the objective function value for the branched structure and define it accordingly.
(5)
If the objective function value of a branch has exceeded the current optimal solution, the branch can be pruned. If a better structure is found, update the current optimal solution.
(6)
Repeat the steps of (2–5) until the termination condition is reached.
The key steps of the ABB algorithm are to effectively reduce the search space through branching and boundary operations, thereby accelerating the process of finding the optimal solution. Meanwhile, the continuous updating of the current optimal solution helps to discover better structures in a timely manner, and the efficiency and accuracy of the algorithm are also improved [33]. Researchers have confirmed that the ABB exhibits an accelerated solving effect when searching for the optimal solution or top-n optimal solutions, making the solution faster and the results more accurate [34]. This work optimized the ABB algorithm during the pruning process in the P-graph framework, and the AHP score was used as one of the pruning conditions to improve the efficiency of the ABB algorithm.

2.3. Analytic Hierarchy Process

AHP is a method mainly used for solving complex decision-making problems. The establishment of the AHP algorithm aims to decompose problems, construct hierarchical structures, and compare elements at each level pairwise to ultimately determine the priority ranking of decisions. This algorithm is a multi-index comprehensive evaluation algorithm that can be used as a quantitative scheme for indicator weighting selection or to assign weights to indicators. When individuals make decisions, their subjective emphasis on certain factors is inconsistent. The AHP algorithm can assign weights to these indicators without the need to collect data. In order to achieve better results, it is important to pay attention to the key steps when using the AHP algorithm for decision calculations. For example, after the construction of the hierarchical evaluation model, expert scoring is required for the indicators of the criterion layer. The specific requirements for expert scoring are shown in Table 1.
The scoring in the above table adopts the 1–9 scale method proposed by American operations researcher Thomas L. Saaty [35]. Based on the above content, we can construct the criterion layer matrix A, as represented by Equation (1) (where m = n); the criterion layer matrix needs to satisfy Equation (2) (where im; jn; i and j are positive integers):
A = a 11 a 1 n a m 1 a m n
a ij = Z a ij = 1 a ji a ii = 1
After establishing the criterion layer matrix, hierarchical single sorting is required. Hierarchical single sorting refers to comparing all elements in the current layer pairwise against a certain element in the previous layer and performing hierarchical sorting. The calculation can be based on the judgment matrix A, and the eigenvalues and eigenvectors that satisfy AW = λmaxW need to be guaranteed. The maximum eigenvalue of A is λmax, and the normalized eigenvector corresponding to λmax is W, where Wi is the component of W. The judgment matrix is used to calculate the weights of each factor aij on the target layer. The calculation steps of the weight vector W and the maximum feature λmax are shown in Equations (3)–(5), where Equation (4) normalizes Wi and the maximum eigenvalue of the judgment matrix is obtained through Equation (5).
W i ¯ = j = 1 n a ij n i , j = 1 , 2 , , n
W i = W i ¯ i = 1 n W i ¯
λ max = 1 n i = 1 n ( AW ) i W i
The maximum eigenvalue and C.I. can be obtained through the following Formulas (6)–(8), where C.I. is the consistency ratio. In the AHP algorithm, C.I. can measure the consistency of each element in the judgment matrix. The median random consistency index R.I. in the following formula is generally taken from a table. C.R. is used to determine whether the obtained hierarchical ranking weights are correct. When C.R. < 0.1, the calculated hierarchical ranking weights are considered correct and reasonable.
C . I . = λ max n n 1
C . R . = C . I . R . I .
BW = λ W
If B is an n-order judgment matrix, its maximum eigenvalue λmax can be obtained from Equation (8). W is the eigenvector of B, and C.I. can be used to verify the consistency of the judgment matrix A. The random consistency index R.I. value can be obtained from simulating 1000 experiments as shown in Table 2; the matrix order is also the order of the criterion layer.
The C.R. can be calculated based on the data in Table 2 and Formulas (7) and (8); then, a judgement can be made. When C.R. < 0.1, it indicates that the consistency of the judgment matrix A is considered to be within an acceptable range, and the eigenvectors of A can be used to calculate the weight vector. If C.R. ≥ 0.1, the judgment matrix A should be adjusted. This work successfully solves the multi-objective optimization problem of ethylene production using the AHP algorithm, and this framework also provides a new approach for multi-objective optimization problems in chemical processes.

3. Methodology and Case Study

3.1. Methodology

The methodology of the hierarchical accelerated branch and bound algorithm is the combination of P-graph and AHP. Roco et al. proposed that the sustainable energy network in the Philippines is generated by the combination of the AHP method and P-graph theory [36]. For a large number of indicators, the superstructure network obtains relative weights through the AHP method and integrates them into a P-graph to evaluate sustainability scores. The AHP method indicates that the most important criterion among the interviewed experts is whether the energy can be self-sufficient. The integrated P-graph and AHP simulation indicate that the optimal and near optimal solution relies on geothermal and hydroelectric energy sources, while retaining other energy sources to meet non-electricity demands. The experiment shows that the optimal energy network generated by combining AHP and P-graph reduces the principal electricity cost expenditure. Estrella et al. cited AHP and P-graph in the cement manufacturing industry [37]. Due to the emission of large amounts of greenhouse gases during the cement manufacturing process, researchers considered limiting carbon emissions by optimizing processes and using alternatives to fossil-derived fuels. The proposed method based on P-graph and Analytic Hierarchy Process (AHP) was constructed to assist in planning the post-CCT retrofitting of cement plants in the total control and trading environment using the Emissions Trading Scheme (ETS). Finally, three alternative post combustion technologies were considered, namely monoethanolamine (MEA) absorption technology, the chilled ammonia process (CAP), and membrane-assisted liquefaction (MEM). The results indicate that under certain conditions, the CAP method is the most effective in helping companies reduce greenhouse gas emissions while saving energy consumption and costs.
The above two cases demonstrate that the combination of the AHP algorithm and P-graph theory can achieve very good results in the field of chemical engineering. This article tightly combines the AHP algorithm with the ABB algorithm under strict superstructure to achieve the goal of solving optimization problems. Figure 2 is the algorithm flowchart used in this study.
In Figure 2, the key step is to use AHP expert scoring to pre-score feasible solutions, and Top-K solutions are selected as the initial boundary to accelerate pruning. Specifically, when pruning using the ABB algorithm, there are two pruning conditions: 1. Pruning when the quantitative target exceeds the cost boundary. 2. The AHP comprehensive score exceeds the tolerance threshold (integrating qualitative objectives), which further improves the efficiency of the ABB algorithm. In Figure 2, it can also be clearly seen that utilizing the characteristics of AHP enables the method proposed in this paper to better solve multi-objective decision-making problems.
When modeling, environmental indicators can be added and then the ABB algorithm can be used to find the optimal and suboptimal solutions. However, the particularity of the ABB algorithm should be taken into account. In the optimization process, only a simple weighting can be applied to the environmental and energy consumption indicators, resulting in solutions that are not as accurate as those obtained by expert scoring. Secondly, environmental indicators are not our main focus, and if the ABB algorithm is used to optimize the solution, secondary modeling is required. At this point, the optimization problem becomes more complex and unnecessary.
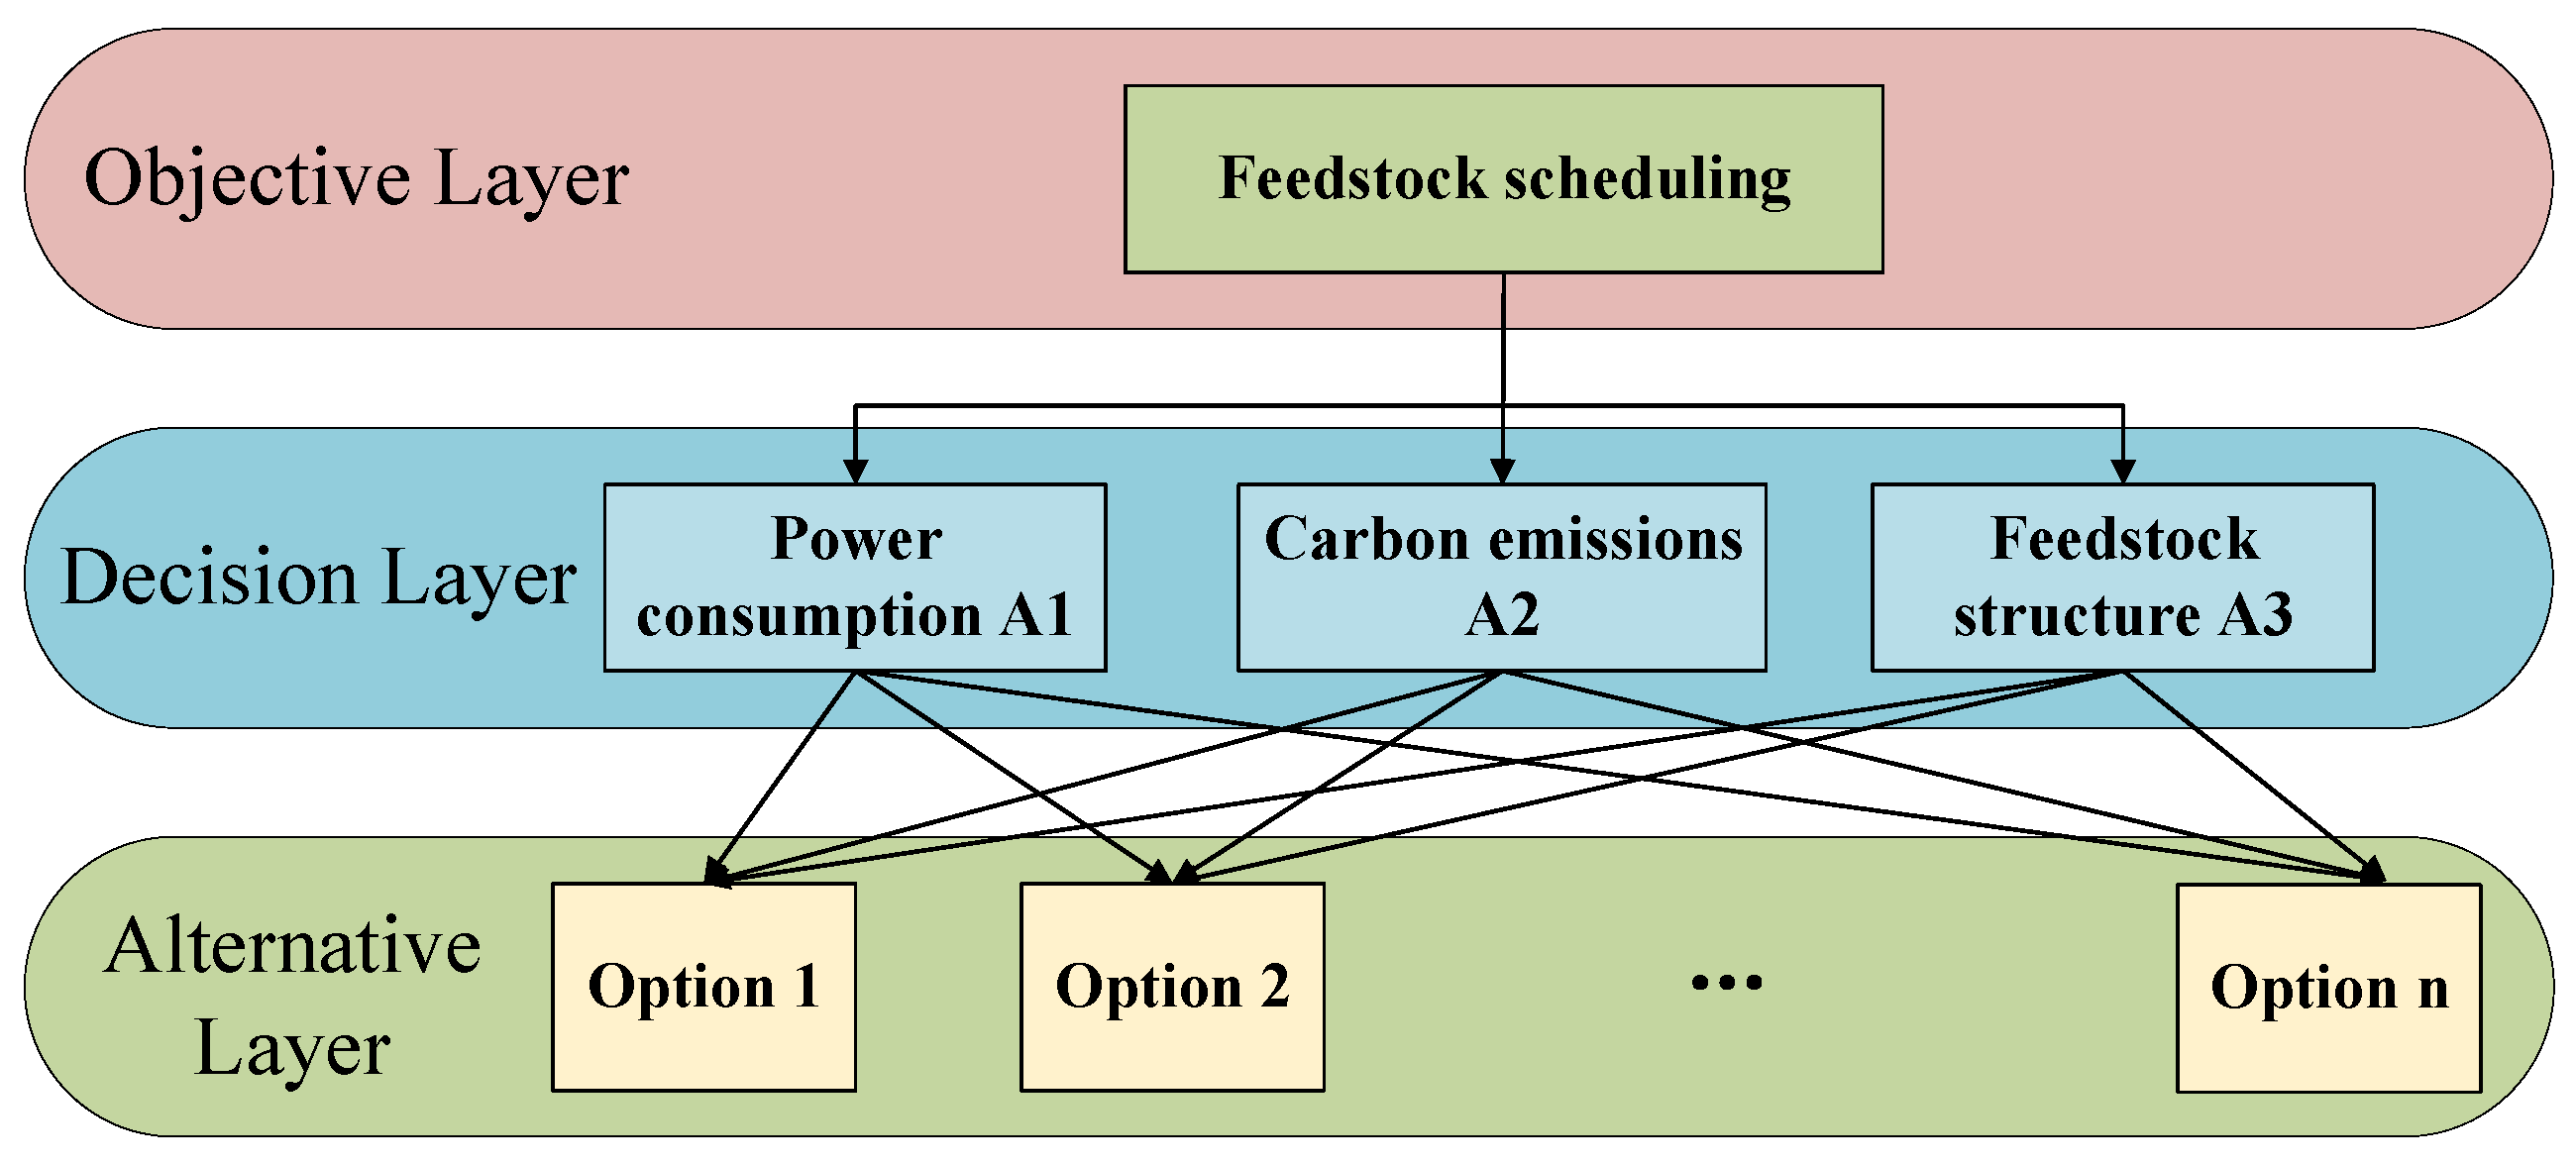
However, in actual production, more factors need to be considered. For example, ethylene is an important chemical in the country, with an annual production growth rate of 6.2%. The large amount of carbon dioxide emissions generated from its production seems unreasonable, so carbon emission indicators should be considered when optimizing the scheduling of ethylene production. In the process of optimizing the superstructure model, energy consumption costs, model structure, and carbon emission indicators should be considered. A hierarchical analysis structure can be established as shown in Figure 3. Based on the above discussion, the feedstock scheduling of ethylene production has become ensuring less energy consumption, lower carbon emissions, and a better raw material structure under quantitative ethylene production.

3.2. Case Study

Ethylene has been widely used in the chemical industry and is a fundamental component of the petrochemical industry [38]. The case study considers the optimal feedstock scheduling problem for ethylene production. There are four main raw materials: C3C4C5 (C5), hydrogenated tail oil (HCR), light diesel oil (light), and naphtha (NAP). Due to the differences in production efficiency and energy consumption among each plant in ethylene production, it is necessary to analyze feedstock scheduling based on actual needs. In order to produce as much ethylene as possible, a reasonable solution method and scientific feedstock scheduling model need to be constructed [39,40,41]. Assuming that plants A and B have different production processes, in order to reduce energy consumption, the feedstock of plants A and B will also be different. All of these factors need to be considered when establishing a superstructure model. The specific parameters for modeling this case are shown in Table 3.
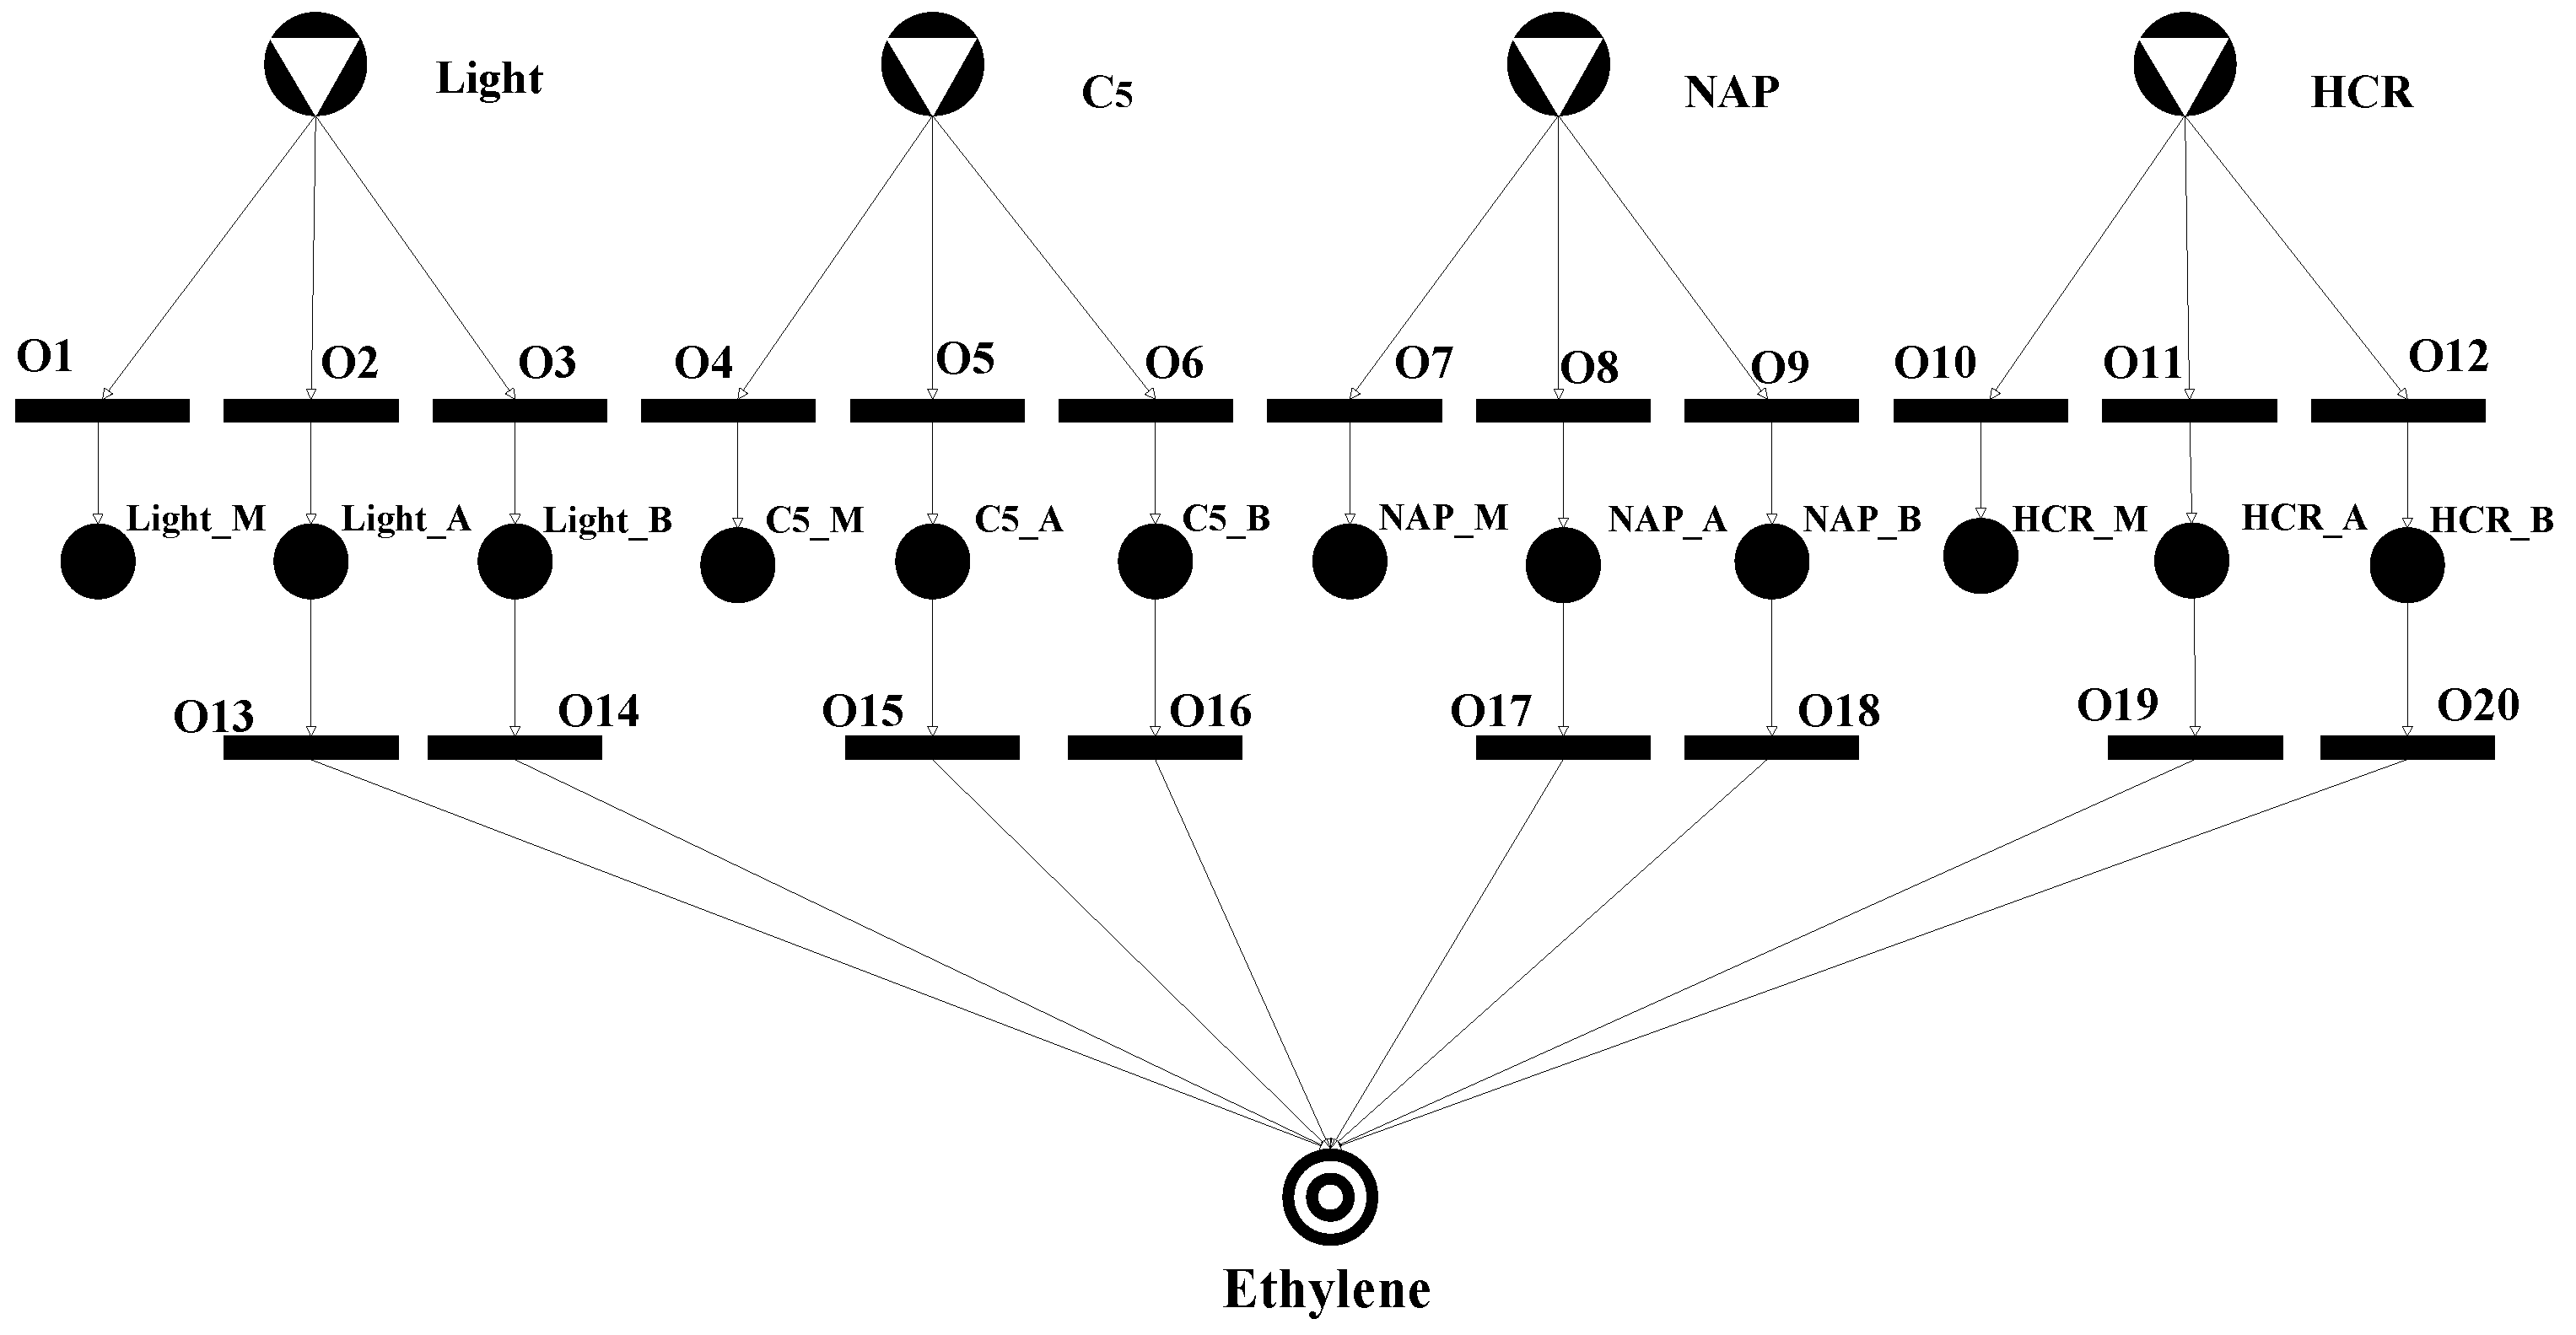
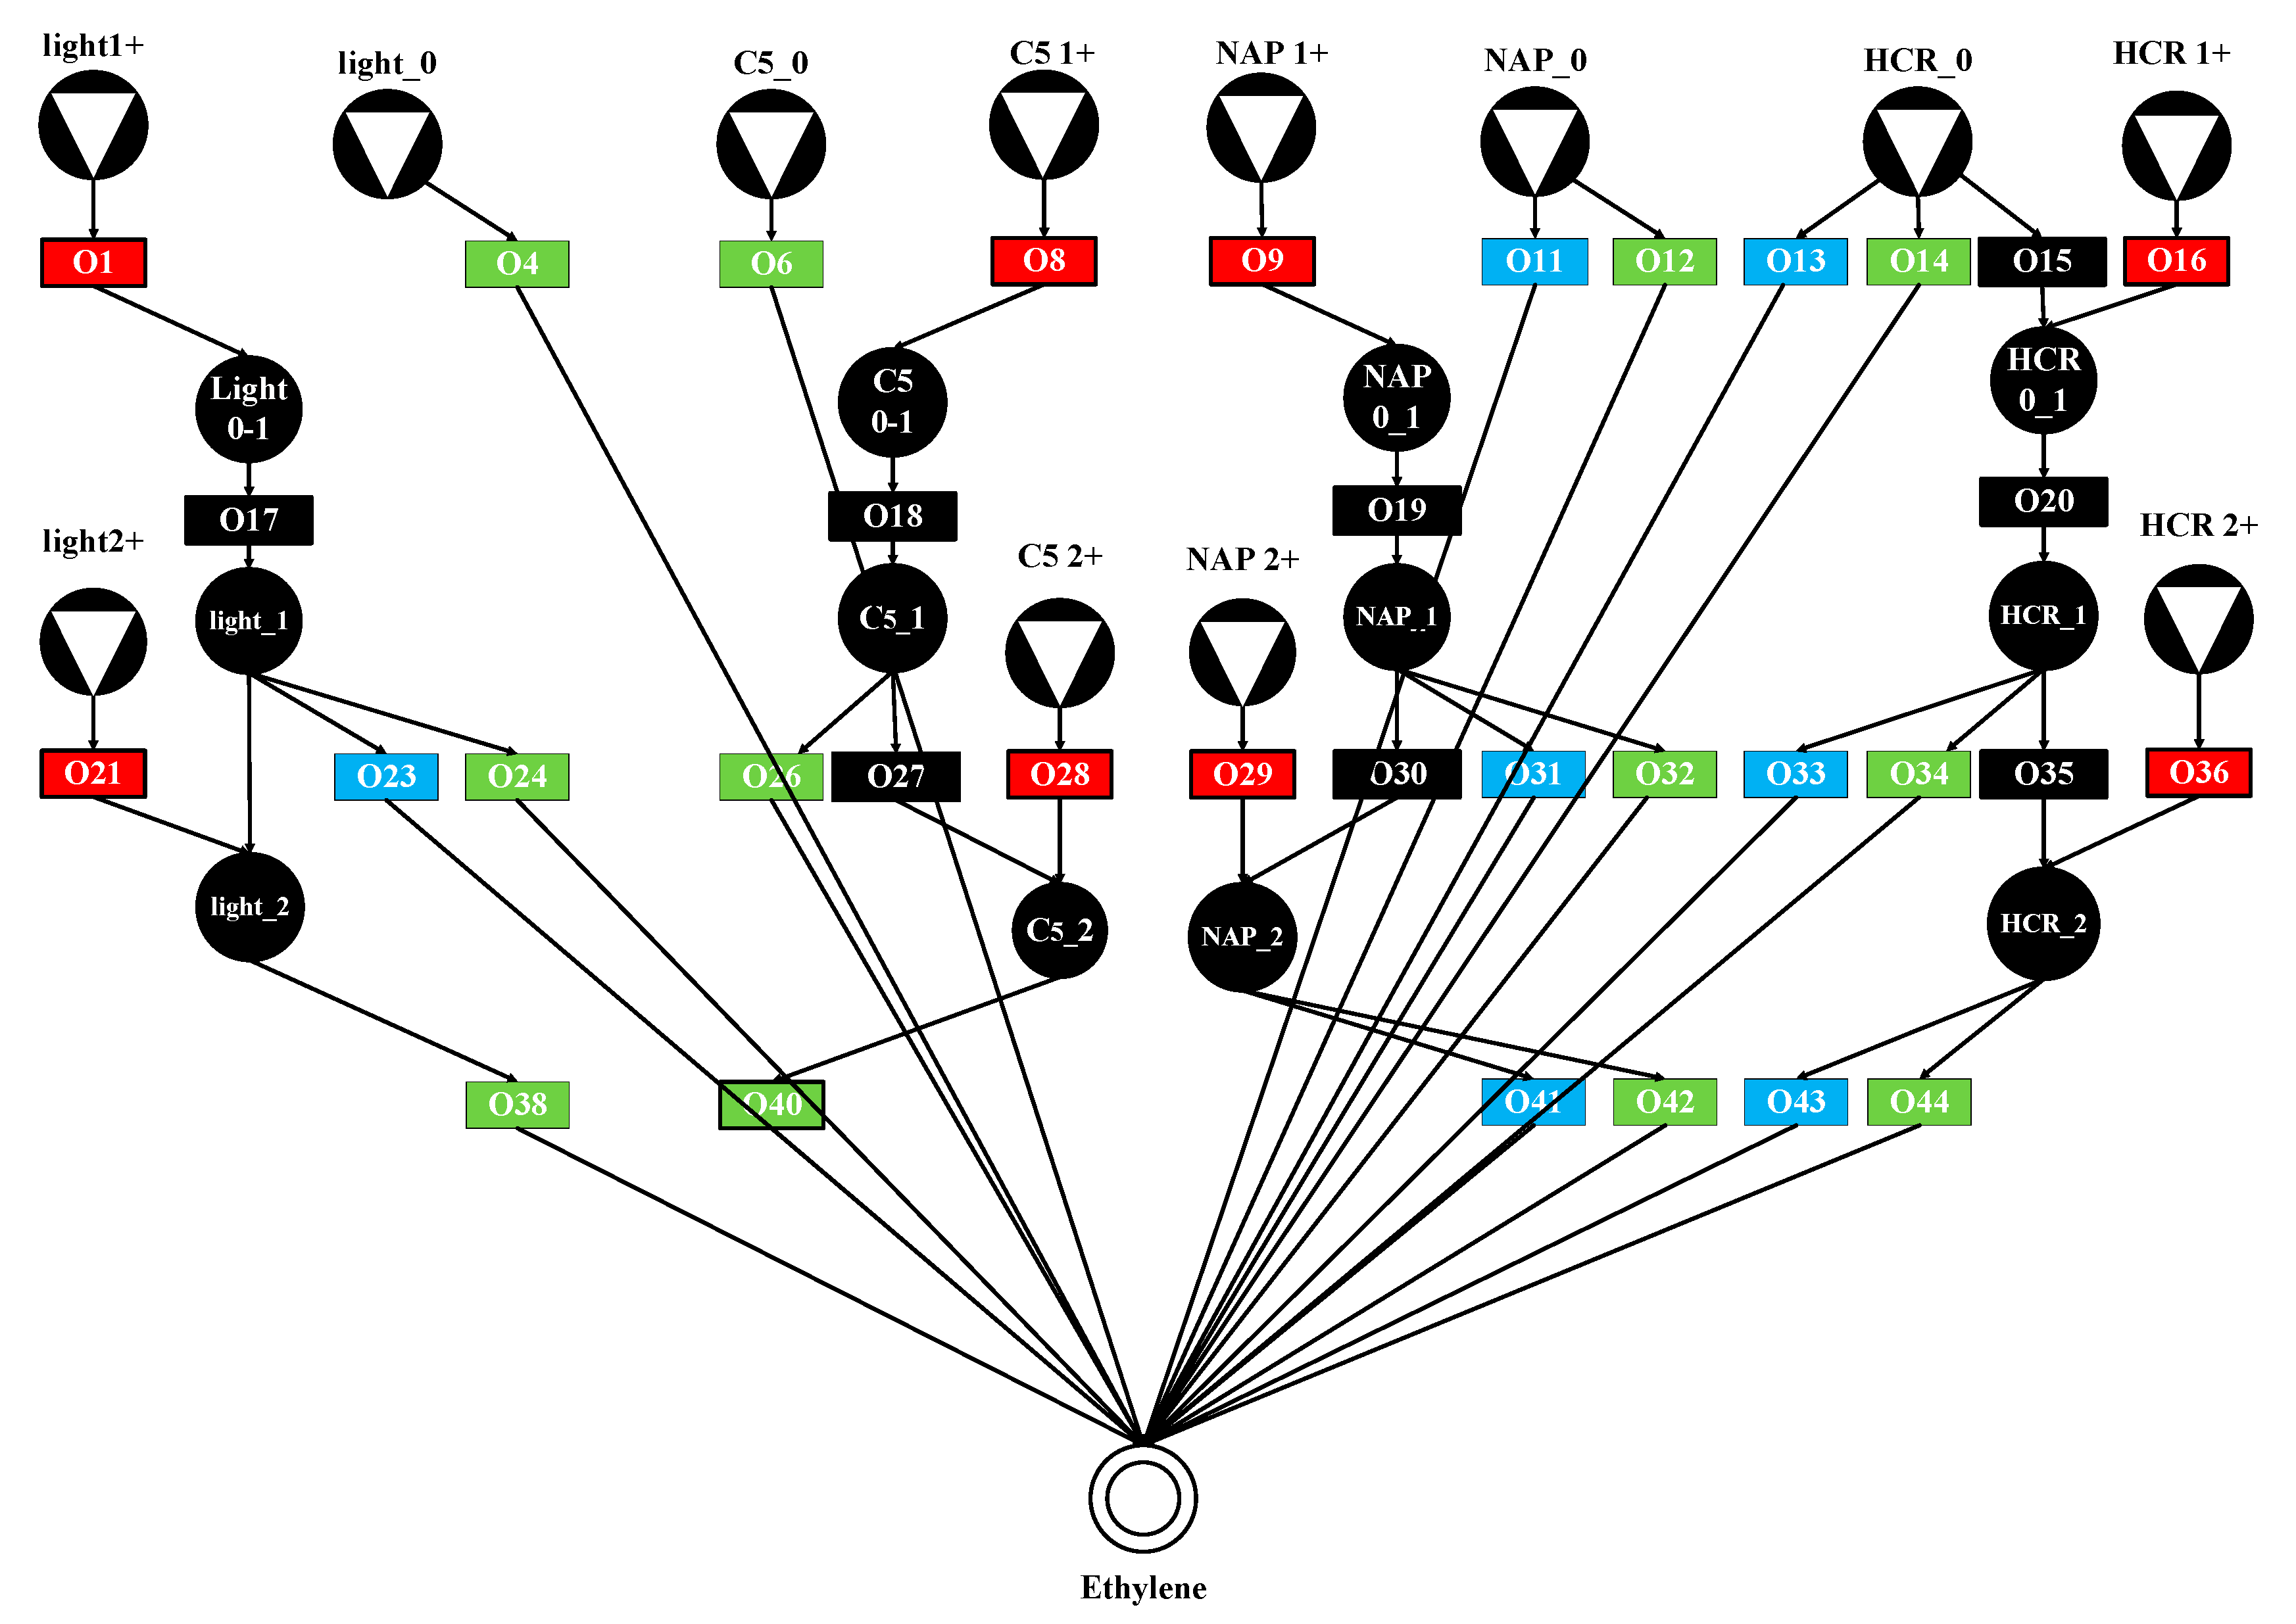
From Table 3, it can be seen that we have identified the allocation of raw materials to plants A and B differently. The strict superstructure model generated by the parameters in Table 3 and P-graph theory is shown in Figure 4. This model consists of four sets, namely R, O, P, and M, with a total of 20 operating units labeled from O1 to O20. The R set is the set of four raw materials C5, HCR, light, and NAP. The M set is the remaining of all materials allocated to plants A and B.
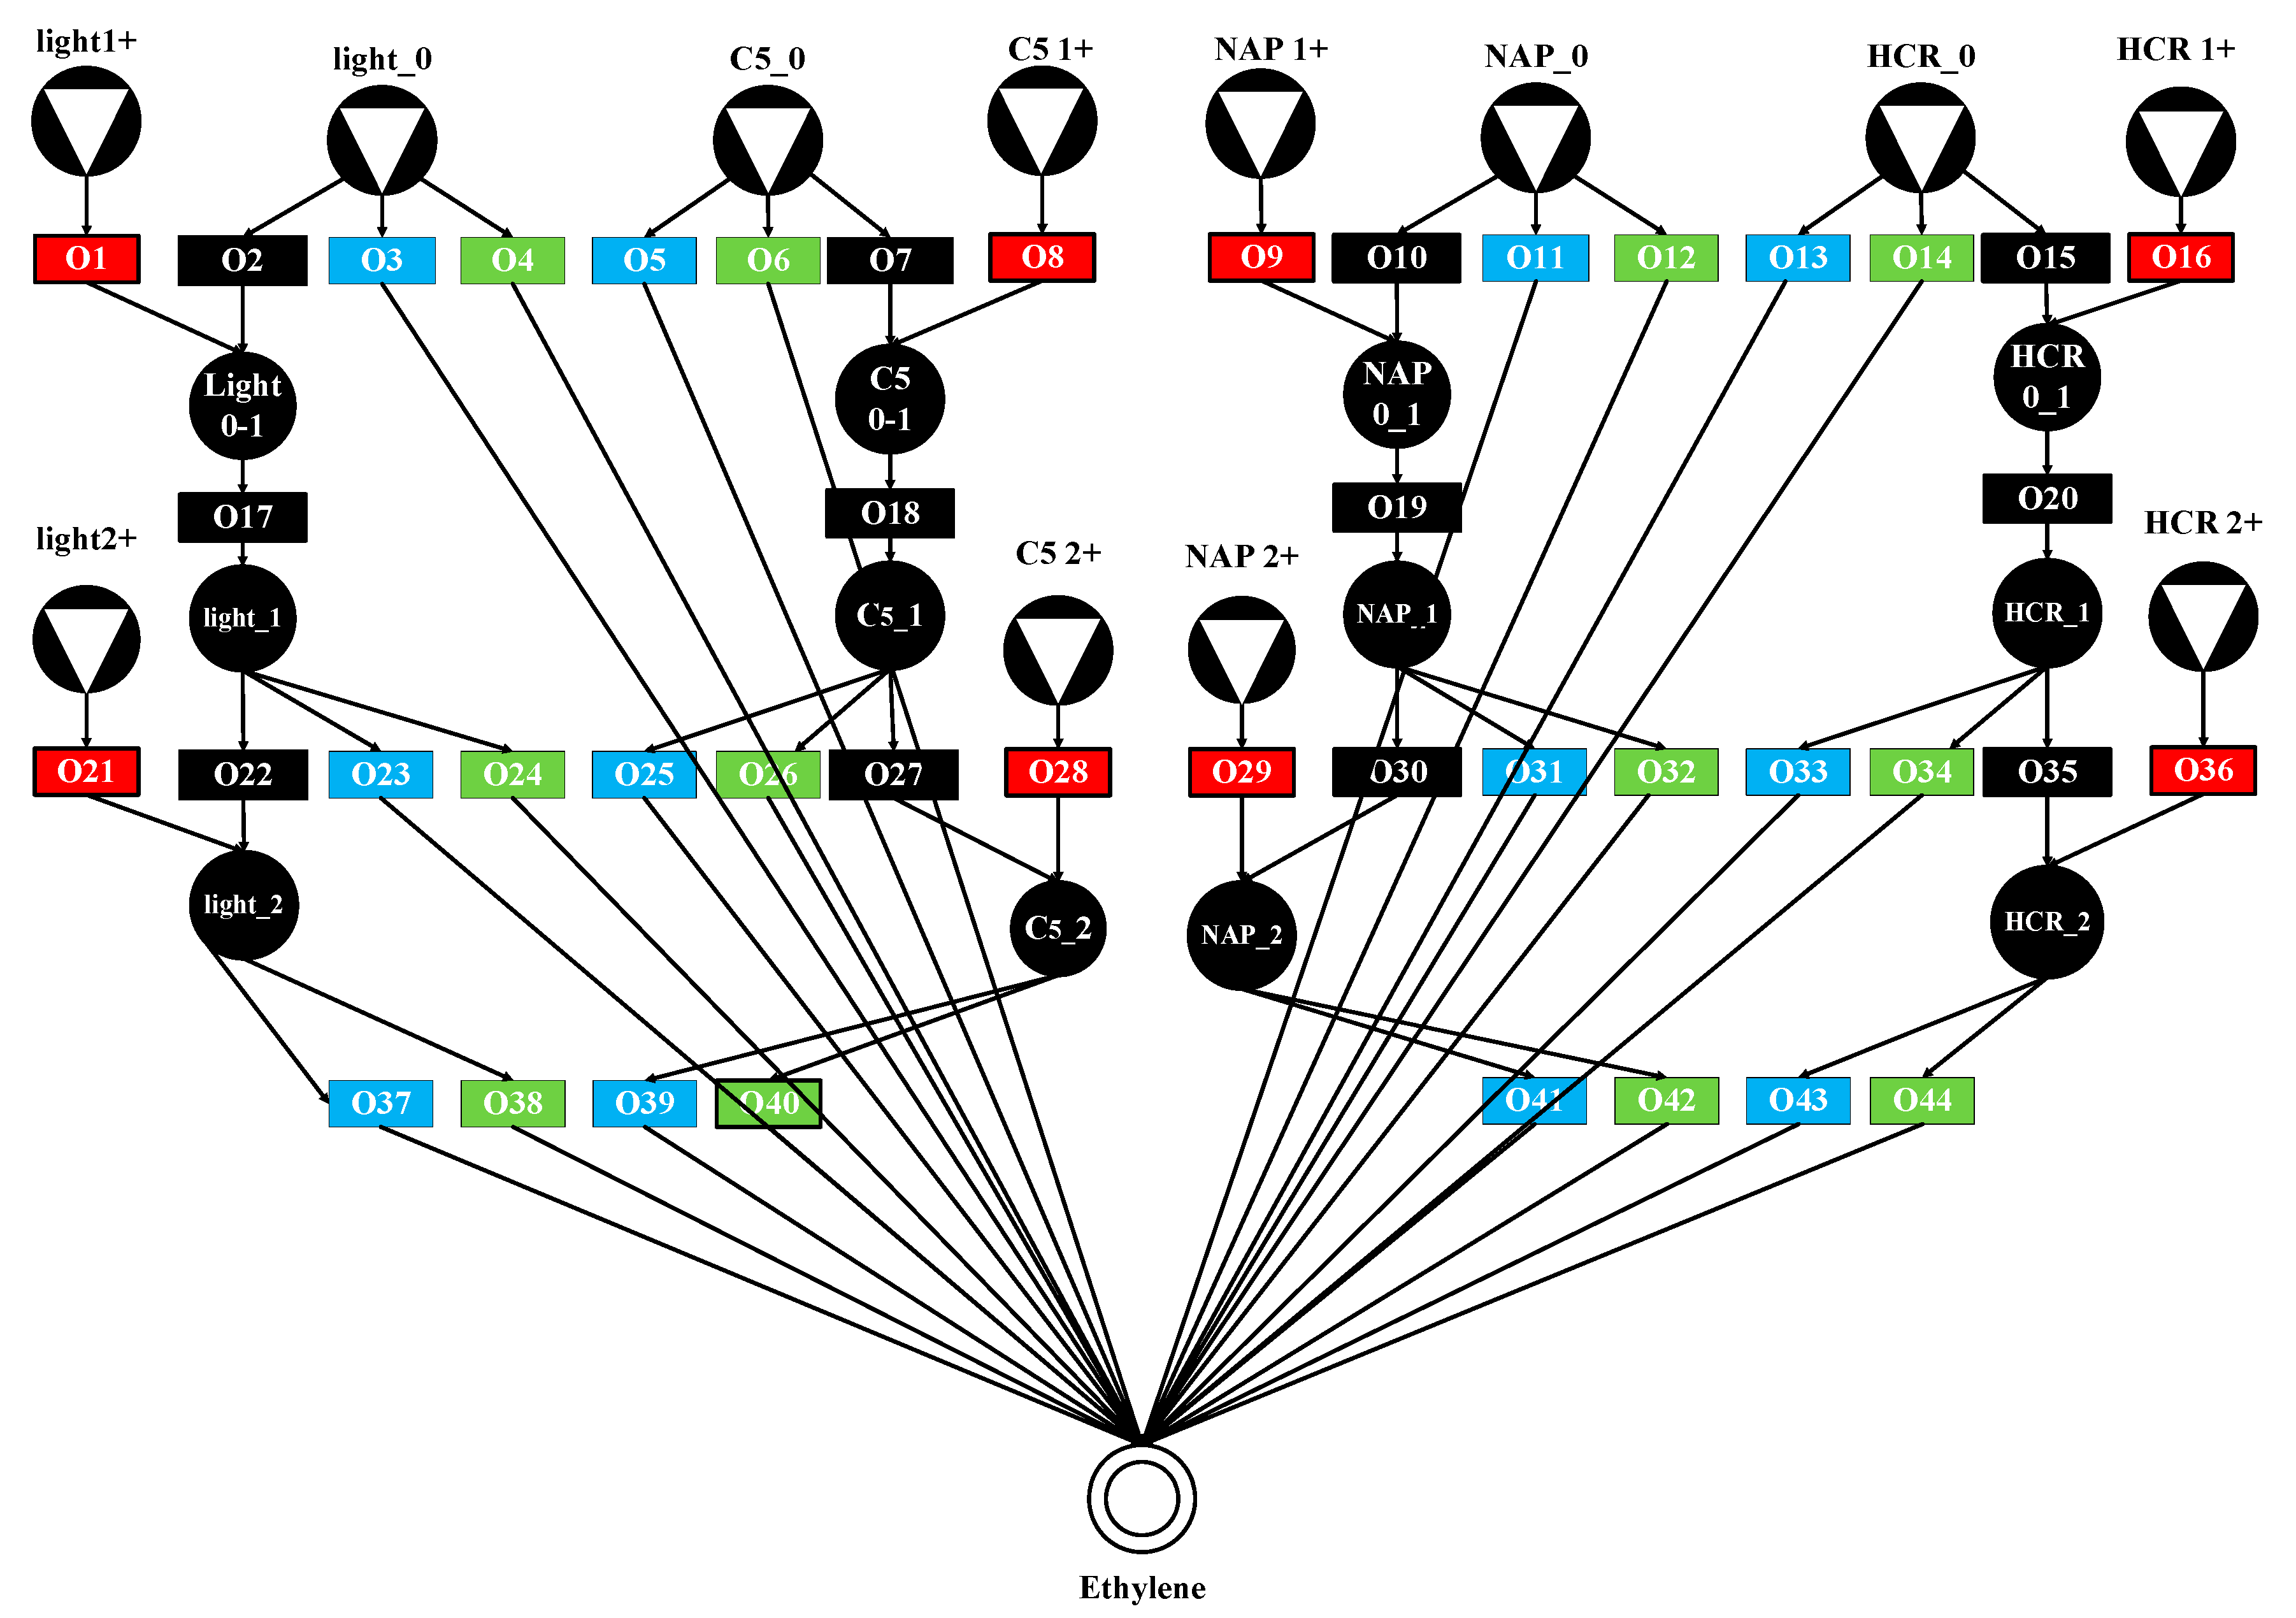
According to the basic structure of Figure 4, the cycle of the case is extended to three months, as shown in Figure 5. If there are two operating units that directly obtain the final product from the raw material or intermediate product, then the operating units assigned to plants A and B are assigned to the raw material from left to right. If there are other operating units, then this operating unit is the surplus allocated to plants A and B. Taking raw material light_0 as an example, O4 is the operating unit for allocating materials to plant B; O3 is the operation of allocating materials to plant A; and O2 is the remaining material that has been allocated. The rules for other raw materials are similar. The special operating units O1, O8, O9, and O16 refer to the operating unit of allocating and preparing materials for the second month after the first month’s materials have been used up; O21, O28, O29, O36 are the operating units of allocating materials prepared for the third month after the second month’s materials have been used up.
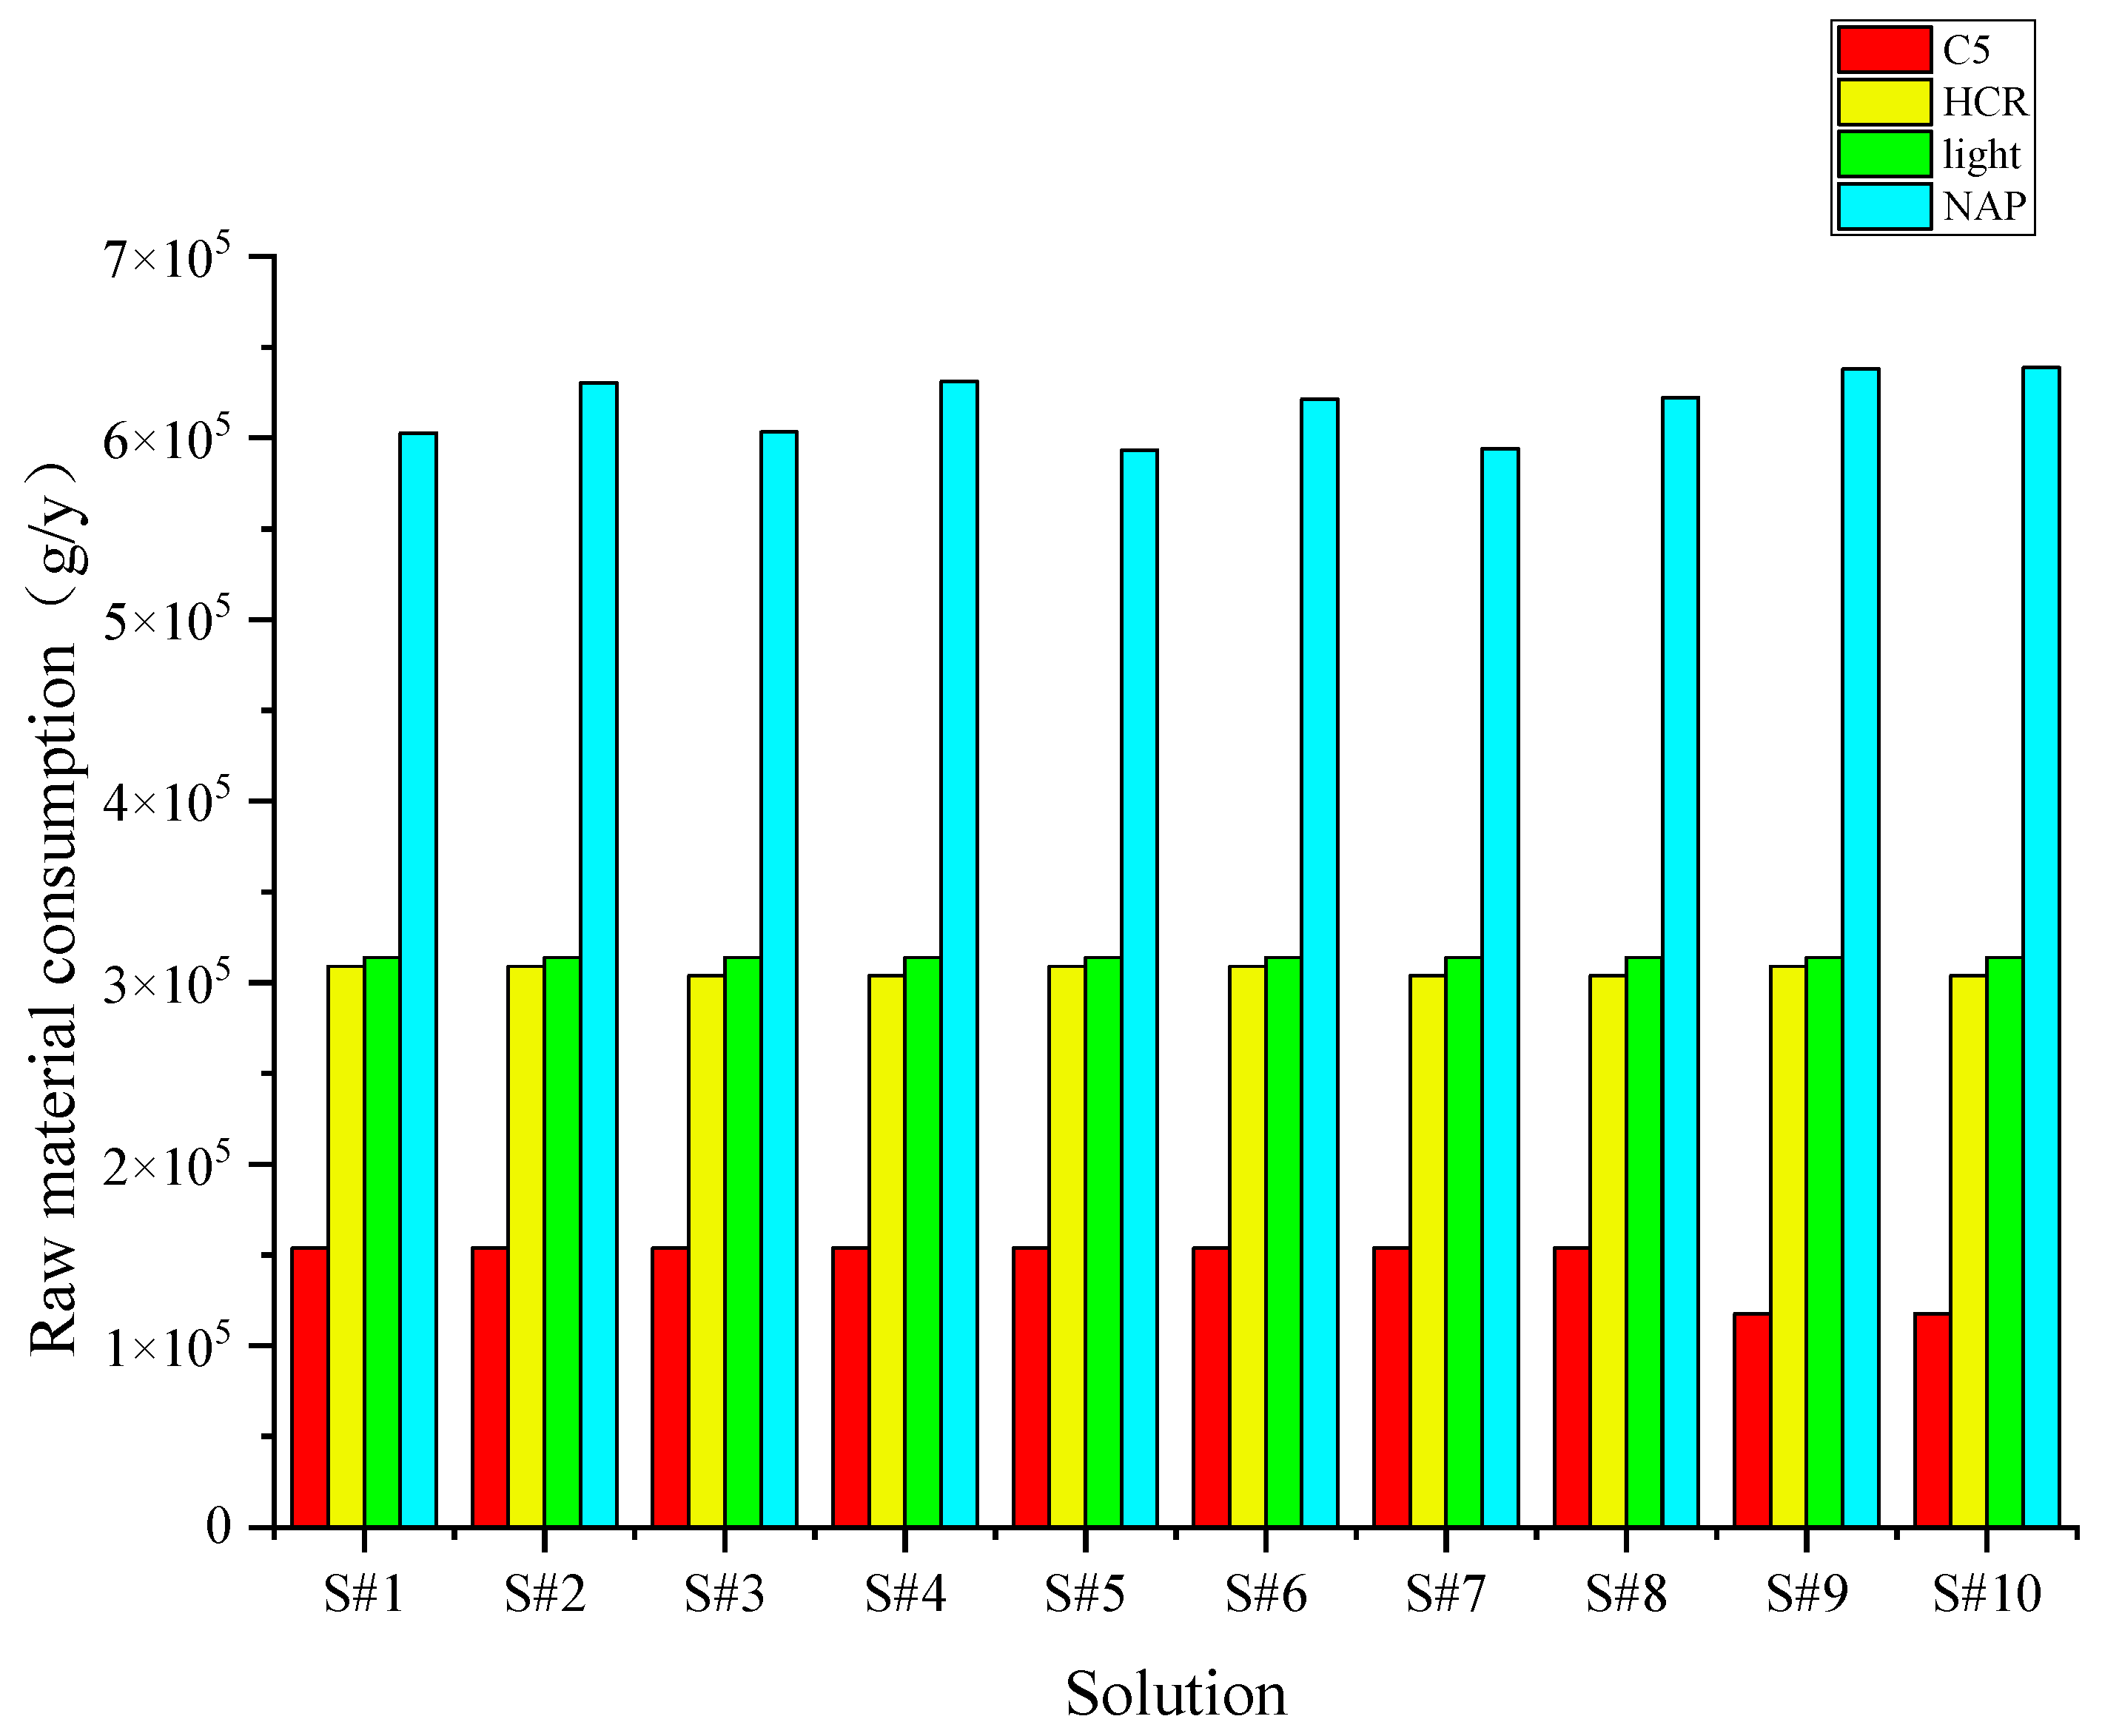
In Figure 5, the black marked operating units (such as O2, O7, etc.) represent the remaining portion after raw material allocation, the blue marked operating units (such as O3, O5, etc.) represent raw material allocation to plant A, the green marked operating units (such as O4, O6, etc.) represent raw material allocation to plant B, and the red marked operating units (such as O1, O8, etc.) represent additional raw material addition. After the establishment of the superstructure model, the ABB algorithm ranks the Top-10 solutions based on the cost. Ten solution sets are named S#1, S#2,…, S#10; the specific raw material consumption of the Top-10 solutions is shown in Table 4.
Because the lowest cost in actual production does not necessarily mean the most optimal scheduling for actual production. Therefore, this case selects the top 10 solutions with the lowest cost consumption for producing the same amount of ethylene in this experiment. Figure 6 can provide a more intuitive comparison of the raw material energy consumption of the 10 solutions.
In the guidelines for national greenhouse gas inventories prepared by the Intergovernmental Panel on Climate Change (IPCC), the method for calculating the total carbon dioxide emissions from energy consumption is provided [42]. The calculation method for carbon dioxide emissions is as follows: E = N × EF, where E is the carbon dioxide emissions, N is the consumption of natural gas energy, which needs to be converted from the physical units of production and consumption of solid, liquid, and gaseous fuels (such as t or m3) to ordinary energy units (J), and EF is the carbon dioxide emission factor of natural gas. The carbon dioxide index is shown in Table 5.
According to Table 5 and the carbon dioxide emission calculation formula, the specific carbon emissions of the Top-10 solutions can be calculated, and the results are shown in Table 6.
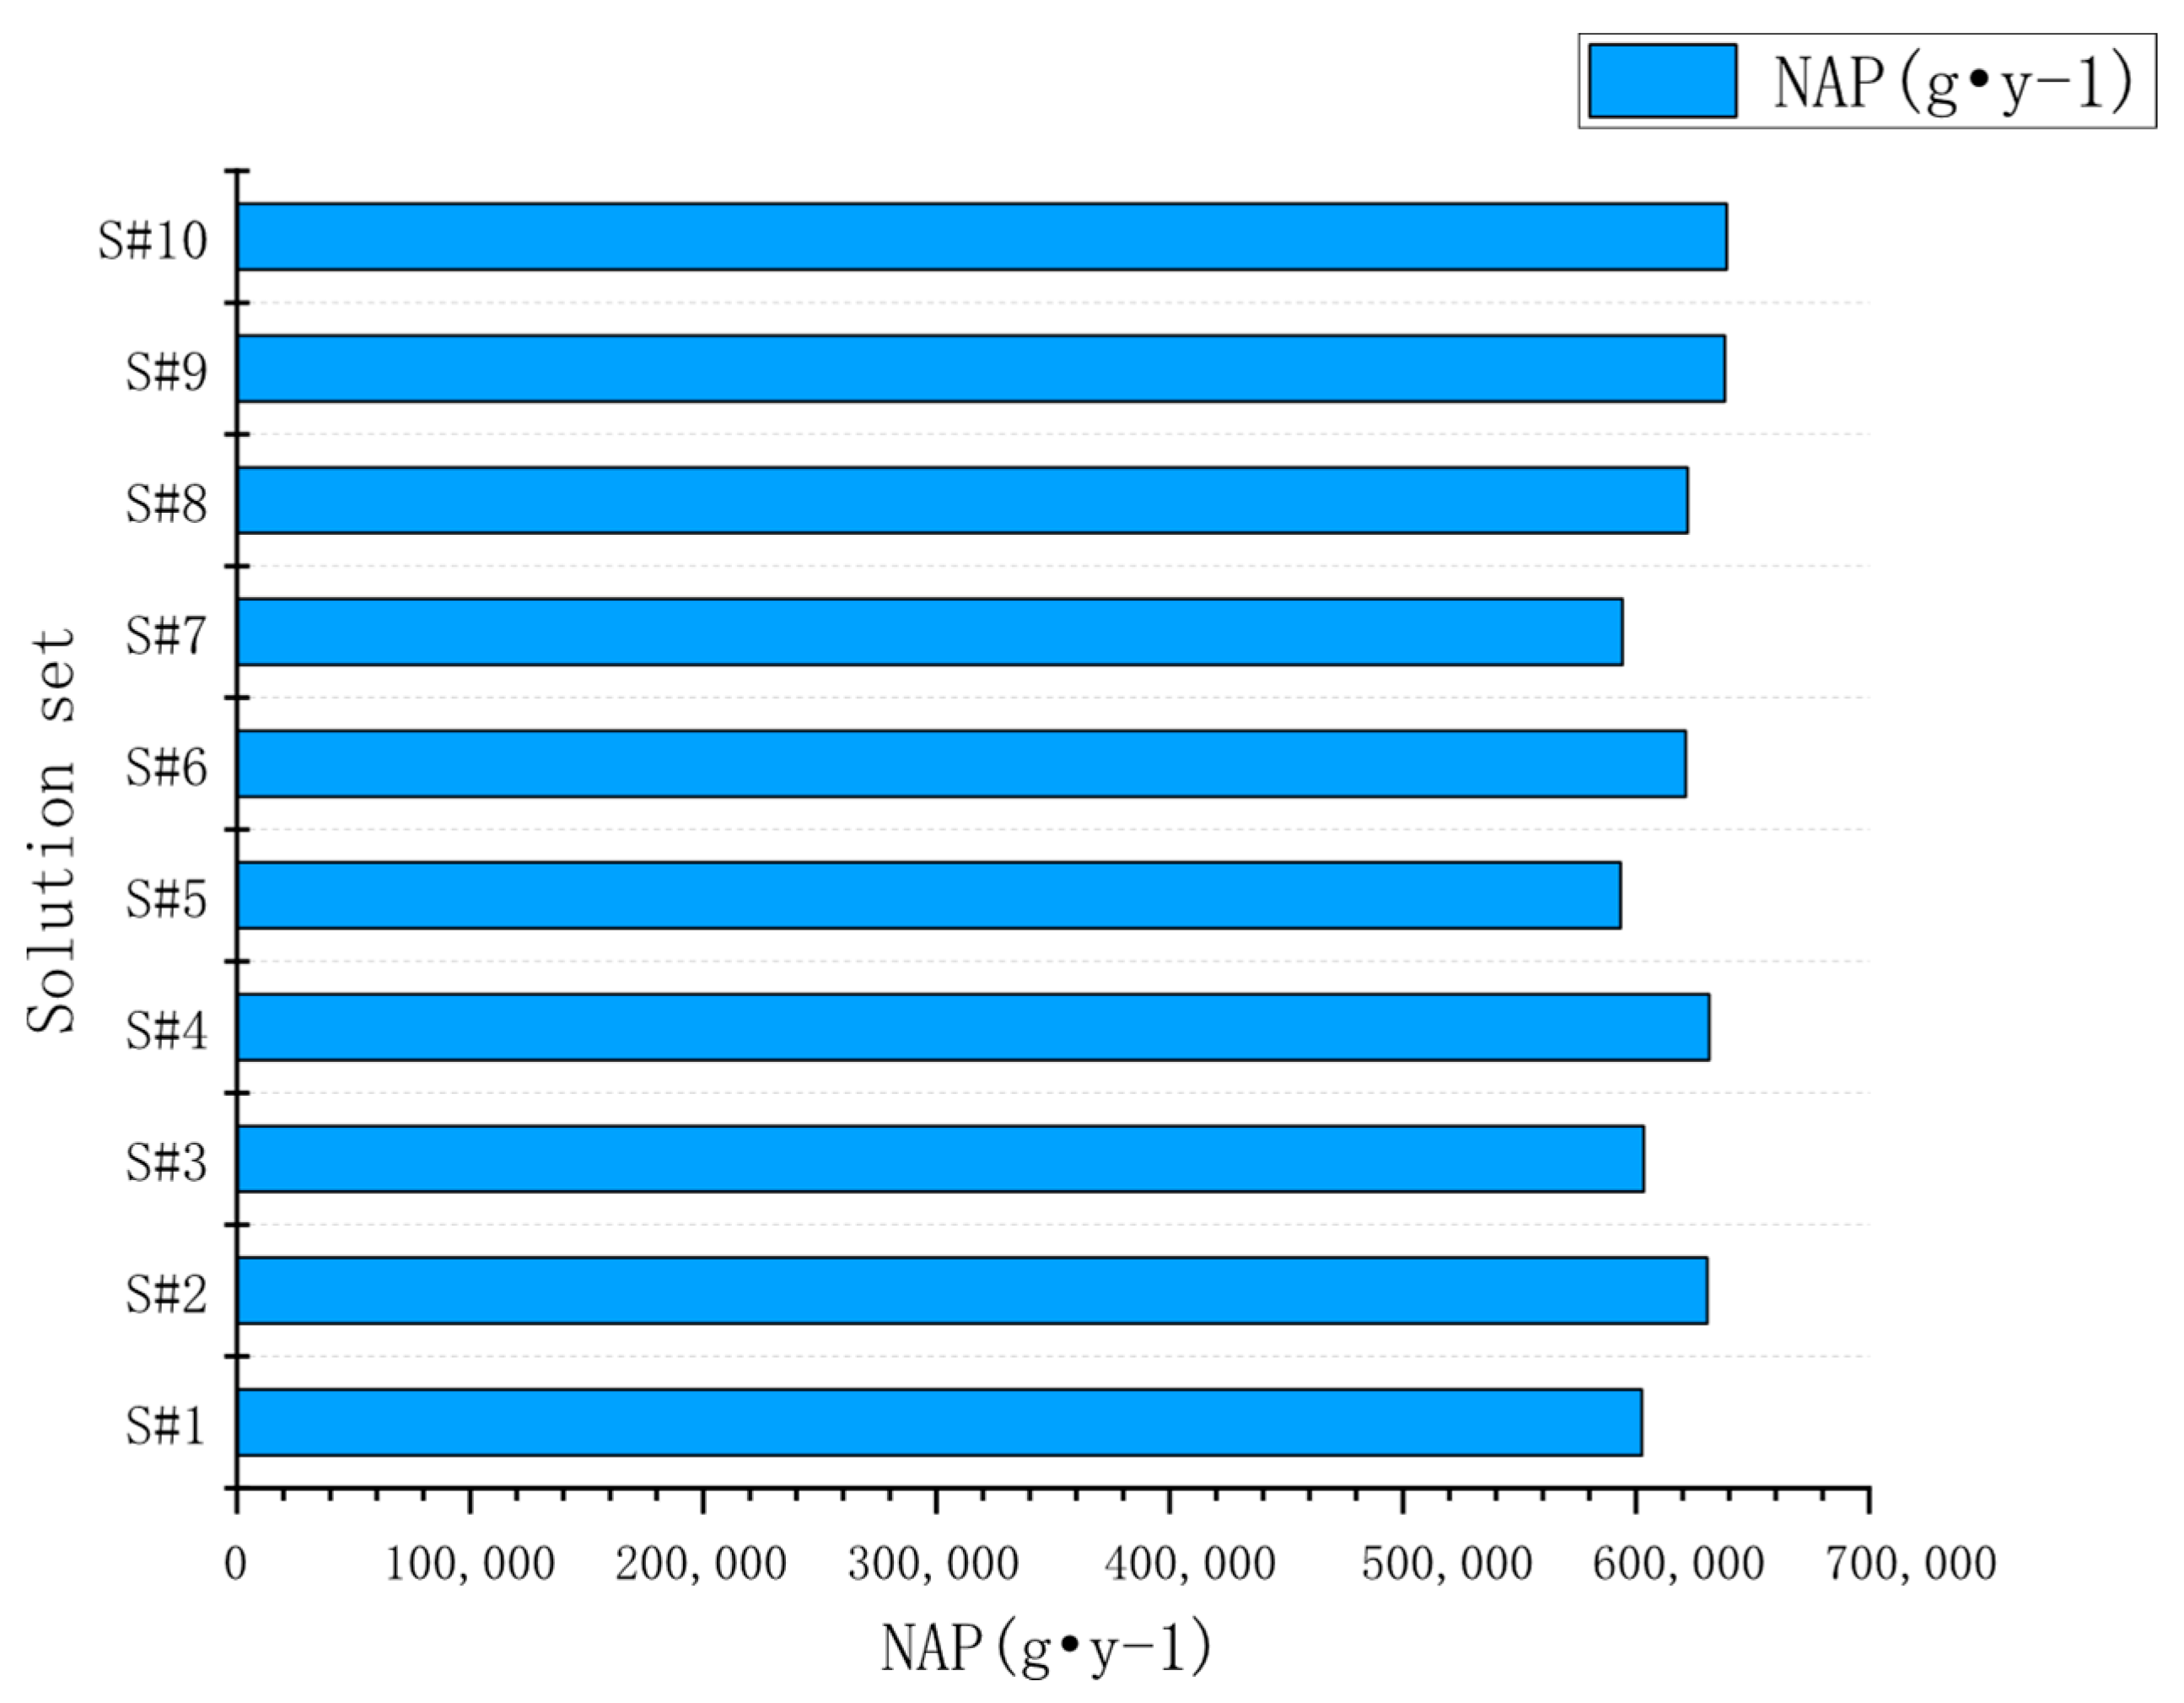
The above has already taken into account the two factors of carbon emissions and energy consumption. As the leader of the petrochemical industry, ethylene’s raw materials mainly include naphtha, natural gas, coal, and ethane, accounting for 41%, 17%, 13%, and 12% of global petrochemical raw materials, respectively. Due to resource limitations, the position of naphtha as the main raw material for domestic cracking units will be maintained for a long time. Considering factors such as the main source of raw materials for ethylene production, if the proportion of naphtha in the raw material structure of the substructure is high, the expert rating will also be higher. The comparison of naphtha distribution among the ten solutions obtained is shown in Figure 7.
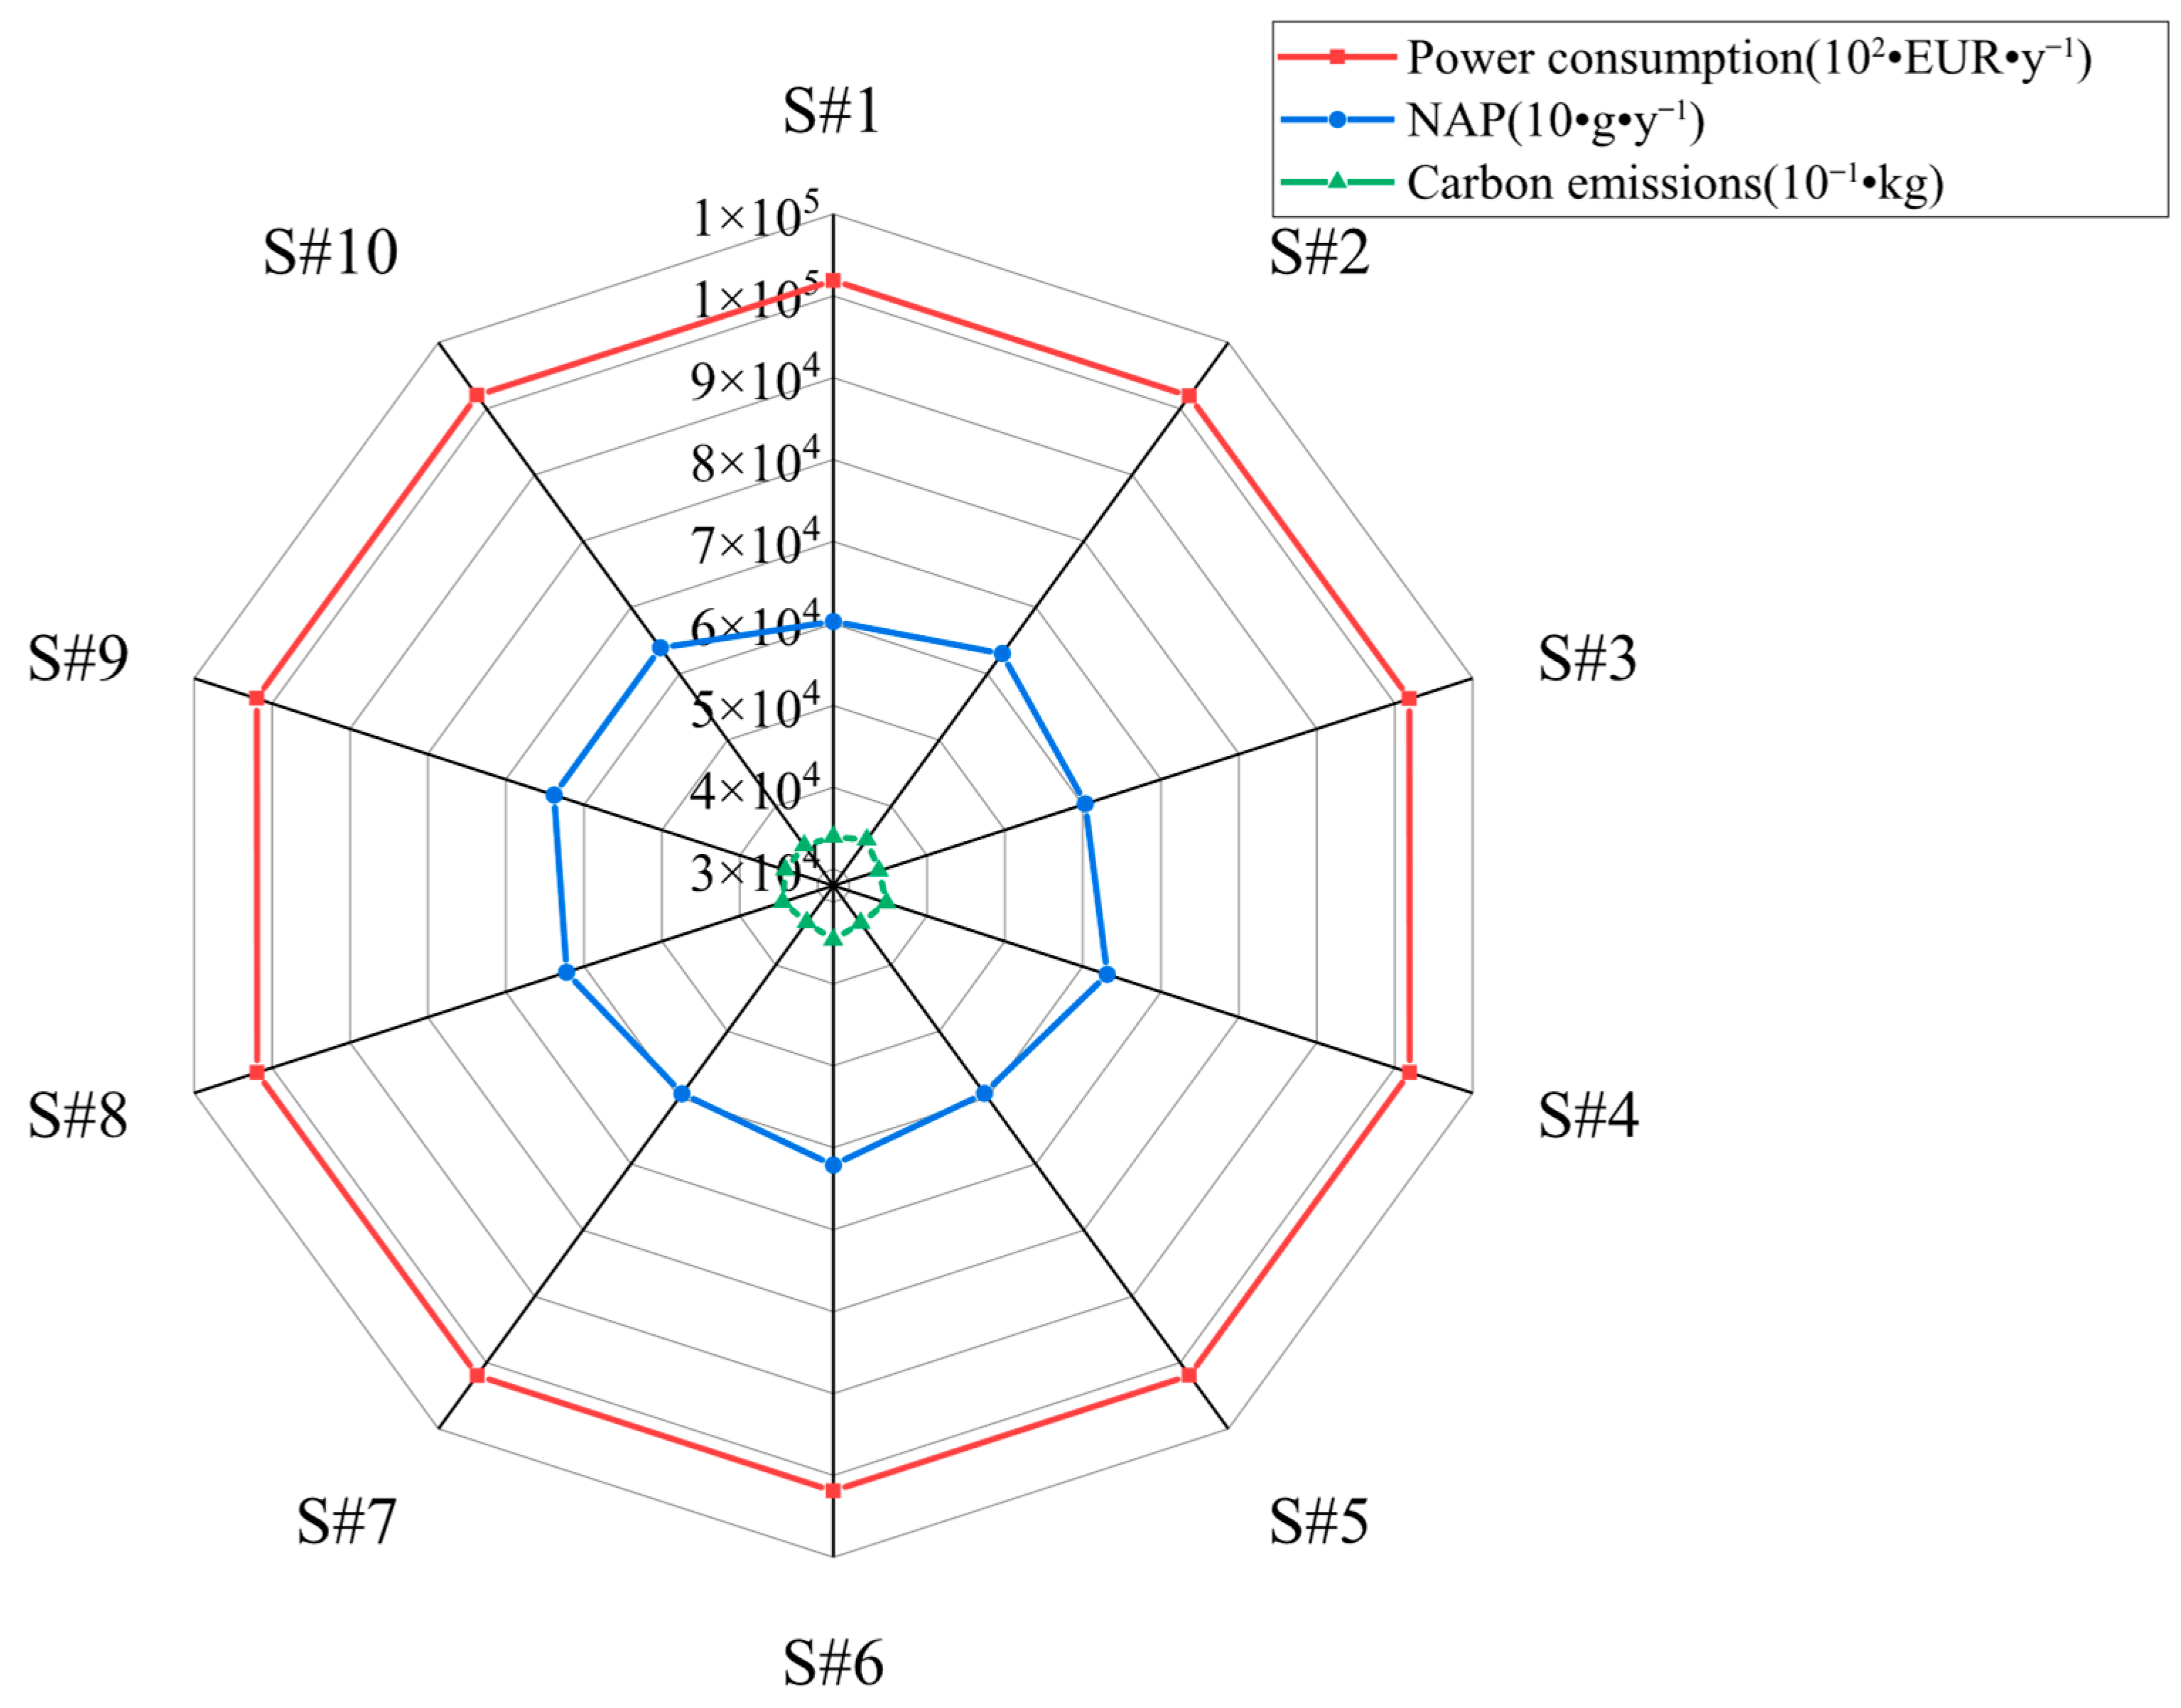
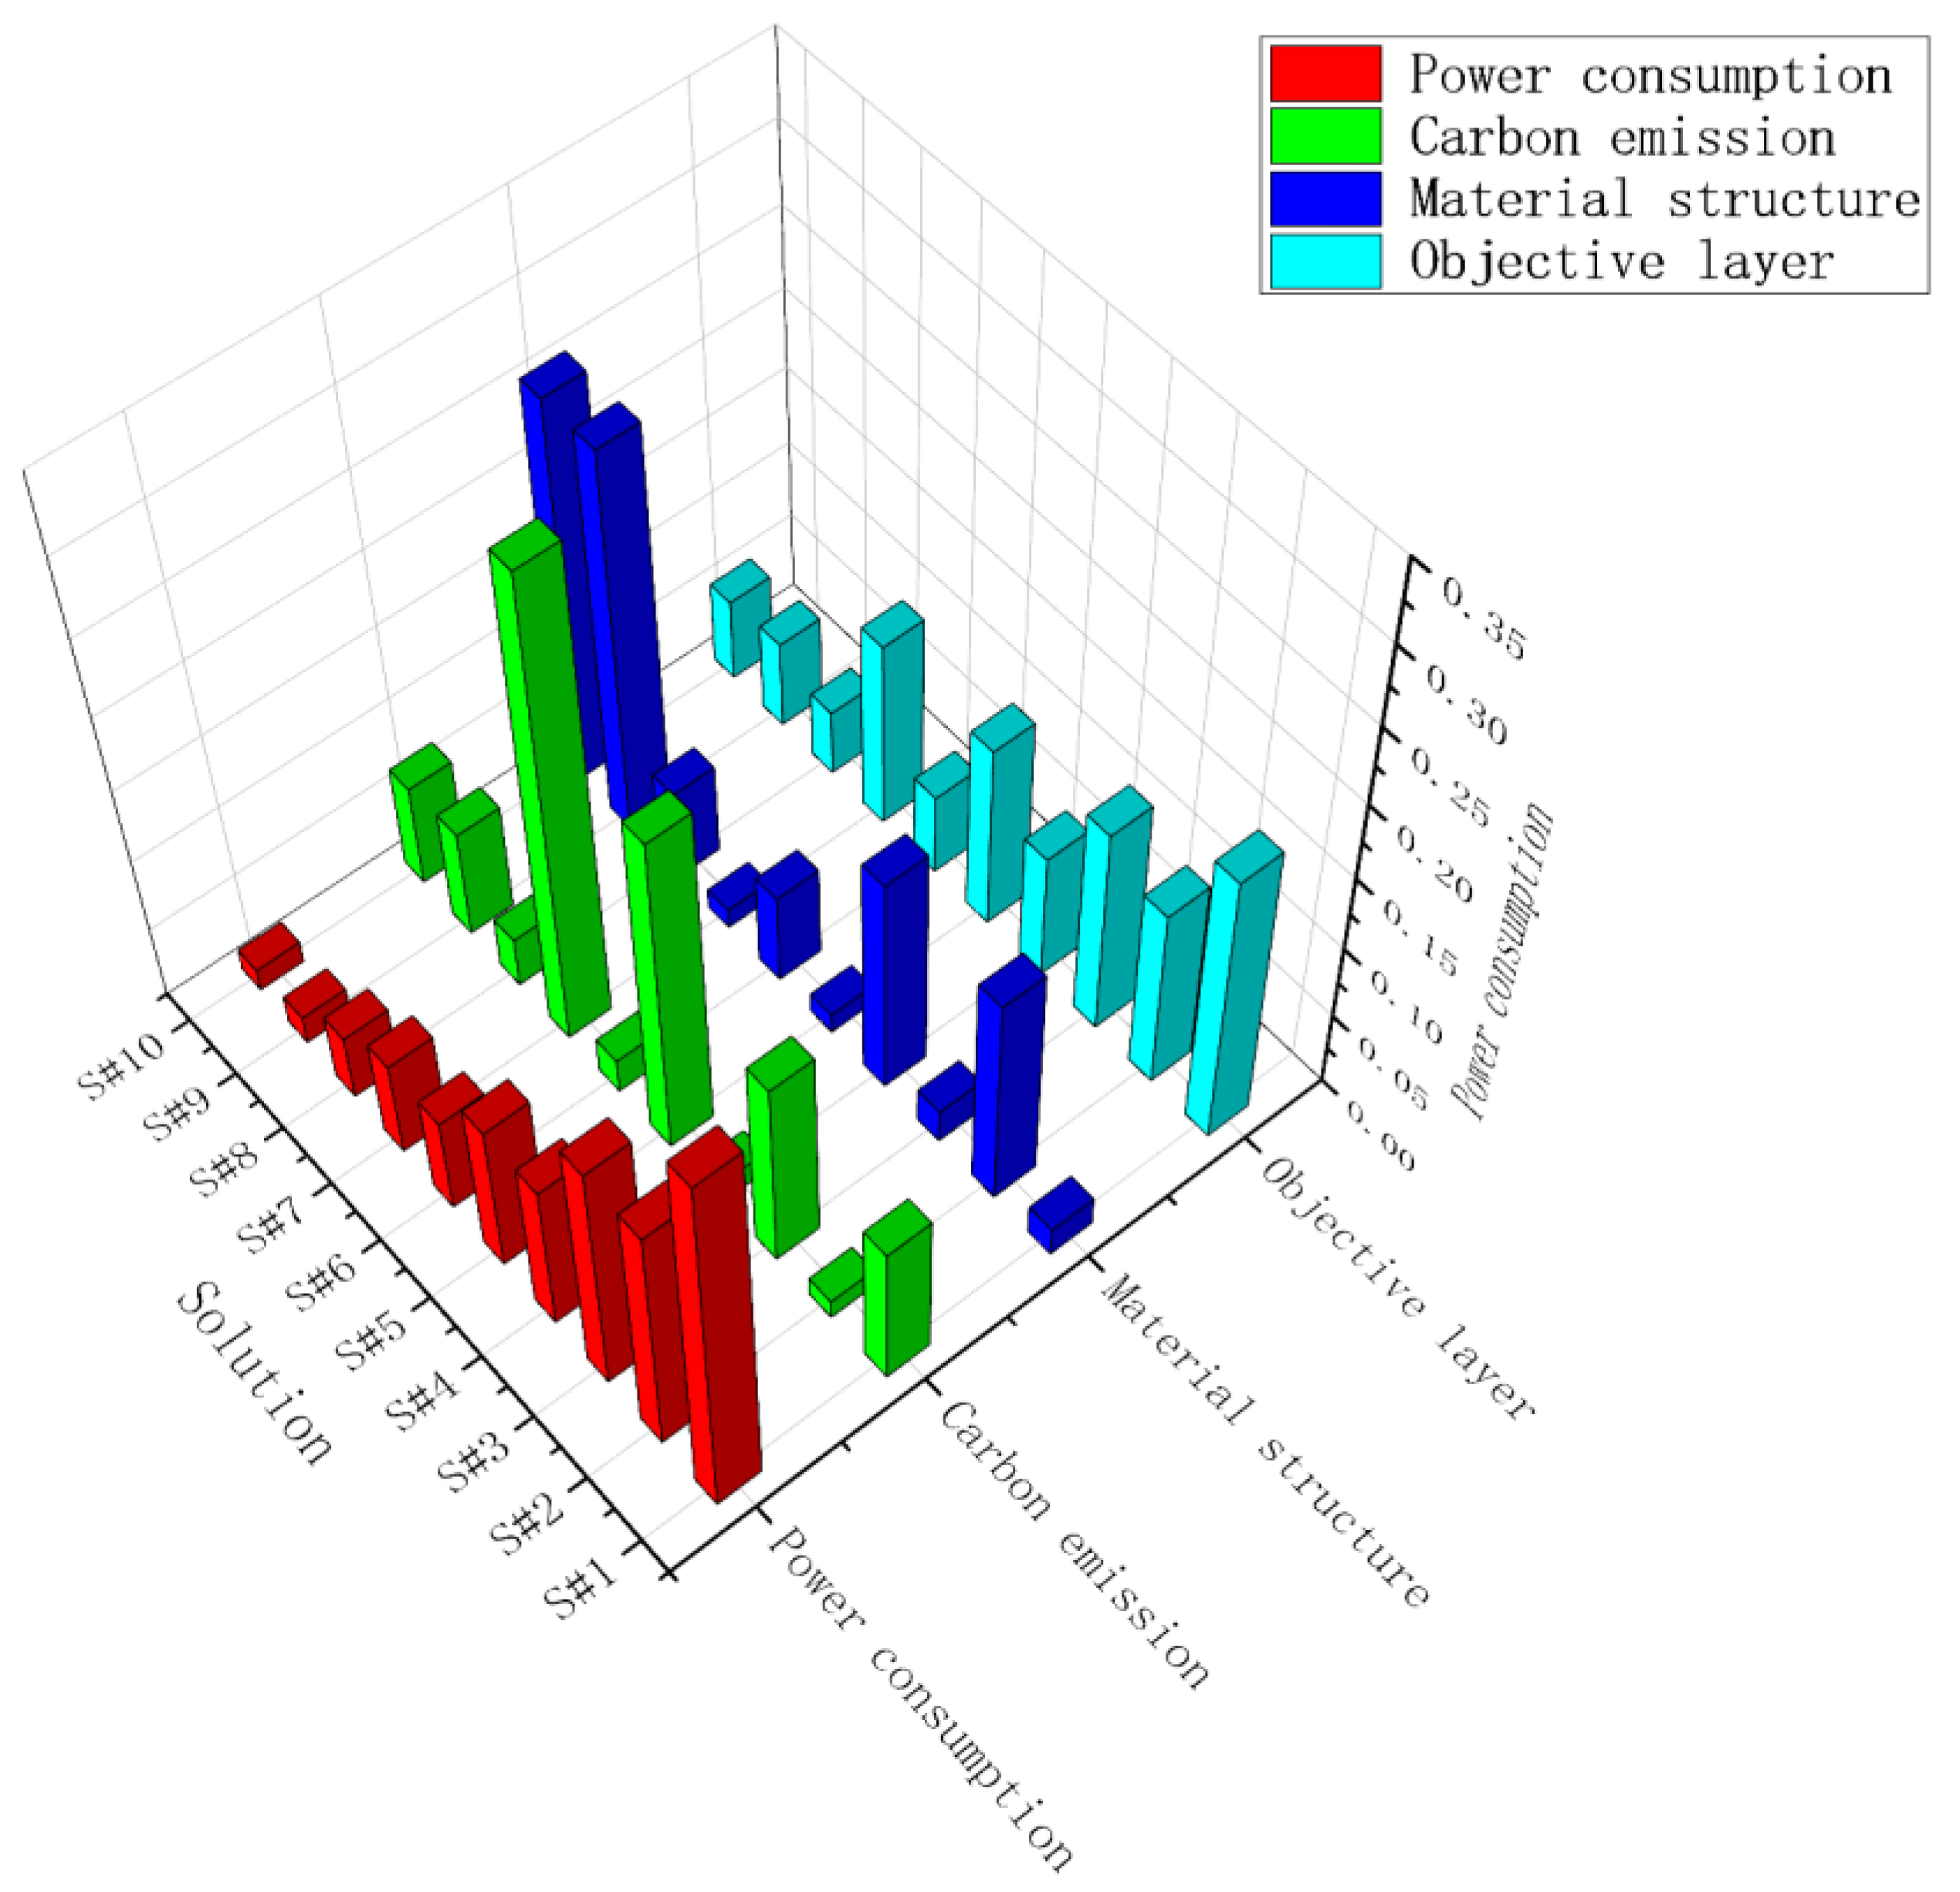
After the case study, Figure 8 shows the differences in three different indicators of the decision-making layer among the ten options. It is evident that there are differences between the decision-level indicators A2 and A3 for the ten options. Solution #1, Solution #5, and Solution #7 have lower naphtha consumption compared to other solutions, and these solutions will receive lower ratings under the A3 index. Solution #6, Solution #2, and Solution #4 have higher CO2 emissions, and these solutions have lower scores under indicator A2.
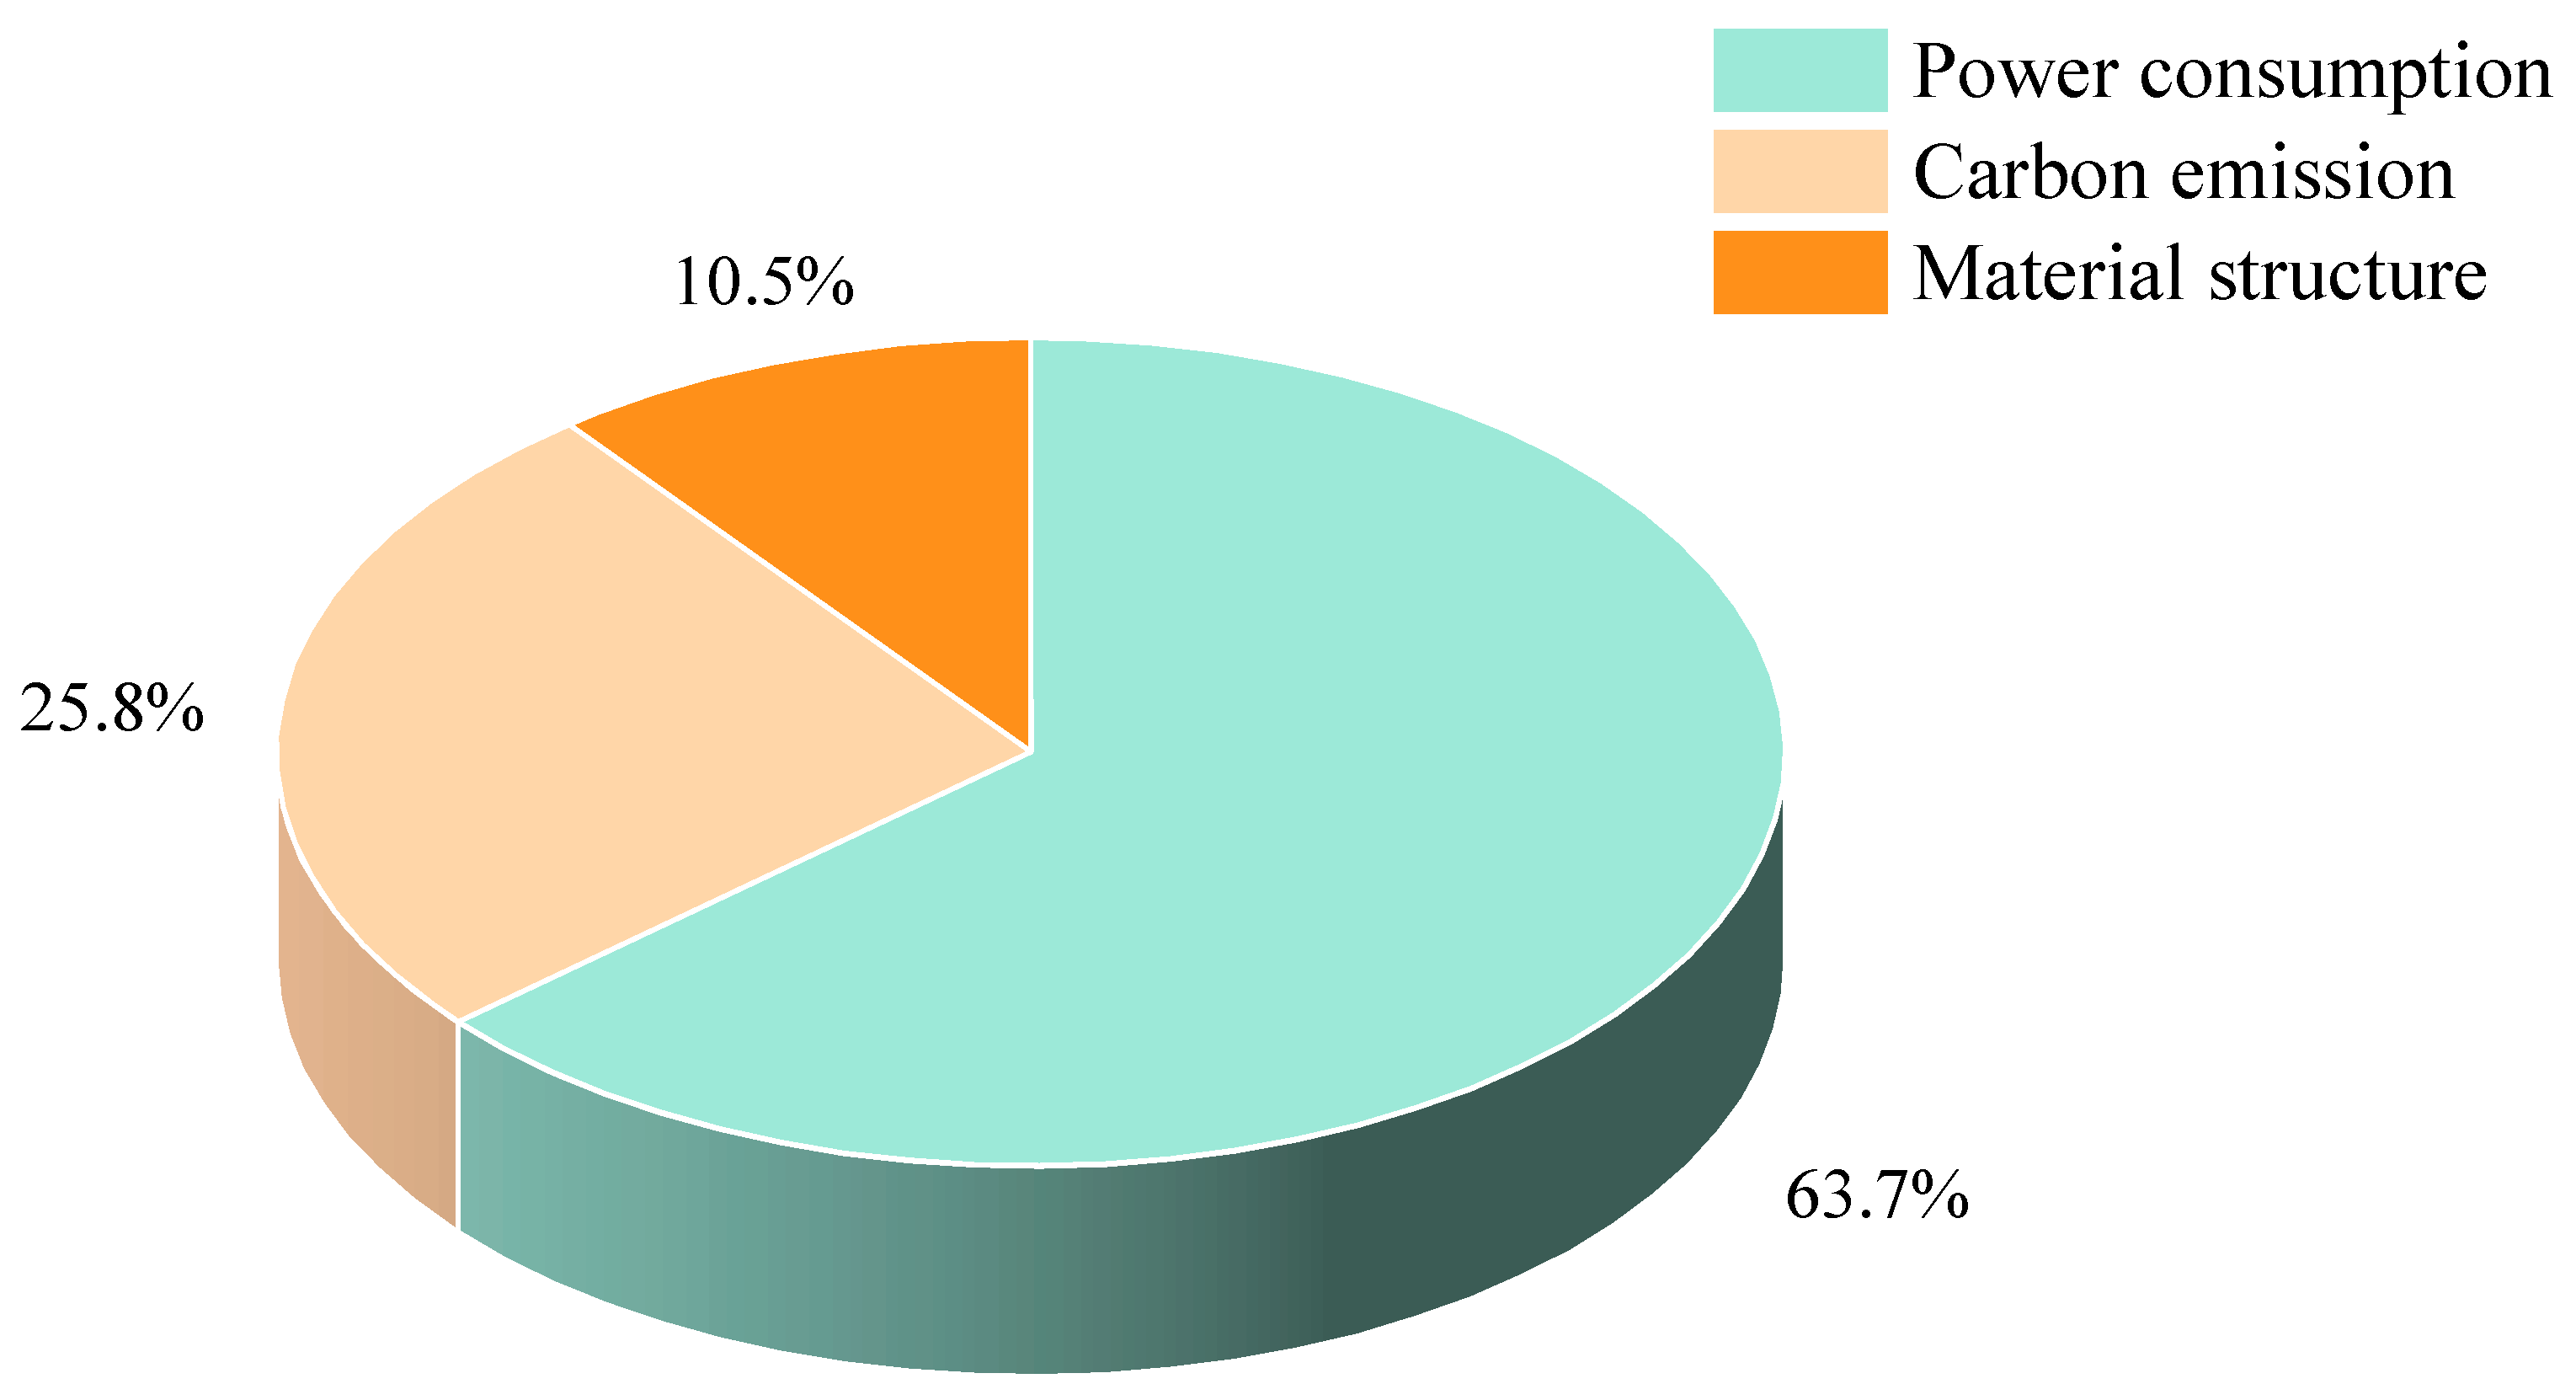
Experts scored the ten solutions obtained by the ABB algorithm based on the proposed model to obtain a judgment matrix. The elements in the same level need to pass consistency checks with the elements in the previous level, and the weights of criterion layer A1, criterion layer A2, and criterion layer A3 are calculated as 0.64, 0.26, and 0.1. From Figure 9, it can be intuitively seen that the weight proportion of the criterion layer is basically consistent with the initial requirements of this case, with A1 having the highest proportion and A2 following closely.
From Table 7, it can be seen that the maximum eigenvalue of the criterion layer, C.R. < 0.1, passed the consistency test. The expert ratings at the criterion level have all passed the consistency test, proving the validity of the results. The final result is shown in Figure 10. According to the target layer score, the optimal choice is Solution #1, as shown in Figure 11, while the second-best option has become Solution #3.
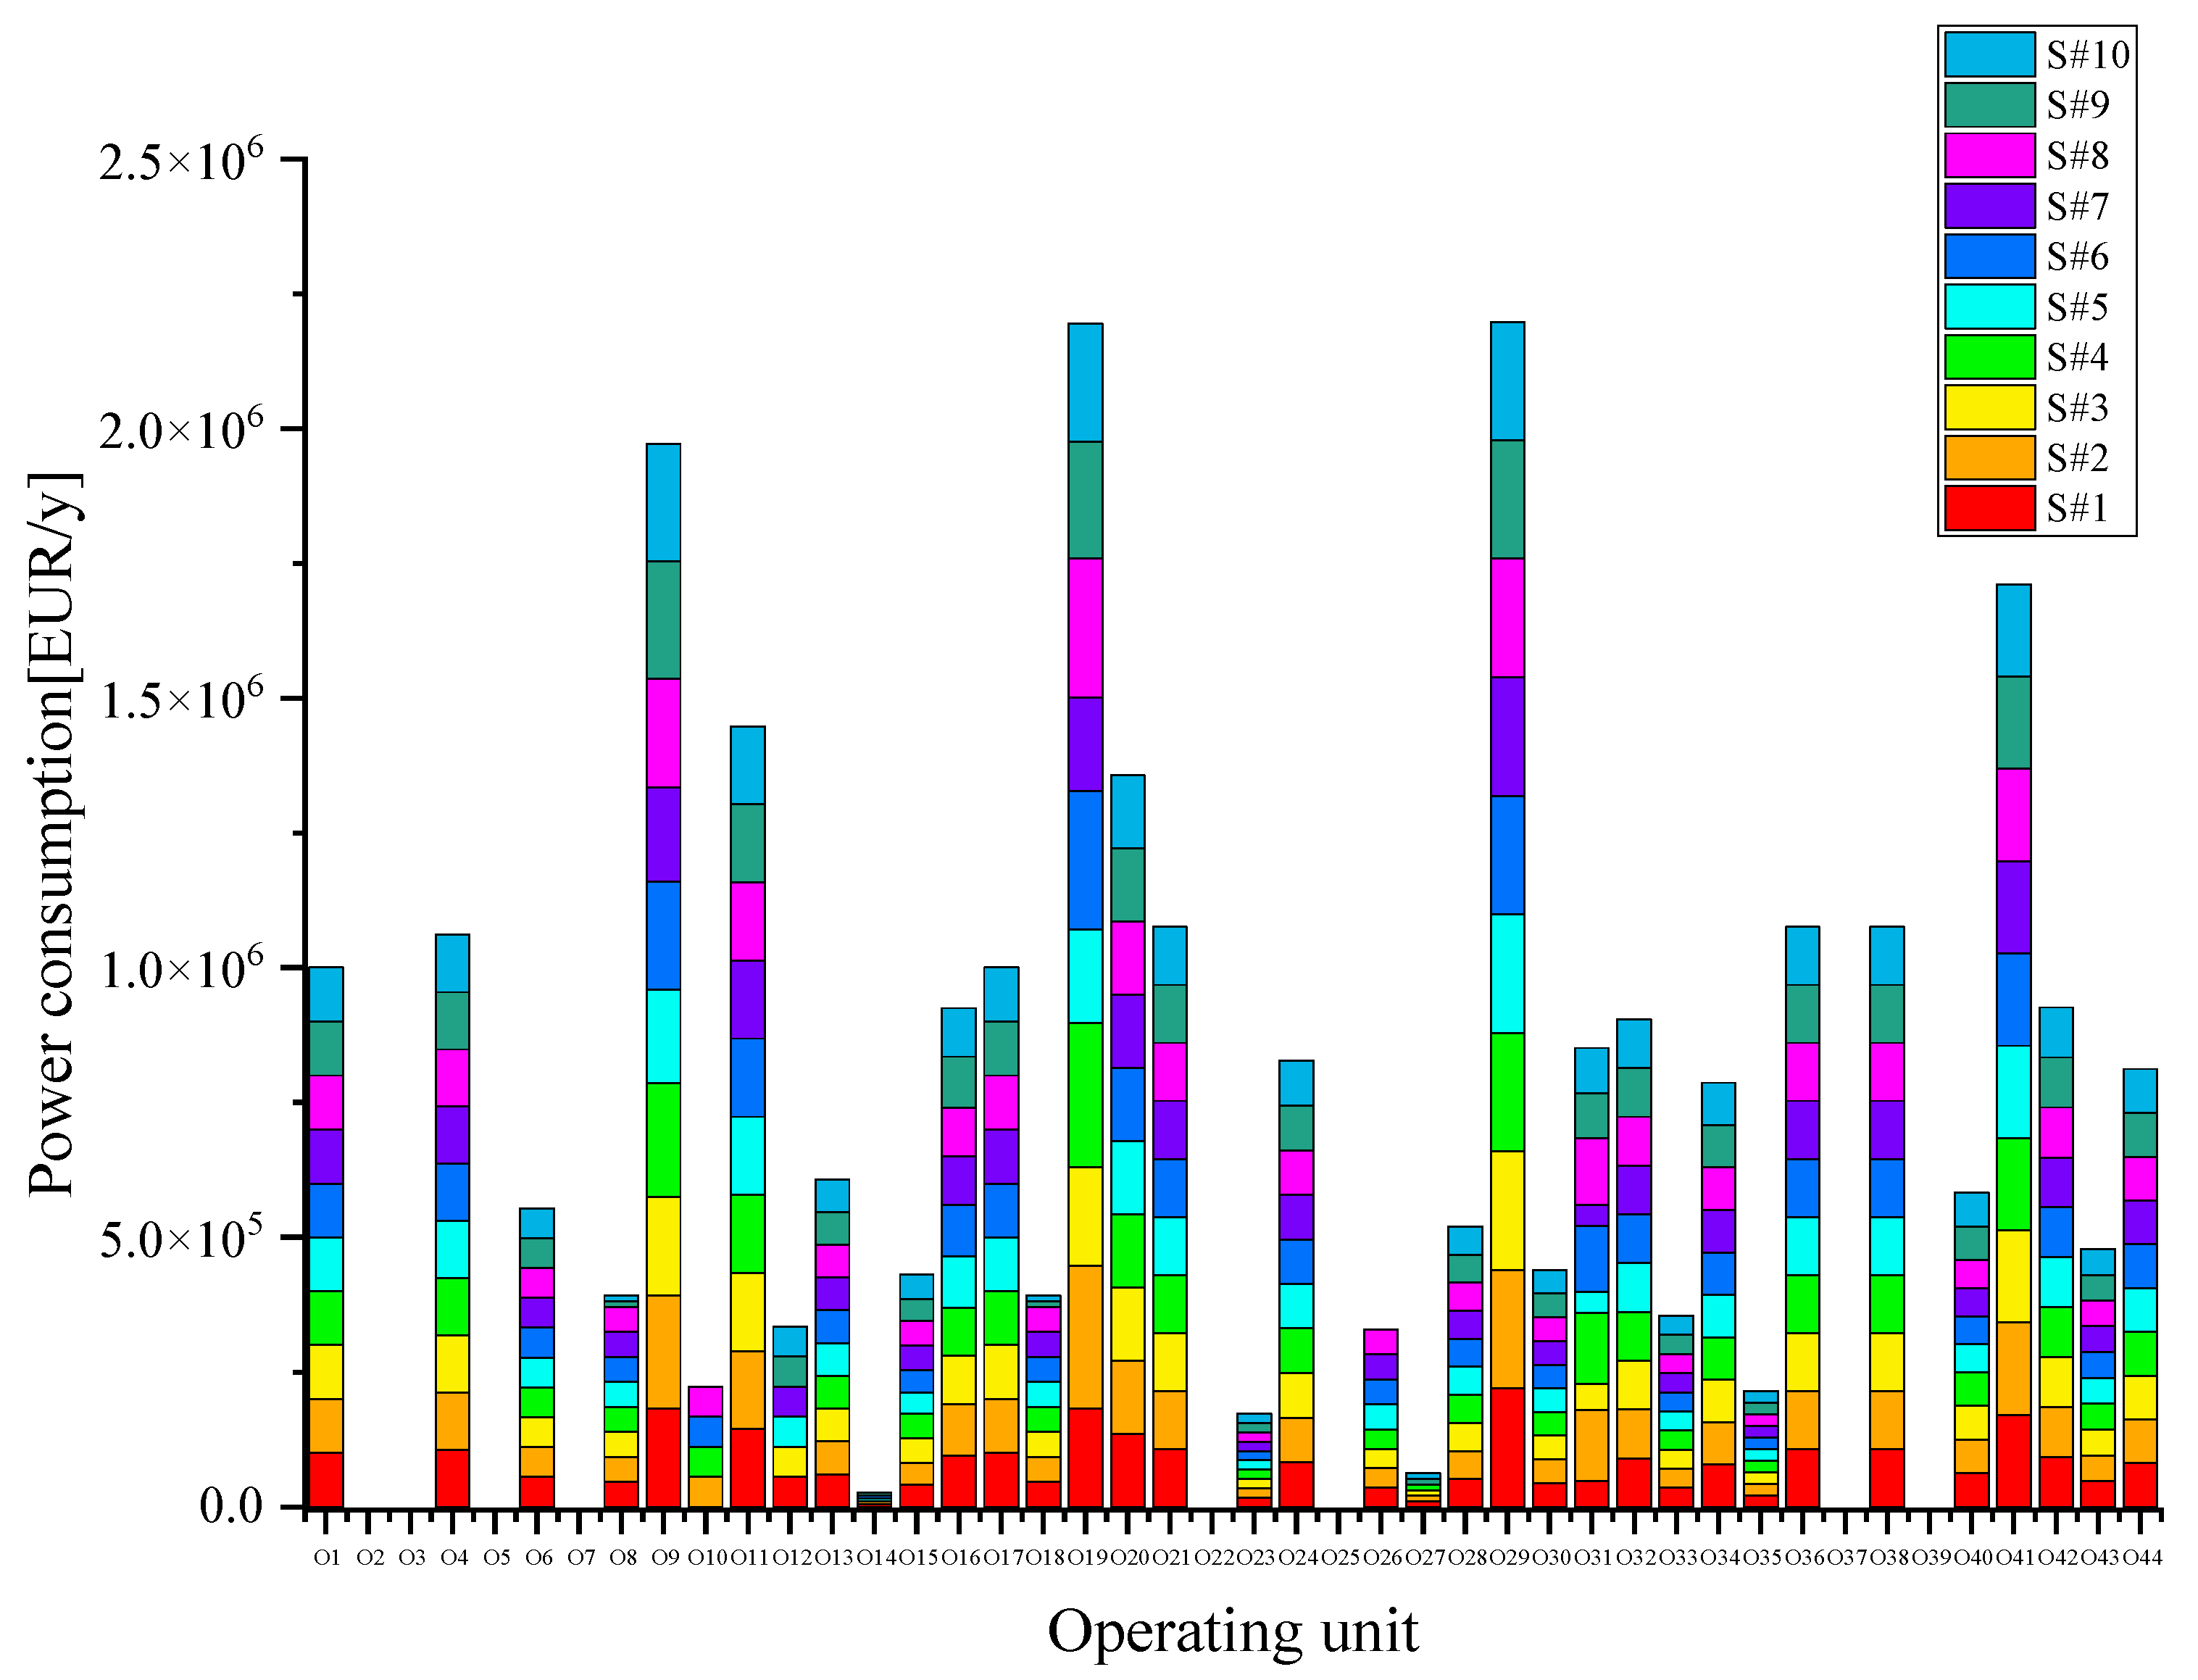
Instead of only considering solution 2 obtained by the ABB algorithm in criterion layer 1, after integrating multiple indicators, the AHP algorithm optimized the results of the ABB algorithm. The ranking given by the AHP algorithm combined with the ABB algorithm for the optimization scheduling problem in this case is Solution #1, Solution #3, Solution #2, Solution #5, Solution #7, Solution #4, Solution #10, Solution #6, Solution #9, and Solution #8. The power consumption for each solution is shown in Figure 12.

4. Conclusions

The strict superstructure in solving the ethylene production problem avoids the interference of redundant structures in the problem, while the ABB algorithm performs pruning operating units during the calculation process. Redundant calculations are avoided, the solution space is further optimized, and the solution set can be calculated faster. Specifically in ethylene production, the ABB algorithm can intelligently search for feedstock scheduling and allocation solutions based on production demand and raw material supply, and the optimal or approximate optimal solution can be quickly obtained. The AHP algorithm has been introduced into the multi-objective optimization problem of ethylene production without the need for remodeling. The experimental results show that the proposed framework greatly reduces the workload of modeling through process optimization, and reduces 2/3 of the modeling workload and model complexity compared to traditional ABB algorithms. During the cooperation with Chinese petrochemical enterprises, the proposed method has achieved good results in optimizing ethylene production. Under the condition of adding a small amount of cost, the optimal solution obtained by this framework can reduce carbon emissions by 1.27% compared to before the improvement, and traditional methods cannot effectively consider multi-objective problems.
The actual production requirements of each plant are different, and the AHP expert scoring used in this article is the result of comprehensive scoring by authoritative personnel such as engineers, managers, and research experts who have been working in the plant for many years. Therefore, we can adjust the judgment matrix of the decision-making layer in the AHP algorithm based on expert ratings, and ultimately obtain a more suitable feedstock scheduling solution for our plant. The integration of the ABB algorithm and AHP algorithm can not only solve the problem of ethylene production, but also provide customized solutions for specific needs in different fields and industries.
In the study of P-graph theory, it was found that the modeling ability for uncertainty, fuzziness, and gradient relationships in the real world is slightly weak. Therefore, it is possible to introduce fuzzy P-graph theory to deal with more problems. It is also possible to integrate nonlinear functions into the model to solve nonlinear problems in complex problems. In order to expand the optimization capability of the model, sustainability indicators such as Carbon Footprint, Water Footprints, and Land Footprints can be incorporated into the model to create a more comprehensive evaluation.

Author Contributions

Conceptualization, J.C.; Methodology, J.C. and H.Y.; Software, J.C. and H.Y.; Validation, J.C. and Y.J.; Formal analysis, H.Y. and J.C.; Writing—original draft, H.Y.; Writing—review and editing, J.C. and Y.J.; Supervision, J.C.; Funding acquisition, J.C. All authors have read and agreed to the published version of the manuscript.

Funding

This research was supported by the Natural Science Foundation of China (No. 52402442) and Beijing Information Science and Technology University research Found (No. 2023XJJ10).

Data Availability Statement

The original contributions presented in this study are included in the article. Further inquiries can be directed to the corresponding author.

Conflicts of Interest

The authors declare no conflict of interest.

Abbreviations

The following abbreviations are used in this manuscript:
PNSprocess network synthesis
P-graphProgress graph
MINLPThe Mixed Integer Nonlinear Programming
ABBAccelerated Branch and Bound
BBBranch and Bound
AHPThe Analytic Hierarchy Process
PFDprocess flow diagram
MSGMaximum Structure Generation
SSGSolution Structure Generation
ETSEmissions Trading Scheme
MEAmonoethanolamine
CAPchilled ammonia process
MEMmembrane assisted liquefaction
HCRhydrogenated tail oil
lightlight diesel oil
C5C3C4C5
NAPnaphtha

References

  1. Mallapragada, D.S.; Dvorkin, Y.; Modestino, M.A.; Biddinger, E.; Esposito, D.V.; Smith, W.A.; Hodge, B.M.; Harold, M.P.; Donnelly, V.M.; Nuz, A.; et al. Decarbonization of the chemical industry through electrification: Barriers and opportunities. Joule 2023, 7, 23–41. [Google Scholar] [CrossRef]
  2. Prawitasari, D.A. Potensi Limbah Hasil Pertanian Padi menjadi Sumber Bioenergi melalui Konsep Biorefineri dengan Pendekatan P-Graph dan Analisis Ekonomi Teknik di Kabupaten Sleman, Yogyakarta. Asian J. Innov. Entrep. 2025, 9, 16–32. [Google Scholar] [CrossRef]
  3. Velázquez, J.J.H.; Durán, F.M.Z.; Díaz, L.A.C.; Ruiz, J.C.; Avila, J.R.A. Hybrid two-step optimization of internally heat-integrated distillation columns. J. Taiwan Inst. Chem. Eng. 2022, 130, 103967. [Google Scholar] [CrossRef]
  4. Xu, Y.; Li, J.; Cui, G.; Zhang, G.; Yang, Q. An improved treble-level assisting optimization strategy to enhance algorithm search ability in heat exchanger network design. J. Taiwan Inst. Chem. Eng. 2021, 129, 162–170. [Google Scholar] [CrossRef]
  5. Friedler, F.; Fan, L.T.; Imreh, B. Process network synthesis: Problem definition. Networks 1998, 31, 119–124. [Google Scholar] [CrossRef]
  6. Orosz, Á.; How, B.S.; Friedler, F. Multiple-solution heat exchanger network synthesis using P-HENS solver. J. Taiwan Inst. Chem. Eng. 2022, 130, 103859. [Google Scholar] [CrossRef]
  7. Ali, R.A.; Nik Ibrahim, N.N.L.; Wan Ab Karim Ghani, W.A.; Lam, H.L.; Sani, N.S. Utilization of process network synthesis and machine learning as decision-making tools for municipal solid waste management. Int. J. Environ. Sci. Technol. 2022, 19, 1985–1996. [Google Scholar] [CrossRef]
  8. Camisa, A.; Notarnicola, I.; Notarstefano, G. Distributed primal decomposition for large-scale MILPs. IEEE Trans. Autom. Control 2021, 67, 413–420. [Google Scholar] [CrossRef]
  9. Yuan, T.J.; Mao, Y.L. A review of pinch analysis techniques and extended application in power systems. Renew. Sustain. Energy Rev. 2024, 202, 114684. [Google Scholar] [CrossRef]
  10. Daoutidis, P.; Lee, J.H.; Rangarajan, S.; Chiang, L.; Gopaluni, B.; Schweidtmann, A.M.; Harjunkoski, I.; Mercangöz, M.; Mesbah, A.; Boukouvala, F.; et al. Machine learning in process systems engineering: Challenges and opportunities. Comput. Chem. Eng. 2024, 181, 108523. [Google Scholar] [CrossRef]
  11. Friedler, F.; Tarjan, K.; Huang, Y.W. Graph-theoretic approach to process synthesis: Polynomial algorithm for maximal structure generation. Comput. Chem. Eng. 1993, 17, 929–942. [Google Scholar] [CrossRef]
  12. Tan, R.R.; Aviso, K.B.; Klemes, J.J.; Lam, H.L.; Varbanov, P.S.; Friedler, F. Towards generalized process networks: Prospective new research frontiers for the P-graph framework. Chem. Eng. Trans. 2018, 70, 91–96. [Google Scholar] [CrossRef]
  13. Tick, A.; Molnár, G. Improving Efficiency: P-Graph Modeling for Business Workflows with Dynamic and Fuzzy Extensions. Acta Polytech. Hung. 2025, 22, 79–100. [Google Scholar] [CrossRef]
  14. Rohman, F.S.; Alwi, S.R.W.; Er, H.A.; Ahmad Termizi, S.N.A.; Abd Manan, Z.; Lim, J.S.; Muhammad, D. Cogeneration system’s energy performance improvement by using P-graph and advanced process control. Chem. Prod. Process Model. 2025, 20, 1–37. [Google Scholar] [CrossRef]
  15. Lim, S.Y.; Chemmangattuvalappil, N.G.; Tapia, J.F.D.; Khoiroh, I.; Chai, P.V.; Ng, L.Y. Optimal chemical reaction pathway for palm process residue recovery using Process Graph (P-graph) framework. Comput. Chem. Eng. 2025, 194, 109000. [Google Scholar] [CrossRef]
  16. Aviso, K.B.; Marfori III, I.A.V.; Tan, R.R.; Ubando, A.T. Optimizing abnormal operations of off-grid community utility systems with fuzzy P-graph. Energy 2020, 202, 117725. [Google Scholar] [CrossRef]
  17. Pimentel, J.; Rodríguez, G.; Gil, I. Synthesis of Alternative Cost-Effective Process Flowsheets for Lactic Acid Valorization by Means of the P-graph Methodology. Ind. Eng. Chem. Res. 2020, 59, 5921–5930. [Google Scholar] [CrossRef]
  18. Vance, L.; Cabezas, H.; Heckl, I.; Bertok, B.; Friedler, F. Synthesis of Sustainable Energy Supply Chain by the P-graph Framework. Ind. Eng. Chem. Res. 2013, 52, 266–274. [Google Scholar] [CrossRef]
  19. Phuang, Z.X.; Sang, K.; Wang, X.C.; You, F.; Woon, K.S. Sustaining regional infrastructure resiliency with externality for plastic waste circularity via geospatially-enhanced P-graph-life cycle optimization framework. J. Clean. Prod. 2025, 486, 144413. [Google Scholar] [CrossRef]
  20. Bertok, B.; Barany, M.; Friedler, F. Generating and Analyzing Mathematical Programming Models of Conceptual Process Design by P-graph Software. Ind. Eng. Chem. Res. 2013, 52, 166–171. [Google Scholar] [CrossRef]
  21. Strouvalis, A.M.; Heckl, I.; Friedler, F.; Kokossis, A.C. An accelerated Branch-and-Bound algorithm for assignment problems of utility systems. Comput. Chem. Eng. 2002, 26, 617–630. [Google Scholar] [CrossRef]
  22. Belkhiri, H.; Chergui, M.E.A.; Ouaïl, F.Z. Optimizing a linear function over an efficient set. Oper. Res. 2022, 22, 3183–3201. [Google Scholar] [CrossRef]
  23. Bakhtari, A.R.; Waris, M.M.; Sanin, C.; Szczerbicki, E. Evaluating industry 4.0 implementation challenges using interpretive structural modeling and fuzzy analytic hierarchy process. Cybern. Syst. 2021, 52, 350–378. [Google Scholar] [CrossRef]
  24. Ba, Z.; Wang, Y.; Fu, J.; Liang, J. Corrosion risk assessment model of gas pipeline based on improved AHP and its engineering application. Arabian J. Sci. Eng. 2022, 47, 10961–10979. [Google Scholar] [CrossRef]
  25. Huang, M.Y.; Huang, L.Y.; Zhong, Y.X.; Yang, H.W.; Chen, X.M.; Huo, W.; Wang, J.Z.; Zhang, F.; Bai, B.; Shi, L. MILP acceleration: A survey from perspectives of simplex Initialization and learning-based branch and bound. J. Oper. Res. Soc. China 2025, 13, 1–55. [Google Scholar] [CrossRef]
  26. Tavana, M.; Soltanifar, M.; Santos-Arteaga, F.J. Analytical hierarchy process: Revolution and evolution. Ann. Oper. Res. 2023, 326, 879–907. [Google Scholar] [CrossRef]
  27. Hemmati, S.; Elnegihi, M.M.; Lee, C.H.; Chong, D.Y.L.; Foo, D.C.Y.; How, B.S.; Yoo, C. Synthesis of Large-Scale Bio-Hydrogen Network Using Waste Gas from Landfill and Anaerobic Digestion: A P-Graph Approach. Processes 2020, 8, 505. [Google Scholar] [CrossRef]
  28. Sitoh, Y.; Tan, V.W.G.; Tapia, J.F.D.; Tan, R.R.; Foo, D.C.Y. Optimal Pathways for Nitric Acid Synthesis Using P-Graph Attainable Region Technique (PART). Processes 2023, 11, 2684. [Google Scholar] [CrossRef]
  29. Ji, M.; Zhang, W.; Xu, Y.; Liao, Q.; Klemeš, J.J.; Wang, B. Optimisation of multi-period renewable energy systems with hydrogen and battery energy storage: A P-graph approach. Energy Convers. Manag. 2023, 281, 116826. [Google Scholar] [CrossRef]
  30. Pimentel, J.; Orosz, Á.; Aviso, K.B.; Tan, R.R.; Friedler, F. Conceptual Design of a Negative Emissions Polygeneration Plant for Multiperiod Operations Using P-Graph. Processes 2021, 9, 233. [Google Scholar] [CrossRef]
  31. Tóth, Á.; Suta, A.; Pimentel, J.; Argoti, A. A comprehensive, semi-automated systematic literature review (SLR) design: Application to P-graph research with a focus on sustainability. J. Clean. Prod. 2023, 415, 137741. [Google Scholar] [CrossRef]
  32. Friedler, F.; Varga, J.B.; Fan, L.T. Decision-mapping: A tool for consistent and complete decisions in process synthesis. Chem. Eng. Sci. 1995, 50, 1755–1768. [Google Scholar] [CrossRef]
  33. Ahn, J.; Kim, H.J. A branch and bound algorithm for scheduling of flexible manufacturing systems. IEEE Trans. Autom. Sci. Eng. 2024, 21, 4382–4396. [Google Scholar] [CrossRef]
  34. Friedler, F.; Varga, J.B.; Feher, E.; Fan, L.T. Combinatorially accelerated branch-and-bound method for solving the MIP model of process network synthesis. In State of the Art in Global Optimization; Springer: Boston, MA, USA, 1996; Volume 7, pp. 609–626. [Google Scholar] [CrossRef]
  35. Saaty, T.L. Deriving the AHP 1–9 scale from first principles. In Proceedings of the 6th ISAHP, Berna, Switzerland, 2–4 August 2001. [Google Scholar] [CrossRef]
  36. Roco, J.B.A.; Promentilla, M.A.B. Philippine Energy Network Design via an Integrated P-graph and Analytic Hierarchy Process (AHP) Framework. In Proceedings of the DLSU Research Congress 2022, Manila, Philippines, 6–8 July 2022; Available online: https://www.dlsu.edu.ph/wp-content/uploads/pdf/conferences/research-congress-proceedings/2022/SEE-05.pdf (accessed on 10 September 2025).
  37. Estrella, E.T.; Belaro, C.M.; Promentilla, M.A.B. Retrofitting of Cement Plant with Carbon Capture Technology and Emissions Trading Scheme (ETS): An Integrated P-Graph and AHP Approach. Chem. Eng. Trans. 2023, 103, 397–402. [Google Scholar] [CrossRef]
  38. Chen, Y.; Kuo, M.J.; Lobo, R.; Ierapetritou, M. Ethylene production: Process design, techno-economic and life-cycle assessments. Green Chem. 2024, 26, 2903–2911. [Google Scholar] [CrossRef]
  39. Cao, J.; He, Y.L.; Zhu, Q.X. Feedstock scheduling optimization based on novel extensible P-Graph reasoning in ethylene production. Ind. Eng. Chem. Res. 2020, 59, 18965–18976. [Google Scholar] [CrossRef]
  40. Eisman, E.M.; Navarro, M.; Castro, J.L. A multi-agent conversational system with heterogeneous data sources access. Expert Syst. Appl. 2016, 53, 172–191. [Google Scholar] [CrossRef]
  41. Xi, J.; Gong, H.; Zhang, Y.; Dai, X.; Chen, L. The evaluation of GHG emissions from Shanghai municipal wastewater treatment plants based on IPCC and operational data integrated methods (ODIM). Sci. Total Environ. 2021, 797, 148967. [Google Scholar] [CrossRef]
  42. Yu, X.; Tan, C. China’s process-related greenhouse gas emission dataset 1990–2020. Sci. Data 2023, 10, 55. [Google Scholar] [CrossRef]
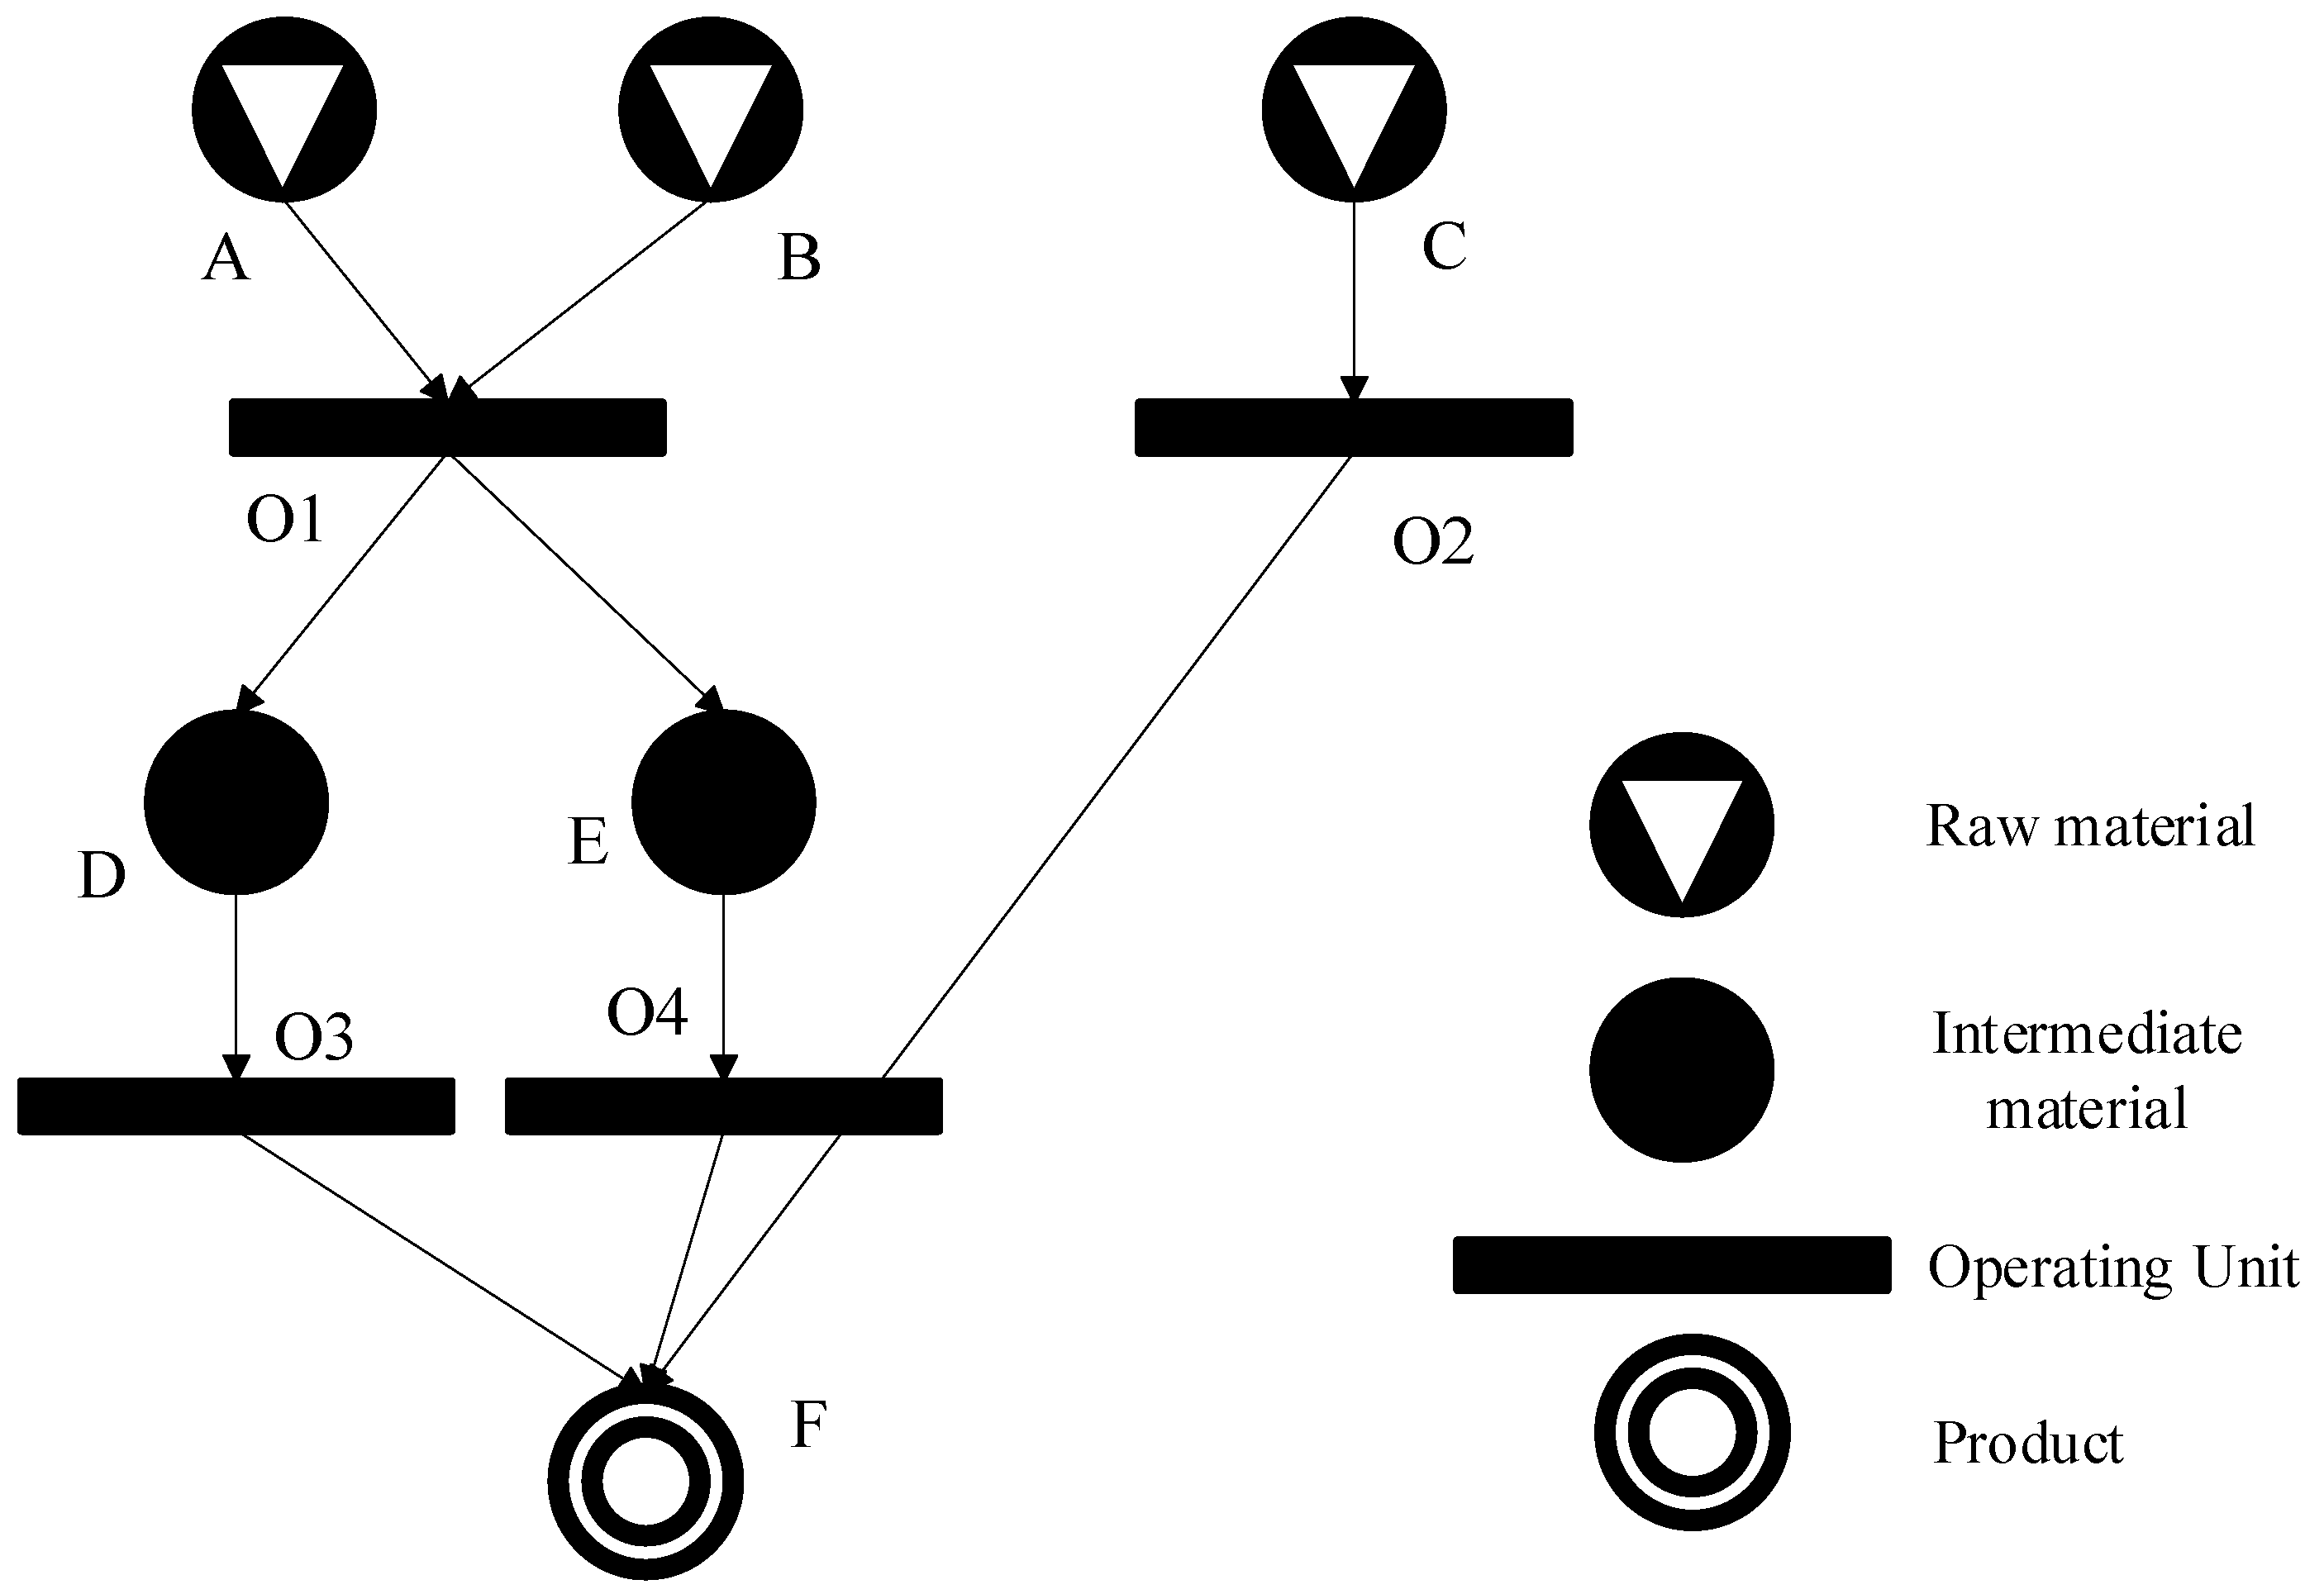
Figure 1. Superstructure modeling by P-graph.
Processes 13 02936 g001
Figure 2. Flowchart of the hierarchical accelerated branch and bound algorithm.
Processes 13 02936 g002
Figure 3. Hierarchical analysis structure.
Processes 13 02936 g003
Figure 4. Feedstock Scheduling Superstructure.
Processes 13 02936 g004
Figure 5. Feedstock Scheduling of four raw materials in plants A and B.
Processes 13 02936 g005
Figure 6. Consumption of raw materials for ten solutions.
Processes 13 02936 g006
Figure 7. Naphtha consumption of top-10 solutions.
Processes 13 02936 g007
Figure 8. Comparison of values of three indicators.
Processes 13 02936 g008
Figure 9. Percentage of weights at the criterions.
Processes 13 02936 g009
Figure 10. Comparison of AHP scoring by solution.
Processes 13 02936 g010
Figure 11. Optimal Solution#1.
Processes 13 02936 g011
Figure 12. Power consumption of atomic operating units for ten solutions.
Processes 13 02936 g012
Table 1. Expert scoring criteria.
Numerical RatingRelative Importance Between Elements i and j
1Equal importance
3i is slightly more important than j
5i is obviously more important than j
7i is extremely more important than j
9i is absolutely more important than j
2, 4, 6, 8The median of the adjacent judgments mentioned above
Reciprocal of 1–9The importance of comparing the exchange order between i and j
Table 2. The value of R.I.
Matrix Order123456789
R.I.000.580.901.121.241.321.411.45
Table 3. Status involved in production.
SubscriptContent
_AMaterial for plant A
_BMaterial for plant B
_MRemaining material after allocating to plant A and B
_0Raw status
_1Status after one month
_2Status after two months
1+Raw for second month
2+Raw for the third month
0_1Status after the first month
Table 4. Top-10 solutions of ABB.
SolutionLight
(g·y−1)
C5
(g·y−1)
NAP
(g·y−1)
HCR
(g·y−1)
Cost
(EUR·y−1)
S#1313,728.00153,817.00602,552.00309,120.0010,188,700.00
S#2313,728.00153,817.00630,553.00309,120.0010,189,900.00
S#3313,728.00153,817.00603,380.00303,960.0010,190,300.00
S#4313,728.00153,817.00631,381.00303,960.0010,191,400.00
S#5313,728.00153,817.00593,357.00309,120.0010,192,100.00
S#6313,728.00153,817.00621,358.00309,120.0010,193,200.00
S#7313,728.00153,817.00594,186.00303,960.0010,193,700.00
S#8313,728.00153,817.00622,187.00303,960.0010,194,800.00
S#9313,728.00117,836.80638,079.00309,120.0010,197,900.00
S#10313,728.00117,836.80638,907.00303,960.0010,199,500.00
# represents one of the sets of solutions generated by the ABB.
Table 5. CO2 Emission Factors for combustion.
Fuel TypeCarbon Content(kg/GJ)Carbon Oxidation FactorEffective CO2 Emission Factor(kg/TJ)
Default Value95% Confidence Interval
ABA·B·44/12 × 1000lowerupper
Gas/Diesel Oil20.1174,10072,60074,800
Liquefied Petroleum Gases17.2163,10061,60065,600
Ethane16.8161,60056,50068,600
Naphtha20.0173,30069,30076,300
Refinery Gas15.7157,60048,20069,000
Other Petroleum
Products
20.0173,30072,20074,400
Refinery
Feedstocks
20.0173,30069,30076,300
Table 6. Carbon emissions of Top-10 solutions.
SolutionCarbon Emissions (kg)
S#13395.7
S#23492.7
S#33384.0
S#43481.1
S#53363.8
S#63460.9
S#73352.2
S#83449.2
S#93416.2
S#103404.6
# represents one of the sets of solutions.
Table 7. Results of AHP.
Maximum EigenvalueC.R.Consistency
Rule 110.340.025True
Rule 210.860.064True
Rule 311.270.094True
Disclaimer/Publisher’s Note: The statements, opinions and data contained in all publications are solely those of the individual author(s) and contributor(s) and not of MDPI and/or the editor(s). MDPI and/or the editor(s) disclaim responsibility for any injury to people or property resulting from any ideas, methods, instructions or products referred to in the content.