Article

Development and Validation of a Simultaneous HPLC Stability-Indicating Method for Atorvastatin and Apigenin in a Novel SMEDDS Formulation Using Quality by Design (QbD) Approach

by
Sarmad Abdulabbas Kashmar
1,2,
Reem Abou Assi
3,*,
Muqdad Alhijjaj
4,5 and
Siok Yee Chan
1,*
1
School of Pharmaceutical Sciences, Universiti Sains Malaysia, Gelugor, Penang 11800, Malaysia
2
Al-Fayhaa Teaching Hospital, Basrah Health Directorate, Basrah 61001, Iraq
3
EDEN Research Group, Discipline of Pharmaceutical Technology, Department of Pharmacy, Al-Qabas College, Mosul 41002, Iraq
4
Department of Pharmaceutics, College of Pharmacy, University of Basrah, Basrah 61001, Iraq
5
Department of Pharmaceutics, College of Pharmacy, Al-Kunooze University, Basrah 61029, Iraq
*
Authors to whom correspondence should be addressed.
Processes 2025, 13(9), 2933; https://doi.org/10.3390/pr13092933
Submission received: 4 August 2025 / Revised: 28 August 2025 / Accepted: 1 September 2025 / Published: 14 September 2025

Abstract

Atorvastatin (ATV), a widely used statin, exhibits both cholesterol-lowering and anti-inflammatory effects. Apigenin (API), a natural flavonoid, also demonstrates potent anti-inflammatory activity. This study aimed to develop and validate a novel stability-indicating reverse-phase HPLC method for the simultaneous quantification of ATV and API in standard solutions and dual ATV–API-loaded self-microemulsifying drug delivery system (SMEDDS). Quality by Design (QbD) approach was used to define the quality target product profile (QTPP), critical quality attributes (CQAs), and identify critical method parameters (CMPs) through risk assessment. A central composite design (CCD) evaluated the effects of organic phase ratio, buffer pH, and flow rate on chromatographic responses, including retention time, tailing factor, and resolution. Separation was achieved using an Agilent Eclipse XDB C-18 column (5 µm, 4.6 × 150 min) with a mobile phase of acetonitrile and 0.1 M ammonium acetate buffer (pH 7.0) in a 40:60 (v/v) ratio, UV detection at 266 nm, and a flow rate of 0.4 mL/ min. The method met ICH and USP (2021) validation criteria, showing excellent linearity (0.1–10 µg/mL), precision, accuracy, and specificity. No interference from SMEDDS excipients or degradation products during stability studies was observed. This validated method offers a reliable tool for formulation development and routine analysis of ATV and API combinations

1. Introduction

Atorvastatin (ATV) (Figure 1) is a synthetic lipid-lowering medication belonging to the class of statins. It acts by blocking the action of the enzyme 3-hydroxy-3-methylglutaryl Co-enzyme A (HMG-CoA) reductase; it is a monocarboxylic acid with a relatively weak acidity (pKa of 4.5) and falls under class II of the Biopharmaceutical Classification System (BCS II) [1]. ATV has low aqueous solubility (0.1 mg mL−1) but excellent intestinal permeability. It is a polar molecule with a molecular weight of 1155.342 g mol−1 and a log P of 6.98 [2]. ATV has gained significant attention in the pharmaceutical industry due to its remarkable efficacy in treating hyperlipidemia. It is often recommended to decrease elevated low-density lipoprotein (LDL) cholesterol levels in individuals with hyperlipidemia.
ATV effectiveness is impacted by several factors, including its poor solubility in water, clearance through the gastrointestinal mucosa before reaching systemic circulation, and metabolism in the liver during the first pass. As a result, the drug’s absolute bioavailability is only about 14%, while the systemic availability of its HMG-CoA reductase inhibitory activity is limited to approximately 30% [3,4].
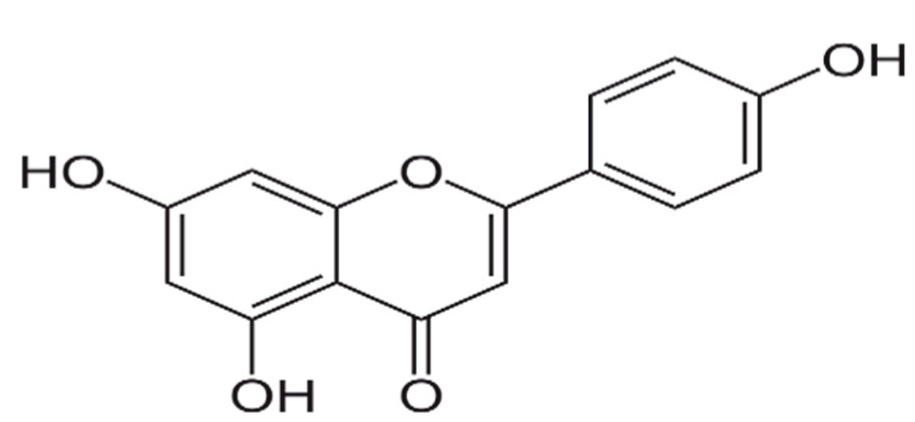
On the other hand, Apigenin (API) (Figure 2) is a naturally occurring polyphenolic flavone extracted from the Apium genus of the Apiaceae family, also known as the parsley family or the carrot and celery family (Umbelliferae). API appears as a yellow crystalline powder and is sparingly soluble in water (0.00135–1.63 mg mL−1). It has a molecular weight of 270.24 g mol−1, log P of 2.87, and pKa 6.57 [5,6]. Despite its poor water solubility, it showed a fast permeability through the physiological barrier; hence, it is considered as BCS II [7]. API has a diverse array of biological activities, including immunomodulator, anti-cancer, antioxidant properties, and a comparable anti-inflammatory effect to diclofenac in an osteoarthritis rat.
API acts by inhibiting the production of nitric oxide and prostaglandins by blocking the enzymes inducible nitric oxide synthase and cyclooxygenase-2, respectively. It also reduced inflammatory cytokines like interleukin (IL-6) and tumor necrosis factor-alpha (TNF-α) with anti-inflammatory effects that are comparable to diclofenac [8]. Studies have demonstrated that the concurrent use of statins with flavonoids leads to increased suppression of cell growth and induction of apoptosis, as well as decreased cancer cell proliferation, compared to the administration of statins alone [9]. For instance, pre-treatment of ATV and quercetin individually and in combination resulted in significant anti-inflammatory effects, as evidenced by a profound suppression of inflammatory markers TNF-α, IL-10, and C-RP, as well as cardiac lipid peroxides [10]. Furthermore, the conjugation of ATV with curcumin in a nanocrystal formulation offered an improvement in the anti-inflammatory effect [11]. Thus, as an ATV and API combination, based on their ability to reduce cytokine production and inhibit oxidative stress, would provide a promising, complementary, and potentially synergistic anti-inflammatory treatment compared to conventional anti-inflammatory drugs, considering the safety profiles of both compounds.
To address the low bioavailability of ATV and API, lipid-based formulations, particularly self-microemulsifying drug delivery systems (SMEDDS), have been proposed to enhance their delivery. SMEDDS are isotropic mixtures that spontaneously form upon mild agitation and consist of oil, surfactant, and co-surfactant or cosolvent [12]. These formulations offer a suitable platform for delivering various compounds with poor water solubility [13,14]. The advantages of these systems include their simplicity, thermodynamic stability, drug loading capacity, and suitability for drugs with a partition coefficient of log P > 2 [15]. As a result, SMEDDS presents an effective formulation for improving the solubility of ATV–API, providing a potent oral anti-inflammatory formulation with an enhanced delivery mechanism [16,17].
A few nano-formulations were developed to enhance the drugs therapeutic via improving the physicochemical property of solubility. This includes ATV nanocrystals, ATV lipid-based nanocapsules, and ATV gold nanoparticles [18,19], API nanosuspension, and API-loaded hybrid nanoparticles. Interestingly, all these nano-formulations were analyzed spectrophotometrically [20,21].
Moreover, various analytical techniques were investigated to identify and quantify either ATV or API in the pharmaceutical dosage forms, including solid form (tablets and phytosome powder aggregates) for ATV and API, respectively. These methods include spectrophotometric ion pair complexation techniques, spectrophotometric analysis, and near-infrared diffuse reflectance spectroscopy [22,23]. Other methods used for quantifying ATV and API include LC-MS/MS [24,25] and UPLC-MS/MS [26], in addition to pharmaceutical dosage form quantification by thin-layer chromatography–densitometry [27]. However, compared to a simple HPLC-UV method, the aforementioned techniques are either costly, labor-intensive, or time-consuming. Furthermore, both ATV and API were analyzed via the reverse-phase HPLC-UV approach separately. This includes ATV in solidified SMEDDS and tablet dosage form [24,28], as well as API, and was reported to be quantified by reverse-phase HPLC methods in powder and bulk powder in liposomes [29,30].
The Quality by Design (QbD) approach was employed to establish a sensitive, robust method. QbD is a systematic framework for developing robust, reproducible HPLC methods that prioritize proactive quality integration over reactive testing. Highlighted in regulatory guidelines like ICH Q8 (R2), Q11, the QbD shifts from traditional trial-and-error approaches to data-driven strategies that ensure compliance with Good Manufacturing Practices (GMP) and pharmaceutical quality standards [31]. The novelty of this work lies in the simultaneous quantification of ATV and API within a single SMEDDS lipid-based oral formulation. This represents a new fixed-dose combination and provides a practical, time-efficient approach for quality control assessment. The method enables precise quantification of ATV and API in standard stock solutions, SMEDDS lipid-based formulations, and marketed formulations (i.e., tablet, capsule). Additionally, stress degradation analysis was performed to validate the method’s stability. In addition, the method’s robustness was evaluated for changes in wavelength, pH, flow rate, and mobile phase composition.

2. Materials and Methods

2.1. Chemicals and Reagents

Atorvastatin calcium (purity 99%) and Apigenin procured from Hebei Lingding Biotechnology Co., Ltd. (Shijiazhuang, China). Lipitor® (10 mg) Pfizer USA, Apigenin® (50 mg) from the Buporai® brand were purchased from a local pharmacy. Acetonitrile was purchased from J.T. Baker, (Radnor, PA,, USA). Ammonium acetate was bought from Bendosen Laboratory Chemicals (Negeri Sembilan, Malaysia). Methanol, acetonitrile, and dimethyl sulfoxide (DMSO) of HPLC grade were obtained from Fisher Scientific, J.T. Baker (Radnor, PA, USA). Glacial acetic acid was purchased from R & M Marketing (Essex, UK). Transcutol HP® (diethylene glycol monoethyl ether), Cremophor RH40® (polyethylene glycol-40 hydrogenated castor oil), and Capmul MCM were purchased from Xingati Xingjiu New Material Technology Co., Ltd. (Guangzong, China). All other chemicals used were either of analytical reagent or HPLC grade.

2.2. Instrumentation and Program Software

The analysis method was carried out using a Shimadzu HPLC liquid chromatography system (VP series, Kyoto, Japan) with CBM/20A system controller, solvent delivery pump (LC-20AD), UV/VIS detector (SPD-20A), auto-sampler (SIL-20A), and column oven system (CTO-10AS). The acquisition of data and analysis was achieved using Shimadzu LabSolutions® software (version 5.30 SP1) (Kyoto, Japan) installed on a desktop computer. The sample injected volume was 10 μL, used in all the experiments.

2.3. Design of Experiments (DoE) Software

The experiment of design, central composite design (CCD), desirability function, and data analysis calculations were performed by using Design Expert® (Version 13.0, Stat-Ease Inc., Minneapolis, MN, USA).

2.4. Preparation of Stock Solution, Standard Calibration Solution, and Quality Control Solutions

A standard stock solution of ATV and API was prepared by accurately weighing 5 mg of each compound using a Sartorius microbalance (Goettingen, Germany). Each weighed sample was transferred separately into a 10 mL volumetric flask separately, adding 5 mL of methanol and DMSO for ATV and API, respectively. Then, vortexing for 5 min occurred, and sonication via a water bath sonicator (Branson 5510, from Emerson, Bakersfield, CA, USA) for 15 min to ensure complete dissolution of the drug. Finally, adjust the volume to 10 mL for each compound with its corresponding solvent to obtain a standard stock solution with a concentration of 500 µg mL−1. The standard stock solution is further diluted with the corresponding solvent for each compound to create working stock solutions of 50 µg mL−1 for calibration concentrations. The prepared solutions were covered with aluminum foil and stored at 4 °C for further use. The calibration curve solution concentrations ranged between 0.1, 0.5, 1, 2, 4, 5, and 10 μg mL−1 for both ATV and API prepared from the working stock solution and diluted with the corresponding solvent. Every solution was injected into the HPLC system in triplicate. The standard calibration curve for each constituent was obtained by graphing the peak regions versus corresponding concentrations. Quality control solutions (QC) at three (low, medium, and high) concentrations of 0.5, 5, and 10 µg mL−1 were prepared from the calibration curve for ATV, and 1, 5, and 10 µg mL−1 for API by further dilution to the working stock solution.

2.4.1. Preparation for ATV–API SMEDDS

The SMEDDS formulation preparation involved accurately weighing 20 mg from both ATV and API and then dissolving them into already prepared SMEDDS (1 mL), which consists of Capmul MCM (oil phase), Cremophor RH40 (as surfactant), and Transcutol HP (co-surfactant). In brief, 20 mg of ATV and 20 mg of API as a fixed-dose combination were dissolved into the prepared blank SMEDDS and vortexed well to ensure homogeneity. Subsequently, the mixture was kept in a water bath shaker overnight at 40 °C, to accomplish the drug dissolving into SMEDDS [32].

2.4.2. Sample Preparation (Assay)

Ten tablets of ATV (Lipitor® 10 mg) were finely pulverized and accurately mixed with the contents of ten capsules of API (Apigenin® 50 mg), following precise weighing. From the resulting powder blend, an equivalent amount corresponding to 10 mg of each drug was accurately weighed and transferred to a 10 mL volumetric flask for extraction. Five mL of the diluent, methanol for ATV and DMSO for API, was added and sonicated in the water bath for 30 min to ensure complete dissolution, then the diluent was added up to prepare a stock solution of 1000 µg mL−1. Subsequently, the solution was filtered using a 0.45 µm Whatman filter paper and stored in a flask covered with foil at 4 °C for further analysis.

2.5. Wavelength Selection

For wavelength detection, both ATV and API were prepared in 100 µg mL−1 solution and scanned by UV spectrophotometry (PerkinElmer SP-UV 300 from PerkinElmer, Waltham, MA, USA) in an overlaid spectrum at 400–200 nm range and selecting the optimum common wavelength.

2.6. Method Optimization

Preliminary studies were conducted to select the optimum organic phase, and acetonitrile (ACN) was superior to methanol for good resolution and peak asymmetry, and ammonium acetate buffer (0.1 M, pH 6.8) was selected as the aqueous phase. All mobile phase components were subjected to filtration through a 0.45 µm membrane and degassed via ultrasonication to eliminate dissolved gases prior to use. The analysis was conducted at ambient temperature.

2.7. Method Development by QbD

2.7.1. Analytical Performance Objectives

The primary aims were to first enhance the chromatographic conditions to improve the chromatogram’s quality in terms of resolution and tailing factor, and second, to effectively apply the developed method for estimating ATV and API in SMEDDS loaded with dual drugs [33].

2.7.2. Risk Parameters Assessment

Risk assessment framework per ICH Q9 is defined as a systematic process for the assessment, control, communication, and review of risks to quality throughout the product lifecycle. Within the QbD paradigm, this stage is implemented to establish a quantifiable assurance of method reliability [34].
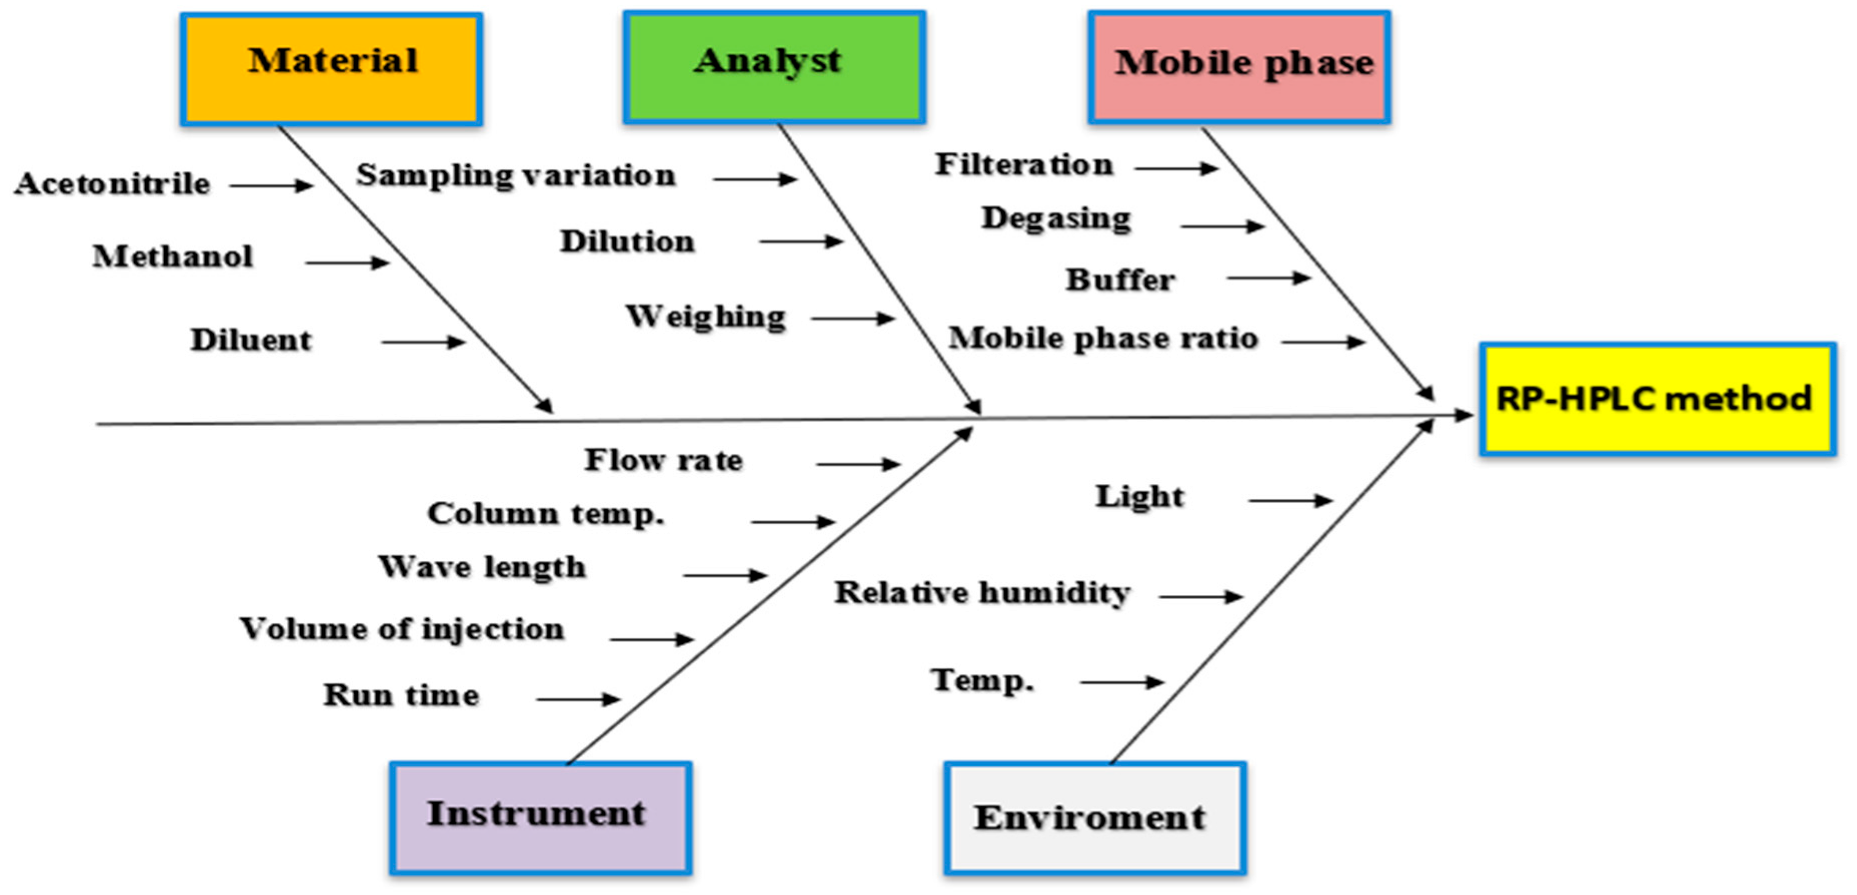
The study aimed to identify the potential risk parameters of CMPs. The method performance parameters were identified based on the preliminary experiments and prior knowledge of HPLC development studies. Initially, the critical risk parameters were identified. All possible factors that influence method outcomes and method development were evaluated. These parameters were systematically varied to assess their impact on performance attributes, such as retention time, peak asymmetry, and resolution. To visualize the relationship between risk parameters and performance attributes, a fishbone diagram was constructed [31,35]. Subsequently, each risk parameter was assessed based on severity, occurrence, and detectability concerning method performance. The risk priority number (RPN) method was employed to quantify risk potency. The RPN was determined by multiplying the values of severity, occurrence, and detectability assigned for each risk parameter. Finally, the RPN scores were plotted against the method performance to classify risk into low, medium, and high-risk levels [31,36].

2.7.3. Determine the Quality Target Product Profile (QTPP)

The QTPP represents the basic form for the method development as per ICH Q8 (R2). For analytical method development, the QTPP functions as a defining framework for specifying the variables required to achieve the intended quality characteristics and purpose of the analytical procedure. The QTPP encompasses factors related to the analyst, the sample, and the analytical techniques to be employed, thereby providing a structured basis for method design and optimization [37,38].
For the proposed HPLC method, retention time, tailing factor, and resolution were selected as key QTPP parameters. These parameters ensure adequate separation, peak shape, and reproducibility necessary for reliable quantification. Retention time reflects analyte elution consistency, tailing factor indicates peak symmetry impacting accuracy, and resolution confirms separation efficiency to avoid co-elution [39,40].

2.7.4. Determine Critical Quality Attributes (CQAs)

A Critical Quality Attribute (CQA) is defined, in accordance with ICH Q9, as a physical, chemical, biological, or microbiological property or characteristic that must be maintained within a specified limit, range, or distribution to ensure the intended quality of the product [41]. These CQAs are crucial for ensuring the reliability and robustness of chromatographic methods. The retention time ensures consistent and reproducible elution of analytes, critical for accurate identification. The tailing factor reflects peak symmetry, which has a direct impact on peak integration and quantification accuracy, where values close to 1 indicate ideal symmetrical peaks. Resolution represents the degree of separation between adjacent peaks, preventing overlap and ensuring the specificity of the method. Thus, the selected CQAs for this study were tailing factor (Tf), retention time (Rt), and resolution (Rs) [33,35,37].

2.7.5. Determine Critical Method Parameters (CMPs)

CMPs are method-related factors that have a significant influence on one or more CQAs. These parameters are identified through risk assessment, concerning the impact on method suitability [31,33,35,39,42].

2.7.6. DoE Based on Risk Assessment Method

Risk assessment identified the mobile phase composition, buffer pH, and flow rate as high-priority CMPs because of their substantial effect on the CQAs (Rt, Tf, and Rs). These CMPs were systematically optimized using a DoE framework based on a CCD. The optimization process aimed to establish an operable range for each CMP that would consistently meet the predefined CQAs acceptance criteria, thereby ensuring robust chromatographic performance. A three-factor CCD at three coded levels (−1, 0, and +1) was applied to model quadratic response surfaces and fit a second-order polynomial equation [43]. The selected factors and their respective levels are presented in Table 1.
The CCD would help in systematic interactions evaluation and method optimization. The selected response was most appropriately described by a second-order polynomial model, characterizing the quadratic form of the response surface [43,44,45], and formulated as
Y = β0 + β1 A + β2 B + β3 C + β11 A2 + β22 B2 + β33 C2 + β12 AB + β13 AC + β23 BC
where A, B, and C are independent variables (CMPs) coded for levels, Y is the predicted response associated with every combination of factor levels, β0 is an intercept, β1, β2, and β3 are linear coefficients, β11, β22, and β33 are quadratic coefficients, and β12, β13, and β23 are interaction coefficients. The 3D surface response plot for each of the CMPs was counted to show its effect on the desired parameter CQAs; also, the desirability of the method was applied to predict the CQAs.

2.7.7. Analysis of Experimental Results and Determination of Optimal Method Conditions

Multivariate analysis using ANOVA based on regression coefficient analysis was conducted to verify the predicted responses with experimental values and select a suitable model for method optimization.

2.8. Method Validation

HPLC method validation is important to ensure the analytical method is reliable, accurate, and reproducible for its intended purpose, and is critical for quality control, regulatory compliance, and decision-making in pharmaceutical development and manufacturing. The developed method underwent thorough validation regarding specificity, as the method includes a stability study, system suitability, linearity, limit of detection (LOD), limit of quantification (LOQ), precision, accuracy, and robustness, following ICH criteria [46].

2.8.1. Specificity

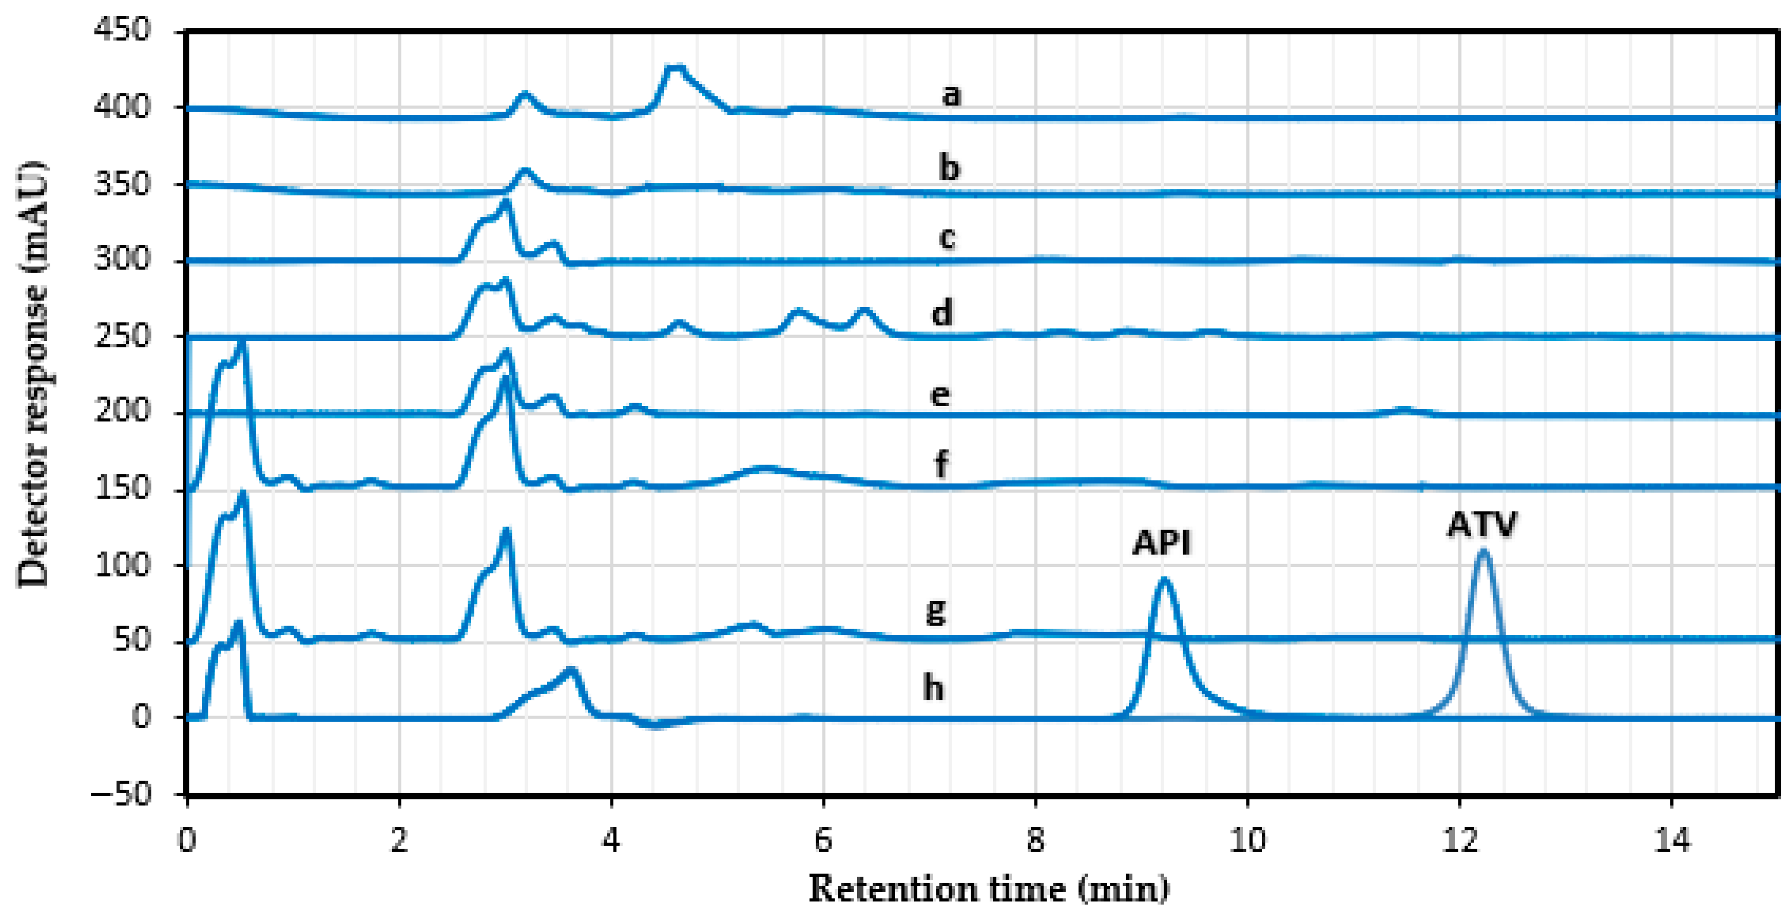
Specificity was confirmed by demonstrating the method ability to distinctly separate ATV and API from each other and from formulation excipients without interference [47]. The test was conducted using blank SMEDDS, SMEDDS loading ATV–API, corresponding solvents used for calibration, and in vitro release medium (phosphate buffer pH 6.8), as well as individual excipients used for SMEDDS formulation.

2.8.2. System Suitability

The suitability of the system research assessed the performance and repeatability of the analytical technique. To validate this, the analytical parameters, including theoretical plate number (NTP), resolution (Rs), retention time (Rt), and tailing factor (Tf), were measured using the medium (QC) concentration in six duplicate injections. This evaluation ensures that the chromatographic system performs reliably before sample analysis and that the developed method can produce reproducible and accurate results throughout the study.

2.8.3. Linearity

A calibration curve for ATV–API had been established by implementing a standard stock solution at a concentration of 500 µg mL−1 for each compound. This solution was then diluted with methanol and DMSO for ATV and API, respectively, to create a series of distinct solutions with concentrations ranging from 0.1 to 10 µg mL−1.

2.8.4. Accuracy

The accuracy of the method was confirmed by spiking different known quantities of ATV and API into the SMEDDS matrix [35,43,48]. Briefly, 0.5 mL of blank SMEDDS was diluted with 10 mL of methanol, followed by the addition of 4 mg, 5 mg, and 6 mg each of ATV and API, which represent (80%, 100%, and 120% of the target concentration). This mixture was stirred continuously for 30 min, then subjected to ultrasonic treatment in a water bath for 20 min. Later, 1 mL of the filtrate was further diluted to 100 mL with methanol. Finally, the solution was filtered using a 0.2 µm nylon membrane filter, yielding a final concentration of 4 µg mL−1, 5 µg mL−1, and 6 µg mL−1. The quantity of each medication was estimated using previously created calibration curves. Mean percentage of recovery and% RSD ± S.D were obtained to assess accuracy, calculated as
%   R e c o v e r y = C a l c u l a t e d   c o n c e n t r a t i o n N o m i n a l   c o n c e n t r a t i o n   × 100 %

2.8.5. Precision

The precision of the developed method has been established via the evaluation of intra-day and inter-day precision. Three sets of quality control (QC), including the low, medium, and high concentrations within the calibration range of ATV and API, were injected in triplicate simultaneously on the same day to evaluate intra-day repeatability. The inter-day precision was evaluated by injecting the three QC sets across six distinct days and preparing a fresh sample daily. QC solutions of ATV and API at three concentration levels (0.5, 5, and 10 µg mL−1) for ATV and (1, 5, and 10 µg mL−1) for API were analyzed in triplicate to evaluate precision for each intra-day and inter-day measurement, as per ICH guidelines [46]. The percentage recovery and relative standard deviation (% RSD) were calculated to assess precision,% RSD calculated as follows:
%   R S D = S t a n d a r d   d e v i a t i o n M e a n   v a l u e × 100 %

2.8.6. Determining LOD and LOQ

LOD represents the smallest concentration of a sample that can be detected with a particular level of confidence. The LOQ indicates the minimum quantity of a substance that can be reliably measured. Both LOD and LOQ are evaluated using the signal-to-noise ratio approach. For LOD, the signal-to-noise ratio acceptable range for detection is 3:1, while for LOQ, the acceptable range is at least 10:1 [46,49]. The calculation of LOD and LOQ regarding the standard deviation of response and the slope of the calibration curve is as follows:
L O D = 3.3           σ       S
L O Q = 10           σ       S
where σ represents the standard deviation of response, and S represents the slope of the calibration curve.

2.8.7. Robustness

To validate a liquid chromatographic technique, assessing robustness involves intentionally making small-scale modifications to optimized chromatographic parameters [47]. The reliability of the current HPLC method was evaluated by making slight alterations at three levels (−, 0, and +). These modifications included varying the wavelength by ±2 nm, the mobile phase composition by ±0.05, the flow rate by ±0.2, and adjusting the mobile phase pH by 0.2 using a few drops of glacial acetic acid or 0.1 M ammonium hydroxide. This systematic evaluation ensures the method’s stability and performance under minor variations in conditions [50].

2.9. Stress Degradation Study

In the stress degradation analysis, a QC solution of 5 µg mL−1 was selected for both ATV and API. This was achieved by extracting 1 mL from a 50 µg mL−1 working stock solution and placing it in a 10 mL flask. The flask was then filled with the appropriate diluted solvent for each compound. The procedure was applied to the SMEDD sample (20 mg mL−1) utilizing methanol as the diluting solvent to generate diluted SMEDDS of equivalent concentrations to the pure drug at the QC concentration of 5 µg mL−1. Moreover, the stress study parameters were adjusted based on preliminary research and literature references to ensure that degradation remains below 20% and closely mimics real conditions [51].

2.9.1. Acid and Alkaline Hydrolysis

The hydrolysis study protocol utilized two sets of three 10 mL flasks. In each set, 1 mL of ATV, API 50 µg mL−1 working stock solution, and 1 mL of diluted SMEDDS-loaded ATV–API was the equivalent of 50 µg mL−1, whereas it resulted in 5 µg mL−1 when completing the volume to 10 mL with the corresponding diluent. They were placed in separate flasks for stress testing. To begin acidic hydrolysis (zero-time samples), 1 mL of 1 mM HCl was introduced to individual flasks. Immediate neutralization was carried out using an equivalent amount of 1 mM NaOH, followed by the addition of methanol or DMSO to fill the flask. These mixtures were then thoroughly combined, filtered, and injected into the HPLC system.
For 24 h samples, using the second set of 10 mL flasks, 1 mL of the stress studies working stock solution of ATV, API, and SMEDDS-loaded ATV–API was combined with 1 mL of 1 mM HCl in each flask. This mixture was kept in closed ambient containers at room temperature (25 °C) and approximately 65% relative humidity for 24 h. Afterwards, these solutions underwent neutralization with 1 mM NaOH and dilution following the same procedure as the zero-time samples. The alkaline degradation study followed the same protocol as the acid study, where 1 mL of 1 mM NaOH was introduced to the first individual flasks. Immediate neutralization was carried out using an equivalent amount of 1 mM HCl, followed by the addition of methanol or DMSO to fill the flask. For 24 h samples using the second set of 10 mL flasks, 1 mL of the stress studies working stock solution of ATV, API, and SMEDDS-loaded ATV–API was combined with 1 mL of 1 mM NaOH in each flask. This mixture was kept in closed ambient containers at room temperature (25 °C) and approximately 65% relative humidity for 24 h. Afterwards, these solutions underwent neutralization with 1 mM HCl and dilution following the same procedure. Each sample was examined in triplicate, with results reported as the mean ± standard deviation.

2.9.2. Oxidative Degradation Study

This research utilized two sets of three 10 mL flasks. In the first set, 1 mL of each ATV, API (50 µg mL−1) working stock solution, and 1 mL of the diluted SMEDDS-loaded ATV–API (50 µg mL−1) was added, followed by 1 mL of 3% (v/v) H2O2. The mixture was then diluted to 10 mL with the appropriate solvent, vortexed, filtered, and analyzed using HPLC. This set was designated for zero-time samples. For the 24 h set, 1 mL of ATV, API working solution, and diluted SMEDDS-loaded ATV–API was individually added to separate 10 mL flasks. After adding 1 mL of 3% (v/v) H2O2 to each flask and mixing thoroughly, the solutions were left at room temperature (25 °C) and approximately 65% relative humidity. These samples were then processed similarly to the zero-time set before HPLC analysis. Each sample was examined in triplicate, with results reported as the mean ± standard deviation.

2.9.3. Photolytic Degradation Study

The study involved two sets of three 10 mL volumetric flasks, each containing 1 mL of ATV, API working stock solution (50 µg mL−1), and diluted SMEDDS-loaded ATV–API (50 µg mL−1). For the zero-time sample, the first set of flasks was immediately filled to the mark with the appropriate dilution solvent, vortexed, filtered, and analyzed using HPLC. The 24 h sample utilized the second set of flasks, which were exposed to UV light at 365 nm wavelength in an ultraviolet chamber (Ultra-Lum, Inc., Claremont, CA, USA). After exposure, these samples were processed similarly to the zero-time samples for analysis. Each sample was examined in triplicate, with results reported as the mean ± standard deviation.

2.9.4. Thermal Degradation Study

Individual 1 mL samples of ATV, API working stock solution (50 µg mL−1), and diluted SMEDDS-loaded ATV–API (50 µg mL−1) were transferred to separate 10 mL volumetric flasks. Each flask was immersed in a water bath preheated to 80 °C and maintained at this temperature for 2 h. After removal, the samples were allowed to cool to room temperature, and their volumes were adjusted to the required level using the appropriate dilution solvent. Subsequently, the samples were subjected to vortexing and filtration before HPLC analysis. Each sample was examined in triplicate, with results reported as the mean ± standard deviation.

3. Statistical Analysis

All the data are presented as mean ± standard deviation (SD). A one-way analysis of variance (ANOVA) was conducted to assess the statistical significance of the datasets, followed by Tukey’s HSD (honest significant difference) performed using IBM SPSS Statistics 27.0 software. A 95% confidence interval was considered statistically significant. To assess the statistical significance, p-values of * p < 0.05 were used.

4. Results

4.1. Wavelength Detection

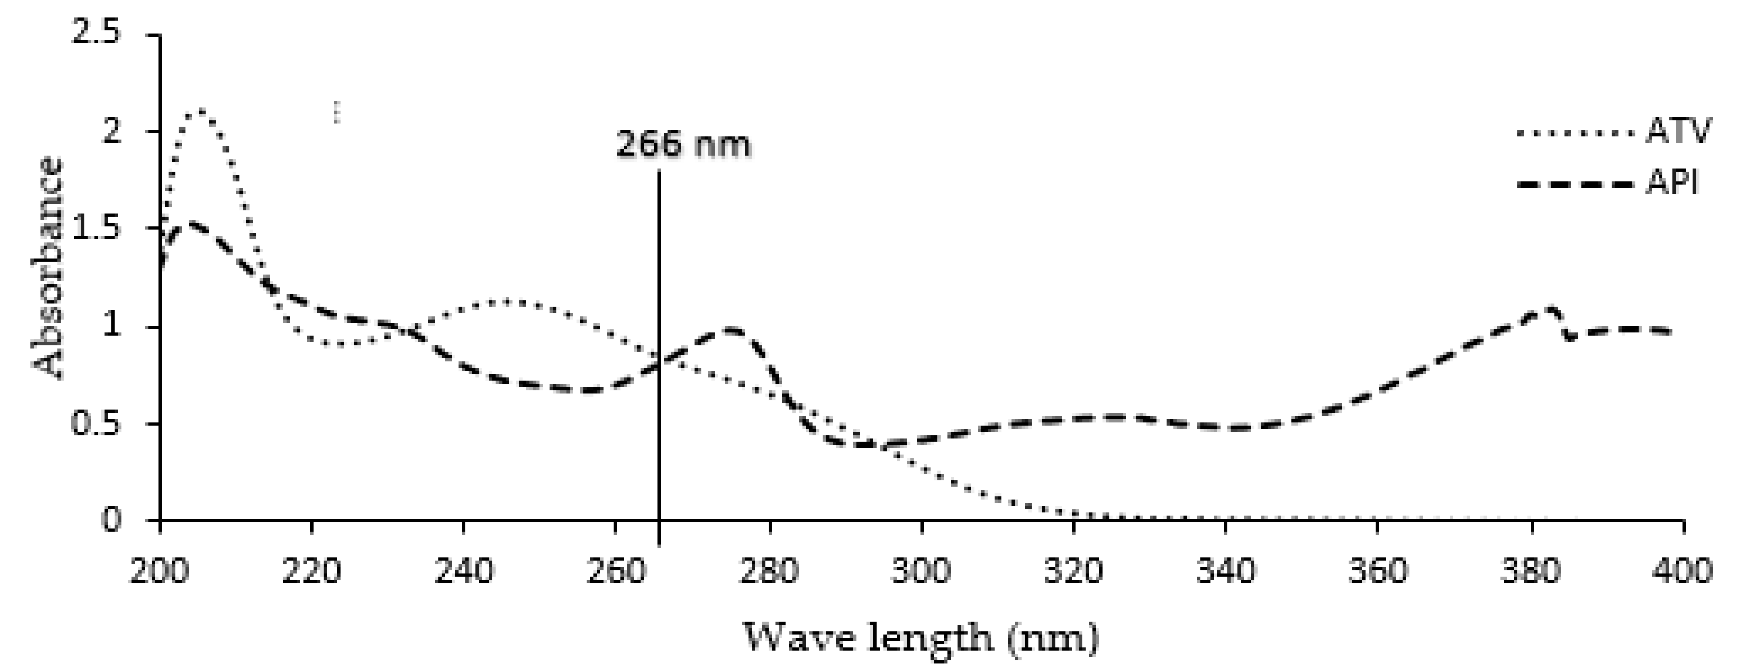
To perform a QbD analysis for simultaneous quantification, the selection of a single sensitive wavelength was necessary. A UV-Vis spectrophotometer was employed to record the spectra of ATV and API. Preliminary studies were conducted using freshly prepared standard solutions, each containing 100 µg mL−1 of the respective compound, which were scanned over a wavelength range of 200–400 nm, as illustrated in Figure 3. The obtained spectra were subsequently overlaid. The individual maximum absorption wavelengths were identified as 207 nm and 247 nm for ATV, and 205 nm, 277 nm, and 384 nm for API.
To establish a common wavelength suitable for the simultaneous determination of both compounds, potential isosbestic points (214, 234, 266, 284, and 296 nm) were screened. Among these, 266 nm was selected as the optimal wavelength based on preliminary analysis. This choice was justified by the more pronounced and distinct absorption peaks exhibited by both ATV and API at 266 nm, which minimized potential interference from excipients. Consequently, 266 nm was determined to be the most appropriate wavelength for use in the analytical method [33,52].

4.2. Risk Assessment

A structured risk assessment was conducted to identify potential sources of variation impacting the CQAs [53]. Method responses, including retention time, peak asymmetry, and resolution, were defined as critical attributes of CQAs. Potential influencing factors were organized using a fishbone diagram (Figure 4) and systematically analyzed through the risk assessment matrix (RAM) approach [35,54], enabling identification of CMPs with the highest impact on method performance.
The fishbone diagram (Figure 4) categorizes potential risks into five main domains: materials, analyst, mobile phase, instrument, and environment. Each category was further broken down into possible risk elements, including solvent purity and diluent choice (materials), sampling variation and weighing (analyst), buffer, filtration, degassing, and organic phase ratio (mobile phase), as well as flow rate, injection volume, column temperature, wavelength, and run time (instrument). Environmental factors such as light, relative humidity, and temperature were also considered. Following a structured risk ranking analysis, the flow rate, organic phase ratio, and buffer pH were identified as the CMPs with the highest impact on CQAs; other factors, while recognized as potential risks, were found to have relatively lower criticality and were fixed at controlled levels during subsequent method optimization (Table 2).
This assessment utilized an Agilent Eclipse XDB C-18 column (5 µm, 4.6 × 150 mm) as the stationary phase. Furthermore, these parameters have a high impact on the CQAs, which will be used in the DoE.

4.3. Method Development and Optimization

According to the literature, methanol and acetonitrile are the most used organic solvents in HPLC quantification methods for ATV and API individually, with C18 columns also frequently employed [55,56]. Considering the physicochemical properties of the analytes, it is evident that API is more hydrophilic than ATV. As a result, API is eluted faster than ATV due to its weaker interaction with the nonpolar stationary phase of the C18 column. Based on these characteristics, the initial mobile phase composition was set at a 50:50 (v/v) ratio of organic to aqueous phase, which achieved a clear separation of both compounds. However, when the organic phase proportion was increased beyond 50% (v/v), separation deteriorated, as demonstrated in Figure 5. Consequently, it was decided to maintain the organic phase ratio within the range of 30–50% (v/v). Further enhancement of peak shape and symmetry was achieved by adjusting the pH, with preliminary trials indicating that good resolution was obtained within the pH range of 5.8 to 7.8 using glacial acetic acid and ammonium hydroxide (0.1 M) for adjusting the pH.

4.4. Optimizing the Risk Assessment Method by CCD

After conducting the risk assessment method, the parameters with a high degree of risk-method optimization were selected as follows: organic phase ratio (A), pH of the buffer (B), and flow rate (C). The critical method attributes as responses were selected based on preliminary trials and sound science [39,40]. The influential risk parameters optimization was conducted by DoE-based CCD. The DoE software recommended seventeen experimental runs, including three center point replicates [35]. The center point replicates indicate reproducibility and enhances the experimental design [35]. All the runs and their results were conducted accordingly, as presented in Table 3. The resulting data were analyzed using multivariate ANOVA and regression analysis. Statistical data, including model determination, predicted versus actual plots, ANOVA, lack-of-fit tests, and response surface plots, were gathered for each Rt, Tf, and Rs for ATV and API individually [33].
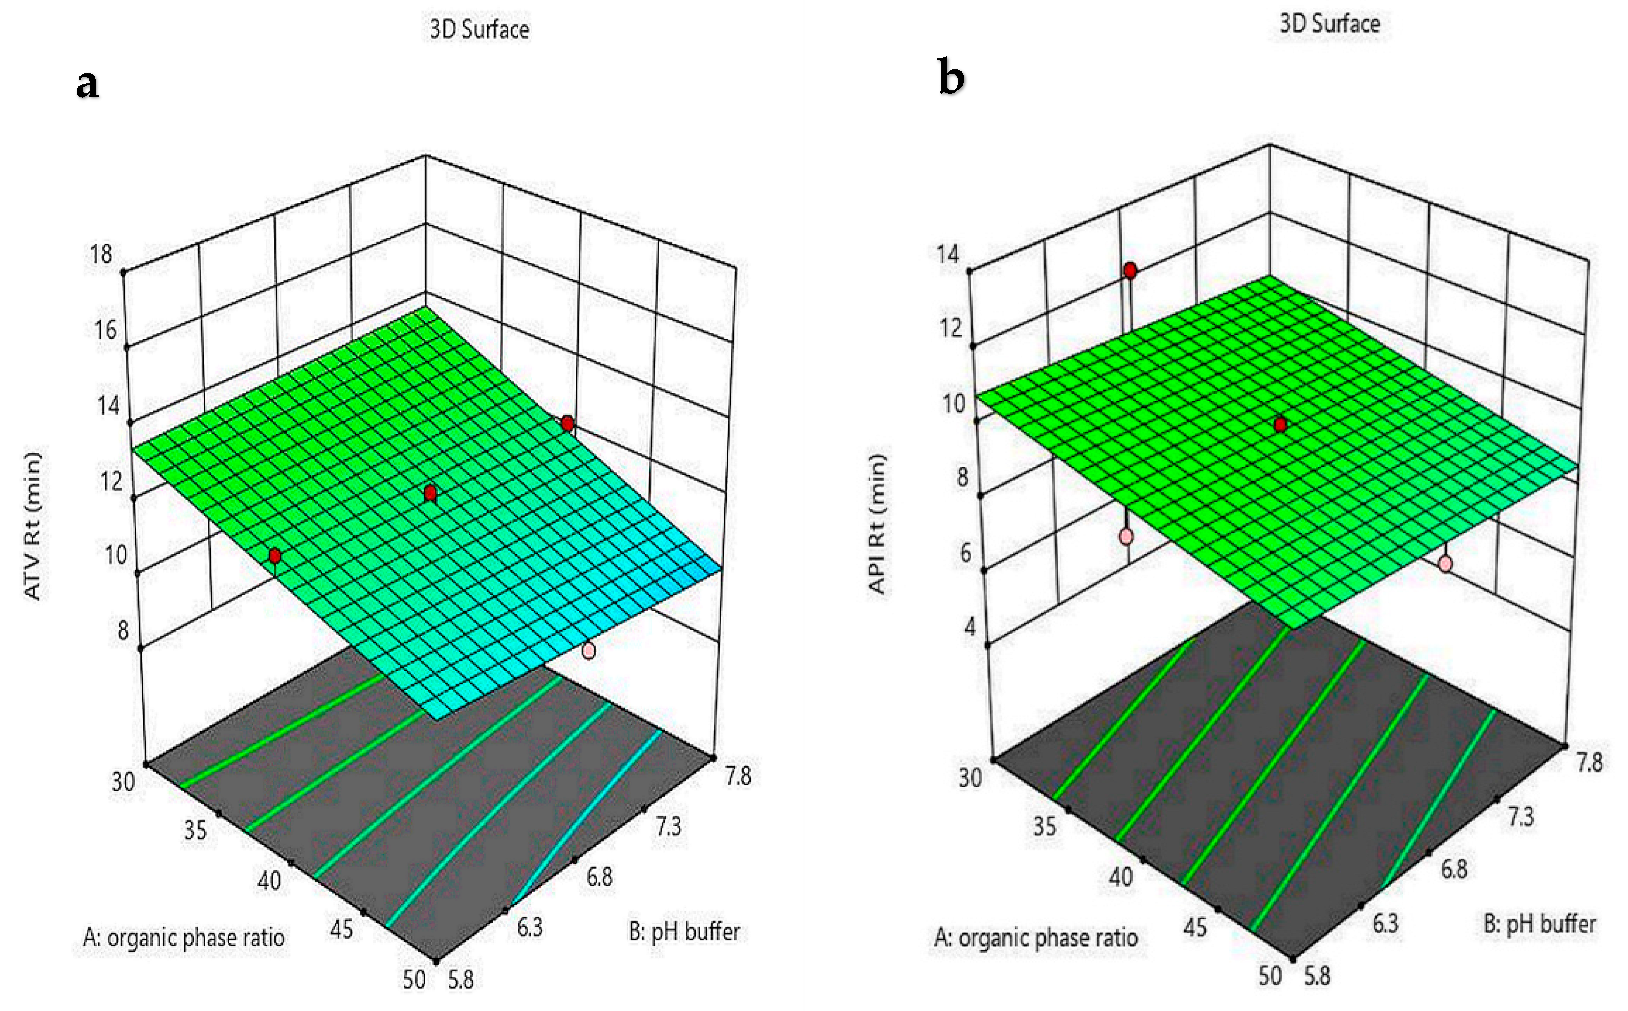
Subsequently, the graphical relationship between the risk parameters and critical performance parameters was investigated to optimize the risk parameters as predicted in Figure 6.
The ANOVA results (Table 4) for the fitted models confirmed that all three factors, organic phase ratio (A), pH of the buffer (B), and flow rate (C), had a significant (p < 0.0001) linear effect on all the measured responses. The F-value for all responses was high, which indicates a fit model with high variability compared to noise. Model reliability was verified through the regression coefficient (R2) and adjusted (R2) results, which showed a good correlation between the adjusted R2 and experimental R2, demonstrating strong predictive accuracy. The optimized model closely aligned with predicted results, as the difference between the predicted (R2) and the experimental (R2) was less than 0.2, indicating a high potential predictive capability [48,57].
For ATV (Rt), the linear coefficients of all three factors (organic phase ratio, buffer pH, and flow rate) were negative, indicating a favorable effect in reducing retention time as each parameter increases. The AB interaction term (organic phase ratio × buffer pH) also exhibited a negative coefficient, signifying that simultaneous increases in solvent strength and buffer pH further decrease ATV Rt. In contrast, the AC (organic phase ratio × flow rate) and BC (buffer pH × flow rate) interactions displayed positive coefficients, suggesting that concurrent increases in these parameter pairs extend ATV Rt, likely due to combined effects on analyte mass transfer and protonation dynamics.
For API (Rt), the linear coefficients for all three parameters were negative, likewise reflecting a favorable effect in decreasing Rt with increasing factor magnitude. However, none of the interaction terms were statistically significant, indicating that simultaneous changes in parameter pairs did not exert a measurable or consistent effect on API Rt under the studied design space. For ATV (Tf), it was shown that the linear coefficients of all three parameters were negative, which exerted a favorable effect as the increase in factors magnitude contributed to improving peak symmetry (low Tf). The AB and BC interactions exerted a slight negative effect, while the AC interaction has a slight positive effect on peak symmetry (Tf). The quadratic interactions (A2, B2, and C2) exerted a negative effect on peak symmetry, and in particular, C2 had an impactful negative effect on peak symmetry, as its coefficient is higher than other quadratic interactions. For API (Tf), it was evident that in linear regression, the organic phase ratio exerted a positive effect on peak symmetry, while both the pH of buffer and flow rate had a negative effect on API (Tf). AB and AC interaction has a slight negative effect on peak symmetry, and BC interaction exhibited a slight positive effect, with a simultaneous increase in pH buffer and flow rate magnitude that will result in an improvement of the (Tf). Quadratic interaction showed negative effects for the three factors, with a significant impact on (C2). For resolution, the organic phase and pH buffer (A, B) showed a positive effect as their linear coefficients are positive, and a favorable effect is high resolution, while flow rate (C) exerted a significant negative impact on separation clarity, whereas the increased flow rate resulted in low resolution. The AB interaction, with a negative effect as a simultaneous increase in organic phase ratio and pH buffer magnitude, decreases resolution, in contrast to AC and BC, that exerted positive effects on resolution. All quadratic terms (A2, B2, and C2) contributed negatively to resolution, reflecting deterioration in separation efficiency at extreme parameter magnitudes.
Furthermore, the lack-of-fit significance values for retention time (Rt) of ATV and API were 0.052 and 0.16, respectively, and 0.073 for resolution, and were all non-significant (p > 0.05), confirming that the model fits well, and the parameters efficiently affect the responses. Adequate precision values obtained were 40.132 for ATV (Rt), 21.63 for API (Rt), 24.65 for ATV (Tf), 20.97 for API (Tf), and 12.67 for resolution, all of which are well above the acceptable threshold. Adequate precision is a statistical metric that quantifies the ratio of signal (true response variation explained by the model) to noise (random deviation). According to ICH guidelines, a value greater than 4 is considered favorable and indicative of a reliable predictive model [48].
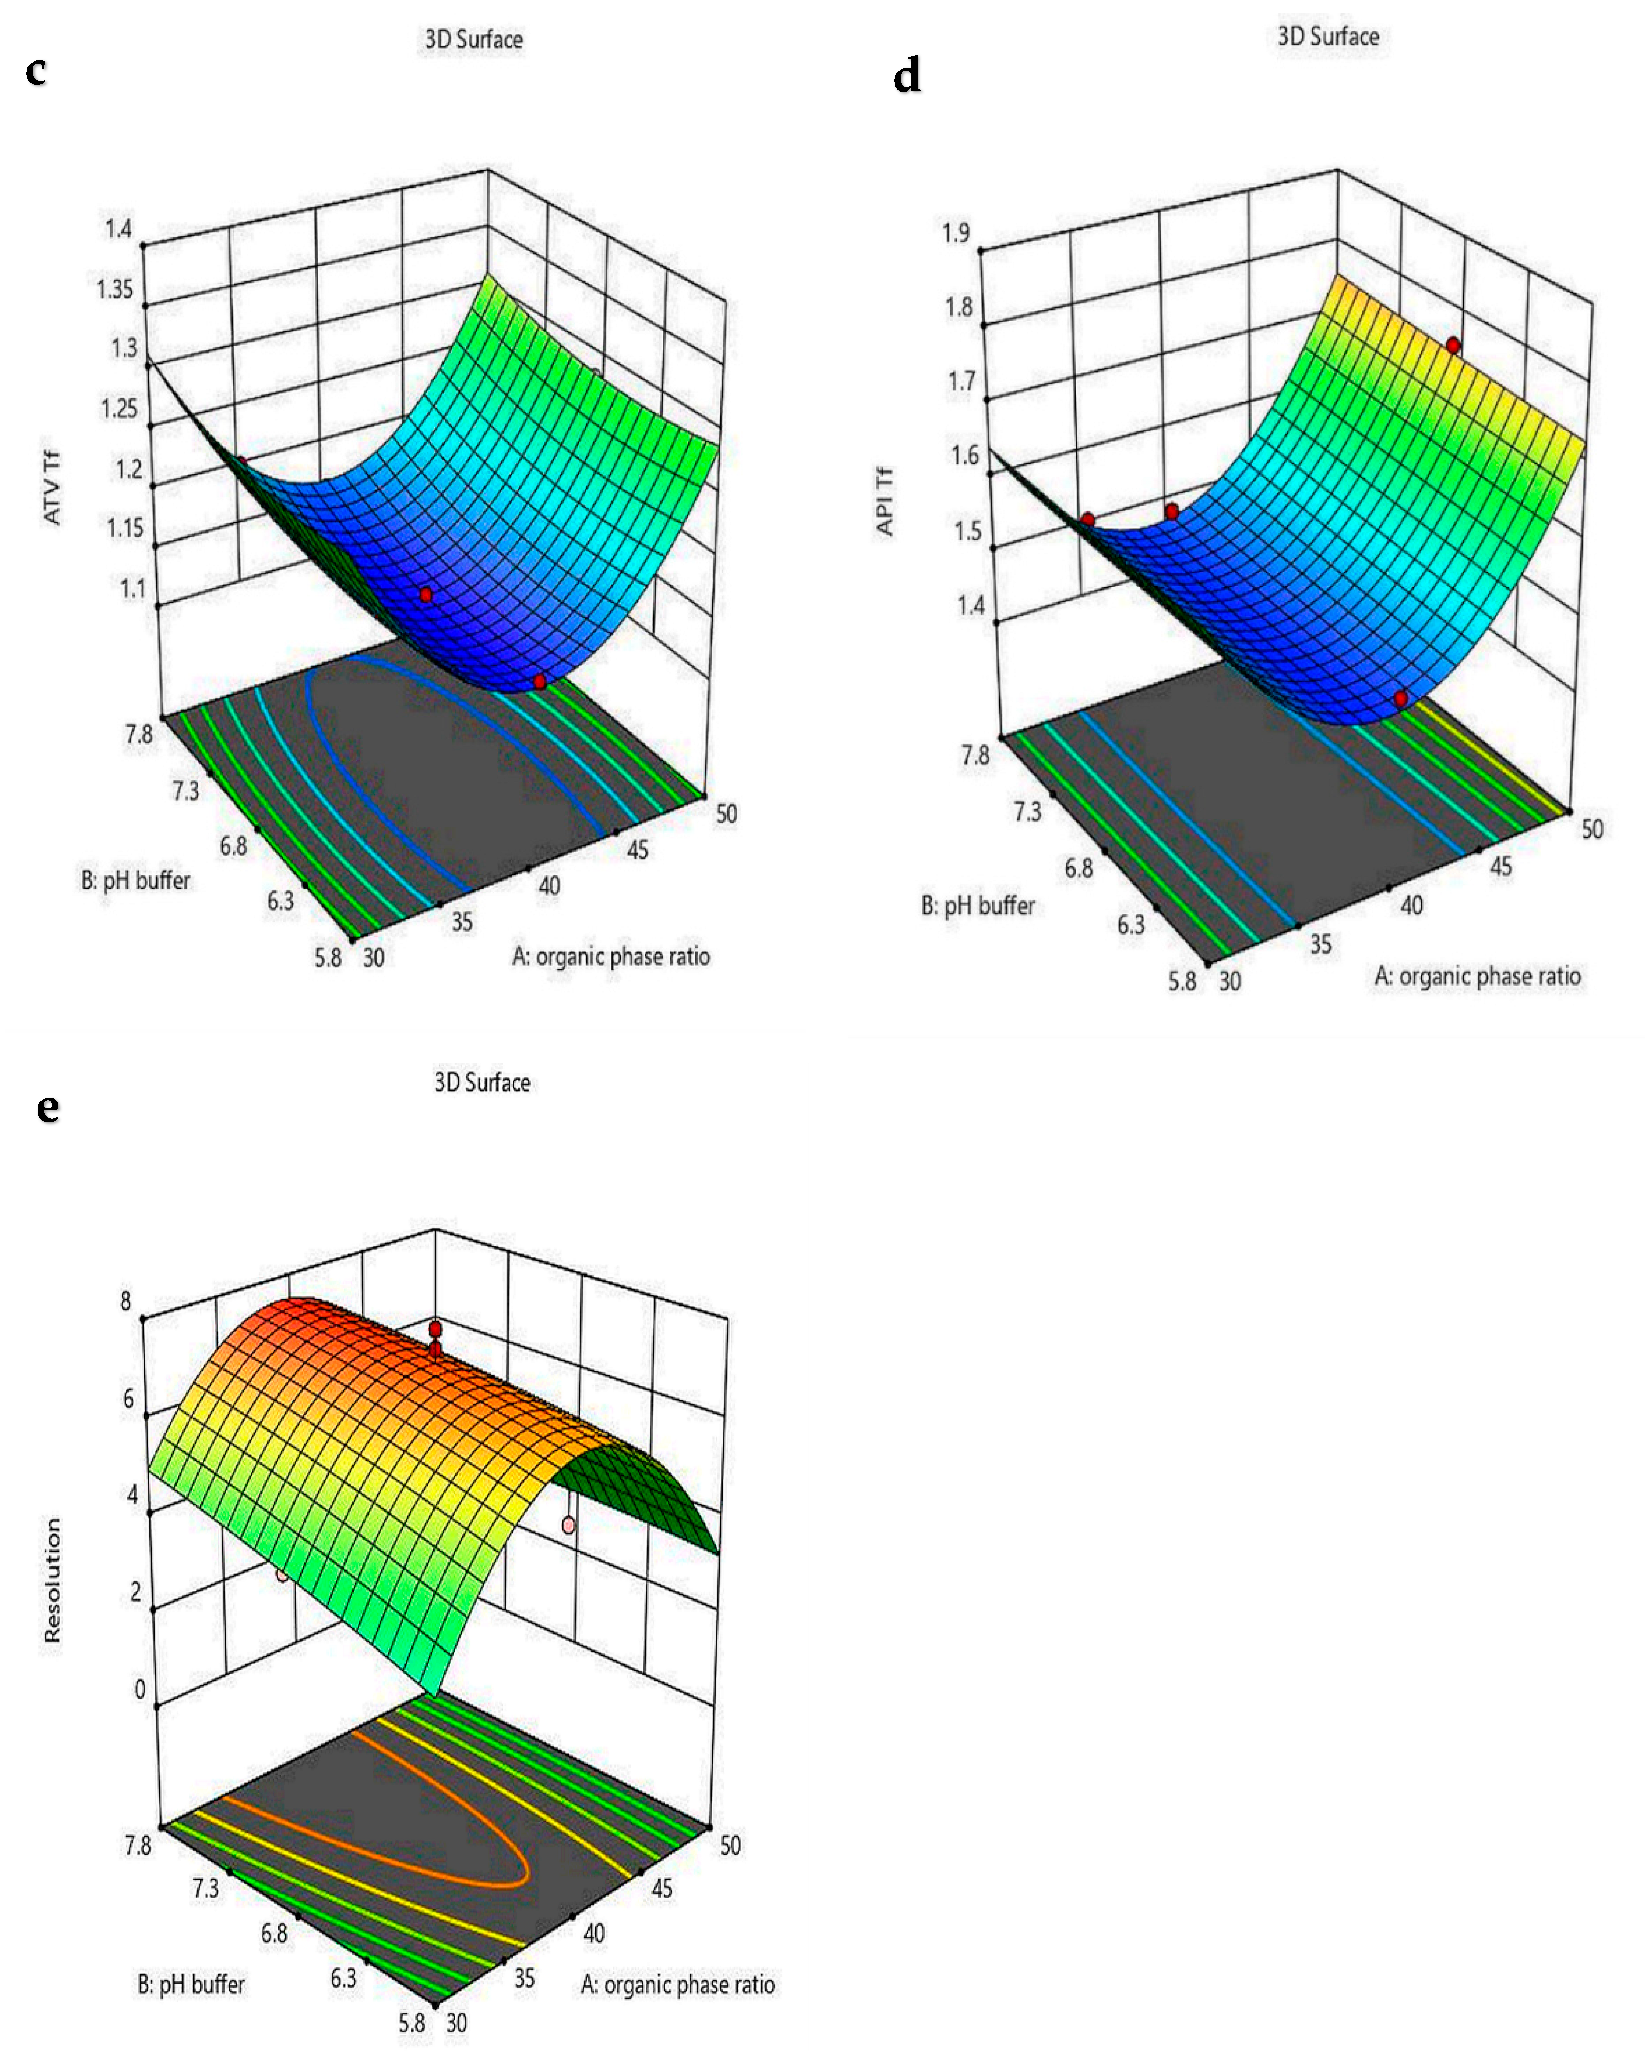
The use of CCD enabled the optimization of chromatographic separation between ATV and API peaks, achieving minimal retention time and tailing factor, along with maximum resolution. The 3D response surface analysis revealed strong interactions among the three experimental parameters and the responses, as shown in Figure 6. For ATV Rt (Figure 6a), and as supported by the corresponding polynomial equation (Table 4), the regression coefficients for organic phase ratio, buffer pH, and flow rate were negative, indicating that decreasing these parameters led to an increase in ATV Rt. A similar trend was observed for API retention time (Figure 6b). Regarding the Tf response, the 3D surface plot for ATV (Figure 6c) demonstrated that increasing the organic phase ratio, buffer pH, and flow rate negatively affected ATV Tf, with lower values of these parameters resulting in increased Tf. For API Tf (Figure 6d), the organic phase ratio exhibited a negative effect (Tf increased as the organic phase ratio decreased), whereas buffer pH and flow rate had positive effects, with Tf increasing as these parameters increased. For the resolution response (Figure 6e), both the 3D plot and the polynomial equation indicated that resolution between ATV and API peaks improved with increasing organic phase ratio and buffer pH, while it decreased with increasing flow rate.

4.5. Optimization and Desirability Function

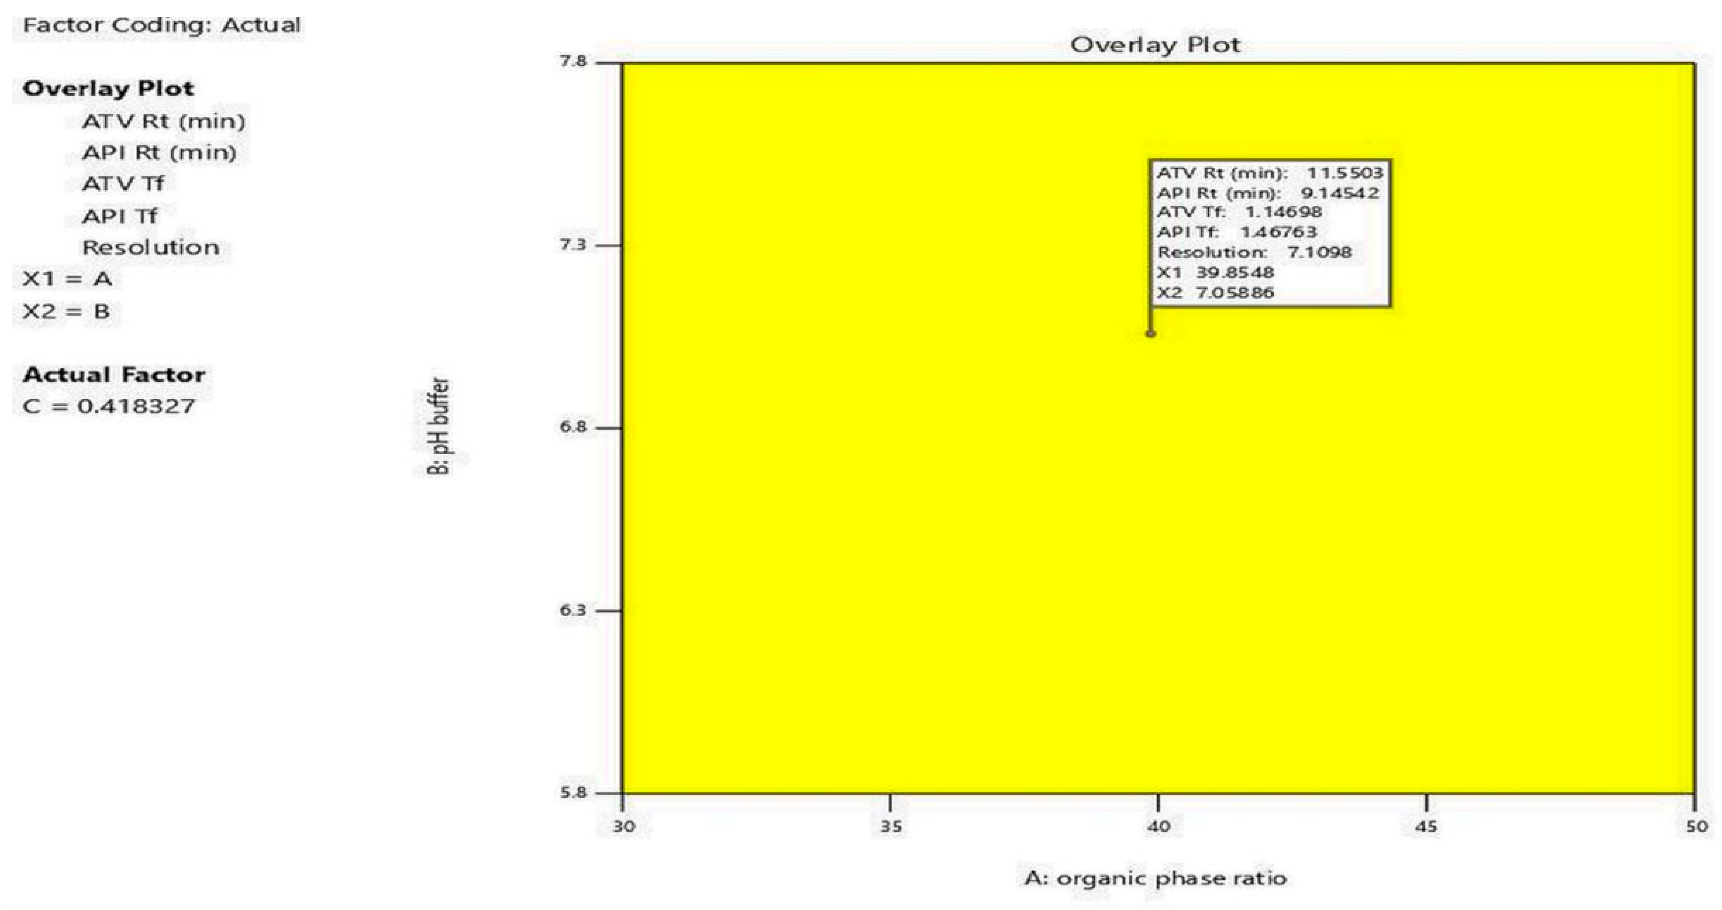
Optimization refers to the process where the most effective regression model predicts the ideal response values, considering real-experiment limitations and factor constraints [48]. Optimization plays a vital role in estimating the method that utilizes the QbD approach through the desirability technique, which can be used to conduct the design space. The design space displayed the target value by defining both upper and lower levels for use in the optimal method [35]. Optimization was carried out both numerically and graphically. The criteria for optimizing parameters were established with importance values, as indicated in Table 5. Design space graphical optimization was performed using overlay plots for each response, as shown in Figure 7.
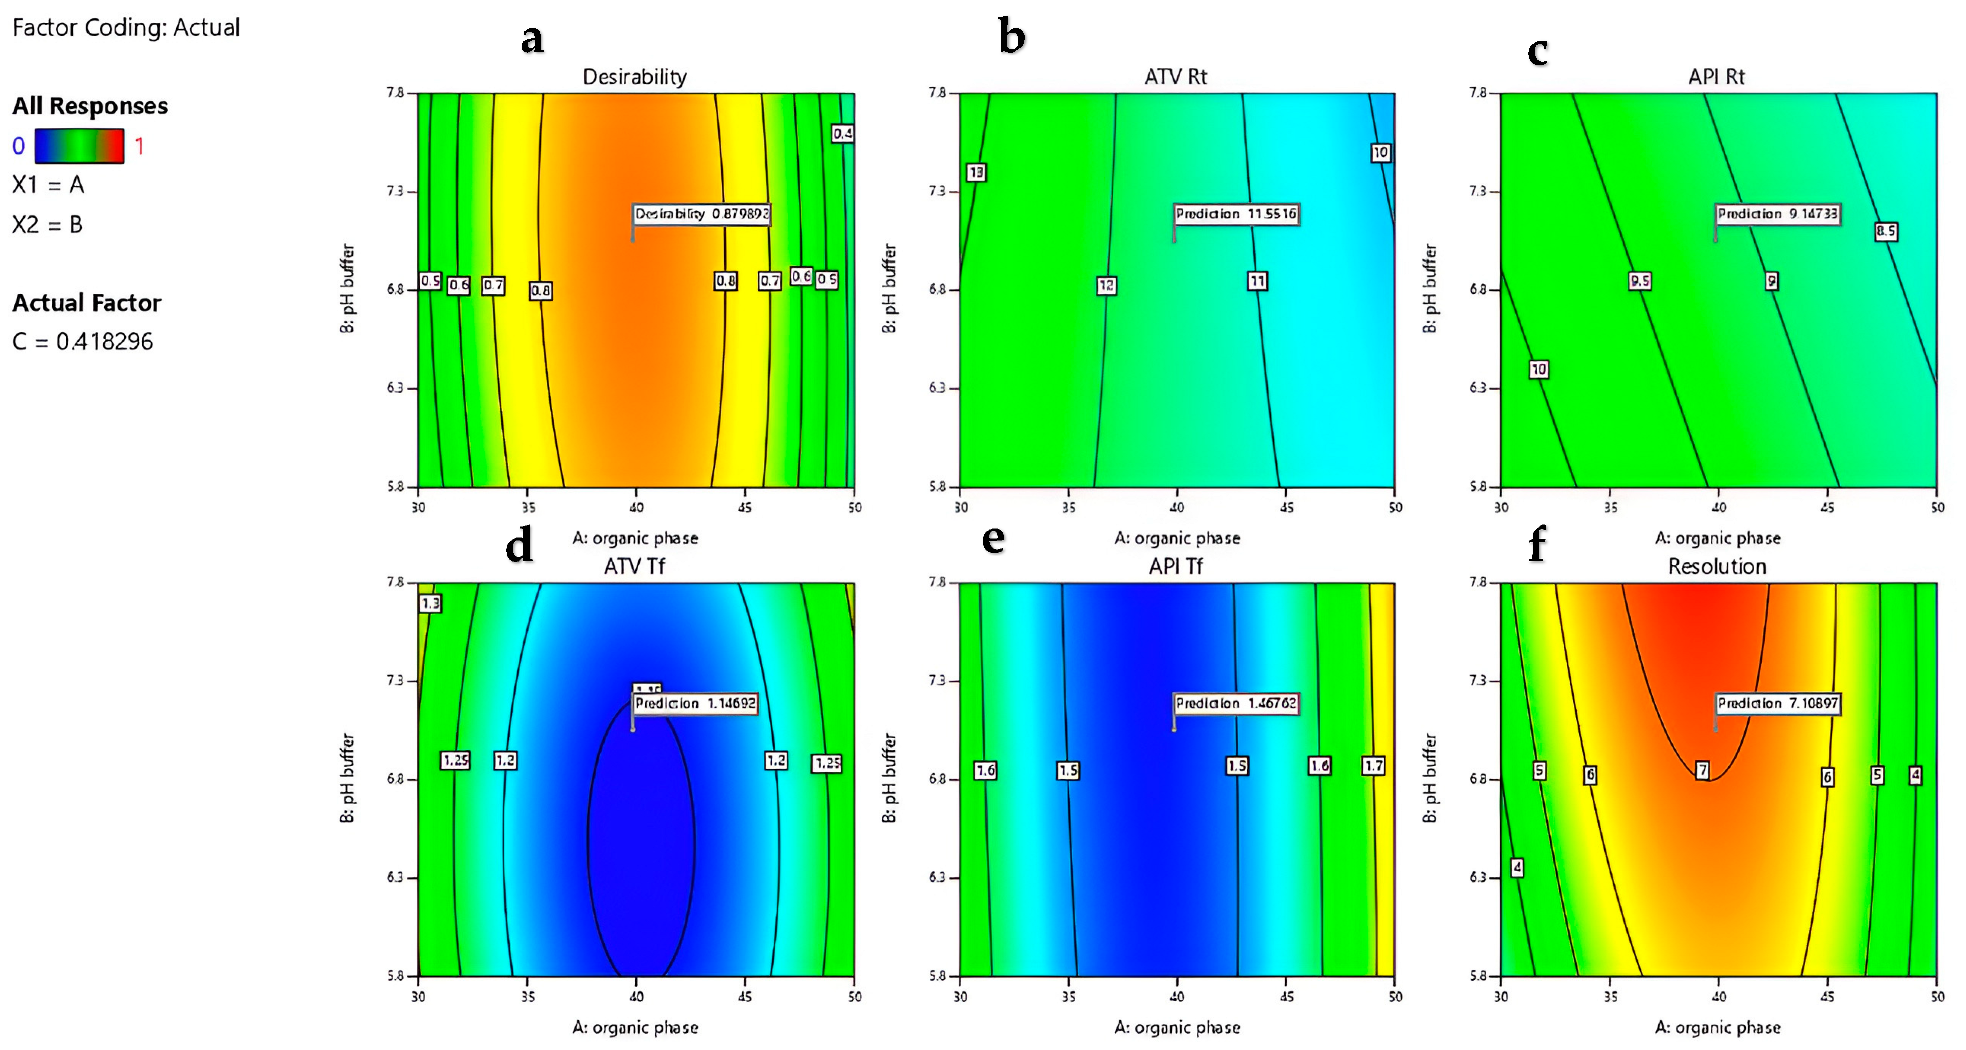
As illustrated in Table 5, the target responses for Rt and Tf for ATV were minimized, while for API, the Rt was set in range, since it is shorter eluted than ATV, but the Tf was set to minimum for enhancing resolution to develop a method with the shortest run time and optimal peak symmetry, while maximizing resolution to ensure superior separation. Furthermore, the importance range was established from 1 to 5, and in our study, we assigned a value of 4 to the Rt of ATV, and assigned a 5 value for the Tf of API. The selection aimed to reduce overall run time due to the later elution of ATV, while prioritizing the Tf of API to minimize potential interference from early eluting solvent peaks, given its earlier retention relative to ATV. The resolution was set to 5, while others were only set to 3. Subsequently, the desirability function, according to the constraints set, resulted in optimum conditional parameters as organic phase of 39.86% v/v, a pH of 7.03, and a flow rate of 0.41 mL min−1, which resulted in predicted responses of ATV Rt 11.54 min, 9.19 Rt of API, ATV Tf 1.14, API Tf 1.46, and a resolution of 7.17, while the desirability value was 0.88, which is close to value 1 (typical value is 1), as presented in (Table 6), and graphically generated by 2D contour surface space as depicted in (Figure 8). Finally, the predicted optimized responses were verified experimentally, and% of prediction error was estimated (Table 7). Figure 9 shows the two drug peaks in the standard solutions separately.

4.6. Method Validation

4.6.1. System Suitability

To validate the suitability, accuracy, and precision of the proposed approach for the HPLC data, a quality control solution (5 µg mL−1) was analyzed to assess the applicability of the system for each component from the working stock solution, in six replicates, and considered the following parameters: Rt, Tf, Rs, and NTP, which indicate the quality of the stationary phase performance as shown in (Table 8). It has been found that all the results were within accepted limits based on the USP validation method [56,58]. Furthermore, the% RSD values for ATV and API suitability parameters were less than 2%, referring to the low variation and hence demonstrating the superior suitability of the system [56]. The developed method showed good separation of ATV analyte with a theoretical plate number (9445 ± 13.61), good peak symmetry, and a tailing factor (1.14 ± 0.01). The only downside parameter was the retention time (12.21 ± 0.02 min), which is longer than the other compared studies [59,60]. Similarly, the selected column showed effective API analyte separation as evidenced by the theoretical plate number (6948 ± 17.34), and appropriate peak symmetry (1.45 ± 0.02). The retention time observed in this study (9.25 ± 0.1 min) was comparatively longer than that reported in previous studies [30], where retention times for individual compounds were less than 5 min. However, those methods targeted single-analyte detection, allowing for shorter run times without the need to resolve co-eluting peaks or accommodate differing physicochemical properties. In contrast, the present method enables simultaneous quantification of both drugs in a complex matrix, including SMEDDS formulations. This required careful consideration of resolution, peak shape, and potential interference. The method development prioritized compliance with USP criteria for ATV, as there are no official USP monographs for API available for reference [61].

4.6.2. Linearity and Calibration Curve

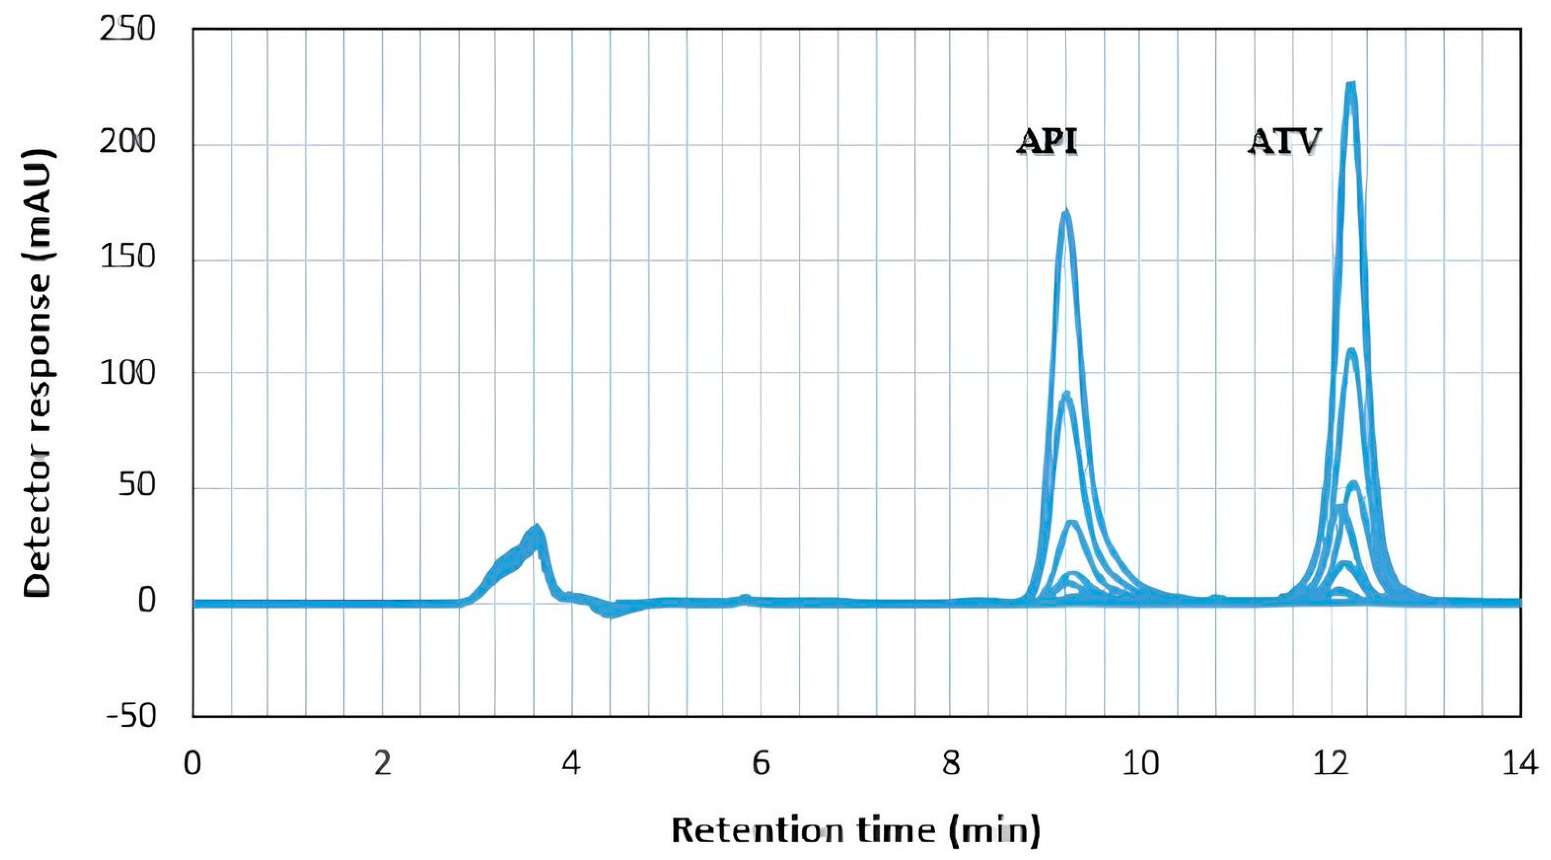
Figure 10 shows the overlaid spectrum of ATV and API calibration curve solutions. The determination of calibration curves included the plotting of peak area versus standard concentrations for ATV and API, which include a range of concentrations from 0.1 to 10 µg mL−1. Both curves exhibited excellent linearity and correlation coefficients over eight concentrations (0.1, 0.25, 0.5, 1, 2, 4, 5, and 10 µg mL−1) for ATV and API. The mean linear regression equations for both ATV and API are tabulated in Table 9.

4.6.3. LOD and LOQ

The LOD and LOQ are presented in Table 9. The current method offers a reliable determination for ATV and API over the range of calibration concentrations. The method showed good sensitivity to ATV quantification and good linearity over the entire range (R2 = 0.9999) as compared with other studies [59,60]. Additionally, API demonstrated linearity across the entire range (R2 = 0.9998), with a favorable limit of quantification of 0.49 and 0.81 µg mL−1 for ATV and API, respectively, as compared with other studies [30,56].

4.6.4. Accuracy

The recovery of ATV resulted in a range of 98.8–101.4%, and for API, the recovery was 101.4–102.2%, and their% RSD < 2. These results confirm that the method is accurate according to the ICH Q2 (R2) guidelines [46].

4.6.5. Precision

For precision, the results were obtained by determining the repeatability of inter-day and intra-day for quality control concentrations, as presented in Table 10.

4.7. Specificity Study

The method exhibited a clear separation for both drugs with good resolution from other excipients, as depicted in (Figure 11).

4.8. Robustness Study

After inducing a small but deliberate change to the method-optimized parameter concerning the mobile phase composition (±0.05), pH buffer (±0.2), detection wavelength (±2), and flow rate (±0.2), there were slight but no statistically significant alterations (p > 0.05) seen in the area of peak, but for retention times, both mobile phase composition and flow rate alteration showed significant change (p < 0.05) compared to the optimized parameters, as presented in (Table 11). The experiment used a medium QC solution of 5 µg mL−1 of ATV and API. The relative standard deviation (RSD) values were less than 2% for both ATV and API, demonstrating sufficient robustness of the approach [56].

4.9. Assay of ATV–API in Tablet

Both ATV (Lipitor 10 mg) and API (Apigenin 10 mg) tablets were quantified under the optimized chromatograph conditions. It showed a resolved peak at 12.18 ± 0.03 min and 9.27 ± 0.02 min retention time, respectively. The assay for ATV was 100.4 ± 0.1% and 98.64 ± 1.5% for API, and their% RSD of <2. These results prove the specificity of the method to quantify ATV and API precisely in the pharmaceutical dosage form without interference with other excipients.

4.10. Stress Degradation Studies

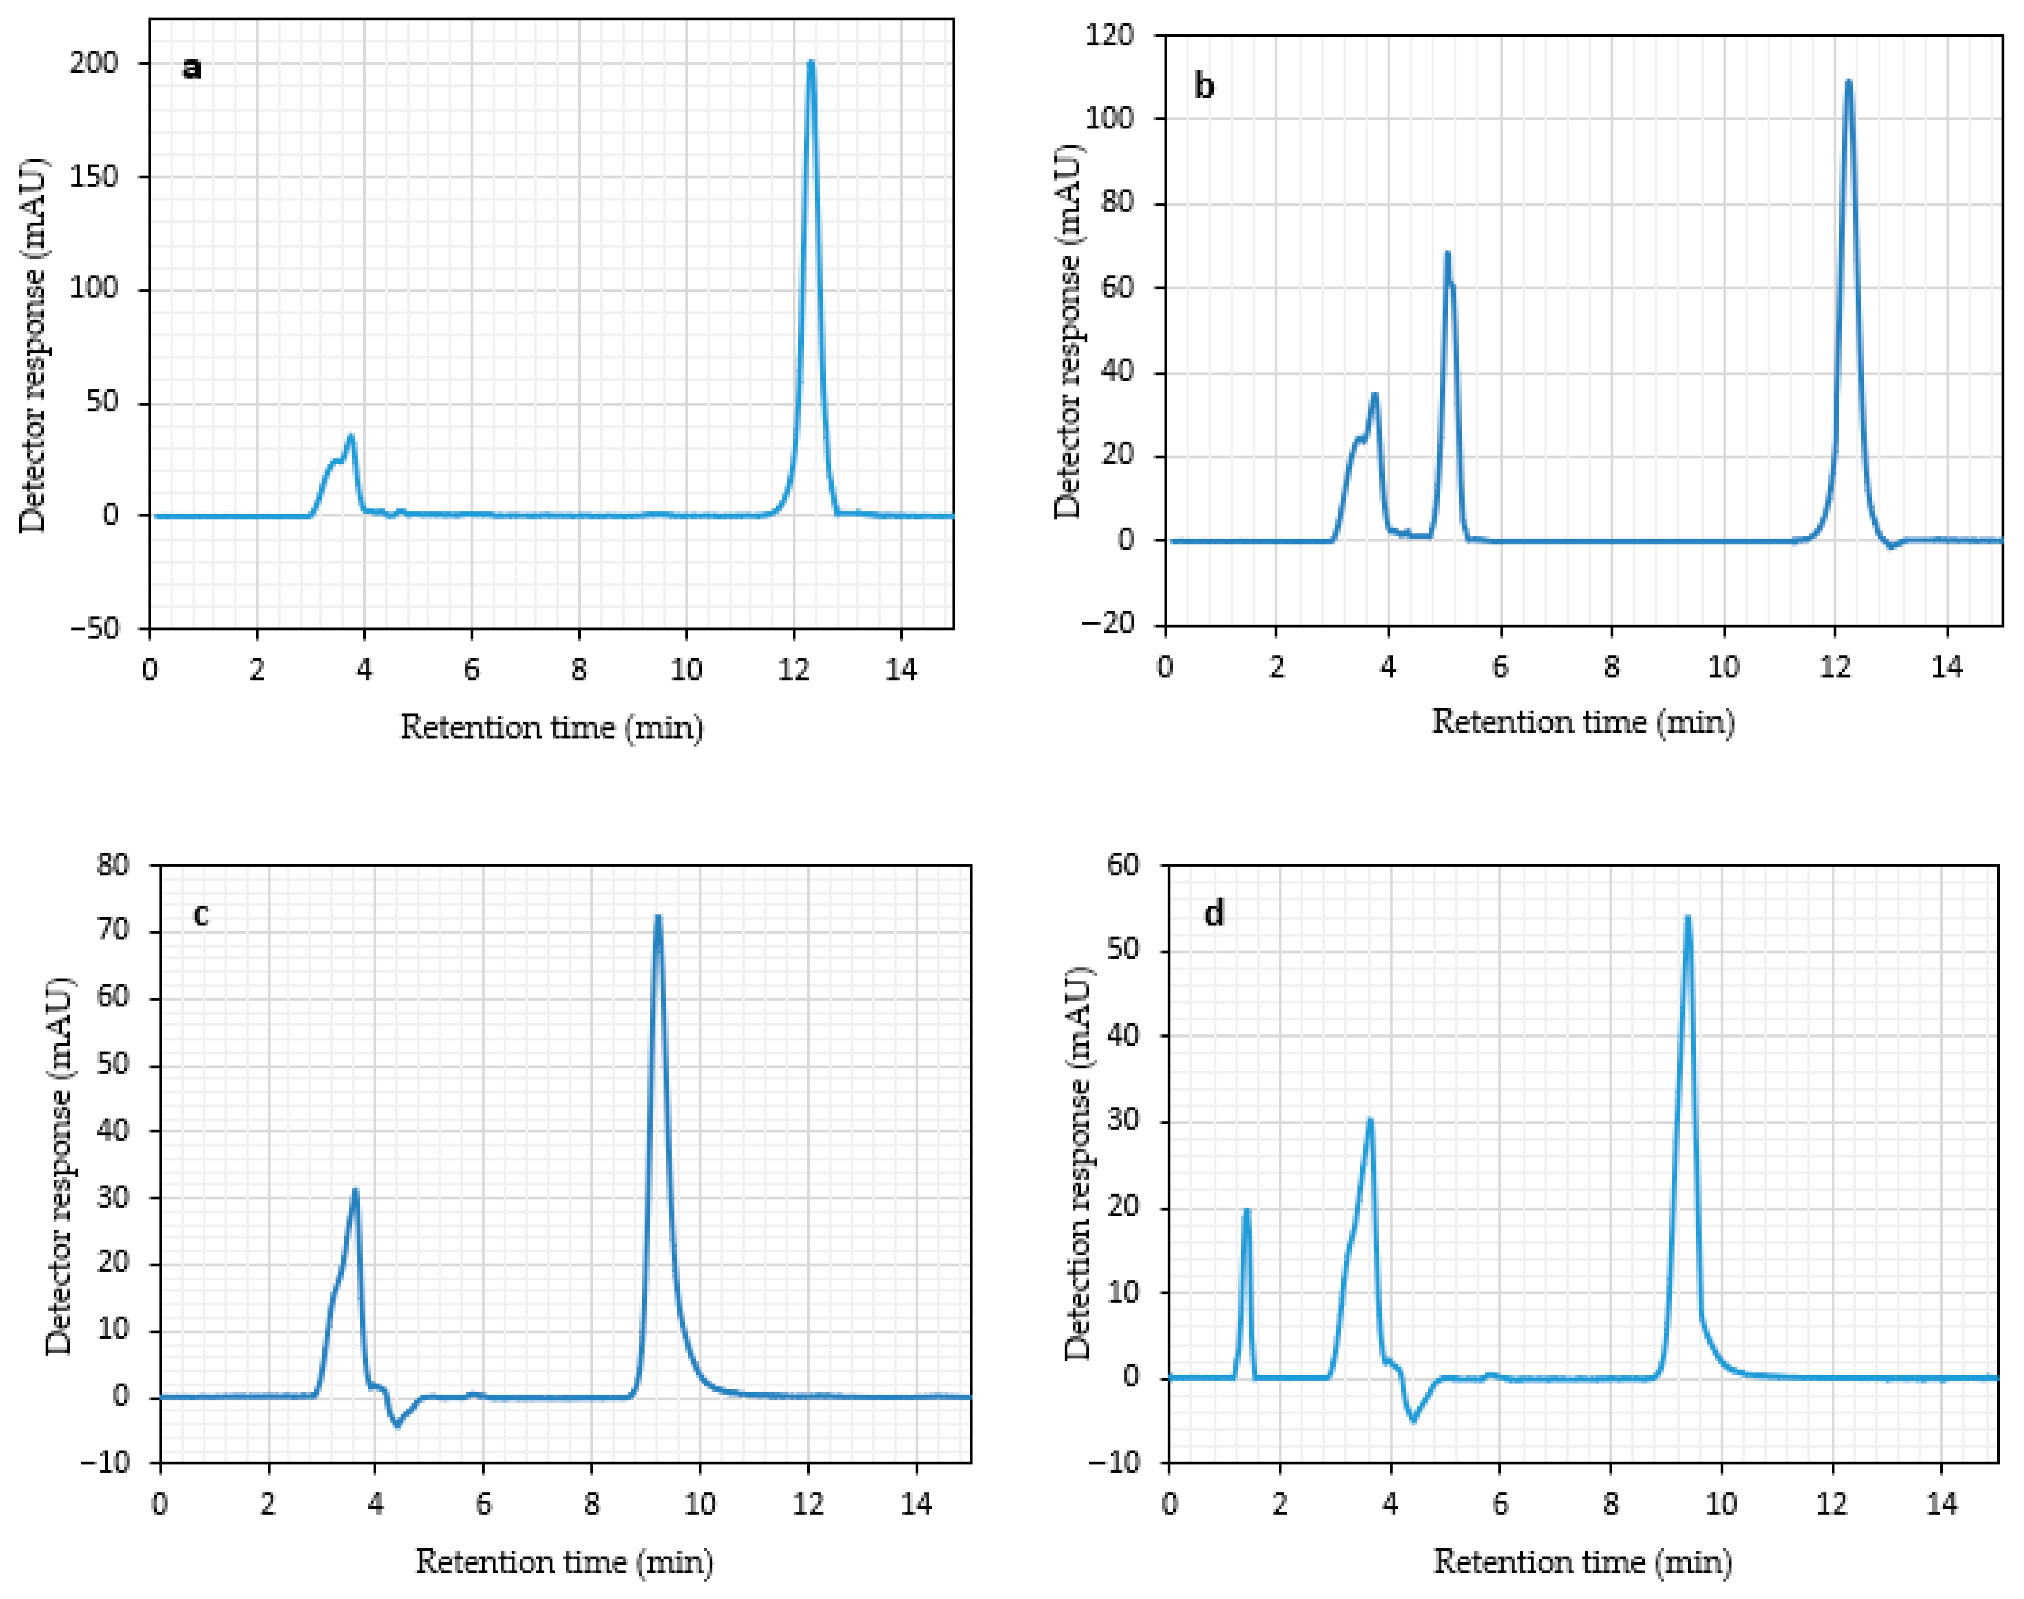
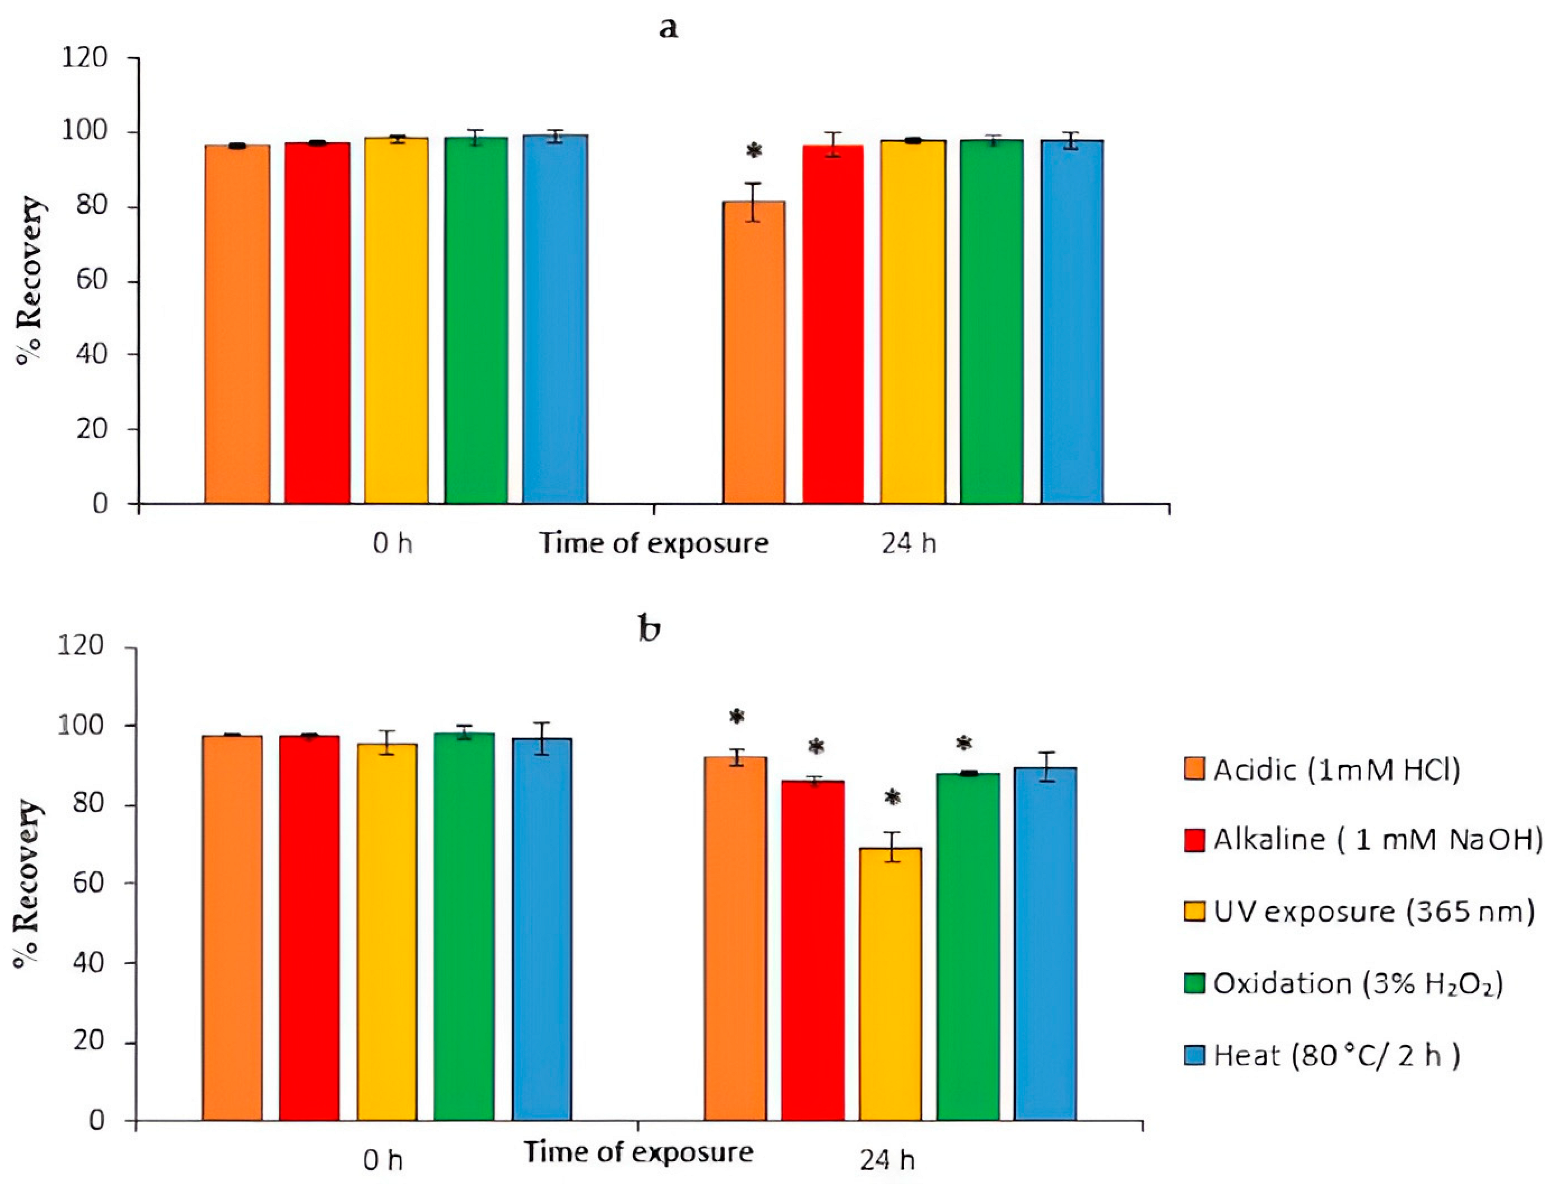
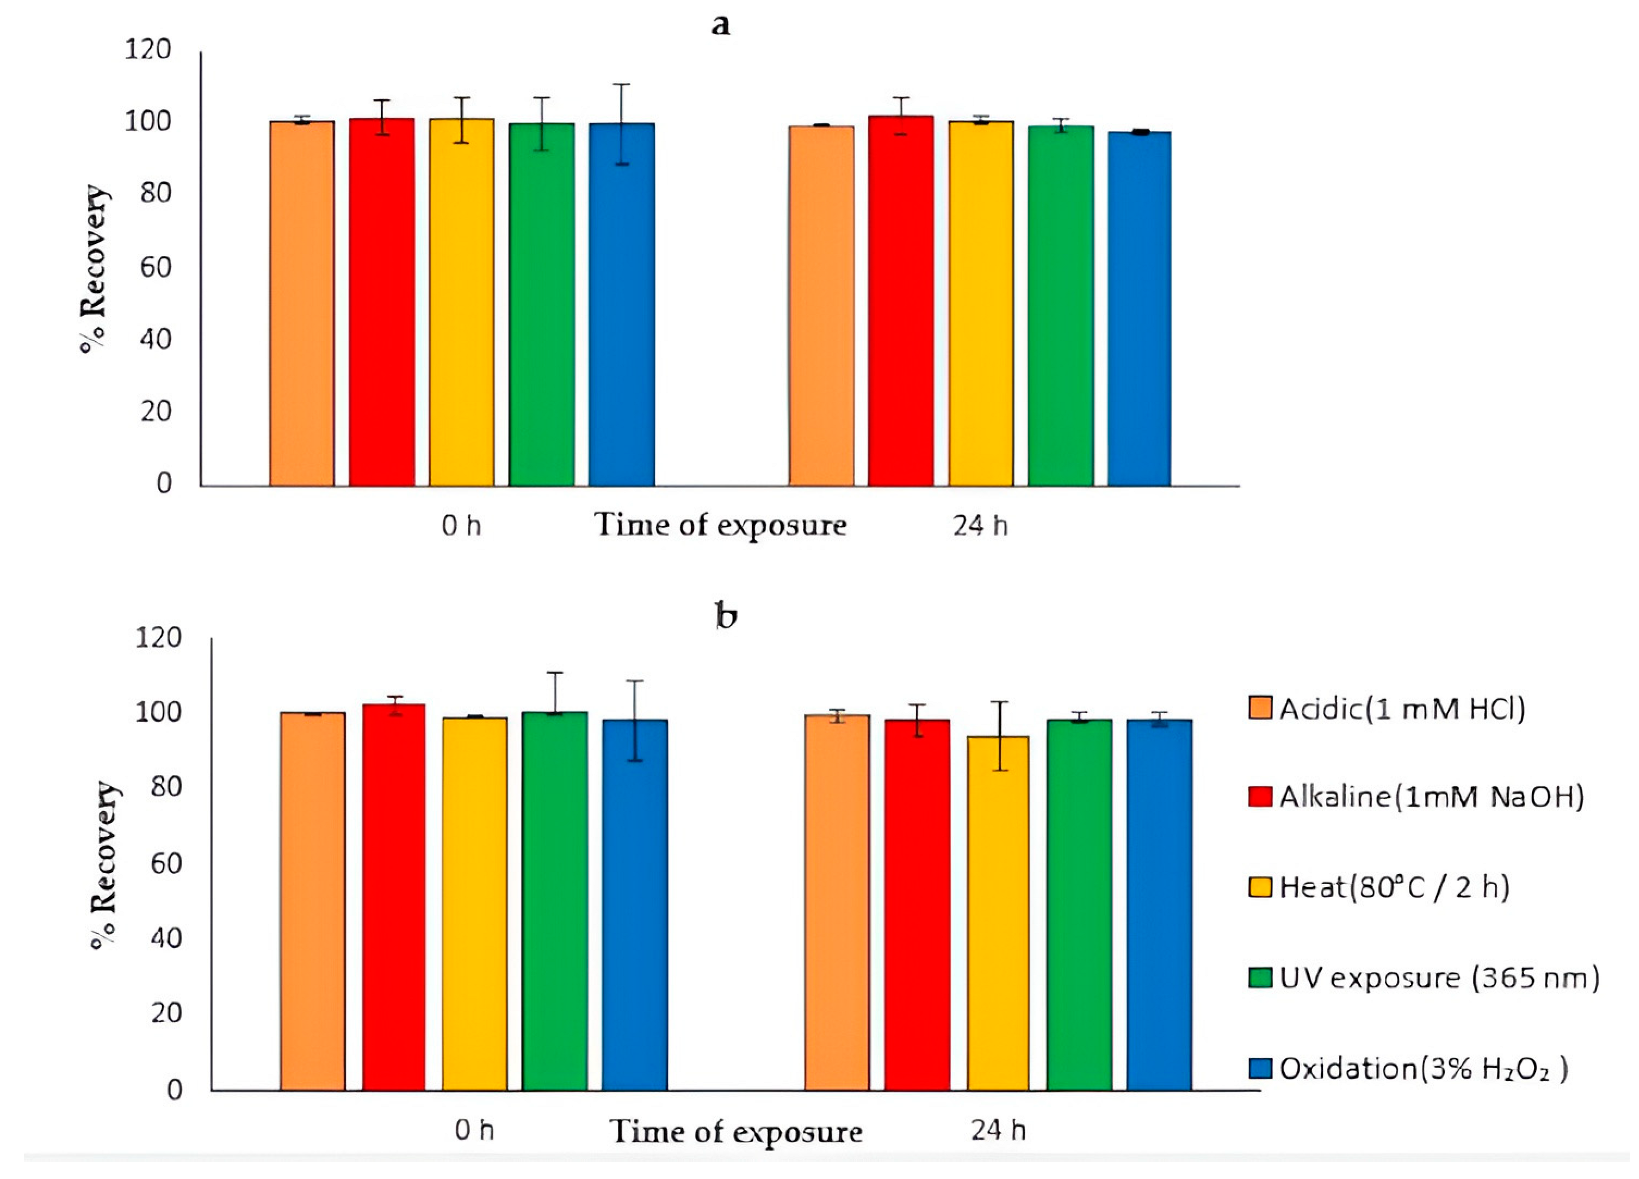
Chromatograms of ATV and API under the studied stress degradation are illustrated in Figure 12. The stress degradation study data were quantified in terms of recovery percentage from the standard stock samples of ATV, API, and the SMEDDS-loaded ATV–API formulation, as shown in (Table 12 and Table 13; Figure 13 and Figure 14).
An initial concentration of 0.1 M HCl was employed to simulate acidic conditions; however, this resulted in a more than 65% degradation of pure ATV after 24 h of exposure. To establish a milder acidic environment that more accurately reflects typical storage or physiological conditions, the HCl solution was subsequently diluted to a concentration aligned with real-time stability criteria [62]. A final strength of 1 mM HCl was selected for subsequent studies. However, the study of acid degradation at 1 mM HCl revealed a loss of around 18% from its standard concentration after 24 h of stress study exposure, which is statistically significant (p < 0.001), as shown in (Figure 12a,b). The ATV hydrolysis in acidic medium is consistent with other studies [63,64]. Similarly, it was reported that ATV in acidic medium undergoes concurrent hydrolysis of lactone and lactonization of the β-hydroxy acid [65]. Stability studies demonstrated that the ATV stock solution exhibited minimal, statistically non-significant degradation under both alkaline and oxidative stress conditions. Similarly, exposure to thermal and photolytic stress for 24 h did not produce any appreciable change in ATV concentration, indicating a high degree of stability under these conditions. Such a stability profile is consistent with previous work [63,66]. Moreover, a similar stability profile was noted after 48 h, where ATV in its solid form showed only minor degradation when exposed to heat and UV light, with degradation levels of 6.9% and 4.8%, respectively [67]. Notably, this study’s acid degradation profile is consistent with findings from LC-MS/MS studies, which identified multiple hydroxy-metabolites formed through phase I metabolism and stress conditions, thereby confirming ATV’s susceptibility to chemical modification [24,68].
For API, the stress study results showed a slight degradation of about 8% only in the acidic medium after 24 h, which indicates the favorable stability of API in an acidic medium, as reported in a previous study [69]. This contrasts with another study that reported an 18% loss in 0.1 N HCl after only 2 h [30]. Another study revealed an extreme degradation of 90% API in 1 N HCl after 24 h [70]. The lower extent of degradation observed in our study may be attributed to the use of a milder acidic concentration and a different mobile phase composition.
Furthermore, about 9% of the API concentration was lost during heating for 2 h, which is in line with the drug thermal stability profile [69].
However, the oxidation resulted in significant degradation (p < 0.05) of 12% degradation after 24 h, and this is attributed to the presence of a hydroxyl group on the B-ring, which makes it prone to oxidation to form phenoxyl derivatives [71]. A related study showed 65% of API was degraded in 3% H2O2 over 24 h [70], a much higher value likely resulting from a stronger oxidizing condition and undiluted stress agent, as opposed to our diluted setup. The alkaline stress exposure showed a significant degradation (p < 0.05) of about 14% after 24 h of exposure time, which might be attributed to the solubility profile of API in basic solvent. Another study showed that API underwent 46% degradation when exposed to 1 N NaOH over 24 h [70], further emphasizing the impact of stress agent concentration and preparation method. Photodegradation was notably significant (p < 0.05), as depicted in (Figure 12c,d) with around 30% reduction observed after 24 h (p < 0.01), which is aligning closely with a study that reported 30.2% degradation under UV exposure and another study that observed 20% degradation due to sunlight after just 2 h [5,64].
For SMEDDS-loaded ATV–API as shown in (Table 13) and (Figure 14a,b), interestingly, the formulation remained stable for both ATV and API under the mentioned stress conditions, with no significant (p > 0.05) changes in the concentrations of either ATV or API, but the heat stress showed about 6% loss of API after 2 h at 80 °C. This stability is attributed to the good encapsulation and protection provided by the SMEDDS excipients. This highlights the role of surfactant and co-surfactant mixtures in forming stable microemulsions that protect the drug from degradation [72]. These findings demonstrated an advantageous SMEDDS formulation with high stability compared to the solution of the pure compounds [73].

5. Conclusions

A novel stability-indicating HPLC-UV method was developed for the simultaneous quantification of Atorvastatin (ATV) and Apigenin (API) using a Quality by Design (QbD) approach with central composite design (CCD) for method optimization. The method is simple, sensitive, and reproducible, enabling accurate analysis of ATV and API in both bulk and SMEDDS formulations. Chromatograms demonstrated high selectivity with no interference from excipients. Risk assessment identified critical method parameters (CMPs) directly influencing Critical Quality Attributes (CQAs), with system suitability consistently meeting ICH guidelines.
Precision and accuracy were statistically acceptable, while robustness testing confirmed method reliability under deliberate variations. Chemometric tools, including CCD and desirability function, effectively optimized resolution, peak symmetry, and run time. Forced degradation studies showed ATV significantly degrades (~18%) in acidic media (1 mM HCl) over 24 h, with moderate degradation (~8%) in alkaline conditions (1 mM NaOH), but is stable against heat, light, and oxidation. API exhibited notable degradation under acidic, alkaline, photo, and oxidative stress.
The ATV–API-loaded SMEDDS formulation demonstrated good stability. The validated method, according to ICH Q2 (R2), is suitable for quantitative analysis in SMEDDS and routine quality control of raw materials. Application of the design of experiments (DoE) significantly reduced development time and provided a systematic understanding of chromatographic parameter effects on separation performance.

Author Contributions

S.A.K. was responsible for conceptualizing and designing the study, conducting the laboratory work, collecting and analyzing the data, and drafting the manuscript, including the discussion; R.A.A. reviewing, manuscript formatting, data curation, and contributed to the discussion. The primary supervisor, S.Y.C., provided overall supervision, guidance, and critical manuscript revisions. The co-supervisor, M.A., contributed by supporting the project in a co-supervisory capacity and approving the manuscript. All authors have read and agreed to the published version of the manuscript.

Funding

Ministry of Higher Education Malaysia Fundamental Research Grant Scheme, FRGS/1/2018/STG07/USM/02/1.

Data Availability Statement

The original contributions presented in this study are included in the article. No new datasets were generated or analyzed beyond the information already presented in the article.

Acknowledgments

The authors would like to thank funder, Ministry of Higher Education Malaysia Fundamental Re-search Grant Scheme, FRGS/1/2018/STG07/USM/02/1 for supporting the research works.

Conflicts of Interest

The authors declare no conflicts of interest.

References

  1. Elmowafy, M.; Ibrahim, H.M.; Ahmed, M.A.; Shalaby, K.; Salama, A.; Hefesha, H. Atorvastatin-Loaded Nanostructured Lipid Carriers (NLCs): Strategy to Overcome Oral Delivery Drawbacks. Drug Deliv. 2017, 24, 932–941. [Google Scholar] [CrossRef]
  2. Aghajanzadeh, M.; Ghannad, F.; Zamani, M.; Andalib, S.; Danafar, H. Anti-Inflammatory Effect of Rosuvastatin Using Diblock Amphiphilic Copolymer: Synthesis, Characterization, in Vitro and in Vivo Study. J. Biomater. Appl. 2019, 34, 229–238. [Google Scholar] [CrossRef]
  3. Bu, D.X.; Griffin, G.; Lichtman, A.H. Mechanisms for the Anti-Inflammatory Effects of Statins. Curr. Opin. Lipidol. 2011, 22, 165–170. [Google Scholar] [CrossRef] [PubMed]
  4. Yeom, D.W.; Son, H.Y.; Kim, J.H.; Kim, S.R.; Lee, S.G.; Song, S.H.; Chae, B.R.; Choi, Y.W. Development of a Solidified Self-Microemulsifying Drug Delivery System (S-SMEDDS) for Atorvastatin Calcium with Improved Dissolution and Bioavailability. Int. J. Pharm. 2016, 506, 302–311. [Google Scholar] [CrossRef]
  5. Li, B.; Robinson, D.H.; Birt, D.F. Evaluation of Properties of Apigenin and [G-3H]Apigenin and Analytic Method Development. J. Pharm. Sci. 1997, 86, 721–725. [Google Scholar] [CrossRef]
  6. Ali, F.; Rahul; Naz, F.; Jyoti, S.; Siddique, Y.H. Health Functionality of Apigenin: A Review. Int. J. Food Prop. 2017, 20, 1197–1238. [Google Scholar] [CrossRef]
  7. Dutta, D.; Chakraborty, A.; Mukherjee, B.; Gupta, S. Aptamer-Conjugated Apigenin Nanoparticles to Target Colorectal Carcinoma: A Promising Safe Alternative of Colorectal Cancer Chemotherapy. ACS Appl. Bio Mater. 2018, 1, 1538–1556. [Google Scholar] [CrossRef] [PubMed]
  8. El Shoubaky, G.A.; Abdel-Daim, M.M.; Mansour, H.; Salem, E.A. Isolation and Identification of a Flavone Apigenin from Marine Red Alga Acanthophora Spicifera with Antinociceptive and Anti-Inflammatory Activities. J. Exp. Neurosci. 2016, 10, 10–21. [Google Scholar] [CrossRef] [PubMed]
  9. Palko-Łabuz, A.; Środa-Pomianek, K.; Wesołowska, O.; Kostrzewa-Susłow, E.; Uryga, A.; Michalak, K. MDR Reversal and Pro-Apoptotic Effects of Statins and Statins Combined with Flavonoids in Colon Cancer Cells. Biomed. Pharmacother. 2019, 109, 1511–1522. [Google Scholar] [CrossRef] [PubMed]
  10. Zaafan, M.A.; Zaki, H.F.; El-Brairy, A.I.; Kenawy, S.A. Protective Effects of Atorvastatin and Quercetin on Isoprenaline-Induced Myocardial Infarction in Rats. Bull. Fac. Pharm. Cairo Univ. 2013, 51, 35–41. [Google Scholar] [CrossRef]
  11. Dash, R.; Biswal, J.; Yadav, M.; Sharma, T.; Mohapatra, S.; Prusty, S.K. Novel Atorvastatin-Curcumin Conjugate Nanogel, a Selective COX2 Inhibitor with Enhanced Biopharmaceutical Profile: Design, Synthesis, in Silico, in Vitro, and in Vivo Investigation. J. Drug Deliv. Sci. Technol. 2023, 81, 104211. [Google Scholar] [CrossRef]
  12. Assi, R.A.; Abdulbaqi, I.M.; Ming, T.S.; Yee, C.S.; Wahab, H.A.; Asif, S.M.; Darwis, Y. Liquid and Solid Self-Emulsifying Drug Delivery Systems (Sedds) as Carriers for the Oral Delivery of Azithromycin: Optimization, in Vitro Characterization and Stability Assessment. Pharmaceutics 2020, 12, 1052. [Google Scholar] [CrossRef]
  13. Laghari, M.; Darwis, Y.; Memon, A.H.; Khan, A.A.; Abdulbaqi, I.M.T.; Assi, R.A. Nanoformulations and Clinical Trial Candidates as Probably Effective and Safe Therapy for Tuberculosis. Trop. J. Pharm. Res. 2016, 15, 201–211. [Google Scholar] [CrossRef]
  14. Assi, R.A.; Abdulbaqi, I.M.; Yee, C.S. The Evaluation of Drug Delivery Nanocarrier Development and Pharmacological Briefing for Metabolic-Associated Fatty Liver Disease (MAFLD): An Update. Pharmaceuticals 2021, 14, 215. [Google Scholar] [CrossRef] [PubMed]
  15. Thi, T.D.; Van Speybroeck, M.; Barillaro, V.; Martens, J.; Annaert, P.; Augustijns, P.; Van Humbeeck, J.; Vermant, J.; Van den Mooter, G. Formulate-Ability of Ten Compounds with Different Physicochemical Profiles in SMEDDS. Eur. J. Pharm. Sci. 2009, 38, 479–488. [Google Scholar] [CrossRef]
  16. Kaushik, D.; Verma, R. A Comprehensive Text Book on Self-Emulsifying Drug Delivery Systems. In A Comprehensive Text Book on Self-Emulsifying Drug Delivery Systems; Kaushik, D., Verm, R., Eds.; Bentham Science Publishers: Sharjah, United Arab Emirates, 2021; pp. 1–195. [Google Scholar] [CrossRef]
  17. Dokania, S.; Joshi, A.K. Self-Microemulsifying Drug Delivery System (SMEDDS)–Challenges and Road Ahead. Drug Deliv. 2015, 22, 675–690. [Google Scholar] [CrossRef] [PubMed]
  18. Sharma, M.; Mehta, I. Surface Stabilized Atorvastatin Nanocrystals with Improved Bioavailability, Safety and Antihyperlipidemic Potential. Sci. Rep. 2019, 9, 16105. [Google Scholar] [CrossRef]
  19. Varshosaz, J.; Masoudi, S.; Mehdikhani, M.; Beni, B.H.; Farsaei, S. Atorvastatin Lipid Nanocapsules and Gold Nanoparticles Embedded in Injectable Thermo-gelling Hydrogel Scaffold Containing Adipose Tissue Extracellular Matrix For myocardial tissue regeneration. IET Nanobiotechnol. 2019, 13, 933–941. [Google Scholar] [CrossRef]
  20. Haiss, M.A.; Maraie, N.K. Utilization of Ultrasonication Technique for the Preparation of Apigenin Nanocrystals. Int. J. Drug Deliv. Technol. 2021, 11, 964–973. [Google Scholar]
  21. Kazmi, I.; Al-Abbasi, F.A.; Imam, S.S.; Afzal, M.; Nadeem, M.S.; Altayb, H.N.; Alshehri, S. Formulation and Evaluation of Apigenin-Loaded Hybrid Nanoparticles. Pharmaceutics 2022, 14, 783. [Google Scholar] [CrossRef]
  22. Alshabrawy, A.; Mostafa, A.; Abotaleb, N. Sensitive Spectrophotometric Determination of Atorvastatin in Pharmaceutical Formulation by Ion Pair Complexation with Pararosaniline Hydrochloride. J. Adv. Pharm. Res. 2017, 1, 193–200. [Google Scholar] [CrossRef]
  23. Telange, D.R.; Patil, A.T.; Pethe, A.M.; Fegade, H.; Anand, S.; Dave, V.S. Formulation and Characterization of an Apigenin-Phospholipid Phytosome (APLC) for Improved Solubility, in Vivo Bioavailability, and Antioxidant Potential. Eur. J. Pharm. Sci. 2017, 108, 36–49. [Google Scholar] [CrossRef]
  24. El-Zailik, A.; Cheung, L.K.; Wang, Y.; Sherman, V.; Chow, D.S.L. Simultaneous LC-MS/MS Analysis of Simvastatin, Atorvastatin, Rosuvastatin and Their Active Metabolites for Plasma Samples of Obese Patients Underwent Gastric Bypass Surgery. J. Pharm. Biomed. Anal. 2019, 164, 258–267. [Google Scholar] [CrossRef]
  25. Zhu, S.; Zhang, J.; Lv, Z.; Yu, M. LC-MS/MS Determination of Apigenin in Rat Plasma and Application to Pharmacokinetic Study. Curr. Pharm. Biotechnol. 2021, 22, 274–280. [Google Scholar] [CrossRef]
  26. Karaźniewicz-Łada, M.; Wójtowski, J.A.; Główka, F.; Danków, R.; Pikul, J.; Gryszczyńska, A.; Foksowicz-Flaczyk, J.; Mikołajczak, P.Ł. Application of UPLC-MS/MS Method for Analysis of Apigenin, Apigenin 7-Glucoside and Chlorogenic Acid in Goat Serum. Chromatographia 2023, 86, 401–411. [Google Scholar] [CrossRef]
  27. Patil, U.P.; Gandhi, S.V.; Sengar, M.R.; Rajmane, V.S.; Gandhi, S.V. A Validated Densitometric Method for Analysis of Telmisartan and Atorvastatin Calcium in Fixed Dose Combination. J. Chil. Chem. Soc. 2010, 55, 94–96. [Google Scholar] [CrossRef]
  28. Hwang, K.-M.; Park, S.-A.; Kim, J.-Y.; Park, C.-W.; Rhee, Y.-S.; Park, E.-S. Formulation and in Vitro Evaluation of Self-microemulsifying Drug Delivery System Containing Fixed-Dose Combination of Atorvastatin and Ezetimibe. Chem. Pharm. Bull. 2015, 63, 423–430. [Google Scholar] [CrossRef]
  29. Gomathy, S.; Narenderan, S.T.; Meyyanathan, S.N.; Gowramma, B. Development and Validation of Hplc Method for the Simultaneous Estimation of Apigenin and Luteolin in Commercial Formulation. J. Crit. Rev. 2020, 7, 4785–4790. [Google Scholar]
  30. Shetti, P.; Jalalpure, S.S. A Single Robust Stability-Indicating RP-HPLC Analytical Tool for Apigenin Quantification in Bulk Powder and in Nanoliposomes: A Novel Approach. Futur. J. Pharm. Sci. 2021, 7, 122. [Google Scholar] [CrossRef]
  31. Prajapati, P.B.; Bagul, N.; Kalyankar, G. Implementation of DoE and Risk-Based Enhanced Analytical Quality by Design Approach to Stability-Indicating RP-HPLC Method for Stability Study of Bosutinib. J. AOAC Int. 2021, 104, 1742–1753. [Google Scholar] [CrossRef]
  32. Nasr, A.; Gardouh, A.; Ghorab, M. Novel Solid Self-Nanoemulsifying Drug Delivery System (S-SNEDDS) for Oral Delivery of Olmesartan Medoxomil: Design, Formulation, Pharmacokinetic and Bioavailability Evaluation. Pharmaceutics 2016, 8, 20. [Google Scholar] [CrossRef]
  33. Bonde, S.; Bonde, C.G.; Prabhakar, B. Quality by Design Based Development and Validation of HPLC Method for Simultaneous Estimation of Paclitaxel and Vinorelbine Tartrate in Dual Drug Loaded Liposomes. Microchem. J. 2019, 149, 103982. [Google Scholar] [CrossRef]
  34. Ganorkar, A.V.; Gupta, K.R. Analytical Quality by Design: A Mini Review. Biomed. J. Sci. Tech. Res. 2017, 1, 1555–1559. [Google Scholar] [CrossRef]
  35. Tambare, R.S.; Shahi, S.R.; Gurumukhi, V.C.; Kakade, S.M.; Tapadiya, G.G. Quality by Design (QbD) Based Development and Validation of RP-HPLC Method for Buserelin Acetate in Polymeric Nanoparticles: Release Study. Heliyon 2024, 10, e39172. [Google Scholar] [CrossRef]
  36. Jayagopal, B.; Murugesh, S. QbD-Mediated RP-UPLC Method Development Invoking an FMEA-Based Risk Assessment to Estimate Nintedanib Degradation Products and Their Pathways. Arab. J. Chem. 2020, 13, 7087–7103. [Google Scholar] [CrossRef]
  37. Patel, K.; Shah, U.A.; Patel, C.N. Box–Behnken Design-Assisted Optimization of RP-HPLC Method for the Estimation of Evogliptin Tartrate by Analytical Quality by Design. Futur. J. Pharm. Sci. 2023, 9, 57. [Google Scholar] [CrossRef]
  38. Bairagi, A.; Kothrukar, R.; Chikhale, H.; Kosanam, S.; Borse, L. AQbD-Novel Strategy for Analytical Methods. Futur. J. Pharm. Sci. 2024, 10, 138. [Google Scholar] [CrossRef]
  39. Goud, V.M.; Sirisha, P.; Rachana, K.N.; Godela, R.; Prasad, B.D. QbD Approach for Analysis of Tirzepatide in Its Bulk and Marketed Formulation by Stability Indicating RP-HPLC. Int. J. Pharm. Qual. Assur. 2023, 14, 404–409. [Google Scholar] [CrossRef]
  40. Dinç-Zor, Ş.; Dönmez, Ö.A.; Aşçı, B.; Pingo, E. Chemometric Optimization of an HPLC Method for the Simultaneous Analysis of a Multi Component Drug Product by the Help of Central Composite Design. Microchem. J. 2020, 152, 104322. [Google Scholar] [CrossRef]
  41. Chandarana, C. Analytical Quality by Design: A Review for Chromatography. Biomed. J. Sci. Tech. Res. 2022, 42, 33714–33732. [Google Scholar] [CrossRef]
  42. Eldin, A.; Shalaby, A.; El-Tohamy, M. Development and Validation of a HPLC Method for the Determination of Montelukast and Its Degradation Products in Pharmaceutical Formulation Using An. Acta Pharm. Sci. 2011, 53, 45–56. [Google Scholar]
  43. Patel, K.Y.; Dedania, Z.R.; Dedania, R.R.; Patel, U. QbD Approach to HPLC Method Development and Validation of Ceftriaxone Sodium. Futur. J. Pharm. Sci. 2021, 7, 141. [Google Scholar] [CrossRef]
  44. Ali, H.S.M.; Hanafy, A.F.; Bafail, R.; Alrbyawi, H.; Almaghrabi, M.; Alahmadi, Y.M.; El Achy, S. Locally Acting Budesonide-Loaded Solid Self-Microemulsifying Drug Delivery Systems (SMEDDS) for Distal Ulcerative Colitis. Int. J. Nanomed. 2024, 19, 11819–11846. [Google Scholar] [CrossRef]
  45. Cerrahoğlu, E.; Kayan, A.; Bingöl, D. New Inorganic–Organic Hybrid Materials and Their Oxides for Removal of Heavy Metal Ions: Response Surface Methodology Approach. J. Inorg. Organomet. Polym. Mater. 2017, 27, 427–435. [Google Scholar] [CrossRef]
  46. European Medicines Agency. ICH Q2(R2) Validation of Analytical Procedures—Scientific Guideline. Available online: https://www.ema.europa.eu/en/ich-q2r2-validation-analytical-procedures-scientific-guideline (accessed on 17 July 2024).
  47. Aminu, N.; Chan, S.Y.; Khan, N.H.; Farhan, A.B.; Umar, M.N.; Toh, S.M. A Simple Stability-Indicating HPLC Method for Simultaneous Analysis of Paracetamol and Caffeine and Its Application to Determinations in Fixed-Dose Combination Tablet Dosage Form. Acta Chromatogr. 2019, 31, 85–91. [Google Scholar] [CrossRef]
  48. Fouad, M.A.; Elsabour, S.A.; Elkady, E.F.; Elshazly, H.M. Design of Experiment (DOE), Multiple Response Optimization and Utilizing the Desirability Function in the Simultaneous HPLC Separation of Five Antihypertensive Drugs. J. Iran. Chem. Soc. 2022, 19, 269–282. [Google Scholar] [CrossRef]
  49. Vial, J.; Jardy, A. Experimental Comparison of the Different Approaches to Estimate LOD and LOQ of an HPLC Method. Anal. Chem. 1999, 71, 2672–2677. [Google Scholar] [CrossRef]
  50. Abdulbaqi, I.M.; Darwis, Y.; Khan, N.A.K.; Assi, R.A.; Loh, G.O.K. A Simple (HPLC–UV) Method for the Quantification of Colchicine in Bulk and Ethosomal Gel Nano-Formulation and its Validation. Int. J. Pharm. Pharm. Sci. 2017, 9, 72. [Google Scholar] [CrossRef]
  51. Assi, R.A.; Darwis, Y.; Abdulbaqi, I.M.; Asif, S.M. Development and Validation of a Stability-Indicating RP-HPLC Method for the Detection and Quantification of Azithromycin in Bulk, and Self-Emulsifying Drug Delivery System (SEDDs) Formulation. J. Appl. Pharm. Sci. 2017, 7, 20–29. [Google Scholar] [CrossRef]
  52. Talele, G.S.; Porwal, P.K. Development of Validated Bioanalytical HPLC-UV Method for Simultaneous Estimation of Amlodipine and Atorvastatin in Rat Plasma. Indian J. Pharm. Sci. 2015, 77, 742–750. [Google Scholar] [CrossRef]
  53. Chalikwar, S.S.; Surana, S.J.; Goyal, S.N.; Chaturvedi, K.K.; Dangre, P.V. Solid Self-Microemulsifying Nutraceutical Delivery System for Hesperidin Using Quality by Design: Assessment of Biopharmaceutical Attributes and Shelf-Life. J. Microencapsul. 2021, 38, 61–79. [Google Scholar] [CrossRef] [PubMed]
  54. Gurumukhi, V.C.; Bari, S.B. Quality by Design (QbD)–Based Fabrication of Atazanavir-Loaded Nanostructured Lipid Carriers for Lymph Targeting: Bioavailability Enhancement Using Chylomicron Flow Block Model and Toxicity Studies. Drug Deliv. Transl. Res. 2022, 12, 1230–1252. [Google Scholar] [CrossRef]
  55. Kogawa, A.C.; Pires, A.E.D.T.; Salgado, H.R.N. Atorvastatin: A Review of Analytical Methods for Pharmaceutical Quality Control and Monitoring. J. AOAC Int. 2019, 102, 801–809. [Google Scholar] [CrossRef]
  56. Rajagopal, S.S.; Vazhayil, B.K.; Varghese, L.; Nanjaian, M. Development and Validation of RP-HPLC Method for Simultaneous Determination of Apigenin and Luteolin in Ethanol Extract of Clerodendrum serratum (Linn.) Leaves. Asian J. Appl. Sci. 2017, 5, 52–60. [Google Scholar]
  57. Hinge, M.A.; Patel, D. Optimization of HPLC Method Using Central Composite Design for Estimation of Torsemide and Eplerenone in Tablet Dosage Form. Braz. J. Pharm. Sci. 2022, 58, e20219. [Google Scholar] [CrossRef]
  58. United States Pharmacopeia; United States Pharmacopeial Convention. General Chapter <621> Chromatography. In United States Pharmacopeia 43–National Formulary 38 (USP 43–NF 38); United States Pharmacopeial Convention: Rockville, MD, USA, 2021. [Google Scholar]
  59. Seshachalam, U.; Kothapally, C.B. HPLC Analysis for Simultaneous Determination of Atorvastatin and Ezetimibe in Pharmaceutical Formulations. J. Liq. Chromatogr. Relat. Technol. 2008, 31, 714–721. [Google Scholar] [CrossRef]
  60. Mustafa, G.; Azeem, A.; Ahmad, F.J.; Khan, Z.I.; Shakeel, F.; Talegaonkar, S. Stability-Indicating RP-HPLC Method for Analysis of Atorvastatin in Bulk Drug, Marketed Tablet and Nanoemulsion Formulation. J. Chil. Chem. Soc. 2010, 55, 184–188. [Google Scholar] [CrossRef]
  61. Shabir, G.A. Validation of High-Performance Liquid Chromatography Methods for Pharmaceutical Analysis: Understanding the Differences and Similarities between Validation Requirements of the US Food and Drug Administration, the US Pharmacopeia and the International Conference on Harmonization. J. Chromatogr. A 2003, 987, 57–66. [Google Scholar] [CrossRef]
  62. Bakshi, M.; Singh, S. Development of Validated Stability-Indicating Assay Methods—Critical Review. J. Pharm. Biomed. Anal. 2002, 28, 1011–1040. [Google Scholar] [CrossRef] [PubMed]
  63. Bkhaitan, M.M.; Mirza, A.Z. Stability-Indicating HPLC-DAD Method for Simultaneous Determination of Atorvastatin, Irbesartan, and Amlodipine in Bulk and Pharmaceutical Preparations. Bull. Korean Chem. Soc. 2015, 36, 2230–2237. [Google Scholar] [CrossRef]
  64. Kumar Mantri, S.; Pashikanti, S.; Ramana Murthy, K.V. Development and Characterization of Self-Nanoemulsifying Drug Delivery Systems (SNEDDS) of Atorvastatin Calcium. Curr. Drug Deliv. 2012, 9, 182–196. [Google Scholar] [CrossRef]
  65. Mohammadi, A.; Rezanour, N.; Ansari Dogaheh, M.; Ghorbani Bidkorbeh, F.; Hashem, M.; Walker, R.B. A Stability-Indicating High Performance Liquid Chromatographic (HPLC) Assay for the Simultaneous Determination of Atorvastatin and Amlodipine in Commercial Tablets. J. Chromatogr. B 2007, 846, 215–221. [Google Scholar] [CrossRef]
  66. Goel, A.; Baboota, S.; Sahni, J.K.; Srinivas, K.S.; Gupta, R.S.; Gupta, A.; Semwal, V.P.; Ali, J. Development and Validation of Stability-Indicating Assay Method by UPLC for a Fixed Dose Combination of Atorvastatin and Ezetimibe. J. Chromatogr. Sci. 2013, 51, 222–228. [Google Scholar] [CrossRef]
  67. Chaudhari, B.G.; Patel, N.M.; Shah, P.B. Stability Indicating RP-HPLC Method for Simultaneous Determination of Atorvastatin and Amlodipine from Their Combination Drug Products. Chem. Pharm. Bull. 2007, 55, 241–246. [Google Scholar] [CrossRef]
  68. Vukkum, P.; Moses Babu, J.; Muralikrishna, R. Stress Degradation Behavior of Atorvastatin Calcium and Development of a Suitable Stability-Indicating LC Method for the Determination of Atorvastatin, Its Related Impurities, and Its Degradation Products. Sci. Pharm. 2012, 81, 93–114. [Google Scholar] [CrossRef]
  69. Liu, W.N.; Shi, J.; Fu, Y.; Zhao, X.H. The Stability and Activity Changes of Apigenin and Luteolin in Human Cervical Cancer Hela Cells in Response to Heat Treatment and Fe2+/Cu2+ Addition. Foods 2019, 8, 346. [Google Scholar] [CrossRef] [PubMed]
  70. Subramanian, G.; Meyyanathan, S.N.; Byran, G. Stability-Indicating Reverse-Phase High-Performance Liquid Chromatography Method for the Simultaneous Quantification of Apigenin and Luteolin from Achillea Millefolium Linn. Asian J. Pharm. Clin. Res. 2019, 12, 169–172. [Google Scholar] [CrossRef]
  71. Bradwell, J.; Hurd, M.; Pangloli, P.; McClure, A.; Dia, V.P. Storage Stability of Sorghum Phenolic Extracts’ Flavones Luteolin and Apigenin. LWT 2018, 97, 787–793. [Google Scholar] [CrossRef]
  72. Narang, A.S.; Delmarre, D.; Gao, D. Stable Drug Encapsulation in Micelles and Microemulsions. Int. J. Pharm. 2007, 345, 9–25. [Google Scholar] [CrossRef] [PubMed]
  73. Salaw, A. Self-Emulsifying Drug Delivery Systems: A Novel Approach To Deliver Drugs. Drug Deliv. 2022, 29, 1811–1823. [Google Scholar] [CrossRef]
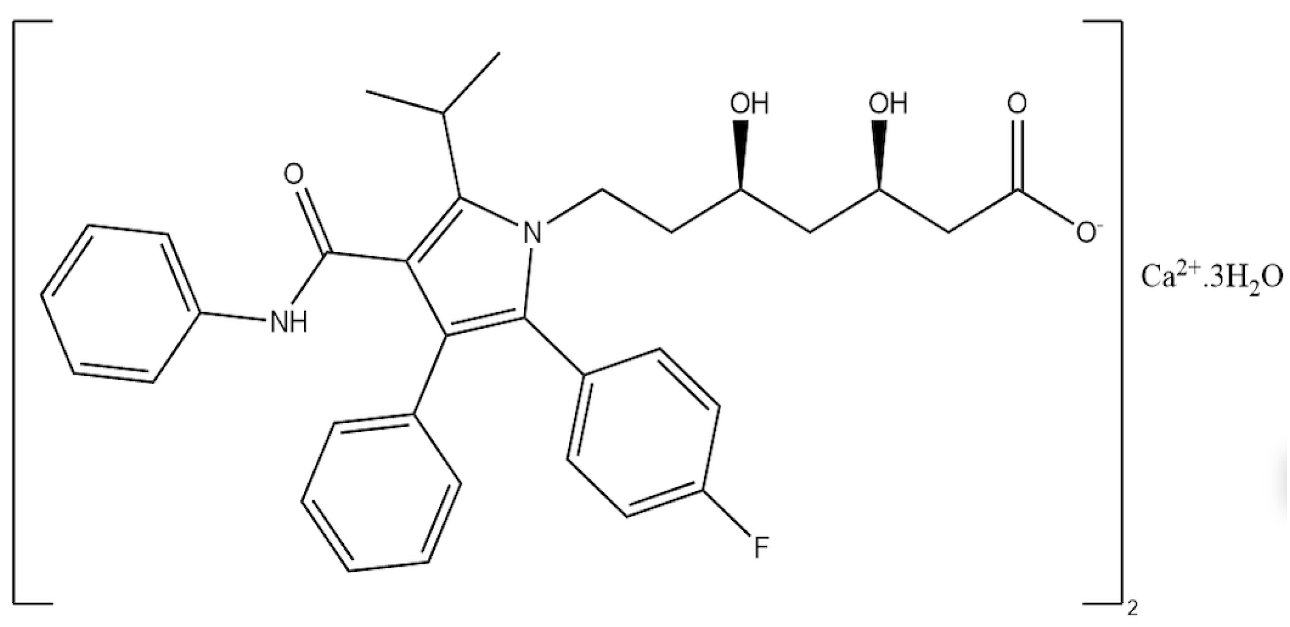
Figure 1. Chemical structure of Atorvastatin.
Processes 13 02933 g001
Figure 2. Chemical structure of Apigenin.
Processes 13 02933 g002
Figure 3. The overlaid spectra for ATV and API showed the optimum selected isosbestic point.
Processes 13 02933 g003
Figure 4. The fishbone diagram illustrating the risk factors involved in method optimization.
Processes 13 02933 g004
Figure 5. Chromatogram of ATV–API solution showing unsuccessful separation when eluted (a) at 50:50 ratio (acetonitrile: 0.1 M ammonium acetate); and (b) 60:40 ratio (acetonitrile: 0.1 M ammonium acetate).
Processes 13 02933 g005
Figure 6. The 3D surface response plotting of combinations of factors (organic phase ratio, pH buffer, and flow rate) on the selected responses as follows: (a) ATV Rt; (b) API Rt; (c) ATV Tf; (d) API Tf; and (e) resolution.
Processes 13 02933 g006aProcesses 13 02933 g006b
Figure 7. Overlay plot for method optimization.
Processes 13 02933 g007
Figure 8. The 2D contour numerical optimization predicted values, (a) desirability; (b) ATV Rt; (c) API Rt; (d) ATV Tf; (e) API Tf; and (f) resolution.
Processes 13 02933 g008
Figure 9. (a) Optimized Apigenin chromatogram at 10 µg mL−1 of the standard stock concentration; (b) optimized Atorvastatin chromatogram at 10 µg mL−1 of the standard stock concentration.
Processes 13 02933 g009
Figure 10. Overlaid spectrum of ATV and API calibration curve solutions.
Processes 13 02933 g010
Figure 11. Selectivity chromatogram showing overlaid chromatographs of (a) DMSO; (b) phosphate buffer pH = 6.8; (c) methanol solvent; (d) Capmul MCM; (e) Cremophor RH40; (f) Transcutol HP; (g) blank SMEDDS; and (h) SMEDDS-loaded ATV–API combination.
Processes 13 02933 g011
Figure 12. Chromatogram under most significant stress changes, (a) ATV standard; (b) ATV under acidic conditions after 24 h; (c) API standard; and (d) API under photolytic stress after 24 h.
Processes 13 02933 g012
Figure 13. Effect of various stress conditions on a standard solution on (a) ATV; (b) API. Data are presented as means ± SD (n = 3), * p < 0.05 when compared to the baseline value.
Processes 13 02933 g013
Figure 14. Effect of various stress conditions on SMEDDS, (a) ATV; (b) API. Data are presented as means ± SD (n = 3).
Processes 13 02933 g014
Table 1. The selected independent variables and their respective values in three levels.
VariablesLevels
Independent VariablesLowMediumHigh
A.
Organic phase ratio
304050
B.
pH of buffer system
5.86.87.8
C.
Flow rate
0.30.40.5
Table 2. Risk assessment method for identifying the risk method parameters.
ResponseRisk Affecting Parameters
QTPPSolventRatio of Mobile
Phase
pH of Buffer
System
WavelengthFlow RateRun TimeOven
Temperature
Volume
of Injection
Tailing factor (Tf)LHHMLLML
Retention time (Rt)LMLLHLLL
ResolutionMHHLLLLL
Theoretical plate number (TPN)LMMLLLLL
Red color assigned for high-risk parameter (H); green color assigned for low-risk parameter (L); yellow color assigned for medium risk parameter (M).
Table 3. Central composite design optimization parameters and responses for ATV and API, including experimental values for suggested parameters.
STDRUNOrganic Phase RatiopHFlow RateATV Rt (min)API Rt (min)ATV TfAPI TfResolution
61505.80.58.235.981.311.811.88
42507.80.311.7611.91.351.771.65
53305.80.59.27.881.341.660.4
24505.80.313.412.81.311.661.65
135406.80.314.1212.131.141.484.8
156406.80.412.059.881.141.457.8
107506.80.410.178.321.281.752.55
148406.80.59.457.251.181.55.35
89507.80.58.46.31.321.762.1
1110405.80.412.79.21.151.486.2
911306.80.413.312.211.291.664.2
712307.80.511.257.671.391.622.15
113305.80.317.5513.781.291.662.88
1214407.80.412.19.151.161.487
1615406.80.412.219.251.141.457.8
1716406.80.412.219.251.141.457.4
317307.80.316.2112.041.281.684.56
Table 4. Polynomial actual equations and statistical analysis of responses.
ResponseActual Equationp-ValueF-ValueR2Predicted R2Adjusted R2Adequate
Precision
Lack-of-Fit
p-Value
R1 = ATV Rt= 49.59 − 0.2 A − 0.146 B − 94.6 C − 0.272 AB + 0.597 AC + 6.5 BC<0.0001133.470.980.930.9840.1320.052
R2 = API Rt= 25.79 − 0.82 A − 0.25 B − 27.57 C<0.000151.910.920.860.921.630.16
R3 = ATV Tf= 4.21 − 0.108 A − 0.231 B − 0.85 C + 0.0012 AB − 0.023 AC + 0.0037 BC + 0.145 A2 + 0.016 B2 + 2.14 C2<0.000186.430.990.80.9724.65-
R4 = API Tf= 5 − 0.19 A + 0.05 B + 0.05 C + 0.001 AB + 0.025 AC − 0.027 BC + 0.22 A2 + 0.0014 B2 + 1.14 C2<0.000165.490.980.850.9720.97-
R5 = Resolution= − 75.59 + 2.61 A + 3.31 B − 96.31 C − 0.4 AB + 0.69 AC + 0.03 BC − 3.33 A2 − 0.1 B2 − 16.3 C2<0.000320.260.960.790.9112.670.073
A, organic phase ratio; B, pH buffer; C, flow rate; Rt, retention time; Tf, tailing factor.
Table 5. Optimization criteria for the selected responses.
NameGoalLower LimitUpper LimitImportance
A: Organic phase ratioIn range30503
B: pH bufferIn range5.87.83
C: Flow rateIn range0.30.53
ATV RtMinimize8.2317.553
API RtIn range 5.9813.783
ATV TfMinimize1.141.394
API TfMinimize1.451.815
ResolutionMaximize0.47.85
Table 6. Optimized parameters and predicted response results, and desirability value.
Organic Phase Ratio pH BufferFlow Rate
(mL min−1)
ATV Rt (min)ATV TfAPI Rt (min)API TfResolutionDesirability
39.867.030.4111.551.149.141.467.10.88
Table 7. Prediction error analysis of predicted and experimental response values under desirability conditions.
ResponseATV
Predicted
API
Predicted
ATV
Experimental
API
Experimental
Relative Prediction Error (%) ATVRelative Prediction Error (%) API
Rt11.559.1412.219.255.810.65
Tf1.141.461.141.4501.36
Resolution ATV–API7.17.17.87.88.088.08
Table 8. Suitability parameters for ATV and API against the accepted criteria. Mean ± SD (n = 6).
Suitability ParametersATV (5 µg mL−1)RSD%API (5 µg mL−1)RSD%Accepted Limits [61]
Retention time (min)12.21 ± 0.020.169.25 ± 0.010.11-
Tailing factor1.14 ± 0.010.881.45 ± 0.021.38≤2
Resolution7.83 ± 0.000.06.58 ± 0.040.61>2
Theoretical plate number9445 ± 13.610.146948 ± 17.340.25>2000
Table 9. Linearity and regression equation values.
ParameterATVAPI
Regression equationy = (49,285)x + (−209.45)y = (38,797)x + (1873.4)
Slope49,28538,797
y-intercept−209.451873.4
R20.99990.9998
Ranges (μg mL−1)0.1–100.1–10
LOD (μg mL−1)0.160.26
LOQ (μg mL−1)0.490.81
Table 10. Precision results for ATV and API repeatability within inter- and intra-day analysis. Mean ± SD (n = 3).
CompoundNominated Conc. µg mL−1Calculated Concentration µg mL−1 (Intra-Day)Precision
(% RSD)
Calculated Concentration µg mL−1 (Inter-Day)Precision
(% RSD)
ATV0.50.5 ± 0.011.940.51 ± 0.000.98
55 ± 0.050.94.96 ± 0.12.02
1010.1 ± 0.070.729.97 ± 0.050.51
API11 ± 0.021.960.97 ± 0.022.04
55.13 ± 0.081.495.17 ± 0.112.04
1010.4 ± 0.171.6210.38 ± 0.131.22
Table 11. Robustness parameters for ATV and API concerning peak area and retention time. Mean ± SD (n = 3).
ParametersModification LevelPeak Area (API)% RSDPeak Area (ATV)% RSDRt (API)% RSDRt (ATV)% RSD
Wavelength detection (nm)+2 (268 nm)197,817 ± 36581.85242,506 ± 31511.309.11 ± 0.010.1612.26 ± 0.030.24
0 (266 nm)203,008 ± 32811.62246,038 ± 42281.729.11 ± 0.010.1312.31 ± 0.040.36
−2 (264 nm)202,255 ± 34611.71246,825 ± 31921.299.15 ± 0.050.5912.31 ± 0.060.47
pH of buffer+0.2 (7.2)200,237 ± 41792.09248,466 ± 24871.008.86 ± 0.050.6112.29 ± 0.070.55
0 (7.0)200,720 ± 32831.64246,730 ± 29161.189.24 ± 0.040.3912.23 ± 0.010.12
−0.2 (6.8)198,031 ± 41292.09247,924 ± 27121.099.28 ± 0.060.5912.25 ± 0.030.24
Flow rate (mL min−1)+0.2 (0.43)205,241 ± 35471.73241,799 ± 29851.238.39 ± 0.060.7211.29 ± 0.10.91
0 (0.41)199,054 ± 38581.94247,597 ± 39381.599.11 ± 0.020.2512.05 ± 0.131.11
−0.2 (0.39)205,631 ± 29721.45240,924 ± 38111.589.39 ± 0.030.2812.36 ± 0.030.26
Mobile phase composition+0.05 (0.45:0.55)202,010 ± 19240.95247,580 ± 38291.559.02 ± 0.11.5511.62 ± 0.050.44
0 (0.4:0.6)200,904 ± 13670.68247,596 ± 37961.539.21 ± 0.060.7112.25 ± 0.040.34
−0.05 (0.35:0.65)201,250 ± 31051.54235,465 ± 26791.149.17 ± 0.330.312.22 ± 0.040.29
Rt, retention time (min); SD, standard deviation (n = 3); RSD, relative standard deviation.
Table 12. Stress study for the standard ATV and API solution in different stressful conditions at 0 time and 24 h of exposure. Mean ± SD (n = 3).
Stress StudyTime
of Exposure (h)
% Recovery (ATV)Time
of Exposure (h)
% Recovery (ATV)Time
of Exposure (h)
% Recovery (API)Time
of Exposure (h)
% Recovery (API)
Acidic (1 mM HCl)096.29 ± 0.662481.33 ± 4.96097.83 ± 0.352492.25 ± 1.9
Basic (1 mM NaOH)097.11 ± 0.42496.46 ± 3.25097.39 ± 1.022486.16 ± 1.4
Oxidative (3% H2O2)098.35 ± 2.12497.67 ± 1.57098.29 ± 1.762488.12 ± 0.47
Photolytic (UV)098.25 ± 1.232497.94 ± 0.8097.83 ± 0.372469.19 ± 3.84
Heat (80 °C)098.88 ± 1.9297.62 ± 0.4097.1 ± 4.08289.72 ± 3.5
Table 13. Stress study for the ATV and API loading in SMEDDS in different stressful conditions at 0 time and 24 h of exposure. Mean ± SD (n =3).
Stress StudyTime
of Exposure (h)
% Recovery (ATV)Time
of Exposure (h)
% Recovery (ATV)Time
of Exposure (h)
% Recovery (API)Time
of Exposure (h)
% Recovery (API)
Acidic (1 mM HCl)0100.79 ± 1.312499.22 ± 0.290100.2 ± 0.342499.53 ± 1.75
Basic (1 mM NaOH)0101.55 ± 5.0224101.99 ± 5.240102.32 ± 2.492498.35 ± 4.4
Oxidative (3% H2O2)098.48 ± 11.242497.7 ± 0.71098.2 ± 10.832498.44 ± 1.73
Photolytic (UV)0100.64 ± 9.372499.37 ± 1.960100.69 ± 10.092498.4 ± 1.67
Heat (80 °C)0100.79 ± 1.312101.28 ± 6.23099.2 ± 0.44293.94 ± 8.92
Disclaimer/Publisher’s Note: The statements, opinions and data contained in all publications are solely those of the individual author(s) and contributor(s) and not of MDPI and/or the editor(s). MDPI and/or the editor(s) disclaim responsibility for any injury to people or property resulting from any ideas, methods, instructions or products referred to in the content.