Article

Study of Gas–Water Two-Phase Flow Characteristics During Water Invasion in Large Bottom-Water Gas Reservoirs Based on Long-Core Dynamic Simulation

1
State Key Laboratory of Low Carbon Catalysis and Carbon Dioxide Utilization, Yangtze University, Wuhan 430100, China
2
Hubei Key Laboratory of Oil and Gas Drilling and Production Engineering, Yangtze University, Wuhan 430100, China
3
College of Petroleum Engineering, Yangtze University, Wuhan 430100, China
*
Author to whom correspondence should be addressed.
Processes 2025, 13(9), 2761; https://doi.org/10.3390/pr13092761
Submission received: 10 July 2025 / Revised: 22 August 2025 / Accepted: 26 August 2025 / Published: 28 August 2025
(This article belongs to the Section Chemical Processes and Systems)

Abstract

In this study, we investigated the influence of water invasion velocity on gas–water permeability in bottom-water gas reservoirs. We conducted simultaneous core water invasion experiments under actual reservoir conditions, systematically examining varied permeability cores and multiple influx velocities. Two data processing methods were comparatively validated, analyzing gas–water relative permeability curves, fractional flow curves, and injection volume–recovery efficiency relationships. The results indicate that under HTHP (high-temperature, high-pressure) conditions, gas relative permeability declines faster, while water relative permeability increases more significantly. NMR imaging revealed that water preferentially invades smaller pores, accelerating gas–water flow before entering larger pores, leading to a rapid increase in water relative permeability. Long-core experiments unveiled a waterfront “stepwise advance” and localized water channeling due to heterogeneity, which were not observed in short-core tests. Water influx velocity critically influences fractional flow curves: high velocities cause rapid post-breakthrough water cut increase, easily inducing fast water breakthrough and coning, whereas low velocities promote a uniform frontal advance. HTHP (high-temperature, high-pressure) long-core flooding experiments more accurately reflect actual reservoir water influx dynamics, offering key insights for optimizing development strategies, delaying water influx, and enhancing recovery efficiency.

1. Introduction

Bottom-water gas reservoirs, as vital components of natural gas resources, play a pivotal role in the global energy supply. China’s offshore gas fields are categorized into five primary types: condensate gas reservoirs, low-permeability gas reservoirs, edge/bottom-water gas reservoirs, high-temperature/high-pressure sour gas reservoirs, and deepwater gas reservoirs [1,2,3,4,5,6,7,8]. In the high-temperature/high-pressure large bottom-water gas reservoirs of the South China Sea, water invasion during actual reservoir development critically impacts flow behavior, transitioning initial single-phase flow into gas–water two-phase flow. The increased flow resistance during early-stage water invasion variably affects recovery efficiency [9,10,11]. Prolonged water invasion leads to substantial water influx into the reservoir, potentially inducing water blocking or flooding. This increases abandonment pressure, thereby accelerating recovery efficiency decline [12,13]. In actual reservoir conditions, water invasion rates dynamically evolve across development phases, where rate magnitude variations induce differential formation damage within the reservoir system [14,15,16,17]. During the initial depletion-driven water invasion phase, aquifer energy can enhance gas reservoir development to a limited extent.
In recent years, researchers worldwide have conducted physical simulation experiments and systematic investigations to study water invasion [15,18,19,20,21,22]. Fang et al. conducted visualized physical modeling experiments on diverse reservoir types, investigating water invasion mechanisms in porous, fractured, vuggy, and fractured vuggy reservoirs [23]. Fang et al. investigated carbonate gas reservoirs by simulating water invasion processes, analyzing the impacts of reservoir characteristics and production parameters including water cut, permeability, and recovery efficiency [24]. Huang et al. conducted experiments using visualized sand-packed tubes, investigating the effects of dissolved gas on gas–water two-phase contact behavior during desorption processes in water-drive gas reservoirs [25]. Xu et al. designed and performed physical simulation experiments of water invasion to investigate the effects of fracture–well spacing, drainage location, drainage duration, and aquifer size on water encroachment and reservoir production performance, aiming to enhance the understanding of water invasion mechanisms and optimize water control strategies in fractured water-invaded gas reservoirs [26]. Xu et al. developed a physical simulation experimental methodology, measured intra-reservoir dynamic pressure decline curves, and conducted comparative analyses of enhanced gas recovery efficiency and water control measures under varying aquifer-to-reservoir volume ratios [27]. Han et al. investigated the microstructure of pore size distribution in target sandstone samples using high-pressure mercury intrusion experiments. They found that permeability decreases in a power-law function with increasing confining pressure, while the compressibility coefficient and permeability variation coefficient decrease as the compression coefficient increases [28]. Ren et al. converted the NMR T2 curves of 100% water-saturated cores into pore-throat radius distribution curves. Based on this, they conducted imbibition and displacement experiments to analyze fluid distribution and imbibition volume and rate characteristics in pores of different sizes at various durations [29]. Chen et al. employed a low-field nuclear magnetic resonance core analysis system to experimentally study fluid flow and distribution characteristics during spontaneous imbibition and centrifugal displacement processes. They identified three main controlling factors affecting fluid dynamics and distribution differences: core petrophysical properties, microstructure, and dispersed clay minerals [30].
Research on water invasion and two-phase flow in bottom-water gas reservoirs remains limited. Conventional experimental methods using short cores fail to accurately simulate vertical heterogeneity and long-distance waterfront advancement in gas reservoirs. Moreover, ambient-condition experiments neglect critical factors such as gas compressibility and dissolved gas liberation under high-temperature/high-pressure conditions, leading to significant deviations between experimental results and actual reservoir behavior. While most existing studies analyze water invasion phenomena through macroscopic perspectives of water encroachment and depletion, this study additionally employs nuclear magnetic resonance scanning to determine gas–water distribution patterns within cores based on NMR signal intensity, providing microscopic insights into relative permeability curve variations during water invasion in bottom-water gas reservoirs [24,31,32,33,34,35].
Studying gas–water relative permeability characteristics offers a better understanding of dynamic water invasion patterns under actual reservoir conditions. We conducted comparative experiments, including conventional short-core tests on gas–water relative permeability variations under different water invasion rates in bottom-water gas reservoirs and HTHP long-core tests on medium-permeability samples under varying invasion rates. NMR scans were performed before and after short-core experiments to provide a theoretical basis for gas–water relative permeability changes from a microscopic perspective. The water invasion experiments employed four different invasion rate conditions, establishing methodologies for studying gas–water two-phase flow in actual bottom-water gas reservoirs and ultimately providing evidence for effective development strategies based on how flow characteristics affect recovery efficiency.

2. Experimental Procedure

2.1. Materials and Instruments

Experimental cores were extracted from a South China Sea block. To study medium-permeability cores under varying water invasion rates during gas displacement, 11 field cores with a total length of 62.975 cm, an average permeability of 65.2 mD, and a total pore volume of 58.82 cm3 were selected. The core properties are detailed in Table 1. Reservoir conditions include a temperature of 147 °C and a pressure of 53 MPa.
Formation water: Field water samples were filtered through a 0.45 μm membrane using a sintered glass funnel prior to experiments, and the ionic composition analysis results are shown in Table 2.
Simulated gas: Humidified nitrogen was used to simulate natural gas.
The following experimental equipment was used: a long-core holder and intermediate containers (Hai’an Petroleum Scientific Instruments Co., Ltd., Haian, China), a high-pressure displacement pump (Jiangsu Lian you Scientific Instruments Co., Ltd., Haian, China), a Sartorius BSA423S-CW electronic analytical balance (Sartorius Scientific Instruments (Beijing) Co., Ltd., Beijing, China), and a constant-temperature oven (Hai’an Petroleum Scientific Instruments Co., Ltd., Haian, China).

2.2. Experimental Methods

The experimental procedure for simulating water invasion dynamics and measuring relative permeability is shown in Figure 1; it was conducted in accordance with the Chinese national standard GB/T 28912-2012 “Method for determining relative permeability of two-phase fluids in rocks” [36]. The conventional water invasion dynamic simulation experiment was conducted under normal temperature and pressure conditions, while the high-temperature and high-pressure water invasion dynamic simulation experiment was conducted at 147 °C and 53 MPa. The detailed experimental steps are described below.
(a)
Sample Preparation
① Core preparation: Experimental cores were dried and then measured for basic petrophysical parameters (length, diameter, porosity, and permeability).
② Fluid preparation: The formation water and humidified nitrogen gas were separately pressurized to the target pressure in two intermediate containers.
(b)
Experimental Setup
Core saturation: Vacuum-treated cores were pressure-saturated with simulated formation water.
(c)
Conventional Water Invasion Dynamic Simulation (Relative Permeability Measurement)
① Representative water-saturated cores were loaded into holders, NMR-scanned, and then flooded at a constant rate until pressure/flow-stabilized for the initial water permeability measurement.
② Nitrogen flooding established irreducible water saturation (Swi = 48.21%).
③ Formation water flooded the cores at designated rates while pressure/production data were recorded until a residual gas state was reached, followed by water permeability measurement at Sgr and relative permeability curve generation.
④ Post-flooding NMR scans were conducted after each rate experiment.
(d)
HTHP Long-Core Water Invasion Simulation
① Water-saturated cores were loaded and flooded at a constant rate until stabilization for initial water permeability.
② Nitrogen flooding was established: Swi = 48.21%.
③ Formation water flooding occurred at designated rates with pressure/production monitoring until a Sgr state was reached, followed by permeability measurement and curve generation.

3. Experimental Results and Discussion

3.1. Relative Permeability Characteristics in Conventional Core Water Invasion Simulation

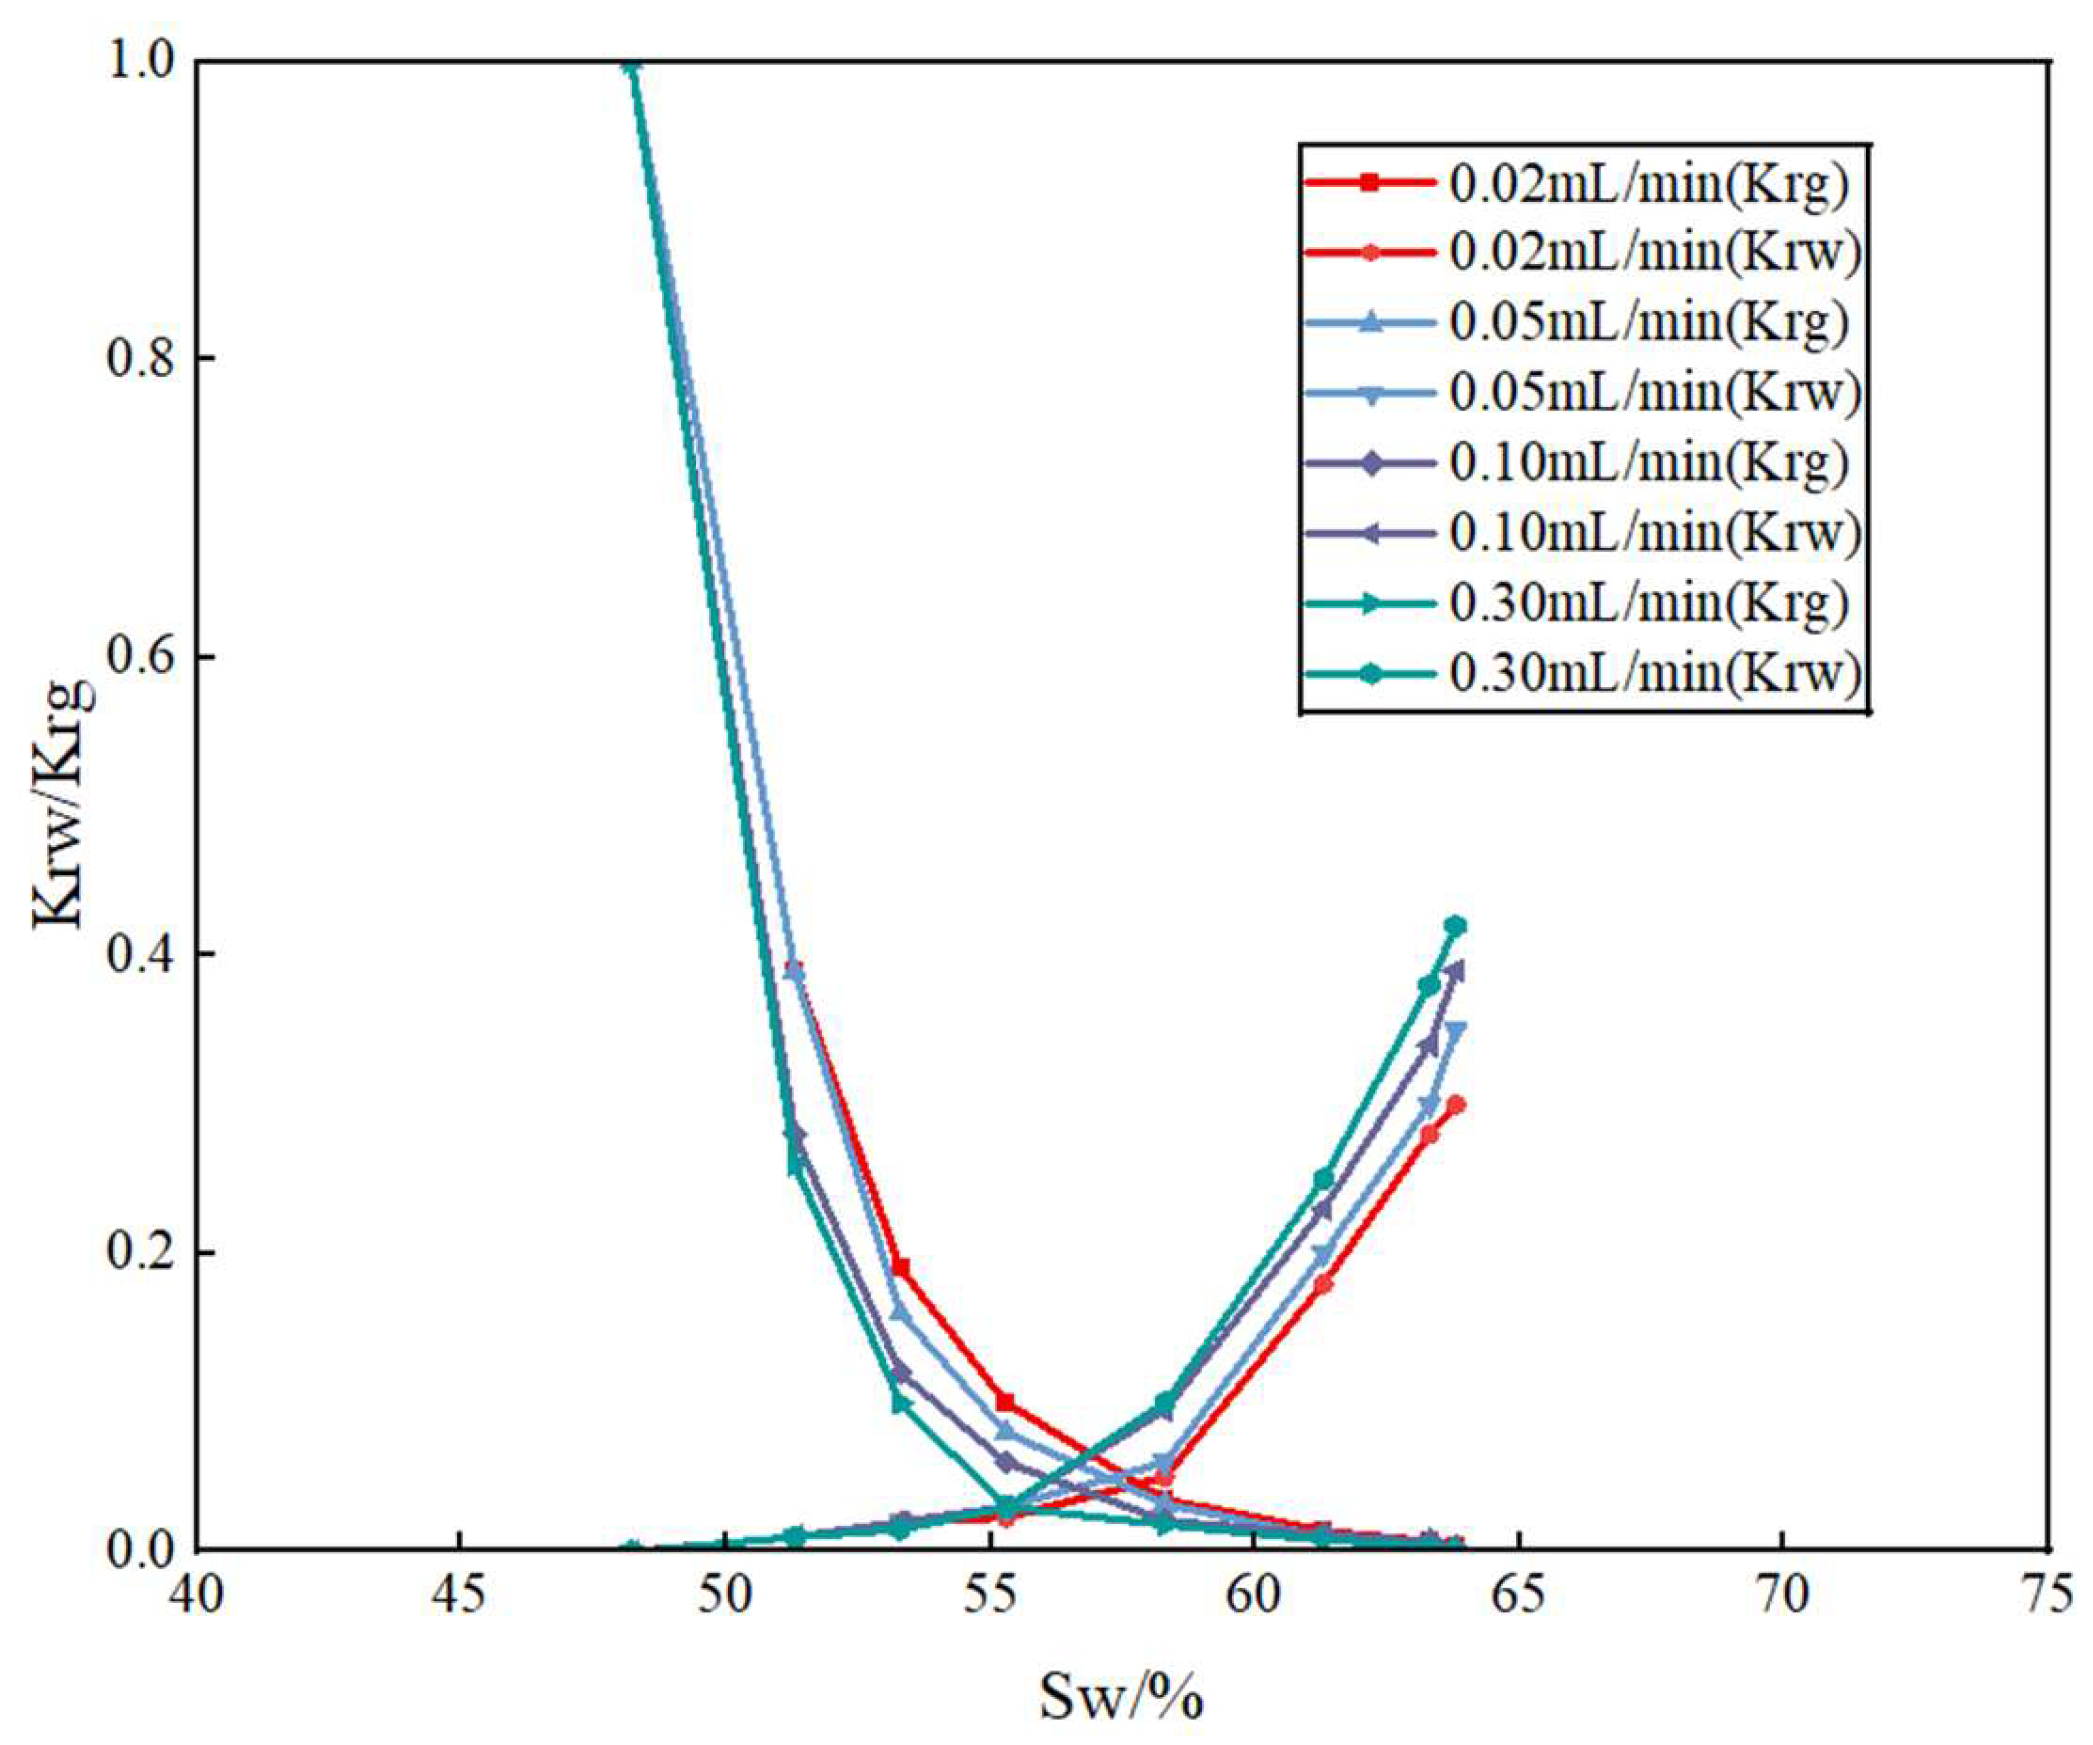
Based on real-time gas/water production data and pressure differentials recorded at the core outlet during gas displacement experiments, the JBN method was employed to calculate gas/water relative permeability and corresponding gas saturation. The derived relative permeability curves for medium-permeability cores under different water invasion rates are presented in Figure 2.

3.2. Patterns from NMR Scanning Results

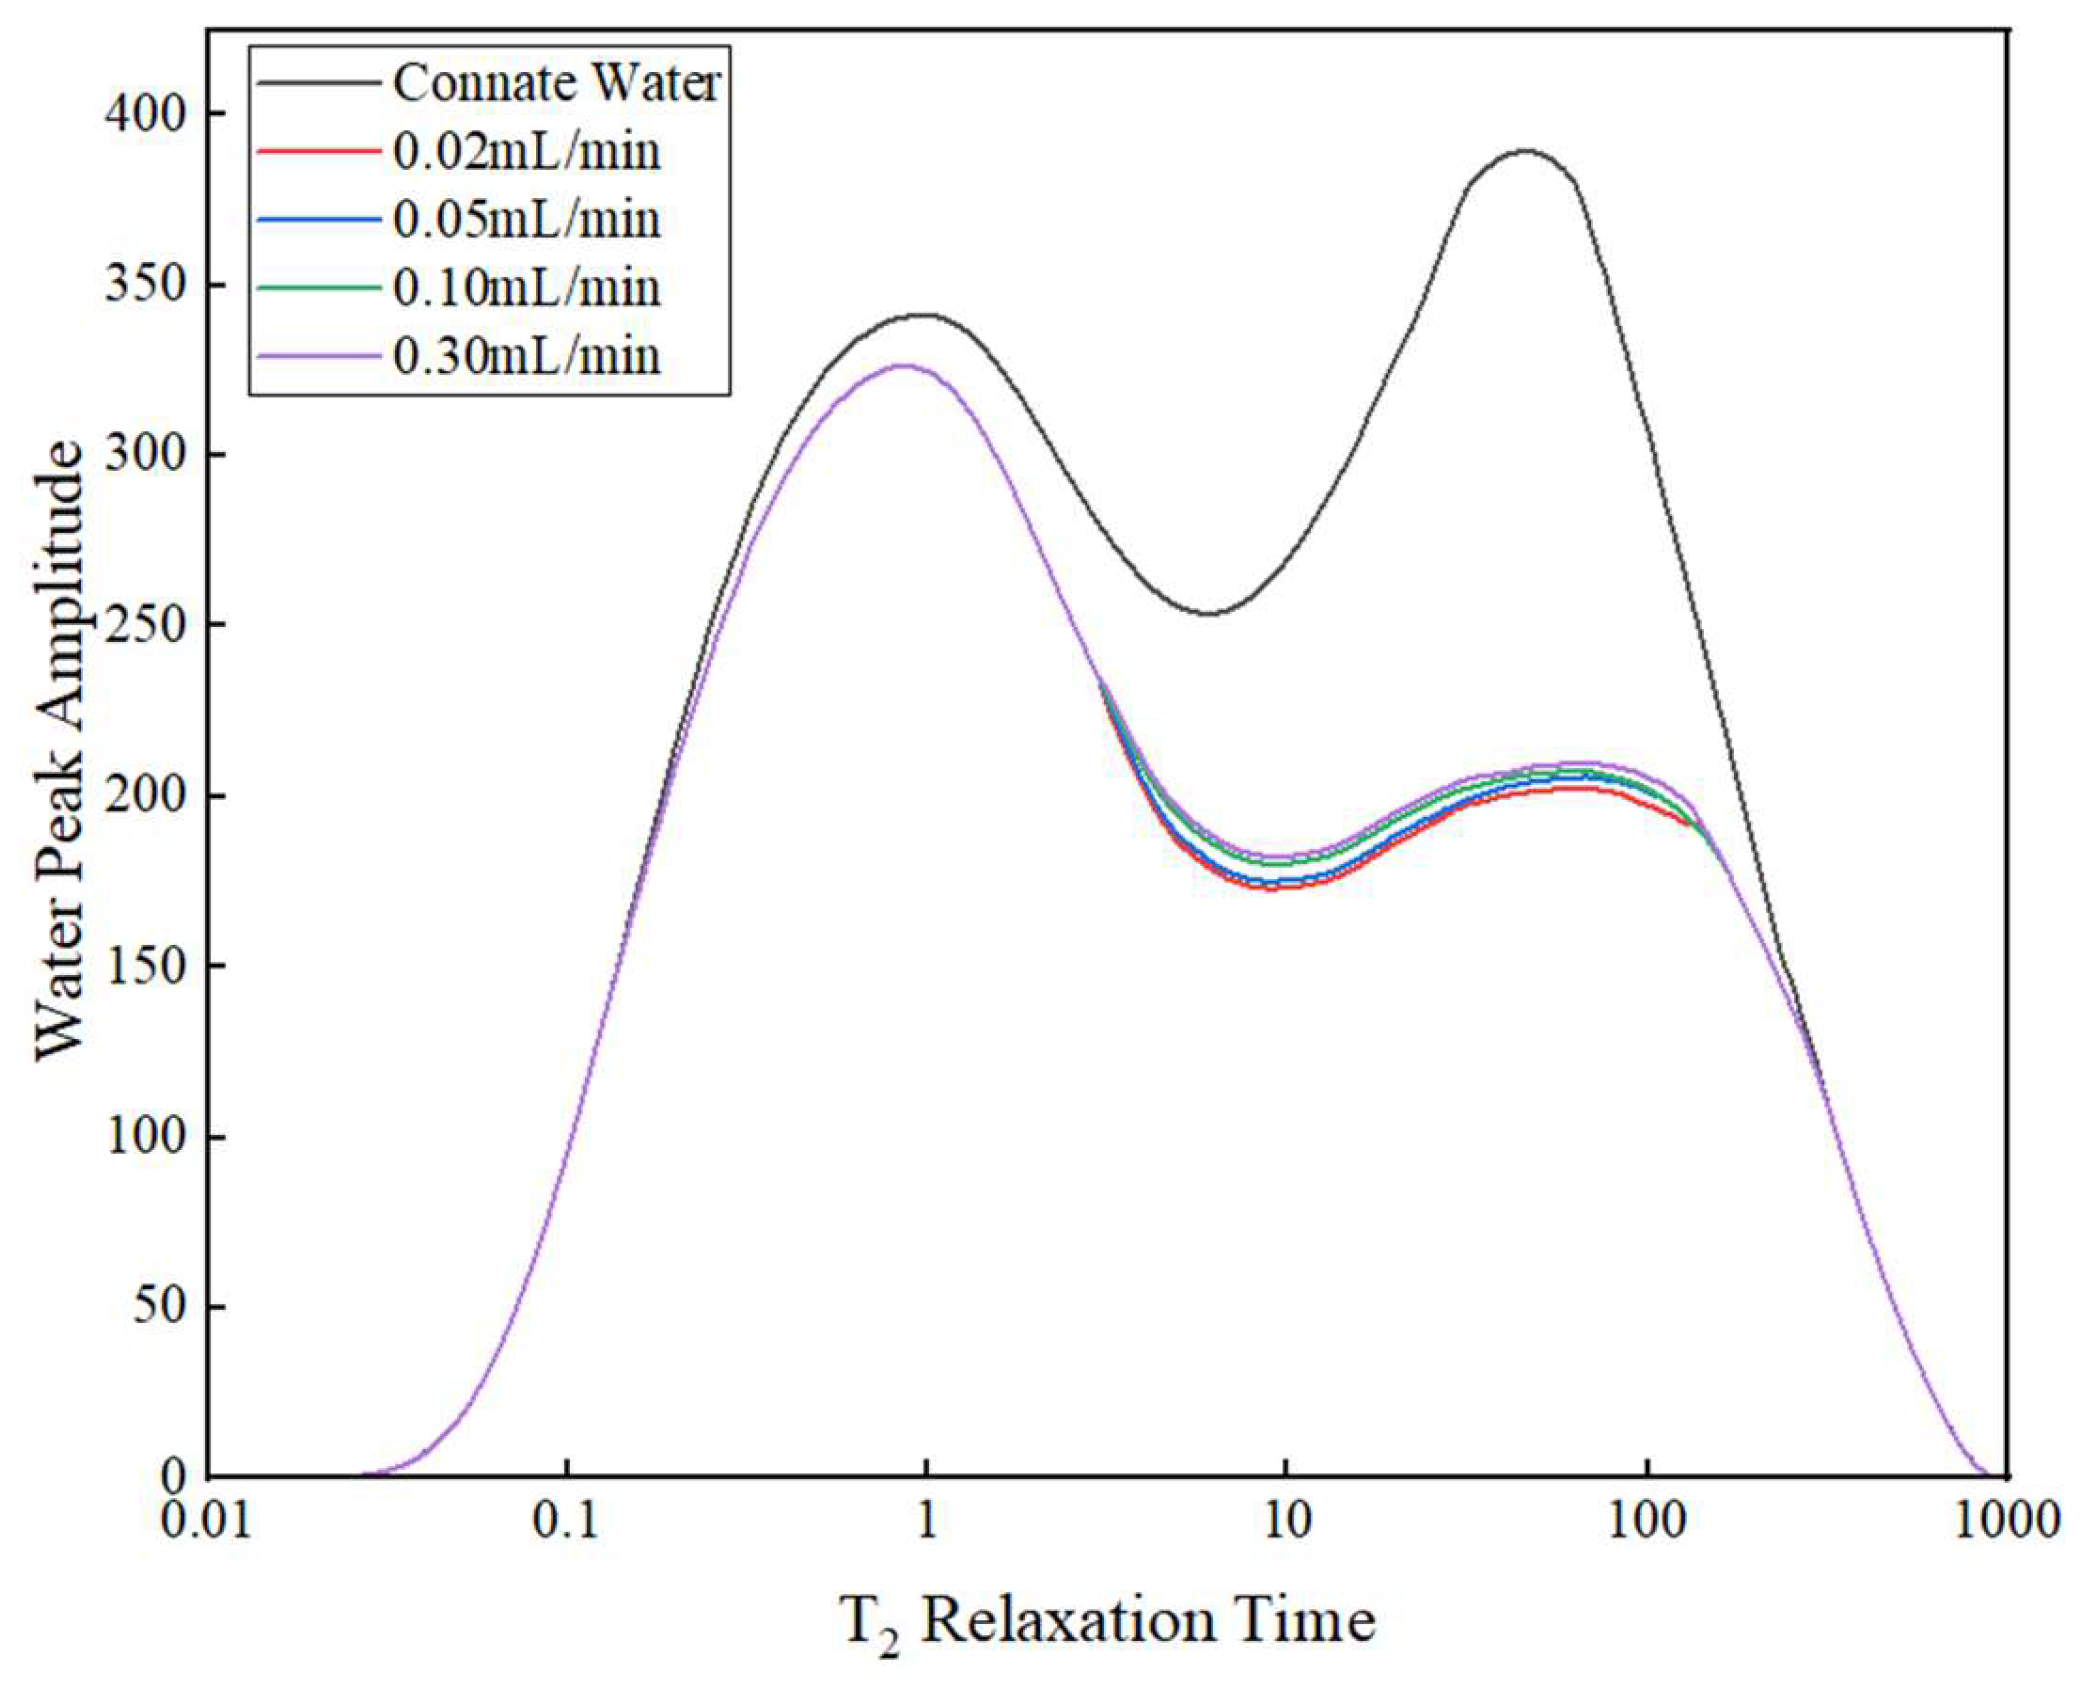
In core flow experiments, the distribution of fluids and changes in saturation are crucial parameters for studying reservoir injection–production efficiency and effective storage space, playing a vital role in understanding gas–water relative permeability behavior. By using NMR imaging to monitor fluid distribution within cores, we assessed the impact of different water invasion rates on gas–water flow through fluid saturation and signal intensity, providing parameter guidance for water-invaded gas reservoir development. Figure 3 shows the T2 spectra obtained from NMR scans of conventional water-saturated cores under various water invasion conditions. In the figure, the vertical axis represents the T2 transverse relaxation time, while the horizontal axis indicates signal intensity.
Figure 3 shows that the relaxation curve of the selected rock core shows a bimodal pattern, with the water signal intensity at the right peak of the bimodal pattern being stronger. The rock core in question is dominated by the bimodal right peak, indicating that most of the formation water is saturated in the macropores. T2 ranges from 0.016 to 880 ms, with a peak occurring around 47 ms, reflecting strong heterogeneity and relatively large pore radii in the core. Observations of fluid distribution under different water invasion rates reveal that as the invasion rate increases, the NMR signal intensity in macropores shows an increasing trend, demonstrating gradual growth in water saturation within the core. At a water invasion rate of 0.3 mL/min, the signal intensity peak reaches its maximum, while the minimum peak value occurs at 0.03 mL/min. The overall trend indicates that signal peak intensity increases with higher water invasion rates. The water-wet rock exhibits significantly increased T2 peaks after water flooding [37,38,39]. By dividing the peak intervals into short T2 peaks (<10 ms), which correspond to micropores, and medium T2 peaks (10–100 ms), which represent mesopores, it is evident that the core predominantly consists of mesopores. During the early stage of water invasion, water preferentially flows through small pore channels. As water invasion progresses, water enters mesopores, forming dominant flow pathways and leading to rapid increases in water-phase permeability and sharp decreases in gas-phase permeability.

3.3. Analysis of Gas–Water Relative Permeability Variations Under Different Water Invasion Rates Using the JBN Method

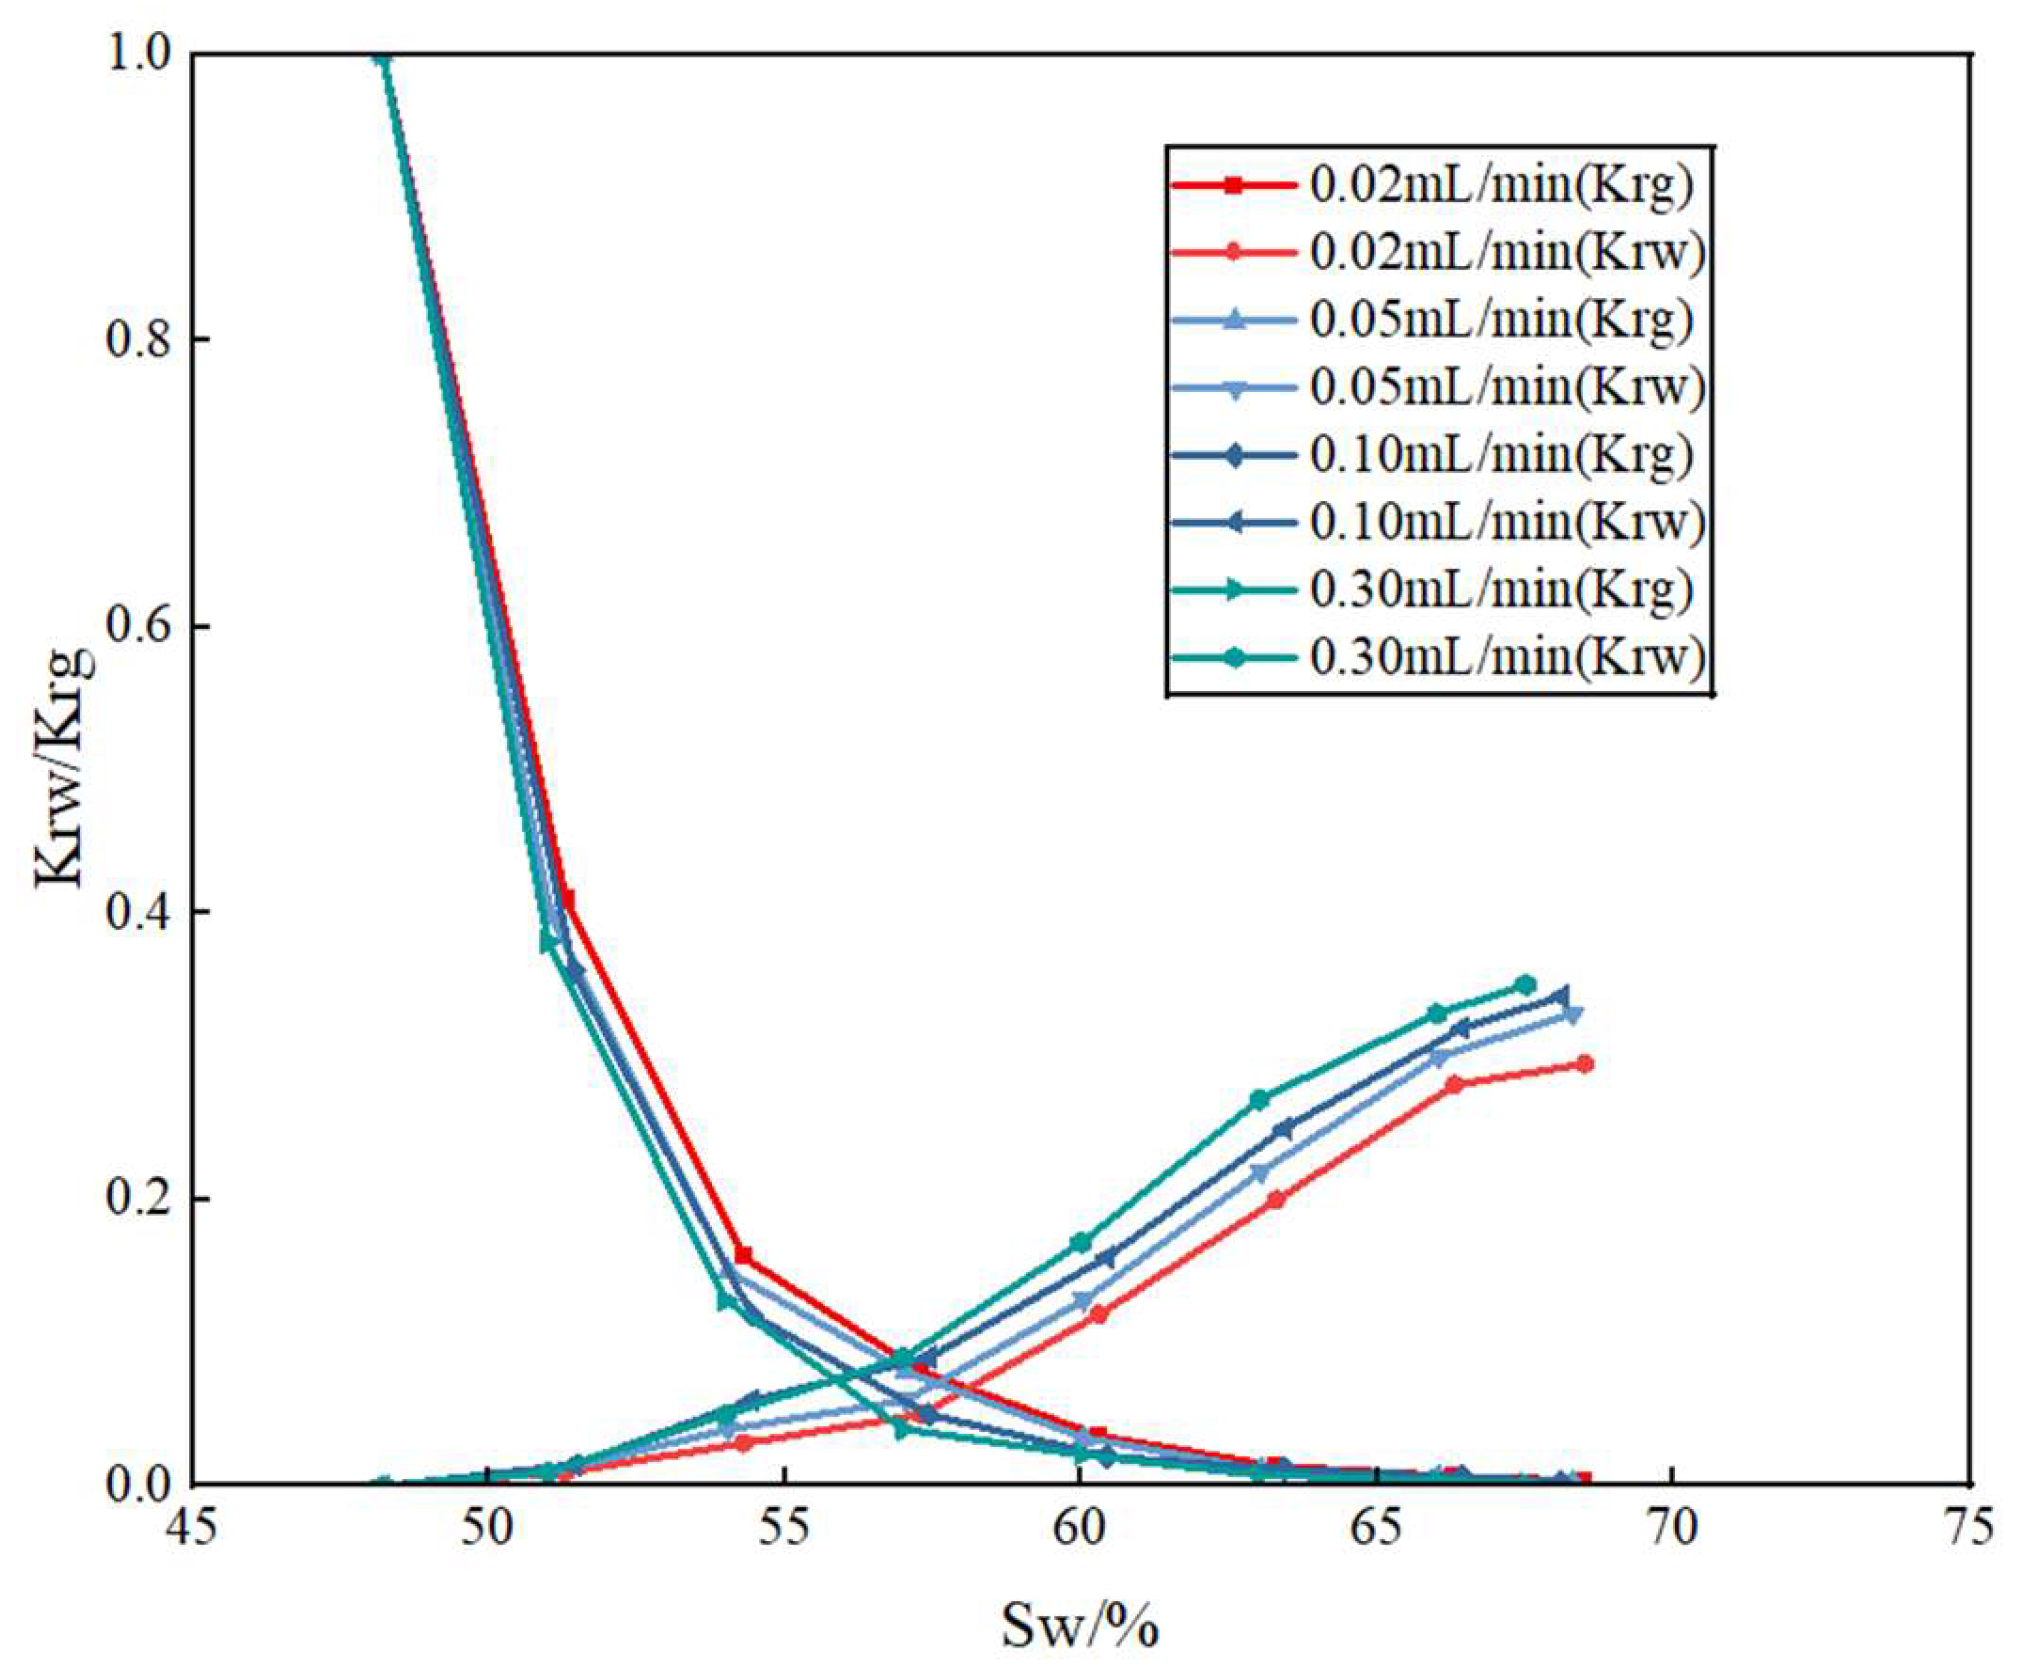
The gas–water relative permeability curves were analyzed according to the JBN method specified in the Chinese National Standard GB/T 28912-2012 “Determination Method of Relative Permeability for Two-Phase Fluids in Rocks” [36]. Experimental data including gas production, water production, and pressure differentials at the core outlet during gas displacement were recorded. The JBN method was applied to calculate gas–water relative permeability and corresponding gas saturation. The resulting relative permeability curves for medium-permeability cores under different water invasion rates are shown in Figure 4, where the Y-axis represents water-phase relative permeability (Krw) and gas-phase relative permeability (Krg), and the X-axis represents water saturation (Sw).
Analysis of Gas–Water Relative Permeability Curves via the Conventional JBN Method: The gas relative permeability curve shows a concave-shaped declining trend. As water invasion rates increase, water occupies more pore space; gas channels are divided, narrowed, or even interrupted; and gas can no longer flow continuously, leading to greater gas-phase flow resistance and accelerated reduction in gas permeability. The water relative permeability curve exhibits an S-shaped growth pattern, divided into three distinct phases. In the early stage of water invasion, when water saturation is low, capillary force promotes water to enter smaller pores, and water exists in a bound state on the surfaces of small pores or particles without forming a continuous flow network. The gas phase occupies large pore channels, and the water flow only passes through narrow paths, resulting in a slow increase in water phase permeability. Mid-Term Water Invasion Phase: Water gradually occupies medium-sized pores and establishes connected flow paths, significantly increasing effective flow in the cross-sectional area. Gas is displaced to residual states, reducing water flow resistance and accelerating permeability growth. Late Water Invasion Phase: Residual gas exists as isolated bubbles or films, obstructing water channels and restricting permeability increase. With macropores already being water-occupied, further permeability growth approaches the upper limit of the pore structure.

3.4. Analysis of Gas–Water Relative Permeability Variations Under Different Water Invasion Rates via Normalized Regression Analysis

In accordance with Darcy’s law, the flow behavior of each phase in gas–water two-phase systems follows Darcy’s principles. The phase permeability of individual fluids can therefore be calculated using the total production rates and in situ reservoir fluid volumes. To validate the experimental findings and ensure the reliability of field application recommendations, this study conducts a comparative analysis with the Normalized Regression Analysis methodology.
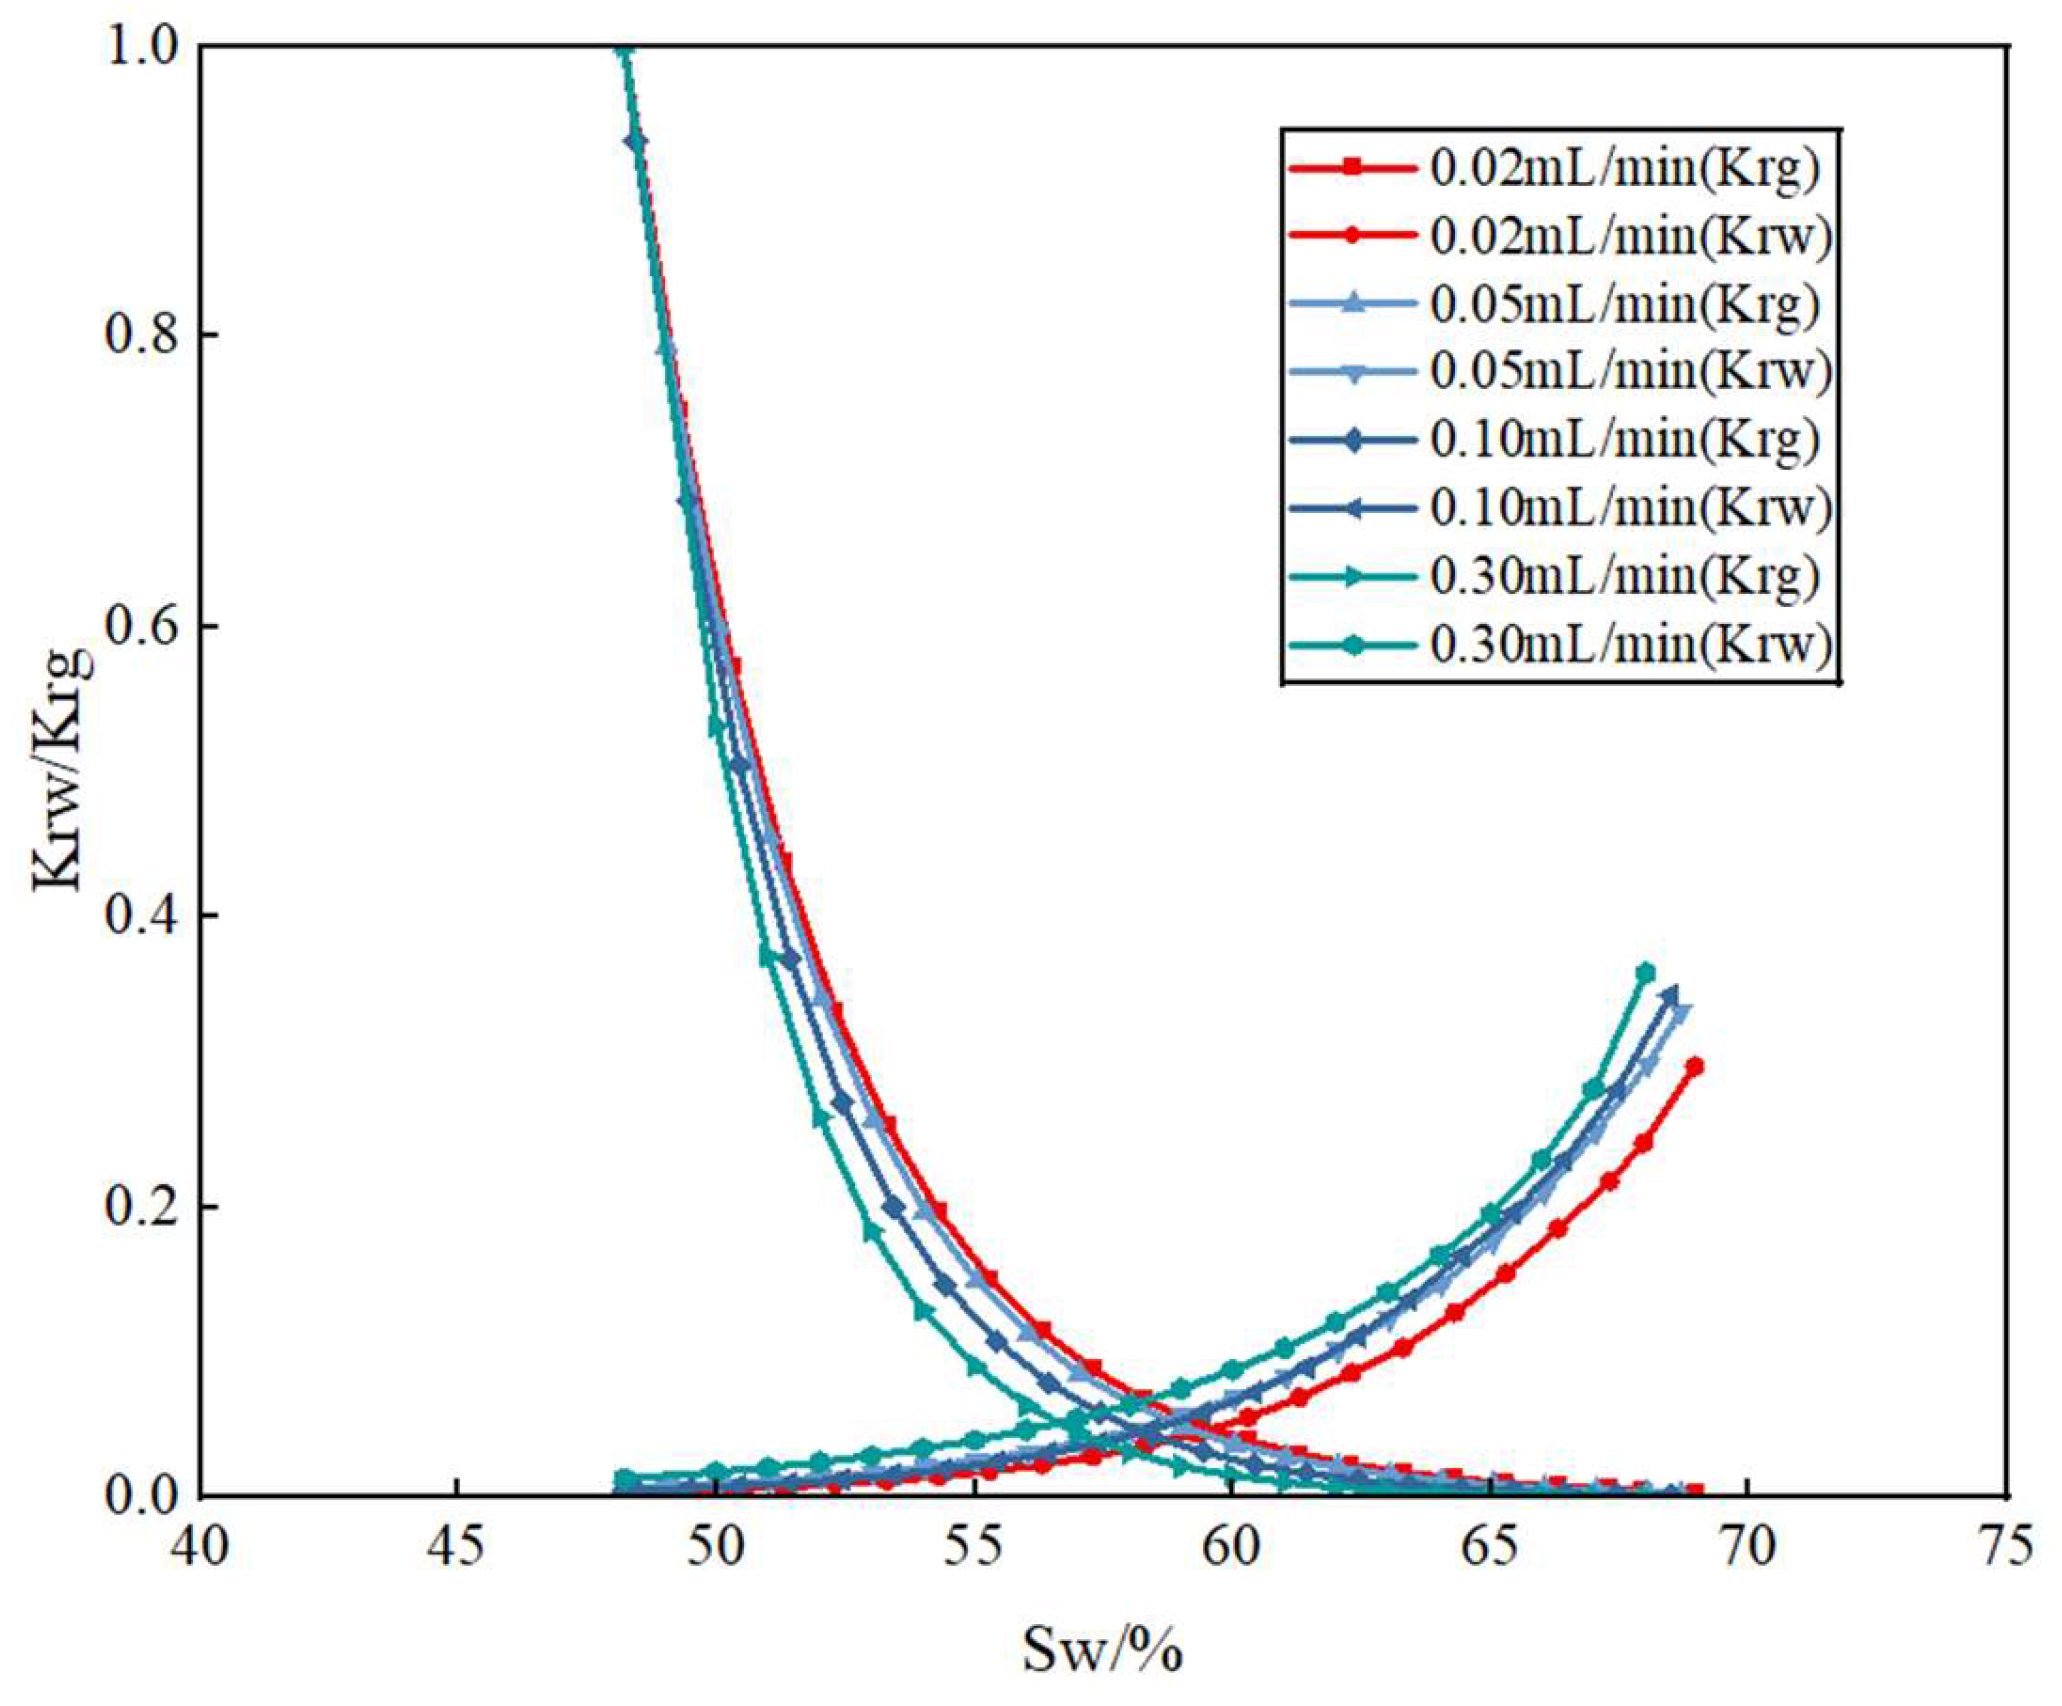
Experimental gas–water relative permeability data were normalized through regression analysis and plotted under varying water invasion rates (Figure 5), with the characteristic parameters listed in Table 3. The results indicate that gas flow capacity in medium-permeability cores declines significantly as water invasion rates increase. Gas-phase permeability exhibits an initial rapid decline followed by slower reduction, while water-phase permeability shows an initial slow increase followed by accelerated growth. The co-percolation point’s water saturation shifts leftward overall, indicating the reservoir’s hydrophilic nature, with a pronounced leftward shift observed at 0.3 mL/min compared to lower invasion rates. Table 3 reveals that residual gas saturation decreases from a maximum of 68.95% to 68% with increasing invasion rates, and the co-percolation zone narrows from 20.74% to 19.79%, with a notable reduction at 0.3 mL/min. Water-phase permeability under residual gas saturation progressively increases with higher invasion rates, demonstrating a marked enhancement at 0.05 mL/min. In the table, irreducible water saturation is denoted by Swi, and water saturation at residual gas is denoted by Sw@Sgr.
Experimental analysis demonstrates that gas-phase relative permeability decreases with increasing water invasion rates. Higher invasion rates accelerate gas–water two-phase flow, where invading water rapidly forms aqueous films on pore surfaces [40,41,42], increasing gas-phase flow resistance and causing a sharp decline in gas-phase relative permeability. Simultaneously, due to the rock’s hydrophilic nature, water preferentially occupies micropores before advancing into macropores, further impeding gas-phase flow. When water accumulation forms continuous water pathways, water-phase permeability increases abruptly, resulting in a progressive reduction in the co-percolation zone and a leftward shift in water saturation at the iso-permeability point as invasion rates increase. From a microscopic flow perspective, variations in water invasion rates significantly govern gas–water flow capacity in the formation.
In large bottom-water gas reservoirs, severe water flooding during late-stage water invasion leads to a progressive increase in water-phase relative permeability. The JBN method, due to its reliance on point-wise integration and differentiation operations, exhibits high sensitivity to experimental noise and demands stringent laboratory conditions and operational protocols. Minor operational fluctuations can introduce significant deviations in the results, limiting the ability to comprehensively characterize post-invasion reservoir dynamics. This study’s comprehensive analysis focuses on normalized and regression-fitted experimental data to investigate these mechanisms.

3.5. Gas–Water Two-Phase Flow Fractional Flow Characteristics

Based on the average gas–water relative permeability, formation gas viscosity, and formation water viscosity, the relationship between water cut (fw) and water saturation (Sw) can be derived to calculate the fractional flow curve (fw and Sw relationship).
Formula (1).
f w = Q w Q w + Q g = K w μ w K w μ w + K g μ g = 1 1 + K r g K r w μ w μ g
Formula (2).
K r g K r w = 1 f w f w × μ g μ w = a e b S w
Formula (1) can be substituted into Formula (2) to obtain Formula (3) (fw and Sw relationship).
Formula (3) [43,44].
f w = 1 1 + μ w μ g a e b S w
Figure 6 reveals the following characteristics of bottom-water gas reservoirs: After water breakthrough, the water cut (fw) increases rapidly while the gas–water co-production period shortens progressively. Under lower water invasion rates, capillary forces dominate, enabling water to penetrate smaller pores and resulting in breakthrough at lower water saturations (Sw). Conversely, higher invasion rates promote water flow through larger pore channels while impeding small-pore entry, necessitating higher Sw for breakthrough. At lower invasion rates, water displaces gas more uniformly, yielding gentler fwSw curves with smaller slopes. Higher invasion rates induce viscous fingering, creating uneven displacement and steeper fwSw curves. The 0.3 mL/min condition exhibits the most rapid fw increase. These variations demonstrate that elevated invasion rates accelerate water cut surges post-breakthrough, causing premature water flooding and suboptimal recovery performance. In the table, the Y-axis represents water cut (fw), and the X-axis represents water saturation (Sw).

3.6. Relationship Between Injection Volume and Recovery Efficiency

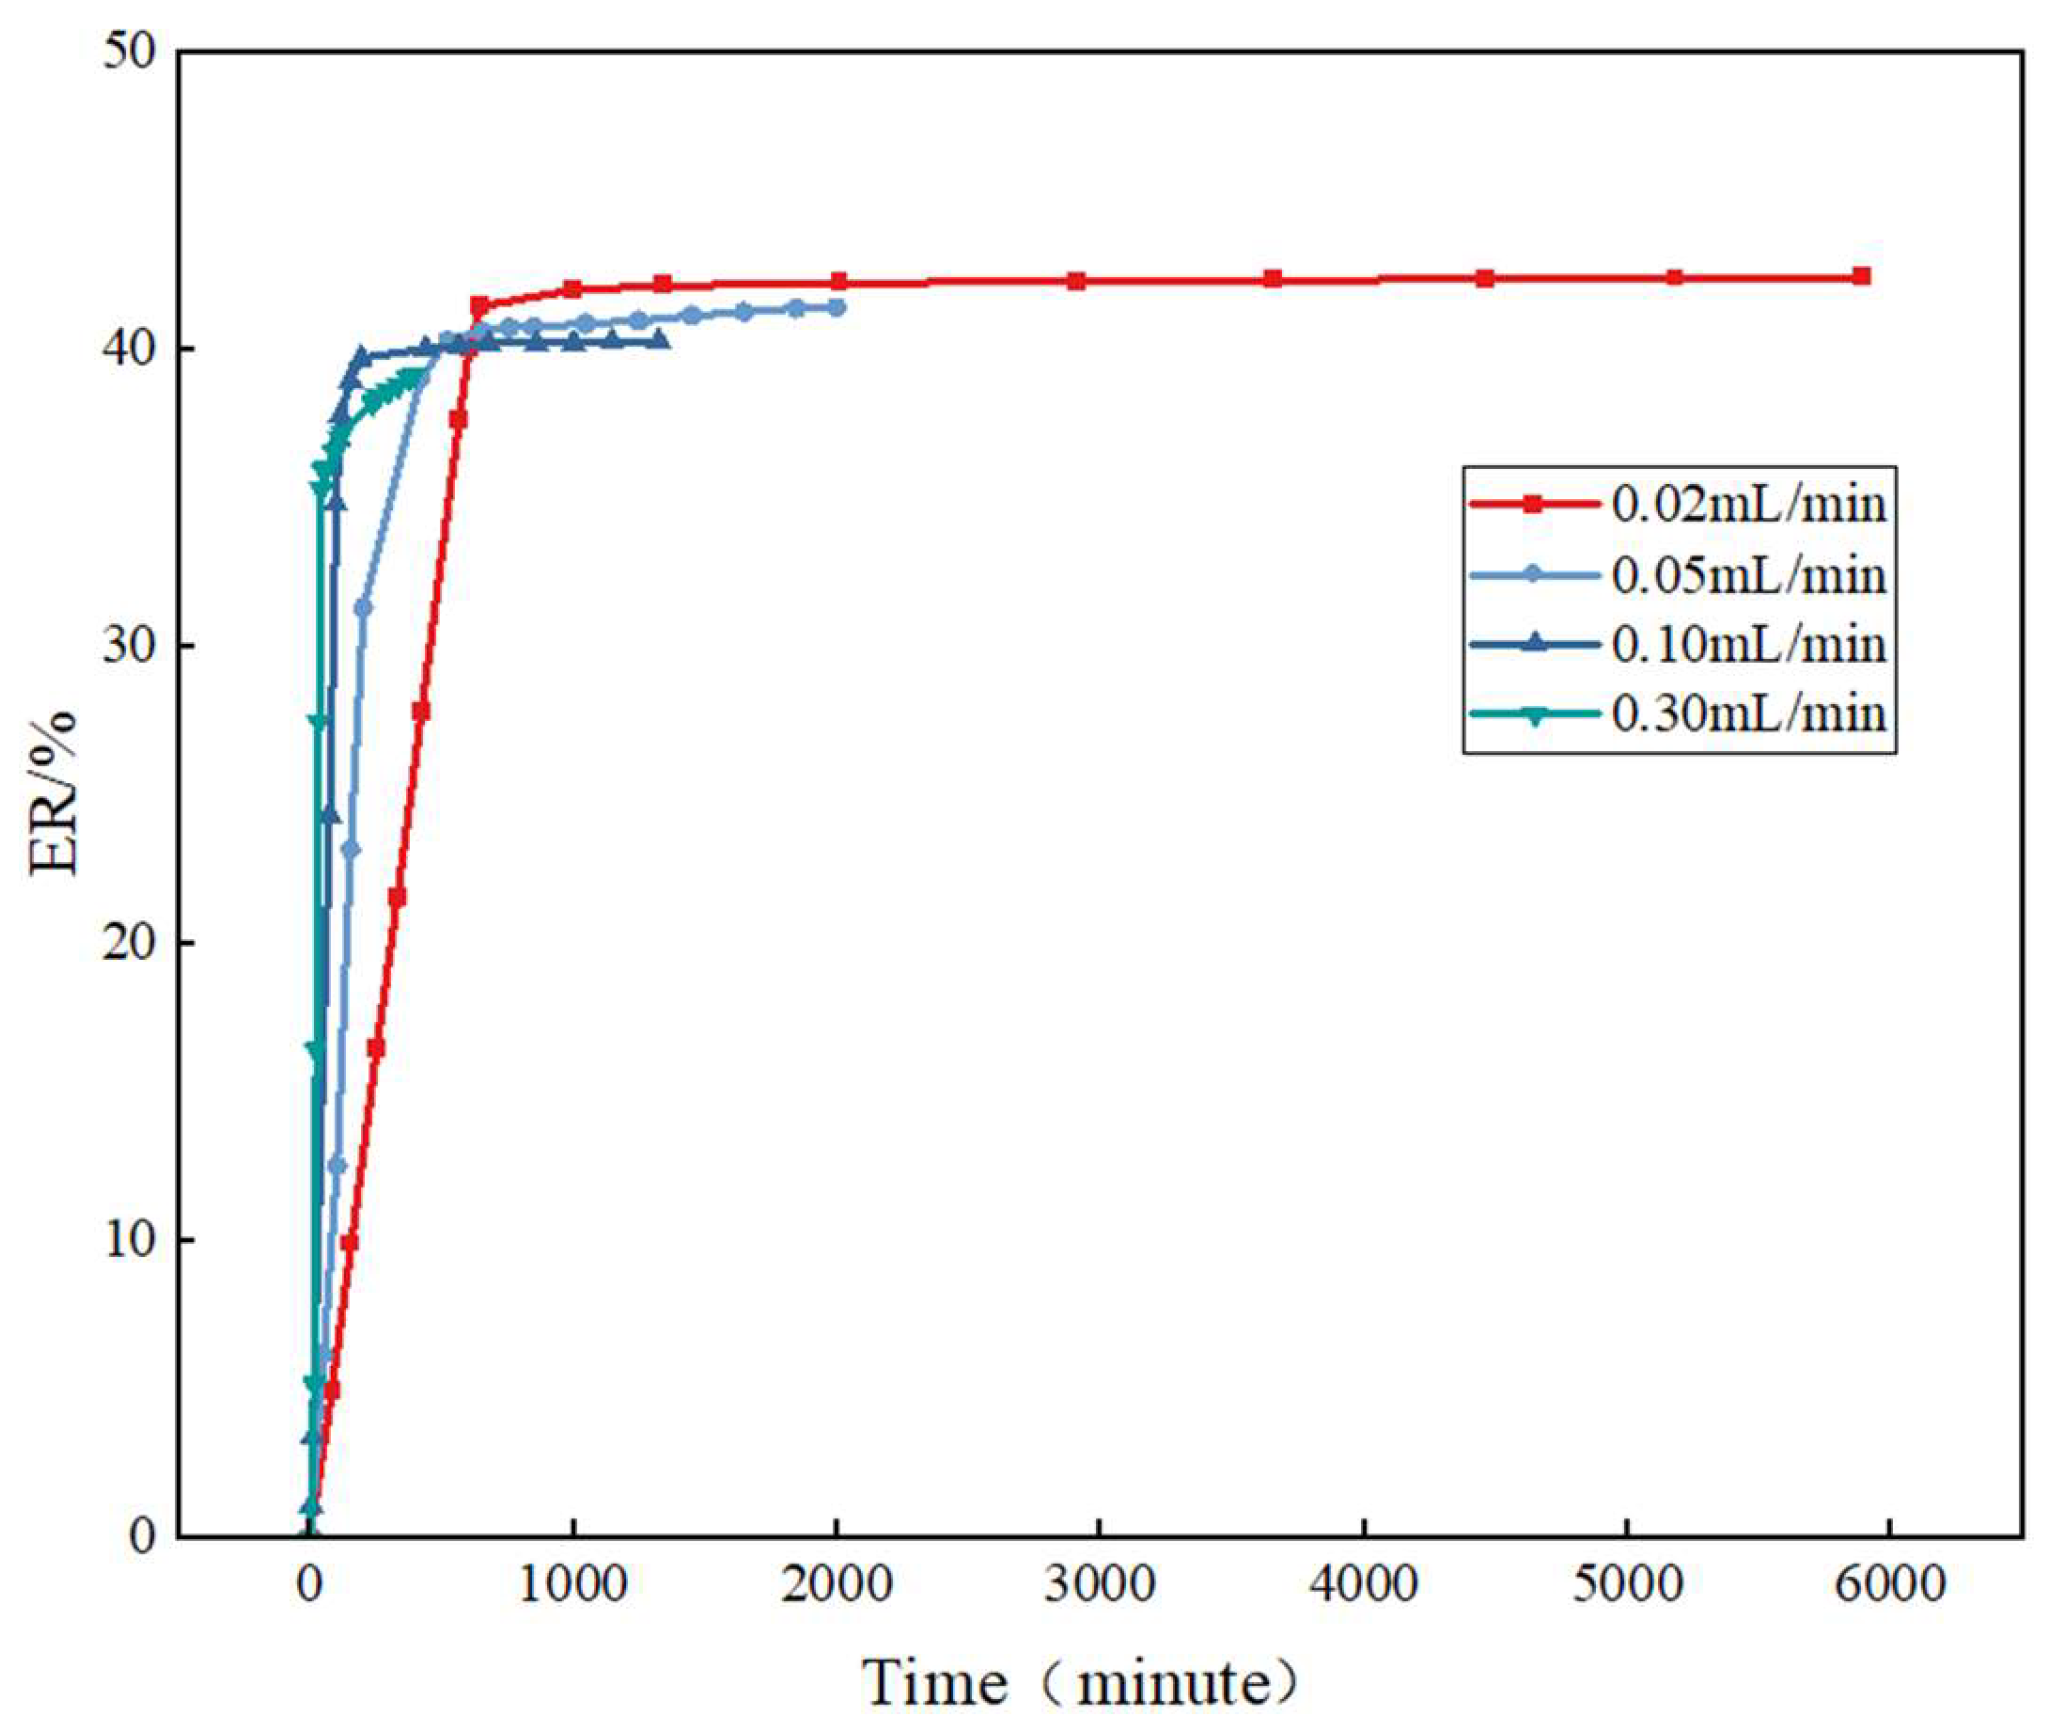
Figure 7 shows the relationship between gas recovery efficiency and injected pore volume multiples. The experimental results demonstrate that in medium-permeability long-core tests, recovery efficiency remains consistent across different water invasion rates at a 0.22 injected pore volume. After water breakthrough, the invasion rate significantly impacts gas displacement efficiency: as the rate increases from 0.02 mL/min to 0.3 mL/min, recovery efficiency declines from 42.42% to 39.03%, representing a 3.39% reduction in displacement efficiency. These findings confirm that higher water invasion rates substantially affect ultimate recovery in bottom-water gas reservoirs.
Based on the experimental results, water invasion initially enhances gas recovery during early-stage reservoir development. At lower invasion rates, capillary forces have sufficient time to facilitate water entry into smaller pores and displace trapped gas—a critical mechanism for improving recovery, particularly in medium-low permeability or complex pore structure reservoirs. Conversely, higher invasion rates promote water channeling through dominant flow paths, bypassing significant gas volumes without effective displacement. Lower rates mitigate channeling and improve sweep efficiency by maintaining more uniform displacement fronts and reducing residual gas zones. However, as invaded pore volumes increase, faster invasion rates exacerbate pore blockage and flow resistance, progressively diminishing recovery efficiency. From an economic perspective based on Figure 8, excessively low rates prolong production timelines, increasing operational costs and reducing profitability. Optimal production efficiency therefore requires maintaining water invasion rates within a controlled range that balances technical and economic factors.

4. Conclusions

(1)
The target reservoir in the large bottom-water gas field exhibits strong hydrophilicity. Under varying water invasion rates, lower flow rates—enhanced by capillary forces—penetrate small pores more effectively, resulting in a slower decline in gas-phase relative permeability. Conversely, higher invasion rates rapidly enter large pores, significantly increasing gas–water two-phase flow resistance and accelerating water-phase relative permeability growth. The relative permeability curves demonstrate a leftward shift in the iso-permeability point, progressive reduction in the two-phase co-percolation zone, and increased residual gas saturation.
(2)
With increasing water invasion rates, the initial water displacement process exhibits more uniform gas displacement, reflected in gradual water cut (fw) changes relative to water saturation (Sw). At higher invasion rates, viscous fingering occurs, leading to non-uniform displacement and steeper fwSw curve slopes. Consequently, post-breakthrough water cut rises rapidly, deteriorating gas displacement efficiency.
(3)
Under varying water invasion rates, reservoir recovery efficiency undergoes differential changes. In actual production, reducing water invasion rates can mitigate impacts on reservoir permeability and recovery performance. Simultaneously, economic viability must be considered to optimize invasion rates for maximum profitability.
(4)
According to this study, low-permeability layers or impermeable interlayers in geological formations can be understood in practical production, and natural barriers can be used to slow down water infiltration rates. Reducing the production of gas wells reduces the production pressure difference, thereby reducing the power of water to push towards the wellbore. By actively discharging some of the invading water, reducing water pressure, and indirectly weakening the driving force of subsequent water invasion, water invasion can be slowed down.

Author Contributions

Conceptualization, Z.Z. and C.W.; methodology, C.W. and S.X.; validation, Z.Z. and C.W.; formal analysis, Z.Z.; investigation, Z.Z. and S.X.; data curation, C.W. and L.S.; writing—original draft preparation, Z.Z.; writing—review and editing, C.W. and S.X.; supervision, C.W. and S.X.; project administration, L.S. All authors have read and agreed to the published version of the manuscript.

Funding

This research received no external funding.

Data Availability Statement

The data that support the findings of this study are available from the corresponding author upon reasonable request.

Acknowledgments

This research was carried out by the State Key Laboratory of Low Carbon Catalysis and Carbon Dioxide Utilization of Yangtze University, and it could not be realized without the help of teachers.

Conflicts of Interest

The authors declare no conflicts of interest.

References

  1. Jia, C.; Zhang, Y.; Zhao, X. Prospects of Challenges to Natural Gas Industry Development in China. Nat. Gas Ind. 2014, 34, 1–13. [Google Scholar]
  2. Li, X.; Guo, Z.; Hu, Y.; Luo, R.; Su, Y.; Sun, H.; Liu, X.; Wan, Y.; Zhang, Y.; Li, L. Efficient Development Strategies for Large Ultra-Deep Structural Gas Fields in China. Pet. Explor. Dev. 2018, 45, 118–126. [Google Scholar] [CrossRef]
  3. Mu, L.; Chen, Y.; Xu, A.; Wang, R. Technological progress and development directions of PetroChina overseas oil and gas field production. Petrol. Explor. Develop. 2020, 47, 120–128. [Google Scholar] [CrossRef]
  4. Lu, J.; Zhao, S. Optimization of Energy Consumption Structure and Natural Gas Industry Development Prospect in China. Nat. Gas Ind. 2013, 33, 9–15. [Google Scholar]
  5. Zou, C.; Zhao, Q.; Chen, J.; Li, J.; Yang, Z.; Sun, Q.; Lu, J.; Zhang, G. Natural Gas in China: Development Trend and Strategic forcast. Nat. Gas Ind. 2018, 38, 380–390. [Google Scholar] [CrossRef]
  6. Dai, J.; Qin, S.; Hu, G.; Ni, Y.; Gan, L.; Huang, T.; Hong, F. Major Progress in the Natural Gas Exploration and Development in the past Seven Decades in China. Pet. Explor. Dev. 2019, 46, 1037–1046. [Google Scholar] [CrossRef]
  7. Li, J.; Zheng, M.; Zhang, G.; Yang, T.; Wang, S.; Dong, D.; Wu, X.; Zhai, H.; Chen, X. Potential and Prospects of Conventional and Unconventional Natural Gas Resource in China. Acta Pet. Sin. 2012, 33, 89–98. [Google Scholar]
  8. Jia, A.; Yan, H.; Guo, J.; He, D.; Wei, T. Characteristics and experiences of the development of various giant gas fields all over the world. Nat. Gas Ind. 2014, 34, 33–46. [Google Scholar]
  9. Zhang, J.; Li, X.; Gao, S.; Ye, L.; Liu, H.; Zhu, W.; Fang, F. Water production mechanism of tight sandstone gas reservoir and its influence on percolation capacity. Nat. Gas Geosci. 2019, 30, 1519–1530. [Google Scholar]
  10. Fang, J.; Guo, P.; Xiao, X.; Du, J.; Dong, C.; Xiong, Y.; Long, F. Gas-water relative permeability measurement of high temperature and high pressure tight gas reservoirs. Pet. Explor. Dev. 2015, 42, 92–96. [Google Scholar] [CrossRef]
  11. Yan, Y.; Chen, J.; Guo, J.; Cheng, Y.; Zhang, Q. A visualized experiment on gas-water two-phase seepage through oolitic reservoirs in the Longgang Gas Field, Sichuan Basin. Nat. Gas Ind. 2012, 32, 64–66. [Google Scholar]
  12. Li, T. Characteristics of water influx in the development of the Puguang Gas Field, Sichuan Basin. Nat. Gas Ind. 2014, 34, 65–71. [Google Scholar]
  13. Zhang, T.; Sun, T.; Chen, W.; Zhu, G.; Wang, X. Pore-scale simulation of gas-water two phase flow in carbonate reservoir with different combinations of pore, network and hole. J. Southwest Pet. Univ. Sci. Technol. Ed. 2023, 45, 88–96. [Google Scholar]
  14. Wang, H.; Liu, Y.; Wang, F.; Wang, X.; Meng, W.; Zhang, J.; Pang, Y. Water Invasion Law in Deepsea Bottom-water Gas Reservoirs and a Water Invasion Risk Identification Method. Nat. Gas Ind. 2020, 40, 71–79. [Google Scholar]
  15. Liu, H.; Ren, D.; Gao, S.; Hu, Z.; Ye, L.; Liu, X. Water influx mechanism and development strategy of gas reservoirs with edge and bottom water. Nat. Gas. Ind. 2015, 35, 47–53. [Google Scholar]
  16. Shen, W.J.; Li, X.Z.; Liu, X.H.; Lu, J.L.; Jiao, C.Y. Physical simulation of water influx mechanism in fractured gas reservoirs. J. Cent. South Univ. (Sci. Technol.) 2014, 45, 3283–3287. [Google Scholar]
  17. Kabir, C.S. Predicting gas well performance coning water in bottom-water-drive reservoirs. In Proceedings of the SPE Annual Technical Conference and Exhibition, San Francisco, CA, USA, 5–8 October 1983. [Google Scholar]
  18. Fan, H.; Zhong, B.; Li, X.; Liu, Y.; Yang, H.; Feng, X.; Zhang, Y. Studies on water invasion mechanism of fractured-watered gas reservoir. Nat. Gas Geosci. 2012, 23, 1179–1184. [Google Scholar]
  19. Yang, D.; Xie, K.; Yin, Q.; Lu, X.; Xiao, J.; Shen, W. Research status and prospect of water intrusion law in edge and bottom water gas reservoirs. Nat. Gas Geosci. 2024, 35, 1304–1322. [Google Scholar]
  20. Xu, X.; Mei, Q.; Chen, Y.; Han, Y.; Tang, H.; Jiao, C.; Guo, C. Experimental analysis method for water invasion and development performance of gas reservoir. Nat. Gas Geosci. 2020, 31, 1355–1366. [Google Scholar]
  21. Fang, F.; Li, X.; Gao, S.; Liu, H.; Zhu, W.; An, W.; Li, C.; Gui, T. Study on dynamic physical simulation experiment of water invasion in carbonate gas reservoir. In Proceedings of the 2016 Annual Natural Gas Academic Conference, Yinchuan, China, 28 September 2016. [Google Scholar]
  22. Guo, Z.; Li, Z.; Yang, Z. Method of determining water invasion model by dynamic production data in Yangta-one gas reservoir. Sci. Technol. Eng. 2015, 15, 206–209. [Google Scholar]
  23. Fang, F.F.; Li, X.Z.; Gao, S.S.; Xue, H.; Zhu, W.Q.; Liu, H.X.; An, W.G.; Li, C.H. Visual simulation experimental study on water invasion rules of gas reservoir with edge and bottom water. Nat. Gas Geosci. 2016, 27, 2246–2252. [Google Scholar]
  24. Fang, F.; Shen, W.; Gao, S.; Liu, H.; Wang, Q.; Li, Y. Experimental Study on the Physical Simulation of Water Invasion in Carbonate Gas Reservoirs. Appl. Sci. 2017, 7, 697. [Google Scholar] [CrossRef]
  25. Huang, X.; Guo, X.; Zhou, X.; Shen, C.; Lu, X.; Qi, Z.; Xiao, Q.; Yan, W. Effects of water invasion law on gas wells in high temperature and high pressure gas reservoir with a large accumulation of water-soluble gas. J. Nat. Gas Sci. Eng. 2019, 62, 62–78. [Google Scholar] [CrossRef]
  26. Xu, X.; Li, X.; Hu, Y.; Mei, Q.; Shi, Y.; Jiao, C. Physical simulation for water invasion and water control optimization in water drive gas reservoirs. Sci. Rep. 2021, 11, 6301. [Google Scholar] [CrossRef] [PubMed]
  27. Xu, X.; Wan, Y.; Chen, Y.; Hu, Y.; Mei, Q.; Jiao, C. Physical simulation of water invasion and water control for the fractured water-bearing gas reservoirs. Nat. Gas Geosci. 2019, 30, 1508–1518. [Google Scholar]
  28. Han, X.; Shan, S.; Xu, G.; Han, Y.; Guo, Y.; Yang, B.; Zhang, J.; Yao, P.; Chu, X.; Zhang, P. Single-and Multifractal Dimension Variation of the Pore-Fracture System in Tight Sandstone by Using High-Pressure Mercury Intrusive Tests and Its Influence on Porosity–Permeability Variation. Energy Fuels 2023, 37, 11969–11981. [Google Scholar] [CrossRef]
  29. Ren, X.; Li, A.; Wang, G.; He, B.; Fu, S. Pore Structure and Porosity–Permeability Evolution Characteristics of Coal/Rocks under the Action of High-Viscosity Slickwater. Energy Fuels 2025, 39, 5279–5294. [Google Scholar] [CrossRef]
  30. Chen, M.; Dai, J.; Liu, X.; Qin, M.; Pei, Y.; Wang, Z. Differences in the Fluid Characteristics between Spontaneous Imbibition and Drainage in Tight Sandstone Cores from Nuclear Magnetic Resonance. Energy Fuels 2018, 32, 10333–10343. [Google Scholar] [CrossRef]
  31. Hu, Y.; Li, X.; Shen, W.; Guo, C.; Jiao, C.; Xu, X.; Jia, Y. Study on the Water Invasion and Its Effect on the Production from Multilayer Unconsolidated Sandstone Gas Reservoirs. Geofluids 2021, 2021, 5135159. [Google Scholar] [CrossRef]
  32. Feng, X.; Zhong, B.; Yang, X.; Deng, H. Effective water influx control in gas reservoir development: Problems and countermeasures. Nat. Gas Ind. 2015, 35, 35–40. [Google Scholar] [CrossRef]
  33. Jafari, I.; Jamshidi, S.; Masihi, M. Investigating the mechanism of water inflow in gas wells in fractured gas reservoirs and designing a controlling method. Int. J. Chem. Environ. Biol. Sci. 2012, 3, 482–487. [Google Scholar]
  34. Cheng, K.H.; Jiang, T.W.; Wang, X.Y.; Mou, W.J.; Pan, Z.C. A study on water invasion mechanism of the bottom-water gas reservoir in the ordovician system of hetian-he gas field. Nat. Gas Ind. 2007, 27, 108–110. [Google Scholar]
  35. Xiong, Y.; Yang, S.; Le, H.; Tang, J.; Yu, X. A new method of water influx performance analysis on fracture gas reservoirs with bottom water. Nat. Gas Ind. 2010, 30, 61–64. [Google Scholar]
  36. GB/T 28912-2012; Method for Determining Relative Permeability of Two-Phase Fluids in Rocks. Standardization Administration of China: Beijing, China, 2012.
  37. Treiber, L.E.; Owens, W.W. A laboratory evaluation of the wettability of fifty oil-producing reservoirs. Soc. Pet. Eng. J. 1972, 12, 531–540. [Google Scholar] [CrossRef]
  38. Anderson, W.G. Wettability literature survey-part 1: Rock/oil/brine interactions and the effects of core handling on wettability. J. Pet. Technol. 1986, 38, 1125–1144. [Google Scholar] [CrossRef]
  39. Djebbar, T.; Donaldson, E.C. Theory and Practice of Measuring Reservoir Rock and Fluid Transport Properties; Gulf Professional Publishing: Houston, TX, USA, 2012. [Google Scholar]
  40. Guo, P.; Zhou, R.; Tian, Z.; Wang, Y.; Zhao, J.; Yu, C. Gas and water distribution characteristics of water-driven gas process in tight sandstone gas reservoirs: A microscale study by molecular simulation and experiment. Energy Rep. 2022, 8, 7025–7036. [Google Scholar] [CrossRef]
  41. Han, X.; Tan, X.; Li, X.; Pang, Y.; Zhang, L. Water invasion performance of complex fracture-vuggy gas reservoirs based on classification modeling. Adv. Geo-Energy Res. 2021, 5, 222–232. [Google Scholar] [CrossRef]
  42. Jiang, G.; Li, Y.; Zhang, M. Evaluation of gas wettability and its effects on fluid distribution and fluid flow in porous media. Pet. Sci. 2013, 10, 515–527. [Google Scholar] [CrossRef]
  43. Zhang, X.; Wang, C.; Wu, H.; Zhao, X. Application of new water flooding characteristic curve in the high water-cut stage of an oilfield. Fluid Dyn. Mater. Process. 2022, 18, 661–677. [Google Scholar] [CrossRef]
  44. Feng, Q.; Zhang, J.; Wang, S.; Wang, X.; Cui, R.; Wang, D.; Bing, S.; Rui, Z. Unified relative permeability model and waterflooding type curves under different levels of water cut. J. Pet. Sci. Eng. 2017, 154, 204–216. [Google Scholar] [CrossRef]
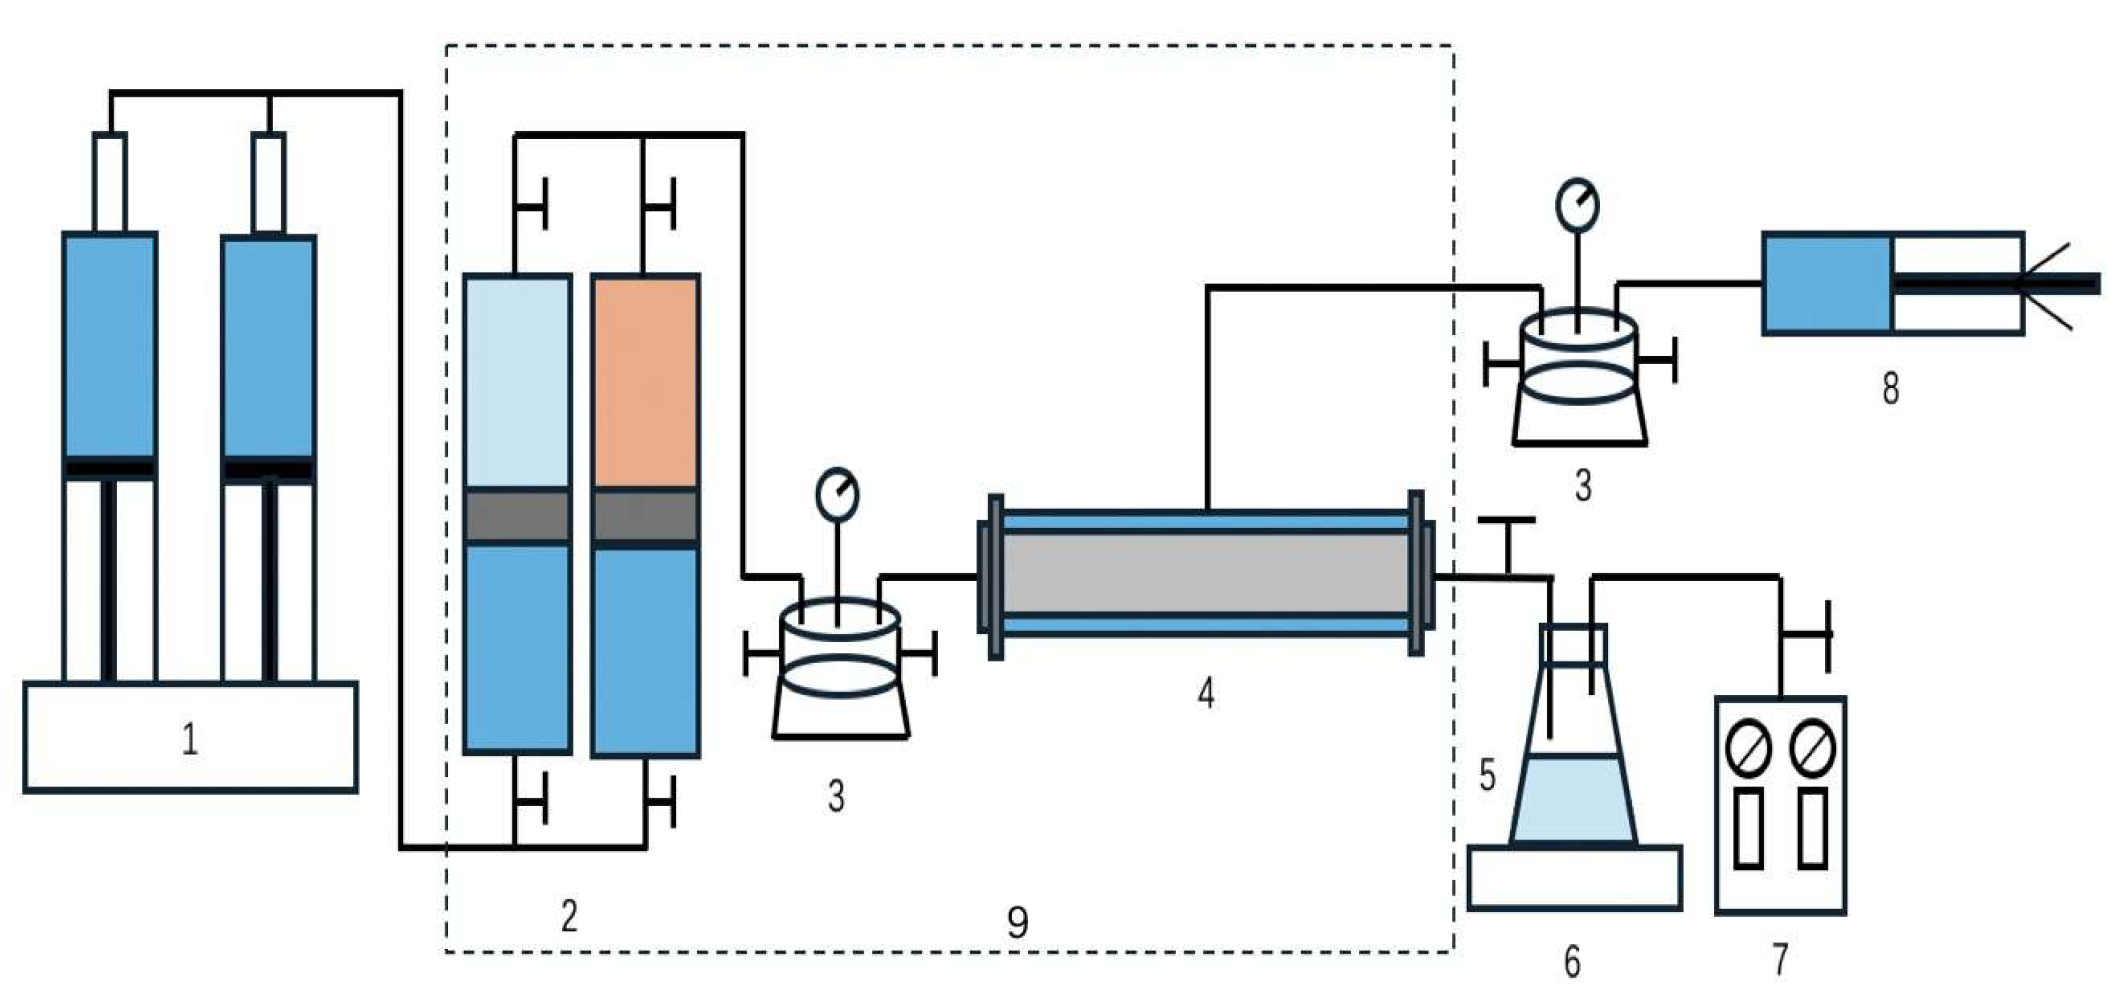
Figure 1. Experimental procedure. 1. High-pressure displacement pump. 2. Accumulators. 3. Six-way valve and pressure gauges. 4. Long-core holder. 5. Gas–liquid separator. 6. Electronic balance. 7. Gas flow meter. 8. Displacement pump. 9. Constant-temperature oven.
Processes 13 02761 g001
Figure 2. Gas–water relative permeability curves of conventional cores under different water invasion rates using the JBN method. Y-axis: water-phase relative permeability (Krw) and gas-phase relative permeability (Krg). X-axis: water saturation (Sw).
Processes 13 02761 g002
Figure 3. T2 spectra of conventional cores after water invasion at different flow rates.
Processes 13 02761 g003
Figure 4. Normalized relative permeability curves of medium-permeability cores under different water invasion rates processed using the JBN method.
Processes 13 02761 g004
Figure 5. Normalized relative permeability curves of medium-permeability cores under varying water invasion rates.
Processes 13 02761 g005
Figure 6. Diagram of relationship between Sw and fw.
Processes 13 02761 g006
Figure 7. Diagram showing relationship between water invasion pore volume multiples and recovery efficiency.
Processes 13 02761 g007
Figure 8. Water invasion time vs. recovery efficiency.
Processes 13 02761 g008
Table 1. Basic petrophysical parameters of cores from a South China Sea block.
Core IDLength (cm)Diameter (cm)Porosity (%)Permeability (mD)Pore Volume (cm3)
15.3702.46519.055.14.86
25.8702.46119.077.75.32
35.9462.46019.983.85.61
45.9152.46118.991.45.32
55.8652.48915.831.94.26
65.3932.46019.799.45.06
75.9482.46119.299.95.44
85.5392.49218.328.04.77
95.8982.48720.0101.05.44
105.6852.49020.0100.05.06
115.5462.48620.7120.64.67
Table 2. Ionic composition analysis results of formation water.
Ion Content (mg/L)Water TypeSalinity
mg/L
Na+ + K+Ca2+Mg2+ClSO42−HCO3CO32−
12,980943410,318027560NaHCO313,073
Table 3. Water invasion characteristic parameters.
Water Invasion Rates (mL/min)Swi
(%)
Sw (Sgr)
(%)
Krw (Sgr)Co-Percolation Point (%)Co-Percolation Zone (%)
0.0248.2168.950.297559.6520.74
0.0548.2168.680.335558.7320.47
0.1048.2168.490.346358.1920.28
0.3048.2168.000.361756.6119.79
Disclaimer/Publisher’s Note: The statements, opinions and data contained in all publications are solely those of the individual author(s) and contributor(s) and not of MDPI and/or the editor(s). MDPI and/or the editor(s) disclaim responsibility for any injury to people or property resulting from any ideas, methods, instructions or products referred to in the content.