Abstract
The cyclone separator is a widely used separation instrument that can be applied in dust removal, mist removal, etc. The geometrical parameters that directly affect the airflow and separation process of a cyclone separator play a significant role in operating performance. In the present paper, numerical simulations are conducted to understand the flue gas flow and solid particle motion involved in the separation process of a dust removal cyclone separator. The effects of geometrical parameters on separation efficiency and pressure drop are thoroughly discussed. It is revealed that the separation of flue gas and dust particles depends on the reversible spiral flow arising from the cyclone structure. While the L/D ratio is 1.7, an undesirable flow and particle motion is obtained. As the H/D ratio is increased, the separation efficiency and the separator resistance both drop. In the process, the de/D ratio is increased from 0.6 to 0.7, and flue gas flow becomes worse, resulting in a dramatical descent in separation efficiency and pressure drop. The cut-off particle diameter is about 6 μm, and the particle size has little influence on pressure drop.
1. Introduction
Cyclone separators are extensively used in industrial gas–solid separation due to their low cost, minimal operational requirements, and adaptability to a wide range of working conditions [1,2,3]. A higher separation efficiency and lower resistance of the separator are generally acknowledged to primarily depend on the well-designed geometrical parameters because the geometric parameters govern the airflow behavior and separation efficiency in a cyclone separator [4].
A series of research studies was carried out to obtain the desired geometrical parameters. Baker et al. [5] reported that the inlet duct of a cyclone separator plays a crucial role in determining its separation efficiency. It is increased as the inlet shape becomes shorter and wider. Misiulia et al. [6] investigated the effect of inlet inclination angle on the performance of a cyclone separator. It was discovered that, as the inlet angle is 30°, the separation efficiency is the highest. Bogodage and Kim et al. [7,8] discovered that increasing the diameter of the vortex finder of the separator can enhance the cut diameter of particles, with a dramatic variation observed in the flow field of the cyclone separator. El-Batsh, Ficici, and Gimbun et al. [9,10,11] found that the maximum velocity and pressure drop increased as the vortex finder diameter decreased. An increase in the height and width of the separator inlet would decrease the vortex finder diameter. Pandey et al. [12] studied how variations in cone height impact the performance of cyclone separators. It was observed that a higher cone height results in a lower pressure drop. Elsayed et al. [13] reported that the discharge diameter exerts a negligible influence on the cyclone separator’s internal flow, while decreasing the diameter slightly increases both pressure drop and velocity. Xiang et al. [14] asserted that the effect of discharge diameter on resistance is negligible until it falls below a certain threshold.
In order to understand the connection between the geometrical parameters and the separation efficiency and resistance, the flue gas and particle motion in the cyclone separator must be understood. A series of experimental research was conducted to explore the flow in the separator. Linden [15] used a spherical pitot tube to determine the complex three-dimensional flow field inside a cyclone separator for the first time. Fan et al. [16] employed particle image velocimetry (PIV) to investigate the flow patterns in a 35 mm mini-cyclone separator with inlet section angles of 0°, 30°, 45°, and 60°. They generated streamline diagrams from the measured velocity vectors, quantified the short-circuit flow rates, and evaluated both the separation and grade efficiencies corresponding to the four inlet angles. Zhao et al. [17] investigated the effects of AVF structures with varying insertion depths on the flow field characteristics and separation performance of hydrocyclones using particle image velocimetry (PIV). The study revealed the mechanism by which the AVF structure enhances separation through the drainage of short-circuit flow (SCF). Gao et al. [18,19] employed a Phase Doppler Particle Analyzer (PDPA) to investigate changes in the internal flow field of a cyclone separator, characterizing the double vortex motion. With rapid advances in modeling techniques, numerical simulations have been widely applied to study the separation mechanisms occurring within cyclone separators.
Numerical simulations have been widely employed to investigate turbulent flow behavior in cyclone separators, providing detailed insights that complement experimental observations. Large-eddy simulation (LES) has been applied to model single-phase turbulent flow within cyclone geometries on uniform cubic grids, allowing high-resolution prediction of three-dimensional average flow fields [20]. It reveals complex flow phenomena such as vortex-core precession, where the core of the main vortex moves quasi-periodically around the cyclone’s geometrical axis. The Strouhal number associated with this vortex-core precession was predicted to be 0.53, closely matching experimental observations of 0.49 in similar geometries at comparable Reynolds numbers. Elsayed et al. [21] investigated the effect of cyclone inlet dimensions on flow patterns and performance in five cyclone separators using the Reynolds Stress Model (RSM) for simulation. It was observed that increasing the cyclone inlet dimensions reduces the maximum tangential velocity, which remains nearly uniform across the cyclone, and also decreases the pressure drop. Azadia et al. [22] developed a 3D CFD model to study the effect of geometry size on cyclone separator performance. They concluded that both the cut-off size and pressure drop increased with increasing cyclone size. The RSM accurately predicted the cut-off diameters, with deviations of 2.3%, 3.4%, and 3.6% from experimental data for cyclones I, II, and III, respectively. Wang et al. [23] employed numerical simulations to examine the flow field characteristics and dust removal efficiency of the separator under various operating conditions. A maximum separation efficiency of 99.48% was obtained for particles larger than 13.1 μm, while particles larger than 2 μm achieved an efficiency of 96.55%. Optimal crushing and atomization performance was observed for the separator at a gas velocity of 10 m·s−1 and a liquid velocity of 3 m·s−1. Chen et al. [24] integrated computational fluid dynamics (CFD) simulations with experimental validation to study novel designs of the cyclone separator. Comparative analyses indicate that such novel designs can improve the collection efficiency of 1–10 μm particles by 5.67–9.77% and 7.03–10.14% under varying gas velocities compared with standard and volute-type cyclones, respectively. Mechanistic studies of the flow field further elucidate how vortex dynamics influence separation performance, providing both structurally optimized cyclone configurations and a validated hybrid experimental–computational framework for industrial fine particle separation.
In the present paper, numerical simulations were conducted to understand the flue gas flow and solid particle motion involved in the separation process of a dust removal cyclone separator. The effects of geometrical parameters on separation efficiency and pressure drop were thoroughly discussed.
2. Physical and Mathematical Models
2.1. Physical Model
The three-dimensional structure of the cyclone separator involved in the simulation is presented in Figure 1, which is applied to the dust removal for coal-fired boiler flue gas. The initial geometry parameters are chosen with reference to the empirical parameters of the XLP-type cyclone separator [25]. For the convenience of the following description, the related structure parameters are marked in Figure 1b. A typical value of related structure parameters is presented in Table 1. The geometric configurations considered include the following parameters: inlet cross-section width (b), inlet cross-section height (h), vortex finder diameter (de) and depth (m), cylinder diameter (D) and height (L), cone height (H), and discharge diameter (d1).
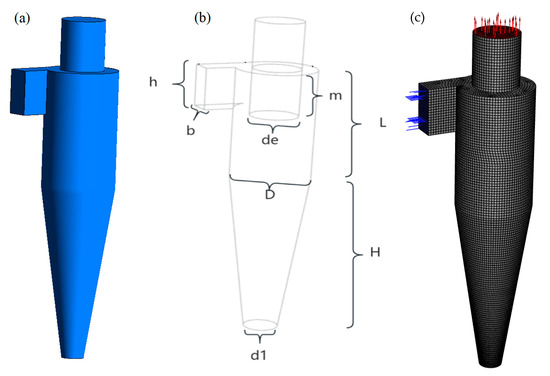
Figure 1.
(a) Three-dimensional geometric model used in CFD simulation; (b) related signs of structural parameters of the cyclone separator; (c) meshes on the walls of cyclone separator.

Table 1.
Structural parameters of the cyclone separator.
2.2. Mathematical Model
2.2.1. Fluid Flow
Continuity and Navier–Stokes equations [26] are used for describing the flue gas flow in the cyclone system.
where is the flue gas density; is the external body forces; u is the velocity vector; p is the pressure; is the gravitational acceleration; ρ is the flue gas density. Given the high Reynolds number, the flue gas flow exhibits turbulence. To characterize the turbulent behavior, the viscous stress tensor is expressed as
where is the Kronecker delta; and is the effective turbulent viscosity, which is calculated by
where is the flue gas viscosity.
In order to capture the turbulent flow features, the turbulent flow model is critical. Although alternative models such as k-ω SST may yield better near-wall predictions and LES could capture more detailed unsteady vortex structures, these approaches are more computationally demanding. Considering the present study’s focus on global flow characteristics and separation efficiency, the k-ε model [27,28] is deemed appropriate. This model has been used in cyclone simulations [22,29,30] and has demonstrated satisfactory performance in predicting mean flow structures and separation efficiency.
The k-ε model is used to simulate production, transport, diffusion, and destruction of turbulent viscosity . The corresponding mathematical descriptions of these processes are presented as follows:
The k and ε are solved by the following equations:
The term represents the production of turbulence kinetic energy:
The related constants in the model are as follows:
2.2.2. Particle Motion
In order to describe the particle motion in a cyclone separator, the Euler–Lagrange approach is used. The fluid phase is treated as a continuum by solving the Navier–Stokes equations, while the dispersed phase is solved by tracking a large number of particles in this method.
The trajectory of a discrete phase particle is determined by integrating the force balance in a Lagrangian reference frame, where the particle inertia is equated with the external forces acting on it, and expressed as [31]
where is an additional acceleration term; is the drag force per unit particle, and is defined as follows:
Here, is the particle velocity; is the fluid density, is the particle diameter, is the relative Reynolds number, which is defined as
The additional acceleration term
is the particle density. is the particle density. Due to the temperature being set constant, the thermophoretic force is neglected. The Saffman lift force [32] is also neglected since the ash of flue gas is generally not the submicron particles. The additional force arising from the pressure gradient in the fluid and the “virtual mass” force in per unit are solved by the following expression:
where is the lift coefficient and can be expressed as follows for a cyclone dust collector:
To predict particle dispersion, the concept of the integral time scale is adopted. As the “tracer” particles moving with the fluid are small enough, the integral time becomes the fluid Lagrangian integral time . This time scale can be expressed as
The k-ε model is approximated and expressed as
The discrete random walk (DRW) model [33] is adopted to predict the trajectories of particles in the turbulent flow condition. In the discrete random walk (DRW) model, the interaction of a particle with a succession of discrete stylized fluid-phase turbulent eddies is simulated. Each eddy is characterized by a Gaussian-distributed random velocity fluctuation , , and , and a time scale .
The values of , , and that prevail during the lifetime of the turbulent eddy are sampled by assuming that they obey a Gaussian probability distribution. For the K-ε model, they are defined as [34]
The characteristic lifetime of the eddy is defined as a constant:
3. Description and Validation of Numerical Method
3.1. Numerical Method
The physical model of cyclone separator is discretized by using structured hexahedral grid (see Figure 1c). Numerical simulation results under different mesh sizes are compared to ensure mesh independence, as presented in Table 2. It indicates that as the mesh spacing is less than 40 mm, the results in simulations have no obvious changes with the increase in mesh number. Considering the results in Table 2, the mesh size in the present simulations is chosen to be 40 mm, and the total mesh number is 96,399 for a typical case, with a maximal skewness and aspect ratio of 0.41 and 4.91, respectively.
Table 2.
The separation efficiency and pressure drop varied with mesh cells.
The governing equations were discretized using the finite-volume method. A second-order upwind scheme was employed for the discretization of momentum and turbulence terms, while the SIMPLE algorithm was applied to couple velocity and pressure. For the pressure correction equation, the PRESTO scheme [35] was adopted. The discretized equations were solved using the commercial CFD software ANSYS Fluent (version 2021). Convergence was assumed when the residuals of the governing equations dropped below 10−4.
3.2. Validation of Numerical Method
In order to validate the numerical method used in the present paper, a comparison was made with the experimental measurements. The separation efficiency and the pressure drop are obtained with different inlet velocities for an experimental cyclone separator setup in our laboratory (Figure 2a). The values of separation efficiency and the pressure drop in experiments compared with the numerical simulations are presented in Figure 2b,c. It is seen that the values in simulations are fairly consistent with those measured in the experiments, both in separation efficiency and the pressure drop.
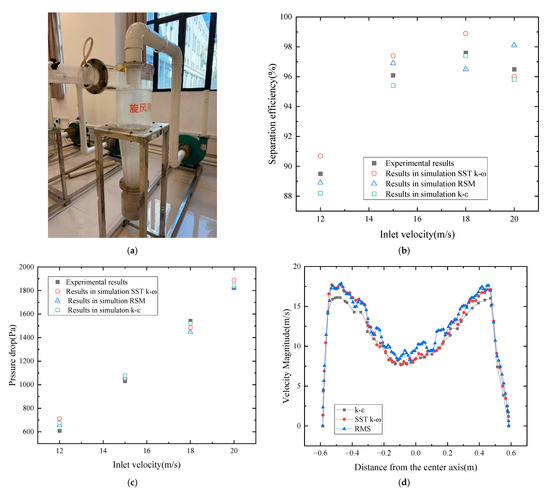
Figure 2.
(a) Schematic representation of the experimental setup of cyclone separator; comparison values of (b) separation efficiency and (c) pressure drop in numerical simulations with the experiments; (d) velocity magnitude distribution on the intersection line of cylinder and cone under different turbulent models.
Given that the turbulent model is critical, Figure 2b,c also present the simulation results of three kinds of widely used models in cyclone separator simulation. They are the k-ε model, SST k-ω, and Reynolds Stress Model (RSM), respectively. It is seen that the difference between different turbulent models is not highly significant. The maximal difference in separation efficiency is 2.4%, with a maximal difference in pressure drop of 57 Pa. The percentage differences in those two cases do not exceed 5%, which is acceptable in engineering practice and is consistent with the results reported by Azadi et al. [22]. A comparison of the velocity magnitude distribution between three kinds of turbulent models is introduced to validate the consistency of the flow, considering that SST k-ω and RSM have an enhanced capability to resolve small-scale vortical structures. Figure 2d shows that the overall flow is consistent among the three models, although higher-order turbulence models capture more details in local regions.
All those described above give us confidence to use the present numerical method to model the gas–solid separation process in the cyclone separator.
4. Results
4.1. Flue Gas Flow and Particle Separation
4.1.1. Flue Gas Flow in Cyclone Separator
The flue gas streamlines and the velocity magnitude distributions on several cross-sections are presented in Figure 3. It can be seen in Figure 3a that as the flue gas containing solid particles flowed into the cyclone separator, the flow is altered to spiral, resulting from the cyclone’s geometric structure. The flue gas flows spirally along the cyclone separator wall from the upper to lower regions, and its flow direction is reversed until it is close to the bottom. The detailed reversed location of the spiral flow is strongly dependent on the geometric structure parameters of the cyclone separator. After the spiral flow is reversed, the flue gas then flows spirally with a smaller rotation radius around the same central axis inside the cyclone separator, where the rotation direction is changed from clockwise to anticlockwise. Through the spiral flow mode, the residence time of flue gas in the cyclone separator is significantly increased, and the maximal residence time is over 3.6 s. This is helpful to improve the separation efficiency of solid particles. Figure 3b,c show that the velocity magnitude near the wall is generally larger than that around the central axis of the separator in the separator cylinder. As the flue is close to the reversed location of the spiral flow in the cone section of the separator, the distribution feature of velocity magnitude is changed, where the velocity magnitude distribution is chaotic, and spiral flow is no longer remarkable (see Figure 3d). Below the reversed location, the flow is nearly stagnant. The solid particle is deposited in those stagnant regions.
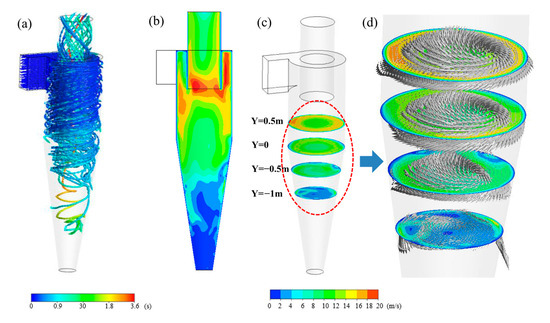
Figure 3.
(a) Streamline of flue gas in cyclone separator; velocity magnitude distribution on the (b) lateral and (c) longitudinal cross-section; (d) the velocity vector on the longitudinal cross-section.
4.1.2. Solid Particle Deposition in Cyclone Separator
Figure 4 presents the distribution of solid particles in the cyclone separator. With the flue gas flowing spirally, the solid particle is thrown onto the separator wall in the effect of centrifugal force. It is thus observed that the main particles are located near the separator wall in Figure 4a. The particles are then gradually deposited in the cone section, and finally, a majority of those are deposited on the bottom of the separator. A few deposited solid particles probably back to the flue gas and escaped from the cyclone separator before resorting to the second vortex. In the above process, the residence time of the solid particle in the separator before escape is nearly tens of seconds. Figure 4b shows the solid particle centration distribution in 3D space of the separator. A higher concentration value is overall located at the bottom of the separator, which indicates that the solid particle is primarily deposited there. The two higher concentration curves are observed along the separator wall, which arise from the second flow deviated from the bulk flow of flue gas in the cyclone separator. Figure 4c depicts solid particle concentration distribution on the slice that cuts through the central axis, where it is intuitively observed that a higher concentration value is mainly at the bottom of the separator cone as described in Figure 4b. The solid particle concentration distribution on several longitudinal cross-sections, i.e., the cut perpendicular to the central axis of the separator, is presented in Figure 4d. It indicates that the higher concentration values are located next to the wall in the cone regions of the separator. Such a kind of distribution pattern is not obvious in the cylinder region of the separator.
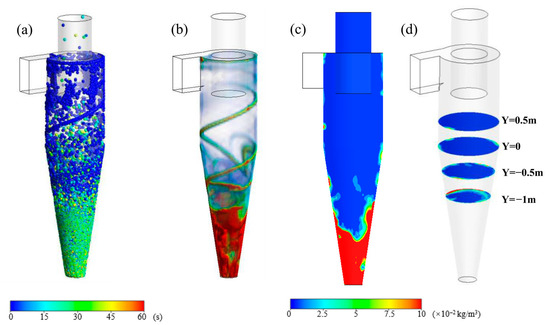
Figure 4.
Solid particle distribution in cyclone separator. (a) Solid particle distribution in cyclone separator; (b) solid particle concentration distribution in cyclone separator; solid particle concentration distribution on the (c) lateral and (d) longitudinal cross-section.
4.2. Influences of Structural Parameters
4.2.1. Ratio of Cylinder Height to Diameter (L/D)
The structural analysis in the present paper is conducted for a cyclone separator applied to dust removal of a CFB boiler flue gas. Velocity magnitude distribution varied with L/D ratio on the lateral cross-section is presented in Figure 5, where the flue gas flow rate is 11,000 Nm3/h, with a dust concentration of 50 g/Nm3 and a particle diameter of 12 μm. It can be seen that the distribution of velocity magnitude is similar on the whole, except for the ratio of cylinder height to diameter of 1.7. As the L/D ratio is 1.5, 1.6, and 1.8, the higher velocity magnitude near the separator wall and the lower velocity magnitude around the central axis are both obvious. The flow is approximately stagnant on the bottom of the separator, where the velocity magnitude is close to zero. In contrast, the higher velocity region next to the wall is no longer significant, with the previous stagnant region above the bottom destabilized, while the ratio of L/D is 1.7. These indicate that the spiral flow in the cyclone separator is undesirable, giving rise to remarkable secondary flow, which is likely to decrease the settling efficiency of particles.
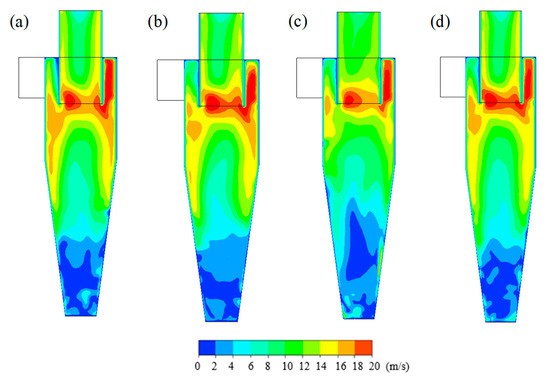
Figure 5.
Velocity magnitude distribution on the lateral cross-section with different L/D. (a) L/D = 1.5; (b) L/D = 1.6; (c) L/D = 1.7; (d) L/D = 1.8.
Velocity distribution on the intersection line of the cylinder and cone of Figure 5 is presented in Figure 6. Because no slip boundary is applied to the wall, the velocity on the wall is zero. The maximal velocity magnitude is observed to be located next to the wall, with the minimal velocity magnitude located near the central axis. Apart from an L/D ratio of 1.7, the maximal and minimal values are approximately the same under different L/D ratios. While the L/D ratio is 1.7, the maximal velocity dramatically declines from 15.8 m/s to 12.5 m/s, resulting in the difference between the maximal velocity and minimal velocity on the line decreasing from 7.9 m/s to 5.4 m/s. A smaller difference in velocity magnitude between the inside and outside of the spiral vortex implies that the centrifugal pull is weak, which may not be completely sufficient to swing the particle toward the separator wall. As a result, the particle easily escapes from the cyclone separators, and the separation efficiency declines.
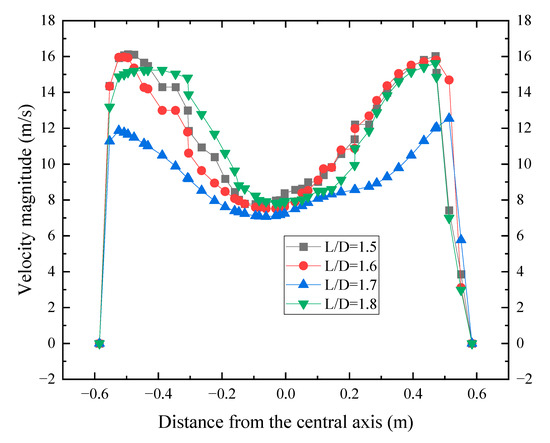
Figure 6.
Velocity magnitude distribution on the intersection line of the cylinder and cone under different L/D ratios.
Figure 7 shows that the particle concentration distribution varied with the L/D ratio on the lateral cross-section. The distribution features in particle concentration for L/D ratios of 1.5, 1.6, and 1.8 are seen to be similar, where the particle is primarily deposited on the bottom of the separator. For an L/D ratio of 1.7, many particles are not driven to the wall because of a weaker centrifugal pull, resulting in a high concentration observed around the central axis near the intersection of the cylinder and cone. The flow perturbation in the particle-deposited region on the bottom of the separator is observed when the L/D ratio is 1.6. Fortunately, the perturbation seems like a weakness and does not cause the deposited particle to escape from the separator, accompanied by the reserved spiral flow. The separation efficiencies do not decrease dramatically for these two cases, as shown in Figure 8.
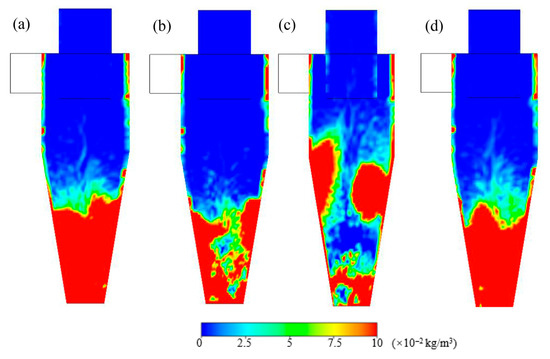
Figure 7.
Solid particle concentration distribution on the lateral cross-section under the different L/D ratios. (a) L/D = 1.5; (b) L/D = 1.6; (c) L/D = 1.7; (d) L/D = 1.8.
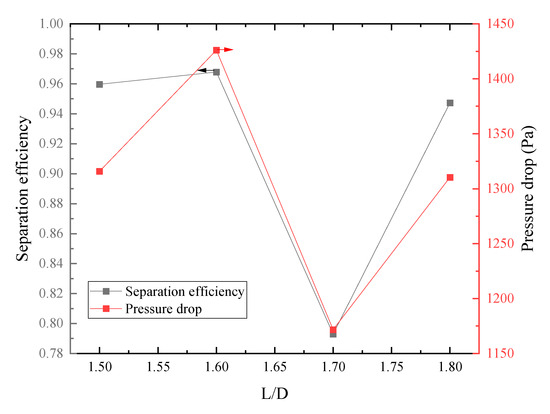
Figure 8.
Separation efficiency and pressure drop varied with L/D ratio.
Figure 8 gives the separation efficiency and pressure drop with different L/D ratios. The pressure drop is seen to be positively correlated with the separation efficiency. As the L/D ratio is 1.6, the maximal separation efficiency of 0.9679 is obtained, accompanied by the maximal pressure drop of 1426 Pa. In contrast, the minimal separation efficiency of 0.7930 and pressure drop of 1172 Pa are observed both in the L/D ratio of 1.7.
4.2.2. Ratio of Cone Height to Cylinder Diameter (H/D Ratio)
The velocity magnitude distribution varied with the H/D ratio on the lateral cross-section, as presented in Figure 9. The distribution features two lower H/D ratios of 1.9 and 2.0 that are similar, where an obvious high velocity exists next to the cylinder wall, with the low velocity region located above the bottom of the separator. With the increase in the H/D ratio, the high-velocity region near the wall decreases to some extent, and the low-velocity region at the bottom of the separator is observably disturbed.
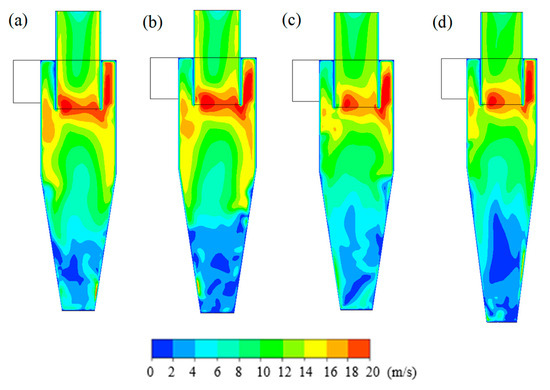
Figure 9.
Velocity magnitude distribution on the lateral cross-section with different H/D ratios. (a) H/D = 1.9; (b) H/D = 2.0; (c) H/D = 2.1; (d) H/D = 2.2.
Velocity distribution on the intersection line of the cylinder and cone of Figure 9 is presented in Figure 10. The maximal velocity magnitude is adjacent to the wall, with the minimal velocity magnitude located around the center. While the H/D ratio increases from 2.0 to 2.2, the maximal velocity on the line drops from 15.9 m/s to 12.5 m/s. In this process, the difference between the maximal velocity next to the wall and the lowest velocity in the central region decreases from 8.1 m/s to 5.4 m/s, which implies the spiral vortex intensity probably declines, and centrifugal pull is weakened.
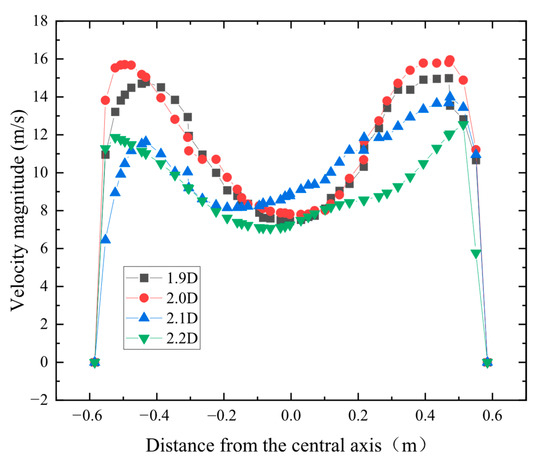
Figure 10.
Velocity magnitude distribution on the intersection line of cylinder and cone under different H/D ratios.
Figure 11 shows that the particle concentration distribution varied with the H/D ratio on the lateral cross-section. It is seen that the particles are primarily clustered at the bottom of the separator as the H/D ratios are 1.9 and 2. It seems that a higher H/D ratio enlarges the deposited region in two cases, where the peak of the red high-concentration region on the bottom is closer to the intersection of the cylinder and cone. As a result, the particle is believed to more easily escape from the separator in a H/D ratio of 2. Since the flow is altered as the H/D ratio increases from 2 to 2.1, the particle concentration distribution observably varied in this process. The deposited region of the particle above the bottom is agitated dramatically, and an intense re-entrainment of particles occurs, giving rise to a decrease in separation efficiency. While the H/D ratio increased to 2.2, the centrifugal force is insufficient to pull the particle to the wall of the separator. A majority of particles are observed to cluster around the central axis in the middle of the separator. Those particles are taken away to the separator outlet by the spirally vortex inside.
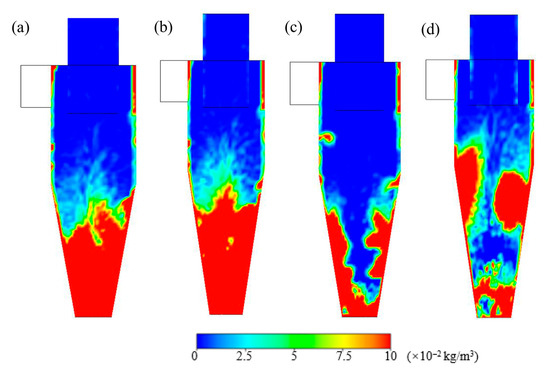
Figure 11.
Solid particle concentration distribution on the lateral cross-section under the different H/D ratios. (a) H/D = 1.9; (b) H/D = 2.0; (c) H/D = 2.1; (d) H/D = 2.2.
Figure 12 gives the separation efficiency and pressure drop with different H/D ratios. The separation efficiency and pressure drop decrease with the increase in H/D ratio. As the H/D ratio increased from 1.9 to 2.2, the separation efficiency dropped from 0.9642 to 0.7930, with the decrease in pressure drop from 1301 Pa to 1171 Pa.
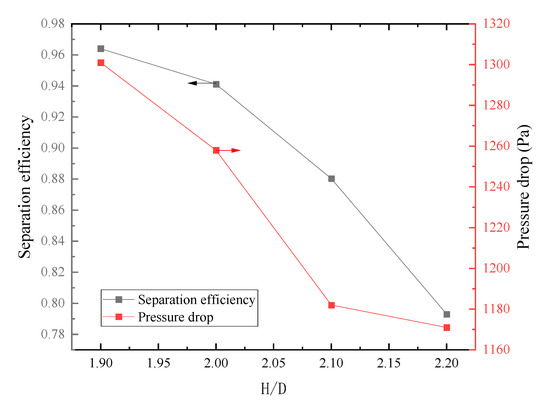
Figure 12.
Separation efficiency and pressure drop varied with H/D ratio.
4.2.3. Ratio of Vortex Finder Diameter to Cylinder Diameter (de/D Ratio)
Velocity magnitude distribution varied with de/D ratio on the lateral cross-section, as presented in Figure 13. It can be seen that the distribution of velocity magnitude in the separator is similar on the whole except de/D ratio of 0.7. The velocity magnitude located adjacent to the cylinder wall is larger than that in the center. The flow is approximately stagnant on the bottom of the cone, where the velocity magnitude is close to zero. On the contrary, the velocity above the intersection of the cylinder and cone decreases significantly, with the previous stagnant region of the bottom destabilized while the ratio of de/D is 0.7. Given that the vortex finder diameter is increased, the velocity in the vortex finder duct is observed to drop obviously, with an increase in de/D ratio from 0.4 to 0.7.
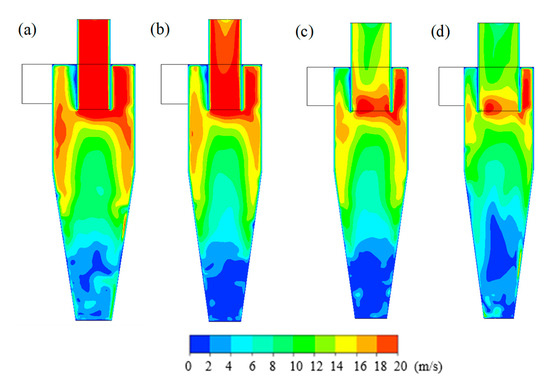
Figure 13.
Velocity magnitude distribution on the lateral cross-section with different de/D ratios. (a) de/D = 0.4; (b) de/D = 0.5; (c) de/D = 0.6; (d) de/D = 0.7.
Velocity distribution on the intersection line of the cylinder and cone of Figure 13 is presented in Figure 14. The maximal velocity magnitude is observed to lie between the center and the cylinder wall. As the de/D ratio increases from 0.4 to 0.7, the maximal velocity decreases from 17.2 m/s to 12.5 m/s, and its apparent location is closer to the center. A significant descent occurs in the maximal velocity magnitude in the process of the de/D ratio increased from 0.6 to 0.7, where the maximal velocity drops from 15.7 m/s to 12.5 m/s. Such a decrease results in the difference in velocity magnitude between the inside and outside of the spiral vortex dropping. The difference between the maximal velocity and the minimal velocity of the center decreases from 7.6 m/s to 5.4 m/s. As discussed above, a smaller difference in velocity magnitude between the inside and outside of the spiral vortex may weaken vortex intensity.
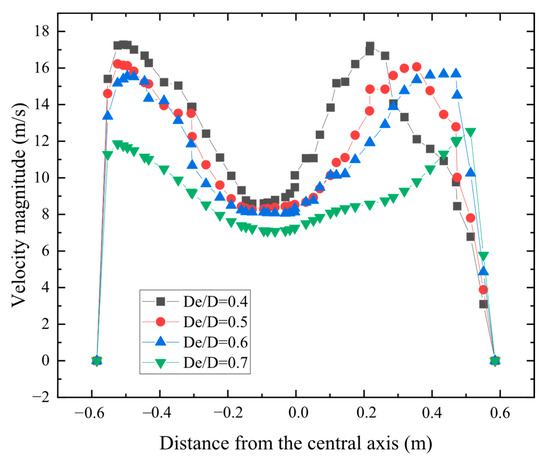
Figure 14.
Velocity magnitude distribution on the intersection line of cylinder and cone under different de/D ratios.
Figure 15 shows that the particle concentration distribution varied with the de/D ratio on the lateral cross-section. The distribution features are the same when the de/D ratios are 04, 0.5, and 0.6. An observable variation occurs in the process of the de/D ratio, increasing from 0.6 to 0.7. Due to the insufficient centrifugal force, a large number of particles are not thrown to the wall of the separator. The high-concentration regions exist near the intersection of the cylinder and cone. Deposited particles on the bottom are seen to agitate dramatically, with the red high-concentration region on the bottom decreasing significantly in height.
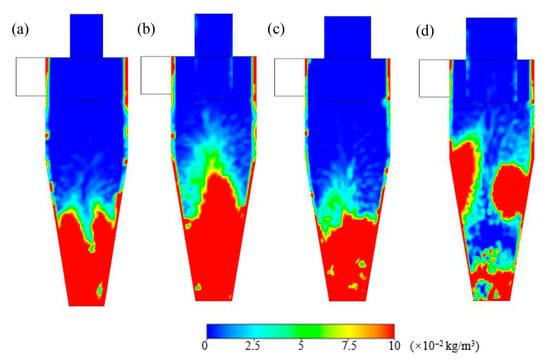
Figure 15.
Solid particle concentration distribution on the lateral cross-section under the different De/D ratios. (a) de/D = 0.4; (b) de/D = 0.5; (c) de/D = 0.6; (d) de/D = 0.7.
Figure 16 gives the separation efficiency and pressure drop with different de/D ratios. A small decrease is observed both in separation efficiency and pressure drop, while the de/D ratio increases from 0.4 to 0.6. The separation efficiency drops from 0.9755 to 0.9321, with the decrease in pressure drop from 1420 Pa to 1345 Pa in this process. As the de/D ratio increases from 0.6 to 0.7, the separation efficiency and pressure drop decrease dramatically, where separation efficiency drops from 0.9321 to 0.7930 and pressure drop decreases from 1345 Pa to 1171 Pa.
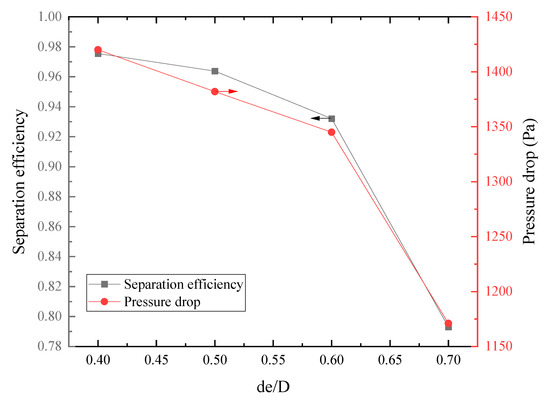
Figure 16.
Separation efficiency and pressure drop varied with de/D ratio.
5. Discussion
It is well-known that the separation efficiency is strongly dependent on the particle size. In the present paper, numerical simulations are carried out for a cyclone separator designed for a coal-fired boiler with a flue gas rate of about 11,000 Nm3/h. The investigation of geometrical parameters is based on particles corresponding to a 90% separation efficiency (D90), which is often used as a performance indicator in cyclone separator design. The employed particle diameter is 12 μm. For a dust collector, the particle diameter at which the separation efficiency reaches 50% is referred to as the cut-off diameter (D50), which serves as an important performance evaluation indicator of the dust collector. In order to acquire the cut-off diameter in the present cyclone separator, the effect of particle size on particle settling is discussed. Figure 17 gives the particle concentration distribution with different particle diameters. While the particle size is small, the centrifugal force suffered by particles is relatively weak, and particles cannot be thrown toward the wall of the cyclone separator. For this reason, the particle is observed to disperse throughout the entire internal space of the separator, as shown in Figure 17a. As particle size increases, the centrifugal force intensifies, leading to a gradual increase in particles near the wall and a corresponding decrease in those in the central region. Particles adjacent to the wall will gradually settle toward the bottom of the cyclone separator under the action of gravity. This process can be clearly observed from Figure 17b–d.
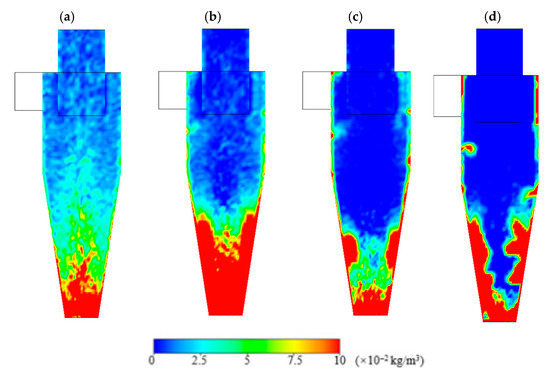
Figure 17.
Solid particle concentration distribution on the lateral cross-section under different particle diameters: (a) 3 μm; (b) 6 μm; (c) 8 μm; (d) 12 μm.
Figure 18 presents the variation in separation efficiency and pressure drop with the particle size. The separation efficiency increased from 23.2% to 88.1% with the particle diameter increasing from 3 μm to 12 μm. The cut-off diameter is approximately 6 μm, since the separation efficiency at a particle size of 6 μm is 51.7%, which is in agreement with the results of Zhao et al. [36]. The change in pressure drop is slight with the increase in particle diameter.
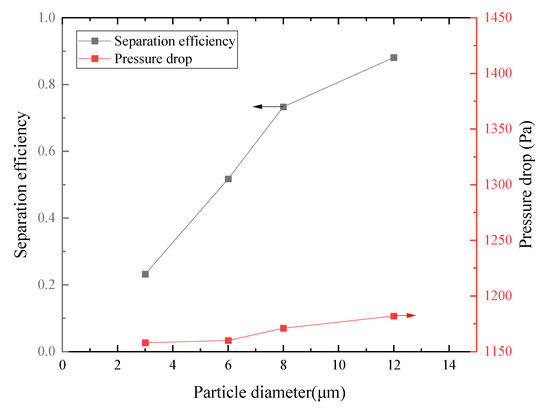
Figure 18.
Separation efficiency and pressure drop varied with particle diameter.
6. Conclusions
In the present paper, numerical simulations were carried out for a cyclone separator used for the separation of flue gas and coal-fired dust. The flue gas flow rate was 11,000 Nm3/h and the dust concentration was 50 g/Nm3 in all cases. Flue gas flow and solid particle motion in the cyclone separator were analyzed, and the effect of structure parameters involved in the separation process was thoroughly discussed. It revealed that the separation of flue gas and dust particles depends on the reversible spiral flow that arises from the cyclone structure. As a result, the structure parameters play an important role in the separation efficiency and the separator resistance. While the L/D ratio is 1.7, an undesirable flow and particle motion is obtained, giving rise to the worst separation efficiency of 0.793. As the H/D ratio is increased, the separation efficiency and the separator resistance both drop. An obvious transformation occurs in velocity and concentration distribution when the H/D ratio is over 2.1. When the de/D ratio increases from 0.4 to 0.7, the separation efficiency drops from 0.9755 to 0.793, with the pressure drop decreasing from 1420 Pa to 1171 Pa. In the process, the de/D ratio is increased from 0.6 to 0.7, and flue gas flow becomes worse, resulting in a dramatic decrease in separation efficiency and pressure drop. The cut-off particle diameter is about 6 μm, and the particle size has little influence on the pressure drop.
Author Contributions
Investigation, C.Z., X.D., M.Z., and Y.Z.; Writing—original draft, X.D.; Writing—review and editing, C.Z. All authors have read and agreed to the published version of the manuscript.
Funding
This work is supported by Yibin University Science and Technology Program (No. 2021QH022) and College Students Innovation and Entrepreneurship Training Program (No. S202510641089).
Data Availability Statement
The original contributions presented in this study are included in the article. Further inquiries can be directed to the corresponding author.
Conflicts of Interest
Xianling Dai is employed by Yibin Guohuan Environmental Protection Engineering Co., Ltd. The remaining authors declare that the research was conducted in the absence of any commercial or financial relationships that could be construed as a potential conflict of interest.
References
- Du, Q.; Su, L.; Dong, H.; Gao, J.; Zhao, Z.; Lv, D.; Wu, S. The experimental study of a water-saving wet electrostatic precipitator for removing fine particles. J. Electrost. 2016, 81, 42–47. [Google Scholar] [CrossRef]
- Qi, L.Q.; Liu, J. Study of Metallurgical industry smoke characteristics and the affect to the performance of electrical precipitator. Adv. Mater. Res. 2012, 402, 371–373. [Google Scholar] [CrossRef]
- Trakumas, S.; Willeke, K.; Reponen, T.; Grinshpun, S.A.; Friedman, W. Comparison of filter bag, cyclonic, and wet dust collection methods in vacuum cleaners. AIHAJ-Am. Ind. Hyg. Assoc. 2001, 62, 573–583. [Google Scholar] [CrossRef]
- Hoffmann, A.C.; Stein, L.E.; Bradshaw, P. Gas cyclones and swirl tubes: Principles, design and operation. Appl. Mech. Rev. 2003, 56, B28–B29. [Google Scholar] [CrossRef]
- Hughs, S.; Baker, R. Effectiveness of model cyclone designs in collecting gin trash particulate emissions. Appl. Eng. Agric. 1998, 14, 317–322. [Google Scholar] [CrossRef]
- Misiulia, D.; Andersson, A.G.; Lundström, T.S. Effects of the inlet angle on the collection efficiency of a cyclone with helical-roof inlet. Powder Technol. 2017, 305, 48–55. [Google Scholar] [CrossRef]
- Bogodage, S.G.; Leung, A. Improvements of the cyclone separator performance by down-comer tubes. J. Hazard. Mater. 2016, 311, 100–114. [Google Scholar] [CrossRef]
- Kim, J.; Lee, K. Experimental study of particle collection by small cyclones. Aerosol Sci. Technol. 1990, 12, 1003–1015. [Google Scholar] [CrossRef]
- El-Batsh, H.M. Improving cyclone performance by proper selection of the exit pipe. Appl. Math. Model. 2013, 37, 5286–5303. [Google Scholar] [CrossRef]
- Ficici, F.; Ari, V.; Kapsiz, M. The effects of vortex finder on the pressure drop in cyclone separators. Int. J. Phys. Sci. 2010, 5, 804–813. [Google Scholar]
- Gimbun, J.; Chuah, T.; Choong, T.S.; Fakhru’l-Razi, A. Prediction of the effects of cone tip diameter on the cyclone performance. J. Aerosol Sci. 2005, 36, 1056–1065. [Google Scholar] [CrossRef]
- Pandey, S.; Saha, I.; Prakash, O.; Mukherjee, T.; Iqbal, J.; Roy, A.K.; Wasilewski, M.; Brar, L.S. CFD investigations of cyclone separators with different cone heights and shapes. Appl. Sci. 2022, 12, 4904. [Google Scholar] [CrossRef]
- Elsayed, K.; Lacor, C. Numerical modeling of the flow field and performance in cyclones of different cone-tip diameters. Comput. Fluids 2011, 51, 48–59. [Google Scholar] [CrossRef]
- Xiang, R.; Park, S.; Lee, K. Effects of cone dimension on cyclone performance. J. Aerosol Sci. 2001, 32, 549–561. [Google Scholar] [CrossRef]
- Ter Linden, A. Investigations into cyclone dust collectors. Proc. Inst. Mech. Eng. 1949, 160, 233–251. [Google Scholar] [CrossRef]
- Fan, Y.; Wang, J.; Bai, Z.; Wang, J.; Wang, H. Experimental investigation of various inlet section angles in mini-hydrocyclones using particle imaging velocimetry. Sep. Purif. Technol. 2015, 149, 156–164. [Google Scholar] [CrossRef]
- Zhao, W.; Li, J.-p.; Zhang, T.; Wei, A.-s.; Li, S.-y.; Yang, D.-h.; Yang, X.-j.; Jiang, X.; Wang, H. Separation characters of dewatering hydrocyclone with annular vortex finder based on particle image velocimetry and experiments. Sep. Purif. Technol. 2025, 353, 128619. [Google Scholar] [CrossRef]
- Gao, Z.; Wang, J.; Wang, J.; Mao, Y. Time-frequency analysis of the vortex motion in a cylindrical cyclone separator. Chem. Eng. J. 2019, 373, 1120–1131. [Google Scholar] [CrossRef]
- Jia, M.; Wang, D.; Yan, C.; Song, J.; Han, Q.; Chen, F.; Wei, Y. Analysis of the pressure fluctuation in the flow field of a large-scale cyclone separator. Powder Technol. 2019, 343, 49–57. [Google Scholar] [CrossRef]
- Derksen, J.; Van den Akker, H. Simulation of vortex core precession in a reverse-flow cyclone. AIChE J. 2000, 46, 1317–1331. [Google Scholar] [CrossRef]
- Elsayed, K.; Lacor, C. The effect of cyclone inlet dimensions on the flow pattern and performance. Appl. Math. Model. 2011, 35, 1952–1968. [Google Scholar] [CrossRef]
- Azadi, M.; Azadi, M.; Mohebbi, A. A CFD study of the effect of cyclone size on its performance parameters. J. Hazard. Mater. 2010, 182, 835–841. [Google Scholar] [CrossRef]
- Wang, L.; Chen, E.; Ma, L.; Yang, Z.; Li, Z.; Yang, W.; Wang, H.; Chang, Y. Numerical simulation and experimental study of gas cyclone–liquid jet separator for fine particle separation. Chin. J. Chem. Eng. 2022, 51, 43–52. [Google Scholar] [CrossRef]
- Chen, J.; Chen, Y.; Zhang, L.; Zhao, B.; Li, Y. Numerical Simulation of a Novel Secondary Separation Cyclone. Processes 2025, 13, 1874. [Google Scholar] [CrossRef]
- Zhang, D.Y.; Wang, C. Handbook of Dust Removal Engineering Design, 3rd ed.; Chemical Industry Press: Beijing, China, 2021. [Google Scholar]
- Spurk, H.J.; Aksel, N. Fluid Mechanics; Springer: Berlin/Heidelberg, Germany, 2008. [Google Scholar]
- Lumley, J.L. Computational modeling of turbulent flows. Adv. Appl. Mech. 1979, 18, 123–176. [Google Scholar]
- Argyropoulos, C.D.; Markatos, N. Recent advances on the numerical modelling of turbulent flows. Appl. Math. Model. 2015, 39, 693–732. [Google Scholar] [CrossRef]
- Vegini, A.A.; Meier, H.F.; Iess, J.J.; Mori, M. Computational fluid dynamics (CFD) analysis of cyclone separators connected in series. Ind. Eng. Chem. Res. 2008, 47, 192–200. [Google Scholar] [CrossRef]
- Shin, M.-S.; Kim, H.-S.; Jang, D.-S.; Chung, J.-D.; Bohnet, M. A numerical and experimental study on a high efficiency cyclone dust separator for high temperature and pressurized environments. Appl. Therm. Eng. 2005, 25, 1821–1835. [Google Scholar] [CrossRef]
- Li, A.; Ahmadi, G. Dispersion and deposition of spherical particles from point sources in a turbulent channel flow. Aerosol Sci. Technol. 1992, 16, 209–226. [Google Scholar] [CrossRef]
- Saffman, P.G. The lift on a small sphere in a slow shear flow. J. Fluid Mech. 1965, 22, 385–400. [Google Scholar] [CrossRef]
- Li, W.; Shi, H.; Yu, X. An improvement to continuous random walk model for sediment diffusion in inhomogeneous turbulent flows. Environ. Fluid Mech. 2023, 23, 779–797. [Google Scholar] [CrossRef]
- Gosman, A.; Loannides, E. Aspects of computer simulation of liquid-fueled combustors. J. Energy 1983, 7, 482–490. [Google Scholar] [CrossRef]
- ANSYS, Inc. ANSYS FLUENT 12.0. Theory Guide; ANSYS, Inc.: Canonsburg, PA, USA, 2009. [Google Scholar]
- Zhao, B.; Su, Y. Particle size cut performance of aerodynamic cyclone separators: Generalized modeling and characterization by correlating global cyclone dimensions. J. Aerosol Sci. 2018, 120, 1–11. [Google Scholar] [CrossRef]


Disclaimer/Publisher’s Note: The statements, opinions and data contained in all publications are solely those of the individual author(s) and contributor(s) and not of MDPI and/or the editor(s). MDPI and/or the editor(s) disclaim responsibility for any injury to people or property resulting from any ideas, methods, instructions or products referred to in the content. |
© 2025 by the authors. Licensee MDPI, Basel, Switzerland. This article is an open access article distributed under the terms and conditions of the Creative Commons Attribution (CC BY) license (https://creativecommons.org/licenses/by/4.0/).