A Study on the Key Factors Influencing Power Grid Outage Restoration Times: A Case Study of the Jiexi Area
Abstract
1. Introduction
2. Methods
2.1. Study Area and Characterization
- (1)
- Which metrics of the distribution network architecture significantly affect the duration of outages?
- (2)
- Which distribution architecture metrics have a significant impact on outage duration?
- (3)
- What is the quantitative relationship between key indices and outage duration affecting power supply reliability?
2.2. Data Sources
2.3. Data Processing and Analysis
2.3.1. Random Forest Regression Model (RF)
2.3.2. Lasso Regression Model (LRM)
2.3.3. Recursive Feature Elimination (RFE)
2.3.4. Consensus-Based Feature Importance Analysis
- (1)
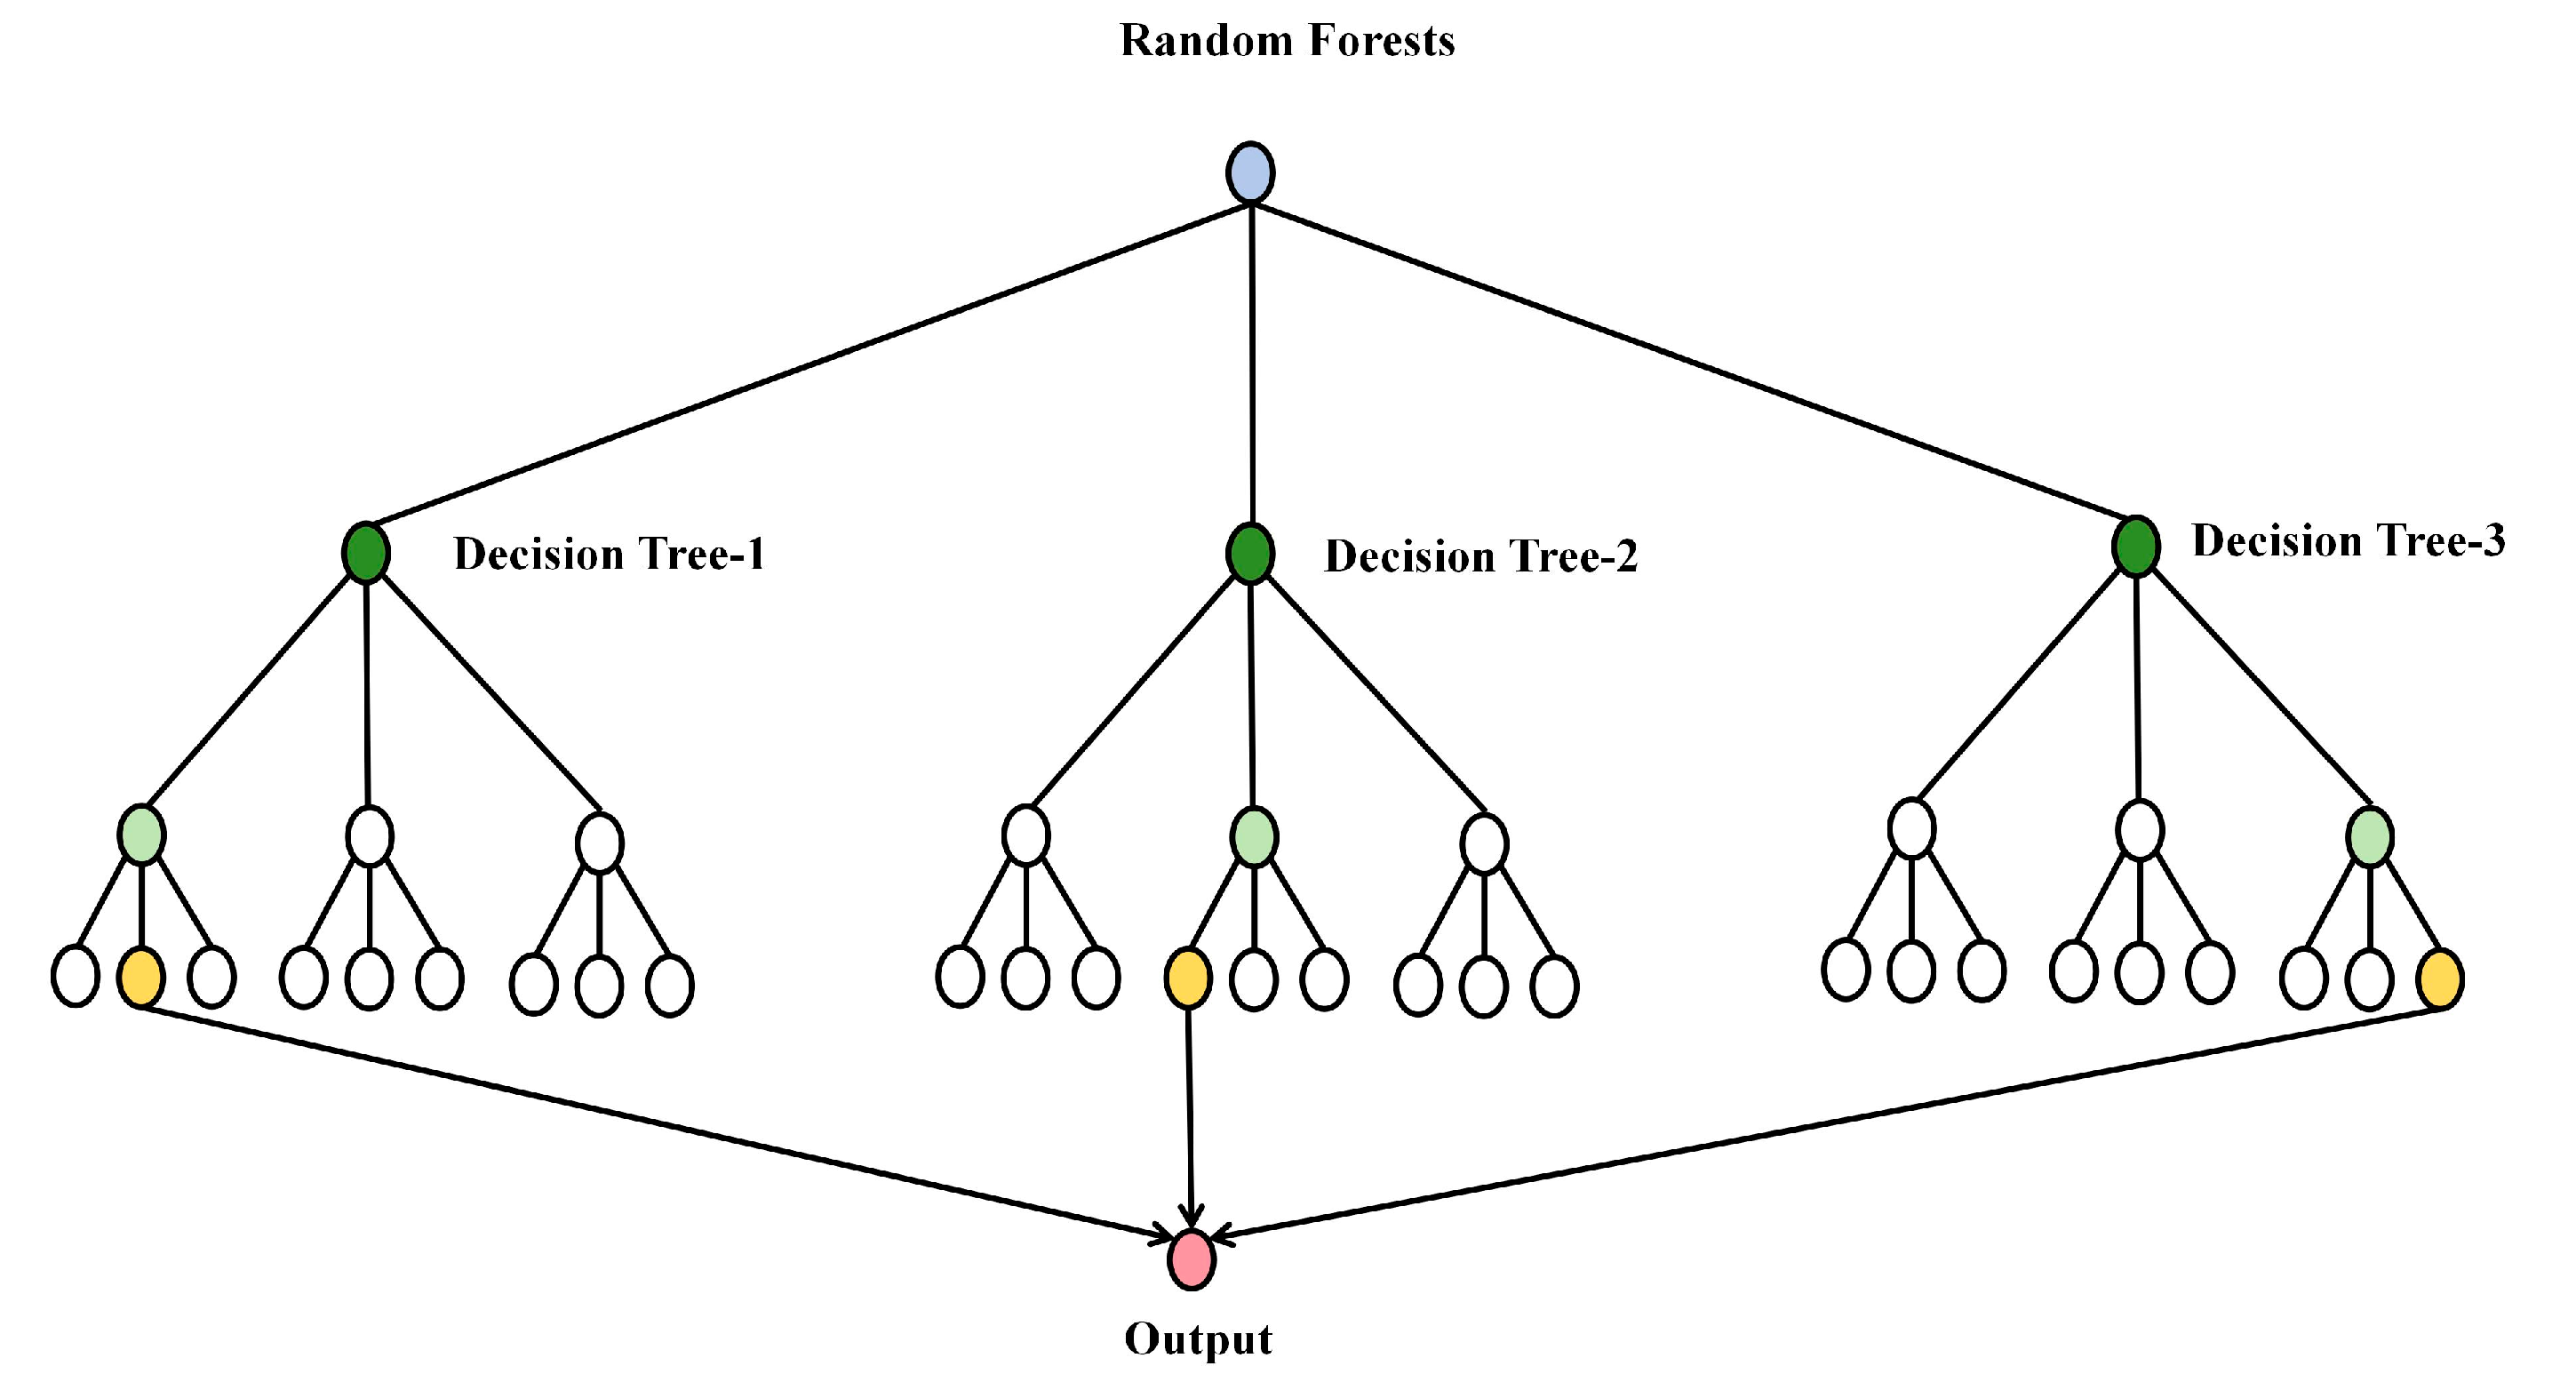
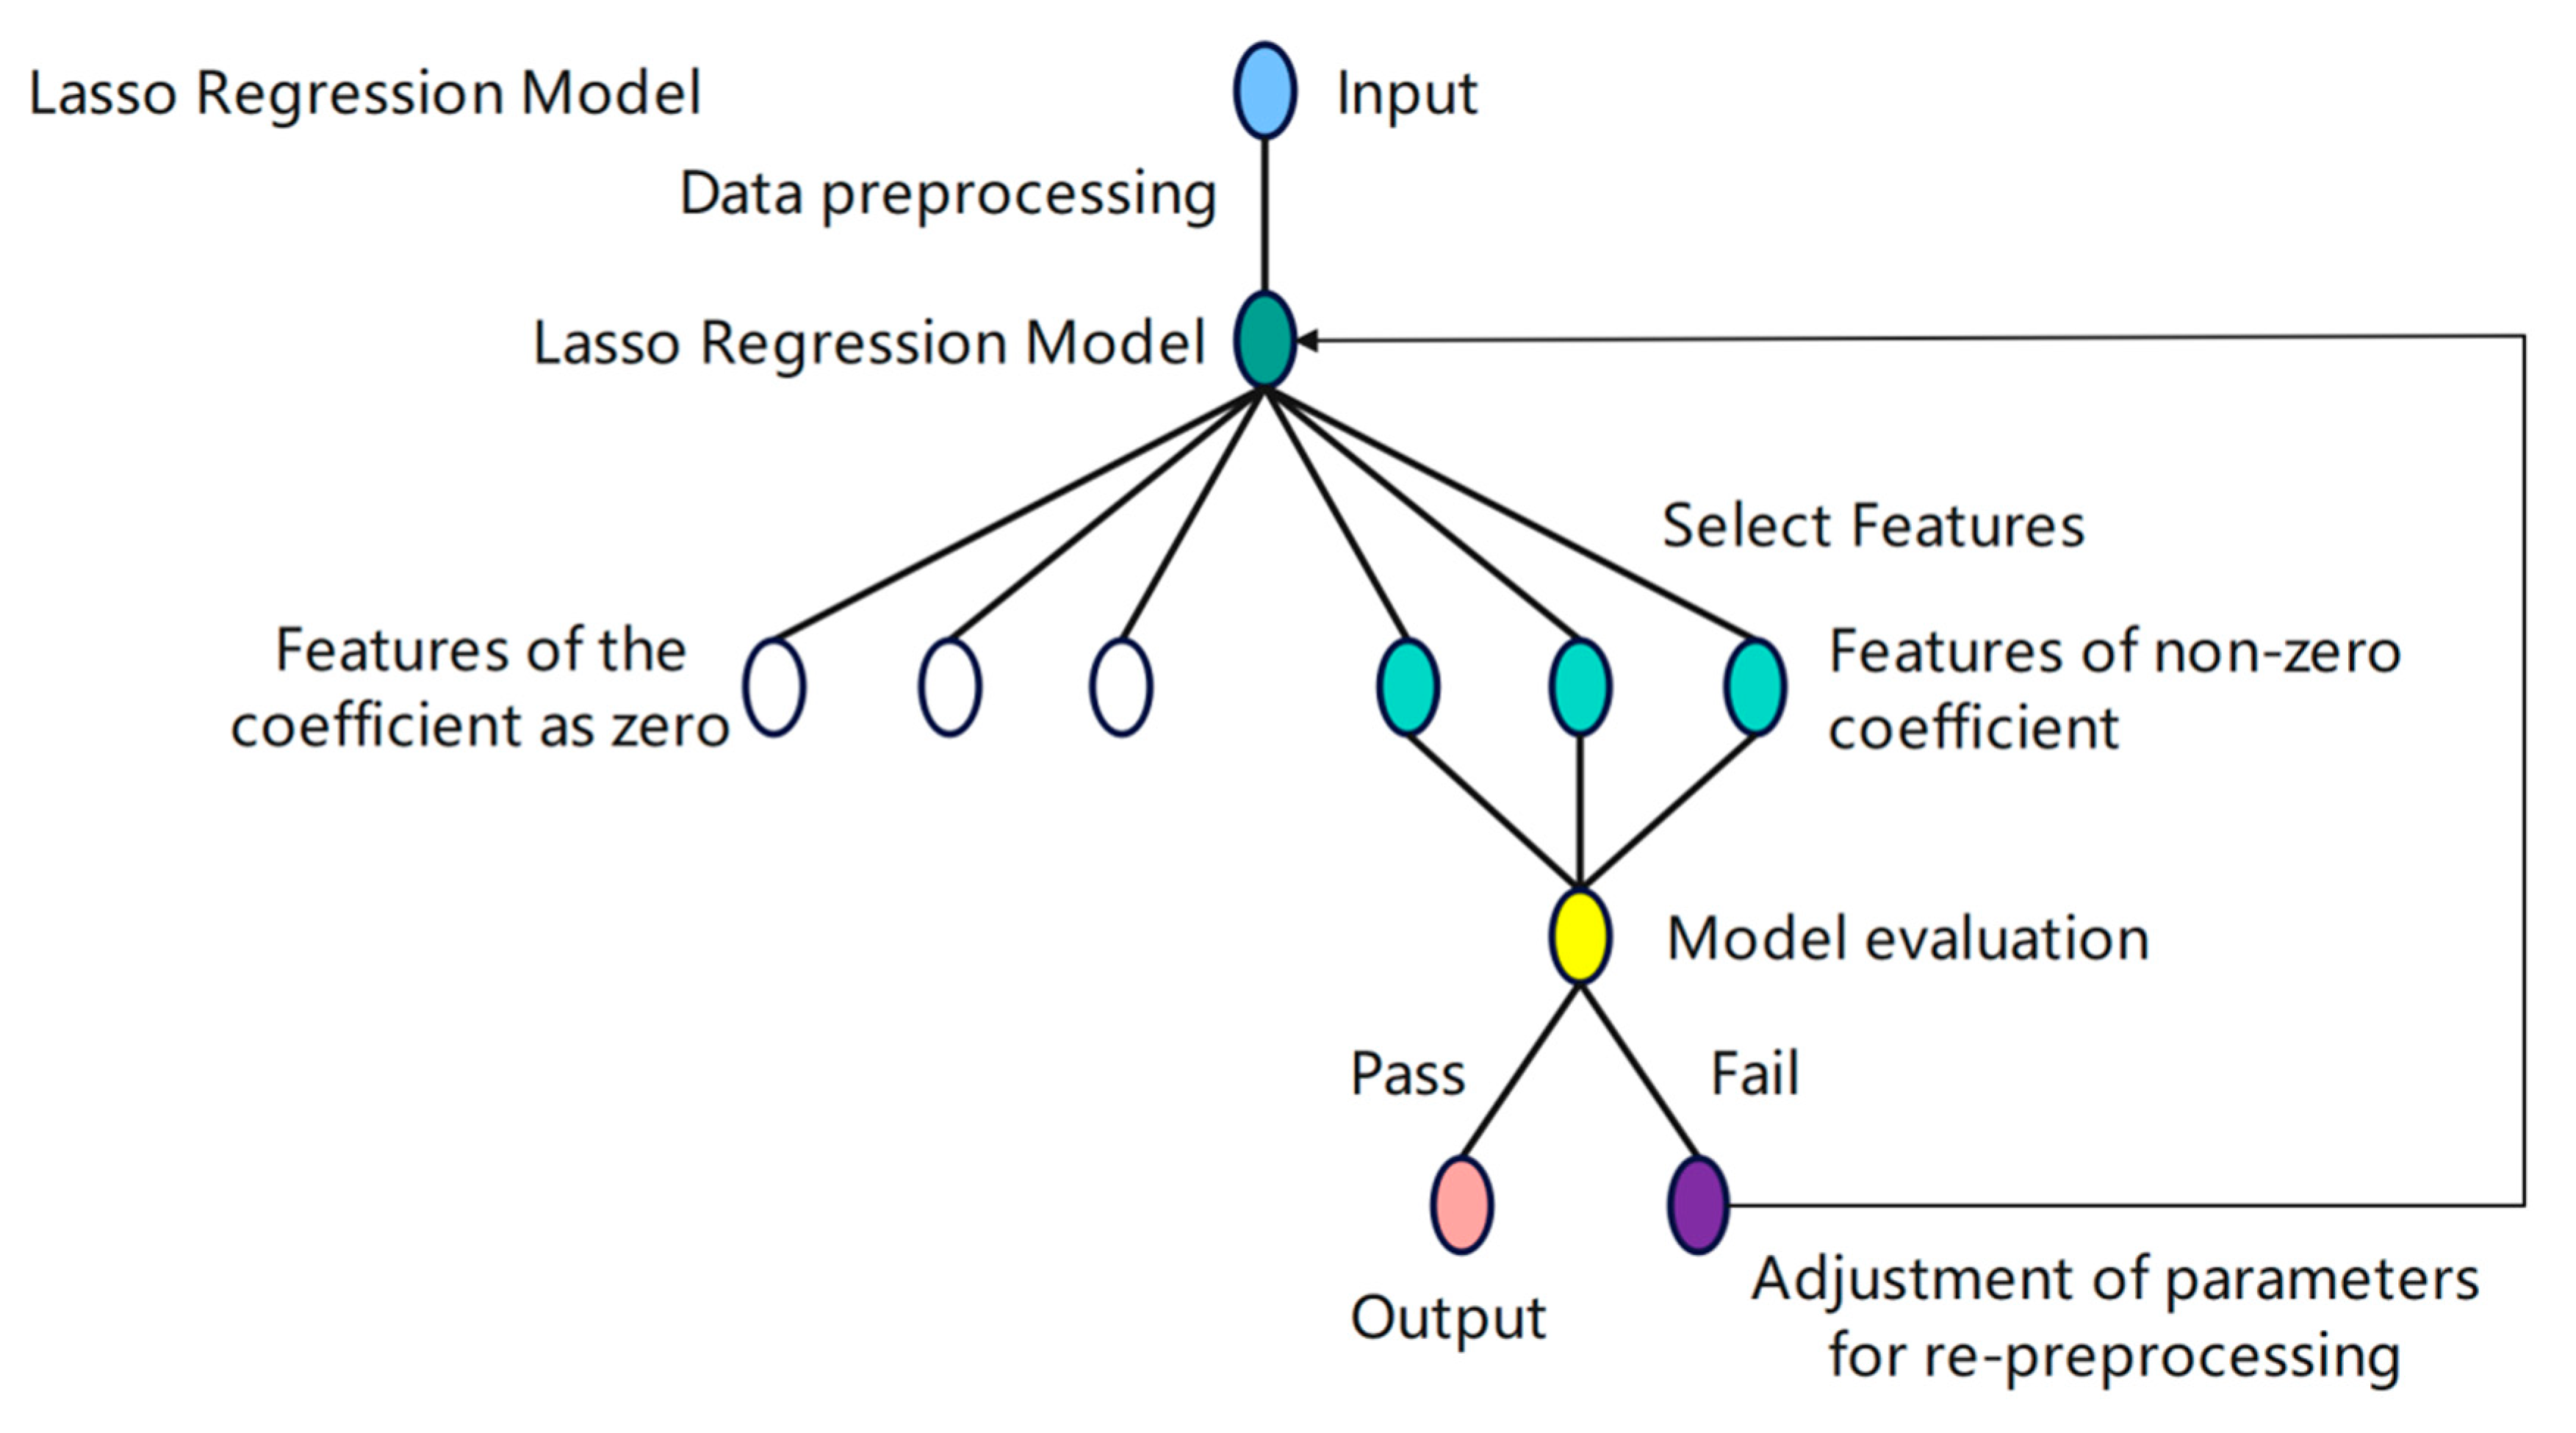
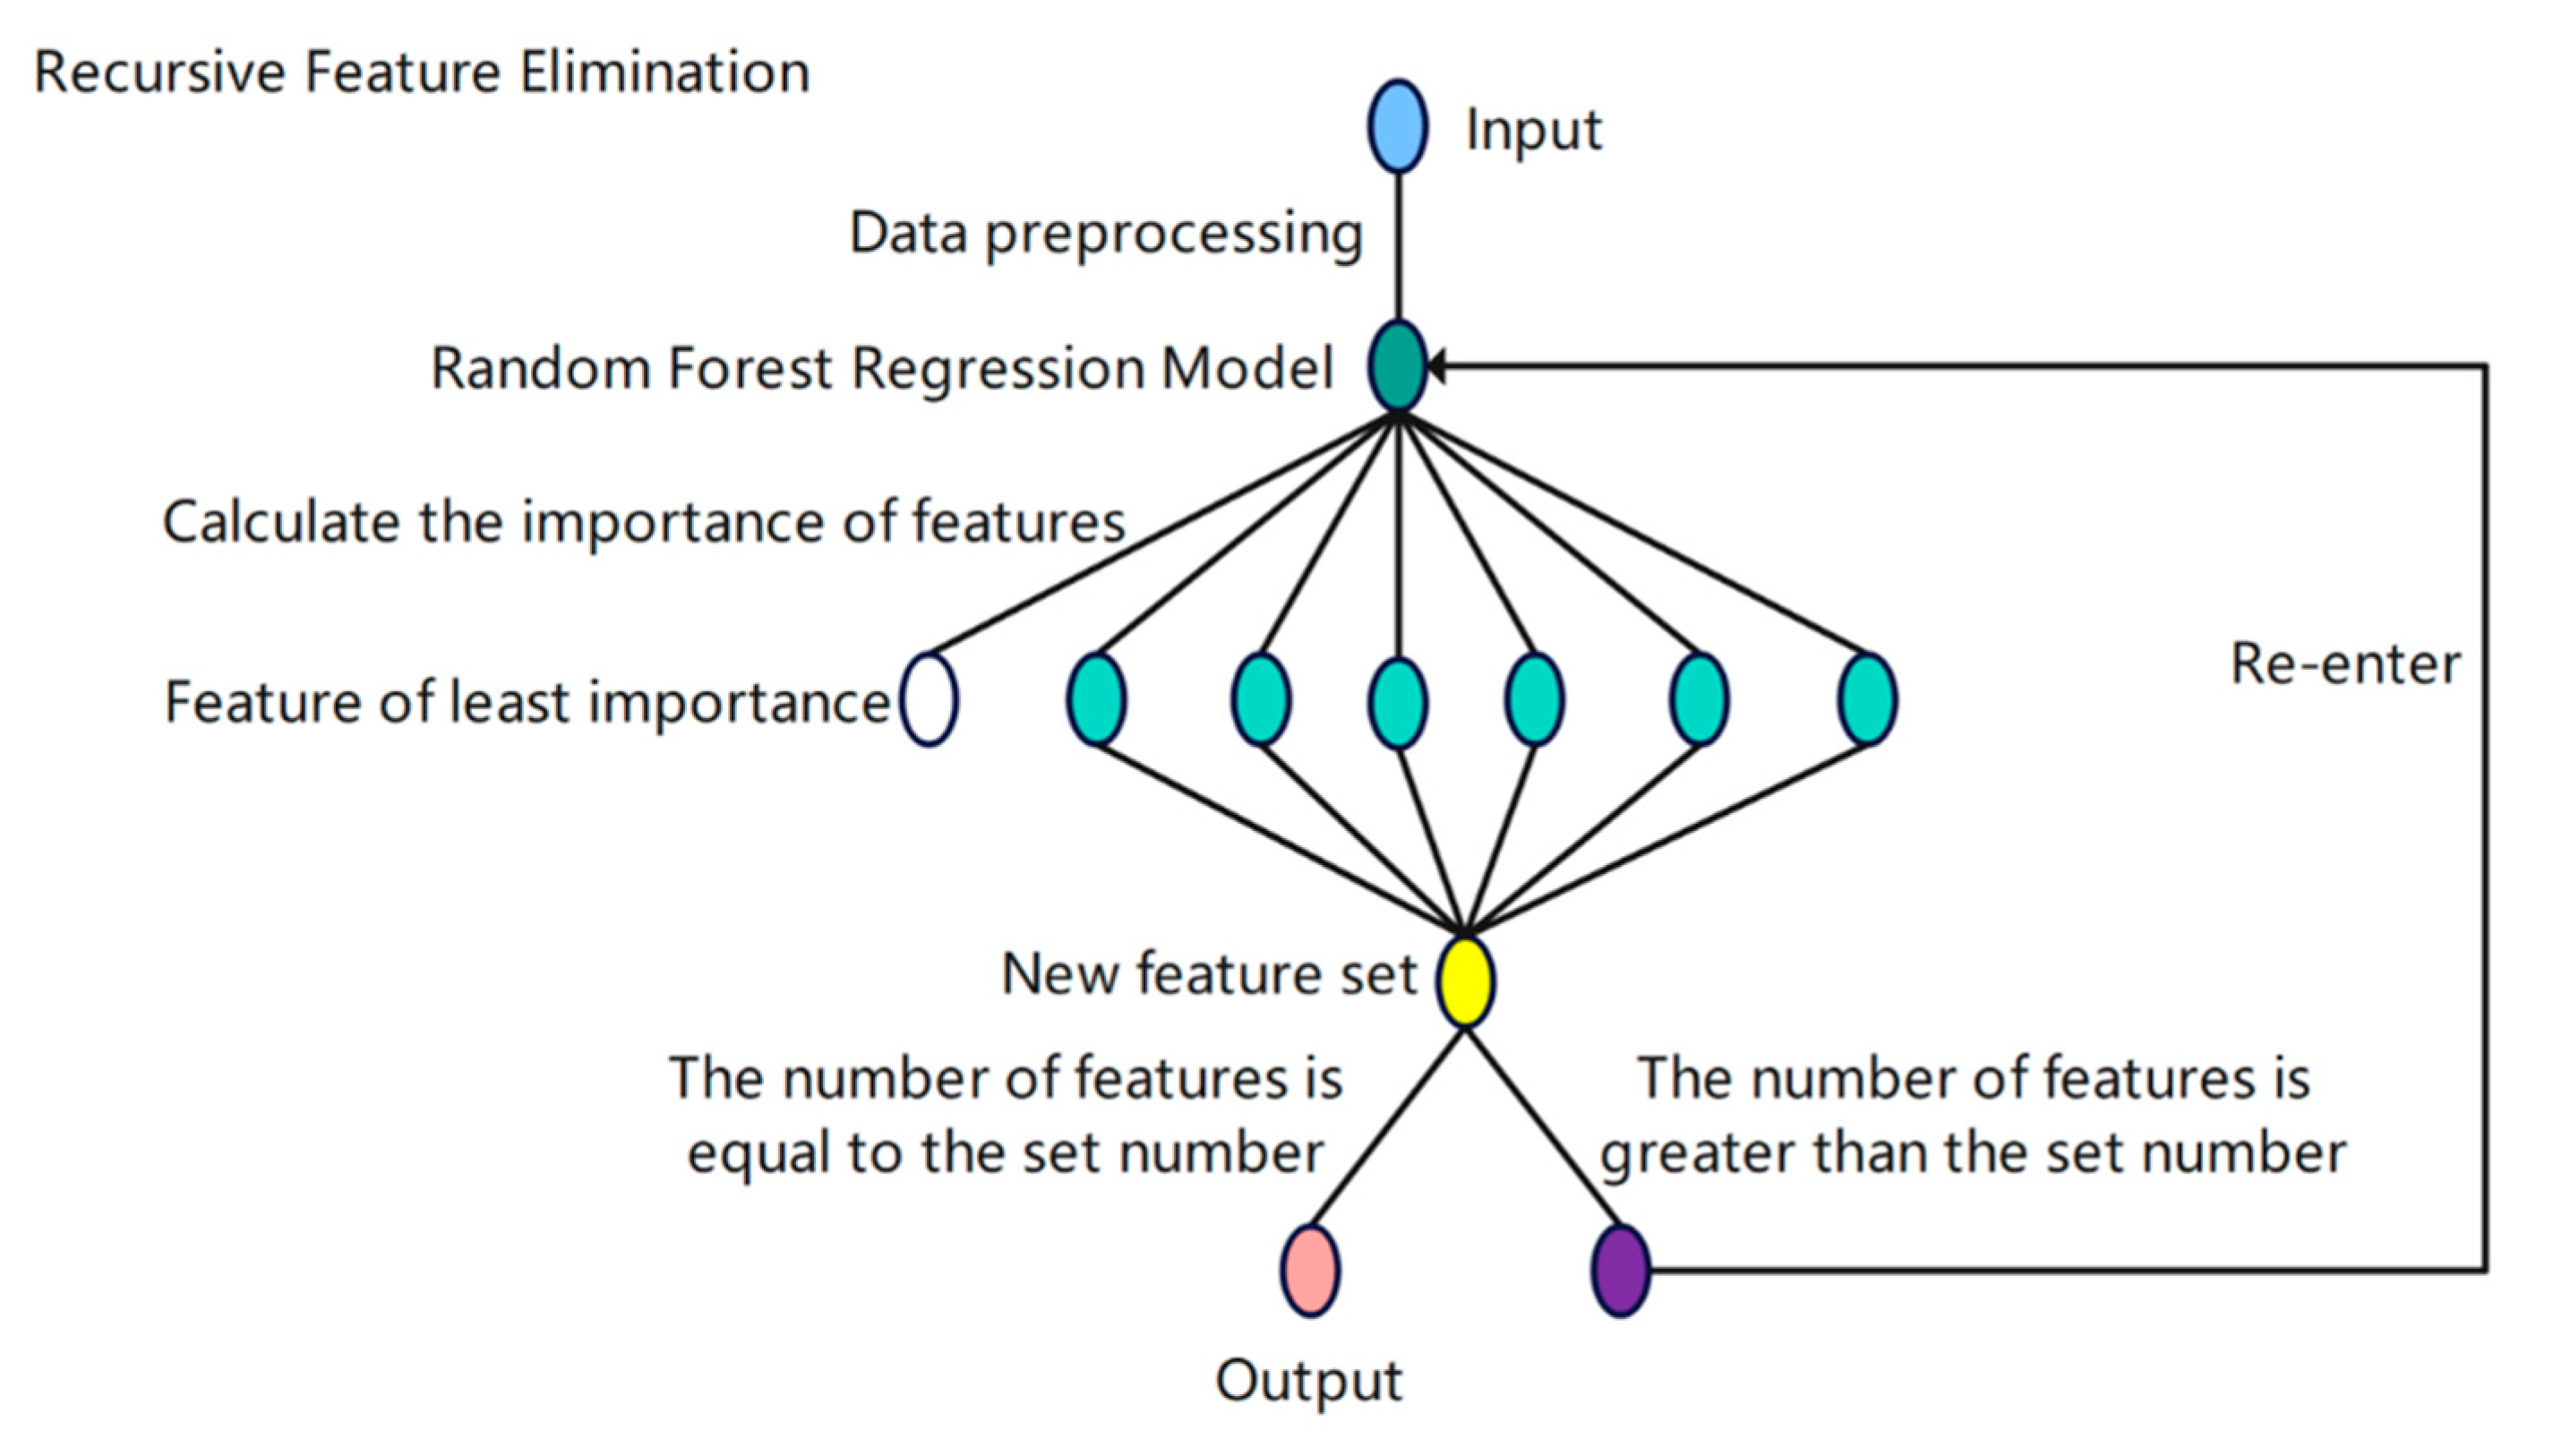
- Independent Feature Ranking: Feature importance rankings derived from three methods, Random Forest, Lasso Regression, and Recursive Feature Elimination, each of which provides a unique analytical perspective (see Section 3.3). The RF model provides rankings based on Gini importance. Meanwhile, the Lasso model ranks features based on the absolute magnitude of the feature coefficients. Finally, RFE produces the ranking based on feature persistence during iterative backward elimination, which identifies a core subset of features that collectively maintain predictive power.
- (2)
- Definition of Consensus: Following the generation of independent rankings, a consensus rule was established to identify the most robust indicators. “Consensus features” are defined as those that consistently appear among the top-ranked variables across the methodologically distinct lists. For the purposes of this study, the specific criterion for this cross-comparison was uniformly set as the top 15 features identified by each of the three models.
- (3)
- Identification of Consensus Features: The final step involves systematically comparing the top-ranked features from all three lists. Features are then categorized by their level of consensus (i.e., identified by three, two, or only one model). Those identified by all three models are considered the most robust and trustworthy indicators, as their significance is validated across linear, non-linear, and iterative-selection frameworks.
2.4. Model Training and Hyperparameter Optimization
3. Results
3.1. Outage Frequency and Lines
3.2. “Two-Hour” Reliability Demonstration and Key Index Analysis
3.3. Identification of Key Influencing Indicators via Consensus-Based Feature Importance
3.4. Exploring the Quantitative Relationship Between Key Indices and Outage Durations
4. Discussion
4.1. Structural and Operational Challenges Undermining Grid Reliability
4.2. A Validated Structural Approach to Resilience: Interpretation, Context, and Limitations
4.3. Complementary Insights from Univariate and Multivariate Analyses
5. Conclusions
- (1)
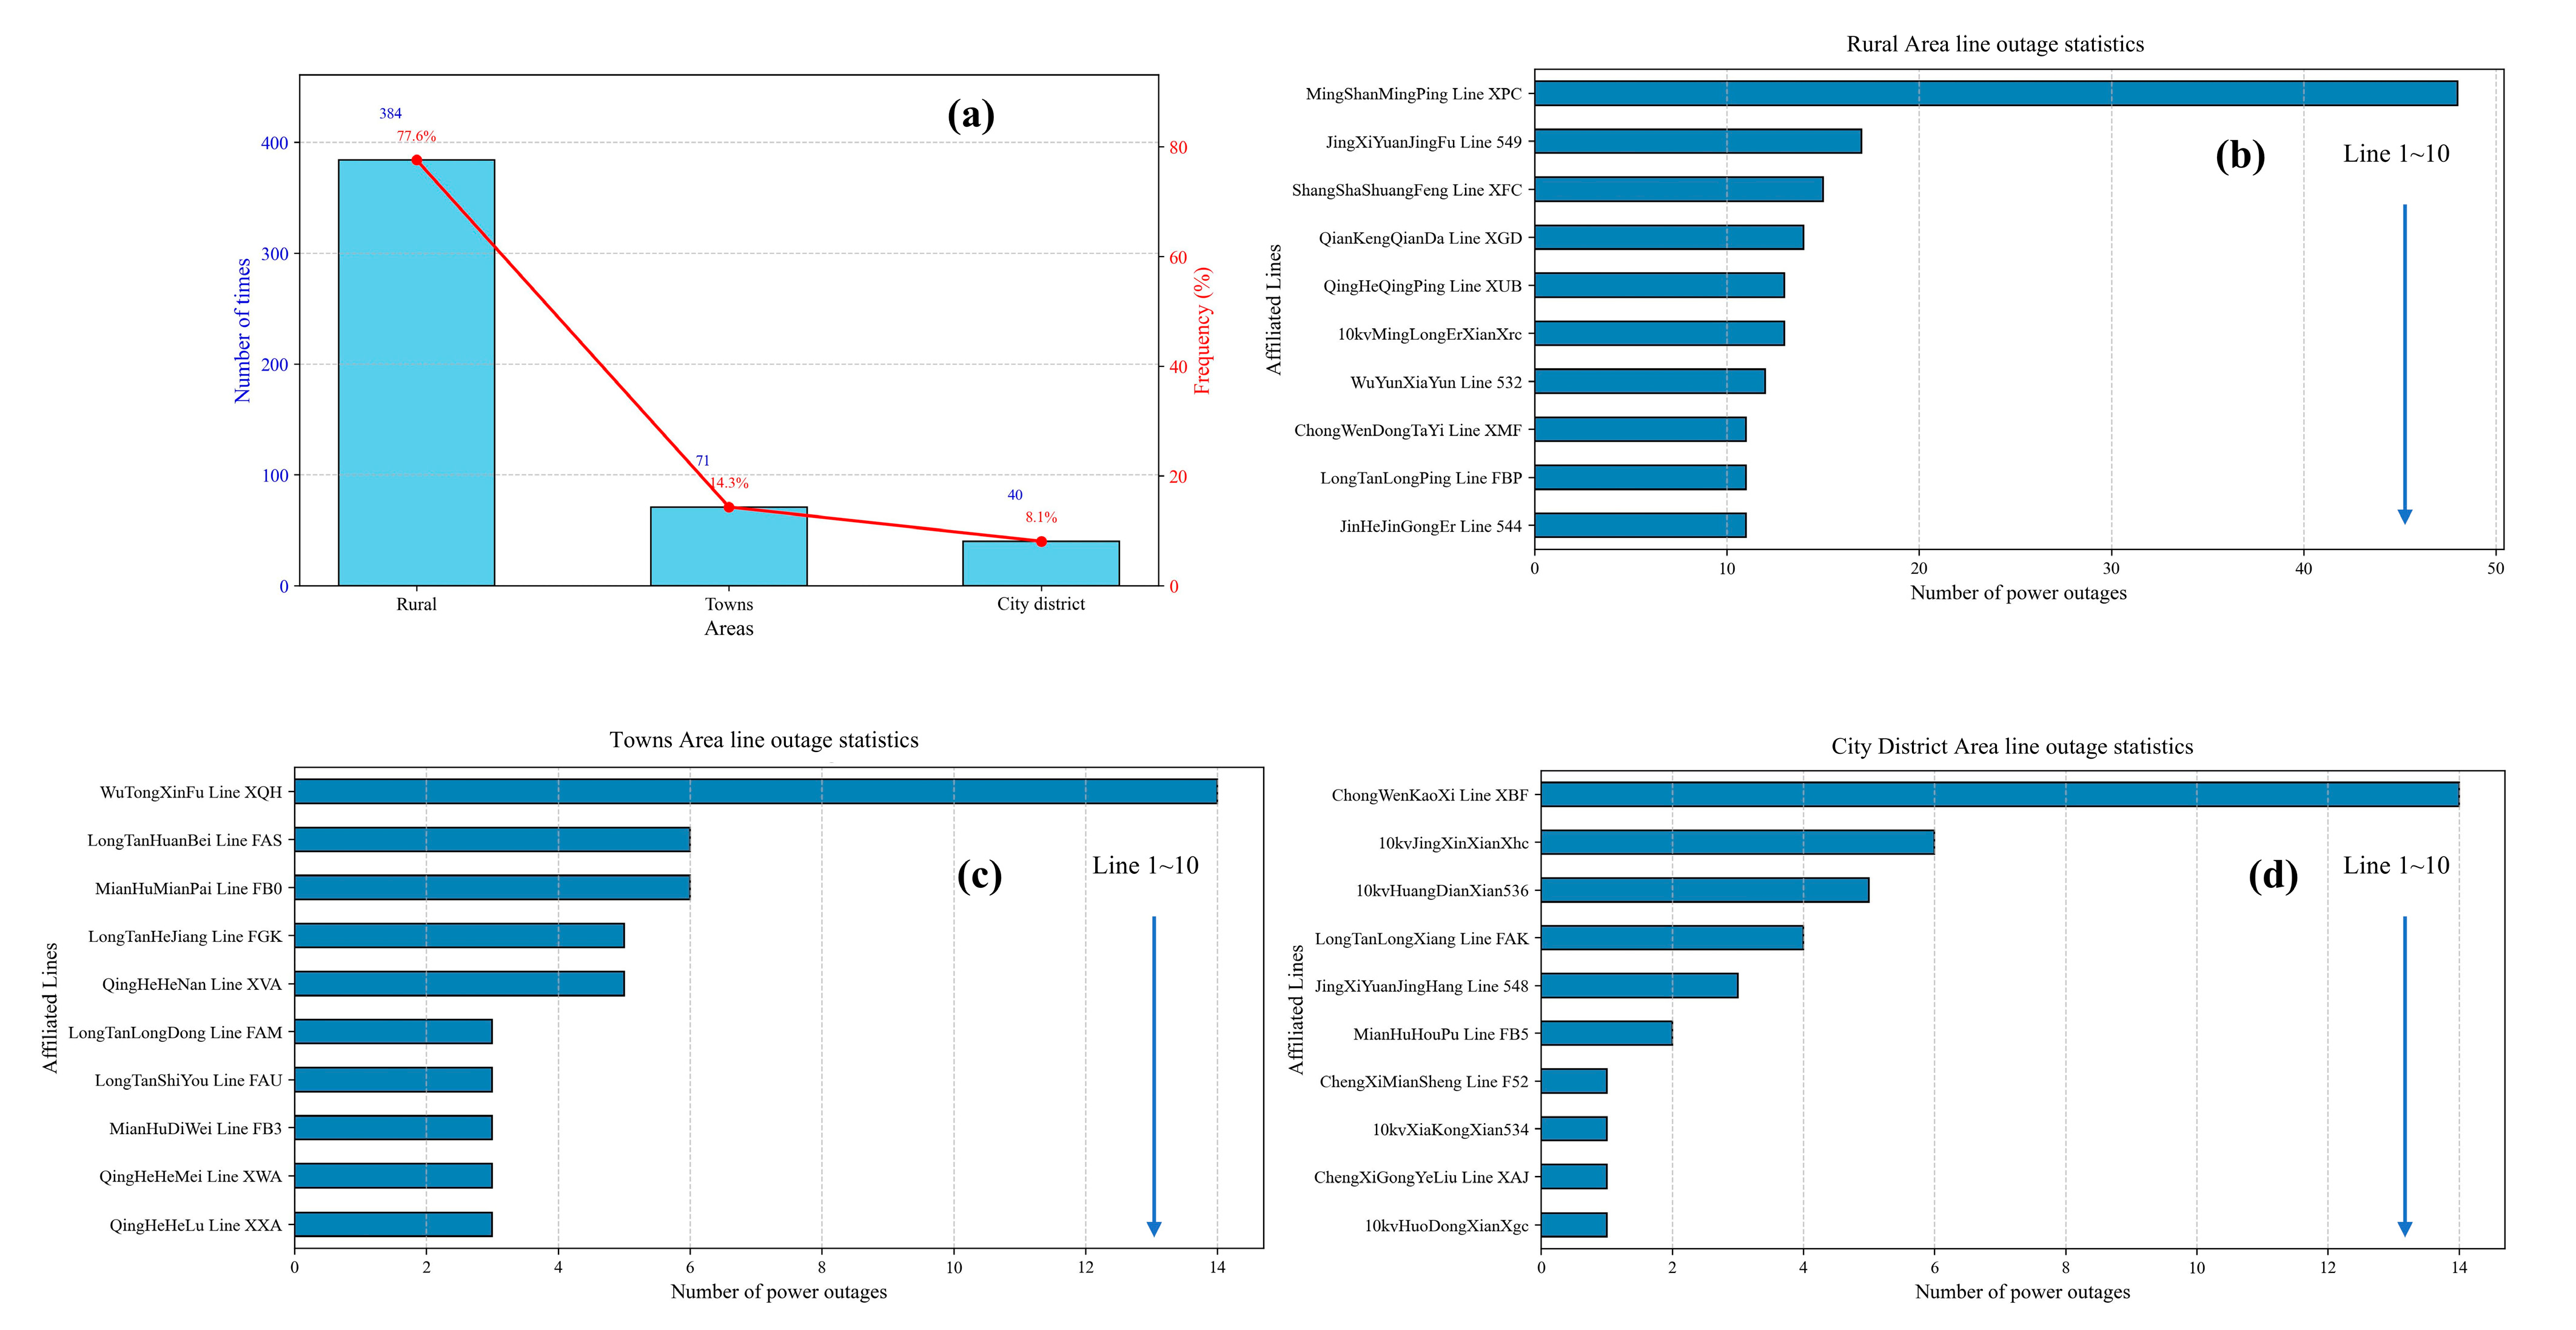
- The statistical analysis confirms that the studied rural power grid not only experiences significantly higher outage frequencies, but also markedly longer outage durations compared to adjacent urban and township grids. These disparities highlight persistent challenges related to structural limitations, inadequate automation, and constrained emergency response capabilities in underdeveloped regions.
- (2)
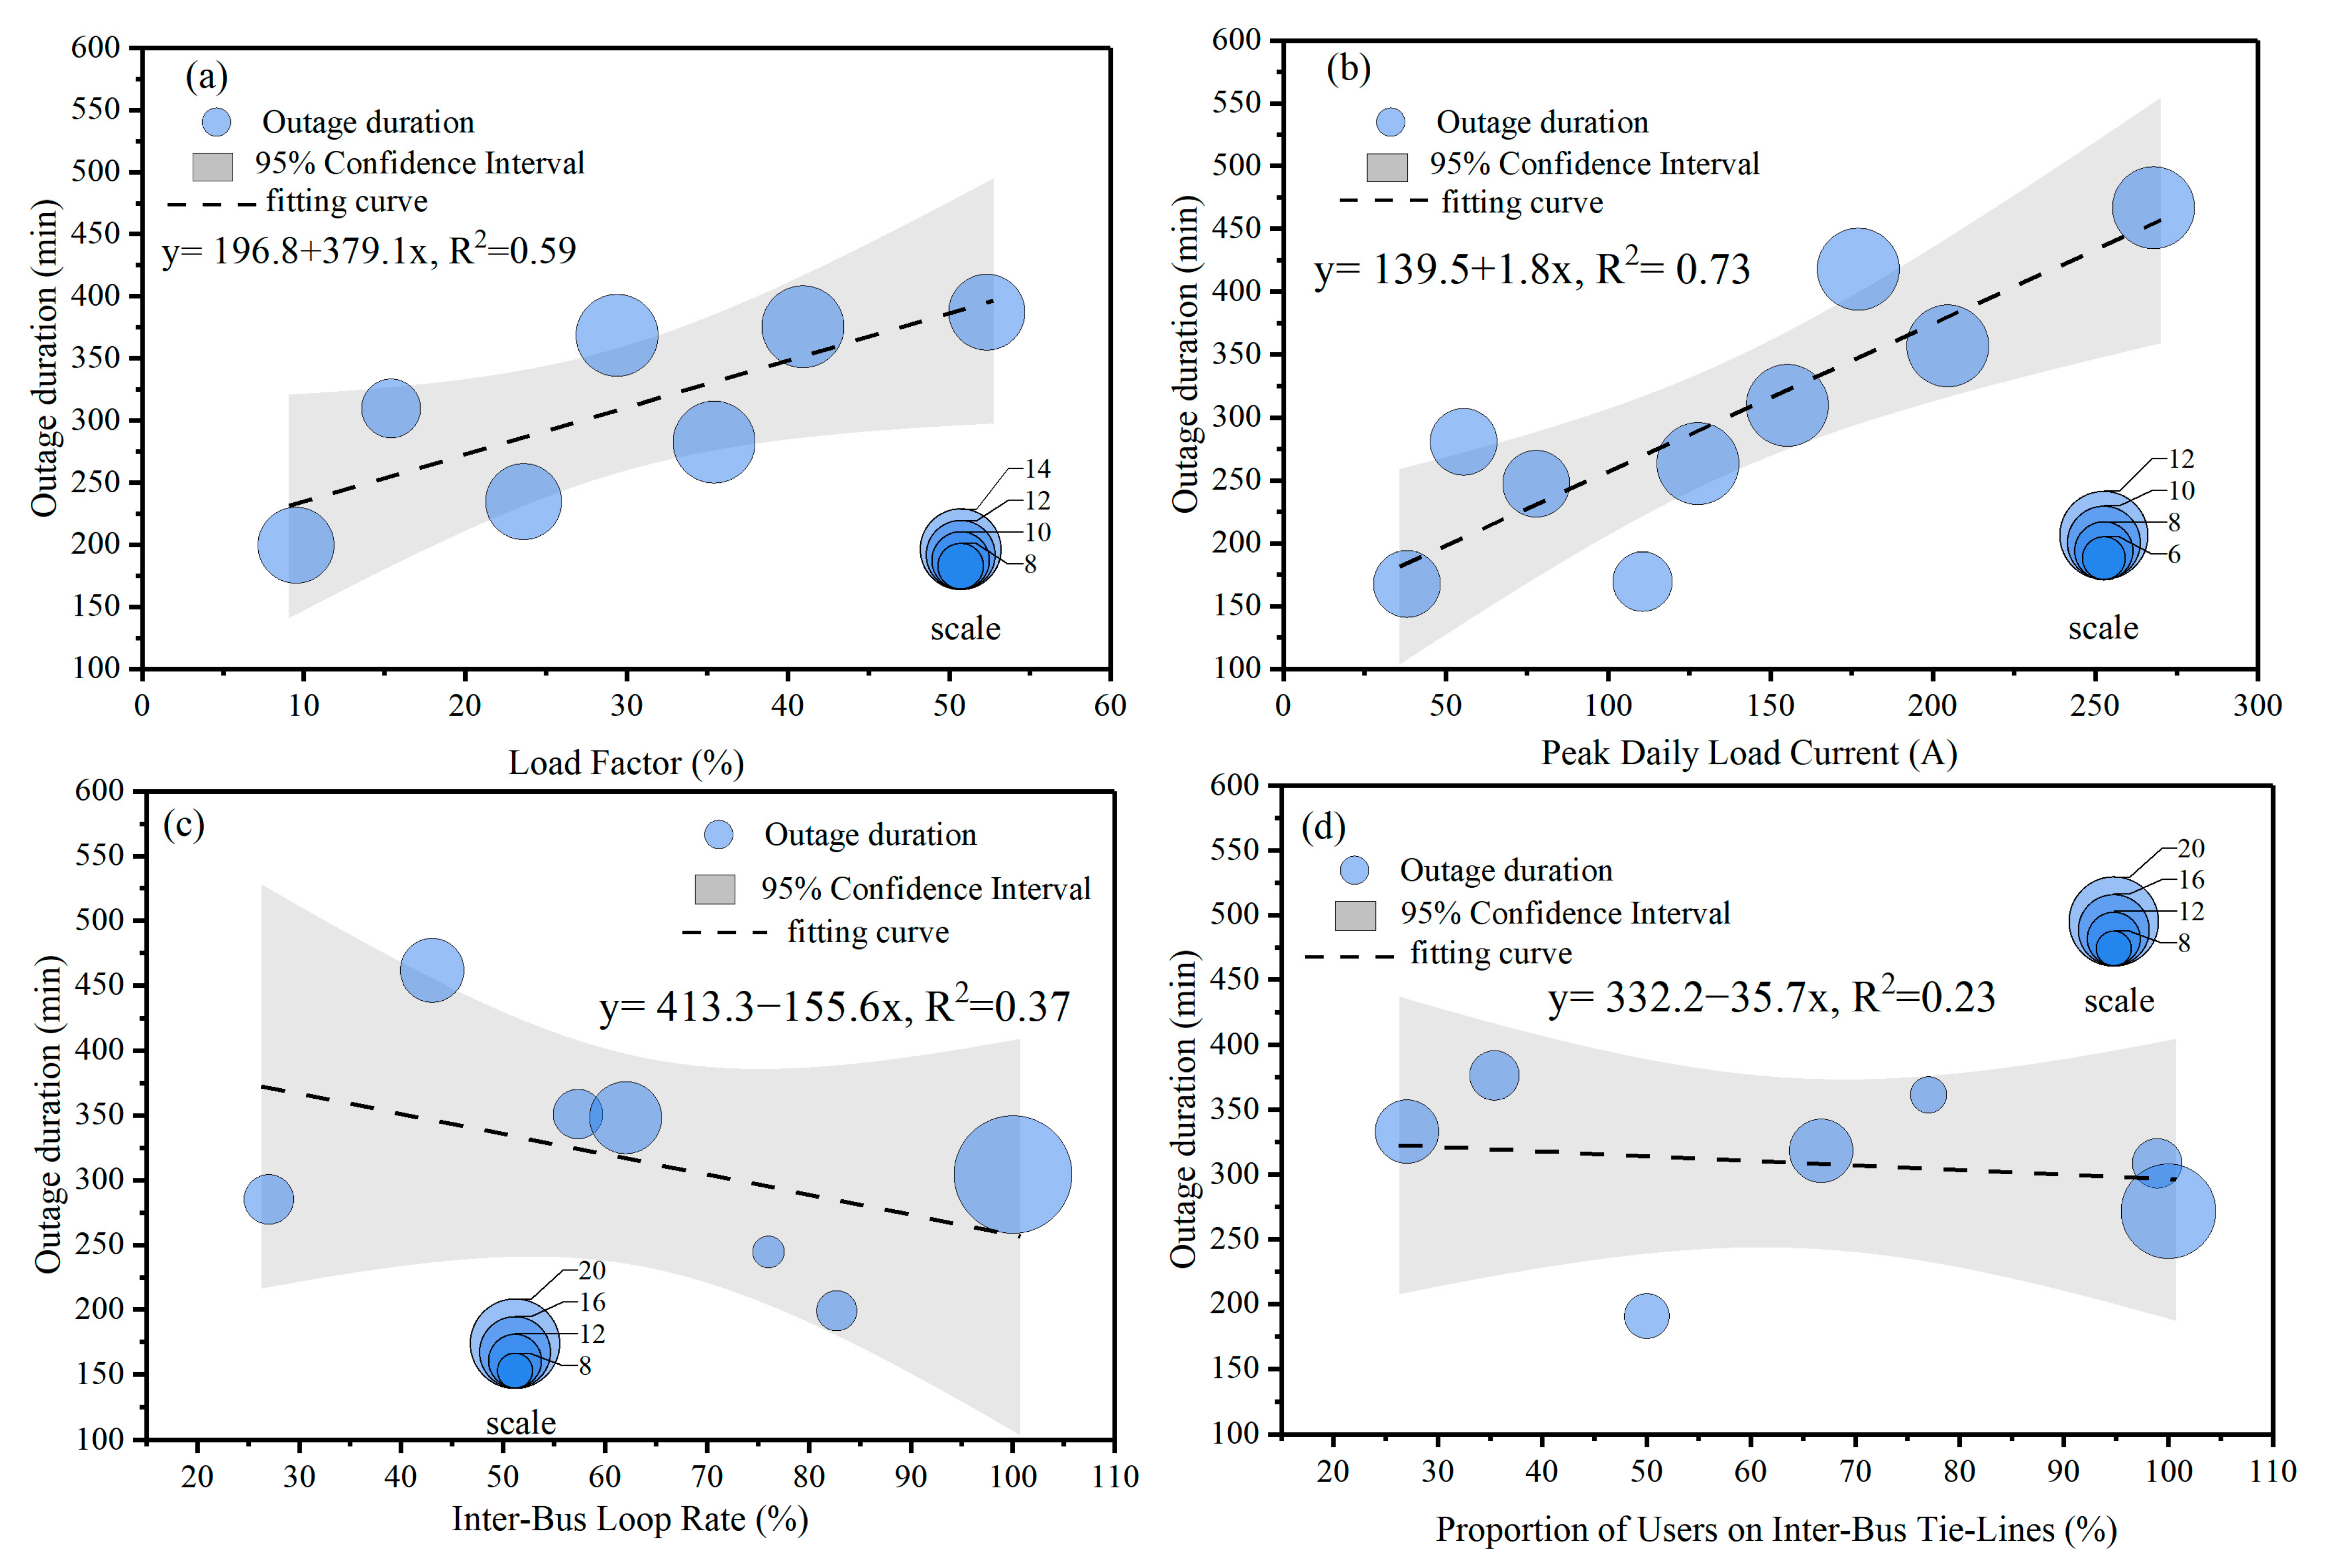
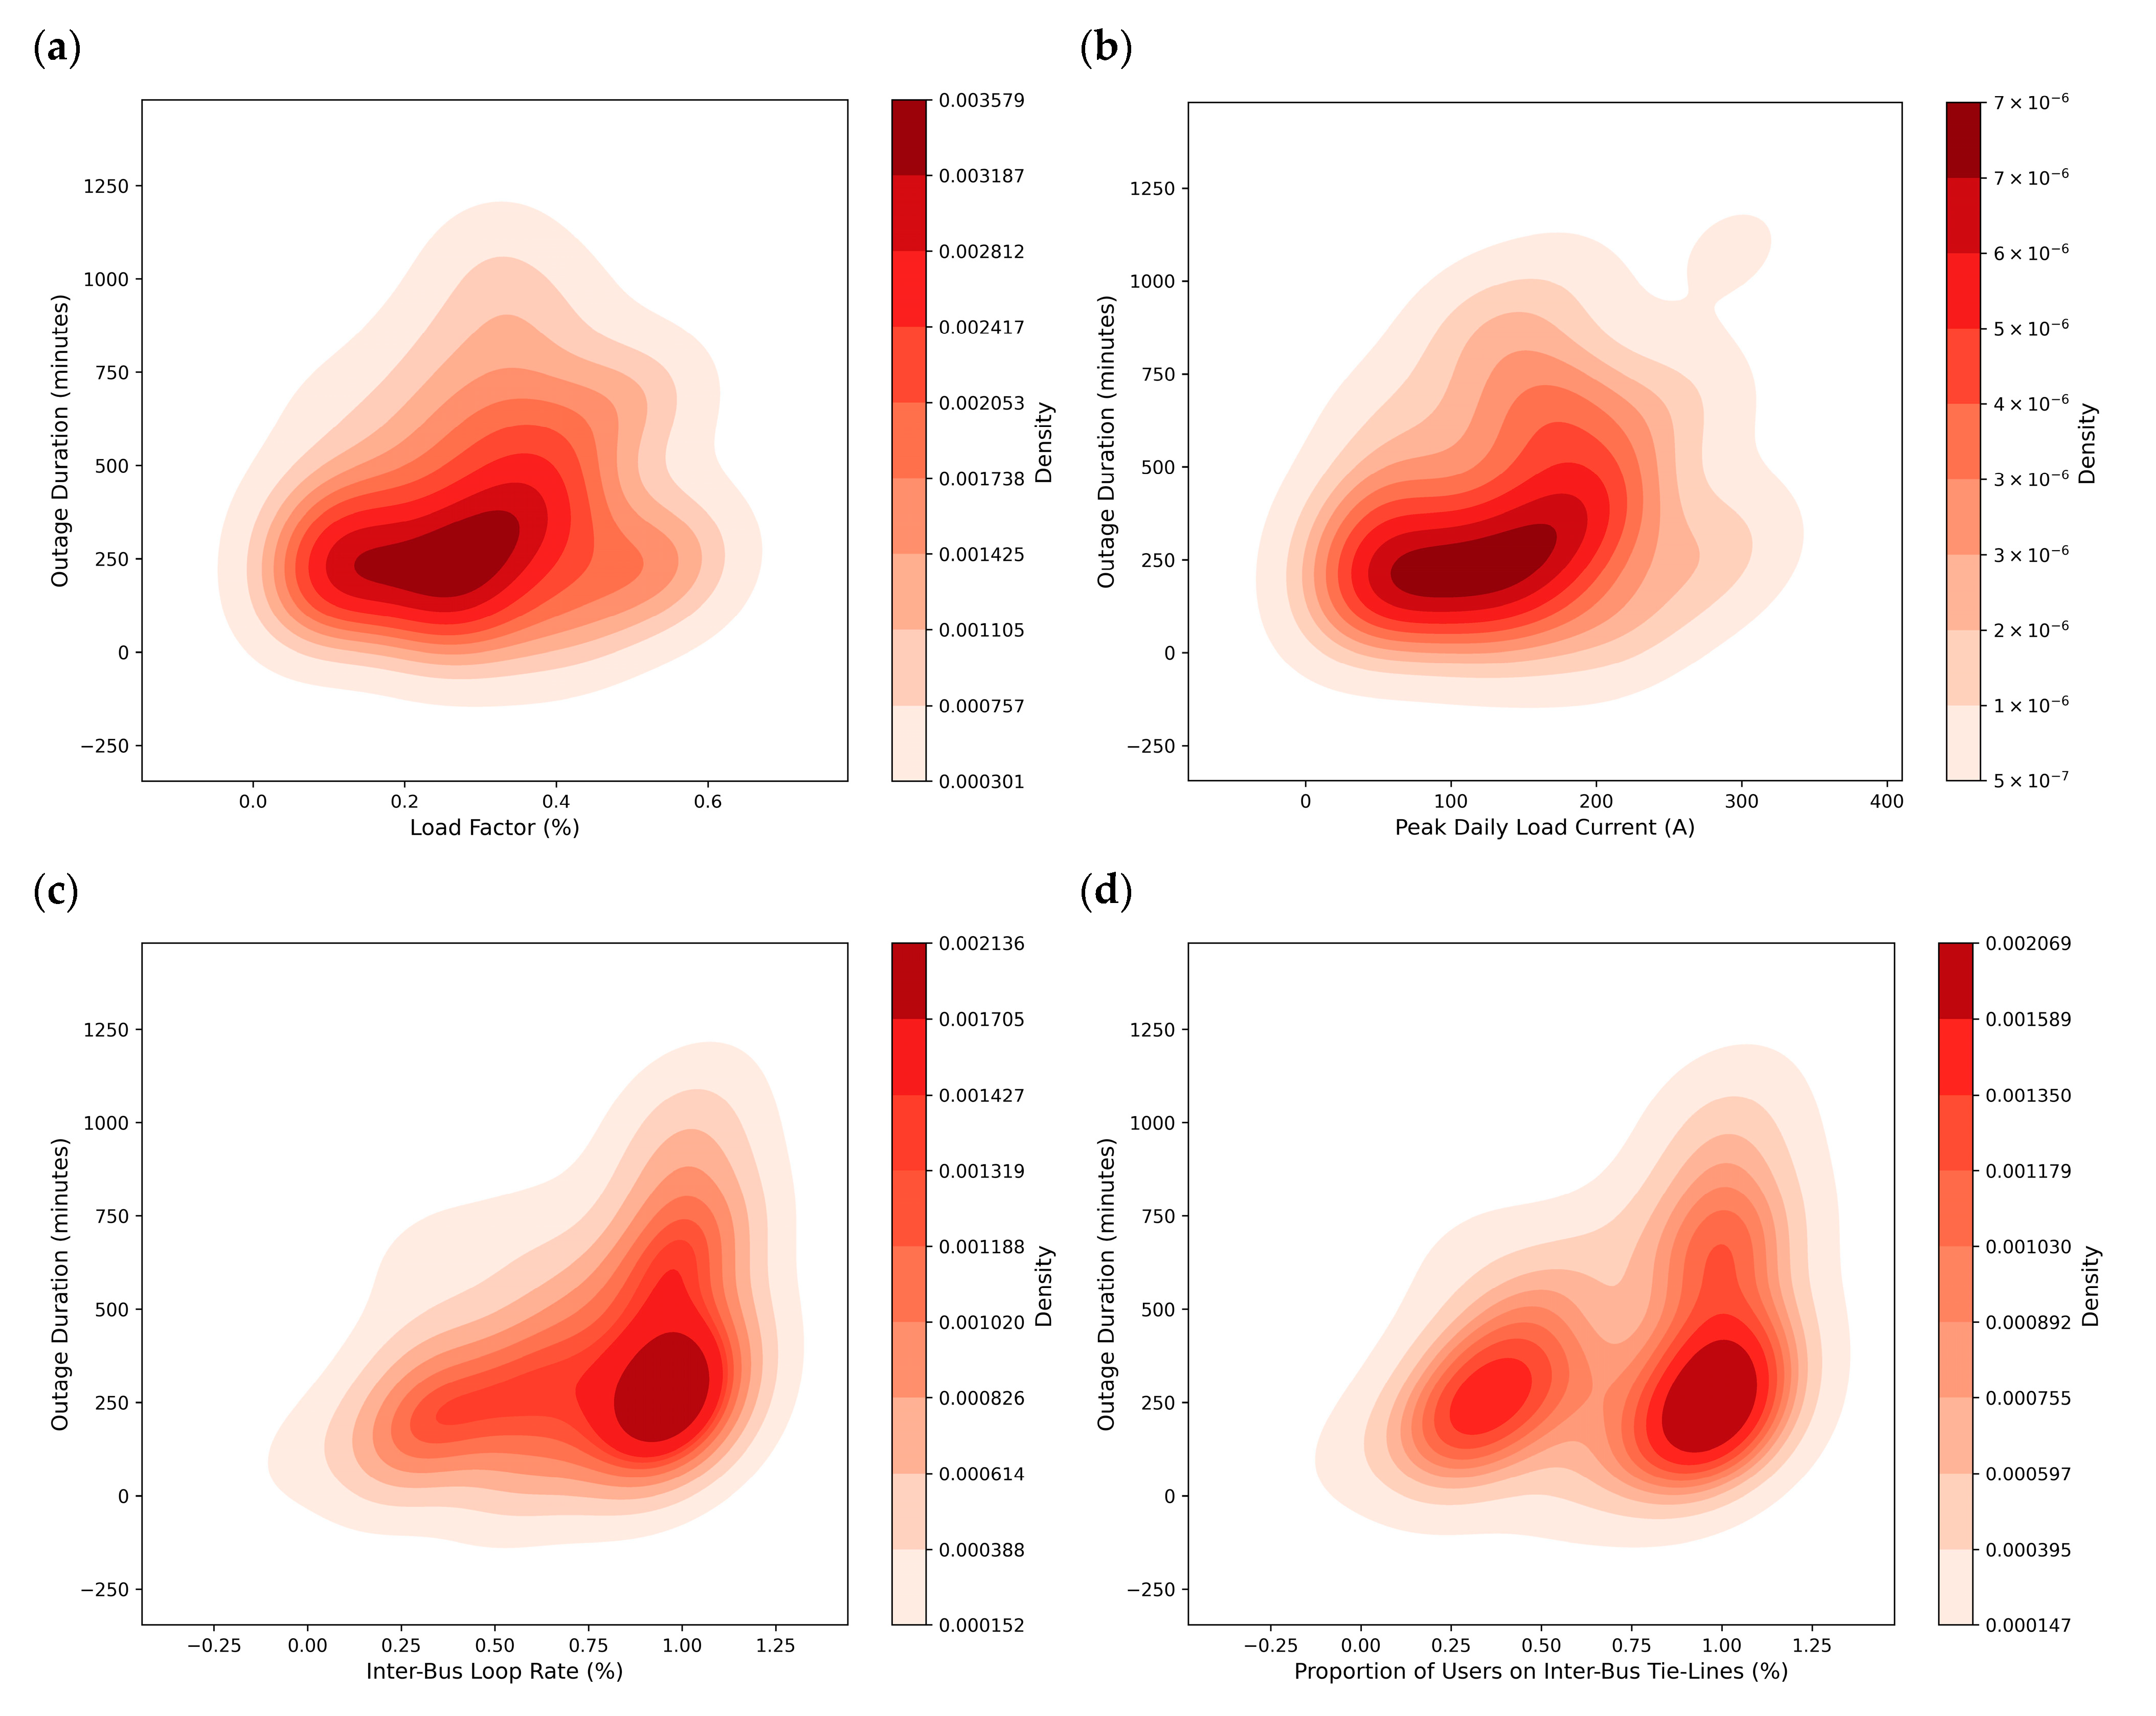
- Through a multi-faceted, consensus-based feature importance analysis, validated by the positive predictive performance of the underlying machine learning models, this study successfully identified and ranked the most critical structural indicators. Five indicators demonstrated the highest level of consensus across all three diverse models: the Inter-Bus Loop Rate, Proportion of Users on Inter-Bus Tie-Lines, Peak Daily Load Current, Load Factor, and Number of LV Customers. This underscores that network topology, electrical stress, and customer density are paramount factors.
- (3)
- The findings provide a robust, data-driven basis for strategic grid enhancement. The validated importance of these consensus indicators offers actionable guidance for rural power utilities, enabling a shift from uniform reactive maintenance to proactive, targeted investment. For instance, prioritizing capital expenditure on enhancing looped configurations and deploying automation on high-user-density and low-structural-redundancy lines can yield substantial improvements in service resilience.
- (4)
- While the predictive models account for a modest but statistically significant portion of the variance, the remaining unexplained variance highlights the strong influence of stochastic external factors (e.g., weather events) and unobserved operational variables. This underscores a key direction for future research: the development of comprehensive, hybrid models that integrate both static structural data and dynamic event data to achieve a more holistic understanding of power system resilience.
Author Contributions
Funding
Data Availability Statement
Conflicts of Interest
Appendix A. Detailed Results of Independent-Sample t-Tests and Consensus Analysis
| Index | T-Statistic | p-Value (Uncorrected) | p-Value (FDR-Adjusted) | Significance (FDR) |
|---|---|---|---|---|
| Number of Upstream Ring Connections | −3.919 | 0.00018 | 0.00220 | TRUE |
| Load Factor | 3.902 | 0.00023 | 0.00271 | TRUE |
| Is Transferable Line (Network-Constrained) | 2.371 | 0.00028 | 0.00429 | TRUE |
| Has Ring Main Units (RMUs) | 3.723 | 0.00036 | 0.00306 | TRUE |
| Is Dedicated Line (Feeder) | −3.351 | 0.00122 | 0.00828 | TRUE |
| Safe Operating Current | −2.825 | 0.00593 | 0.03359 | TRUE |
| Number of Automated Inter-Station Switches | 2.627 | 0.02491 | 0.12099 | FALSE |
| Peak Daily Load Current | 1.393 | 0.23721 | 0.80654 | FALSE |
| Is Transferable Line (Substation-Constrained) | 1.421 | 0.22302 | 0.80654 | FALSE |
| Number of Manual Switches in RMUs | 0.833 | 0.46034 | 0.96605 | FALSE |
| Transferable Load Rate (Substation-Constrained) | −0.776 | 0.48559 | 0.96605 | FALSE |
| Transferable Circuits (Substation-Constrained) | 0.694 | 0.52991 | 0.96605 | FALSE |
| Transferable Circuits (Network-Constrained) | 0.722 | 0.51414 | 0.96605 | FALSE |
| Transferable Load Rate (Network-Constrained) | −0.683 | 0.53556 | 0.96605 | FALSE |
| Number of Automated Inter-Bus Switches | 0.656 | 0.55688 | 0.96605 | FALSE |
| Number of Ring Main Units (RMUs) | −0.558 | 0.60565 | 0.96605 | FALSE |
| Number of LV Customers | −0.526 | 0.62230 | 0.96605 | FALSE |
| Number of LV Customers on Bus | −0.526 | 0.62230 | 0.96605 | FALSE |
| Is Intra-Bus Tie-Line | 0.513 | 0.64215 | 0.96605 | FALSE |
| Inter-Bus Loop Rate | −0.459 | 0.67534 | 0.96605 | FALSE |
| Transferable Rate of Inter-Bus Lines | −0.299 | 0.78296 | 0.98351 | FALSE |
| Number of Automated Inter-Bus Switches | −1.599 | 0.18837 | 0.80056 | FALSE |
| Users on Inter-Bus Tie-Lines | −0.629 | 0.56303 | 0.96605 | FALSE |
| Number of Inter-Bus Circuits | 0.368 | 0.73349 | 0.98351 | FALSE |
| Transferable Inter-Bus Circuits | 0.458 | 0.67306 | 0.96605 | FALSE |
| Transferable LV Customers on Inter-Bus Lines | −0.440 | 0.68192 | 0.96605 | FALSE |
| Number of Automated Inter-Station Switches | −2.917 | 0.01326 | 0.08065 | FALSE |
| Proportion of Users on Inter-Bus Tie-Lines | −0.108 | 0.92018 | 0.98351 | FALSE |
| Is Transferable Inter-Station Tie-Line | 0.061 | 0.95458 | 0.98351 | FALSE |
| Is Inter-Station Tie-Line | −0.093 | 0.63745 | 0.87062 | FALSE |
| Affected Users on Bus (Incl. Transferable) | −0.015 | 0.98865 | 0.98865 | FALSE |
| Is Transferable Inter-Bus Tie-Line | 0.154 | 0.88700 | 0.98351 | FALSE |
| Affected Users on Bus (Incl. Tie-Lines) | 0.104 | 0.92343 | 0.98351 | FALSE |
| Proportion of Transferable Users on Inter-Station | 0.133 | 0.90230 | 0.98351 | FALSE |
| Structural Indicator (Feature Name) | Identified by RF (Top 15) | Identified by Lasso (Top 15) | Identified by RFE (Top 15) | Consensus Level |
|---|---|---|---|---|
| Inter-Bus Loop Rate | ✔ | ✔ | ✔ | 3 Models (Highest Consensus) |
| Proportion of Users on Inter-Bus Tie-Lines | ✔ | ✔ | ✔ | 3 Models (Highest Consensus) |
| Number of LV Customers | ✔ | ✔ | ✔ | 3 Models (Highest Consensus) |
| Peak Daily Load Current | ✔ | ✔ | ✔ | 3 Models (Highest Consensus) |
| Load Factor | ✔ | ✔ | ✔ | 3 Models (Highest Consensus) |
| Inter-Bus Transferability Rate | ✔ | ✖ | ✔ | 2 Models (RF, RFE) |
| Total Affected Users (incl. Transferable) | ✔ | ✖ | ✔ | 2 Models (RF, RFE) |
| Users on Inter-Bus Tie-Lines | ✔ | ✖ | ✔ | 2 Models (RF, RFE) |
| Is Transferable Line (Network Constrained) | ✔ | ✖ | ✔ | 2 Models (RF, RFE) |
| Number of Transferable Circuits | ✔ | ✔ | ✖ | 2 Models (RF, Lasso) |
| Number of Ring Main Units (RMUs) | ✔ | ✔ | ✖ | 2 Models (RF, Lasso) |
| Is Inter-Station Tie-Line | ✔ | ✖ | ✔ | 2 Models (RF, RFE) |
| Transferable Inter-Bus Circuits | ✔ | ✖ | ✔ | 2 Models (RF, RFE) |
| Number of Inter-Bus Circuits | ✔ | ✖ | ✔ | 2 Models (RF, RFE) |
| Transferable Load Rate | ✖ | ✔ | ✖ | 1 Model (Lasso) |
| Is Transferable Line (Substation Constrained) | ✖ | ✔ | ✔ | 2 Models (Lasso, RFE) |
| Number of Automated Inter-Bus Switches | ✖ | ✔ | ✖ | 1 Model (Lasso) |
| Is Intra-Bus Tie-Line | ✖ | ✔ | ✖ | 1 Model (Lasso) |
| Number of Upstream Ring Connections | ✖ | ✔ | ✖ | 1 Model (Lasso) |
| Number of Manual Switches in RMUs | ✖ | ✔ | ✖ | 1 Model (Lasso) |
| Number of Automated Inter-Station Switches | ✖ | ✔ | ✖ | 1 Model (Lasso) |
| Has Ring Main Units (RMUs) | ✖ | ✖ | ✔ | 1 Model (RFE) |
| Transferable Load Rate (Network Constrained) | ✖ | ✖ | ✔ | 1 Model (RFE) |
References
- China Unveils 2024 Guiding Opinions on Energy Work-Newsletter-AllBright Law Offices. Available online: https://www.allbrightlaw.com/EN/10531/b687d58ecace421d.aspx (accessed on 30 May 2025).
- Full Text: China’s Energy Transition|english.scio.gov.cn. Available online: http://english.scio.gov.cn/whitepapers/2024-08/29/content_117394384_7.htm (accessed on 30 May 2025).
- China Releases Guideline on Strengthening Integration of NEVs with Power Grid. Available online: https://english.www.gov.cn/news/202401/04/content_WS659695e2c6d0868f4e8e2c2e.html (accessed on 30 May 2025).
- Wu, M.Y.; Ridzuan, M.I.; Djokic, S.Z. Smart grid functionalities for improving reliability of rural electricity networks, Transmission, Distribution and Energy Conversion (MedPower 2016). In Proceedings of the Mediterranean Conference on Power Generation, Belgrade, Serbia, 6–9 November 2016; pp. 1–7. [Google Scholar] [CrossRef]
- Silva, N.S.e.; Castro, R.; Ferrão, P. Smart Grids in the Context of Smart Cities: A Literature Review and Gap Analysis. Energies 2025, 18, 1186. [Google Scholar] [CrossRef]
- Abdelmalak, M.; Cox, J.; Ericson, S.; Hotchkiss, E.; Benidris, M. Quantitative Resilience-Based Assessment Framework Using EAGLE-I Power Outage Data. IEEE Access 2023, 11, 7682–7697. [Google Scholar] [CrossRef]
- Yao, Y.; Liu, W.; Jain, R.; Chowdhury, B.; Wang, J.; Cox, R. Quantitative Metrics for Grid Resilience Evaluation and Optimization. IEEE Trans. Sustain. Energy 2023, 14, 1244–1258. [Google Scholar] [CrossRef]
- Stanković, A.M.; Tomsovic, K.L.; De Caro, F.; Braun, M.; Chow, J.H.; Čukalevski, N.; Dobson, I.; Eto, J.; Fink, B.; Hachmann, C.; et al. Methods for Analysis and Quantification of Power System Resilience. IEEE Trans. Power Syst. 2023, 38, 4774–4787. [Google Scholar] [CrossRef]
- Almasoudi, F.M. Enhancing Power Grid Resilience through Real-Time Fault Detection and Remediation Using Advanced Hybrid Machine Learning Models. Sustainability 2023, 15, 8348. [Google Scholar] [CrossRef]
- Jiang, H.; Zhang, J.J.; Gao, W.; Wu, Z. Fault Detection, Identification, and Location in Smart Grid Based on Data-Driven Computational Methods. IEEE Trans. Smart Grid 2014, 5, 2947–2956. [Google Scholar] [CrossRef]
- Maheshwari, Z.; Ramakumar, R. Using SIRES to Enhance Resilience in Remote & Rural Communities. J. Energy Power Technol. 2022, 4, 6. [Google Scholar] [CrossRef]
- Majidi, M.; Etezadi-Amoli, M.; Fadali, M.S. A Sparse-Data-Driven Approach for Fault Location in Transmission Networks. IEEE Trans. Smart Grid 2017, 8, 548–556. [Google Scholar] [CrossRef]
- Rizeakos, V.; Bachoumis, A.; Andriopoulos, N.; Birbas, M.; Birbas, A. Deep learning-based application for fault location identification and type classification in active distribution grids. Appl. Energy 2023, 338, 120932. [Google Scholar] [CrossRef]
- Ghosh, P.; De, M. A comprehensive survey of distribution system resilience to extreme weather events: Concept, assessment, and enhancement strategies. Int. J. Ambient Energy 2022, 43, 6671–6693. [Google Scholar] [CrossRef]
- Mujjuni, F.; Betts, T.R.; Blanchard, R.E. Evaluation of Power Systems Resilience to Extreme Weather Events: A Review of Methods and Assumptions. IEEE Access 2023, 11, 87279–87296. [Google Scholar] [CrossRef]
- Ren, H.; Hou, Z.J.; Ke, X.; Huang, Q.; Makatov, Y. Analysis of Weather and Climate Extremes Impact on Power System Outage. In Proceedings of the 2021 IEEE Power & Energy Society General Meeting (PESGM), Washington, DC, USA, 26–29 July 2021; pp. 1–5. [Google Scholar] [CrossRef]
- Panteli, M.; Mancarella, P. Influence of extreme weather and climate change on the resilience of power systems: Impacts and possible mitigation strategies. Electr. Power Syst. Res. 2015, 127, 259–270. [Google Scholar] [CrossRef]
- Flores, N.M.; Northrop, A.J.; Do, V.; Gordon, M.; Jiang, Y.; Rudolph, K.E.; Hernández, D.; Casey, J.A. Powerless in the storm: Severe weather-driven power outages in New York State, 2017–2020. PLoS Clim. 2024, 3, e0000364. [Google Scholar] [CrossRef]
- Strielkowski, W.; Vlasov, A.; Selivanov, K.; Muraviev, K.; Shakhnov, V. Prospects and Challenges of the Machine Learning and Data-Driven Methods for the Predictive Analysis of Power Systems: A Review. Energies 2023, 16, 4025. [Google Scholar] [CrossRef]
- Doostan, M.; Chowdhury, B.H. A data-driven analysis of outage duration in power distribution systems. In Proceedings of the 2017 North American Power Symposium (NAPS), Morgantown, WV, USA, 17–19 September 2017; pp. 1–6. [Google Scholar] [CrossRef]
- Ghasemkhani, B.; Kut, R.A.; Yilmaz, R.; Birant, D.; Arıkök, Y.A.; Güzelyol, T.E.; Kut, T. Machine Learning Model Development to Predict Power Outage Duration (POD): A Case Study for Electric Utilities. Sensors 2024, 24, 4313. [Google Scholar] [CrossRef]
- Arif, A.; Wang, Z. Distribution Network Outage Data Analysis and Repair Time Prediction Using Deep Learning. In Proceedings of the 2018 IEEE International Conference on Probabilistic Methods Applied to Power Systems (PMAPS), Boise, ID, USA, 24–28 June 2018; pp. 1–6. [Google Scholar] [CrossRef]
- El Mrabet, Z.; Sugunaraj, N.; Ranganathan, P.; Abhyankar, S. Random Forest Regressor-Based Approach for Detecting Fault Location and Duration in Power Systems. Sensors 2022, 22, 458. [Google Scholar] [CrossRef]
- Theng, D.; Bhoyar, K.K. Feature selection techniques for machine learning: A survey of more than two decades of research. Knowl. Inf. Syst. 2024, 66, 1575–1637. [Google Scholar] [CrossRef]
- Dhal, P.; Azad, C. A comprehensive survey on feature selection in the various fields of machine learning. Appl. Intell. 2022, 52, 4543–4581. [Google Scholar] [CrossRef]
- Huang, N.; Lu, G.; Xu, D. A Permutation Importance-Based Feature Selection Method for Short-Term Electricity Load Forecasting Using Random Forest. Energies 2016, 9, 767. [Google Scholar] [CrossRef]
- Lee, Y.-G.; Oh, J.-Y.; Kim, D.; Kim, G. SHAP Value-Based Feature Importance Analysis for Short-Term Load Forecasting. J. Electr. Eng. Technol. 2023, 18, 579–588. [Google Scholar] [CrossRef]
- Li, M.; Wang, Y. Power load forecasting and interpretable models based on GS_XGBoost and SHAP. J. Phys. Conf. Ser. 2022, 2195, 012028. [Google Scholar] [CrossRef]
- Yaprakdal, F.; Varol Arısoy, M. A Multivariate Time Series Analysis of Electrical Load Forecasting Based on a Hybrid Feature Selection Approach and Explainable Deep Learning. Appl. Sci. 2023, 13, 12946. [Google Scholar] [CrossRef]
- Janiszewski, P.; Sawicki, J.; Kurpas, J.; Mróz, M. Practical Ways to Improve SAIDI and SAIFI Power Supply Reliability Indicators in an MV Grid. Acta Energ. 2018, 45–50. [Google Scholar] [CrossRef]
- Kunaifi; Reinders, A. Perceived and Reported Reliability of the Electricity Supply at Three Urban Locations in Indonesia. Energies 2018, 11, 140. [Google Scholar] [CrossRef]
- Kozyra, J.; Łukasik, Z.; Kuśmińska-Fijałkowska, A.; Kaszuba, P. The impact of selected variants of remote control on power supply reliability indexes of distribution networks. Electr. Eng. 2022, 104, 1255–1264. [Google Scholar] [CrossRef]
- Guo, S.; Zhao, H.; Zhao, H. The Most Economical Mode of Power Supply for Remote and Less Developed Areas in China: Power Grid Extension or Micro-Grid? Sustainability 2017, 9, 910. [Google Scholar] [CrossRef]
- Rojas-Zerpa, J.C.; Yusta, J.M. Application of multicriteria decision methods for electric supply planning in rural and remote areas. Renew. Sustain. Energy Rev. 2015, 52, 557–571. [Google Scholar] [CrossRef]
- Sami, N.M.; Naeini, M. Machine learning applications in cascading failure analysis in power systems: A review. Electr. Power Syst. Res. 2024, 232, 110415. [Google Scholar] [CrossRef]
- Manninen, H.; Kilter, J.; Landsberg, M. Health Index Prediction of Overhead Transmission Lines: A Machine Learning Approach. IEEE Trans. Power Deliv. 2022, 37, 50–58. [Google Scholar] [CrossRef]
- Yazdanpanah, Z.; Rastegar, M.; Jooshaki, M. Determining target levels of power distribution system reliability indices using machine learning. Electr. Power Syst. Res. 2024, 233, 110456. [Google Scholar] [CrossRef]
- Zhu, H.; Giannakis, G.B. Lassoing line outages in the smart power grid. In Proceedings of the 2011 IEEE International Conference on Smart Grid Communications (SmartGridComm), Brussels, Belgium, 17–20 October 2011; pp. 570–575. [Google Scholar] [CrossRef]
- Arora, P.; Ceferino, L. Probabilistic and machine learning methods for uncertainty quantification in power outage prediction due to extreme events. EGUsphere 2022, 2022, 1–29. [Google Scholar] [CrossRef]
- Breiman, L. Random Forests. Mach. Learn. 2001, 45, 5–32. [Google Scholar] [CrossRef]
- Tibshirani, R. Regression Shrinkage and Selection Via the Lasso. J. R. Stat. Soc. Ser. B Stat. Methodol. 1996, 58, 267–288. [Google Scholar] [CrossRef]
- Muthukrishnan, R.; Rohini, R. LASSO: A feature selection technique in predictive modeling for machine learning. In Proceedings of the 2016 IEEE International Conference on Advances in Computer Applications (ICACA), Coimbatore, India, 24 October 2016; pp. 18–20. [Google Scholar] [CrossRef]
- Jeon, H.; Oh, S. Hybrid-Recursive Feature Elimination for Efficient Feature Selection. Appl. Sci. 2020, 10, 3211. [Google Scholar] [CrossRef]
- Darst, B.F.; Malecki, K.C.; Engelman, C.D. Using recursive feature elimination in random forest to account for correlated variables in high dimensional data. BMC Genet. 2018, 19, 65. [Google Scholar] [CrossRef] [PubMed]
- Zheng, K.; Du, W.; Wang, H. Dynamic Interaction and Stability Analysis of Hybrid Multi-Microgrid Systems. Proc. Chin. Soc. Electr. Eng. 2021, 41, 5552–5568. [Google Scholar]
- Zhang, H.; He, G. A Discussion on the Power Supply Reliability of Rural Distribution Networks and Its Improvement Measures. China Electr. Power Educ. 2011, 8, 87–88. [Google Scholar]
- Song, Y.; Zhang, D.; Wu, J.; Peng, D.; Liang, C.; Qiu, Y.; Chen, Z.; Wu, Q.; Cao, J. Comparative Analysis of Power Supply Reliability in Urban Distribution Networks at Home and Abroad. Power Syst. Technol. 2008, 32, 13–18. [Google Scholar]
- Kang, Z. An Analysis of Measures to Improve the Reliability of Power Supply in Distribution Networks. Front. Electr. Energy 2024, 2, 118–120. [Google Scholar]
- Wang, W.; Zhang, T.; Xuan, W.; Li, H.; Liu, Z.; Wang, K. A Power Grid Planning Method Considering Unit Commitment and Network Structure Optimization. J. Power Syst. Autom. 2021, 33, 108–115. [Google Scholar]
- Li, J.; Xie, Y.; Zeng, H.; Zhou, S.; Luo, Y.; Song, J. A Review of Research on Optimization Scheduling under Uncertainty and Its Application in New Type Power Systems. High Volt. Eng. 2022, 48, 3447–3464. [Google Scholar]
- Mitsova, D.; Li, Y.; Einsteder, R.; Roberts Briggs, T.; Sapat, A.; Esnard, A.-M. Using Nighttime Light Data to Explore the Extent of Power Outages in the Florida Panhandle after 2018 Hurricane Michael. Remote Sens. 2024, 16, 2588. [Google Scholar] [CrossRef]
- Yang, X.; Liu, X.; Li, Z.; Xiao, G.; Wang, P. Resilience-oriented proactive operation strategy of coupled transportation power systems under exogenous and endogenous uncertainties. Reliab. Eng. Syst. Saf. 2025, 262, 111161. [Google Scholar] [CrossRef]
- Li, X.; Hu, C.; Luo, S.; Lu, H.; Piao, Z.; Jing, L. Distributed hybrid-triggered observer-based secondary control of multi-bus DC microgrids over directed networks. IEEE Trans. Circuits Syst. Regul. Pap. 2025, 72, 2467–2480. [Google Scholar] [CrossRef]
- Tiwari, R.S.; Sharma, J.P.; Gupta, O.H.; Ahmed Abdullah Sufyan, M. Extension of pole differential current based relaying for bipolar LCC HVDC lines. Sci. Rep. 2025, 15, 16142. [Google Scholar] [CrossRef] [PubMed]


| Author(s) and Year | Main Focus/Methodology | Key Contributions | Research Gap Addressed by This Study |
|---|---|---|---|
| Ghasemkhani et al. (2024) [21] | ML for power outage duration (POD) prediction (e.g., CatBoost) | Feasibility of ML for operational POD forecasting | Lacked focus on static structural indicators (predictive, not explanatory) |
| Yazdanpanah et al. (2024) [37] | ML and data envelopment analysis (DEA) for optimal reliability targets setting | Framework for reliability benchmarking and planning | Focused on high-level targets, not specific line-level structural causes |
| Ren et al. (2021) and Panteli et al. (2015) [16,17] | Analysis of extreme weather impact on outages | Highlighted the role of external factors (non-structural) | Focused on outage causes, not restoration duration from a structural view |
| Lee et al. (2023) and Li et al. (2022) [27,28] | Interpretable ML (SHAP) for load forecasting | Power of advanced interpretability tools (SHAP) | Applied to data-rich task, did not address feature identification in data-scarce rural grids |
| Jiang et al. (2014) and Majidi et al. (2017) [10,12] | ML/DL for data-driven fault location | Focused on “where” and “what” of a fault (dynamic diagnosis) | Did not analyze the “why” of restoration tied to pre-existing structural limits |
| Manninen et al. (2022) [36] | ML-based health index prediction for transmission lines | Data-driven approach for asset management and condition monitoring | Focused on the component health, not system-level restoration time |
| Kozyra et al. (2022) [32] | Impact analysis of remote control on reliability indices | Quantified benefits of automation on reliability | Lacked a systematic framework to rank multiple structural factors simultaneously |
| Janiszewski et al. (2018) [30] | SAIDI/SAIFI optimization via fault analysis and mathematical models | Practical methods for improving grid-level reliability indicators | Relied on traditional models, not on a comprehensive, non-linear ML-based feature evaluation |
| Rojas-Zerpa and Yusta (2015) [34] | Multi-criteria decision-making (DEA with SVM/RF) for supply planning | High-level planning tool for remote areas | Did not perform granular analysis of specific line-level engineering indicators |
| This Study | ML-based analysis of structural indicators (RF, Lasso, and RFE) on a real-world rural grid dataset | Identifies and validates key physical grid characteristics that are most influential on restoration time in a resource-constrained environment | - |
| Model | Hyperparameter | Optimal Value |
|---|---|---|
| Tuned Random Forest | n_estimators | 200 |
| max_depth | 5 | |
| min_samples_split | 5 | |
| min_samples_leaf | 10 | |
| max_features | 0.7 | |
| Tuned XGBoost | n_estimators | 100 |
| max_depth | 7 | |
| learning_rate | 0.01 | |
| subsample | 0.7 |
| Model | R-Squared (R2) | RMSE (Minutes) | MAE (Minutes) |
|---|---|---|---|
| Tuned Random Forest (RF) | 0.2641 | 201.87 | 175.53 |
| Tuned XGBoost | 0.1547 | 192.94 | 171.79 |
| Lasso CV (Baseline) | 0.1779 | 194.86 | 172.12 |
| Fault Category | Sub-Category Example | Recorded Count |
|---|---|---|
| Weather-Related | Lightning, Thunderstorm, High Wind | 46 |
| External Interference | Tree Encroachment, Vehicle Collision, Kites | 18 |
| Animal Contact | Birds, Rats, Snakes | 17 |
Disclaimer/Publisher’s Note: The statements, opinions and data contained in all publications are solely those of the individual author(s) and contributor(s) and not of MDPI and/or the editor(s). MDPI and/or the editor(s) disclaim responsibility for any injury to people or property resulting from any ideas, methods, instructions or products referred to in the content. |
© 2025 by the authors. Licensee MDPI, Basel, Switzerland. This article is an open access article distributed under the terms and conditions of the Creative Commons Attribution (CC BY) license (https://creativecommons.org/licenses/by/4.0/).
Share and Cite
Lin, J.; Xie, R.; Lin, H.; Guo, X.; Mao, Y.; Fang, Z. A Study on the Key Factors Influencing Power Grid Outage Restoration Times: A Case Study of the Jiexi Area. Processes 2025, 13, 2708. https://doi.org/10.3390/pr13092708
Lin J, Xie R, Lin H, Guo X, Mao Y, Fang Z. A Study on the Key Factors Influencing Power Grid Outage Restoration Times: A Case Study of the Jiexi Area. Processes. 2025; 13(9):2708. https://doi.org/10.3390/pr13092708
Chicago/Turabian StyleLin, Jiajun, Ruiyue Xie, Haobin Lin, Xingyuan Guo, Yudong Mao, and Zhaosong Fang. 2025. "A Study on the Key Factors Influencing Power Grid Outage Restoration Times: A Case Study of the Jiexi Area" Processes 13, no. 9: 2708. https://doi.org/10.3390/pr13092708
APA StyleLin, J., Xie, R., Lin, H., Guo, X., Mao, Y., & Fang, Z. (2025). A Study on the Key Factors Influencing Power Grid Outage Restoration Times: A Case Study of the Jiexi Area. Processes, 13(9), 2708. https://doi.org/10.3390/pr13092708


