Article

The Effect of Jet Deviation on the Stability of Pelton Turbine

1
CHN Energy Dadu River Repair & Installation Co., Ltd., Leshan 641900, China
2
School of Mechatronic Engineering, Southwest Petroleum University, Chengdu 610500, China
3
Key Laboratory of Fluid and Power Machinery, Ministry of Education, Xihua University, Chengdu 610039, China
4
College of Water Resources and Civil Engineering, China Agricultural University, Beijing 100083, China
*
Authors to whom correspondence should be addressed.
Processes 2025, 13(9), 2683; https://doi.org/10.3390/pr13092683 (registering DOI)
Submission received: 21 July 2025 / Revised: 13 August 2025 / Accepted: 22 August 2025 / Published: 23 August 2025
(This article belongs to the Section Chemical Processes and Systems)

Abstract

During the installation and operation of Pelton turbines, deviations of the jet centerline from the runner pitch circle can compromise turbine stability and efficiency. Utilizing design data from a Pelton turbine on China’s Dadu River, this study employs the SST k-ω and VOF models to investigate the flow characteristics, pressure pulsations, and force on the bucket surface under varying offset conditions. The results demonstrate that radial offset causes the jet to enter the bucket later when deflected outward and earlier when deflected inward. All forms of offset exert adverse effects on turbine performance, with axial offsets causing more severe impacts than radial ones. The maximum pressure pulsation amplitude reached 24%. Afterwards, the erosion of Pelton turbines with different grain sizes was investigated by erosion modeling. It was found that the erosion of large grain size is more serious than that of small grain size. This research provides valuable theoretical insights and an important guiding role for improving the operational stability of Pelton turbines.

1. Introduction

China possesses abundant hydropower resources, primarily concentrated in the southwestern region. With the continuous advancement of scientific research, the country’s hydropower generation has reached a stage of mature technical exploitability. Among the various types of turbines, the Pelton turbine has emerged as the preferred choice for high-head hydropower generation [1,2]. However, the stability of hydropower turbines remains a significant challenge in current research, as it involves a multitude of factors, including hydraulic, electrical, and mechanical aspects. Therefore, research on the stability of Pelton turbines is highly important [3,4]. Offsets can lead to reduced flow rates, increased pressure pulsations, reduced efficiency, and compromised stability in Pelton turbines, resulting in reduced economic benefits.
Most researchers currently employ numerical simulations to investigate the stability of Pelton turbines. These simulations incur higher computational costs compared to those for reaction turbines, due to the complex multiphase flow and unsteady jet–bucket interactions within the rotating runner. Liu et al. [5,6,7] performed transient analyses on several Pelton turbine power stations, using the SST k-ω turbulence and VOF multiphase flow models to examine the internal flow characteristics at various time points and assess sediment erosion, thereby providing a theoretical foundation for stability and erosion prediction. Santolin et al. [8] explored the influence of different jet shapes on Pelton turbine efficiency through transient numerical simulations of jet–bucket interactions. Anagnostopoulos et al. [9] developed a numerical approach based on the Lagrangian method, which tracks representative fluid particle trajectories to simulate transient free-surface flows during bucket–jet interactions at low computational cost, enabling the rapid and efficient analysis of complex flow dynamics and energy conversion. Han et al. [10] used the VOF model to capture the air–water interface and investigated jet bifurcation, a phenomenon that significantly affects turbine performance, concluding that secondary flows play a crucial role in optimizing Pelton turbine performance. Wang et al. [11] applied entropy generation analysis to examine the energy dissipation characteristics of a six-nozzle Pelton turbine under varying operating heads. The results showed that the increase in the entropy generation rate was due mainly to wall friction, secondary flows, fluid separation, jet expansion, jet impact, and fluid interference.
With the increase in experimental conditions and the widespread use of advanced precision monitoring instruments, research on the stability of Pelton turbines has been highly beneficial. Jung I. H. et al. [12] adopted both experimental and numerical simulation methods to investigate the effects of nozzle eccentricity on jet flow within Pelton turbines. Their results revealed that, under low-flow conditions, nozzle eccentricity induces jet divergence and significantly increases injection losses. Zeng et al. [13] analyzed the influence of guide vanes, nozzles, and buckets on hydraulic performance across three distinct operating head conditions and experimentally validated the numerical findings. Guo et al. [14,15] combined experimental and numerical approaches to examine the role of vortices in shaping the internal flow and energy dissipation mechanisms of Pelton turbines. Their study showed that vortices are unevenly distributed within the jet, leading to non-uniform jet velocity profiles and intensifying flow interference between buckets. Zhu et al. [16,17] conducted experimental and numerical simulation studies on Pelton turbines to analyze the flow state changes from jet entry to complete exit from buckets. Through energy characteristic analysis, they reported that the flow rate and velocity torque at the bucket inlet initially increase but then decrease, whereas those at the bucket outlet exhibit the opposite trend. This research provides a theoretical foundation for effectively interpreting the energy conversion characteristics of Pelton turbines.
Nozzle jet centerline deviation from operation will, firstly, lead to unbalanced radial force on the runner, increase additional axial force, and then cause the vibration oscillation of the unit to exceed the standard, and in serious cases, it will also lead to the collision of the unit’s stator and rotor and even produce the escape accident; secondly, it will lead to the offset of the position of the water flow action of the nozzle jet to the runner, which will affect the safe and stable operation of the unit. At present, the internal flow characteristics of Pelton turbines are getting more and more attention, but there are still relatively few studies on the pressure pulsation of Pelton turbines. Based on the design data of a Pelton turbine located on the Dadu River, China, the study employs the SST k-ω and VOF models to analyze the flow characteristics and pressure pulsations on the bucket surface under various offset conditions. According to the GB/T 8564-2023 [18] standard, the maximum allowable offset was selected for the study. The investigation into the effects of jet deviation on turbine stability offers a theoretical basis for advancing stability research in Pelton turbines. Power stations should be urged to monitor the operation of runners in real time and avoid the deflection of jets. Afterwards, the erosion of Pelton turbines with different grain sizes was investigated by erosion modeling. It was found that the erosion of large grain size is more serious than that of small grain size. The study on the force and stability of the hydraulic turbine when the jet centerline of the Pelton turbine deviates from the center of the runner pitch circle has an important guiding role for the actual operation and maintenance of the power station. Research has found that jet deviation has a significant impact on the efficiency, pressure pulsation, and axial force of turbines. Therefore, jet centerline deviation from the pitch circle should be avoided during the actual operation of the Pelton turbine.

2. Numerical Simulation Method

2.1. Turbine Geometric Parameters

This study is based on the design data of a Pelton turbine located on the Dadu River, China. The turbine model was designed with a radial offset of S1 = 3.92 mm and an axial offset of S2 = 2.91 mm between the jet centerline of the turbine nozzle and the pitch circle diameter of the bucket, in accordance with maximum offsets permitted by GB/T 8564-2023 Installation Code for Hydraulic Turbine Generators. The design parameters of the turbine are listed in Table 1. The geometric model of the turbine’s flow components is shown in Figure 1, while the schematic diagram of the jet offset is provided in Figure 2. The condition with no offset is defined as PY0; PY+ indicates radial offset of the jet toward the outer edge of the bucket; PY represents the radial offset toward the bucket root; and PYZ denotes the axial offset. These data are derived from actual field data of the Dadu River Pelton turbine.

2.2. Mathematical Model

The solution to fluid motion requires the basic equations of fluid motion. The continuity equation and equation of motion that govern fluid flow are as follows:
ρ t + x i ρ u i = 0
t ρ u i + x j ρ u i u j = τ i j x j + ρ g i
τ i j = μ u i x j + u j x i P + 2 3 μ u k x k δ i j
where P represents pressure, x represents coordinates, and subscripts i, j, and k represent tensor coordinates. When j = i, δij = 1; when ji, δij = 0.
The SST k-ω turbulence model is used to solve the Reynolds stresses. By combining the advantages of the k-ω and k-ε models through a weighted average approach, it achieves high computational accuracy and efficiency, accurately capturing the behavior of boundary layers and pressure gradients. The equation is as follows:
t ρ k + x i ρ k u i = x i Γ k k x i + G k Y k + S k
t ρ ω + x i ρ ω u i = x i Γ ω ω x i + G ω Y ω + D ω + S ω
where Gk represents the turbulent kinetic energy k term; Gω represents the ω term; Yk and Yω represent the effective diffusion terms for k and ω, respectively; Dω represents the orthogonal divergence term; Sω and Sk represent user-defined source terms. Yk = ρβ*kω, β* = 0.09; Yω = ρβkω2, σω,2 = 1.168.
Given that the internal flow within the turbine is a two-phase flow, the VOF model is employed to handle complex air–water interface issues effectively [19,20]. The control equations for the VOF model are described as follows:
ρ = αiρi
µ = αiμi
where α represents the volume fraction, ρ denotes the density, µ is the coefficient of kinetic viscosity, and the subscript i corresponds to the tensor coordinate, indicating the liquid–gas phases. The subscript i specifically denotes the liquid–gas phase.
Pelton turbine buckets are subject to erosion caused by sand-laden water flow, and the Generic erosion model is used here to predict the wear distribution and the magnitude of the erosion rate of the critical overflow components of the Pelton turbine. The definition of the erosion rate in the Generic erosion model is as follows:
ε = p = 1 N P m ˙ p c ( d p ) f ( α ) V b ( V ) A f a c e
where ε denotes the wall erosion rate, NP denotes the total number of particles, p denotes the particles, mp denotes the particle mass flow rate, c(dp) denotes the particle size function, f(α) denotes the impact angle function (α denotes the angle at which the particles impact on the wall), b(V) denotes the function of the relative velocity of the particles (V denotes the relative velocity of particles with respect to the wall surface), and Aface denotes the area of the wall surface (m2).

2.3. Mesh Generation and Independence Verification

Owing to the intricate structure of the Pelton turbine, polyhexcore unstructured meshing is employed, with local refinement on the bucket surface to better simulate the flow. A mesh independence study is performed by creating three mesh sets (Table 2) to ensure solution reliability while using computational resources efficiently.
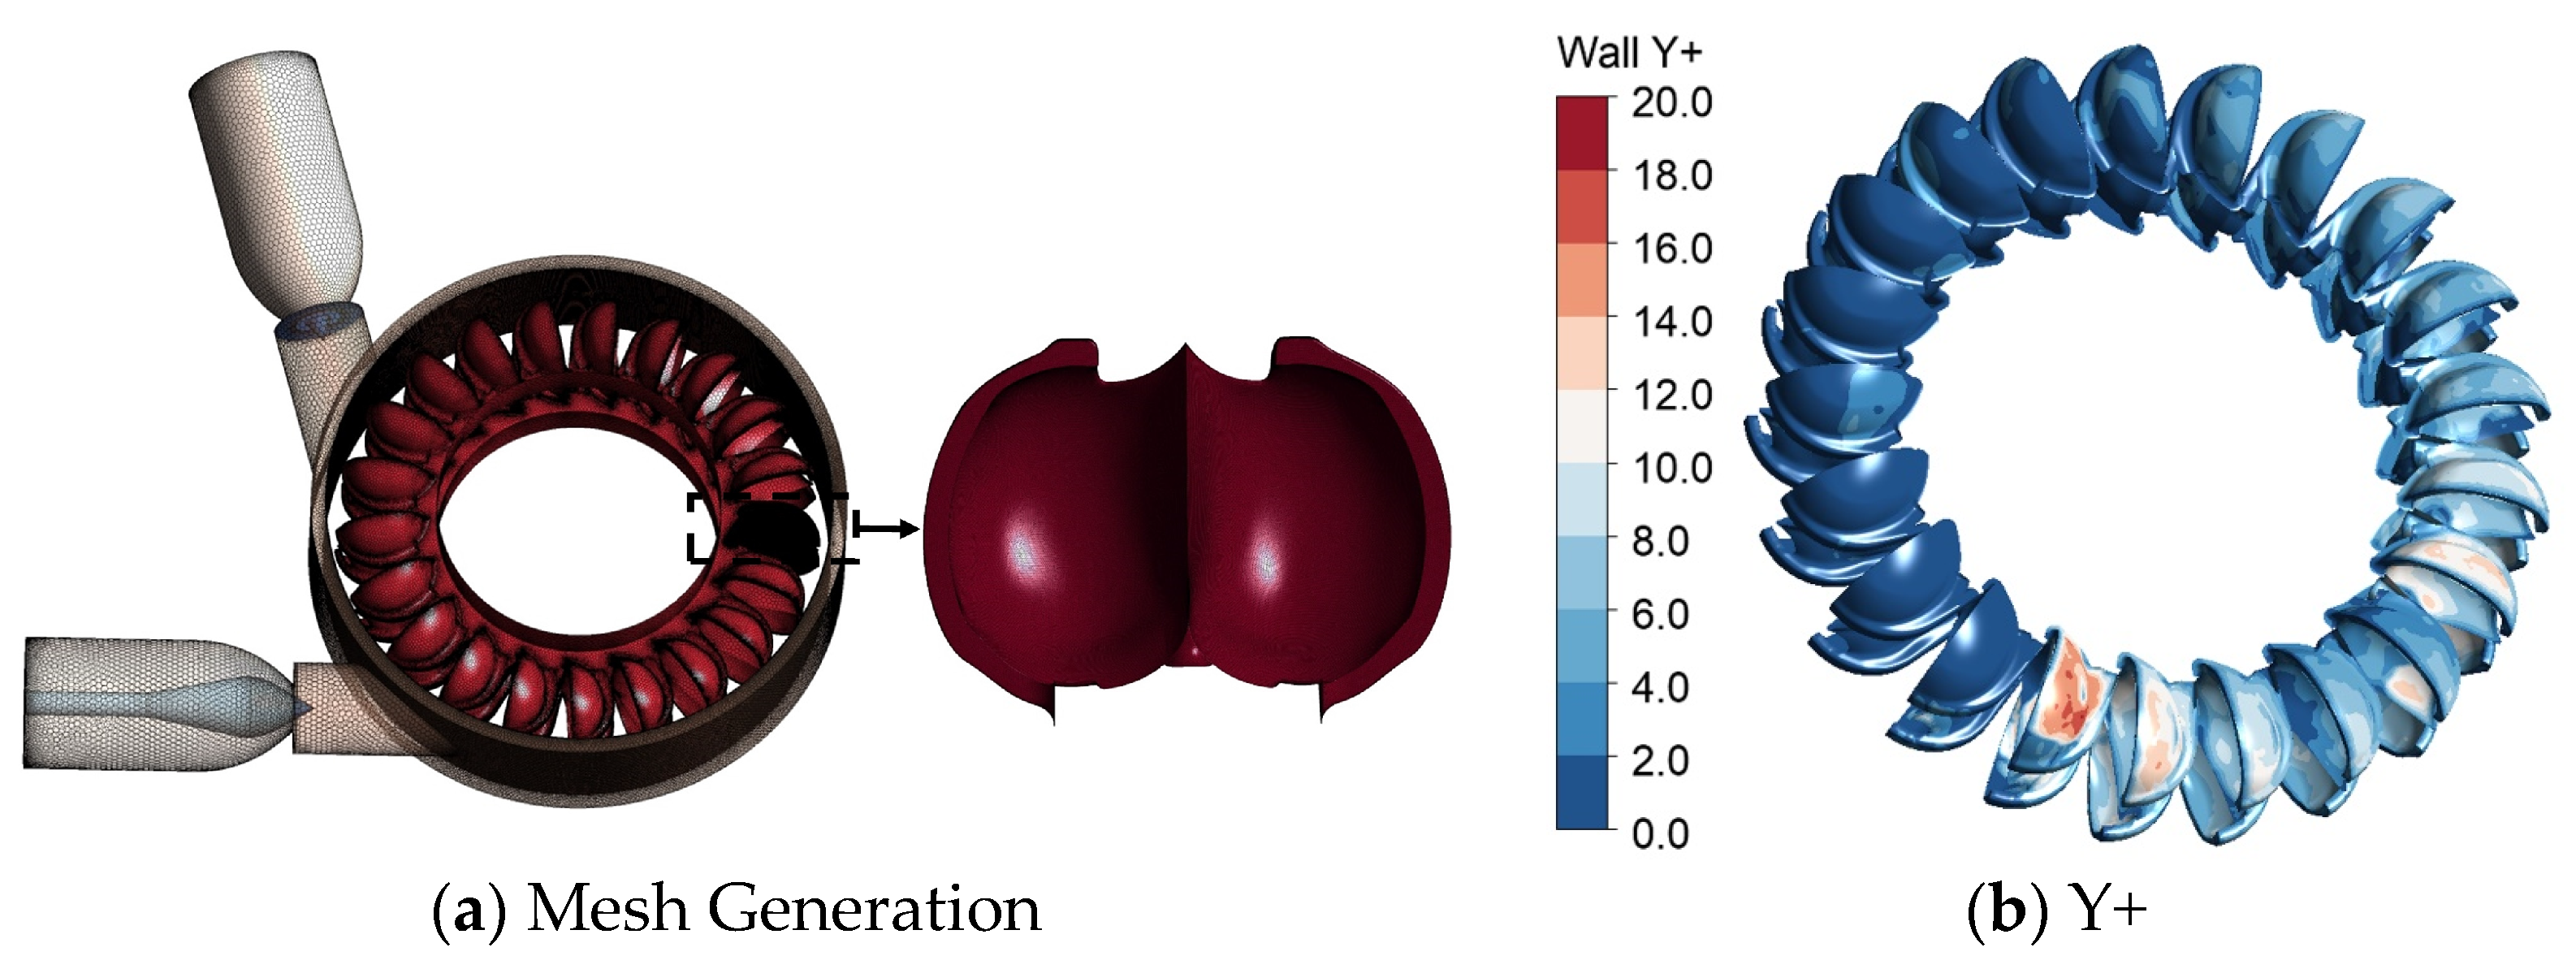
The grid convergence index (GCI) is employed to evaluate the convergence of the computational results. The maximum torque of a single bucket (φ) is selected as the key parameter for the grid independence analysis. As presented in Table 3, the mesh satisfies the convergence criteria. To balance computational efficiency and accuracy, mesh G2 is chosen for the subsequent numerical simulations. The mesh configuration is illustrated in Figure 3a. The distribution of bucket y + at the moment (most areas of bucket y + are below 10) when the jet is perpendicular to the bucket is illustrated in Figure 3b.

2.4. Boundary Conditions

The finite volume method is employed to discretize the governing equations, utilizing a pressure-based solver. Boundary conditions include a pressure inlet with a total pressure of 5,647,406.8 Pa and a pressure outlet with a relative pressure of 0 Pa. along with a specified rotational speed of 750 r/min. The SIMPLEC algorithm is applied to perform the calculations. The VOF model is used to define the water phase volume fraction, assigning a value of 1 for the stationary and air domains and 0 for the rotating domain. The interface between the rotating and stationary domains is designated as a sliding interface to facilitate data transfer, while standard wall functions are applied near the walls. To investigate the flow characteristics on the bucket surface at different time intervals, transient simulations are carried out with a time step of 0.2° (4.44 × 10⁻⁵ s). To ensure computational accuracy, 20 iterations are performed per time step, with a minimum convergence residual of 10−4.

2.5. Comparison of Experimental and Numerical Calculations

The tests were carried out on the Dadu River impingement turbine test rig, which provided an accurate validation of the numerical simulation results of this study. A comparison of the field data with the numerical calculation results is shown in Table 4, and the analysis results show that the relative errors of the flow Q and efficiency η obtained from the numerical simulation and the experimental results are within 2.39% and 2.77%, respectively. Therefore, the results obtained from the numerical simulation scheme reflect the actual situation more accurately and lay the foundation for accuracy.

3. Numerical Calculation of Bucket Offset Working Conditions Results and Discussion

3.1. Numerical Calculation of the Internal Flow Characteristics of Buckets

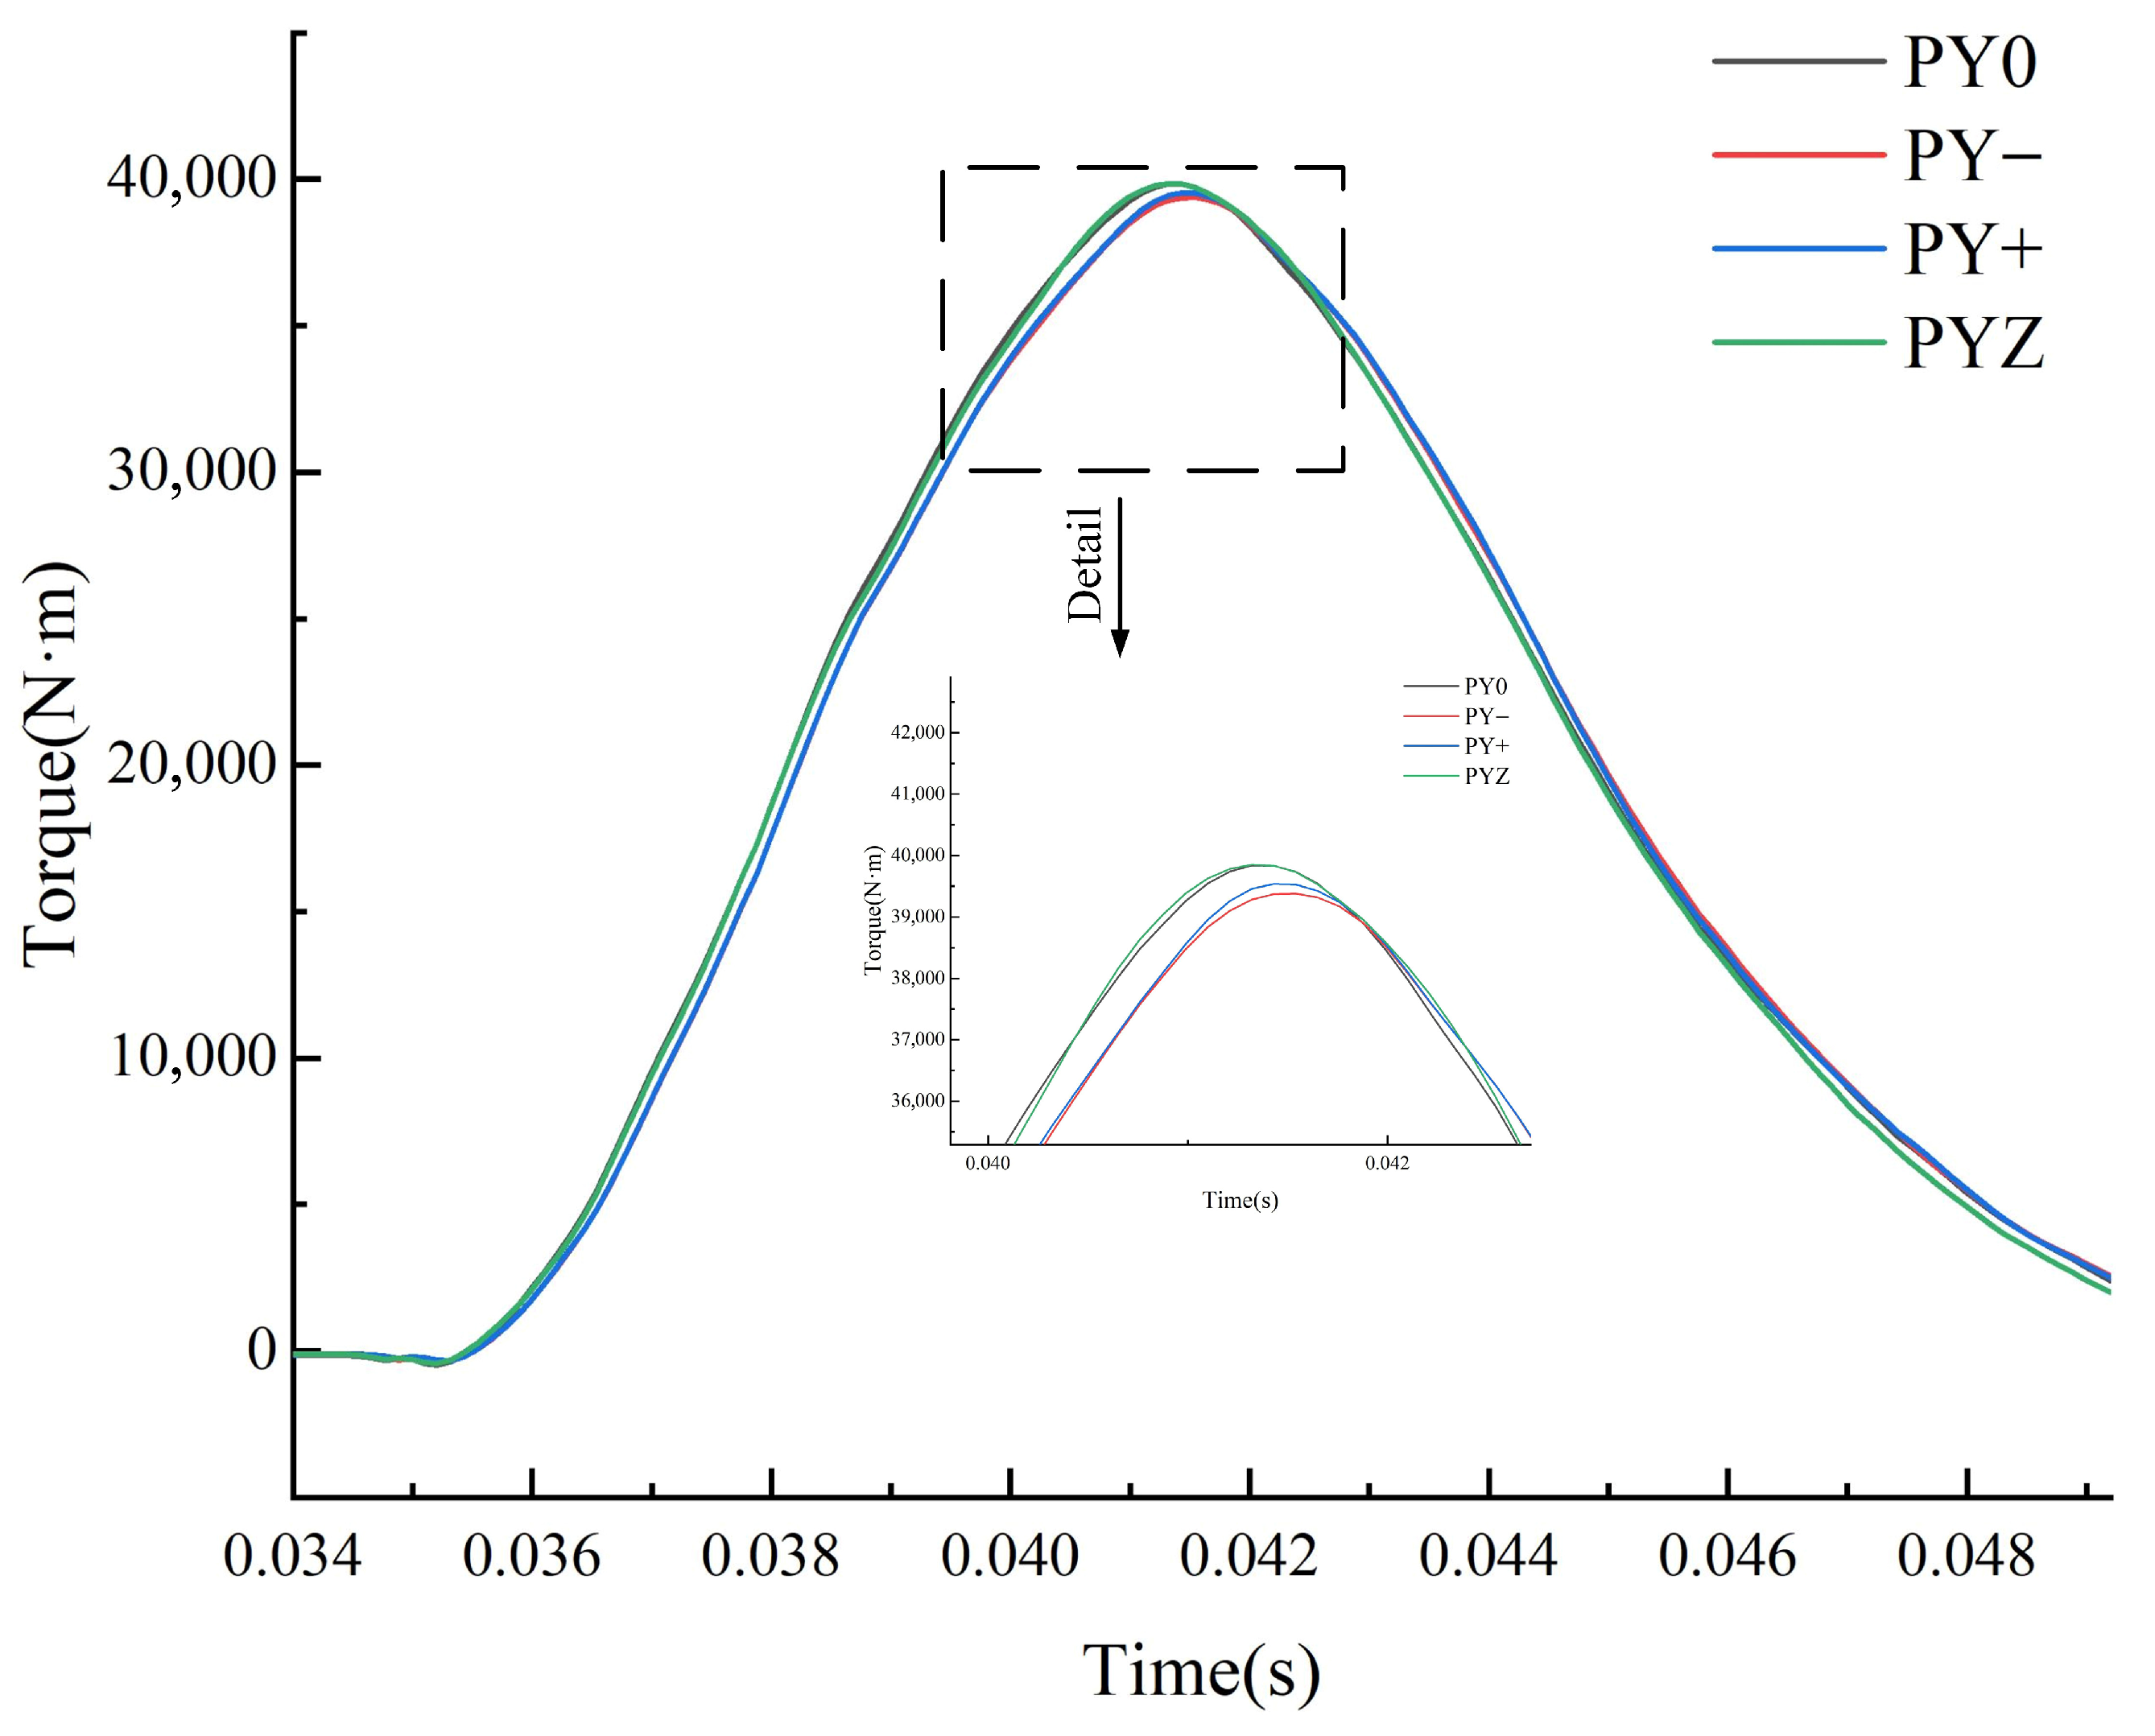
As the runner of a Pelton turbine rotates, the jet exits the nozzle and impinges on the working face of the bucket. It enters the bucket through the division blade notch, then spreads toward the root and the bucket edge, thereby driving the runner, converting the jet’s kinetic energy into mechanical energy, and enabling the generator rotor to generate electricity. Numerical calculations revealed that the torque on a single bucket exhibits periodic behavior. Accordingly, the torque variations of Bucket No. 1 were selected for detailed analysis, and six representative moments (M1–M6) were identified to investigate the internal flow characteristics within the bucket, as shown in Figure 4. The results demonstrate that the highest torque occurs under the no-offset condition (black line), followed by the axial offset condition (green line), with the PY condition (red line) yielding the lowest torque.
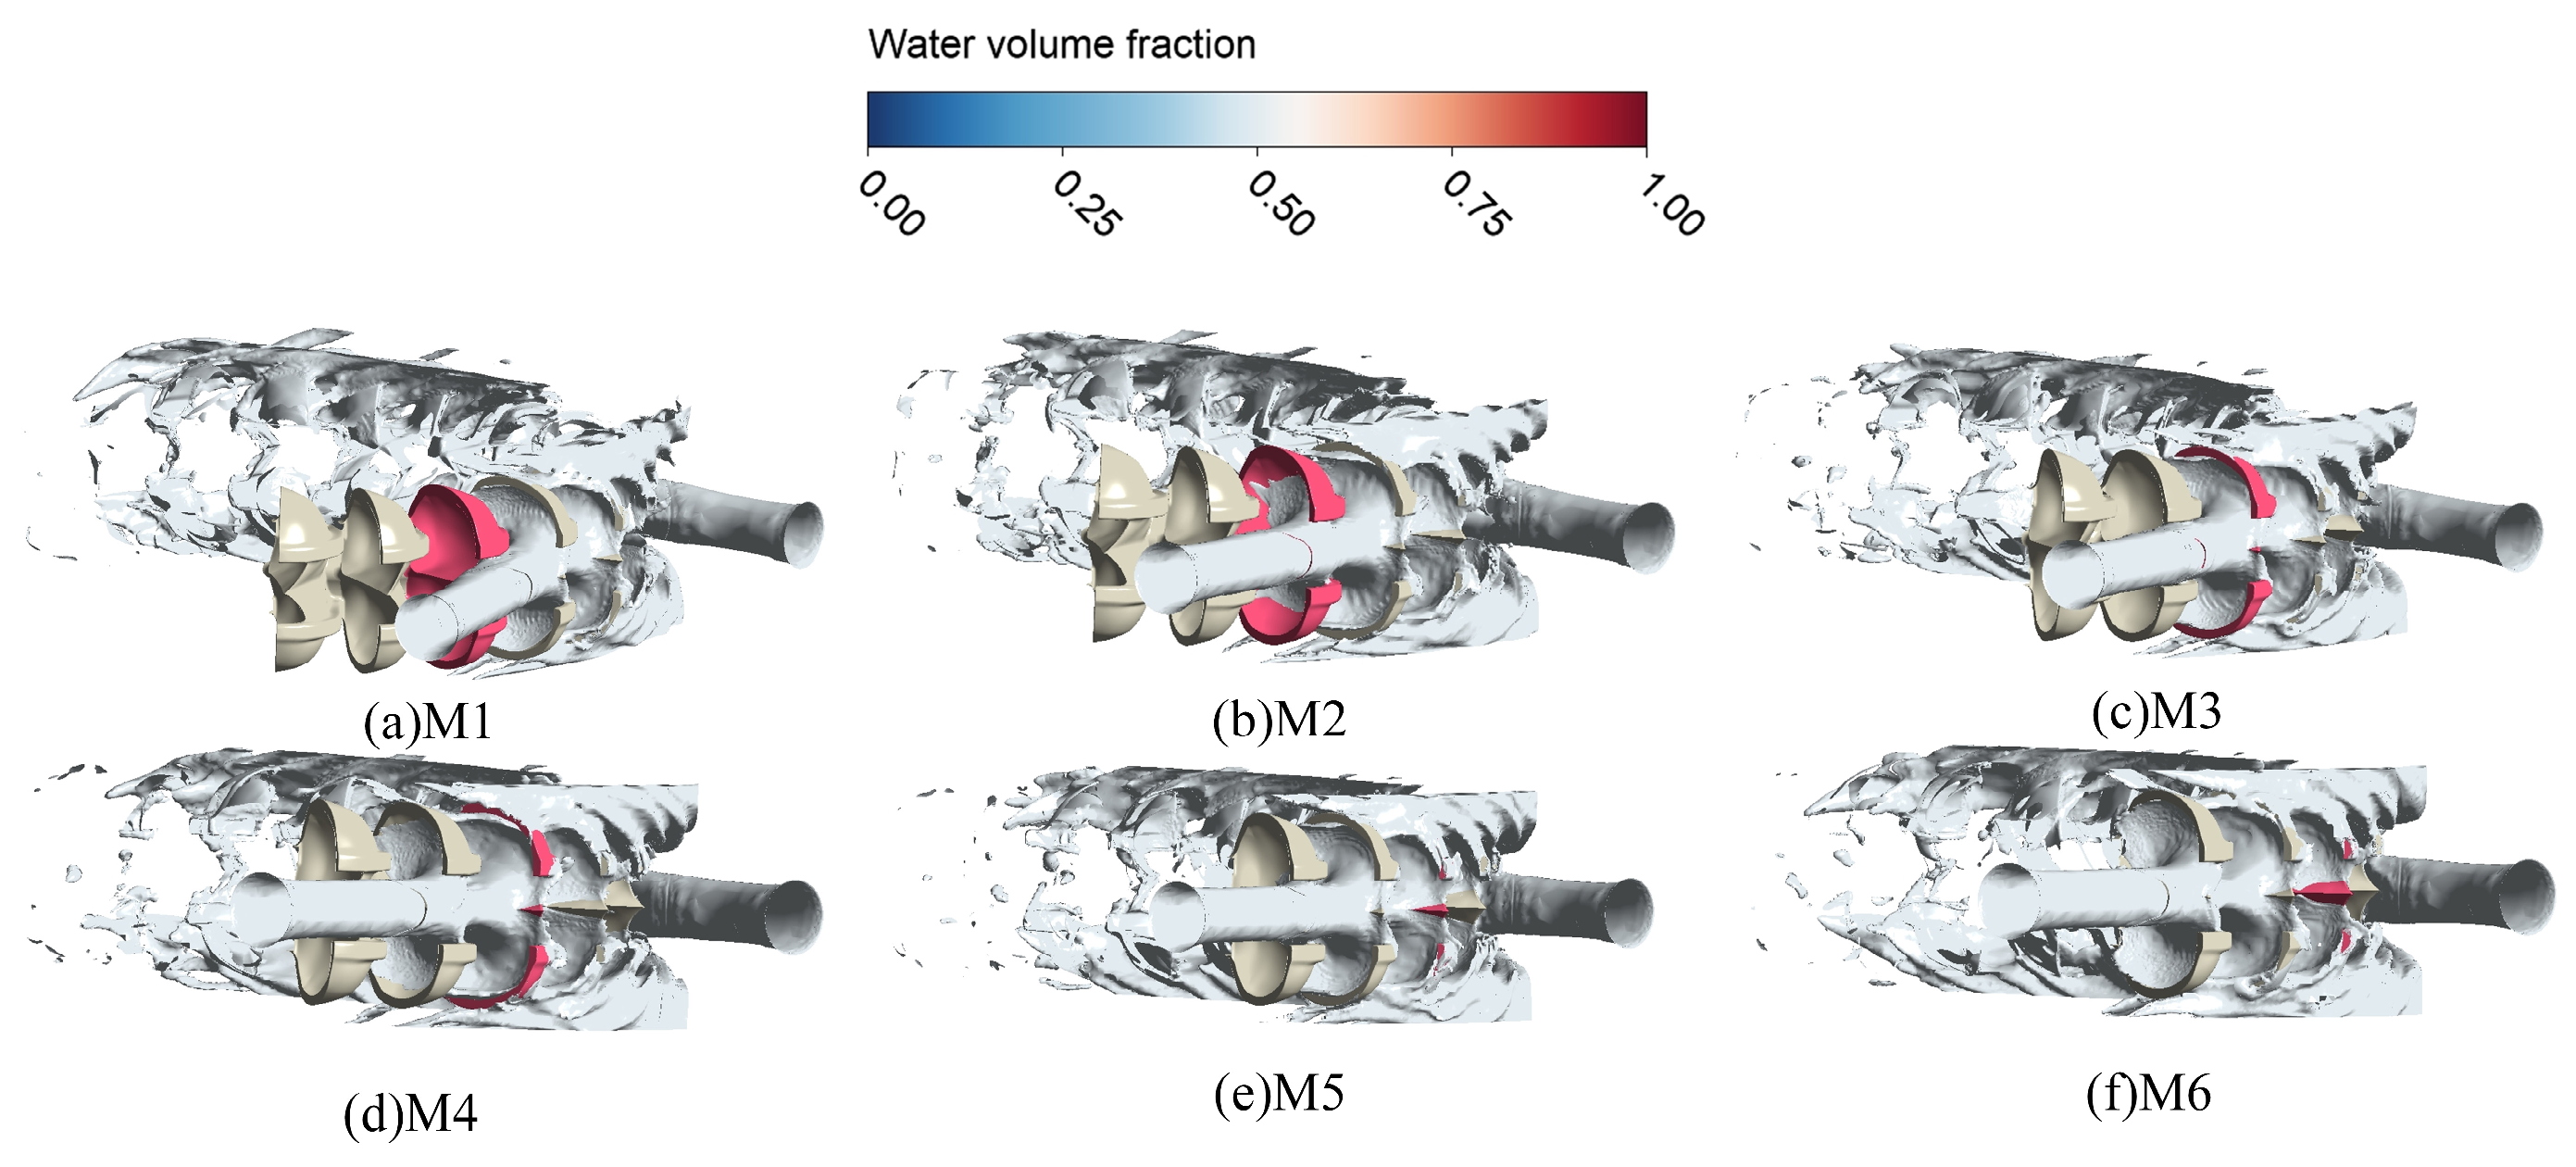
The water volume fraction on the surface of Bucket No. 1 is presented in Figure 5. The distribution of water on the bucket evolves with the rotation of the runner. At the initial moment, M1, the jet impinges on the leading edge of the division blade, and a water film begins to spread toward the root and the outlet edge from the division blade. At this stage, the water film near the pitch circle remains relatively thin. As the runner continues to rotate toward moment M4, the jet gradually shifts from the leading edge to the middle section of the division blade, causing the water film to thicken progressively. By moment M4, when the jet strikes the division blade perpendicularly, the water film at the pitch circle reaches its maximum thickness.
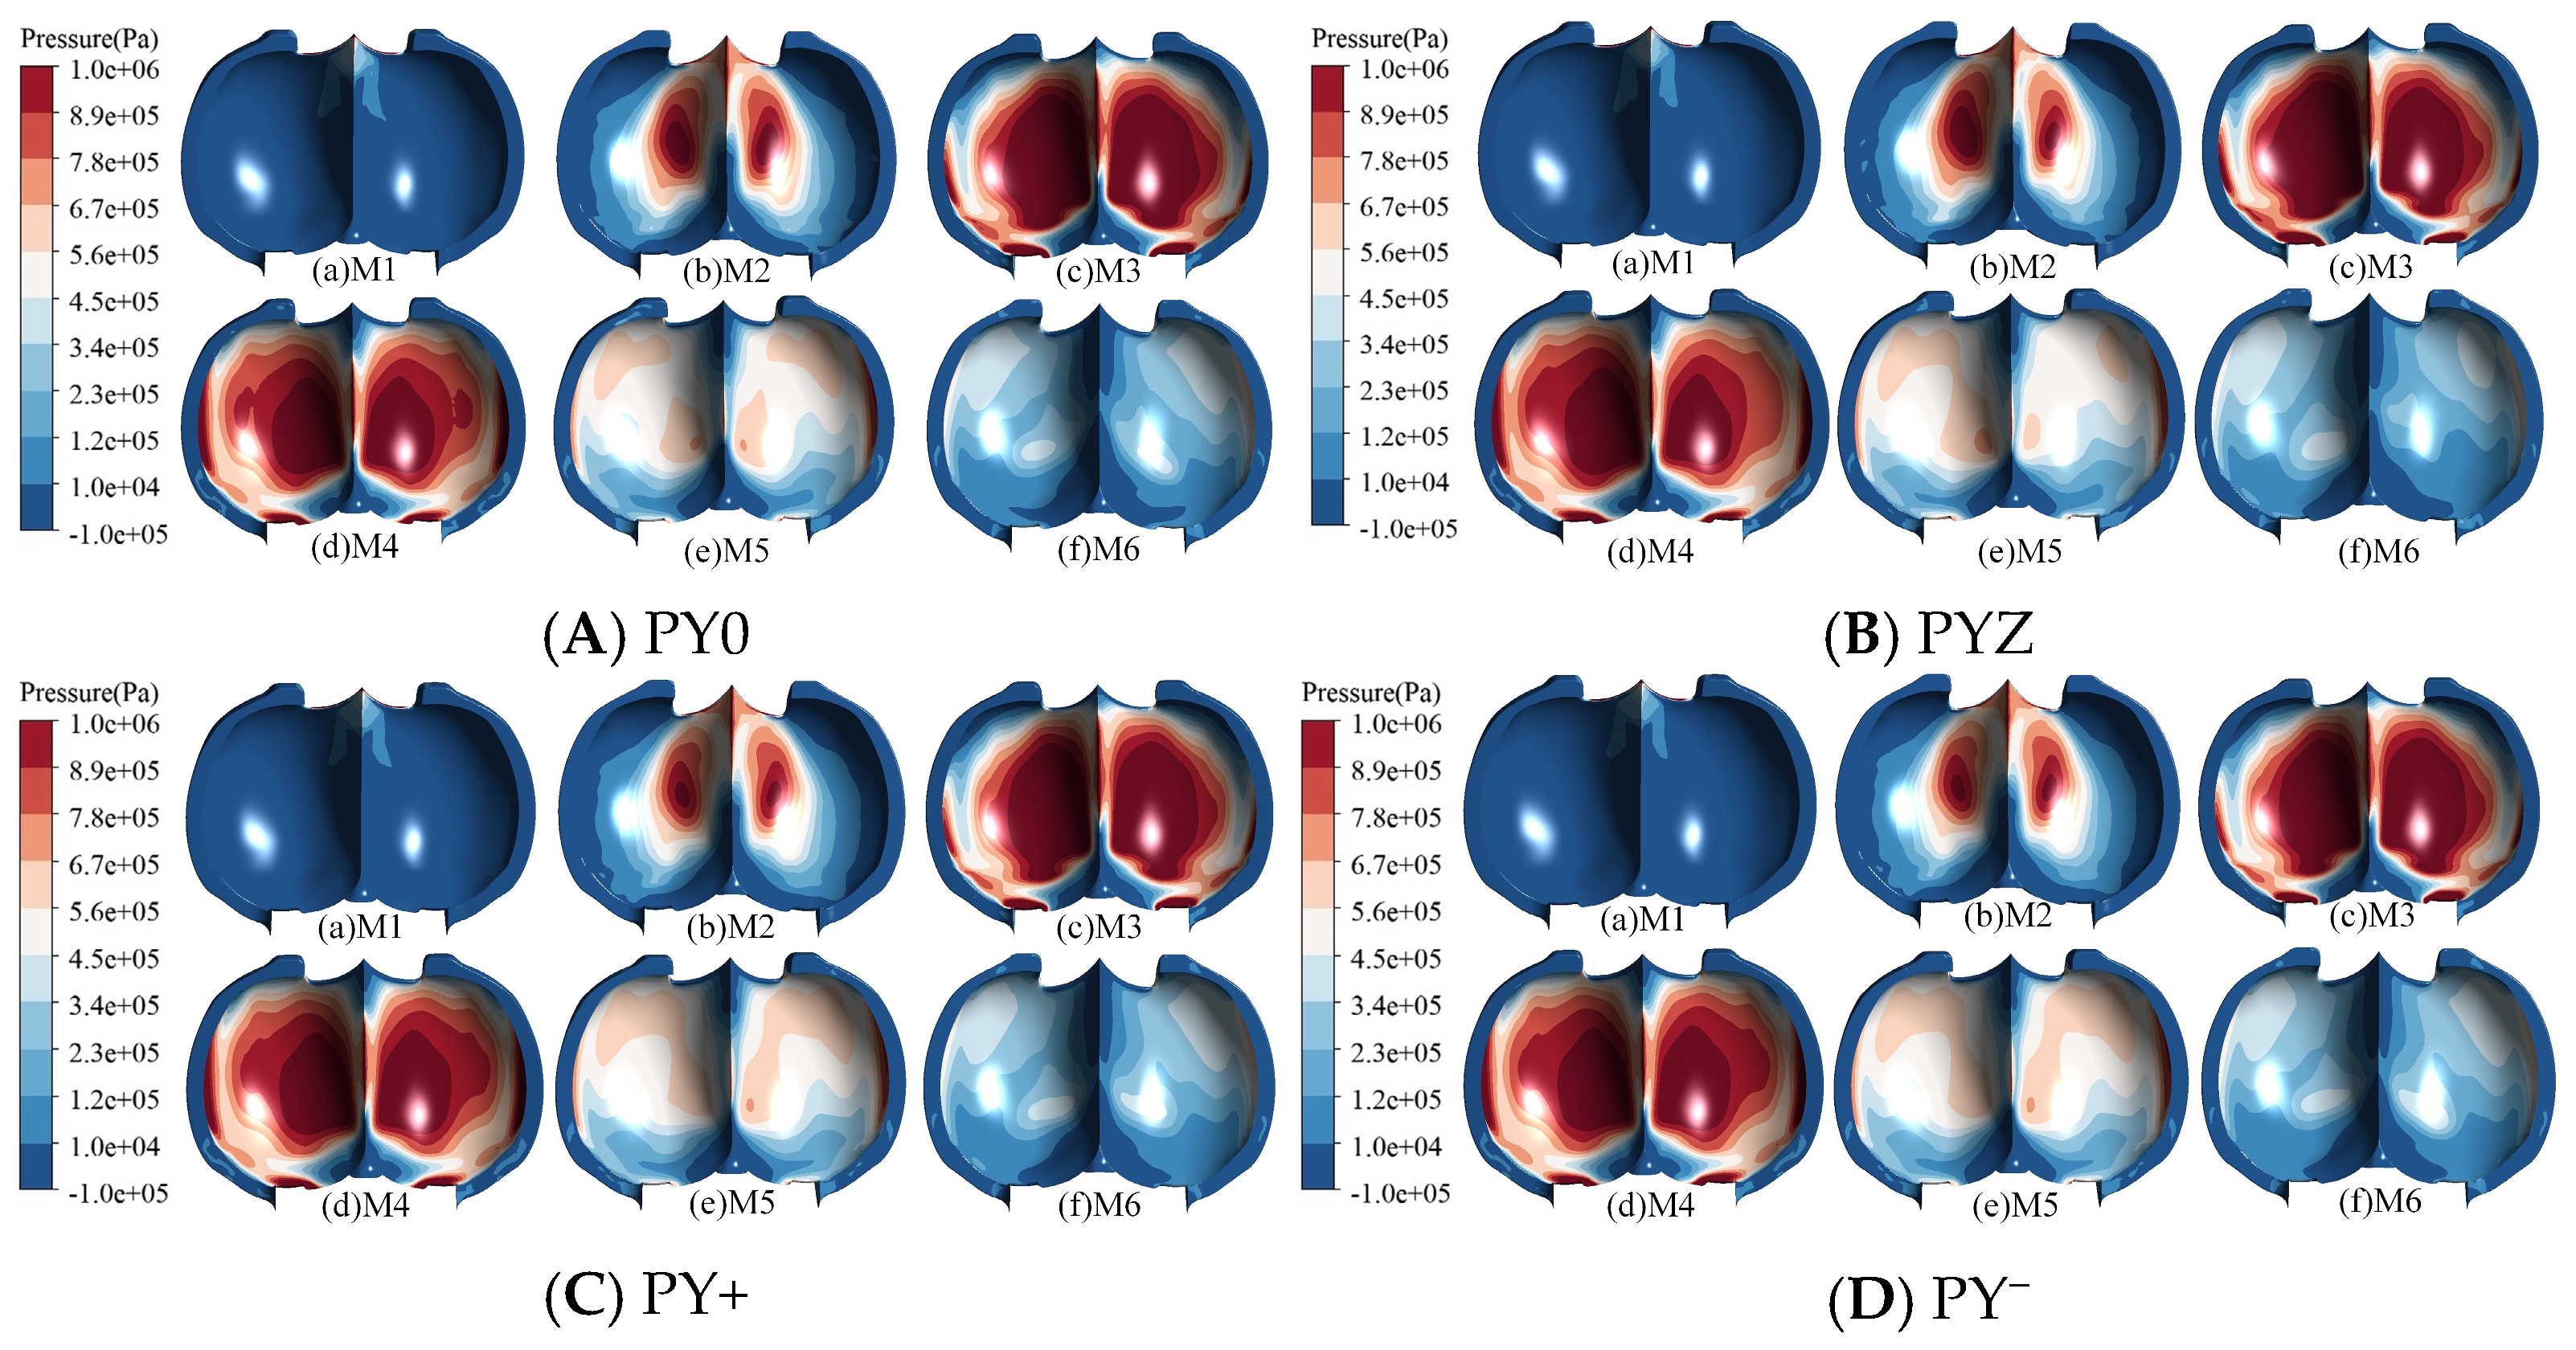
Figure 6 presents the pressure distribution on Bucket 1 across the four conditions. As the runner rotates and the water film on the bucket surface evolves, the pressure distribution exhibits distinct trends. At M1, the jet enters the bucket via the division blade notch, resulting in maximum pressure at the division blade tip. The low-pressure zones observed on either side of the working face are attributed to the residual water present on Bucket No. 1. At moment M2, the jet extends from the tip of the division blade toward the root of the working face, with the high-pressure zone concentrated at the division blade. As rotation progresses to moments M3 and M4, the jet advances from the division blade toward the bucket edge, causing the high-pressure region to shift from the tip to the midpoint of the division blade, accompanied by relatively uniform high-pressure zones on both sides of the blade. By moments M5 and M6, the water film gradually departs from the working face, exiting the bucket via the division blade and dispersing toward the edges. Under radial offset conditions, although the jet continues to be split by the division blade, a noticeable delay in jet entry into the bucket is observed. Specifically, under the PY+ condition, the jet enters the division blade later than under the PY0 condition, a difference particularly evident at M2 and M3. In the case of axial offset (PYZ), the pressure distribution across the division blade becomes asymmetric. At M3 and M4, the high-pressure zone expands more prominently on the side toward which the jet is offset. Prolonged operation under such offset conditions may lead to fatigue damage on the working face of the bucket.
Figure 7 presents the velocity streamline contours of Bucket No. 1 under four operating conditions. During the torque rise phase on the bucket face, the jet entry position shifts from the division blade notch toward the bucket root. At moment M1, the jet begins to enter the bucket from the tip of the division blade, with high-velocity regions concentrated at the tip. The jet impinges on the bucket at an acute angle relative to the division blade. Compared to the no-offset condition, the jet enters the bucket earliest under the PY condition, accompanied by the largest velocity region, whereas, under the PY+ condition, the jet entry is noticeably delayed. By moment M3, the water film continues to develop toward the center of the bucket face, and the high-velocity region is symmetrically divided by the division blade. At M4, the bucket aligns with the jet impact position at the pitch circle, where the water film spreads across most of the bucket face, reaching its maximum thickness. The jet streamlines then diverge from the division blade, exiting the bucket from the root toward the edge. By moments M5 and M6, the jet gradually spreads from the root toward the sides of the bucket face. Under the PY condition, the water film formed by the jet reaches the bucket bottom earliest, while under the PY+ condition, the water film flows over the bucket bottom most slowly. These observations indicate that the radial offset of the jet centerline significantly influences the spreading velocity of the water film on the bucket face. A comparison of the velocity streamline patterns between PYZ and PY0 reveals slight differences in the jet entry timing and uneven distributions of velocity regions on both sides of the division blade. This is attributed to the jet not being evenly divided at the division blade owing to the offset, resulting in larger high-velocity regions on the side toward which the jet is offset.

3.2. Stability Calculation of the Bucket Offset Working Conditions

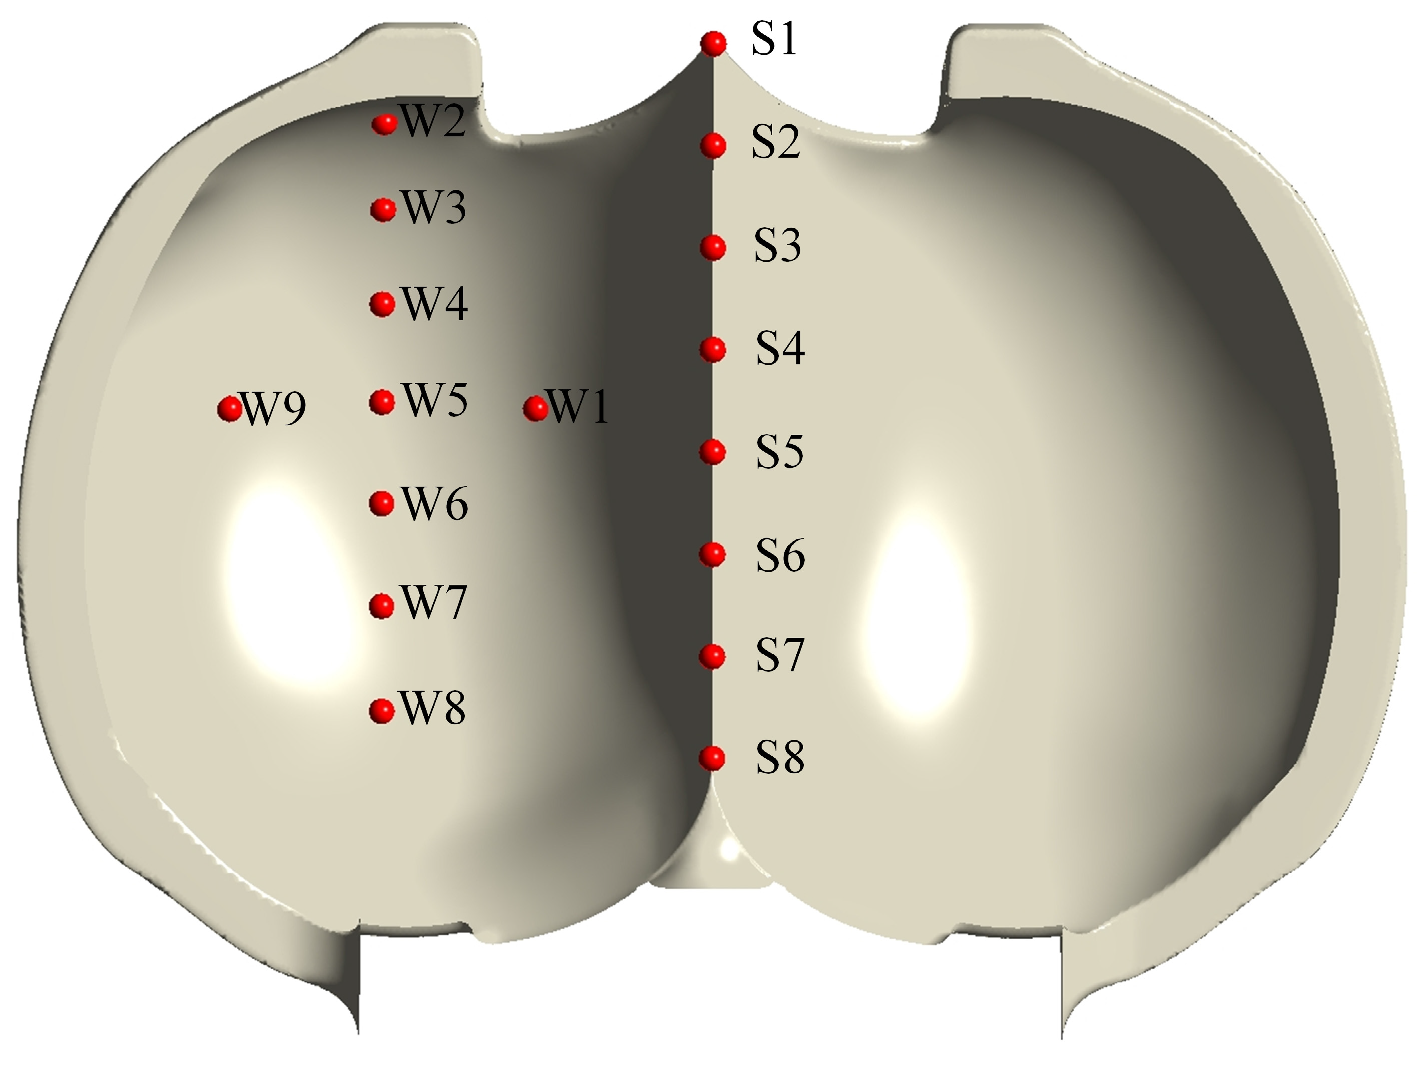
To observe the internal pressure pulsation in the bucket, 17 monitoring points are placed at equal intervals on the bucket working face and division blade. These points are labeled S1–S8 and W1–W9, as shown in Figure 8.
To quantify the pressure pulsation intensity in a Pelton turbine, the dimensionless parameters of the pressure coefficient Cp and relative pressure fluctuation amplitude ΔH/H are defined. Their expressions are as follows:
Δ H H = p i max p i min ρ g H × 100 %
C p = p i p ref ρ g H × 100 %
where ΔH represents the peak pressure fluctuation, H is the head, pi is the pressure at point i, pimax and pimin are the maximum and minimum pressures at point i, respectively, and pref is 1 atm.
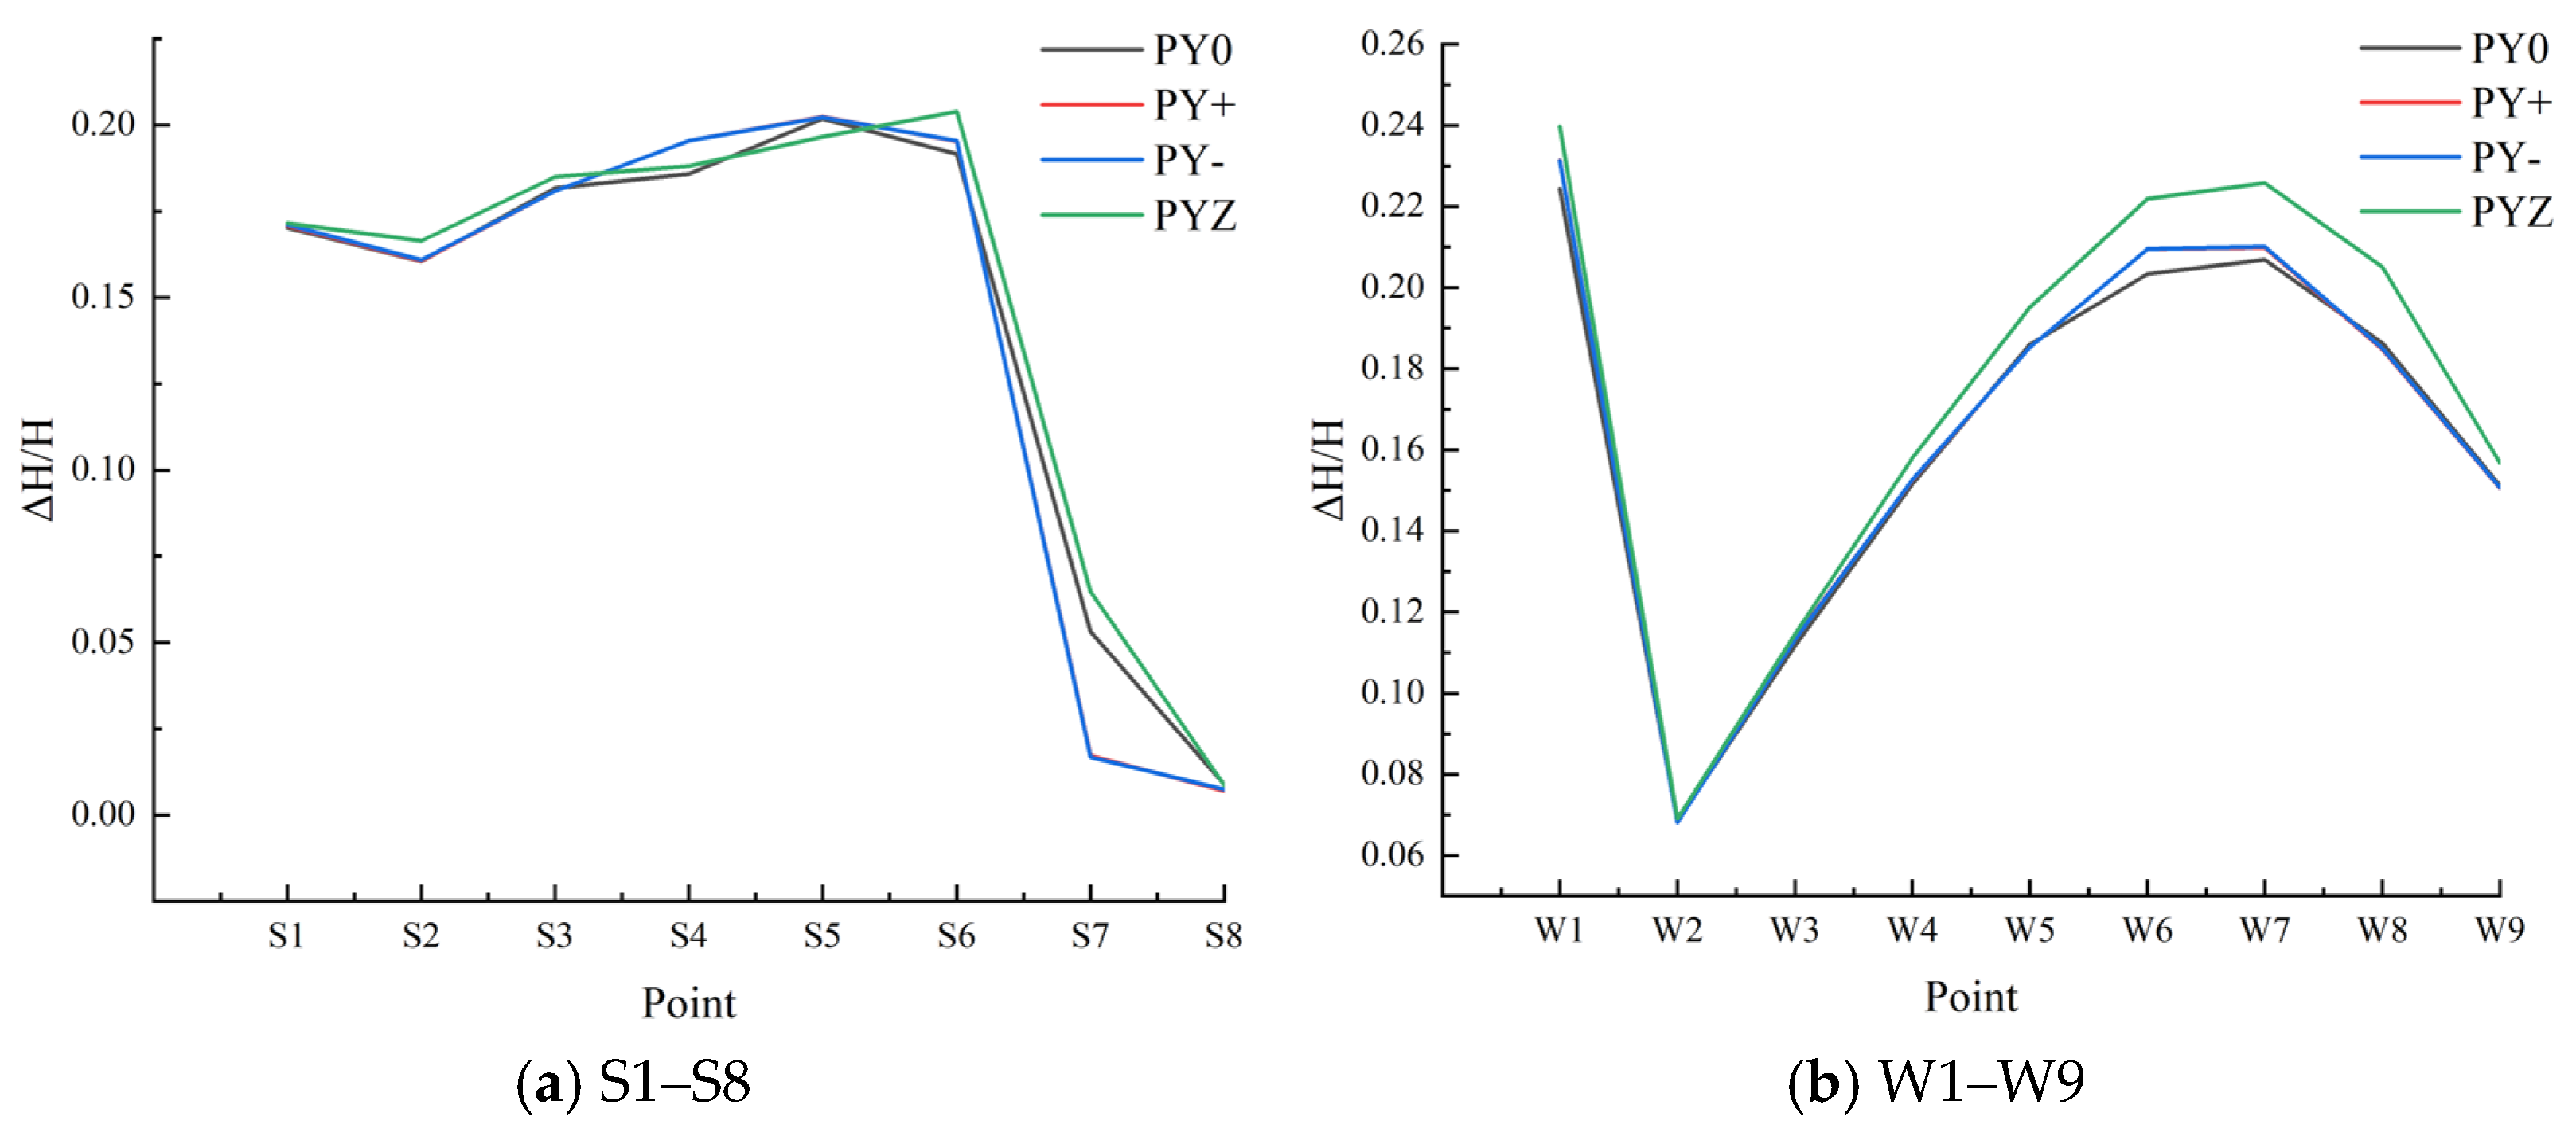
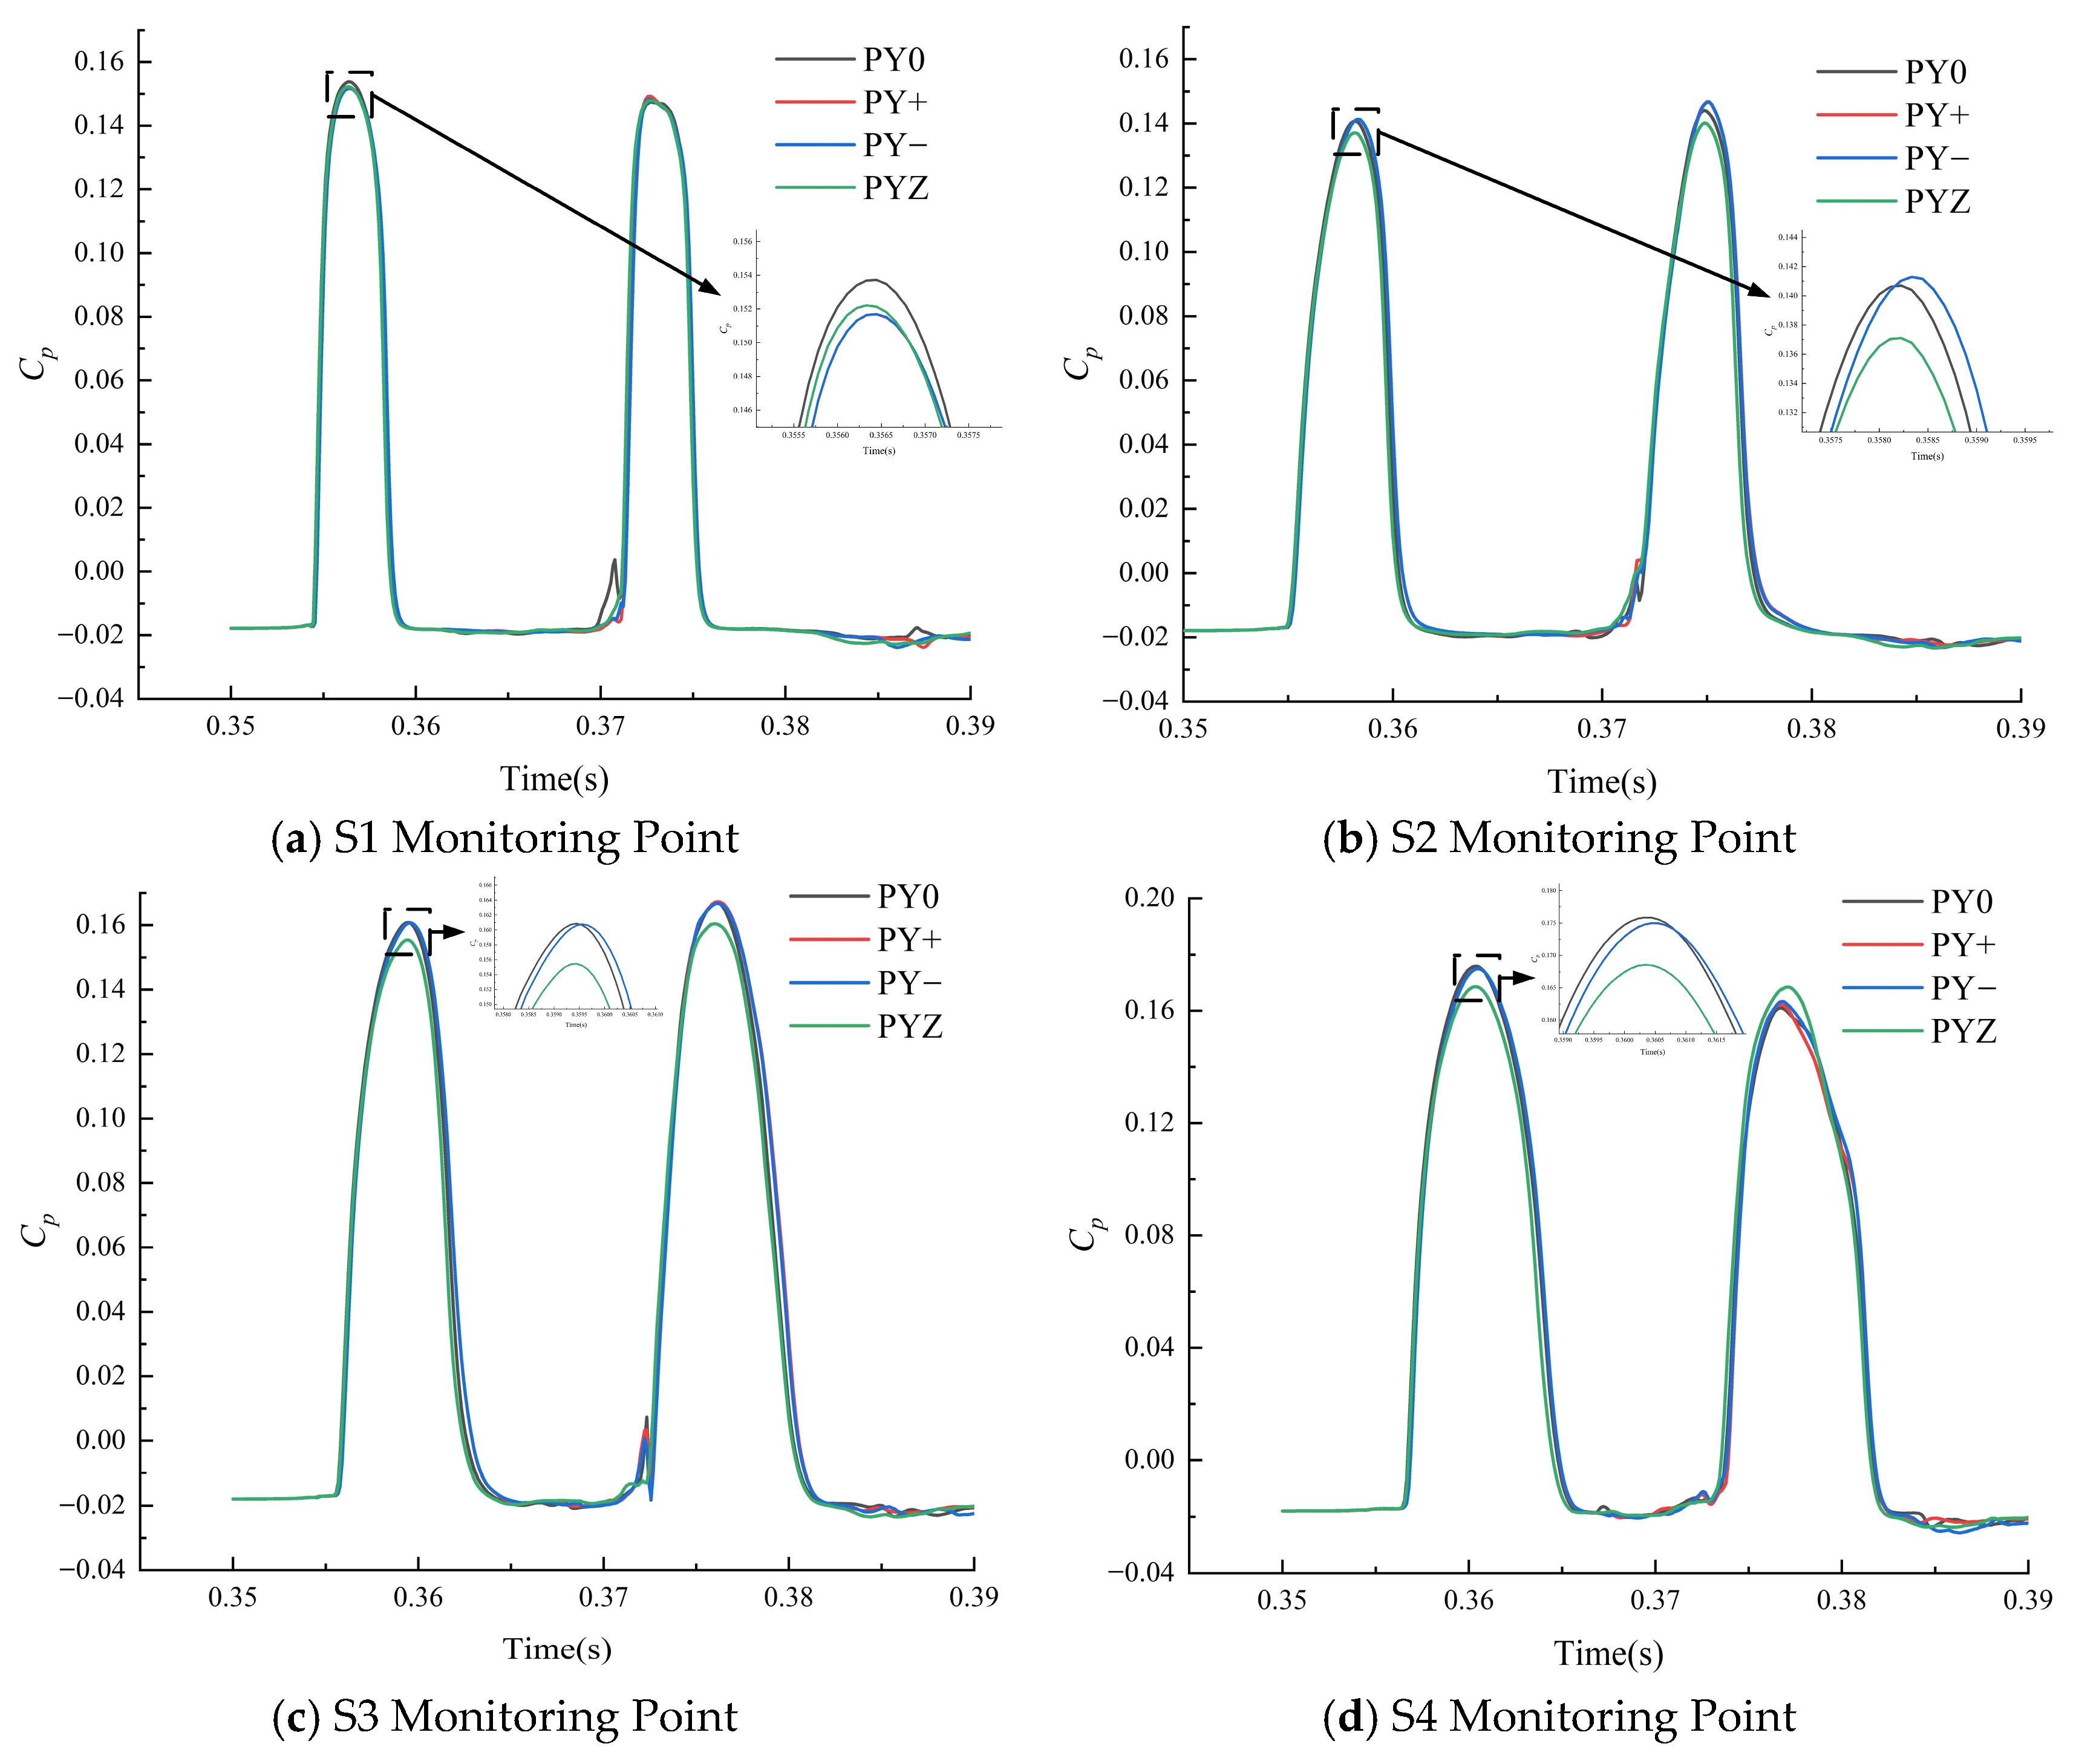
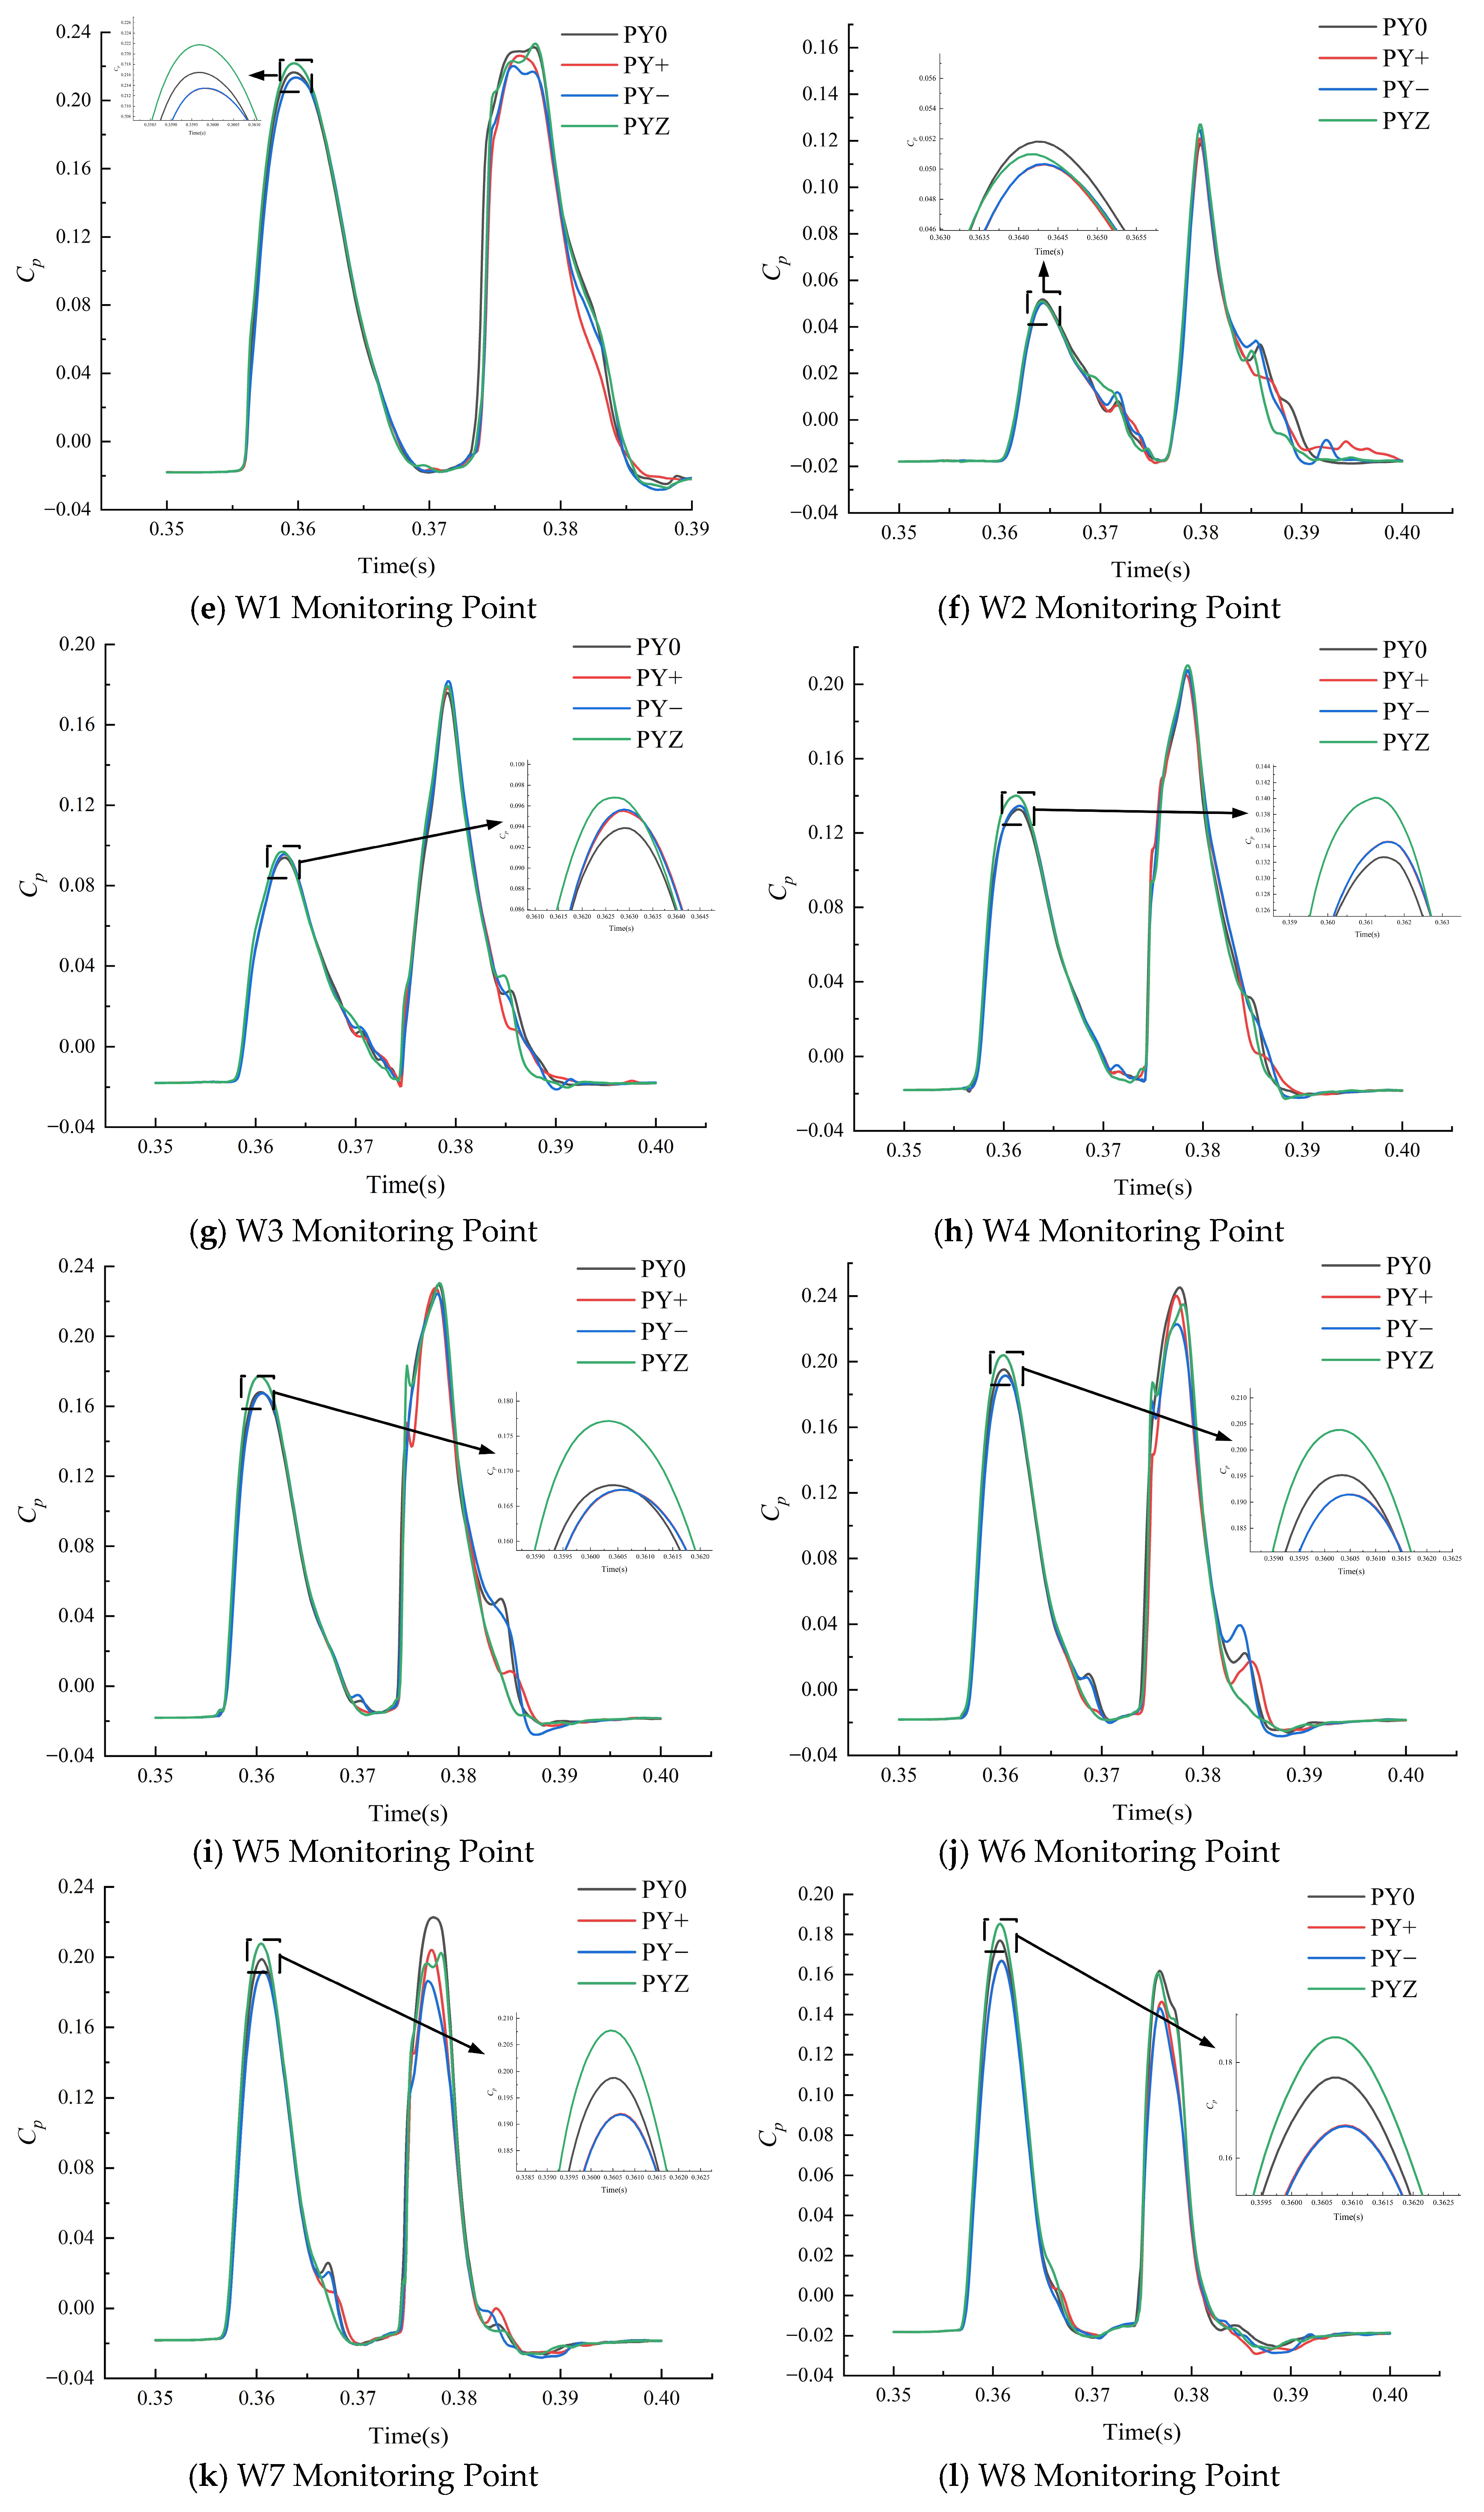
Figure 9 presents the relative amplitude of pressure pulsation at the bucket monitoring points, with the corresponding pressure pulsation coefficients illustrated in Figure 10. Along the division blade, as the position moves from the tip toward the bucket root, the influence of radial offset on pressure pulsation progressively intensifies. The closer the location is to the root, the greater the observed pressure fluctuation. The amplitude initially increases and then decreases, reaching a maximum of 20% at point S5, indicating that regions near the root are more vulnerable to damage under radial offset conditions. On the bucket working face, the effect of radial offset on pressure pulsation similarly escalates from the division blade tip toward the root. The pressure pulsation amplitude under radial offset conditions surpasses that observed under the no-offset condition. Notably, the amplitude is higher under the PY+ condition compared to the PY condition, highlighting a more pronounced effect when the jet is radially offset in the positive direction. Additionally, the axial offset (PYZ) has a more significant effect on pressure pulsation than the radial offset does, with its amplitude surpassing that of the radial offset conditions.
In a study investigating the force characteristics of a hydro turbine runner, the operational force in the following three directions were monitored: axial (z-direction), radial (r-direction), and tangential (t-direction). During the data processing phase, force from a complete rotation cycle after computational convergence was selected for analysis to ensure that the results reflected steady-state operating characteristics. The study found that under the four typical operating conditions—PY0, PY±, and PYZ—the radial, axial, and tangential force acting on the runner all exhibited significant irregular non-periodic oscillations (Figure 11), indicating that the runner is subjected to complex unsteady hydrodynamic excitations. Notably, when radial and axial displacement occurred, the peak axial force experienced a significant increase. This phenomenon directly demonstrates that the displacement amplifies axial vibration energy in the turbine, transmitted through the thrust bearing to the unit’s support structure, thereby substantially increasing the unit lifting risk (axial instability of the rotor system). These findings are strongly corroborated by simultaneously measured vibration data from the turbine guide bearing.
Concurrent observations revealed a slight reduction in the peak radial force under displacement conditions. By excluding pressure pulsation interference and considering solely the static perspective, the restructuring of mechanical equilibrium post-radial displacement theoretically helps suppress radial swing amplitude. However, regarding tangential force, although the data indicate only a minimal attenuation, its engineering impact is significant, as the tangential force is directly linked to the efficiency of torque transmission from the runner. Even this minor reduction leads to a decline in output shaft power and hydraulic efficiency loss for the turbine, adequately explaining the observed reduction in unit power output during field operation. This research elucidates the differential impact mechanisms of radial–axial displacement on the tri-directional force acting on the runner.

3.3. Erosion Analysis for Different Particle Sizes

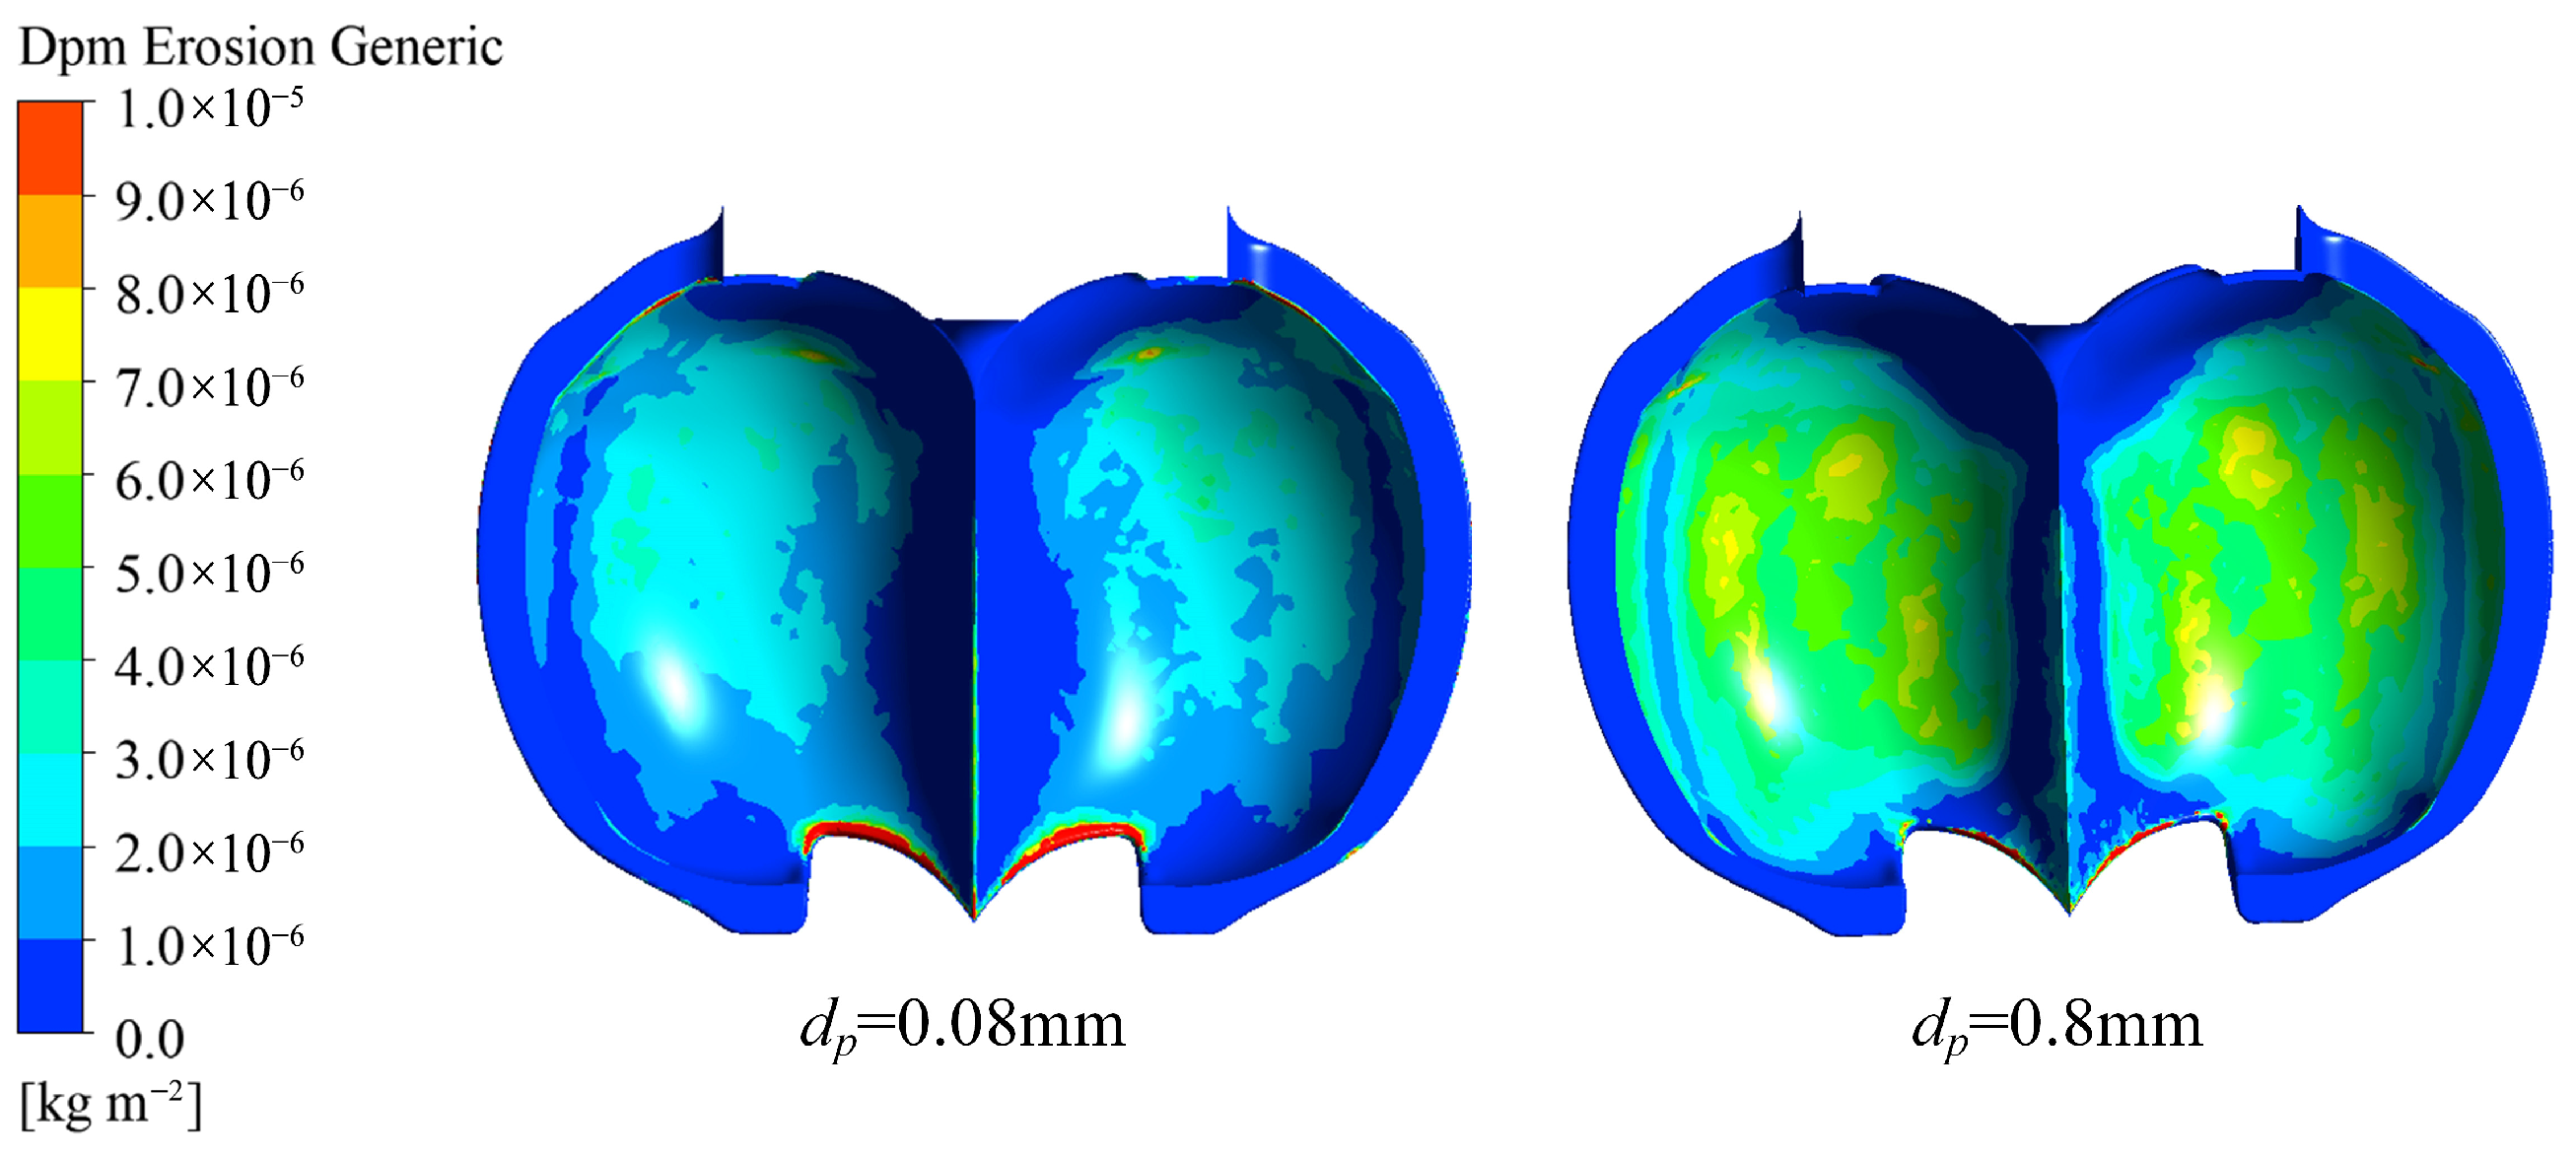
Sediment erosion of the constructed overflow parts of the Pelton model hydraulic turbine is calculated according to the Generic erosion model. Sand particle size is taken as dp = 0.08 mm, 0.8 mm, sediment density is 2650 kg/m3, and sediment concentration is taken as CV = 0.357 kg/m3.
Different grain sizes of erosion are shown in Figure 12. The erosion difference between 0.08 mm (fine sand) and 0.8 mm (coarse sand) sediment on the bucket of the Pelton turbine is significant; 0.08 mm fine sand spreads with the jet in a high concentration suspension state, mainly forming uniform shallow scratches on the working surface, and erosion and micro-cutting dominate; 0.8 mm coarse sand, due to large inertia and concentrated trajectory, directly impacts the splitter and the cut-out, resulting in impact craters, edge spallings, and easily induced Fatigue cracks. Erosion is more severe for large particle sizes than for small particle sizes.

4. Conclusions

This study carried out transient two-phase flow calculations for a turbine in the Dadu River Basin in China. This study aimed to explore the internal flow and stability of the turbine and analyze how radial and axial offsets affect runner operation. Power stations should be urged to monitor the operation of runners in real time and avoid the deflection of jets. The key findings are as follows:
(1)
Radial offset causes the jet to enter the bucket later when deflected outward and earlier when deflected inward.
(2)
Radial offset increases the relative pressure pulsation amplitude, with the most pronounced effects observed near the bucket root and along the division blade. The maximum amplitude reaches 20% at point S5. On the working face, the increase in pressure pulsation amplitude is more substantial under the PY+ condition compared to the PY condition, with the most significant relative amplitude change observed at point W1, reaching 23%. The highest absolute pressure pulsation amplitude is recorded at point W6, reaching 24%.
(3)
Axial offset results in an uneven pressure distribution and elevated relative pressure pulsation amplitudes. The most notable change is observed at point W1, with an amplitude reaching 23.97%. This condition increases the likelihood of bucket vibration and fatigue damage.
(4)
Erosion is more severe for large particle sizes than for small particle sizes.

Author Contributions

Methodology, Z.Y., J.L. (Jitao Liu) and X.L.; Software, Z.Y., J.L. (Jitao Liu), Y.C., J.L. (Jianan Li) and K.X.; Formal analysis, J.P., Y.G. and H.W.; Investigation, J.Z., Y.C., J.L. (Jianan Li) and K.X.; Resources, J.Z.; Data curation, J.P., Y.G. and H.W.; Writing–original draft, J.L. (Jitao Liu); Writing–review & editing, X.L.; Funding acquisition, X.L. All authors have read and agreed to the pub-lished version of the manuscript. All authors have read and agreed to the published version of the manuscript.

Funding

This research is supported by Key Program of National Natural Science Foundation of China (No. U23A20669), Sichuan Science and Technology Program (No. 2022ZDZX0041).

Data Availability Statement

The original contributions presented in this study are included in the article. Further inquiries can be directed to the corresponding authors.

Acknowledgments

This research is especially grateful to the Key Program of National Natural Science Foundation of China for the funding of the science and technology project, and to Xihua University for their strong support in the theoretical research of the project.

Conflicts of Interest

Author Zhiqiang Yuan, Jian Zhang, Yinhui Cai, Jianan Li, Haoyu Wang was employed by the company CHN Energy Dadu River Repair & Installation Co., Ltd., Leshan China. The remaining authors declare that the research was conducted in the absence of any commercial or financial relationships that could be construed as a potential conflict of interest.

Abbreviations

VOFvolume of fluid
GCIgrid convergence index
SSTshear stress transport

Nomenclature

PY0no offset
PY+radial offset of the jet toward the outer edge of bucket
PYradial offset toward the bucket root
PYZaxial offset
Cppressure coefficient

References

  1. Bhattarai, S.; Vichare, P.; Dahal, K.; Al, M.A.; Olabi, A.G. Novel trends in modelling techniques of Pelton Turbine bucket for increased renewable energy production. Renew. Sustain. Energy Rev. 2019, 112, 87–101. [Google Scholar] [CrossRef]
  2. Yang, Z.; Li, C.; Zhou, X. Global hydropower development status and potential analysis in 2021. Adv. Sci. Technol. Water Resour. 2022, 42, 39–44+56. [Google Scholar]
  3. Liu, X. Hydraulic Turbine Sand and Water Flow and Erosion; Water Conservancy and Hydropower Press: Beijing, China, 2020. [Google Scholar]
  4. Han, L.; Zhang, G.; Wang, Y.; Wei, X.Z. Investigation of erosion influence in distribution system and nozzle structure of Pelton turbine. Renew. Energy 2021, 178, 1119–1128. [Google Scholar] [CrossRef]
  5. Liu, J.; Liu, X.; Chang, X.; Qin, B.; Pang, J.; Lai, Z.; Jiang, D.; Qin, M.; Yao, B.; Zeng, Y. Research on the mechanism of sediment erosion in the bucket of a large-scale Pelton turbine at a hydropower station. Powder Technol. 2025, 455, 120805. [Google Scholar] [CrossRef]
  6. Yao, B.; Zhou, Y.; Wu, B.; Pang, J.; Jiang, D.; Zhang, H.; Liu, J.; Qin, B.; Liu, X. Effect of sediment erosion on pressure pulsations in a large Pelton turbine. Energy Sci. Eng. 2024, 12, 4040–4056. [Google Scholar] [CrossRef]
  7. Qin, M.; Yu, Z.; Wu, B.; Pang, J.; Jiang, D.; Zhang, H.; Liu, J.; Hua, H.; Liu, X. Numerical simulation of multiphase flow and prediction of sediment wear in a large Pelton turbine. Energy Sci. Eng. 2024, 12, 5031–5044. [Google Scholar] [CrossRef]
  8. Santolin, A.; Cavazzini, G.; Ardizzon, G.; Pavesi, G. Numerical investigation of the interaction between jet and bucket in a Pelton turbine. Proc. Inst. Mech. Eng. Part A J. Power Energy 2009, 223, 721–728. [Google Scholar] [CrossRef]
  9. Anagnostopoulos, J.S.; Papantonis, D.E. A fast Lagrangian simulation method for flow analysis and runner design in Pelton turbines. J. Hydrodyn. 2012, 24, 930–941. [Google Scholar] [CrossRef]
  10. Han, L.; Duan, X.L.; Gong, R.Z.; Zhang, G.F.; Wang, H.J.; Wei, X.Z. Physic of secondary flow phenomenon in distributor and bifurcation pipe of Pelton turbine. Renew. Energy 2019, 131, 159–167. [Google Scholar] [CrossRef]
  11. Wang, D.; Wang, Q.; Zhang, B.; Xu, Y. Old wine in a new bottle: Energy loss evaluation in a six-nozzle Pelton turbine with entropy production theory. Energy 2025, 319, 135132. [Google Scholar] [CrossRef]
  12. Jung, I.H.; Kim, Y.S.; Shin, D.H.; Chung, J.T.; Shin, Y. Influence of spear needle eccentricity on jet quality in micro Pelton turbine for power generation. Energy 2019, 175, 58–65. [Google Scholar] [CrossRef]
  13. Zeng, C.; Xiao, Y.; Luo, Y.; Zhang, J.; Wang, Z.; Fan, H.; Ahn, S.-H. Hydraulic performance prediction of a prototype four-nozzle Pelton turbine by entire flow path simulation. Renew. Energy 2018, 125, 270–282. [Google Scholar] [CrossRef]
  14. Sun, L.; Wang, Z.; Zhou, H.; Wang, Z.; Guo, P. Numerical assessment of transient flow and energy dissipation in a Pelton turbine during startup. Phys. Fluids 2024, 36, 094119. [Google Scholar] [CrossRef]
  15. Fan, W.; Sun, L.; Guo, P. Investigation on unstable flow characteristics and energy dissipation in Pelton turbine. Eng. Appl. Comput. Fluid Mech. 2024, 18, 2304643. [Google Scholar] [CrossRef]
  16. Zhao, H.; Zhu, B.; Xu, B.; Tang, P.; Guo, N.; Zhang, W. Investigation on the influence of bucket’s flow patterns on energy conversion characteristics of Pelton turbine. Eng. Appl. Comput. Fluid. Mech. 2023, 17, 2234435. [Google Scholar] [CrossRef]
  17. Zhao, H.; Xu, B.; Tang, P.; Guo, N.; Zhu, B. Generation mechanism and control method of counter torque in the bucket of a Pelton turbine. Phys. Fluids 2023, 35, 105133. [Google Scholar] [CrossRef]
  18. GB/T 8564-2003; Installation Code for Hydraulic Turbine Generators. China Standards Press: Beijing, China, 2003.
  19. Li, L.; Lu, J.; Gong, Y.; Zhao, H.; Liu, X.; Zhu, B. Sediment erosion characteristics of Pelton turbine runner: Effects of sediment concentration and diameter. Renew. Energy 2024, 220. [Google Scholar] [CrossRef]
  20. Ge, X.; Sun, J.; Zhou, Y.; Cai, J.; Zhang, H.; Zhang, L.; Ding, M.; Deng, C.; Binama, M.; Zheng, Y. Experimental and numerical studies on opening and velocity influence on sediment erosion of Pelton turbine buckets. Renew. Energy 2021, 173, 1040–1056. [Google Scholar] [CrossRef]
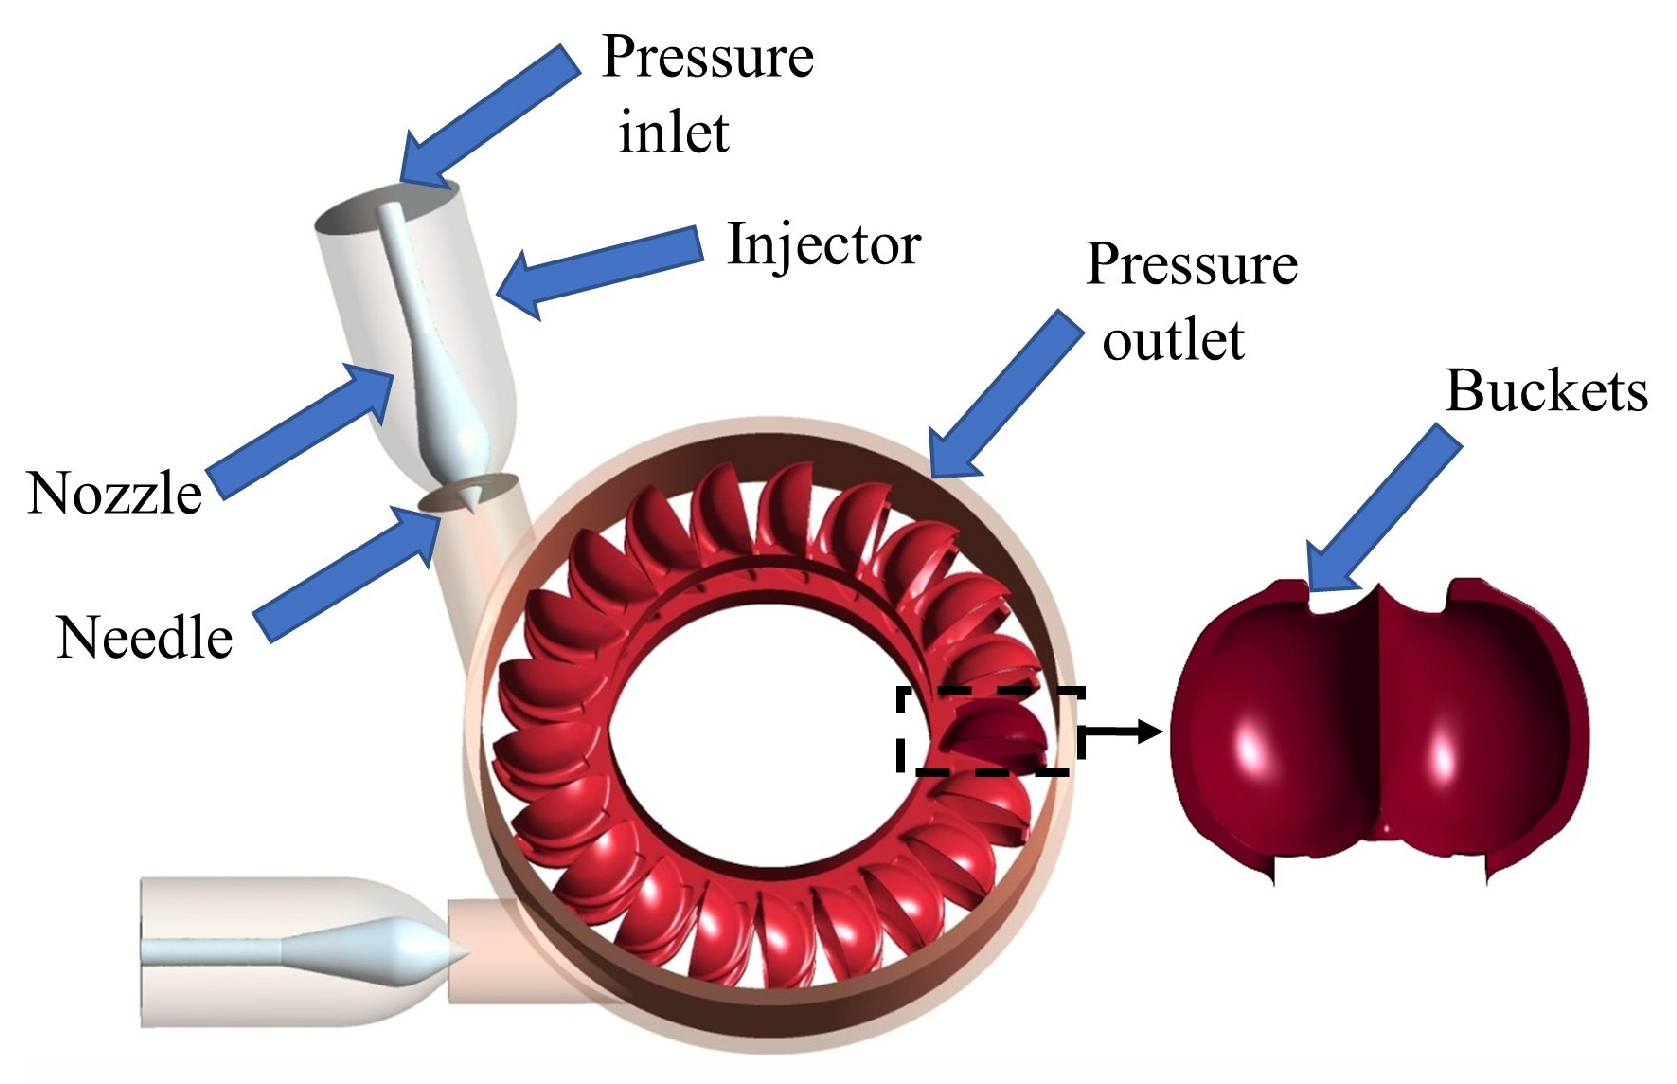
Figure 1. Pelton turbine model.
Processes 13 02683 g001
Figure 2. Offset schematic diagram.
Processes 13 02683 g002
Figure 3. Mesh generation and Y+.
Processes 13 02683 g003
Figure 4. Torque of a single bucket.
Processes 13 02683 g004
Figure 5. Water volume fraction.
Processes 13 02683 g005
Figure 6. Pressure cloud diagram.
Processes 13 02683 g006
Figure 7. Velocity streamline cloud diagram.
Processes 13 02683 g007
Figure 8. Layout of pressure pulsation points on the turbine runner bucket.
Processes 13 02683 g008
Figure 9. Relative amplitude of pressure pulsation at bucket points.
Processes 13 02683 g009
Figure 10. Pressure pulsation coefficient at bucket monitoring points.
Processes 13 02683 g010aProcesses 13 02683 g010b
Figure 11. Time–history curves of runner force in the z (axial), r (radial), and τ (tangential) directions under operating conditions PY0, PY±, and PYZ.
Processes 13 02683 g011
Figure 12. Erosion of different grain sizes.
Processes 13 02683 g012
Table 1. Basic parameters of the Pelton turbines.
Design ParametersValueDesign ParametersValue
Head (m)578Flow (m3/s)2.09
Rated speed (r/min)750Number of nozzles2
Number of buckets21Runner pitch circle diameter (mm)1280
Bucket width (mm)382.3Nozzle inlet diameter (mm)430
Table 2. Grid information.
ComponentG1G2G3
Number of grids12,489,7109,580,4556,943,521
Table 3. Grid independence verification (GCI).
Parameterφ1φ2φ3prGCI
φ39,972.839,836.1168839,643.53.451.15%
Table 4. Comparison of the hydraulic performance.
Flow QEfficiency η
experimental2.09 m3/s86.7%
numerical calculation2.04 m3/s84.3%
errors2.39%2.77%
Disclaimer/Publisher’s Note: The statements, opinions and data contained in all publications are solely those of the individual author(s) and contributor(s) and not of MDPI and/or the editor(s). MDPI and/or the editor(s) disclaim responsibility for any injury to people or property resulting from any ideas, methods, instructions or products referred to in the content.