Article

Mechanisms and Potential Assessment of CO2 Sequestration in the Baijiahai Uplift, Junggar Basin

1
BGP Inc., CNPC, Zhuozhou 072750, China
2
National Key Laboratory of Petroleum Resources and Engineering, China University of Petroleum (Beijing), Beijing 102249, China
*
Author to whom correspondence should be addressed.
Processes 2025, 13(8), 2648; https://doi.org/10.3390/pr13082648
Submission received: 24 June 2025 / Revised: 14 July 2025 / Accepted: 11 August 2025 / Published: 21 August 2025
(This article belongs to the Section Energy Systems)

Abstract

To reduce CO2 emissions, CO2 geological storage is recognized as an effective approach to decrease atmospheric carbon concentration. Sequestration in deep saline aquifers has become a research focus. However, the physicochemical property changes in saline formations induced by CO2 injection remain unclear, making it difficult to assess their CO2 storage potential. This study focuses on saline aquifers within the Jurassic Badaowan formation (J1b), Sangonghe formation (J1s), and Cretaceous Tugulu Group (K1tg) of the Baijiahai Uplift in the Junggar Basin. An integrated methodology combining laboratory experiments—including CO2 static immersion tests, dynamic displacement tests, X-ray diffraction (XRD), mercury injection capillary pressure (MICP), nuclear magnetic resonance (NMR) measurements, and mechanical testing—with CMG-based numerical modeling was employed to analyze CO2 storage mechanisms and evaluate storage potential. The results show that after CO2 immersion, extensive dissolution of calcite in J1s, clay swelling/cementation in J1b, and extensive dissolution of calcite in K1tg all lead to increased porosity and permeability, with the J1b formation exhibiting superior CO2 storage capacity, the highest MICP-derived porosity, and the greatest NMR-measured porosity among the three formations. Numerical simulations further confirmed J1b’s leading sequestration volume. Based on integrated experimental and simulation results, the J1b formation is identified as the optimal reservoir for CO2 storage. However, to manage potential mechanical instability during real-world injection scenarios, injection pressures and rates should be carefully controlled and continuously monitored to avoid formation fracturing and ensure long-term storage security. This study provides a reference for implementing saline aquifer CCUS projects.

1. Introduction

Under the severe circumstances of global climate change, environmental issues caused by CO2 emissions pose a common challenge for countries to maintain sustainable development [1,2,3]. According to statistics from the International Energy Agency (IEA) [4], global CO2 emissions reached 36.8 billion tons in 2023, an increase of approximately 18% compared to 2010, and nearly 50% higher than at the beginning of the Industrial Revolution [5,6]. To mitigate the impacts of climate change [7], reducing atmospheric CO2 concentration has become a key initiative. As a critical component of carbon capture, utilization, and storage (CCUS) technologies [8], CO2 storage has been proven economically feasible [9] and its environmental risks predictable [10]. Among various approaches, deep saline aquifer geological CO2 storage has attracted significant attention due to its wide distribution and enormous storage potential [11,12,13]. Saline aquifers, typically located in deep sedimentary basins, are characterized by large thickness, moderate porosity and permeability, and stable distribution, providing ideal storage spaces for CO2 and being regarded as the most promising storage formations [8,14,15].
The storage mechanisms of CO2 in saline aquifers mainly include physical storage (structural storage and residual gas storage) [16,17] and chemical storage (dissolution storage and mineral storage); physical storage can accommodate large amounts of CO2 but is unstable, as the trapped CO2 is vulnerable to leakage due to tectonic movements such as faults and fractures [18,19]; chemical storage offers stronger stability but acts over relatively longer timescales [20,21]. However, the migration patterns of CO2 in saline aquifers remain incompletely understood. Complex geological structures and fluid properties affect CO2 distribution and diffusion, making it difficult to accurately predict its long-term storage behavior. The sealing integrity of caprocks is critical for storage safety, yet how to evaluate their ability to resist CO2 leakage under long-term geological conditions requires further study. Additionally, the chemical reaction rates between CO2, saline water, and formation minerals are slow, meaning physical storage dominates in the short term, while the effects and influencing factors of long-term chemical storage still need further exploration.
Previous studies have addressed various aspects of CO2 storage in saline aquifers. Li et al. [22] investigated the distribution and geological characteristics of potential CO2 reservoirs in deep saline aquifers of the Bohai Bay Basin. Zhao Yulong et al. [21] evaluated the CO2 storage potential in saline aquifers and developed an adaptive evaluation method to better understand CO2 migration characteristics. Gholami et al. [23] found that injected CO2 further migrates and accumulates in pore throats under resistance, reducing reservoir porosity and permeability. Edem et al. [24] conducted core flooding experiments on Gray Berea sandstone with different salinities (5, 15, 25 wt.% NaCl) and found that permeability increased from 10% to 70%, and porosity increased from 0.75% to 6% with increasing salinity. Jia Haizheng et al. [25] investigated the interactions between CO2 and Jimusaer reservoir rocks, revealing differences in CO2 storage capacity among different rock types. Mohd Amin et al. [26] observed that porosity decreased most significantly at the interface between reservoir and caprock due to mineral precipitation, enhancing the caprock sealing capacity in the presence of mineral precipitation. Alzayer et al. [27] modeled CO2 storage in deep saline aquifers and studied best practices for simulating CO2 storage in deep brine-bearing layers. Ji Youjun et al. [28] investigated the effects of CO2 geological storage on reservoir mechanical properties and gas migration-–diffusion under multi-field coupling through stress sensitivity experiments and numerical simulations. Yiyang Zhou et al. [29] studied CO2 storage effects in deep saline aquifers under different phases through relative permeability tests and numerical simulations. Peng Xiyi et al. [30] analyzed the influence of CO2 behavior differences (liquid vs. supercritical states) on plume dynamics evolution through migration experiments in saline aquifers. Fatima et al. [31] investigated the impacts of CO2 storage on geomechanical and petrophysical properties under different caprock conditions using laboratory experiments and numerical simulations with CMG software 2023.10. Jin Yangjun et al. [32] studied the variation in CO2 solubility in deep saline aquifers with burial depth through numerical simulations. Temitope et al. [33] used CMG to simulate the feasibility of commercial CO2 injection in saline aquifers in the United Arab Emirates, revealing CO2 migration pathways into the aquifers.
Despite these achievements, research on the Baijiahai Uplift in the Junggar Basin remains insufficient. Existing studies lack systematic insights into mineral reactions between CO2 and local formation minerals, as well as changes in reservoir physical properties before and after CO2 exposure in this region’s saline aquifers. In terms of storage potential evaluation, precise assessment models tailored to the unique geological conditions of the Baijiahai Uplift have not been established, and some geological parameters are obtained inaccurately or incompletely. Additionally, potential environmental impacts arising during long-term CO2 storage remain underexplored. Addressing these gaps, this study focuses on the saline aquifers of the Baijiahai Uplift, using a combination of physical experiments and numerical simulations to perform the following: (1) Clarify reservoir physical properties and mineral reactions before and after CO2 exposure. (2) Establish an appropriate evaluation model for CO2 storage potential in the region’s saline aquifers, calculate CO2 storage capacity, and assess storage potential. (3) Identify CO2 storage mechanisms and key controlling factors. (4) Optimize the selection of the best CO2 storage formation in the Baijiahai area.

2. Research Area

As illustrated in Figure 1, the Baijiahai area in the Junggar Basin of Xinjiang, China, presents an ideal reservoir for carbon capture, utilization, and storage (CCUS) technology. This suitability stems from its combined advantages in geological structure, reservoir characteristics, and existing oil and gas development infrastructure.
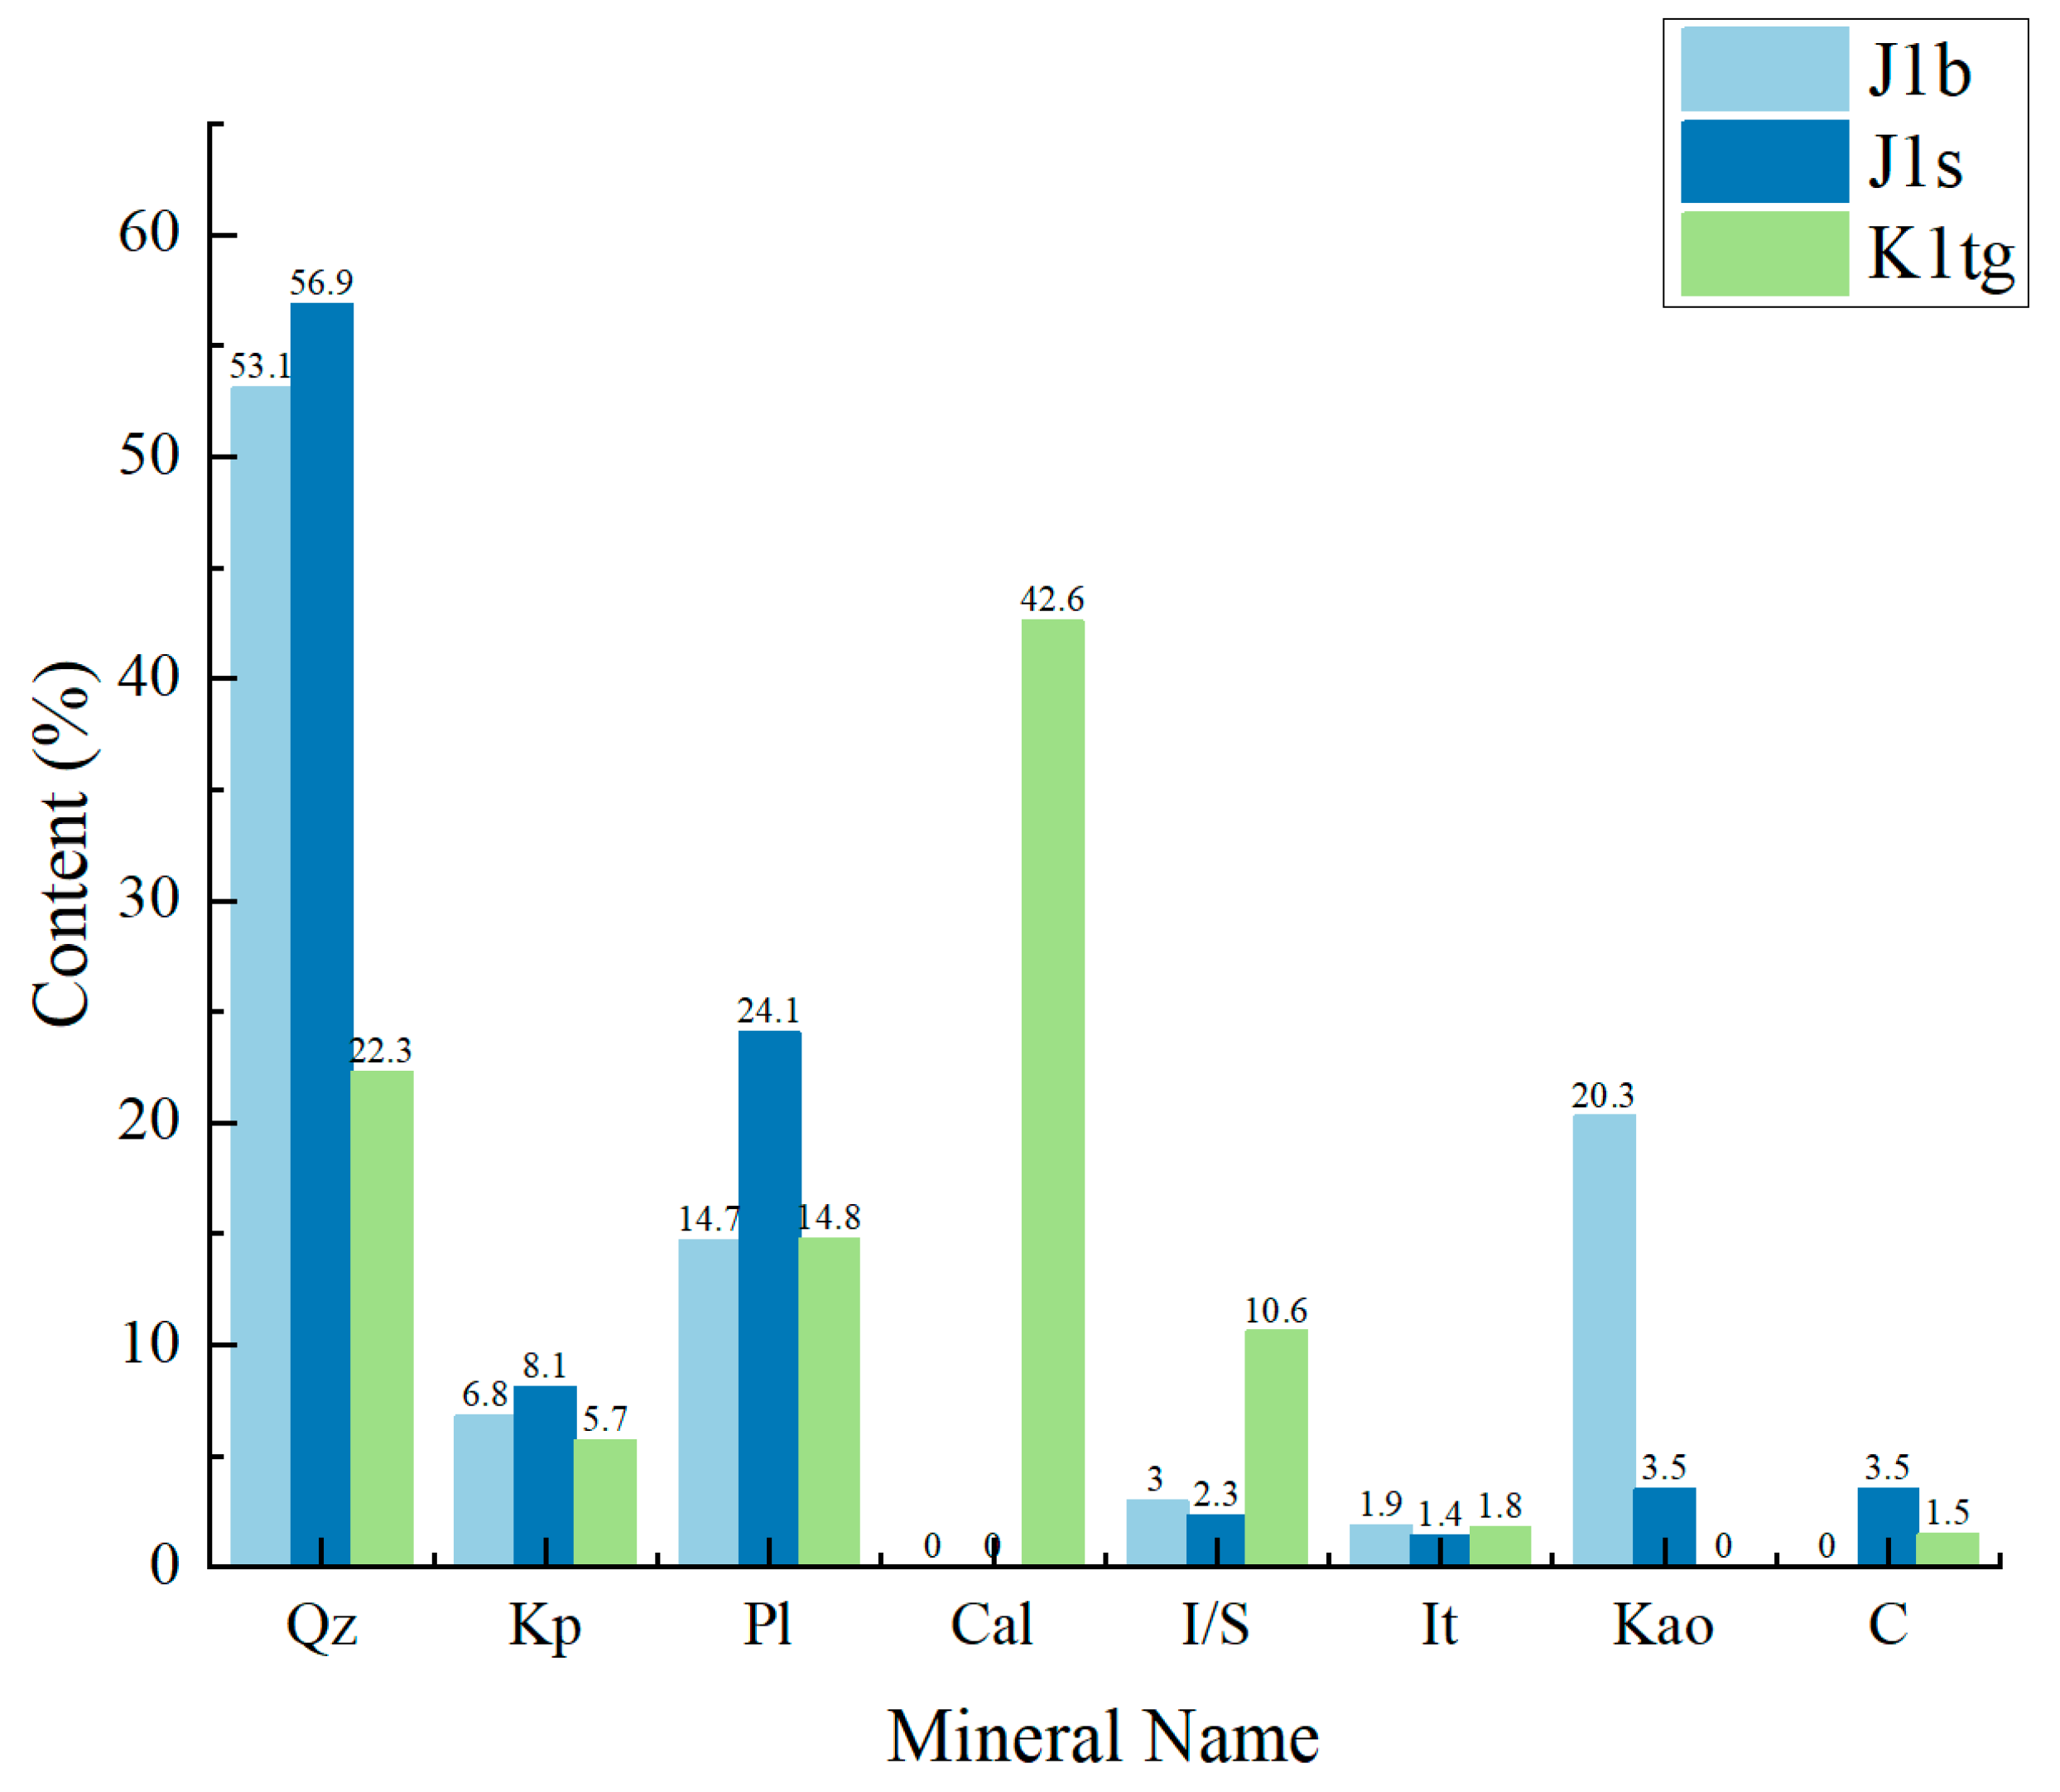
This study involved sampling, experimental work, and numerical simulations targeting three geological formations: the Jurassic Badaowan formation (J1b), Sangonghe formation (J1s), and Cretaceous Tugulu Group (K1tg). An offline (ex situ) dry measurement method based on the interaction of X-rays with solid matter was employed [34]. Three representative rock samples were selected from each formation for whole-rock and clay mineral composition analysis, with their average values taken as the typical mineral composition of the formation, as shown in Figure 2. The analysis revealed that the J1b formation is rich in quartz and clay minerals, with quartz accounting for 53.1%, clay minerals for 25.2%, plagioclase for 14.7%, and potassium feldspar for 6.8%, among which kaolinite is the main clay mineral. The J1s formation is mainly composed of quartz and plagioclase, with quartz content of 56.9%, plagioclase of 24.1%, potassium feldspar of 8.1%, and clay minerals of 10.9%, including kaolinite, illite–montmorillonite mixed layers, and chlorite. The K1tg formation is rich in calcite and quartz, with a calcite content of 42.6%, quartz of 22.3%, plagioclase of 14.8%, potassium feldspar of 5.7%, and clay minerals of 13.8%, with illite–montmorillonite mixed layers as the main clay minerals.

3. Research Method

3.1. Technical Roadmap

This study employs an integrated methodology combining laboratory experiments and numerical simulations, grounded in seepage mechanics, geochemistry, and multiphysics coupling theory, to investigate gas–water–rock interactions during CO2 injection in the Baijiahai area reservoirs. Physical simulation experiments and reaction mechanisms are examined through this approach, with the technical roadmap detailed in Figure 3.

3.2. Sample Preparation

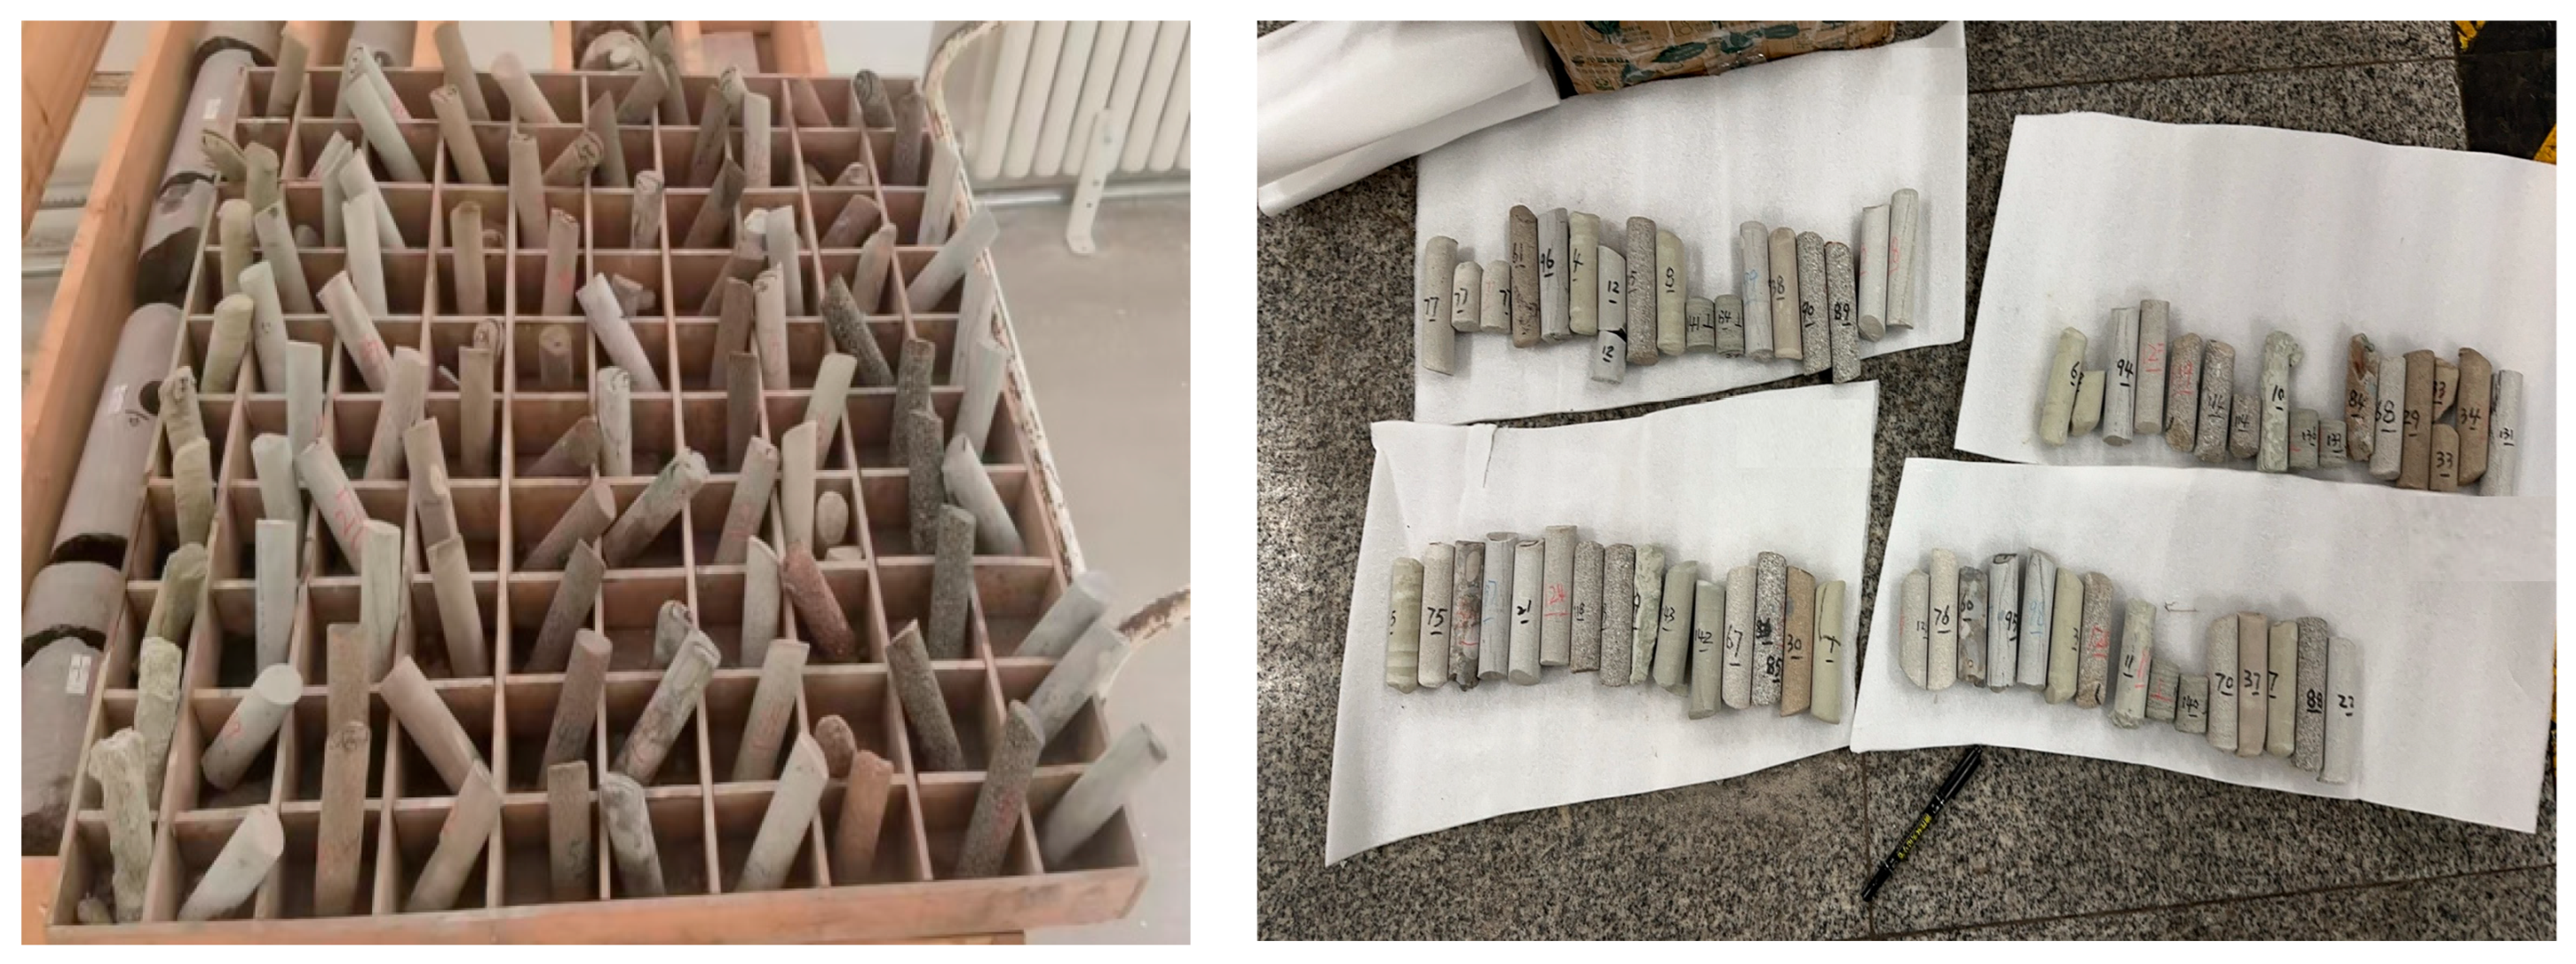
Core samples were taken from Well Shaqiu-3, Shaqiu-101, Shaqiu-103, Cai-002, and Cai-10 (K1tg, J1b, J1s formations), as shown in Figure 4. Formation water was prepared at a concentration of 12 g/L of KCl and 300 mg/L of Na2CO3, and an experimental plan was developed. The parameters set for each test are listed in Table 1.

3.3. CO2 Immersion and Displacement Experiments

To simulate the interaction between supercritical carbon dioxide (SC-CO2) and formation rock samples from J1s, J1b, and K1tg under reservoir conditions, self-developed high-temperature and high-pressure immersion experimental equipment was used to carry out SC-CO2 + formation water coupling immersion experiments. The specific procedure is as follows: First, place the rock samples in the glass container shown in Figure 5c, inject formation water, and perform vacuum saturation treatment. Remove the samples after 4–5 h. Then transfer the formation water-saturated rock samples to the intermediate container shown in Figure 5a (adopting a 316 L stainless steel piston structure with a volume of 500 mL, pressure resistance of 70 MPa, and equipped with a fluor rubber sealing ring). Supply gas from the CO2 gas cylinder in Figure 5b and conduct immersion experiments at a constant temperature of 40 °C for different durations. After the experiments, remove the samples and dry them in an oven at 85 °C for 12 h.
Displacement experiments were used to evaluate the CO2 storage capacity of the 3 formations. In the experiments, the displacement parameters for J1s rock samples were set as follows: injection pressure of 12 MPa, confining pressure of 14 MPa, outlet pressure of 11.5 MPa, and temperature of 40 °C. For J1b and K1tg rock samples, a parameter combination of an injection pressure of 24 MPa, confining pressure of 26 MPa, outlet pressure of 23.5 MPa, and temperature of 40 °C was adopted, and the experiments were carried out using a displacement holder equipped with a back-pressure regulator (in Figure 5d). The experimental steps include the following: First, saturating the rock samples with formation water; second, measuring the porosity and wet weight of the saturated rock samples; finally, displacing with CO2 and recording the changes in porosity and weight after displacement.

3.4. MICP, NMR, and Mechanical Testing

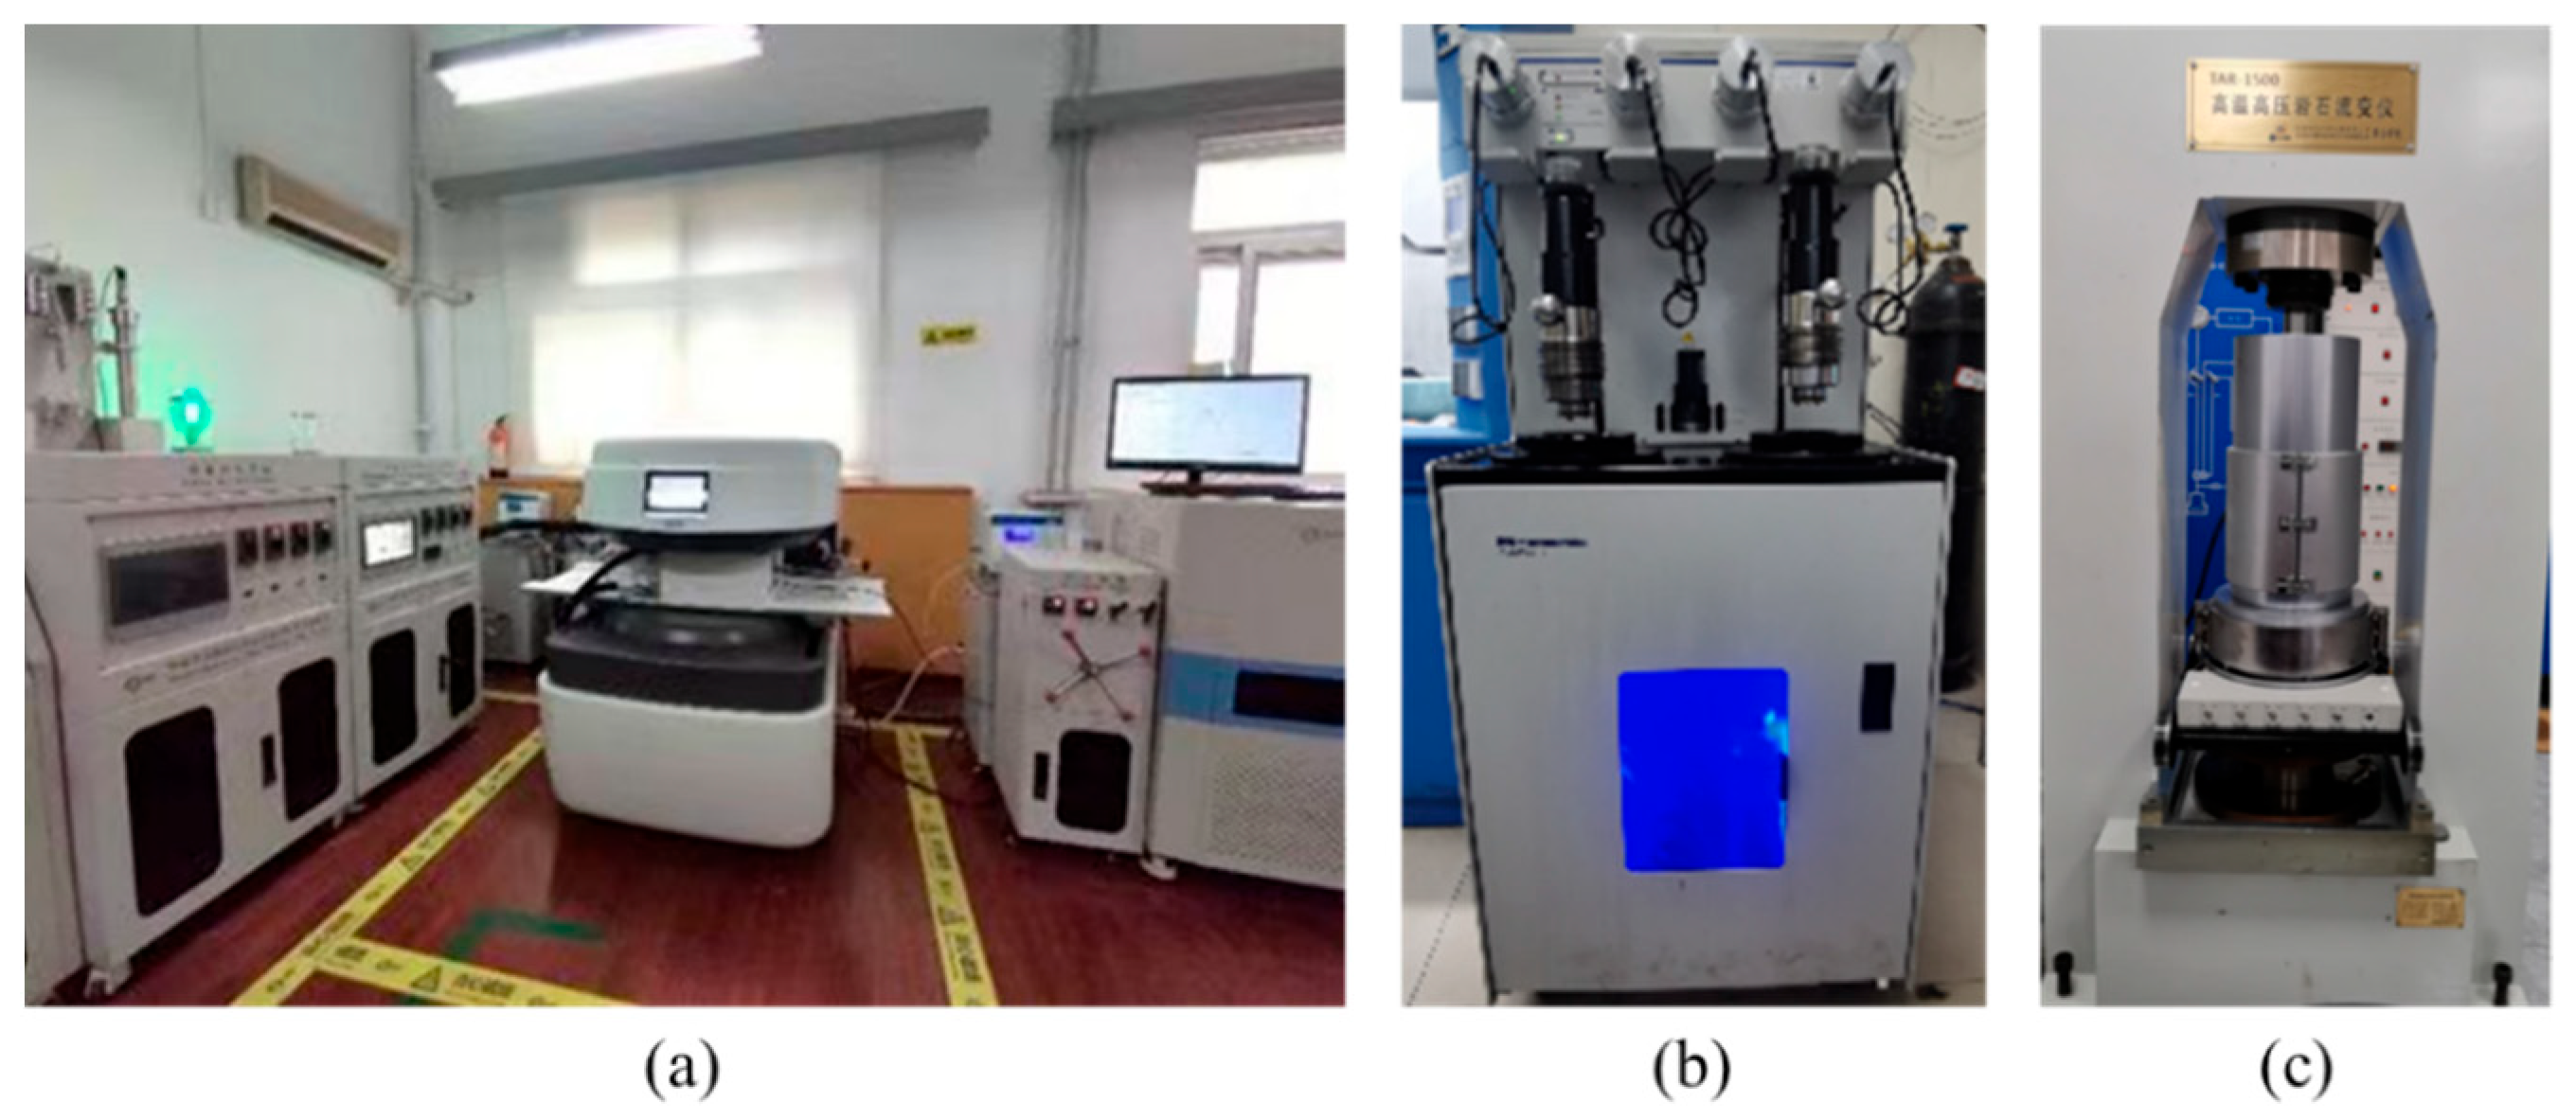
Mercury intrusion testing provides fundamental pore-throat structure data for analyzing reservoir storage capacity and studying CO2 migration patterns. During the test, samples before and after immersion are fixed by a holder, and the American Micromeritics AutoPore IV-9500 fully automated mercury porosimeter (as shown in Figure 6b) is used. The displacement pressure range is set to 0.014–0.301 MPa. The uncertainties in MICP interpretation primarily arise from the following aspects: contact angle, mercury wettability, pore connectivity, compression effects, sample representativeness, and hysteresis effects. To mitigate these uncertainties, we have adopted standardized procedures by implementing the National Standards of the People’s Republic of China—GB/T 29172-2012 [35] “Core Analysis Methods” and GB/T 29171-2012 “Determination of Rock Capillary Pressure Curves”. This ensures relatively consistent experimental conditions and reduces errors. Additionally, we alleviate these uncertainties through replicate experiments and maintaining consistency throughout the entire pre-treatment process.
NMR testing is conducted using the NMRC12-010V Cryogenic Nano-Porosity Analyzer and Supra22k Centrifuge, designed and constructed by SuZhou Niumag Analytcal instrument Corporation (Suzhou, China). It provides a comprehensive characterization of reservoir pore structure and pore size distribution, offering essential technical support for optimizing CO2 injection strategies. The procedure is as follows: The core is first cleaned to remove residual oil, then dried in an oven for 24 h until a constant weight is achieved. Its dry weight, length, and diameter are recorded. The core is subsequently vacuum-saturated with formation water for more than 4 h and weighed again to obtain its wet weight. NMR T2 spectrum measurements are conducted using the equipment shown in Figure 6a. Following the displacement experiment, a second NMR T2 spectrum test is performed. By comparing the T2 spectra before and after displacement, the T2 cutoff value for movable fluids can be determined.
Mechanical testing serves as a critical tool for assessing reservoir stability. Determining the mechanical strength and deformation behavior of reservoir rocks enables an evaluation of the risks associated with fracture initiation, deformation, subsidence, and stress sensitivity following CO2 injection. These assessments provide essential evidence for evaluating the safety and long-term effectiveness of geological CO2 storage. In this study, triaxial mechanical tests were conducted on samples before and after CO2 exposure using the hydraulic servo testing system TAR-1500, designed and constructed by Changchun Huiyang Co. Ltd. (Changchun, China) as shown in Figure 6c, including uniaxial tensile and shear strength tests, to systematically investigate the mechanical response of the reservoir rocks under simulated subsurface conditions.

4. Experimental Results

4.1. NMR Tests Before and After Displacement

4.1.1. Nuclear Magnetic Resonance Results

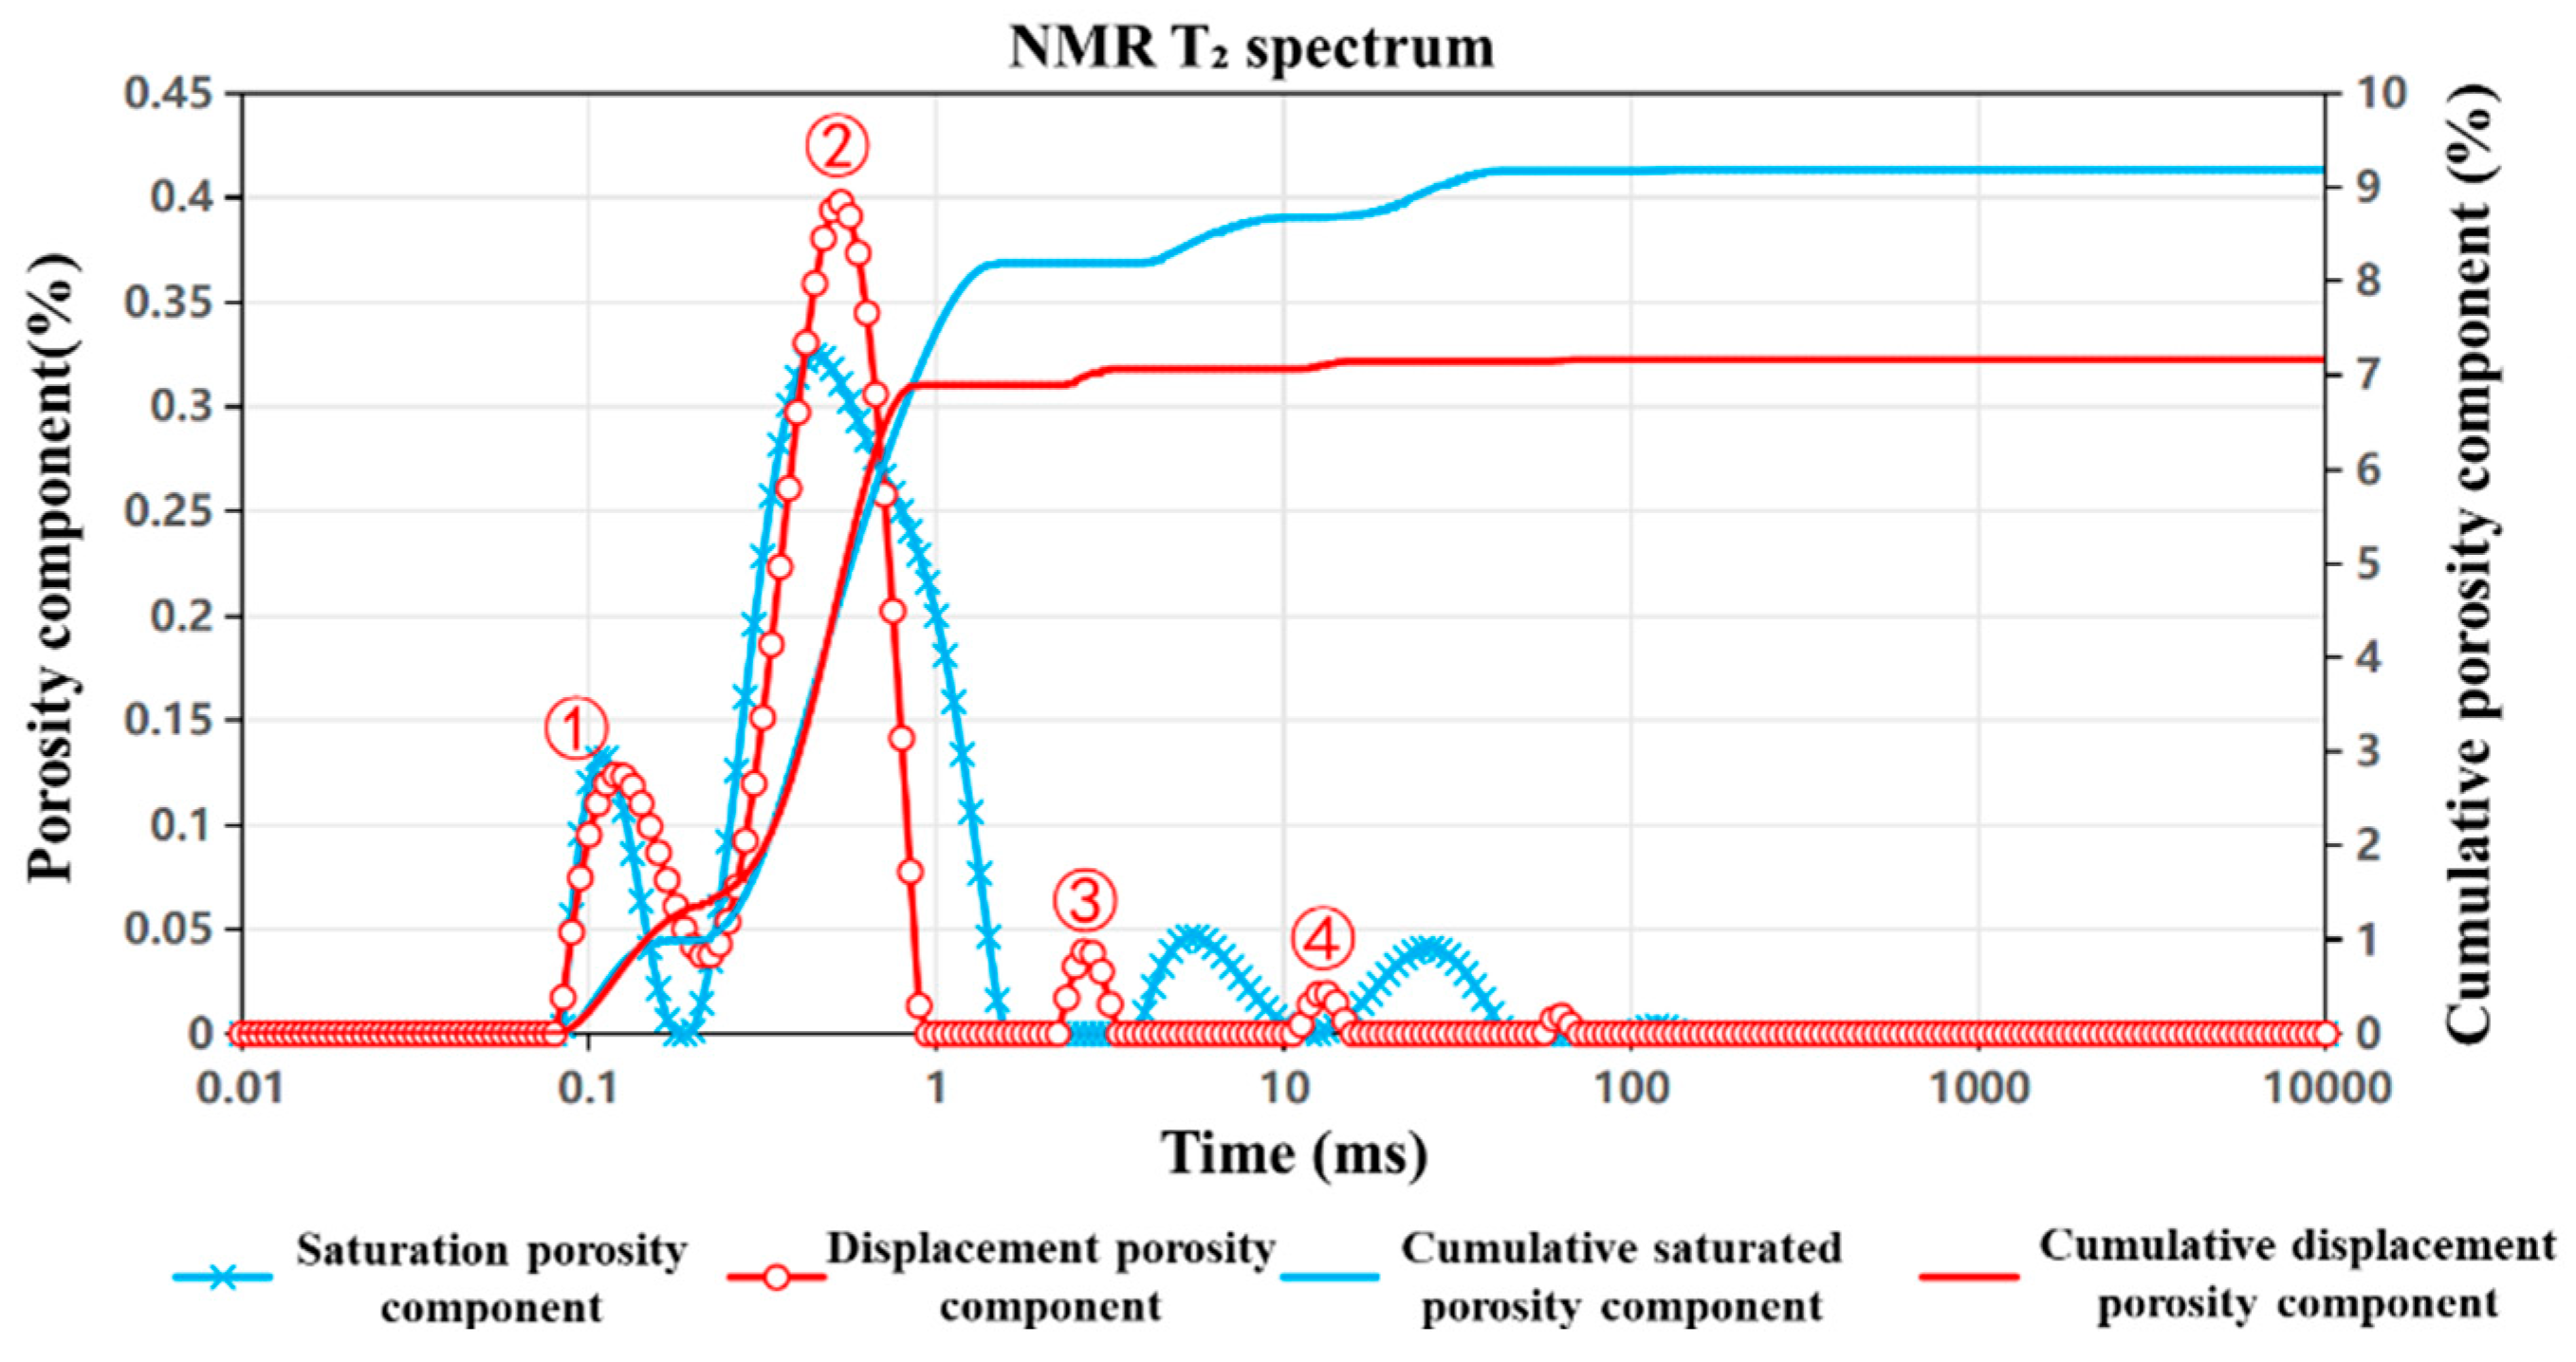
Figure 7, Figure 8 and Figure 9 present the nuclear magnetic resonance (NMR) T2 spectrum curves of the J1s, J1b, and K1tg formations, respectively, measured before and after 24 h of CO2 displacement. By analyzing the morphological evolution of the T2 spectra, the shifts in characteristic peaks, and the differences in cumulative porosity pre- and post-displacement, the influence of CO2 injection on pore structure—including pore size distribution and connectivity—as well as fluid occurrence states, was quantitatively characterized. The extent of porosity reduction directly reflects the storage effect, offering an intuitive measure of CO2 sequestration efficiency. These analyses provide critical multi-scale insights into the CO2–brine–rock interaction mechanisms and highlight formation-specific differences in storage performance. The detailed interpretation is as follows:
For the J1s formation (Figure 7), the T2 distribution curve (red) shifts toward the intermediate relaxation time region following displacement, indicating a trend toward pore structure homogenization. This suggests that the displacement process enhances the uniformity of pore size distribution and improves overall fluid connectivity. NMR measurements yield a T2 cutoff value of 53.6 ms. Porosity decreases slightly from 14.3% prior to displacement to 13.1% afterward, with a cumulative porosity separation of 1.2%, reflecting a modest CO2 storage effect. Characteristic peak analysis reveals the following:
(1)
Within the 0.1–1 ms interval, both the number and size of Peak ① (small pores) decrease.
(2)
Peak ② (small-to-medium pores) shows a reduction in number but an increase in size.
(3)
In the 1–10 ms interval, Peaks ③ and ④ (medium pores) display a significant increase in number.
(4)
In the 10–100 ms range, Peak ⑤ (medium-to-large pores) decreases in number while its size remains largely unchanged, and Peak ⑥ (large pores) exhibits an increase in pore size.
The mineralogical composition of the J1s formation is dominated by silicates, which are chemically stable and exhibit minimal reactivity with the acidic environment generated by CO2–brine interaction. As a result, the displacement process primarily affects the movable fluid (brine) within pre-existing large pore channels. Minor enhancements in connectivity are observed in microfractures and smaller pores, contributing to a more uniform pore network, with only limited reductions in overall movable porosity.
These results suggest that CO2 injection in the J1s formation induces a redistribution of pore fluids and a moderate reorganization of the pore structure. The observed increase in medium-pore content and the homogenization of the pore system may enhance short-term injectivity and fluid mobility. However, due to the relatively small increase in cumulative porosity and the reduction in small-pore volume, the formation’s long-term CO2 storage capacity remains limited.
For the J1b formation (Figure 8), the T2 distribution curve (red) exhibits a distinct shift toward the shorter relaxation time region (<1 ms) following displacement, with residual signal intensity concentrated within the ultra-small-pore domain. This shift reflects a notable increase in the abundance of micropores and an overall reduction in effective pore size, accompanied by the structural reconfiguration of previously dominant macropore networks. NMR measurements reveal a T2 cutoff value of 58.9 ms, with porosity declining markedly from 21.2% pre-displacement to 12.8% post-displacement. The cumulative porosity separation difference reaches 8.4%, representing the highest among all tested formations and suggesting a pronounced CO2 trapping capacity. Detailed T2 spectral analysis indicates the following trends:
(1)
In the 0.01–1 ms range, the intensity of Peak ① (small pores) increases, though the corresponding pore sizes diminish.
(2)
Peak ② (small-to-medium pores) retains a stable amplitude while shifting toward smaller sizes.
(3)
Within the 1–10 ms range, Peak ③ (small-to-medium pores) exhibits increased amplitude, while Peak ④ (medium pores) remains largely unchanged in both size and number.
(4)
In the 10–100 ms range, Peak ⑤ (medium-to-large pores)—representing the principal pore-throat domain for CO2 storage—undergoes a significant decline in amplitude with stable size, whereas Peak ⑥ (large pores) shows a slight increase in pore size.
The elevated clay mineral content of the J1b formation plays a pivotal role in this pore structure evolution. Under acidic CO2–brine conditions, clay minerals are prone to swelling, exfoliation, or precipitation, which may partially obstruct macropores. Simultaneously, the disaggregation of clay aggregates can generate a substantial number of micro- and nano-scale pores and microfractures. These processes, coupled with clay particle migration and secondary cementation, result in the reconfiguration of original intergranular pores and fractures, promoting a transition from macroporous to microporous systems. Consequently, bound water becomes the dominant fluid phase post-displacement.
Collectively, the NMR results indicate that CO2 injection induces a substantial redistribution of pore size within the J1b formation, characterized by a marked increase in micropore populations and the restructuring of macropore pathways. The significant cumulative porosity separation (8.4%) underscores the superior CO2 sequestration potential of the J1b formation, primarily through enhanced capillary trapping facilitated by newly generated microporous structures.
For the K1tg formation (Figure 9), the T2 distribution curve (red) concentrates around Peak ② (representing small-to-medium pores) after displacement, indicating that the displacement process primarily affects large pores, while bound water in smaller pores remains relatively unchanged. NMR testing shows that porosity decreases from 9.2% before displacement to 7.2% after displacement, with a cumulative porosity separation difference of 2%, suggesting a moderate CO2 storage effect. Characteristic peak analysis reveals the following:
(1)
In the 0.01–1 ms range, there is no significant change in Peak ① (small pores).
(2)
The number of Peak ② (small-to-medium pores) increases, although their size remains constant.
(3)
In the 1–10 ms range, the amplitude of Peak ③ (medium pores) decreases.
(4)
In the 10–100 ms range, both the amplitude and size of Peak ④ (large pores) decrease.
These findings confirm that CO2 injection predominantly displaces fluids in larger pores, while smaller pores retain their bound water content.
In K1tg, calcite is easily dissolved by acidic CO2–water, forming new mesopores approximately 1 μm in size, leading to an increase in the peak area within the 0.1–1 ms interval. Meanwhile, fluids in larger pores (10–100 ms interval) are preferentially displaced, causing a decrease in this peak. However, due to the structural stability of the carbonate framework, some large pores are still preserved.

4.1.2. Displacement Results

Through displacement experiments, the process of supercritical CO2 injection into saline aquifers under realistic geological conditions was simulated. By precisely measuring the mass of rock samples in key states—dry, saturated with formation water, and after CO2 displacement—the amount of CO2 stored in formation pore spaces (by displacing pore water and occupying its volume) was directly and quantitatively calculated. This approach provides the most direct experimental evidence for evaluating the actual storage capacity of different reservoirs. The experimental results are as follows:
The dry mass of the J1s sample was 52.9 g, which increased to 56.51 g after saturation with formation water, and decreased to 56.04 g after CO2 displacement, indicating a CO2 storage amount of 0.47 g. The J1b sample had a dry mass of 51.1 g, a saturated mass of 56.44 g, and a post-displacement mass of 53.98 g, corresponding to a CO2 storage amount of 2.46 g. The K1tg sample had a dry mass of 60.5 g, increased to 62.8 g after saturation, and decreased to 62.08 g after displacement, resulting in a CO2 storage amount of 0.72 g.
These results clearly demonstrate that the J1b formation sample exhibits the highest CO2 storage capacity among the formations tested.

4.2. Mercury Injection Test

Displacement experiments simulate the actual migration process of CO2 in reservoirs, enabling the quantification of CO2 storage capacities in different formations and revealing the dynamic interaction mechanisms between CO2, formation fluids, and rock pore structures. The results form a closed-loop data system with mercury intrusion testing and NMR testing—changes in pore-throat radius reflected by capillary pressure curves (e.g., the maximum pore-throat radius of J1s increasing from 25 μm to 40 μm) directly explain the phenomenon of permeability leap after displacement (from 204.1 mD to 1665.5 mD), while improvements in pore-throat sorting (e.g., the median pore-throat radius of J1b increasing from 0.183 μm to 0.406 μm) and post-displacement porosity changes (e.g., J1b decreasing from 21.2% to 12.8%) jointly confirm the contributions of capillary trapping and mineral reactions to storage efficiency. Additionally, the T2 cutoff value of movable fluids recorded in displacement experiments (e.g., 53.6 ms for J1s), combined with mercury intrusion saturation from capillary pressure curves (e.g., J1s increasing from 91.85% to 92.78%), further quantifies the occurrence states of CO2 in different pore size intervals, providing critical measured data for parameter calibration in multi-field coupling models of numerical simulations. The results of mercury intrusion experiments are as follows:
After a 24 h immersion at 40 °C, in Figure 10, the permeability of J1s increased from 204.1 mD to 1665.5 mD, porosity rose from 20.8% to 21.5%, the median pore-throat radius increased from 2.214 μm to 5.757 μm, and the maximum mercury saturation increased from 91.85% to 92.78%. With permeability enhanced by over seven times and a 160% increase in the median pore-throat radius, the results indicate significant enlargement of throat sizes and greatly improved seepage capacity after immersion. However, the low overall porosity and extremely small median pore-throat radius limit its suitability as an optimal reservoir for CCUS applications.
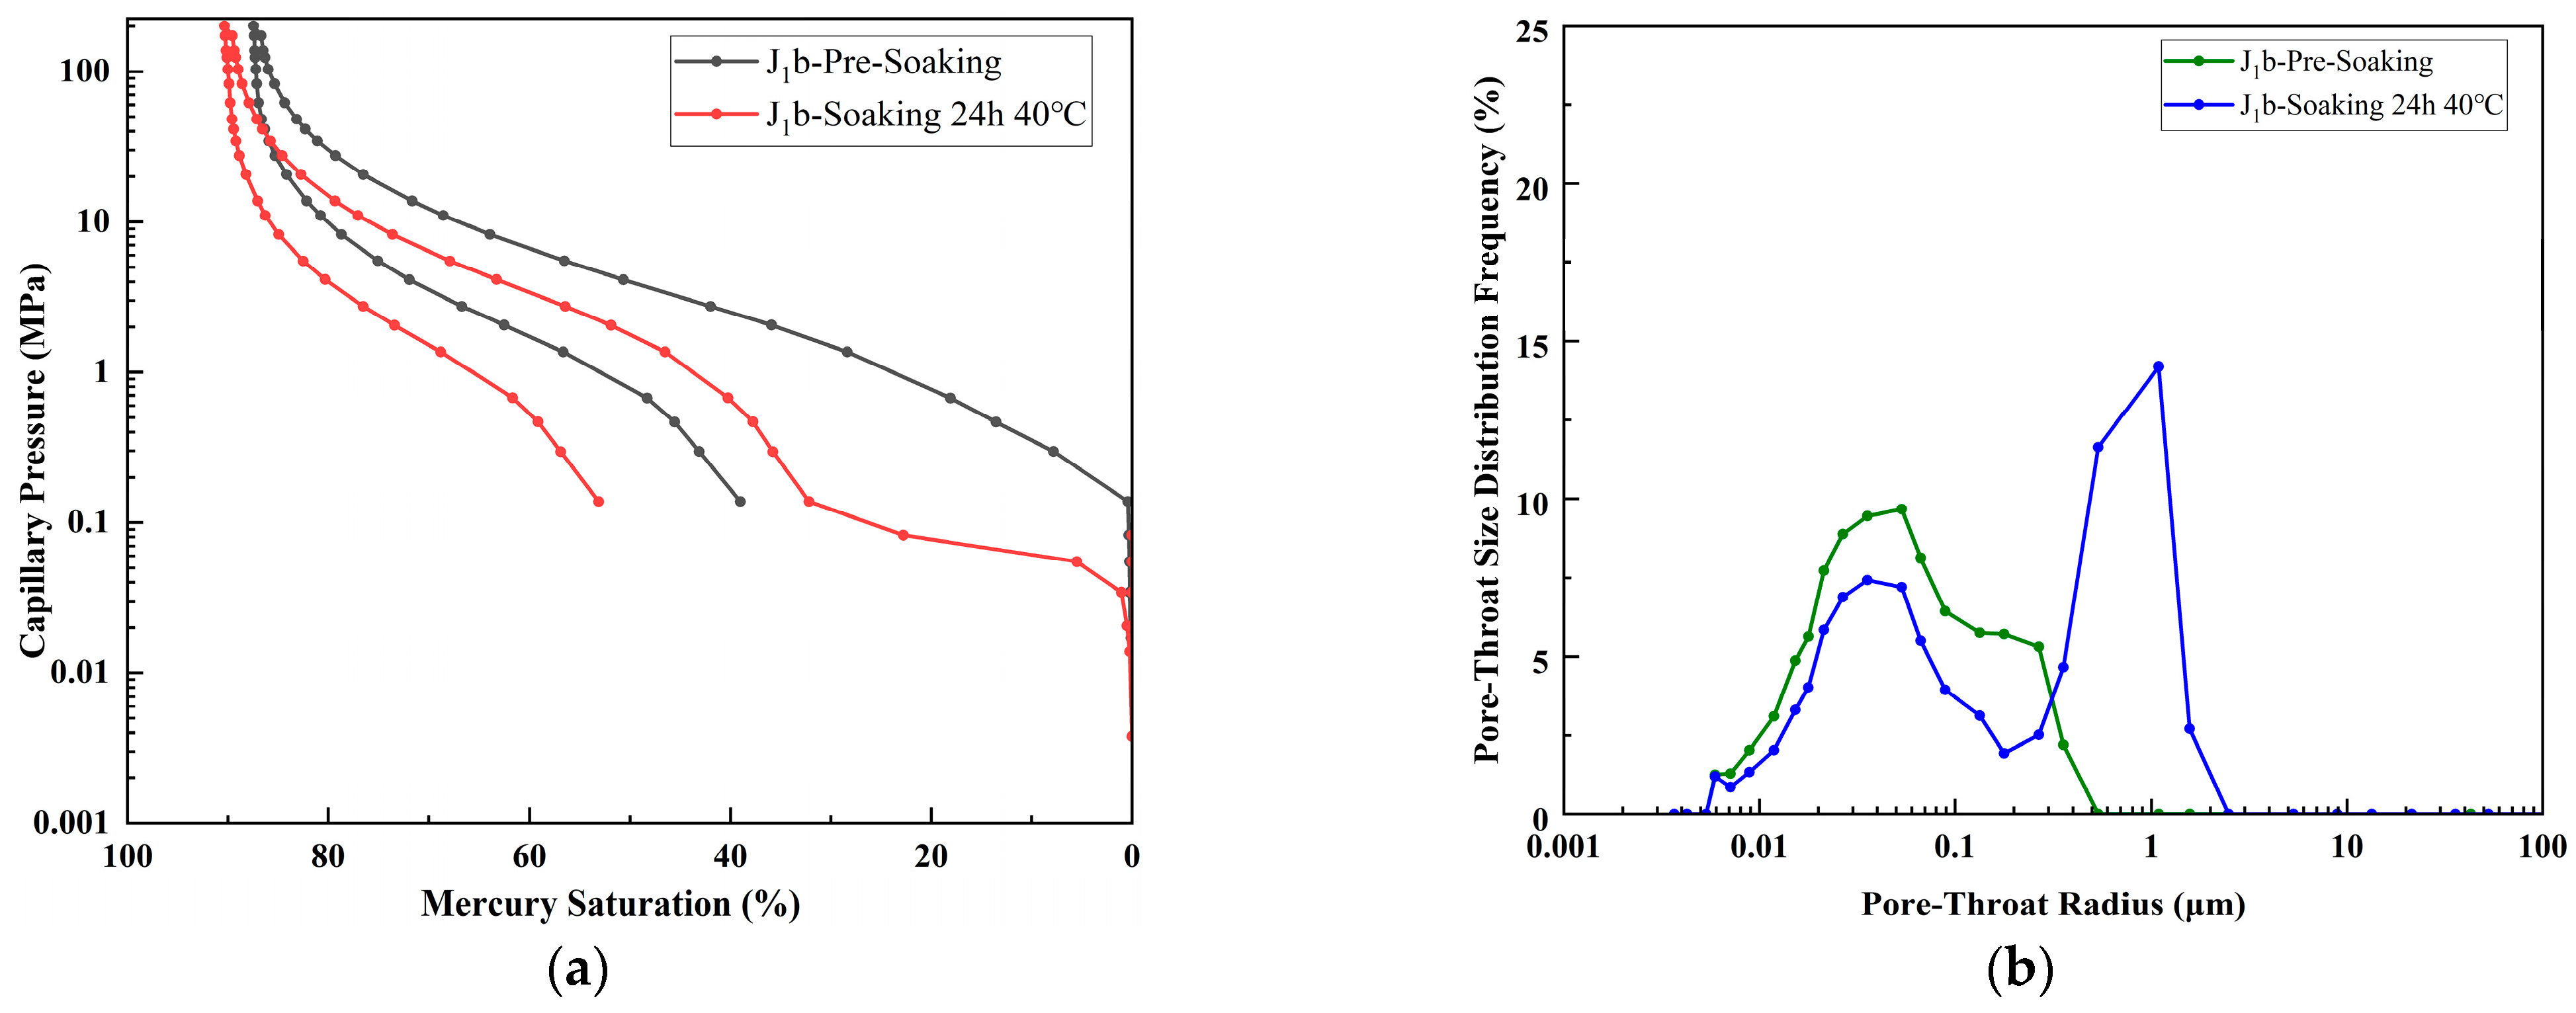
For J1b in Figure 11, immersion at 40 °C for 24 h caused permeability to increase from 13.140 mD to 110.757 mD, porosity to rise from 26.559% to 29.947%, the median pore-throat radius to increase from 0.183 μm to 0.406 μm, and the maximum mercury saturation to increase from 87.437% to 90.323%. The enlarged pore-throat radius, improved sorting, and enhanced connectivity—with the pore-throat radius doubled—confirm the development of microfractures or dissolution of clay minerals, which significantly eliminated seepage bottlenecks and caused a 743% surge in permeability. These changes marked an enlargement of pore throats, improved sorting, and enhanced connectivity, confirming the development of microfractures and/or the dissolution of clay minerals, effectively removing seepage bottlenecks. Such physicochemical modifications significantly boost the seepage capacity and suggest greatly improved injectivity and storage performance for CO2 sequestration in the J1b reservoir.
For K1tg in Figure 12, immersion at 40 °C for 24 h led to an increase in permeability from 3.901 mD to 7.777 mD, porosity from 21.486% to 23.429%, the median pore-throat radius from 0.058 μm to 0.159 μm, and the maximum mercury saturation from 85.971% to 88.039%. Despite a 174% increase in the pore-throat radius, the absolute value of 0.159 μm remained extremely small, resulting in slow permeability growth and moderate mercury saturation changes, with pore enlargement primarily occurring in small-to-medium pores. However, the absolute throat size remains very small, so permeability enhancement is limited, and pore accessibility improvements are modest. The mechanical properties are relatively stable.

4.3. The Evolution Law of Mechanical Characteristics

Stress–strain curves of J1s, J1b, and K1tg formations obtained from uniaxial compressive tests after CO2 immersion for 24 h and 48 h at 40 °C are shown in Figure 13 and Figure 14. The results indicate that as the CO2 immersion time extends from 24 h to 48 h, the curves shift entirely toward the low-stress region, with the strain-softening stage prolonged and its shape tending to flatten. Specifically, the peak stress decreases, reflecting the decay of the rock samples’ compressive strength; the residual strain increases, indicating a significant enhancement in plastic deformation capacity. This phenomenon reveals the time-dependent degradation effect of CO2–water–rock interaction on the mechanical properties of reservoir rocks. Regarding wellbore stability, the shear strength of the J1s formation plummets by 20.57% within 24 to 48 h, making the cement sheath highly susceptible to early-stage shear failure and increasing the risk of annular channeling. The J1b formation exhibits delayed deterioration, with a 10.95% reduction in shear strength between 48 and 60 h. Long-term CO2 penetration may dissolve cementitious materials, potentially inducing interfacial micro-annuli. In contrast, the K1tg formation maintains stable shear strength, showing only a 2.63% decrease. Concerning caprock integrity, the J1s formation presents a high risk of brittle failure, where the caprock is prone to sudden fracturing under pressure fluctuations. The enhanced plasticity of the J1b formation reduces its fracture-closing capacity, lowering the CO2 breakthrough pressure threshold by 15–20%. Although the K1tg formation retains stable strength, stiffness loss still compromises its fracture resistance. The time-dependent mechanical degradation induced by CO2–rock interaction is fundamentally a chemical–mechanical coupling process. The brittle deterioration of J1s necessitates precautions against short-term wellbore integrity failure, while the plastic transformation of J1b poses the greatest threat to the long-term sealing capacity of the caprock.
Figure 15 presents the load–strain curves of the J1s, J1b, and K1tg formations obtained from uniaxial shear tests conducted after 24 h, 48 h, and 60 h of CO2 immersion at 40 °C. The results indicate that with increasing CO2 exposure time, the entire curves progressively shift toward the lower-load region, and the peak load values exhibit a consistent downward trend. This behavior reflects a gradual reduction in rock shear strength under prolonged CO2 interaction. A strong positive correlation is observed between immersion duration and the extent of shear strength degradation, highlighting the continuous weakening effect of CO2–brine–rock chemical interactions on the mechanical integrity of reservoir rocks. These findings underscore the importance of considering time-dependent geochemical weakening in evaluating the long-term mechanical stability of CO2 storage formations.

4.3.1. Uniaxial Compressive Strength Test

Prior to immersion, the J1s formation exhibited an elastic modulus of 37.778 GPa, a Poisson’s ratio of 0.211, and a compressive strength of 222.173 MPa. After immersion at 40 °C for 24 h, the elastic modulus slightly increased to 38.296 GPa, Poisson’s ratio decreased marginally to 0.206, and compressive strength declined to 210.608 MPa. Specifically, the compressive strength experienced a reduction of 11.565 MPa (a 5.20% decrease), the elastic modulus increased by 0.518 GPa (a 1.37% rise), and Poisson’s ratio decreased by 0.005 (a 2.37% decline). These results indicate that immersion had a negligible impact on the elastic modulus and Poisson’s ratio of the J1s samples, suggesting stable elastic behavior and preserved structural rigidity. However, the notable decrease in compressive strength (5.2% reduction) implies that chemical interactions or physical degradation mechanisms induced by CO2 exposure have compromised the rock’s resistance to mechanical damage.
Prior to immersion, the K1tg formation exhibited an elastic modulus of 11.714 GPa, a Poisson’s ratio of 0.230, and a compressive strength of 127.643 MPa. After immersion at 40 °C for 24 h, the elastic modulus decreased to 10.500 GPa, Poisson’s ratio declined to 0.218, and compressive strength reduced to 124.281 MPa. Specifically, the compressive strength decreased by 3.362 MPa (a 2.63% reduction), the elastic modulus declined by 1.214 GPa (a 10.36% reduction), and Poisson’s ratio decreased by 0.012 (a 5.22% reduction). Despite the relatively pronounced reductions in the elastic modulus and Poisson’s ratio, the modest decrease in compressive strength suggests that the K1tg formation maintains comparatively robust mechanical properties, retaining substantial structural integrity and resilience against external loading conditions.

4.3.2. Uniaxial Shear Resistance Test

After 24 h of immersion, the failure load of J1s was 39.348 kN, decreasing to 31.256 kN after 48 h and 27.743 kN after 60 h. While the failure load decreases over time, the rate of change decays from 20.57% (8.092 kN) to 11.24% (3.513 kN), indicating that the mechanical properties of the formation degrade more drastically from 24 to 48 h, with the decline in failure load slowing over time. The most significant drop occurred from 24 to 48 h, with a decrease of 8.092 kN (20.57%), while the decline from 48 to 60 h slowed significantly to 3.513 kN (11.24%). This “fast–slow” decay trend suggests that the mechanical properties of J1s rock samples are rapidly weakened in the early stage of CO2 action, but the loss of structural stability slows as the reaction approaches saturation.
For J1b, the failure load was 28.394 kN after 24 h of immersion, 27.595 kN after 48 h, and 24.573 kN after 60 h. The load decreased by 0.799 kN from 24 to 48 h and by 3.022 kN from 48 to 60 h, with the rate of change increasing from 2.81% to 10.95%—opposite to the trend in J1s. The failure load remained nearly stable from 24 to 48 h, decreasing by only 0.799 kN (2.81%), but dropped significantly by 3.022 kN (10.95%) from 48 to 60 h, indicating that degradation is minimal in the early stage but accelerates as the CO2 immersion reaction progresses. This suggests that the J1b formation may exhibit an illusion of apparent stability in the early stage of storage, but long-term stability risks increase, necessitating enhanced dynamic monitoring and pressure control in the post-injection phase.
For K1tg, the failure load after 24 h CO2 immersion was 57.303 kN, decreasing to 48.656 kN after 48 h and 43.555 kN after 60 h. The load reduction measured 8.647 kN (24 h→48 h) and 5.101 kN (48 h→60 h), with the degradation rate declining from 15.09% to 10.48%. In contrast, K1tg formation exhibited an inverse trend: the failure load remained relatively stable during 24–48 h, with only a 0.799 kN reduction (2.81%), but showed significant deterioration of 3.022 kN (10.95%) during 48–60 h. This indicates negligible initial degradation but accelerated mechanical property attenuation as CO2 dissolution reactions progressed. These results suggest that the K1tg reservoir may demonstrate apparent short-term stability during early sequestration phases, while long-term stability risks increase substantially. Therefore, enhanced dynamic monitoring and pressure control during late-stage injection are recommended.

4.3.3. Geochemical Alterations Coupling with Geomechanical Properties

The J1s formation manifests the preferential dissolution of silicate minerals, weakening the rock framework. Its high quartz content (56.9%) combined with plagioclase (24.1%) forms a rigid structure. Upon the CO2 dissolution generating carbonic acid, plagioclase undergoes hydrolysis reactions, leading to dissolution at mineral contact points. The abrupt decline in intergranular cementation strength triggers microfracture propagation along quartz–feldspar interfaces. This is reflected in a 20.57% plummet in shear strength within 24 h, posing short-term risks of wellbore shear failure.
The J1b formation exhibits clay mineral interlayer expansion and phase transformation, driving ductile transition. Swelling within clay mineral interlayers causes its Poisson’s ratio to increase by 4.46% and elastic modulus to decrease by 11.27% after 48 h, promoting a brittle-to-ductile transformation. By 60 h, shear strength attenuation accelerates to 10.95%, resulting in a 15–20% reduction in a caprock breakthrough pressure threshold.
The K1tg formation demonstrates suppressed structural damage through a dynamic carbonate dissolution–reprecipitation equilibrium. Calcite (42.6%) preferentially reacts with CO2 to form soluble Ca(HCO3)2, while partial Ca2+ reprecipitates to seal pores. The low expansibility of illite–montmorillonite mixed-layer clay minimizes internal stress. Consequently, after 60 h of immersion, compressive strength declines by only 2.63%, shear strength attenuation stabilizes around 10%, and mechanical degradation remains the slowest.

5. Simulation Results

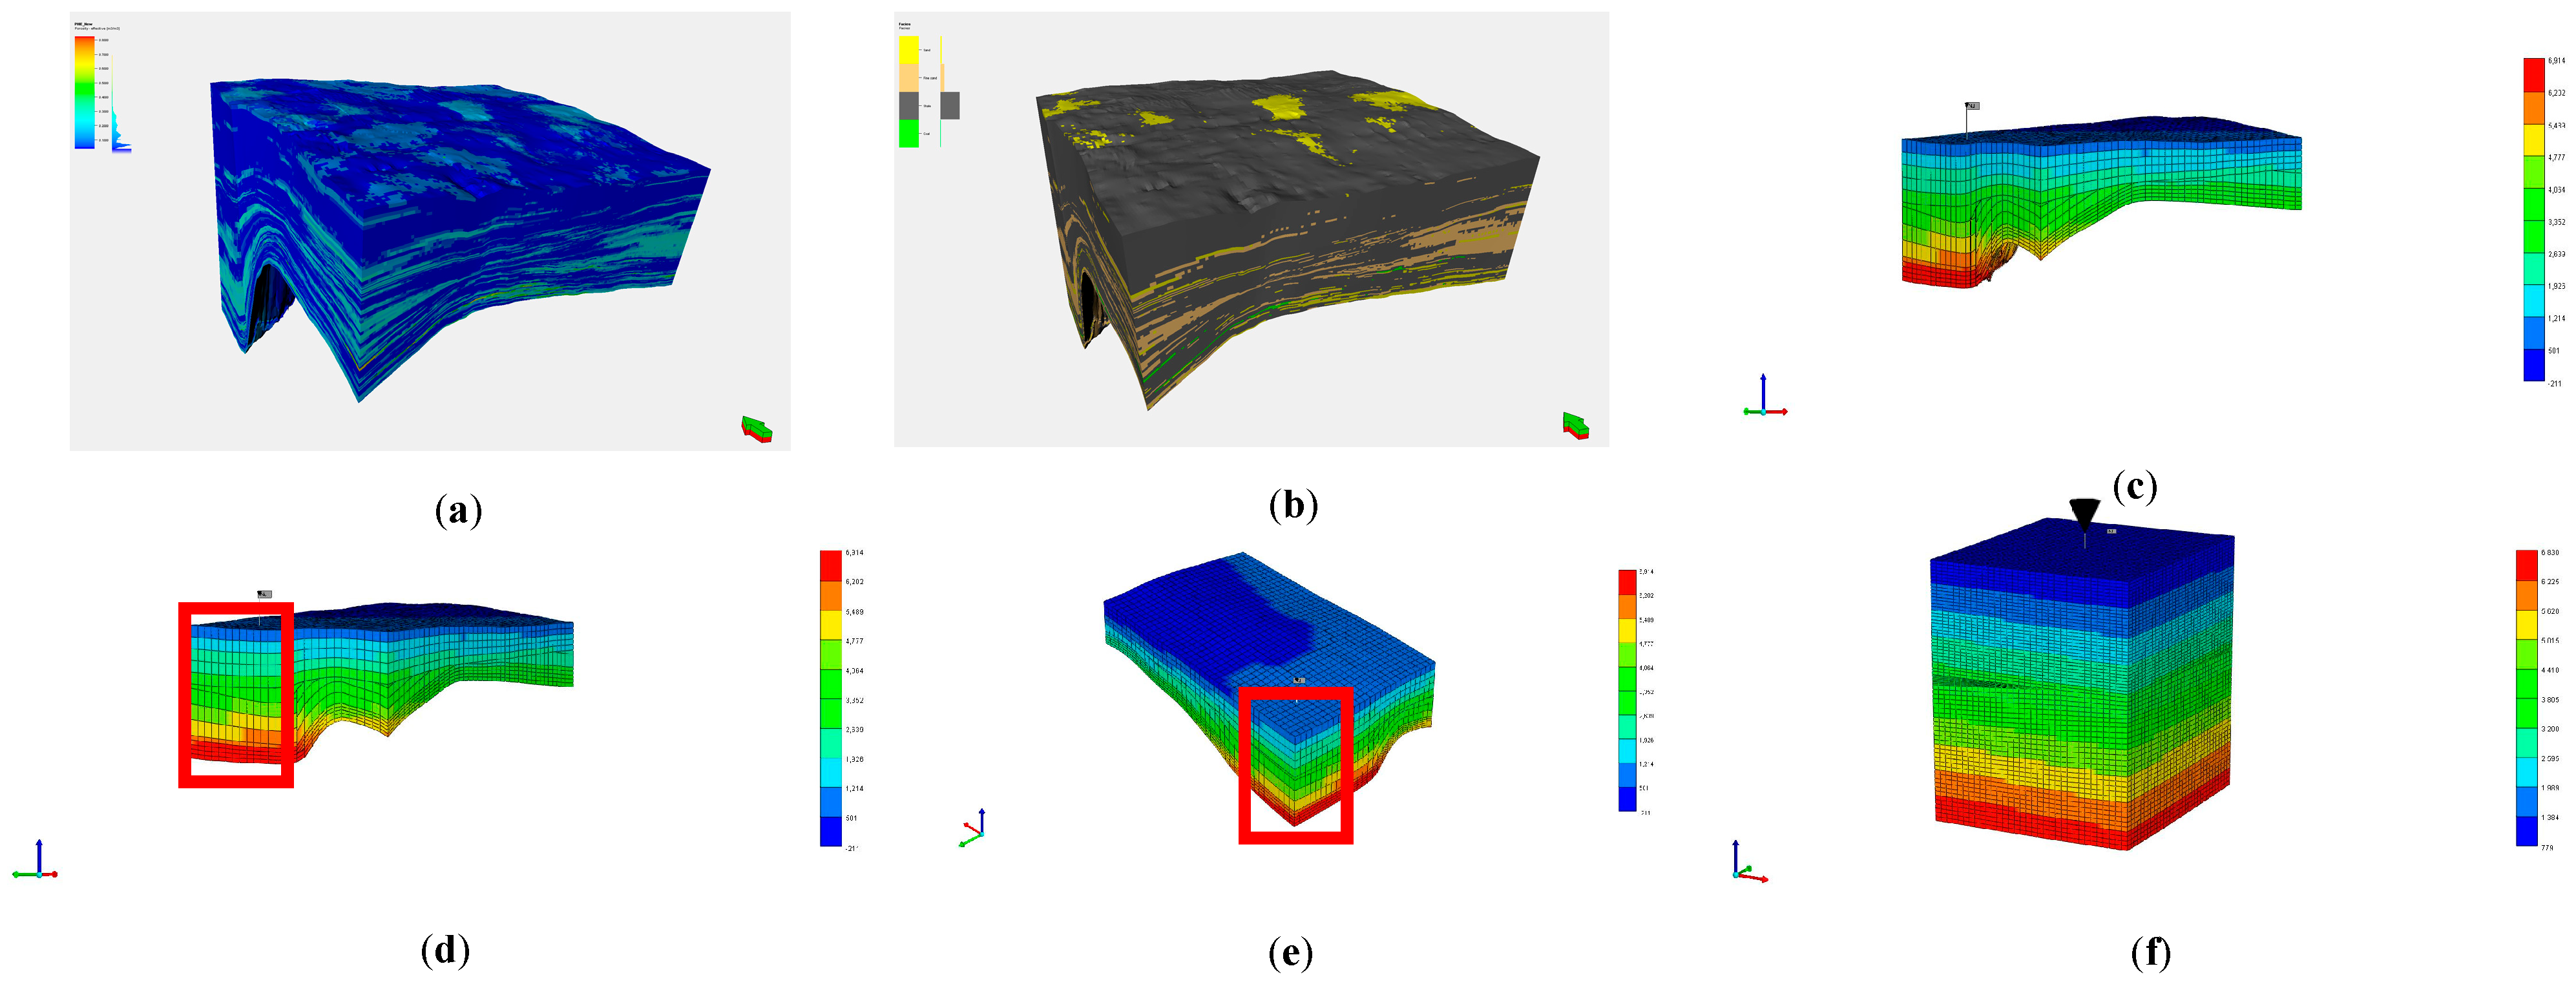
Numerical simulations are based on the Petrel geological models of the J1b, J1s, and K1tg formations in the Baijiahai area, as shown in Figure 16a,b. The model spans 18,000 m horizontally, 14,000 m longitudinally, and 2600 m vertically. The Petrel geological models of the J1b, J1s, and K1tg formations in the Baijiahai area were imported into the CMG numerical simulation software, and the initial physical property conditions of the models were set as shown in Figure 16c. To more intuitively observe the migration of injected CO2 in the formation, the blocks shown in Figure 16d,e were selected for refinement. The selected area spans 1340 m in the I direction, 1340 m in the J direction, and 2600 m in the K direction. The Edit Grid function in Reservoir was used to refine the selected area, with the I and J directions refined 11 times and the K direction refined 7 times. The model has 33, 33, and 66 grid cells in the I, J, and K directions, respectively, totaling 71,874 grids (excluding faults), as shown in Figure 16f.
We added the experimental gas–water relative permeability curves for the three formations obtained from laboratory tests into CMG, as shown in Figure 17.
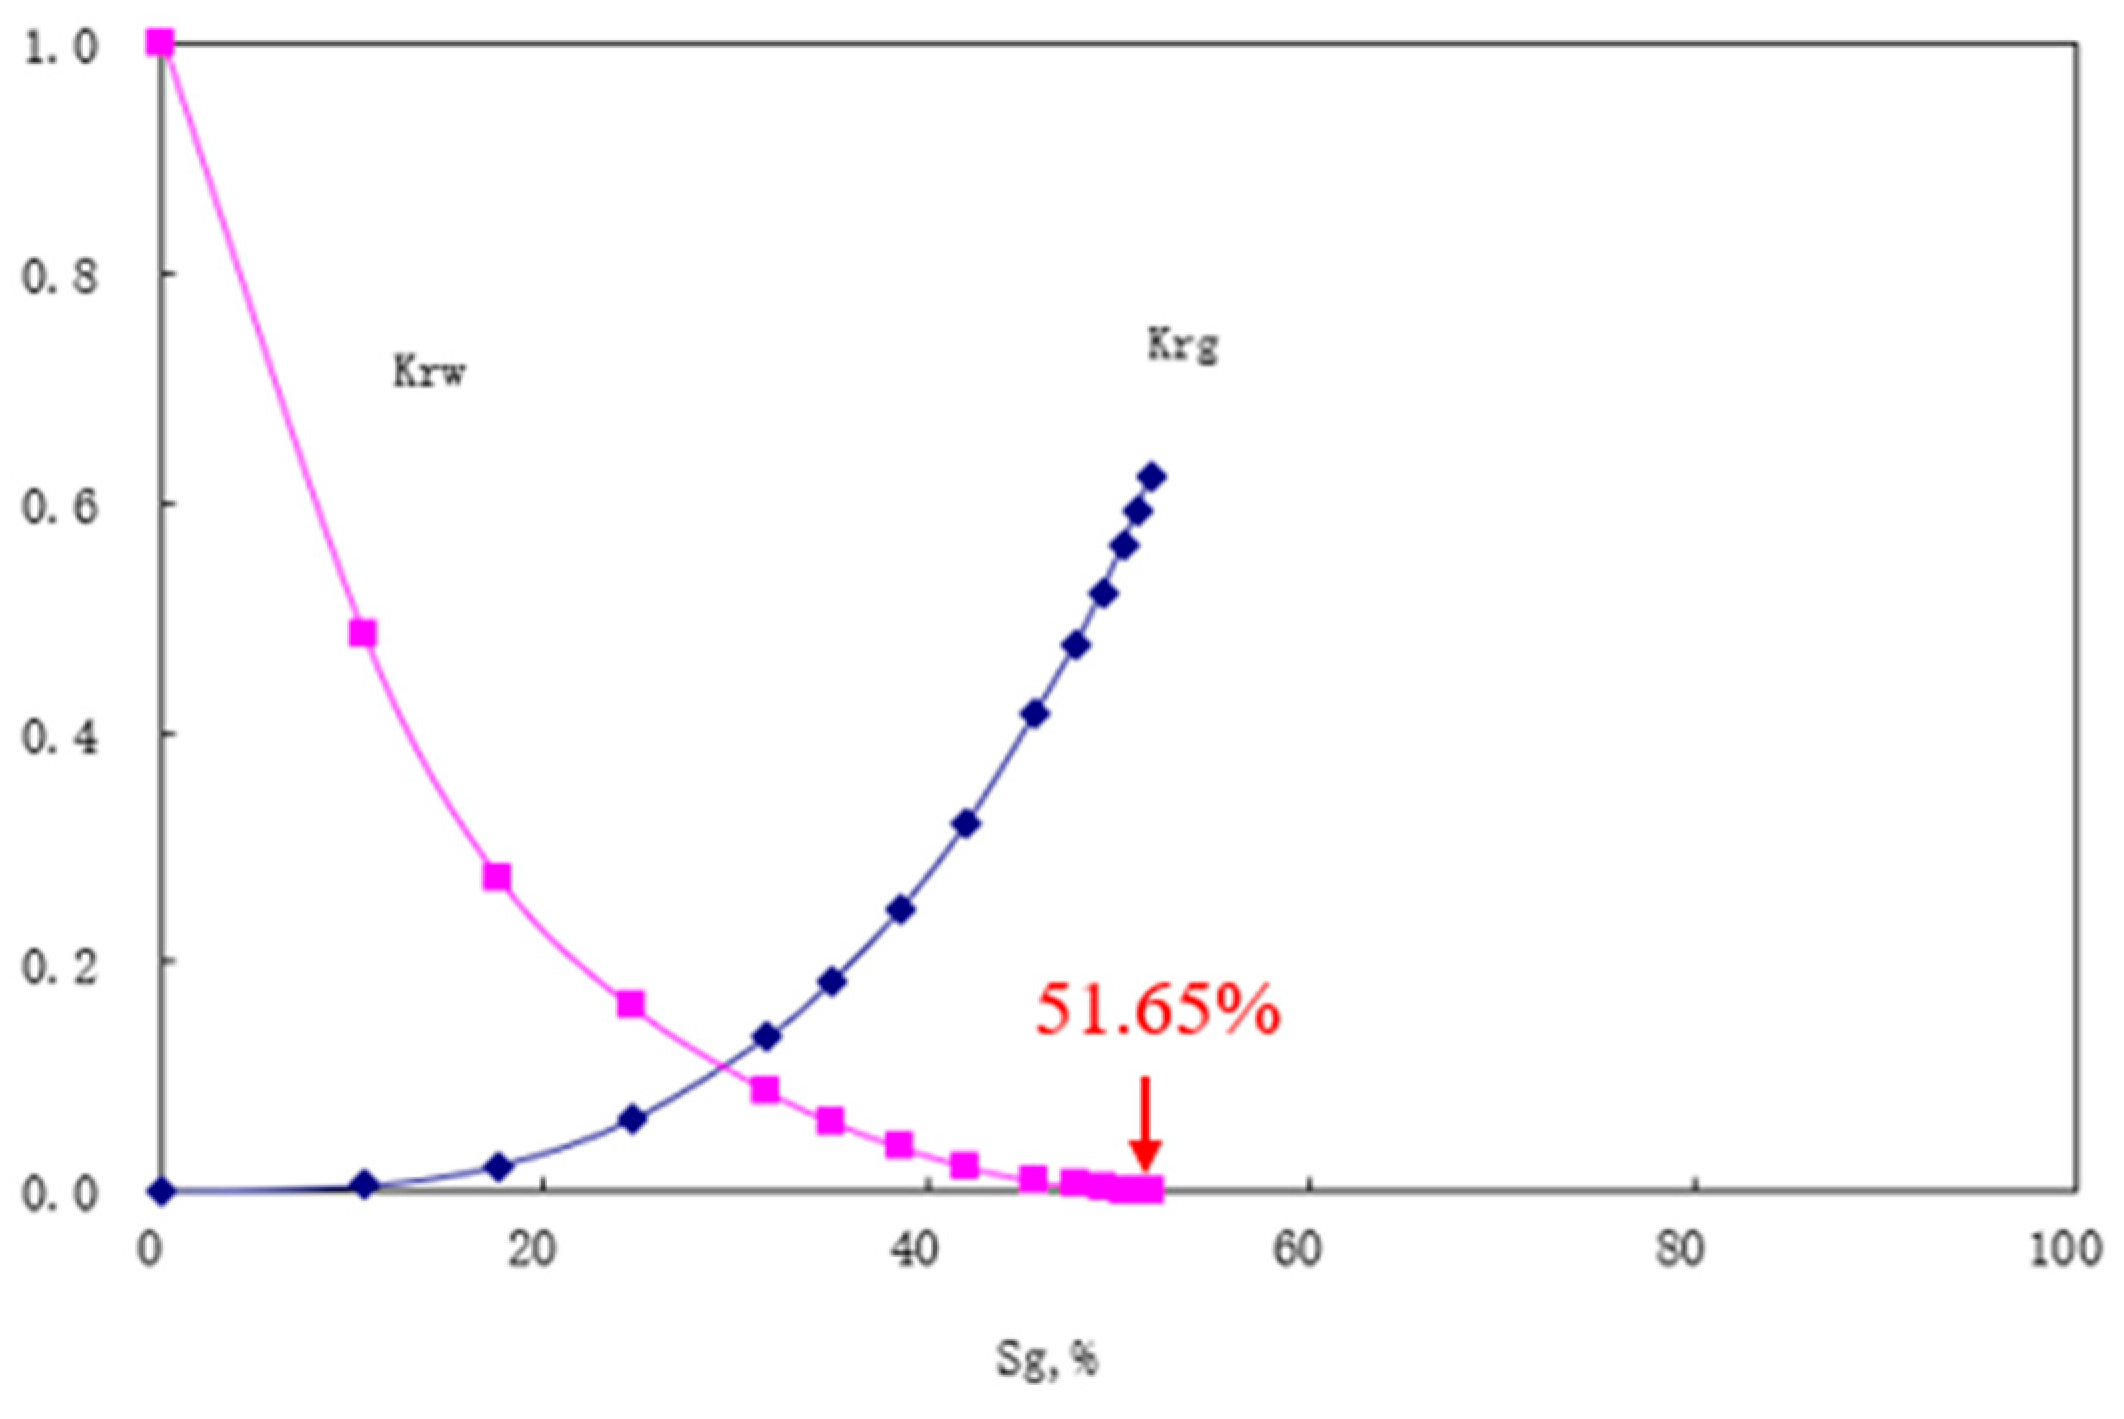
Taking the J1b formation as an example, the J1b core sample was utilized to establish an idealized model for the numerical simulation of the CO2 flooding process with left-side injection and right-side production; configuring parameters according to Table 2, the gas–water relative permeability curves demonstrate that gas relative permeability reaches zero at a gas saturation of 51.65%, equivalent to a critical gas saturation of 51.65% in Figure 18. When these relative permeability curves were incorporated into the numerical simulation verification case, the resulting storage coefficient was approximately 54.9%. Compared with the 51.65% derived from the relative permeability curves in Figure 19, this represents a 93.98% consistency rate.
In the CCS module, the Land model was selected, and the maximum residual gas saturation calculated from the mercury intrusion test data in physical experiments was input into maximum residual gas saturation. After CO2 enters the formation, it dissolves in water, generating CO32− and HCO3−, which react with formation rocks such as anorthite, kaolinite, and calcite. The following chemical equations were added to the mineralization reaction module in CCS:
CO2 + H2O ↔ H+ + HCO3
H+ + OH ↔ H2O
CO32− + H+ ↔ HCO3
Calcite (CaCO3) + H+ ↔ Ca2+ + HCO3
Kaolinite (Al2Si2O5(OH)4) + 6H+ ↔ 5H2O + 2SiO2 + 2Al3+
Anorthite (CaAl2Si2O8) + 8H+ ↔ 4H2O + Ca2+ + 2SiO2 + 2Al3+
Injection wells are, respectively, set in the J1s, J1b, and K1tg formations. The simulation conditions are as follows: the simulation time starts on 1 January 2000, with CO2 injection lasting for 25 years. After the 25-year injection period, the wells are shut in, and the entire simulation continues for 100 years.
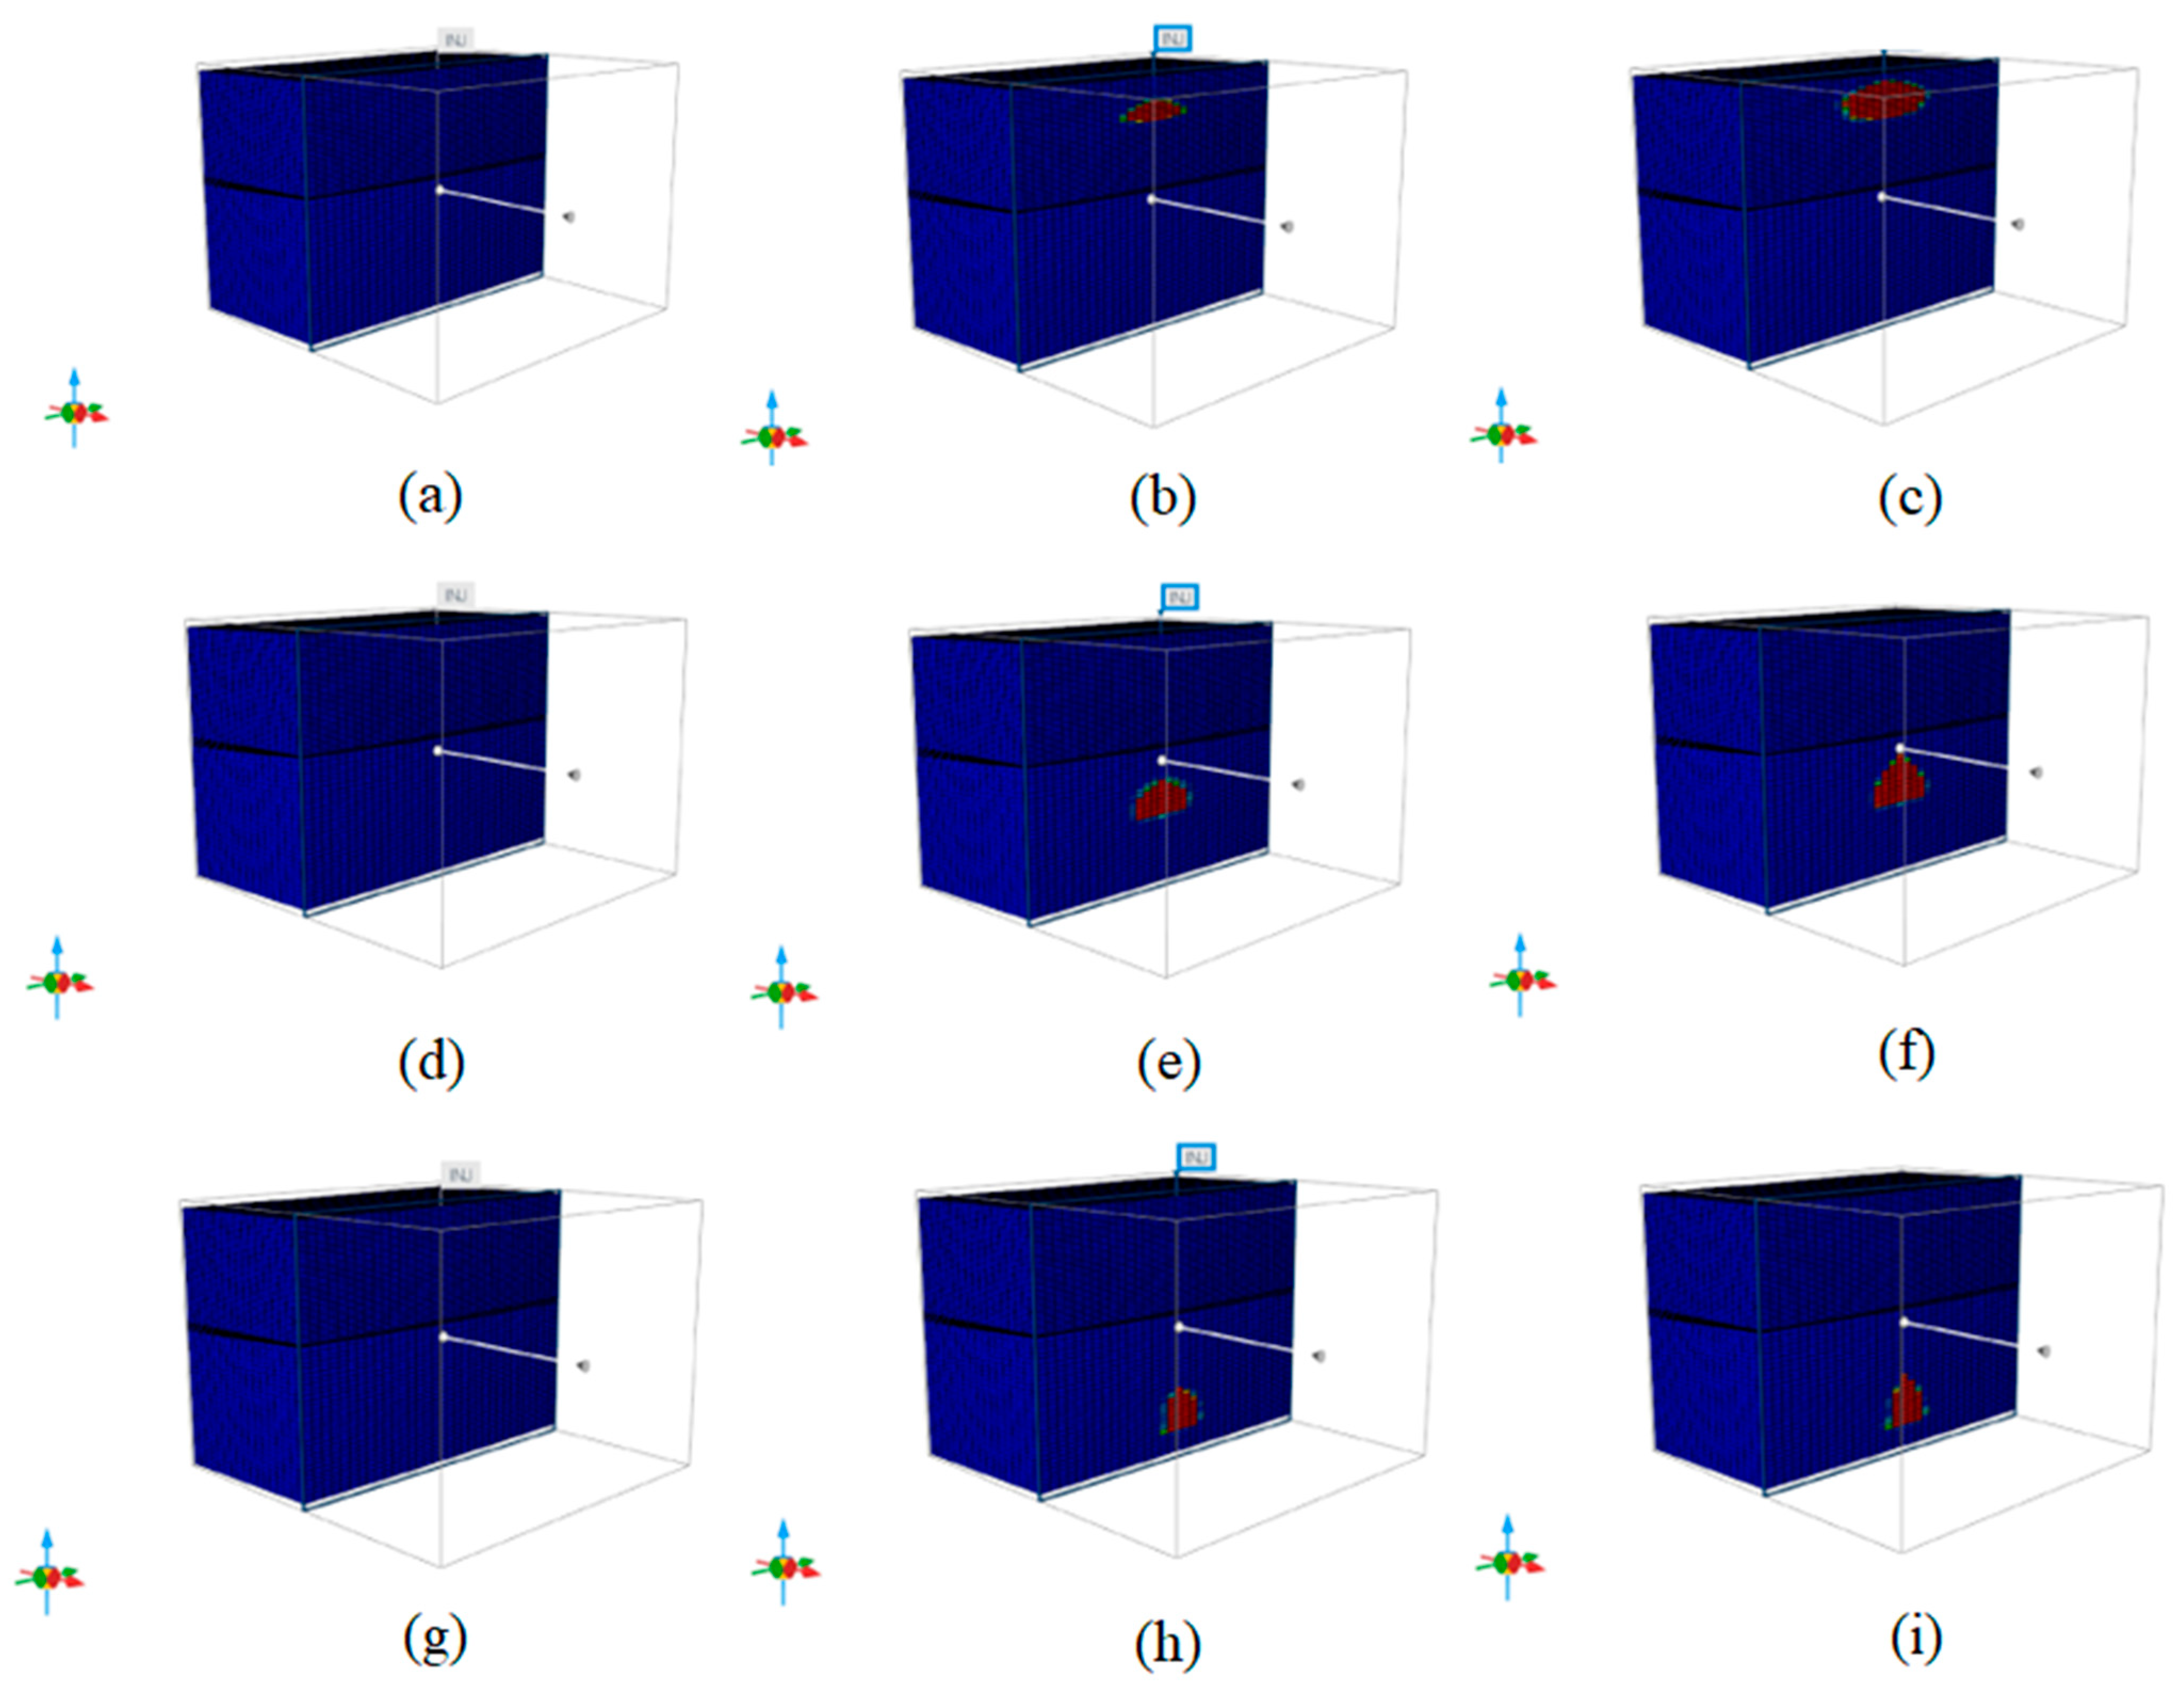
As shown in Figure 20a–i, the CO2 migration in the K1tg, J1s, and J1b formations is depicted at the initial state, after 25 years, and after 100 years. Upon CO2 injection, the gas diffuses radially in the formation during the injection phase. After shutting in the injection wells, CO2 primarily migrates vertically, with a greater migration volume in the vertical direction than in the horizontal direction, gradually forming a triangular shape.
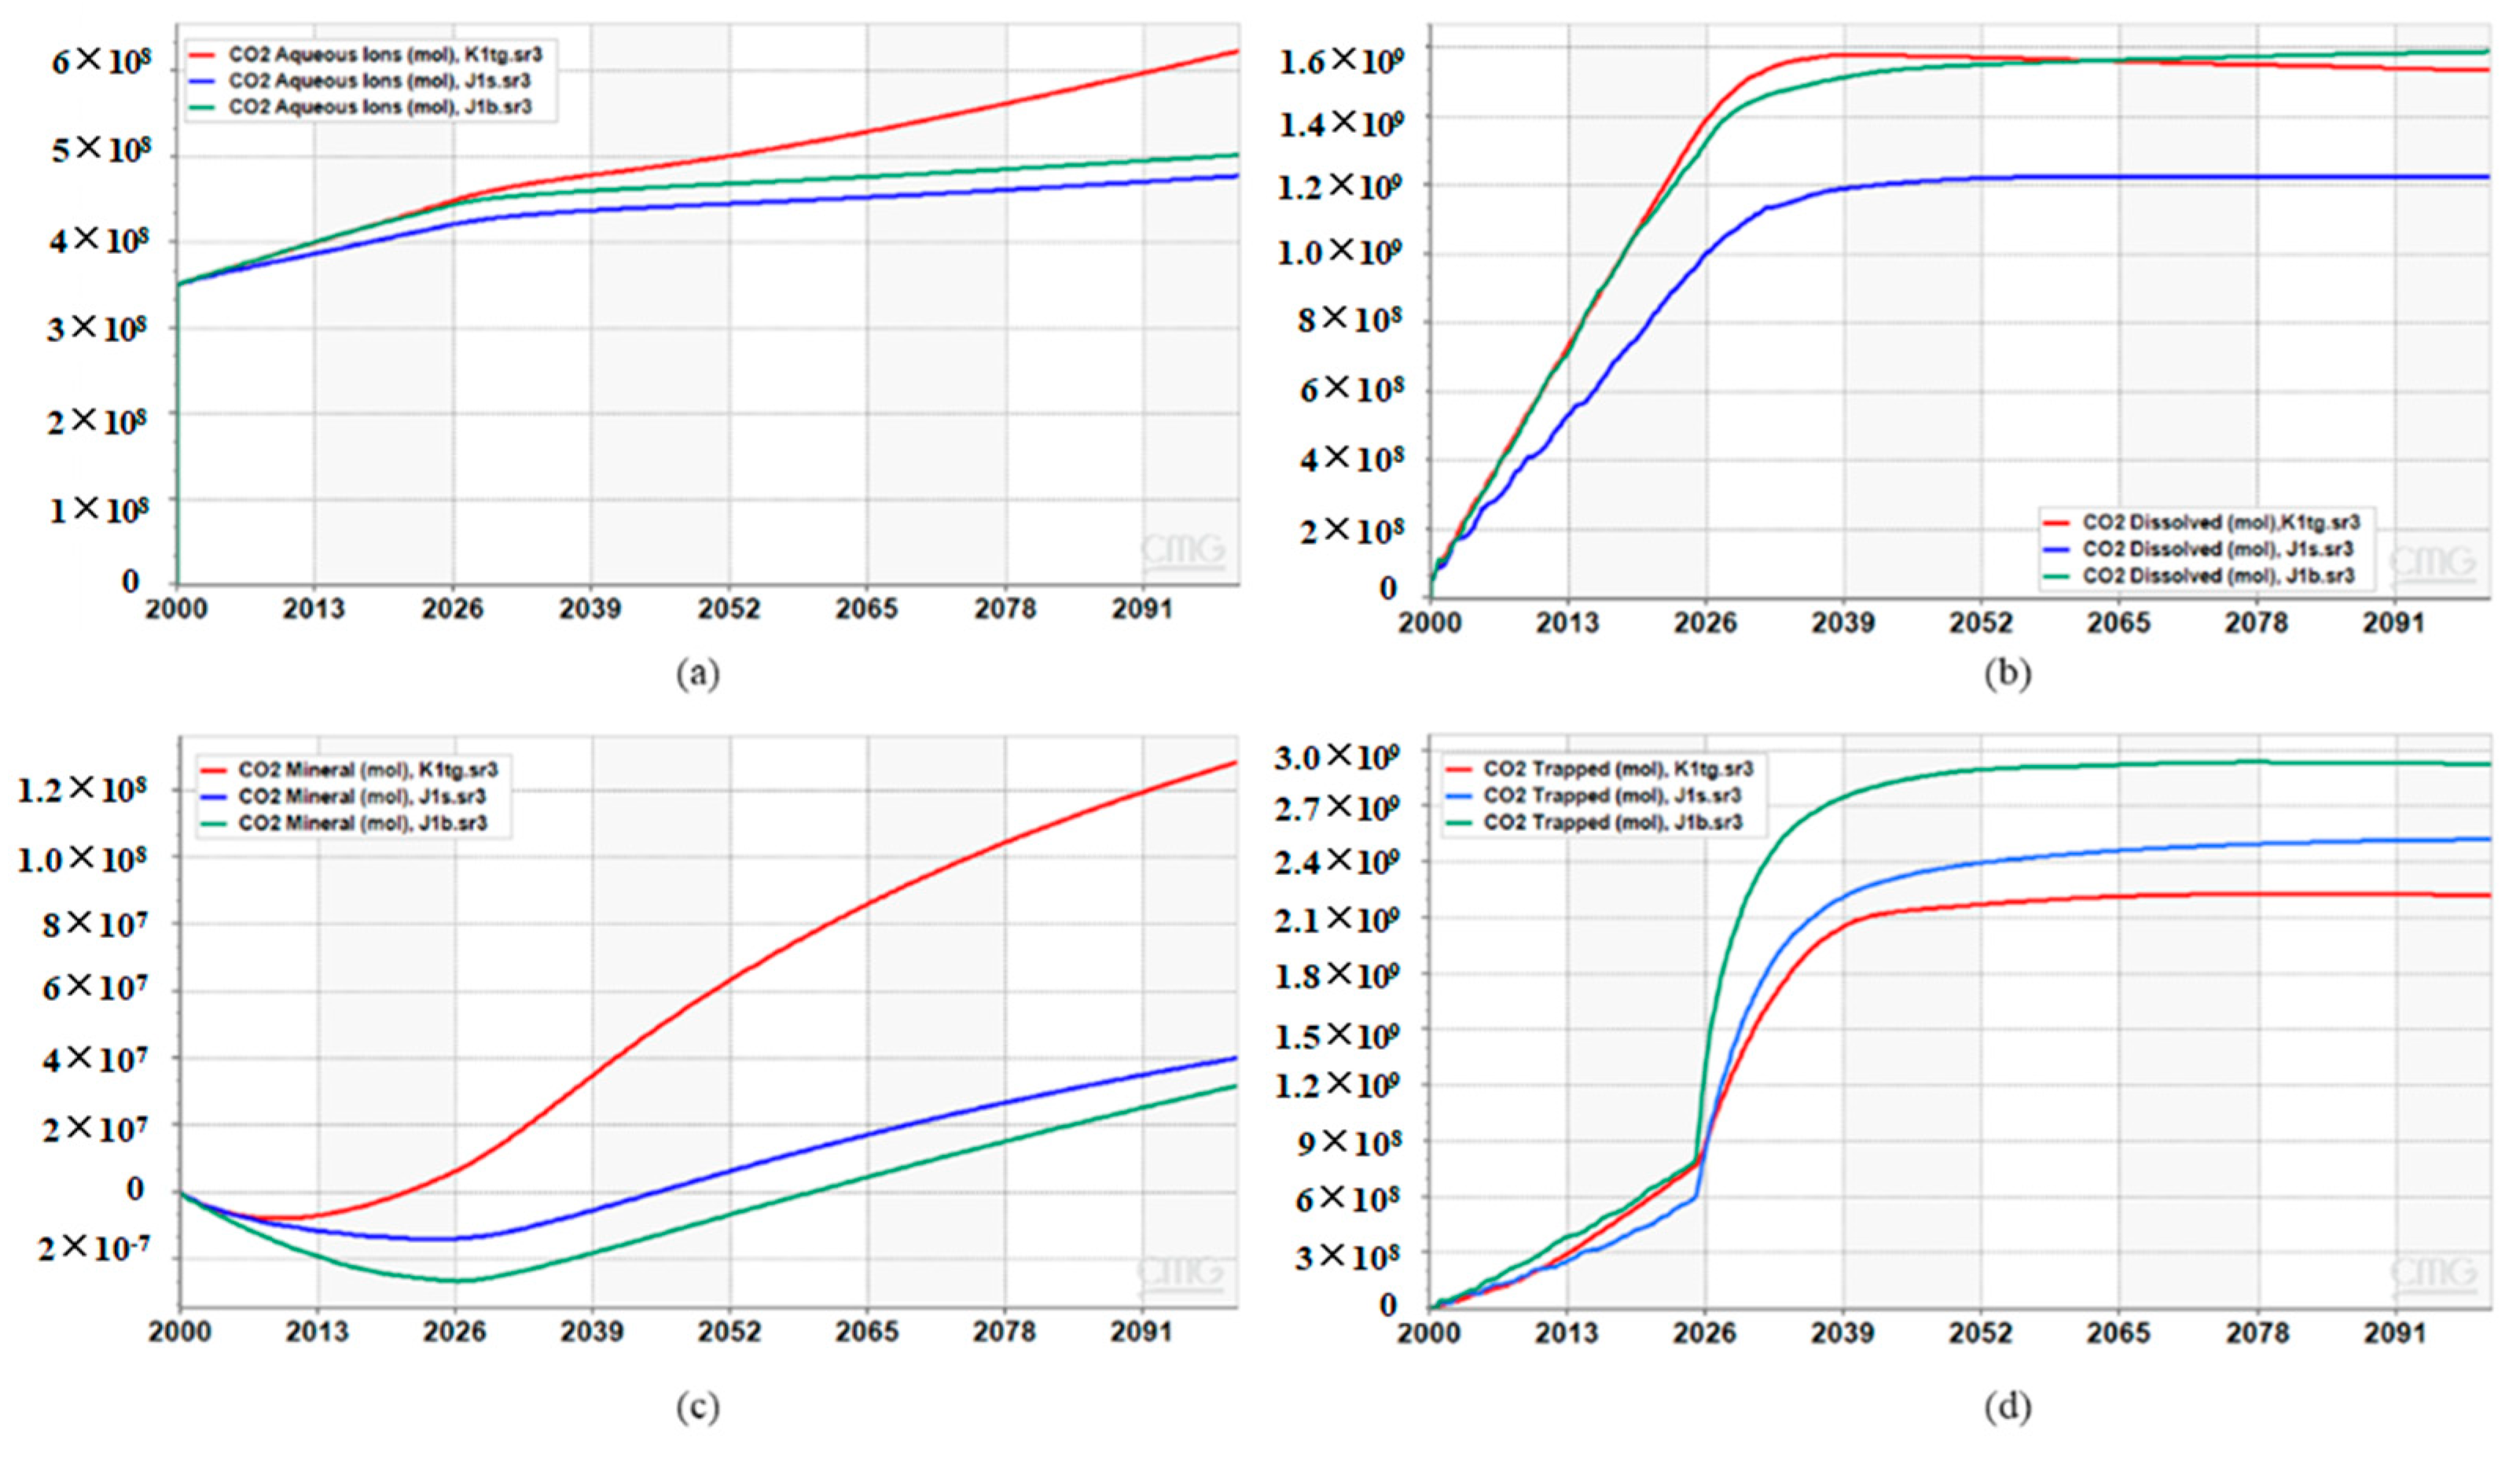
Figure 21a,b show that in the CO2 aqueous phase, the CO2 storage capacity of the K1tg formation is higher than that of J1s and J1b. In the CO2 dissolved phase, the storage capacities of all three formations gradually increase during CO2 injection and plateaus after well shut-in, with J1b ultimately exhibiting the highest storage capacity. As shown in Figure 21c, the K1tg formation has the largest CO2 storage capacity in the mineralized phase, but the differences among the three formations are minimal due to the extremely slow rate of mineralization. In the bound storage phase (Figure 21d), the storage capacities of all three formations increase before well shut-in, after which J1b shows a more pronounced upward trend until it gradually stabilizes after 74 years. According to the numerical simulation results, the CO2 storage capacities of the K1tg, J1s, and J1b formations via different storage mechanisms after 100 years of simulation are summarized in Table 3, with the order of total storage capacity being J1b > K1tg > J1s.
Porosity and permeability are two critical parameters influencing CO2 geological storage. This study conducted a sensitivity analysis on the porosity and permeability of three formations: K1tg, J1s, and J1b. The analysis applied parameter perturbations of ±50% and ±20% to each variable, with results quantified as deviations in cumulative CO2 storage volume compared to baseline conditions.
Dev = n nbase nbase
The sensitivity analysis in Figure 22 demonstrates that for both the overall trend and individual formations, the parameters’ impact on CO2 storage capacity follows the order: porosity > permeability. Increasing either porosity or permeability enhances total CO2 storage, though porosity exhibits more pronounced effects. These results suggest that strategically improving formation porosity (and to a lesser extent, permeability) can significantly increase CO2 storage potential.

6. Discussions and Conclusions

This study focuses on three formations—J1b, J1s, and K1tg—within the Baijiahai Uplift of the Junggar Basin. Through laboratory experiments (including CO2 static immersion, dynamic displacement, NMR, and mercury injection capillary pressure [MICP] testing) and CMG numerical simulations, we systematically analyze physicochemical alterations, CO2 storage mechanisms, and reservoir potential following CO2 injection.
  • The Jurassic Badaowan formation (J1b) is characterized by high quartz content and kaolinite-dominated clay minerals, while the Jurassic Sangonghe formation (J1s) consists mainly of quartz and plagioclase with lower and more diverse clay mineral content. The Cretaceous Tugulu Group (K1tg) is rich in calcite and illite–smectite mixed-layer clays.
  • Displacement experiments reveal sequestration efficiency rankings: J1b(8.4%) > K1tg(2.0%) > J1s(1.2%). J1b exhibits increased small pores and dominant large-pore sequestration; J1s shows pore homogenization; K1tg experiences preferential displacement in large pores with stable bound water in small pores. The superior capacity of J1b is attributed to clay mineral (kaolinite) swelling and large-pore plugging effects.
  • XRD and NMR analyses indicate that while J1b has the smallest original pore-throat radius (median, 0.183 μm), it demonstrates the most comprehensive improvement in porosity and permeability after CO2 immersion. J1s achieves significant breakthroughs in permeability and a maximum pore-throat radius, whereas K1tg forms a medium-pore preponderance due to calcite dissolution but with limited permeability enhancement.
  • Mechanical tests show that J1b has the highest sequestration potential but the poorest mechanical stability, requiring measures to prevent formation collapse. J1s experiences a rapid 20% decline in shear strength within 24 h, necessitating injection pressure control during short-term operations.
  • Numerical simulations confirm that J1b achieves the highest total storage capacity through strong capillary trapping in clay minerals, despite weak mineralization. K1tg ranks second due to calcite-driven mineralization and early aqueous storage, while J1s performs mediocrely across all mechanisms.
  • Optimal reservoir for CCUS: J1b requires wellbore reinforcement technologies to address mechanical degradation.

Author Contributions

Methodology, Q.W.; investigation, S.Q.; writing—original draft, X.W.; writing—review and editing, W.Z.; visualization, K.W.; supervision, T.W. All authors have read and agreed to the published version of the manuscript.

Funding

This study has been supported by the China Petroleum Youth Science and Technology Project: Research on Geophysical Evaluation Methods for 10-Million-Ton Scale CCS Saline Aquifer Geological Storage Site Selection and Safety Monitoring (2024DQ03170), BGP Inc. Science and Technology Project: Integrated Technology Research for Carbon Dioxide Geological Storage Whole-Industry-Chain Demonstration Project (10-02-2025), BGP Inc. Science and Technology Project: Research on Underground Reservoir Evaluation and Monitoring Technology (10-02-2024). Science and Technology Development Program Project of the Silk Road Economic Belt Innovation-Driven Development Pilot Zone and the Urumqi-Changji-Shihezi National Independent Innovation Demonstration Zone: “Research on the Occurrence Mechanism and Key Development Technologies for Deep Coalbed Methane in Xinjiang” (2023LQ01005).

Data Availability Statement

The data were obtained from experiments and simulation results. The original contributions presented in this study are included in the article. Further inquiries can be directed to the corresponding authors.

Conflicts of Interest

Authors Xiaohui Wang, Wen Zhang, Qun Wang, Kepeng Wang and Saisai Qin were employed by the company BGP Inc., CNPC. The remaining author declares that the research was conducted in the absence of any commercial or financial relationships that could be construed as a potential conflict of interest.

References

  1. Le Quéré, C.; Andrew, R.M.; Friedlingstein, P.; Sitch, S.; Hauck, J.; Pongratz, J.; Pickers, P.A.; Korsbakken, J.I.; Peters, G.P.; Canadell, J.G. Global carbon budget 2018. Earth Syst. Sci. Data 2018, 10, 2141–2194. [Google Scholar] [CrossRef]
  2. Yoro, K.O.; Daramola, M.O. CO2 emission sources, greenhouse gases, and the global warming effect. In Advances in Carbon Capture; Elsevier: Amsterdam, The Netherlands, 2020; pp. 3–28. [Google Scholar] [CrossRef]
  3. Soeder, D.J. Greenhouse gas sources and mitigation strategies from a geosciences perspective. Adv. Geo-Energy Res. 2021, 5, 274–285. [Google Scholar] [CrossRef]
  4. International Energy Agency (IEA). Global CO2 Emissions in 2023; IEA: Paris, France, 2024; Available online: https://www.iea.org/reports/co2-emissions-in-2023 (accessed on 2 June 2025).
  5. Dunn, R.J.H.; Aldred, F.; Gobron, N.; Miller, J.B.; Willett, K.M.; Ades, M.; Adler, R.; Allan, R.P.; Allan, R.; Anderson, J.; et al. Global climate. Bull. Am. Meteorol. Soc. 2021, 102, S11–S142. [Google Scholar] [CrossRef]
  6. Khanal, A.; Shahriar, M.F. Optimization of CO2 Huff-n-Puff in Unconventional Reservoirs with a Focus on Pore Confinement Effects, Fluid Types, and Completion Parameters. Energies 2023, 16, 2311. [Google Scholar] [CrossRef]
  7. Zhan, J.; Niu, Z.; Li, M.; Zhang, Y.; Ma, X.; Fan, C.; Wang, R. Numerical simulation and modeling on CO2 sequestration coupled with enhanced gas recovery in shale gas reservoirs. Geofluids 2021, 2021, 9975296. [Google Scholar] [CrossRef]
  8. Shahriar, M.F.; Khanal, A. Fundamental investigation of reactive-convective transport: Implications for long-term carbon dioxide(CO2) sequestration. Int. J. Greenh. Gas Control. 2023, 127, 103916. [Google Scholar] [CrossRef]
  9. Yang, G.; Li, Y.; Ma, X.; Atrens, A.; Ni, H. Modeling study of enhanced thermal brine extraction using supercritical CO2. Bull. Geol. Sci. Technol. 2014, 33, 233–240. [Google Scholar]
  10. Li, Q.; Cai, B.; Chen, F.; Liu, G.; Liu, L. Review of environmental risk assessment methods for carbon dioxide geological storage. Environ. Eng. 2019, 37, 13–21. [Google Scholar]
  11. Goodman, A.; Sanguinito, S.; Tkach, M.; Natesakhawat, S.; Kutchko, B.; Fazio, J.; Cvetic, P. Investigating the role of water on CO2-utica shale interactions for carbon storage and shale gas extraction activities: Evidence for pore scale alterations. Fuel 2019, 242, 744–755. [Google Scholar] [CrossRef]
  12. Cook, P.J. CCS research development and deployment in a clean energy future: Lessons from Australia over the past two decades. Engineering 2017, 3, 477–484. [Google Scholar] [CrossRef]
  13. Jin, J.; Yang, G.; Liu, S.; Ma, X.; Zhang, Y.; Han, S. Effects of CO2-saltwater-rock interaction on reservoir porosity: A case study of the Donggou Formation sandstone layer in the Junggar Basin. Nonferrous Met. (Extr. Metall.) 2025, 204–216. Available online: https://link.oversea.cnki.net/doi/10.20237/j.issn.1007-7545.2025.02.023 (accessed on 2 June 2025).
  14. Cai, B.; Li, Q.; Zhang, X.; Ouyang, T. Annual Report of Carbon Dioxide Capture, Utilization and Storage (CCUS) in China (2021)—China CCUS Path Research; Environmental Planning Institute of the Ministry of Ecology and Environment: Beijing, China, 2021. [Google Scholar]
  15. Jafari, M.; Cao, S.C.; Jung, J. Geological CO2 sequestration in saline aquifers: Implication on potential solutions of China’s power sector. Resour. Conserv. Recycl. 2017, 121, 137–155. [Google Scholar] [CrossRef]
  16. Vishal, V.; Singh, T. (Eds.) Geologic Carbon Sequestration: Understanding Reservoir Behavior; Springer: Cham, Switzerland, 2016; Volume 16, pp. 47–133. [Google Scholar]
  17. Machado, M.V.B.; Delshad, M.; Sepehrnoori, K. Injectivity assessment for CCS field-scale projects with considerations of salt deposition, mineral dissolution, fines migration, hydrate formation, and non-Darcy flow. Fuel 2023, 353, 129148. [Google Scholar] [CrossRef]
  18. Meguerdijian, S.; Pawar, R.J.; Harp, D.R.; Jha, B. Thermal and solubility effects on fault leakage during geologic carbon storage. Int. J. Greenh. Gas Control. 2022, 116, 103633. [Google Scholar] [CrossRef]
  19. Li, Y. Progress in Carbon Neutralization and Carbon Capture, Utilization and Storage Technology; China Petrochemical Press Ltd.: Beijing, China, 2021; Available online: https://ricn.sjtu.edu.cn/Web/Show/77 (accessed on 2 June 2025).
  20. Ye, H.; Hao, N.; Liu, Q. Review on Key Parameters and Characterization Technology of CO2 Sequestration Mechanism in saline aquifers. Power Gener. Technol. 2022, 43, 562–573. [Google Scholar] [CrossRef]
  21. Zhao, Y.; Yang, B.; Cao, C.; Zhang, L.; Zhou, X.; Huang, C.; Rui, Y.; Li, J. Research progress of evaluation of CO2 storage potential and suitability assessment indexes in saline aquifers. Pet. Reserv. Eval. Dev. 2023, 13, 484–494. [Google Scholar]
  22. Li, Y.; Pang, Z. Capacity and suitability assessment of deep saline aquifers for CO2 sequestration in the Bohai Bay Basin, East China. Environ. Earth Sci. 2016, 75, 402. [Google Scholar] [CrossRef]
  23. Gholami, R.; Raza, A. CO2 sequestration in sandstone reservoirs: How does reactive flow alter trapping mechanisms. Fuel 2022, 324, 124781. [Google Scholar] [CrossRef]
  24. Edem, D.; Abba, M.; Nourian, A.; Babaie, M.; Naeem, Z. Experimental investigation of the extent of the impact of Halite precipitation on CO2 injection in deep saline aquifers. In Proceedings of the SPE Europec featured at EAGE Conference and Exhibition, SPE, Virtual, 1–3 December 2020. [Google Scholar] [CrossRef]
  25. Haizheng, J.; Baiyang, L.; Zhao, L. Experimental study on the interaction between CO2 and Jimsar reservoir rocks. Chem. Eng. Oil Gas 2021, 50, 76–80. [Google Scholar]
  26. Amin, S.M.; Weiss, D.J.; Blunt, M.J. Reactive transport modelling of geologic CO2 sequestration in saline aquifers: The influence of pure CO2 and of mixtures of CO2 with CH4 on the sealing capacity of cap rock at 37 °C and 100 bar. Chem. Geol. 2014, 367, 39–50. [Google Scholar] [CrossRef]
  27. Alzayer, H.; Zahrani, T.; Shubbar, A. Modeling CO2 Sequestration in Deep Saline Aquifers–Best Practices. In Proceedings of the International Petroleum Technology Conference, IPTC, Riyadh, Saudi Arabia, 21–23 February 2022. [Google Scholar] [CrossRef]
  28. Youjun, J.; Xiaoyang, W.; Tiyao, Z.; Zegen, W.; Guobin, J. Effect of CO2 geological sequestration on reservoir mechanical properties and gas migration and Diffusion Under Multi field coupling. Environ. Eng. 2023, 41 (Suppl. S2), 442–446. [Google Scholar]
  29. Zhou, Y.; Tang, L.; Song, Z.; Pan, B.; Yue, M.; Liu, J.; Song, H. Research on CO2 sequestration in saline aquifers with different relative permeability considering CO2 phase conditions. Energy 2024, 313, 133739. [Google Scholar] [CrossRef]
  30. Peng, X.; Wang, Y.; Li, S.; Wang, X.; Cui, G.; He, Y. Migration characteristics and storage forms of liquid and supercritical CO2 in saline aquifers. Coal Geol. Explor. 2025, 53, 99–106. [Google Scholar]
  31. Fatima, S.; Khan, H.M.M.; Tariq, Z.; Abdalla, M.; Mahmoud, M. An experimental and simulation study of CO2 sequestration in an underground formations; impact on geomechanical and petrophysical properties. In Proceedings of the SPE Middle East Oil and Gas Show and Conference, SPE, Event Canceled, 28 November–1 December 2021. [Google Scholar] [CrossRef]
  32. Jin, Y.J.; Wang, J.L.; Pan, Z.Y. Determination of CO2 Solubility in Saline Solutions Under Geological Storage Conditions Using Raman Spectroscopy Combined with a Quartz Capillary Equilibrium Still; Chinese Society for Mineralogy, Petrology and Geochemistry; Abstracts of the 17th Annual Conference of the Chinese Society for Mineralogy, Petrology and Geochemistry; College of Environmental Science and Engineering, Zhejiang University of Technology: Hangzhou, China, 2019; p. 1037. [Google Scholar]
  33. Temitope, A.; Gomes, J.S.; Al Kobaisi, M.; Hu, J. Characterization and quantification of the CO2 sequestration potential of a carbonate aquifer in Falaha Syncline, onshore Abu Dhabi. In Proceedings of the Abu Dhabi International Petroleum Exhibition & Conference, One Petro, Abu Dhabi, United Arab Emirates, 7–10 November 2016. [Google Scholar] [CrossRef]
  34. Rezk, M.G.; Ibrahim, A.F. Impact of rock mineralogy on reactive transport of CO2 during carbon sequestration in a saline aquifer. J. Pet. Explor. Prod. Technol. 2025, 15, 10. [Google Scholar] [CrossRef]
  35. GB/T 29172-2012; Practices for Core Analysis. General Administration of Quality Supervision, Inspection and Quarantine of the People’s Republic of China, Standardization Administration of the People’s Republic of China: Beijing, China, 2012.
Figure 1. Location of the Baijiahai Uplift area.
Processes 13 02648 g001
Figure 2. Mineral composition and corresponding contents of the 3 formations.
Processes 13 02648 g002
Figure 3. Technical workflow.
Processes 13 02648 g003
Figure 4. Core sampling.
Processes 13 02648 g004
Figure 5. (a) Intermediate container for CO2, (b) CO2 gas cylinder, (c) glass container, and (d) displacement experiment device.
Processes 13 02648 g005
Figure 6. (a) NMR instrument, (b) Micromeritics AutoPore IV-9500 Mercury Intrusion Porosimeter, and (c) TAR-1500 high-temperature and high-pressure rock rheometer.
Processes 13 02648 g006
Figure 7. NMR T2 spectrum curve of the J1s formation.
Processes 13 02648 g007
Figure 8. NMR T2 spectrum curve of the J1b formation.
Processes 13 02648 g008
Figure 9. NMR T2 spectrum curve of the K1tg formation.
Processes 13 02648 g009
Figure 10. (a) Capillary pressure curves of sample J1s prior to immersion and following 24 h immersion at 40 °C. (b) Pore size distribution curves of sample J1s prior to immersion and following 24 h immersion at 40 °C.
Processes 13 02648 g010
Figure 11. (a) Capillary pressure curves of sample J1b prior to immersion and following 24 h immersion at 40 °C. (b) Pore size distribution curves of sample J1b prior to immersion and following 24 h immersion at 40 °C.
Processes 13 02648 g011
Figure 12. (a) Capillary pressure curves of sample K1tg prior to immersion and following 24 h immersion at 40 °C. (b) Pore size distribution curves of sample K1tg prior to immersion and following 24 h immersion at 40 °C.
Processes 13 02648 g012
Figure 13. Stress–radial strain curve of different formations.
Processes 13 02648 g013
Figure 14. Stress–axial strain curve of different formations.
Processes 13 02648 g014
Figure 15. Load–displacement curves of 3 different formations.
Processes 13 02648 g015
Figure 16. Petrel (a) porosity model, (b) sedimentary facies model, (c) CMG model in Petrel, (d,e) Location and Extent of the CMG Submodel, (f) The Refined CMG Submodel.
Processes 13 02648 g016
Figure 17. Gas–water relative permeability curves for the three formations.
Processes 13 02648 g017
Figure 18. Gas–water relative permeability curves for the J1b formation.
Processes 13 02648 g018
Figure 19. Displacement simulation results for the J1b formation.
Processes 13 02648 g019
Figure 20. Initial state of 3 formations, and CO2 migration patterns after 25 years and 100 years. (a) K1tg formation initial state, (b) K1tg formation CO2 migration patterns after 25 years, (c) K1tg formation CO2 migration patterns after 100 years, (d) J1s formation initial state, (e) J1s formation CO2 migration patterns after 25 years, (f) J1s formation CO2 migration patterns after 100 years, (g) J1b formation initial state, (h) J1b formation CO2 migration patterns after 25 years, (i) J1b formation CO2 migration patterns after 100 years.
Processes 13 02648 g020
Figure 21. (a) Evolution of CO2 storage capacity under CO2 Aqueous lons in 3 formations, (b) Evolution of CO2 storage capacity under CO2 Dissolved in 3 formations, (c) Evolution of CO2 storage capacity under CO2 Mineral in 3 formations, (d) Evolution of CO2 storage capacity under CO2 Trapped in 3 formations.
Processes 13 02648 g021
Figure 22. Sensitivity analysis of CO2 storage parameters for (a) K1tg, (b) J1s, and (c) J1b formations (“+” represents the deviation caused by increasing the parameters. “-” represents the deviation caused by increasing the parameters).
Processes 13 02648 g022
Table 1. Settings of test parameters for each experiment.
TestFormationCO2 Immersion TimeCO2 Immersion Temperature
Mercury Injection TestJ1s24 h40 °C
J1b
K1tg
SEM TestJ1s24 h40 °C
J1b
K1tg
Uniaxial Compression TestJ1s24 h40 °C
J1b
K1tg
Uniaxial Shear TestJ1s24 h, 48 h, 60 h40 °C
J1b24 h, 48 h, 60 h40 °C
K1tg24 h, 48 h, 60 h40 °C
Table 2. Parameter configuration.
Length
cm
Diameter
cm
Porosity
%
Permeability
mD
Injection Pressure
MPa
Outlet Pressure
MPa
Temperature
°C
5.2082.51426.55913.14011.611.540
Table 3. CO2 storage in 3 formations.
StratumCO2
Aqueous
(mol)
CO2
Dissolved
(mol)
CO2
Mineral
(mol)
CO2
Super Critical
(mol)
CO2
Trapped
(mol)
Total
Storage Capacity
(mol)
K1tg4.92821 × 1081.49032 × 1093.00589 × 1072.65337 × 1092.64899 × 1094.666569 × 109
J1b4.97961 × 1081.41702 × 1094.50067 × 1073.09315 × 1093.06720 × 1095.053138 × 109
J1s6.05990 × 1081.41933 × 1091.20637 × 1082.12958 × 1091.99623 × 1094.275537 × 109
Disclaimer/Publisher’s Note: The statements, opinions and data contained in all publications are solely those of the individual author(s) and contributor(s) and not of MDPI and/or the editor(s). MDPI and/or the editor(s) disclaim responsibility for any injury to people or property resulting from any ideas, methods, instructions or products referred to in the content.