Article

Mechanisms and Optimization of Critical Parameters Governing Solid-Phase Transport in Jet Pumps for Vacuum Sand Cleanout

by
Xia Jia
1,2,3,
Hualin Liao
1,2,3,*,
Lei Zhang
1,2,3,4,
Yan Zhang
5 and
Jiawei Liu
5
1
School of Petroleum Engineering, China University of Petroleum (East China), Qingdao 266580, China
2
Key Laboratory of Unconventional Oil and Gas Development, Ministry of Education, Qingdao 266580, China
3
Shandong Ultra-Deep Drilling Process Control Tech R&D Center, Qingdao 266580, China
4
PetroChina Zhejiang Oilfield Branch Company, Hangzhou 310000, China
5
Jianghan Machinery Research Institute Limited Company of CNPC, Wuhan 430023, China
*
Author to whom correspondence should be addressed.
Processes 2025, 13(8), 2639; https://doi.org/10.3390/pr13082639
Submission received: 9 July 2025 / Revised: 14 August 2025 / Accepted: 18 August 2025 / Published: 20 August 2025
(This article belongs to the Topic Advanced Heat and Mass Transfer Technologies, 2nd Edition)

Abstract

This paper addresses the critical challenge of insufficient solid-phase suction capacity in jet pumps during vacuum sand cleanout operations for low-pressure oil and gas wells. Through integrated numerical simulations validated by experimental measurements with under 15% error, a kind of nonlinear interaction mechanism among key operational and solid-phase parameters is revealed in this paper. The results demonstrate that due to intensified turbulent dissipation, particle diameters exceeding 0.5 mm will lead to a significant decrease in pump efficiency, while an increase in solid volume fraction can improve the solid transport rate but will reduce the energy conversion efficiency. Working pressure optimization shows that the pump efficiency will reach its maximum when the work pressure is 5 MPa, while if it is 8 MPa, the solid transport capacity will be increased by 116%. A discharge pressure exceeding 2.5 MPa will reduce the suction pressure difference and disrupt solid phase transport. A novel dual-metric framework considering the solid transport rate and pump efficiency is put forward in this paper, which includes limiting the particle diameter to 0.5 mm or less, maintaining a solid volume fraction below 30%, and keeping the working pressure between 5 and 8 MPa and the discharge pressure at 2.5 MPa or lower. This method can increase the sand removal efficiency to over 30% while minimizing energy loss, providing a validated theoretical basis for sustainable wellbore repair in depleted oil reservoirs.

1. Introduction

Declining formation energy during late-stage oilfield development induces severe sand production, causing downhole sand accumulation and critically impairing hydrocarbon recovery in low-pressure wells [1,2]. Vacuum sand cleanout technology addresses this challenge by deploying a jet pump assembly within downhole tools to generate localized negative pressure at the downhole wellbore. This mechanism fluidizes accumulated sand into the concentric coiled tubing annulus while lifting sand-laden fluid to the surface, effectively mitigating fluid loss and preserving reservoir integrity [3]. Nevertheless, inefficient energy transfer during solid–liquid two-phase transport within jet pumps substantially constrains the solid-phase suction capacity, leading to suboptimal operational efficiency [4,5], which hinders field-scale implementation.
Previous numerical and experimental studies of solid–liquid two-phase jet pumps have primarily focused on examining how operational and structural parameters affect hydraulic performance [6,7,8]. Deng compared abrupt versus gradual diffusers’ effects on sand removal efficiency [9,10]. Meakhail revealed how nozzle diameter and working pressure regulate jet characteristics [11]. Zhou employed large-eddy simulation to resolve 3D liquid–solid flow behavior [12]. Itoh studied fundamental jet pump characteristics under single-phase and solid–liquid conditions, comparing flow patterns for different throat diameters and particle sizes [13]. Liu analyzed the impact of the initial solid concentration on flow fields and efficiency [14]. Shen optimized parameters such as the nozzle convergence angle using the Eulerian model [15]. Despite these advances, significant limitations persist in the current research paradigms.
Three critical research gaps remain unresolved, as listed below:
Parameter focus imbalance: Current investigations predominantly emphasize the operational parameters (mainly pressure and flow rate) and structural parameters (nozzle or throat geometry), while substantially neglecting how solid-phase parameters govern transport processes [16,17].
Evaluation metric deficiency: Existing assessment methods over reliance on the pump efficiency [18,19,20], which can not directly quantify the core engineering objective. The pump efficiency represents the downhole sand-bed clearance efficiency, which is intrinsically determined by the solid transport rate,
Mechanistic understanding gap: The nonlinear interactions between solid-phase characteristics (particle diameter, volume fraction) and operational parameters remain poorly characterized.
Therefore, this paper proposes a dual-metric synergistic evaluation framework to jointly characterize the solid-phase suction capacity of jet pumps using the solid transport rate and pump efficiency, which collectively represent the comprehensive performance in entraining and conveying solid particles. A three-dimensional solid–liquid two-phase flow physical model is established, and numerical simulations are conducted using FLUENT to systematically investigate the influence mechanisms of operational parameters and solid-phase parameters on jet pump performance. Additionally, an experimental rig simulating vacuum sand cleanout operation is commissioned for the verification of the numerical model, demonstrating its reliability with deviations under 15%. Ultimately, optimization guidelines for the solid–liquid two-phase jet pumps are formulated for engineering applications, which can provide a theoretical foundation for enhancing sand cleanout efficiency in low-pressure oil and gas wells.

2. Principles

2.1. Technical Principle

Vacuum sand cleanout technology employs a dual-component downhole tool system comprising a jet pump and a leading nozzle assembly, as illustrated in Figure 1. High-pressure working fluid is pumped through the inner string of concentric coiled tubing, generating two synergistic mechanisms [20,21,22]:
Sand fluidization: High-velocity jet fluids from the leading nozzle agitate and suspend compacted sand beds.
Solid-phase entrainment: Localized negative pressure is created while jetting with a jet pump to suction a mixture of sand and fluid into the annular return channel.
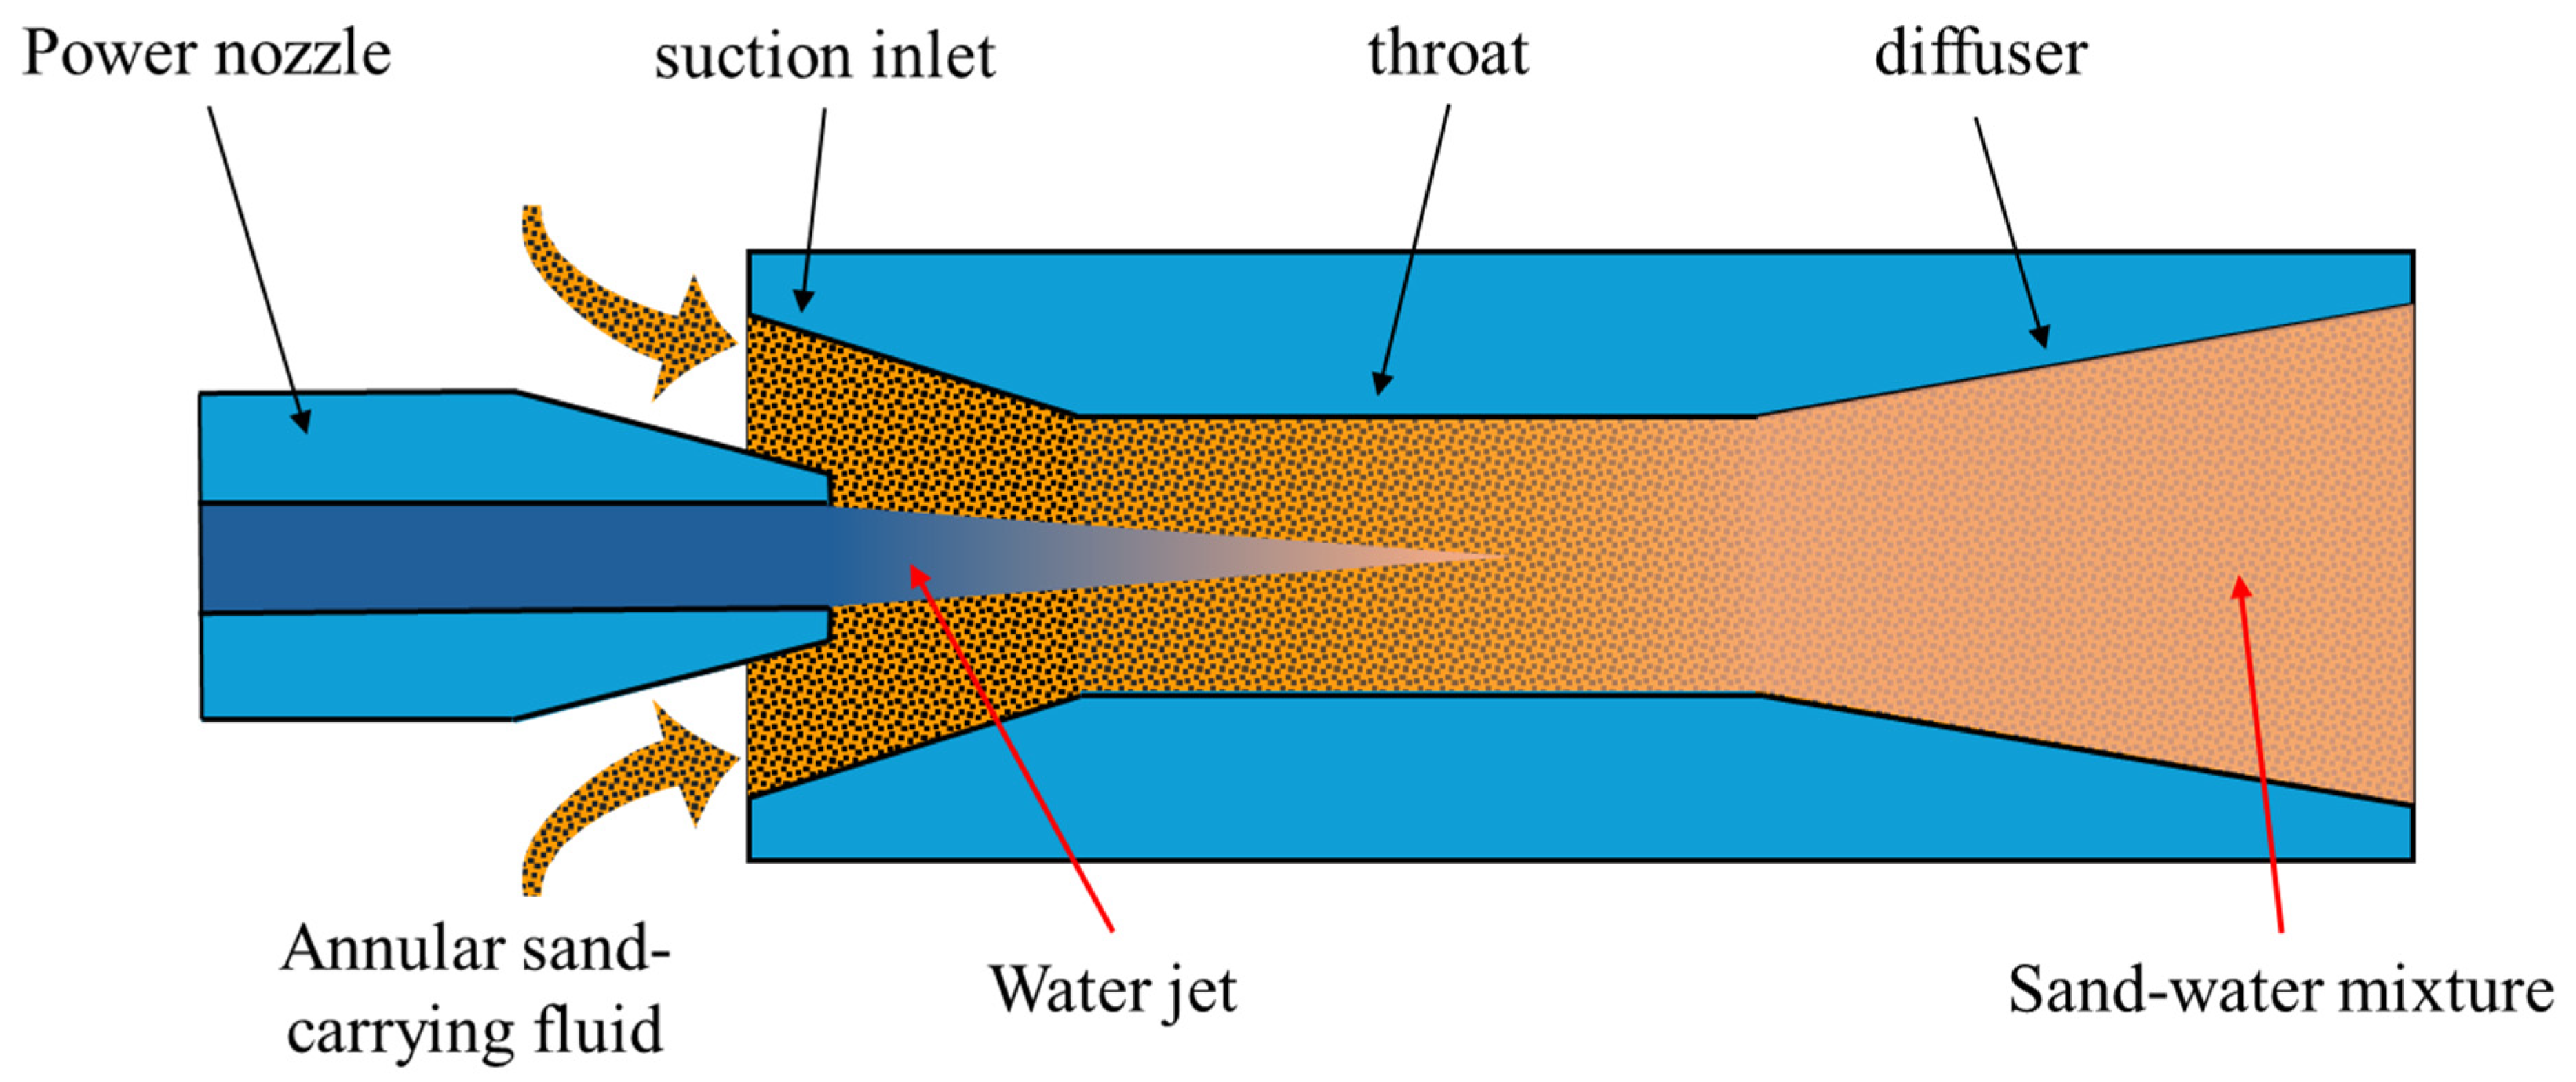
The basic structure of a jet pump is shown in Figure 2, including a nozzle, suction inlet, throat, and diffuser. Its function relies on fluid dynamic momentum exchange: high-pressure working fluid accelerates through the nozzle, creating a low-pressure zone at the suction inlet; two kinds of fluid streams intensively mix in the throat section; the mixed fluid then decelerates in the diffuser for pressure recovery. The jet pump’s moving-part-free design makes it ideal for particle-laden fluid transport.

2.2. Evaluation Metrics for Solid-Phase Suction Capacity

To address the inadequacy of conventional single-metric pump efficiency in comprehensively evaluating vacuum sand cleanout performance, a dual-metric evaluation system is established in this paper, of which the model construction process can be seen as follows:
Solid Transport Rate (ms) [23]: Defined as the mass of solid phase transported by the jet pump per unit time, this metric directly characterizes the efficiency of downhole sand-bed clearance.
m s = ρ s φ 2 A v m
where ms represents the solid transport rate, kg/s; ρs represents the density of the solid phase, kg/m3; φ2 represents the solid volume fraction in the mixed fluid of the diffuser outlet; A represents the cross-sectional area of the throat, m2; vm represents the average velocity of the mixed fluid in the transport section, m/s.
Pump Efficiency (E) [20]: This represents the ratio of energy acquired by the suction fluid (Es) to energy provided by the motive fluid (Ej), reflecting the jet pump’s energy conversion efficiency.
E = E s E j = ρ s ρ l P M P = P 2 P 3 P 1 P 2 M = q 3 q 1
where ρl expresses the density of the liquid phase, kg/m3; P expresses the dimensionless pressure ratio; M expresses the dimensionless flow ratio; P1 expresses the motive fluid pressure at the power nozzle inlet; P2 expresses the mixture pressure at the outlet of the diffuser of the pump; P3 expresses the suction pressure at the suction inlet; q1 expresses the motive fluid mass flow (water jet at power nozzle); q3 expresses the annular sand-carrying fluid flow (suction inlet).
This evaluation system synergistically assesses the solid-phase suction capacity through the coordinated evaluation of the solid transport rate and the pump efficiency, enabling comprehensive characterization of the jet pump’s performance.

3. Methodology

3.1. Governing Equations

This section details the computational framework for simulating solid–liquid two-phase flow in jet pumps, employing Eulerian-based mixture modeling to resolve complex multiphase interactions. The governing equations follow the Eulerian mixture model framework [24].
(1)
Continuity equation for the mixture phase:
𝜕 ρ m 𝜕 t + ( ρ m v ¯ m ) = 0 ρ m = k = 1 n φ k ρ k v ¯ m = 1 ρ m k = 1 n φ k ρ k v k
where ρm indicates the density of the mixed fluid, kg/m3; t indicates time, s; ∇ indicates the Hamiltonian operator; v ¯ k indicates the mass-averaged velocity vector, m/s; n indicates the total number of phases; φk indicates the volume fraction of the k-th phase; vk indicates the velocity of the k-th phase, m/s; ρ k indicates the density of the k-th phase, kg/m3.
(2)
Momentum conservation equation:
𝜕 𝜕 t ( ρ m v ¯ m ) + ( ρ m v m v m ) = p + μ m ( v ¯ m + v ¯ m T ) + ρ m g + F + ( k = 1 n φ k ρ k v d r , k v d r , k ) u m = k = 1 n φ k u k v d r , k = v k v ¯ m
where p shows the pressure of the mixture fluid, Pa; F shows the volumetric force vector, N/m3; g shows the gravitational acceleration, m/s2; μm shows the dynamic viscosity of the mixture fluid, kg/(m·s); μk shows the viscosity of the k-th phase, Pa·s; vdr,k shows the drift velocity vector of the k-th phase, m/s.

3.2. Computational Domain and Grid Division

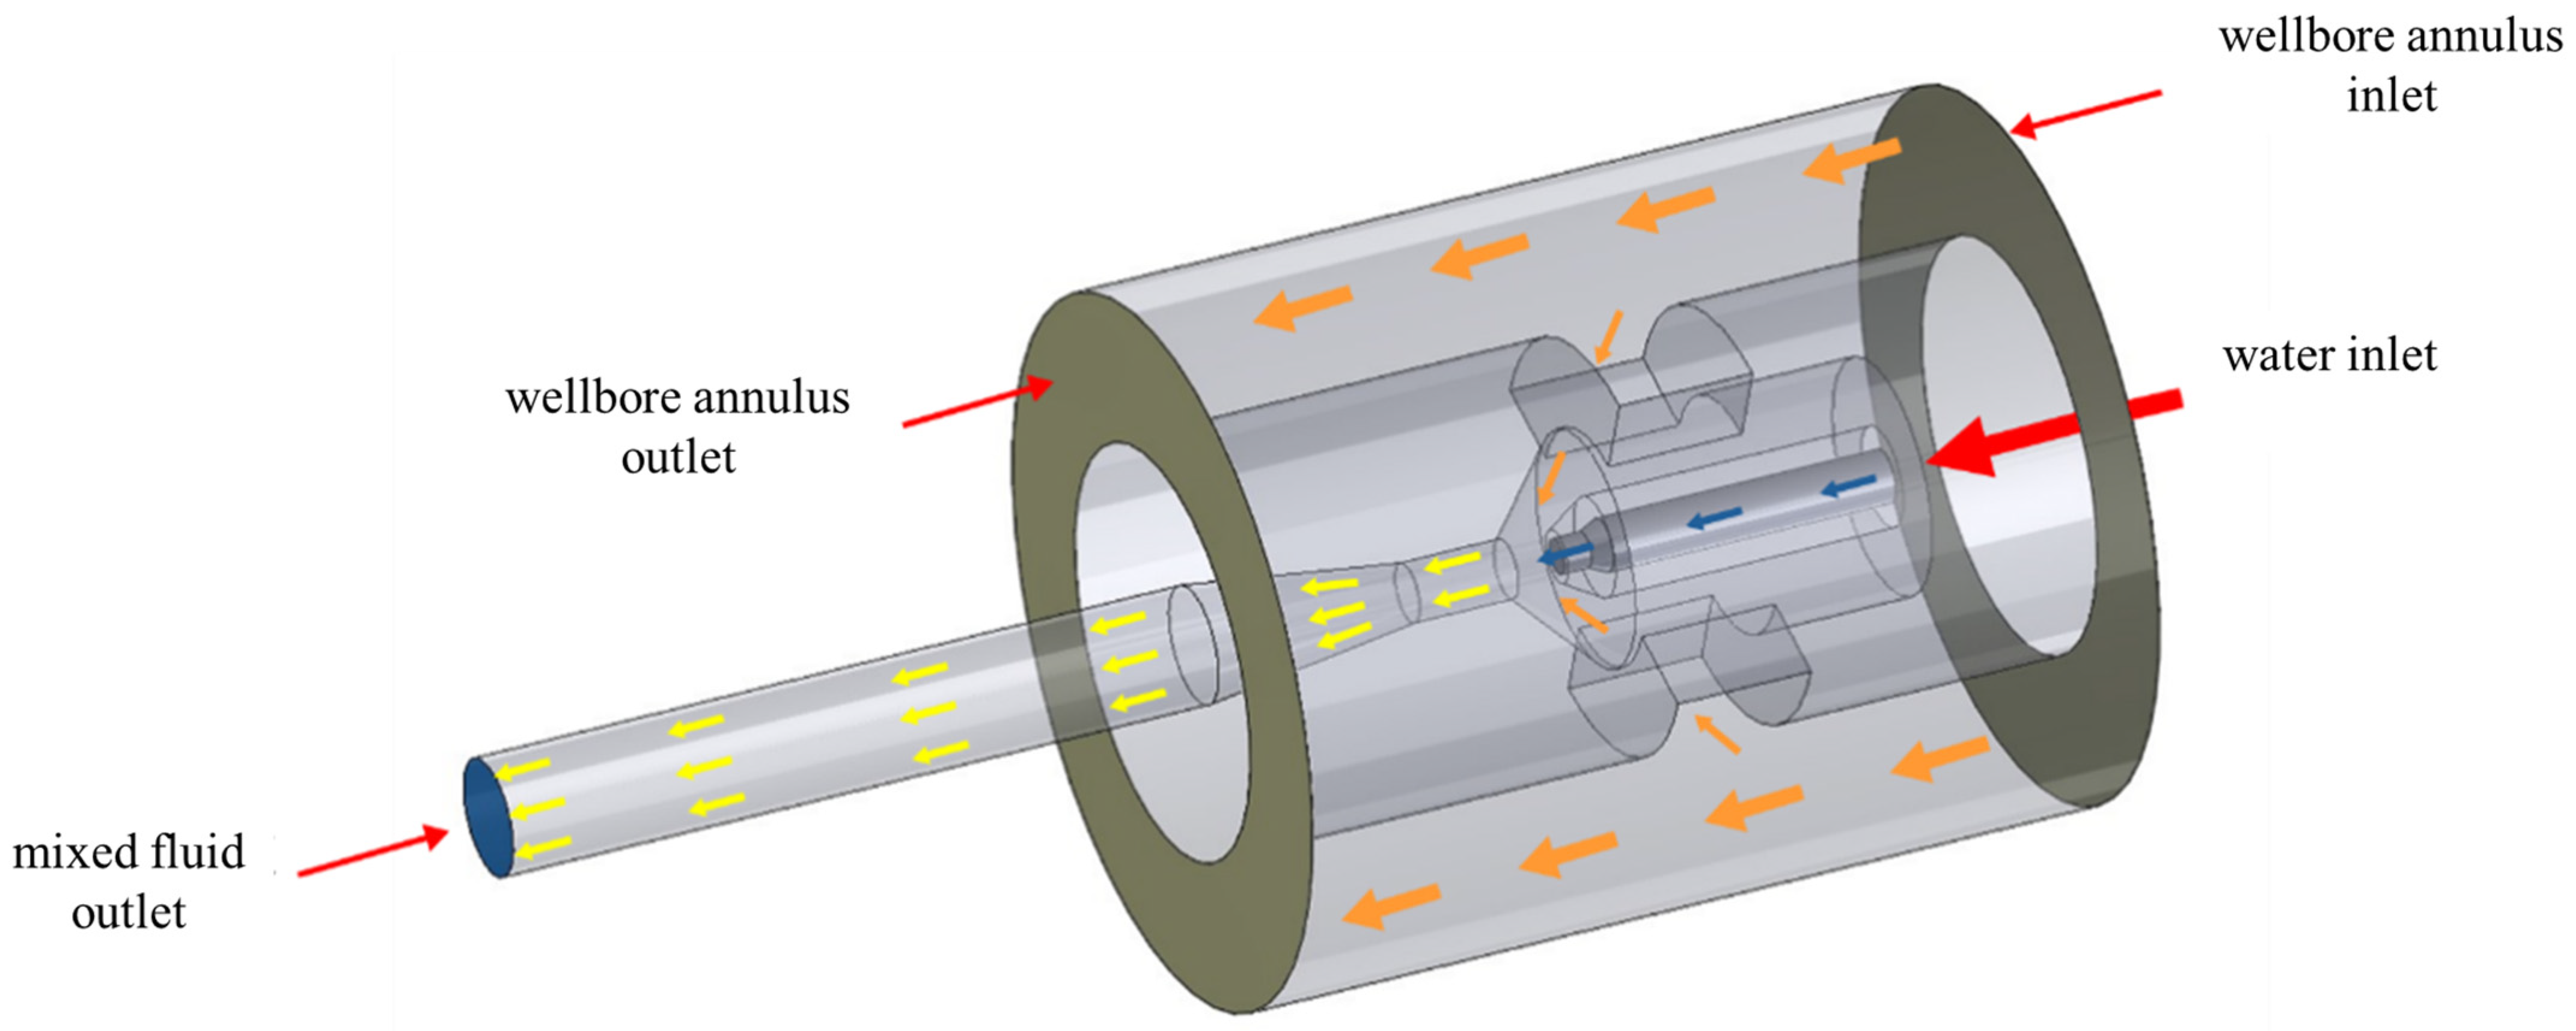
According to the designed structure of the jet pump of the vacuum sand cleanout tool (Figure 1), the simulation domain is reasonably simplified as a cylinder. A 3D physical simulation model was established adopting ANSYS workbench 2021R1, a computational domain with five key boundaries governing fluid flow: the water inlet (high-velocity pure water jet driving suction), annulus inlet (sand–water mixture drawn into the throat by low pressure), mixed fluid outlet (discharging sand-laden water under backpressure), annulus outlet (ambient gas phase maintaining reference pressure), and solid walls (no-slip boundaries confining flow), as illustrated in Figure 3.
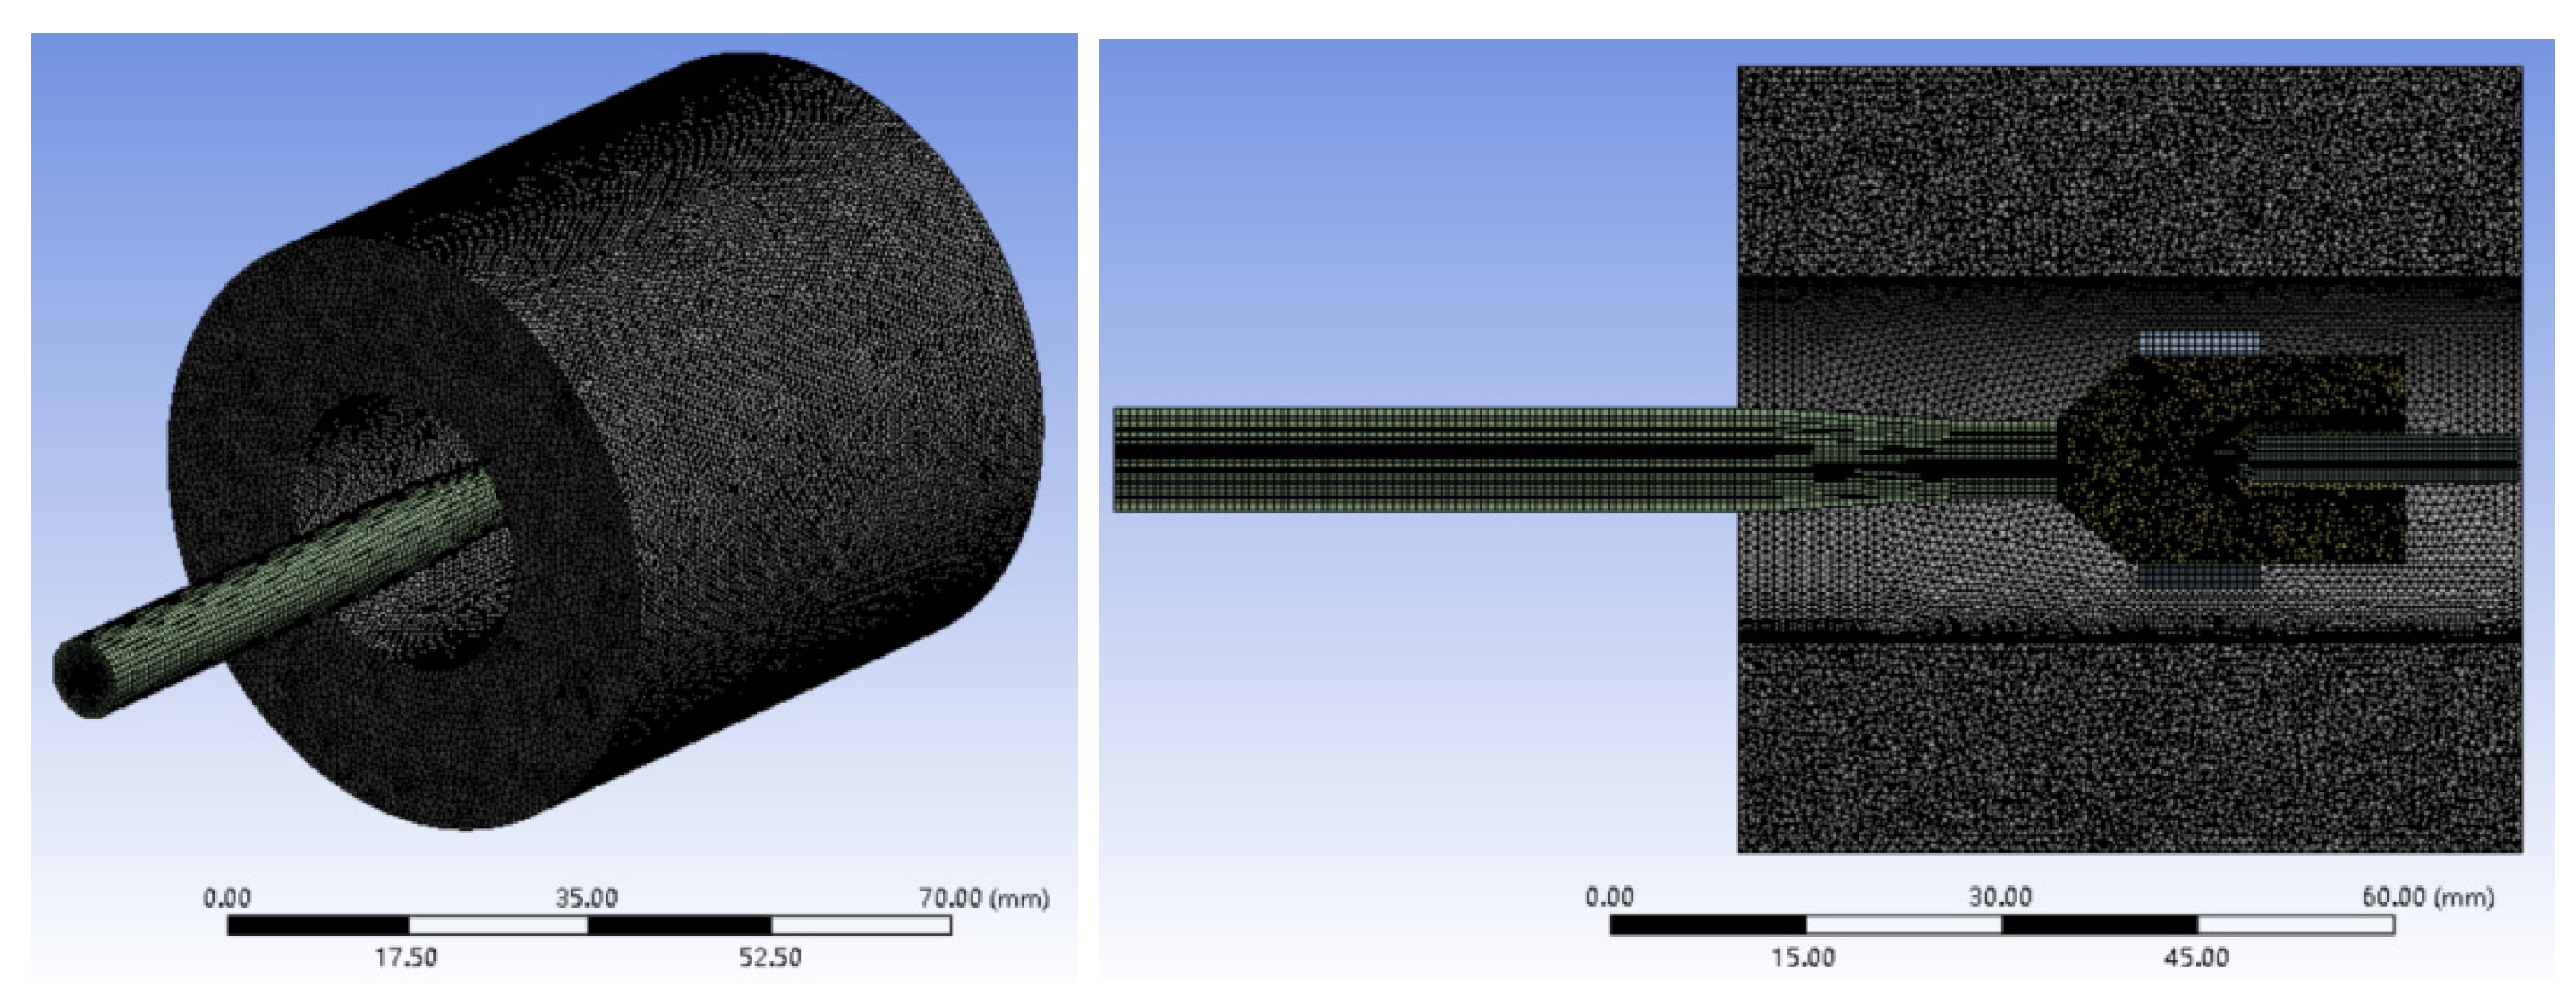
A grid model of the jet pump of the vacuum sand flushing tool was obtained based on the above physical model, as shown in Figure 4. In the grid model, the boundary names denote the settings of the boundary conditions and the computational domain during the simulation. There are three main boundary conditions used in this paper: inlet, outlet, and walls. In order to accurately identify and load the boundary conditions, four main boundary regions were named, water inlet, sand inlet, sand outlet, and mixed fluid outlet.
The tetrahedral and hexahedral elements were employed to meshing the above simulation model to ensure a high mesh quality and improve the simulation efficiency. Based on the dimensions of each local flow channel, mesh refinement in the throat transition zone ensured a minimum size of 0.02 mm. A total of 503,013 grid nodes and 2,559,754 grid elements were generated. These mesh quality metrics confirm suitability: maximum skewness was 0.8 (average 0.22), and the element quality ranged from 0.15 to 1 (average 0.84). These skewness and element quality values indicate that the overall quality of mesh generated in this paper is satisfactory.

3.3. Boundary Conditions and Solution Method

The boundary conditions were set as specified in Table 1, with key parameters including working pressure (P1), discharge pressure (P2), environmental reference pressure (P3), initial solid volume fraction (φS), and particle diameter (d). In the simulation model, the material of water was defined as the main phase, the density of which was set as 1 g/cm3. The material of sand was designated as the secondary phase, characterized by a density of 2.65 g/cm3.
The simulation conducted in this paper involved a multiphase flow, calculated based on the steady method and a pressure-based solver. The Euler model of Fluent software (2021R1) was adopted to describe the mixing process. The boundary conditions were defined as pressure inlet and pressure outlet in the inlet and outlet boundary, separately.
In the incompressible multiphase flow model (Section 3.1), the pressure dynamics are governed by pressure gradients rather than absolute values. The environmental reference pressure P3 (annulus outlet) was fixed at 0.1 MPa to simulate downhole conditions.
  • Driving pressure differential (governs kinetic energy generation at the nozzle): ΔPmotive = P1P3;
  • Resistance pressure differential (dictates flow resistance in the diffusion section): ΔPback = P2P3.
Given that P3 remains a constant reference pressure, the pressure differentials governing system dynamics are comprehensively characterized by variations in P1 (working pressure) and P2 (discharge pressure) in subsequent analyses.

4. Simulation Results and Discussion

4.1. Effect of Working Pressure on Solid-Phase Transport Capacity of Jet Pump

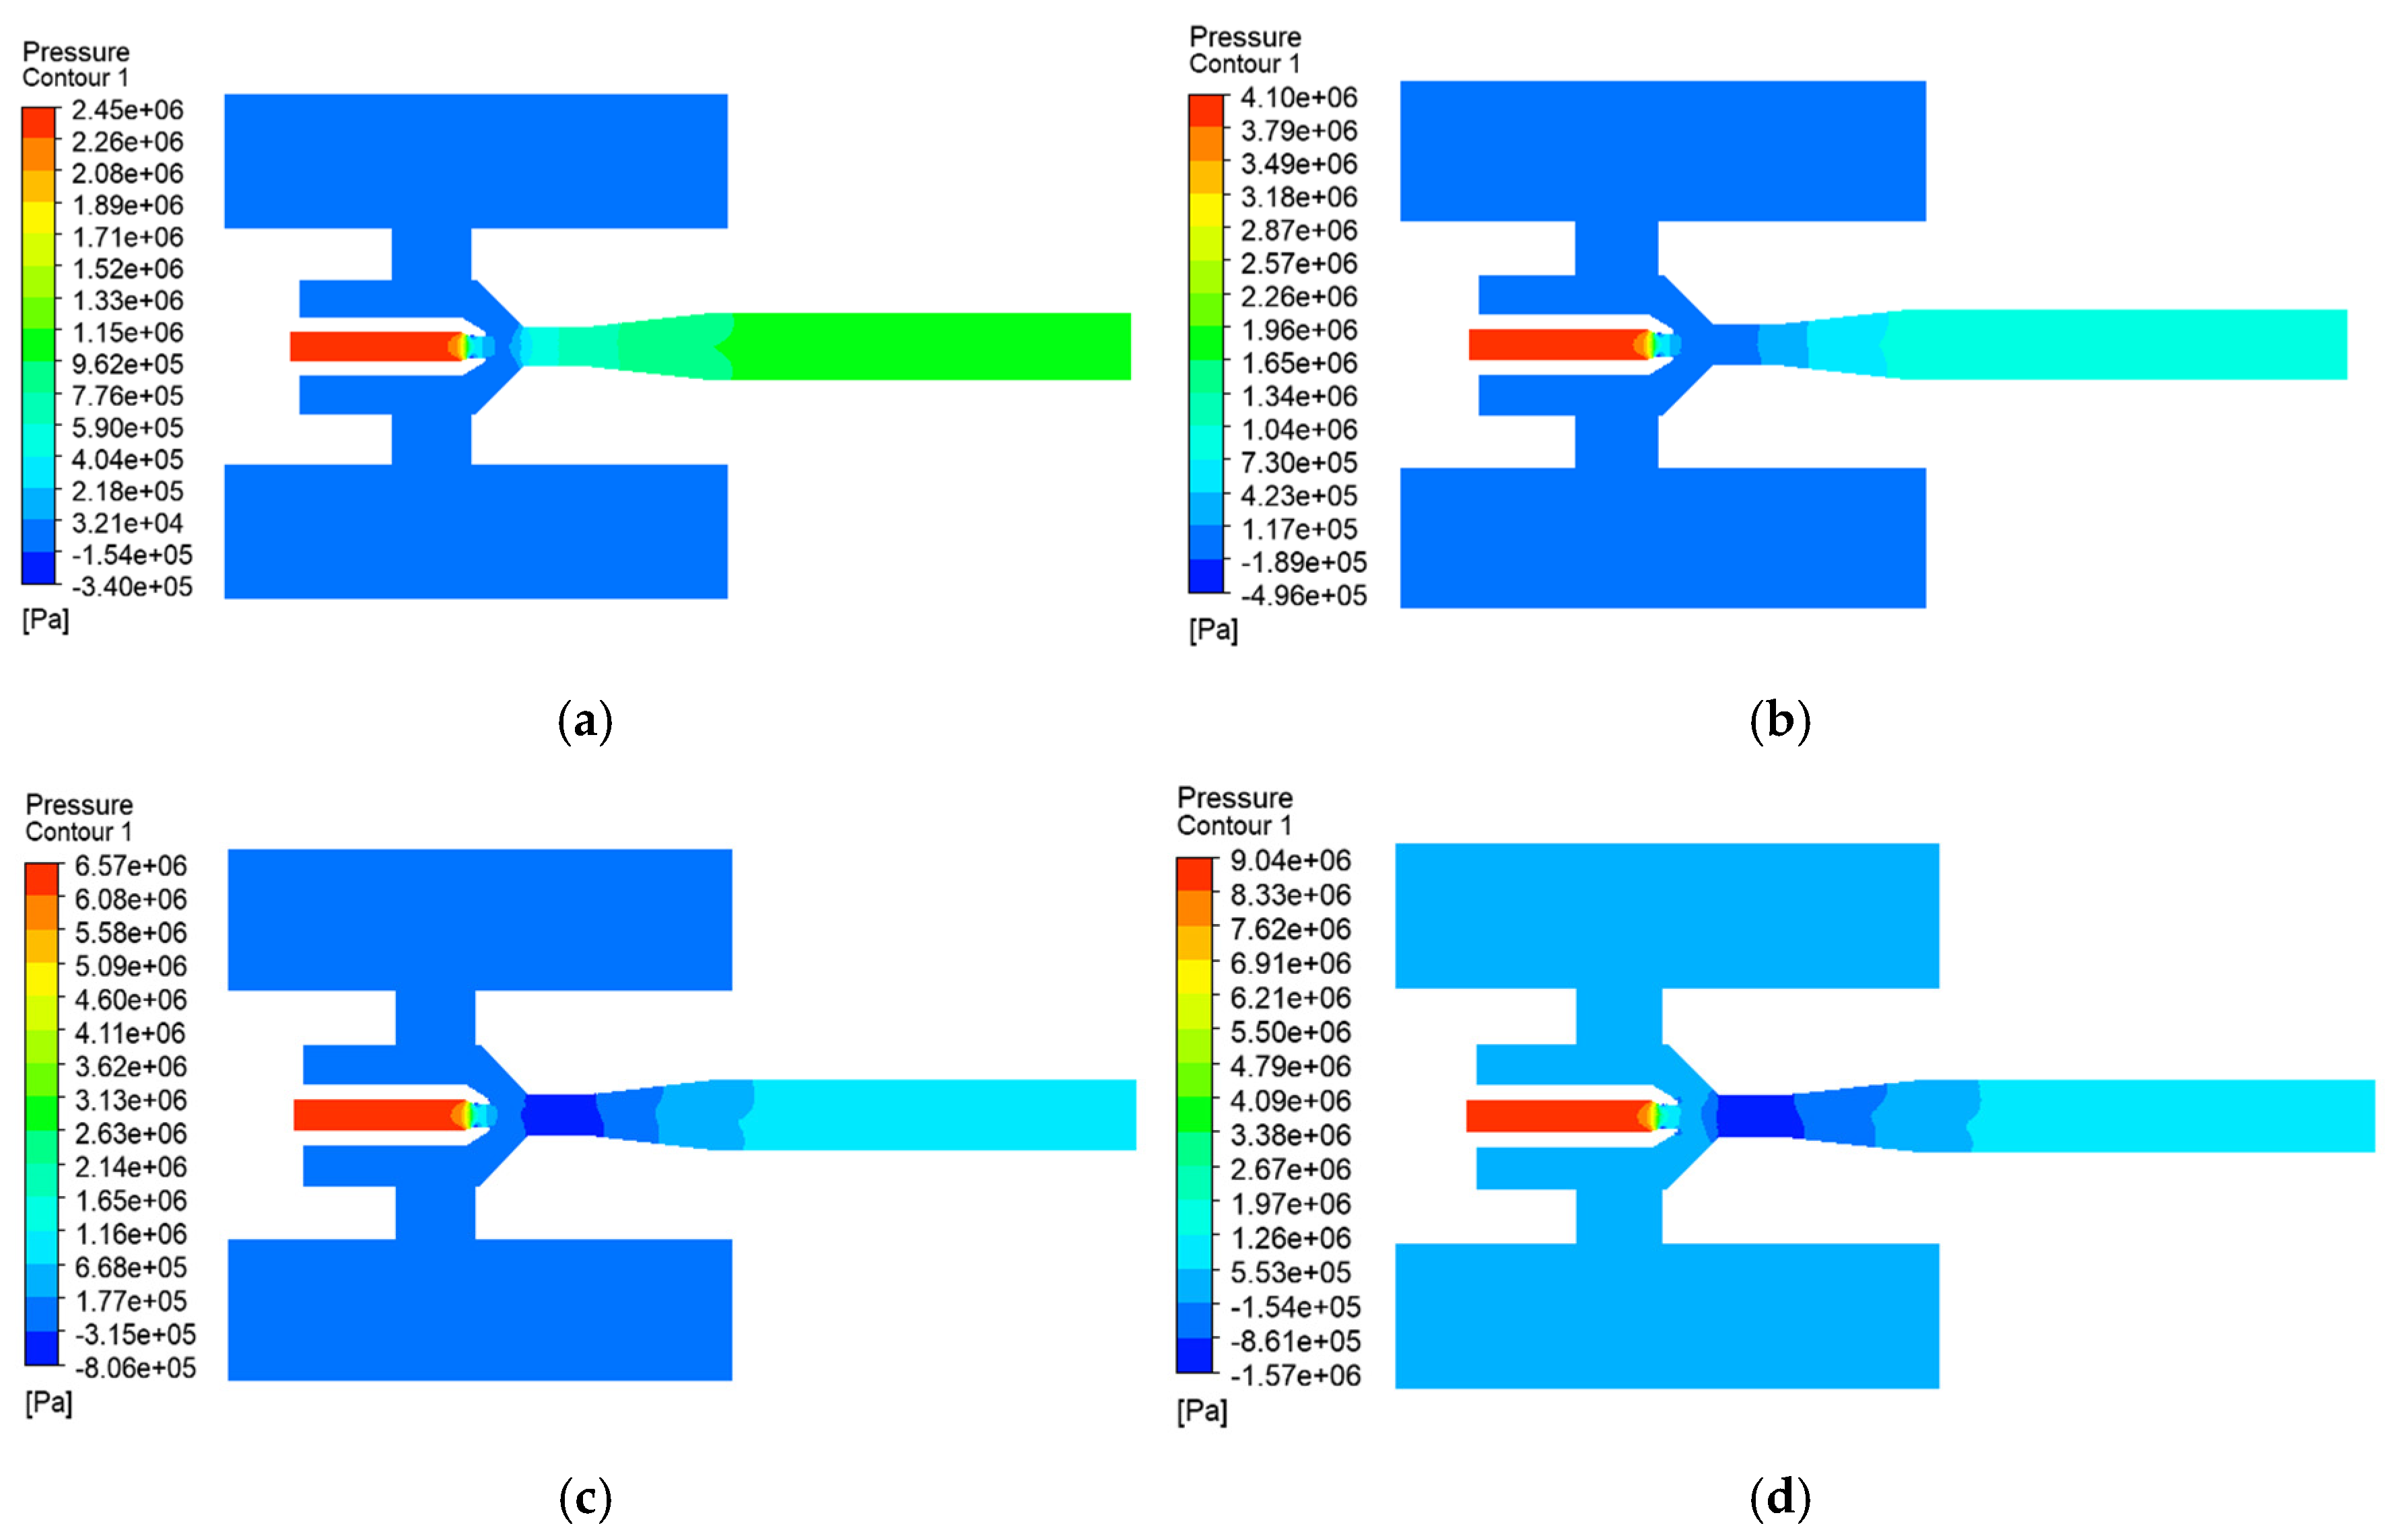
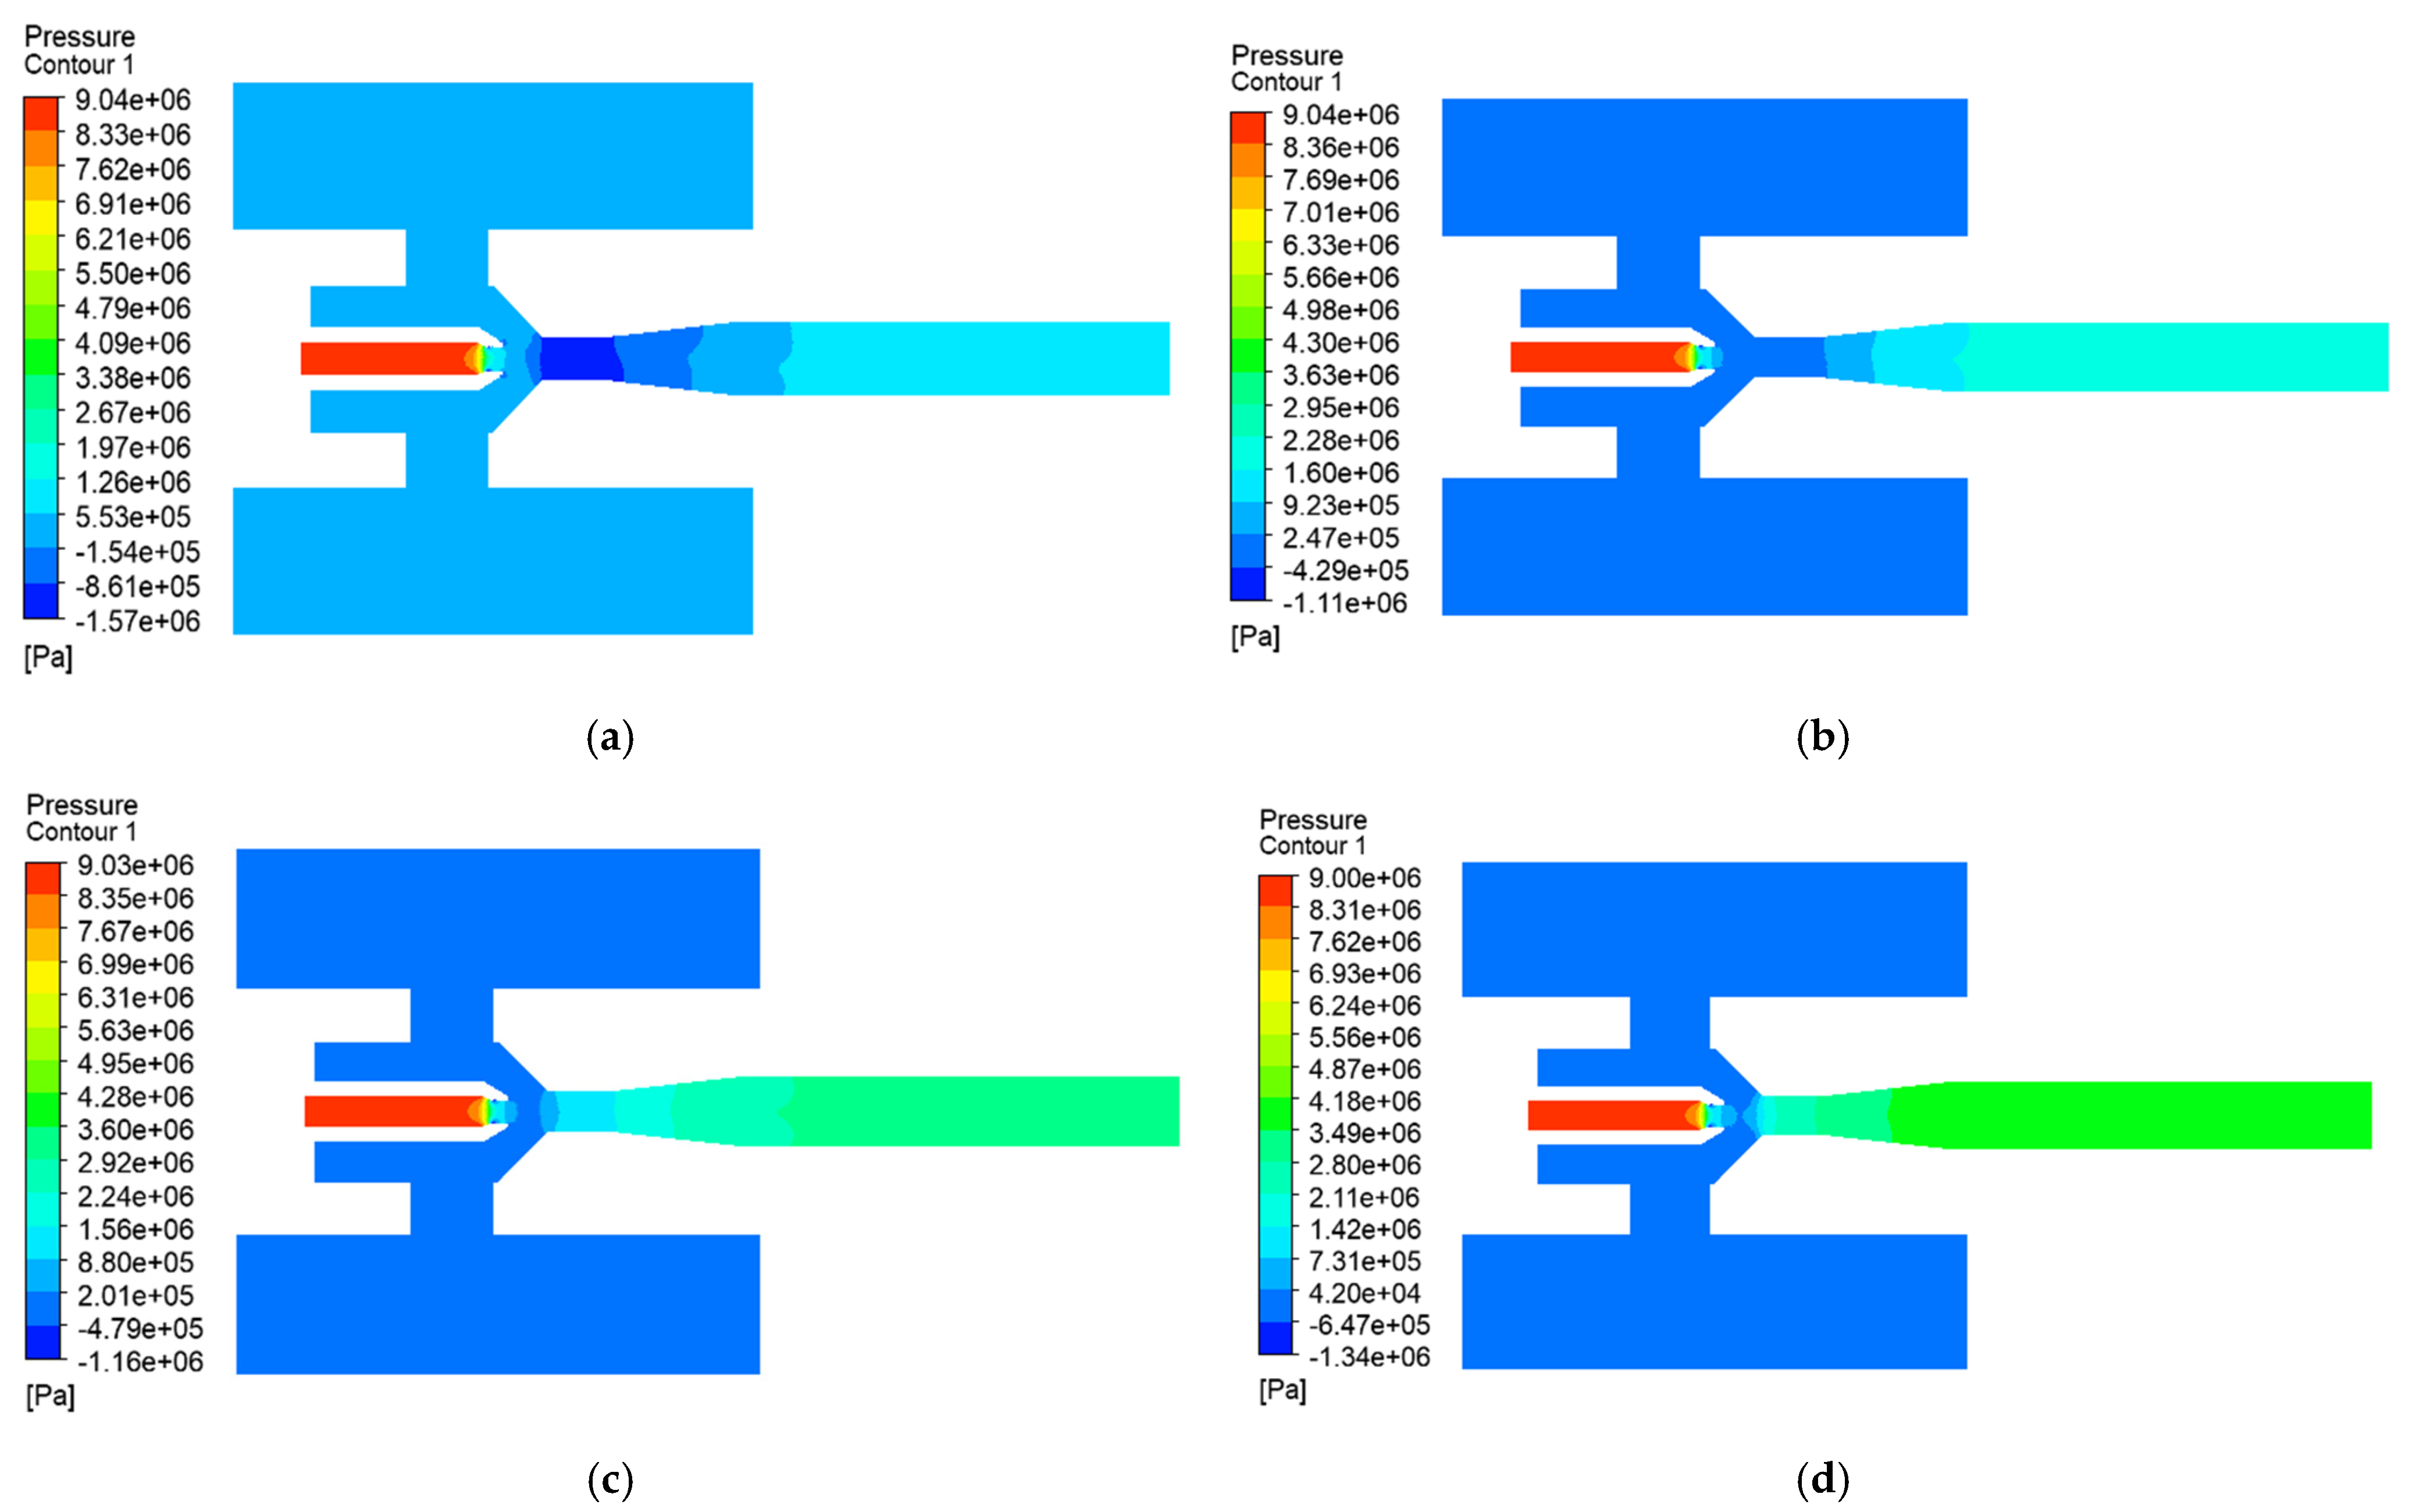
Pressure distribution analysis: Figure 5 reveals that as the working pressure increases, the pressure difference between the throat section and wellbore annulus increases from 0.08 MPa to 3.2 MPa. At a lower working pressure, ranging from 3 to 5 MPa, the minimum pressure zone is primarily located at the suction channel near the nozzle. When the working pressure rises to 8–11 MPa, the previously mentioned low-pressure zone shifts to the throat section and expands axially. This indicates momentum transfer inefficiency due to flow separation and wall friction effects. Pressure field evolution confirms enhanced suction capability at higher pressures. Our low-pressure zones align with Zhou’s (2012) LES simulations [12], but our model captures 15% stronger suction gradients due to particle interactions.
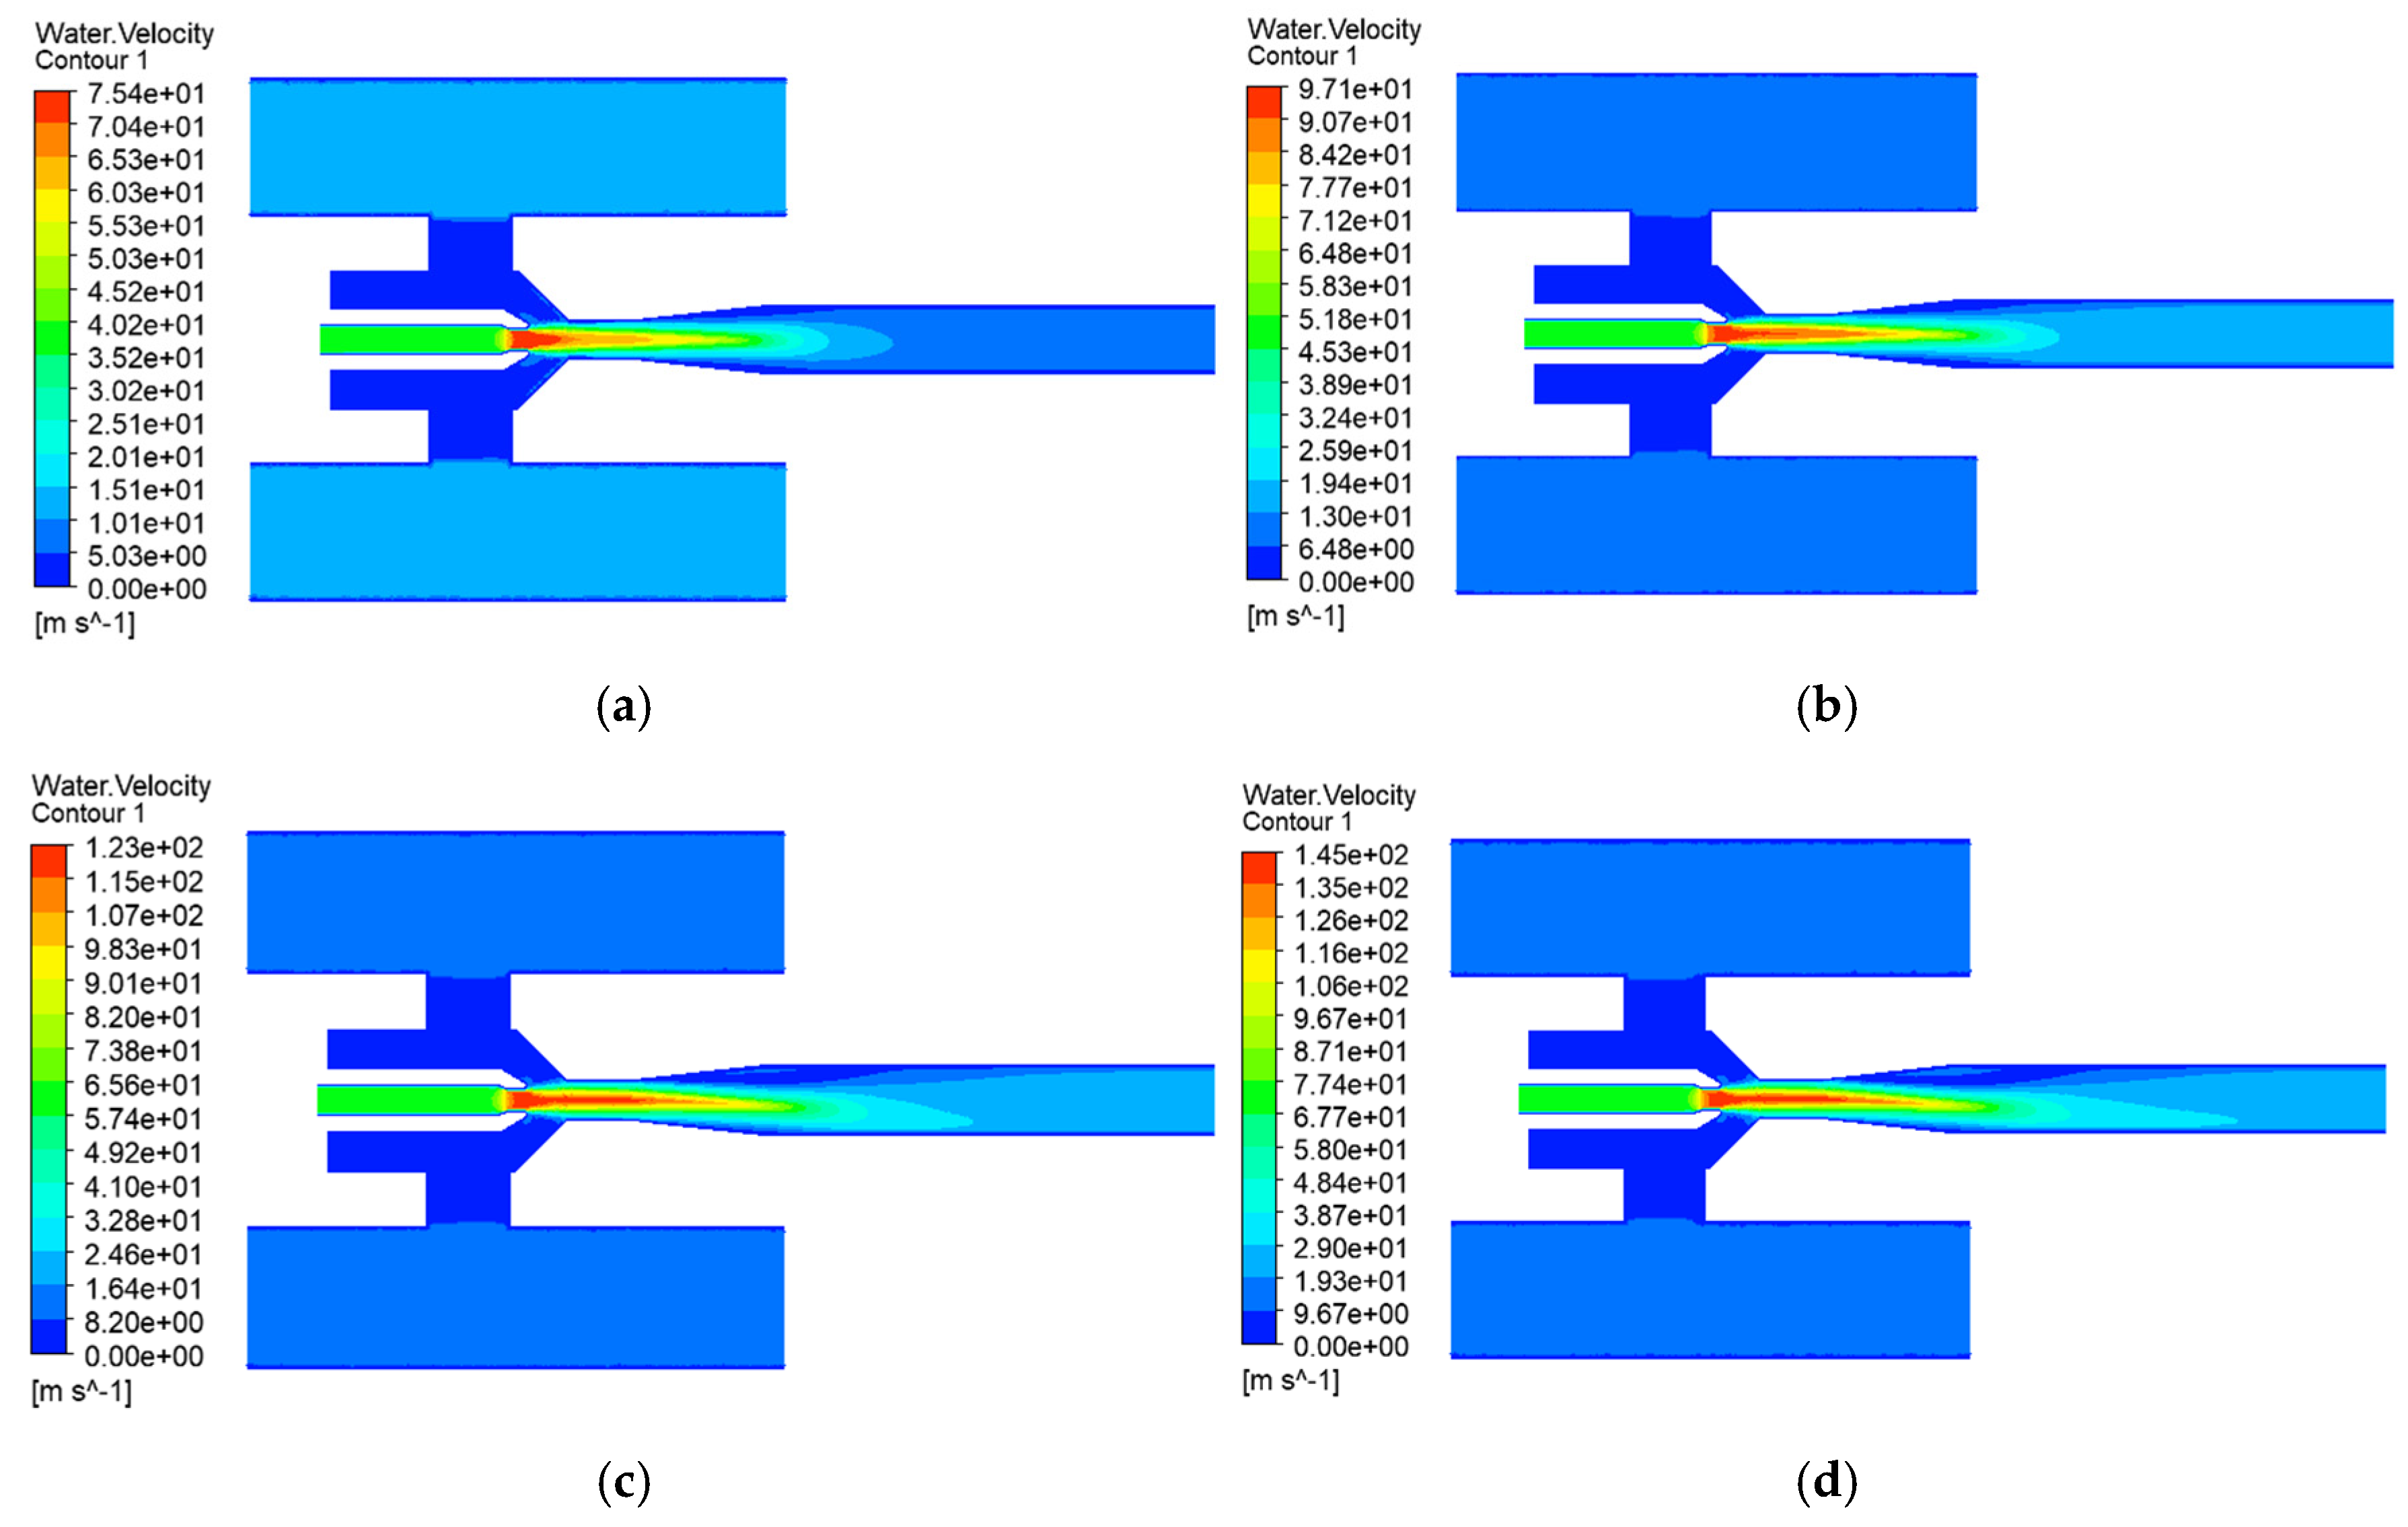
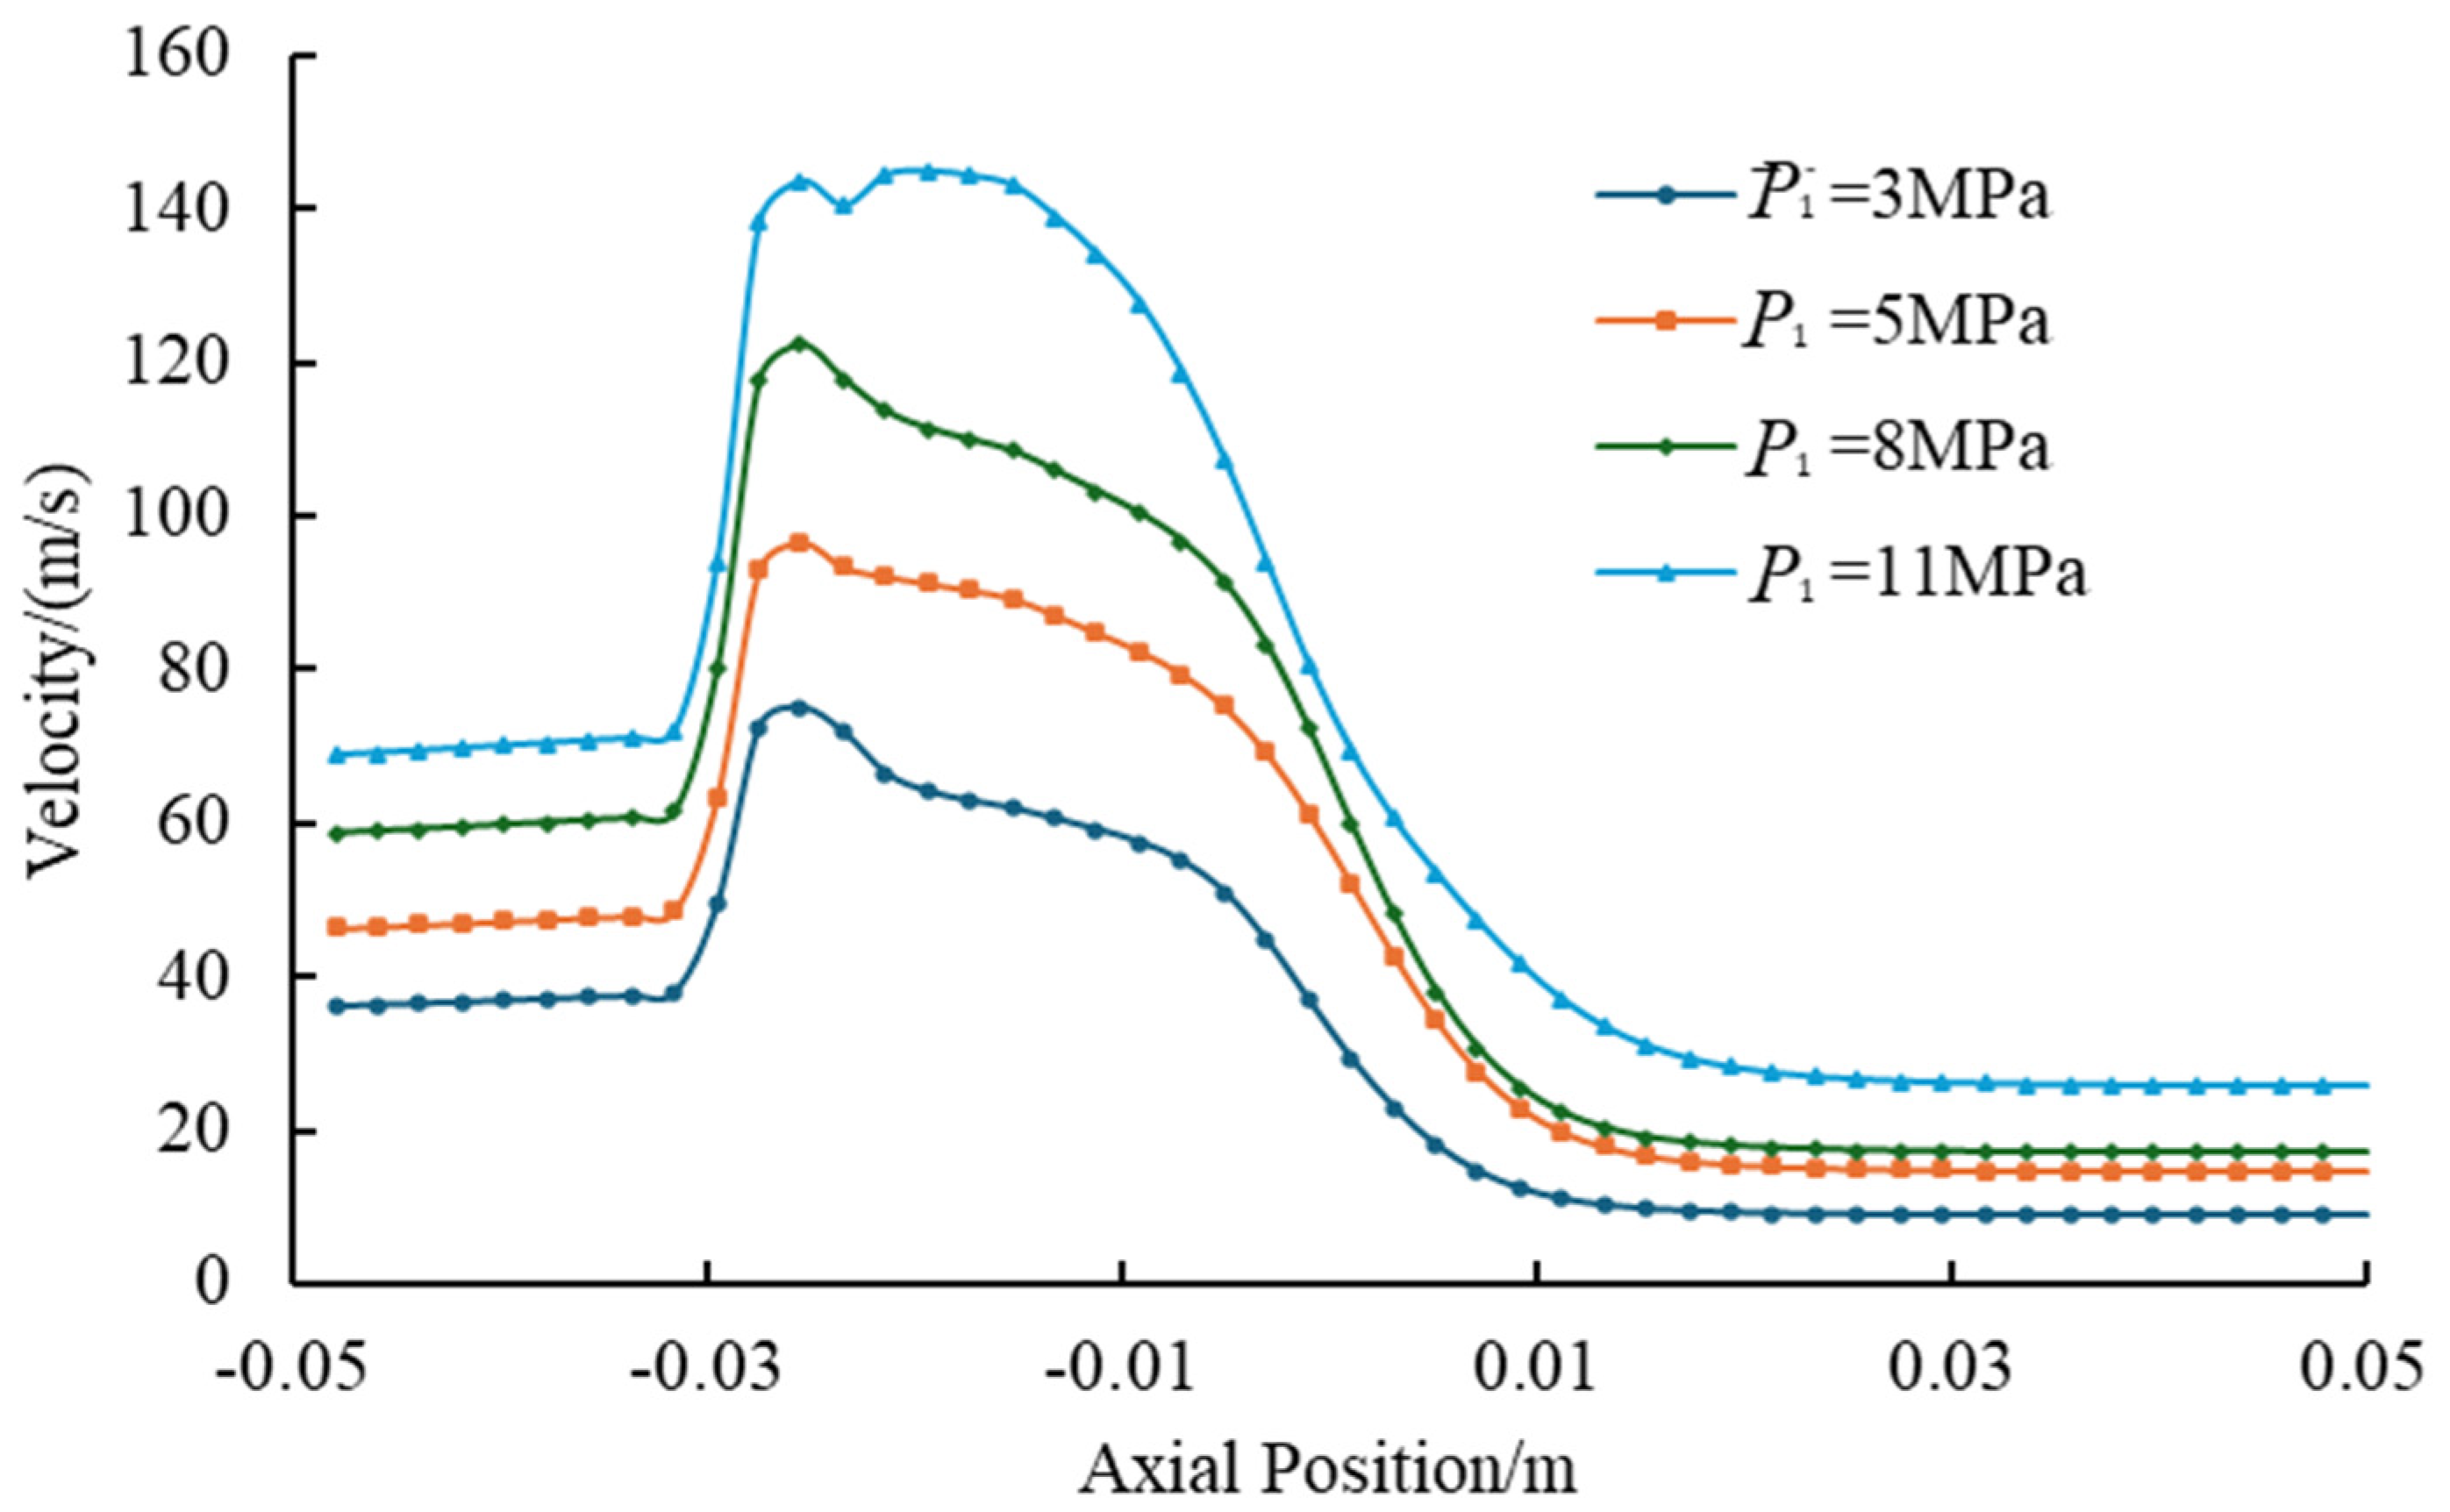
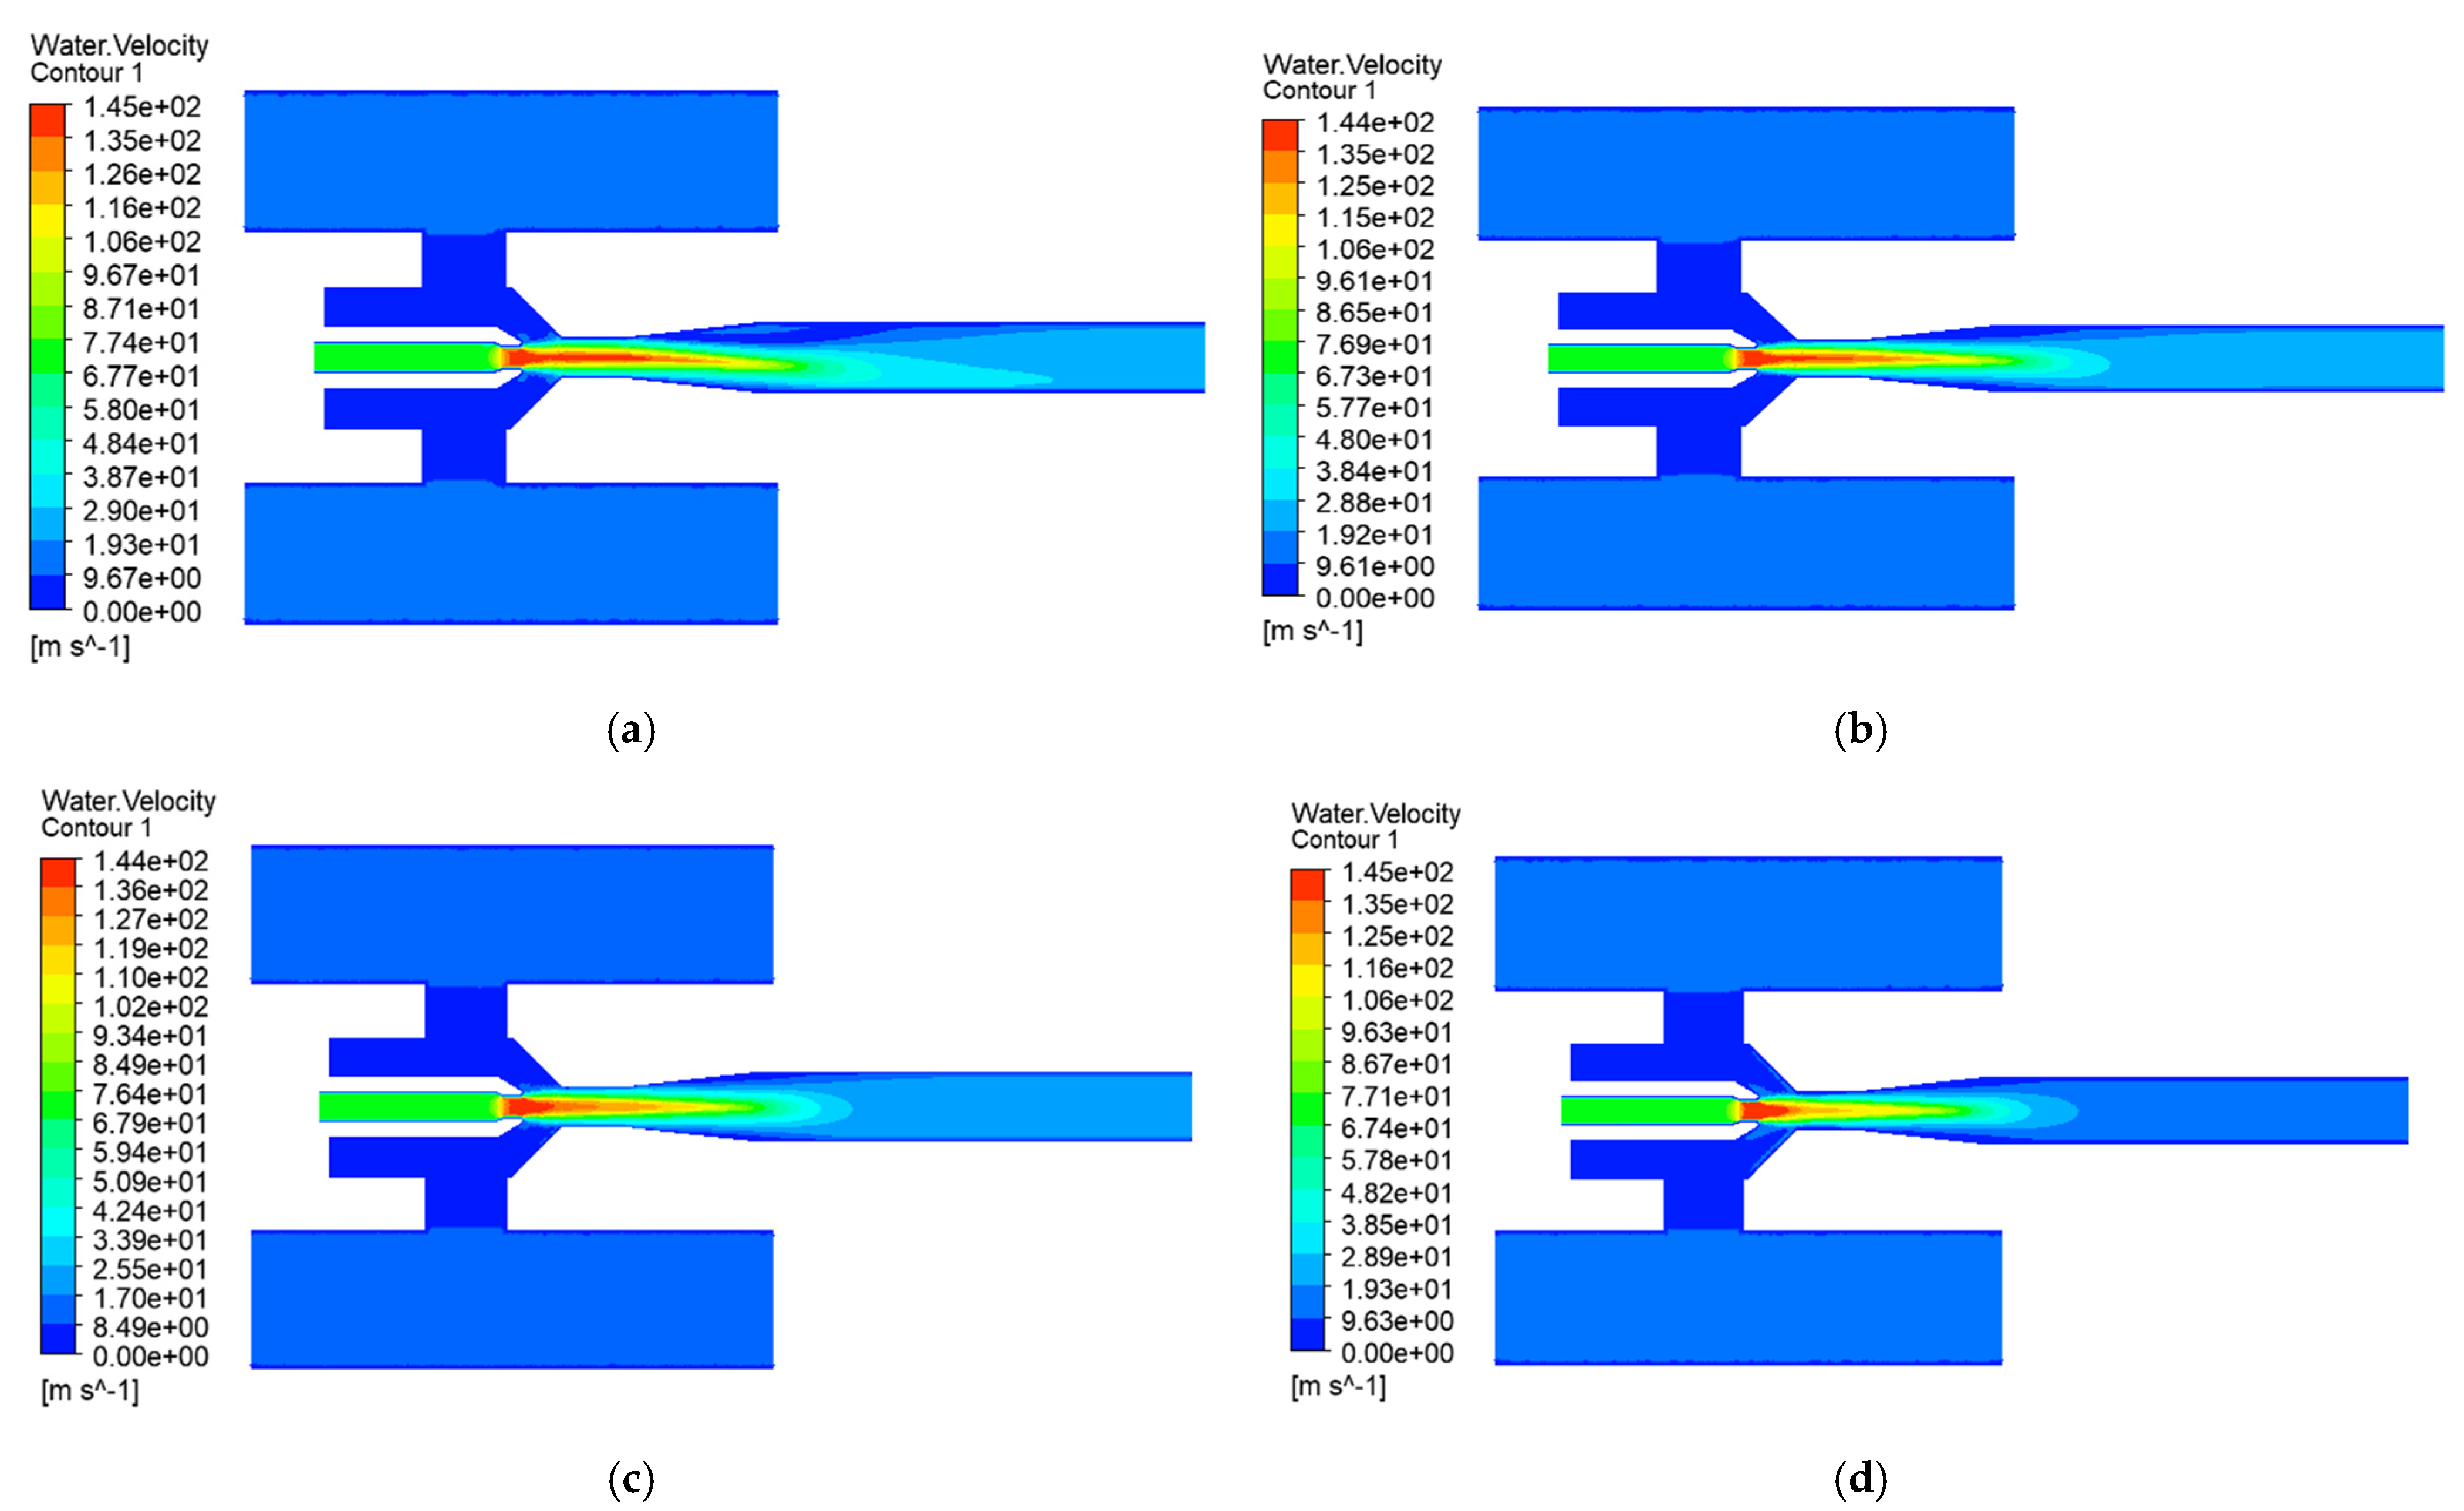
Liquid-phase velocity characteristics: Figure 6 and Figure 7 demonstrate that as the working pressure increases, the jet velocity at the nozzle outlet significantly increases. The maximum velocity along the central axis rises from approximately 72 m/s at 3 MPa to 144 m/s at 11 MPa. In actual conditions, considering the nozzle discharge coefficient (0.95–0.98), the jet velocity can reach 144 m/s. Although the spatial extent of the high-velocity jet core expands with increasing pressure, velocity distribution becomes increasingly uneven beyond 8 MPa, particularly in the throat and diffuser sections. while flow separation at the diffuser entrance causes non-uniformity. This explains the efficiency peak at 5 MPa where the flow remains attached.
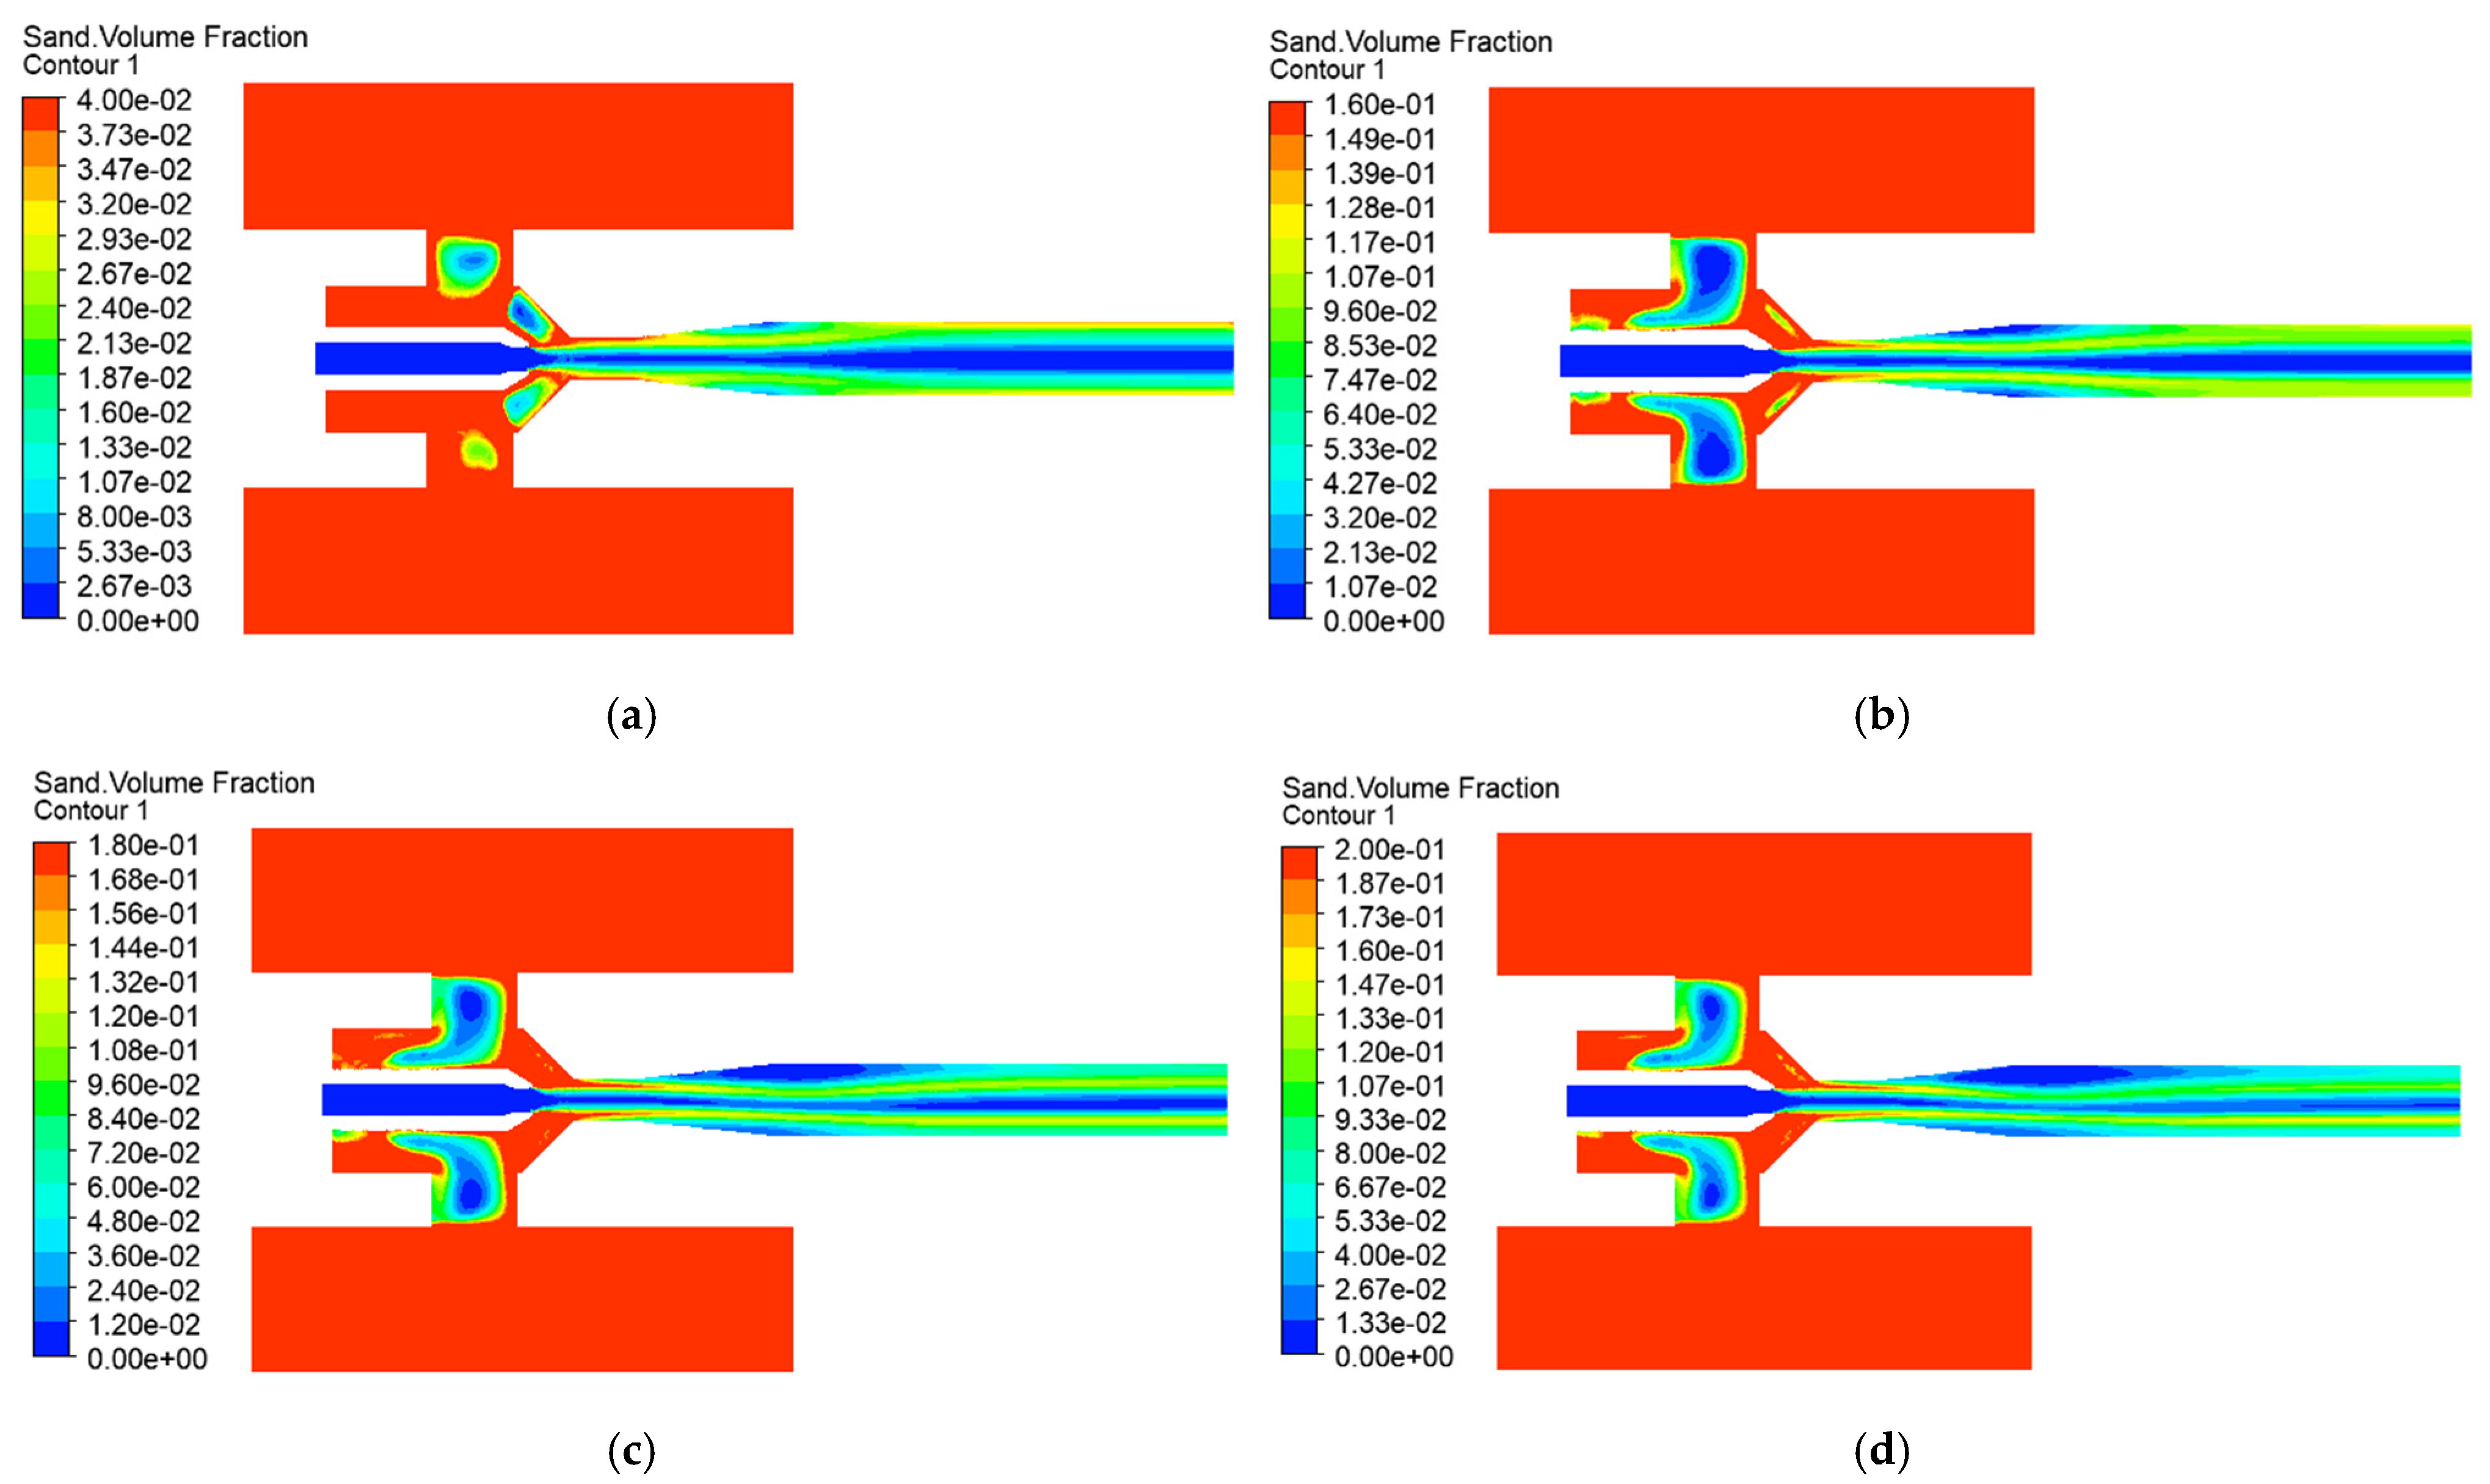
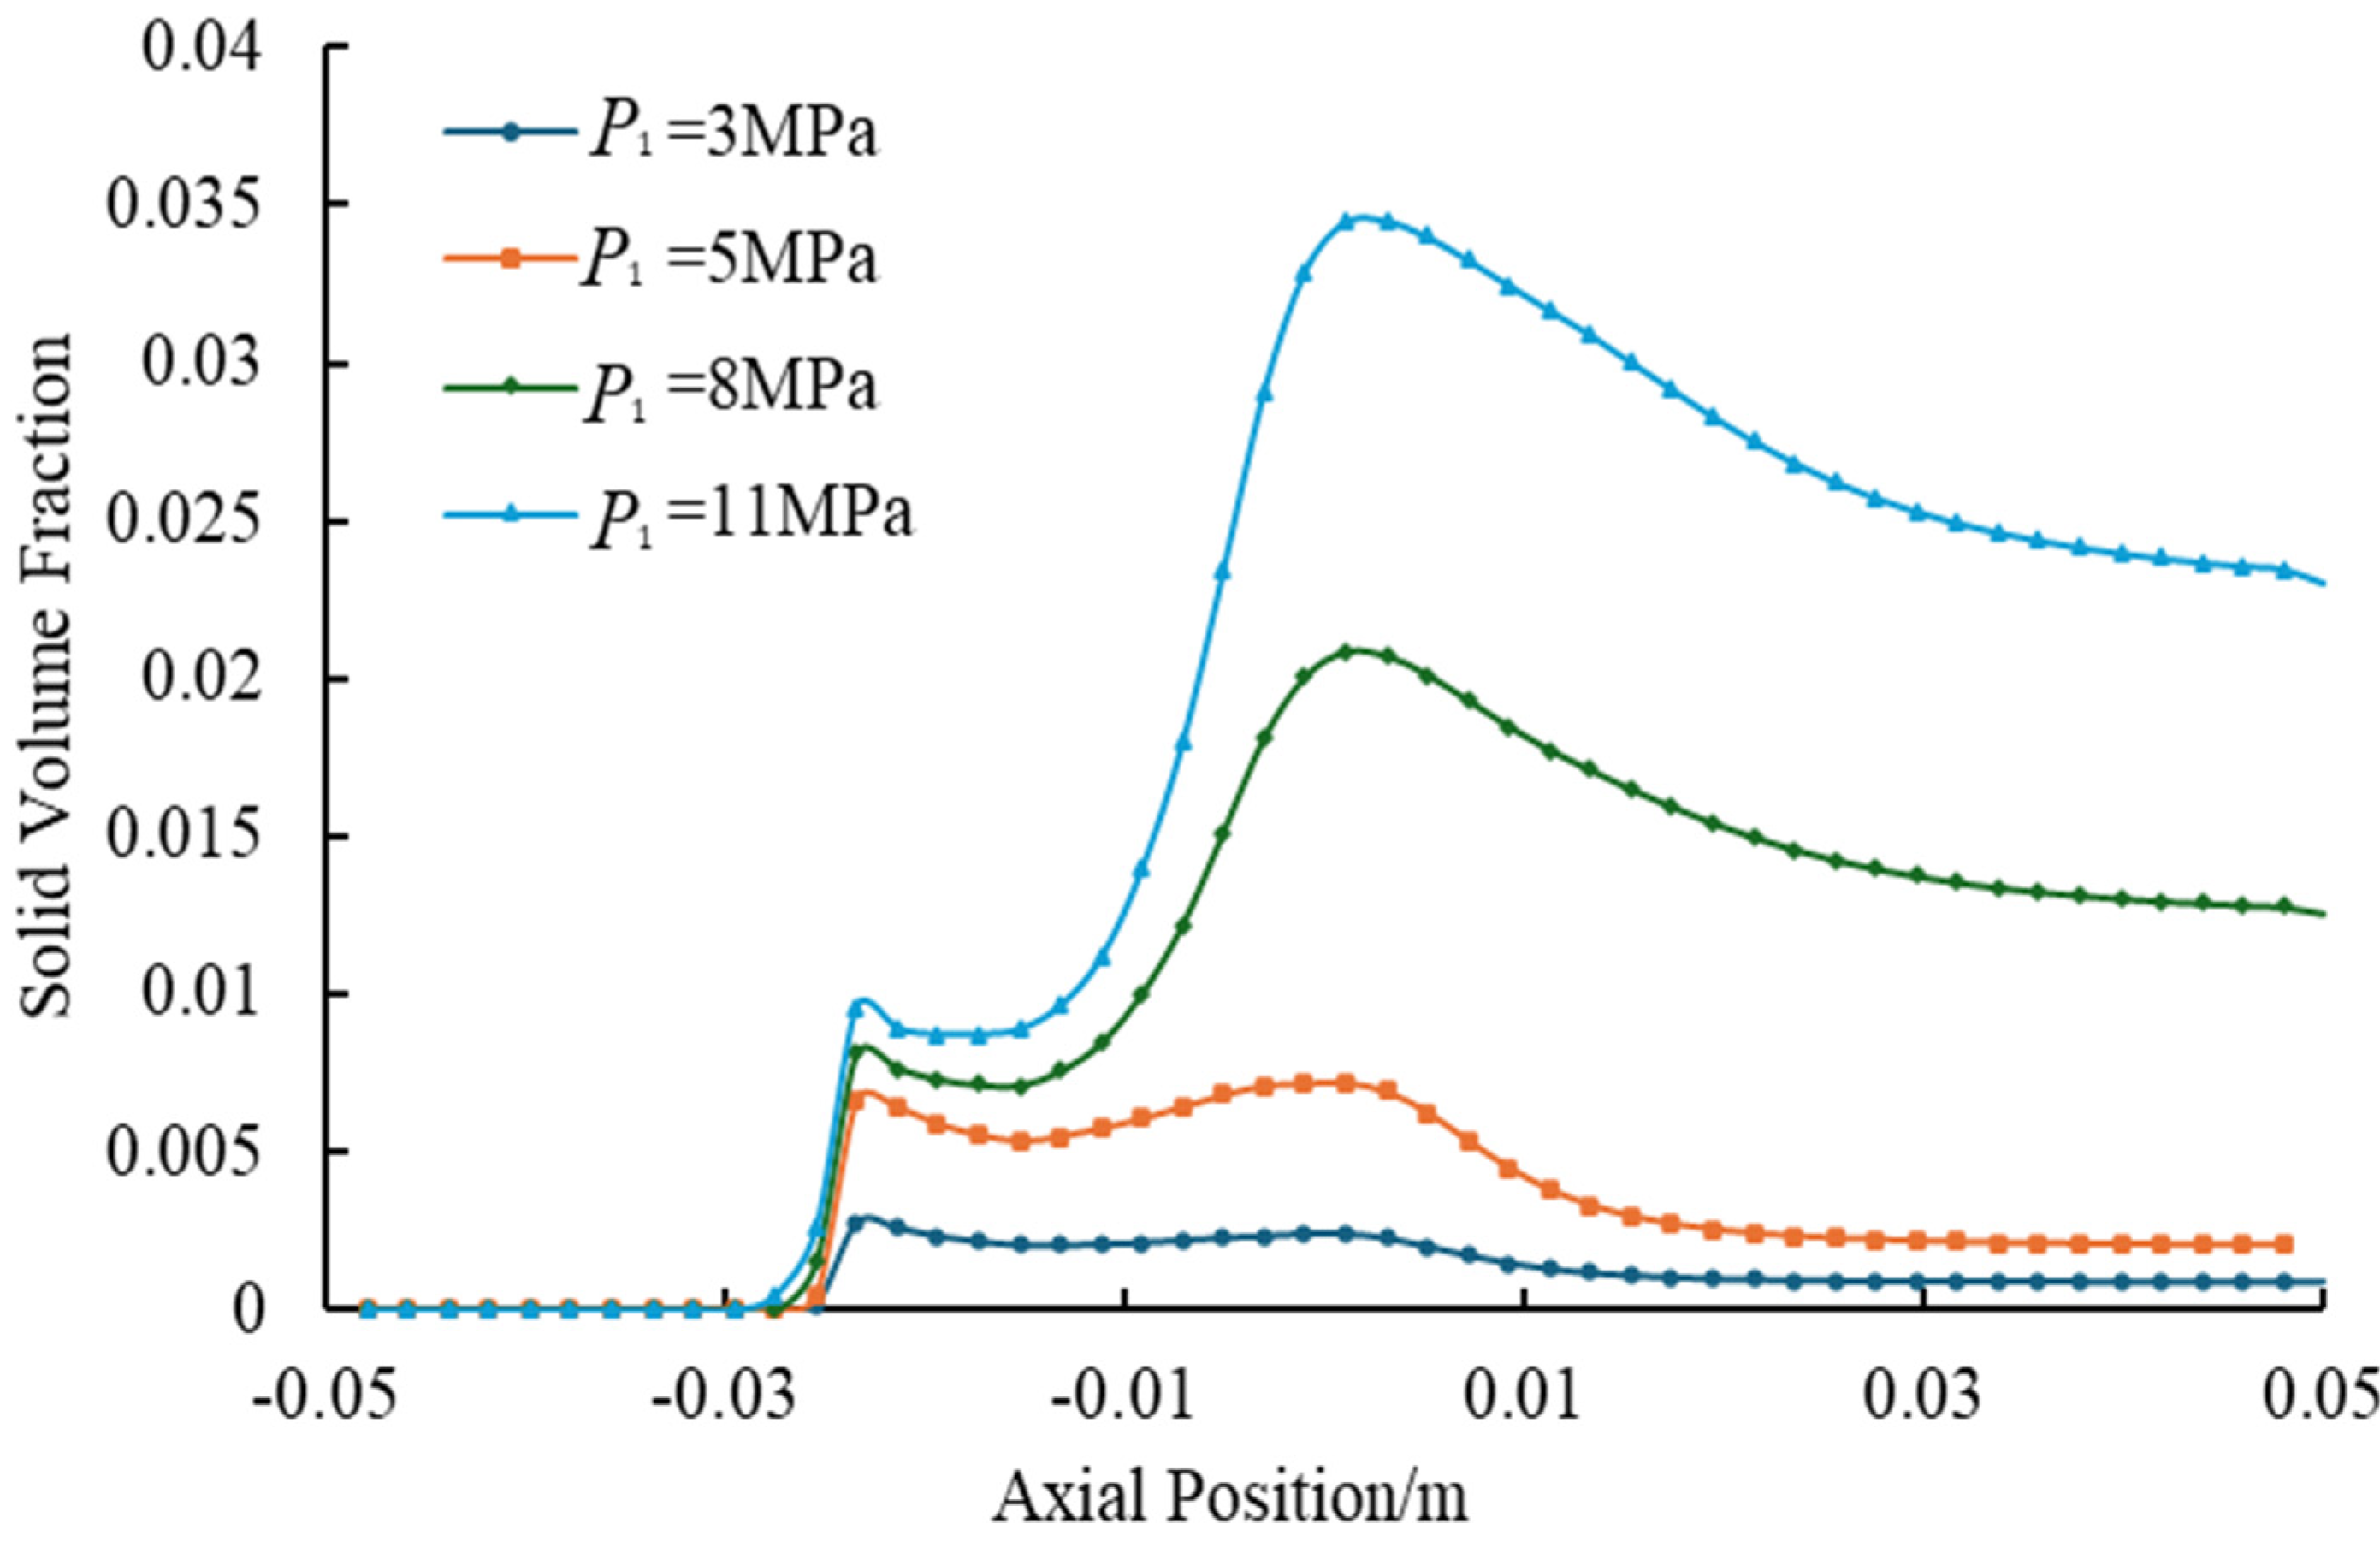
Solid-phase distribution patterns: Figure 8 and Figure 9 show the relationship between the working pressure and the volume fraction of sand during the simulation, indicating that that an increasing working pressure significantly enhances the solid volume fraction in the throat and diffuser sections. At a working pressure of 3 MPa, the solid concentration approaches the background level near the entrance of the throat, while the localized values exceed 0.025 at a working pressure of 11 MPa. Notably, lower working pressures cause solid-phase accumulation near the throat wall, whereas higher pressures promote uniform cross-sectional distribution. The elimination of wall-adjacent accumulation zones prevents particle retention.
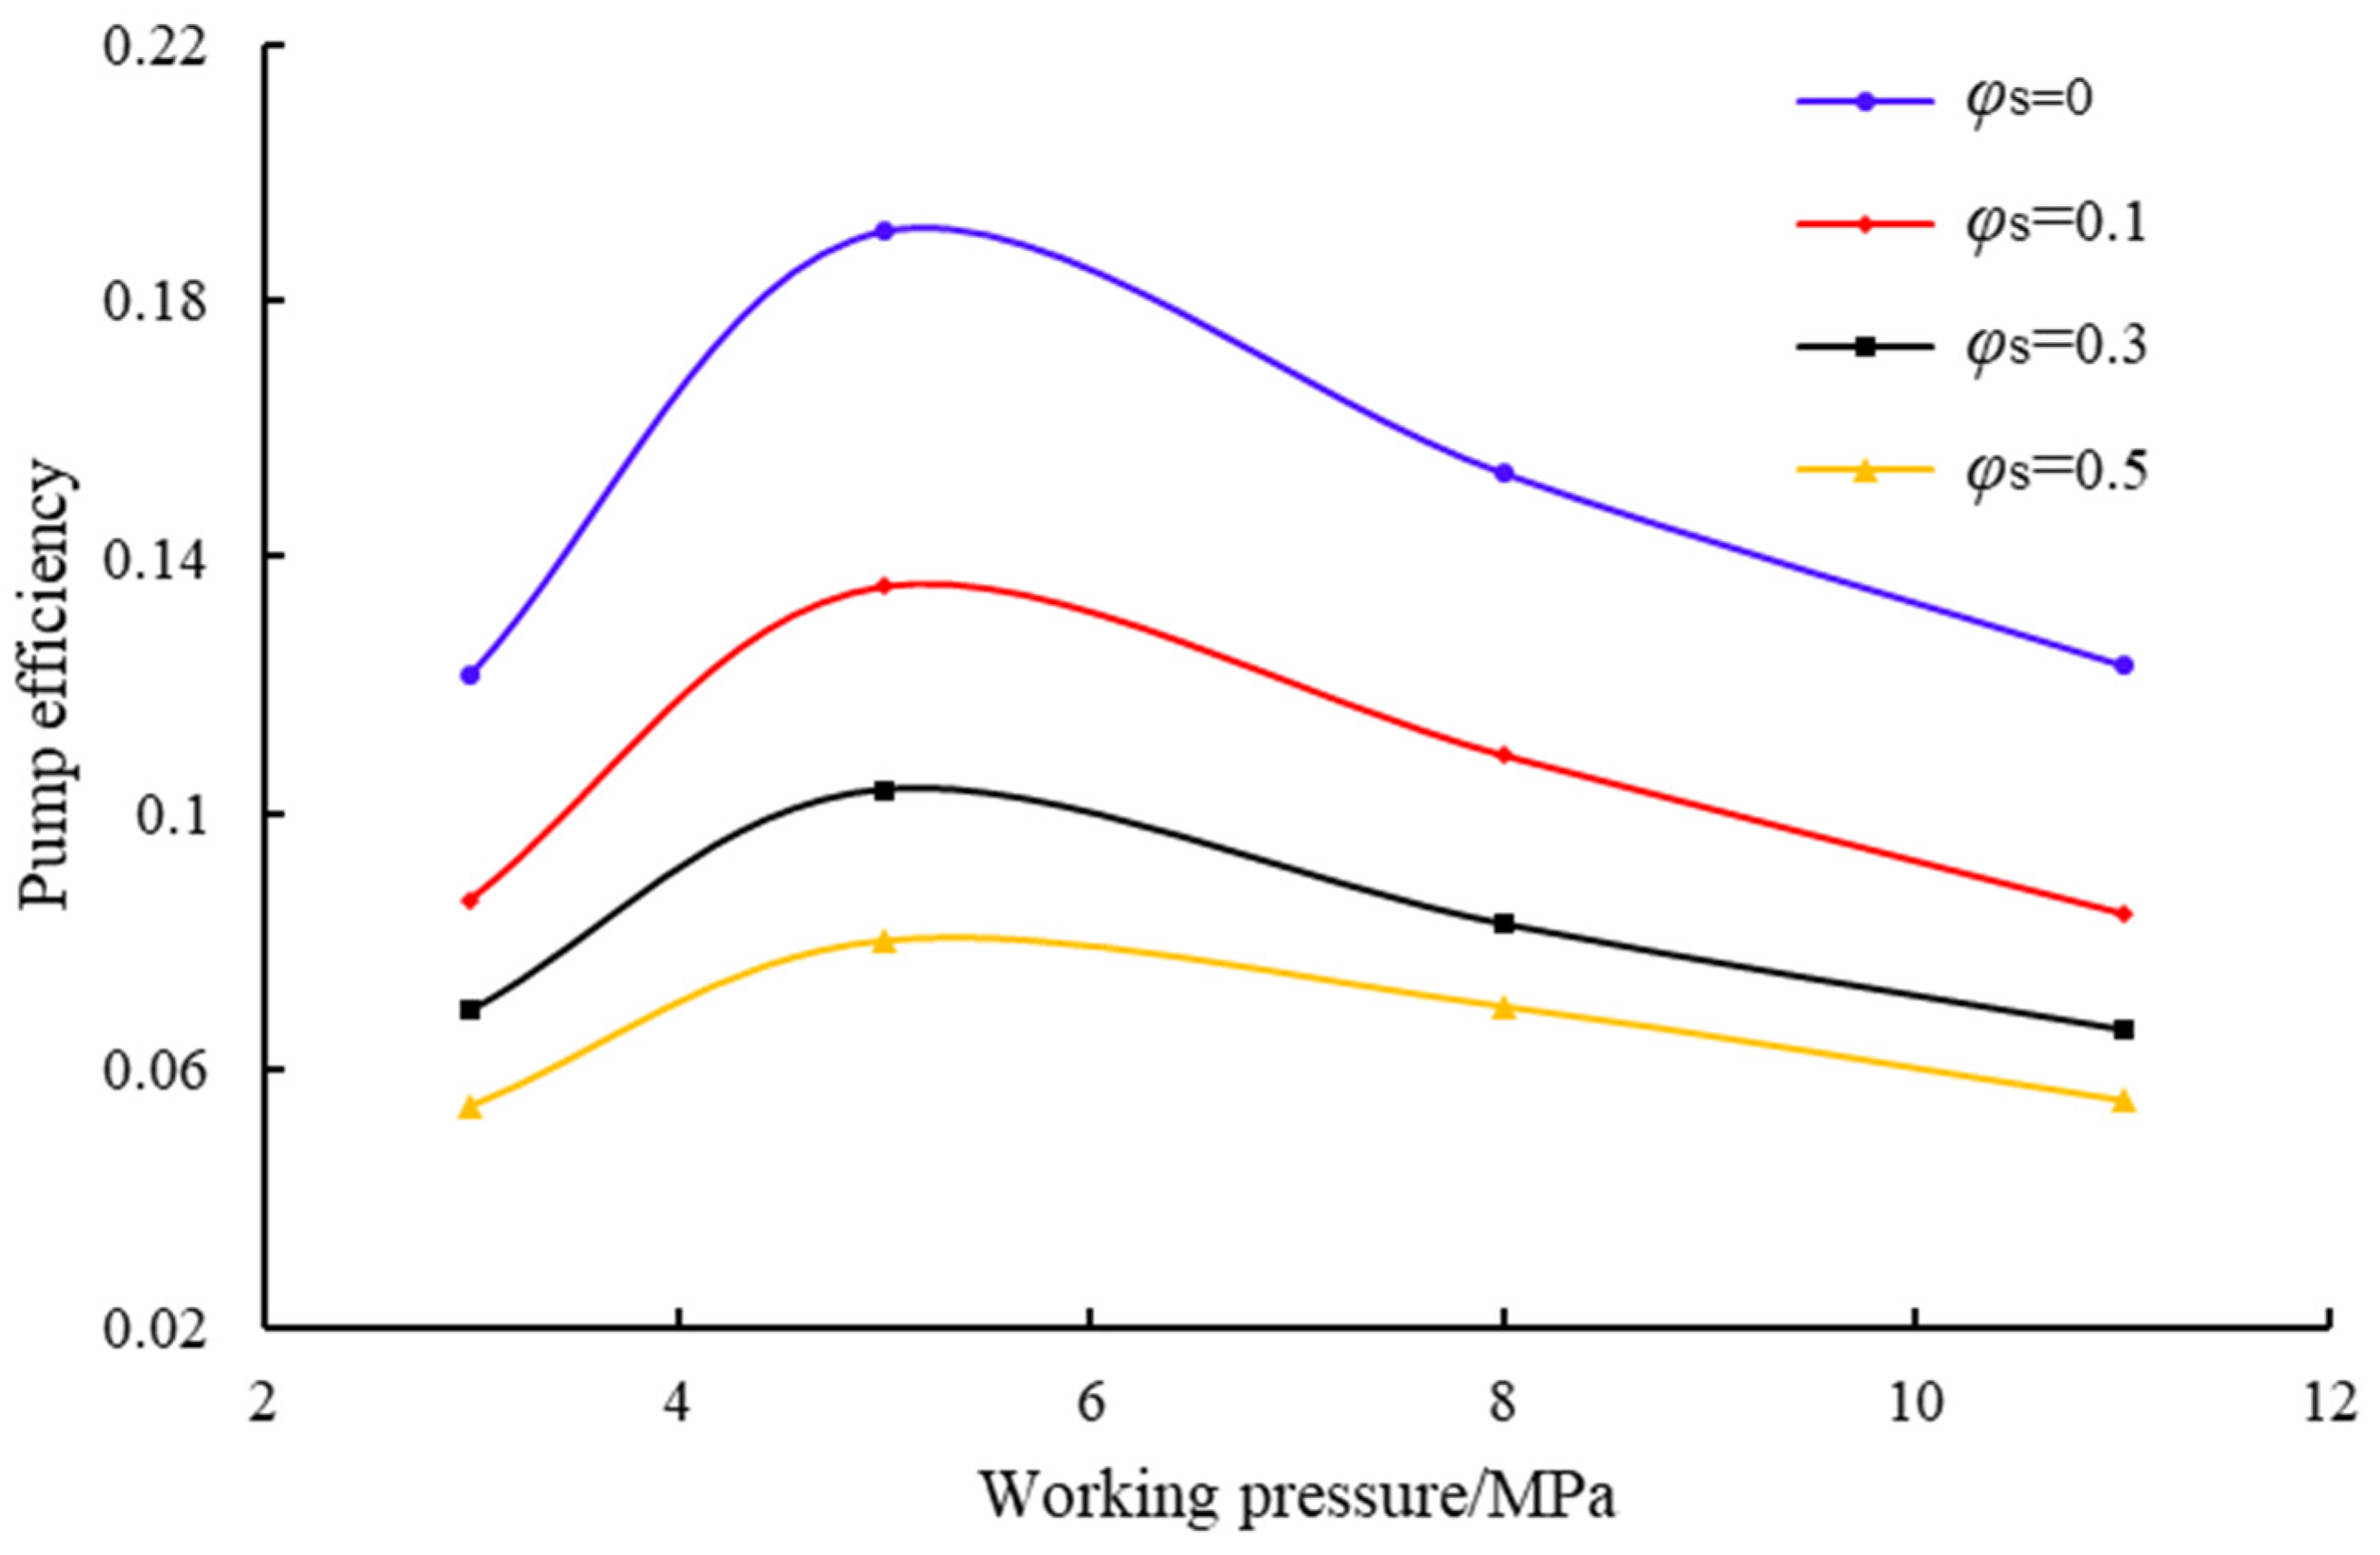
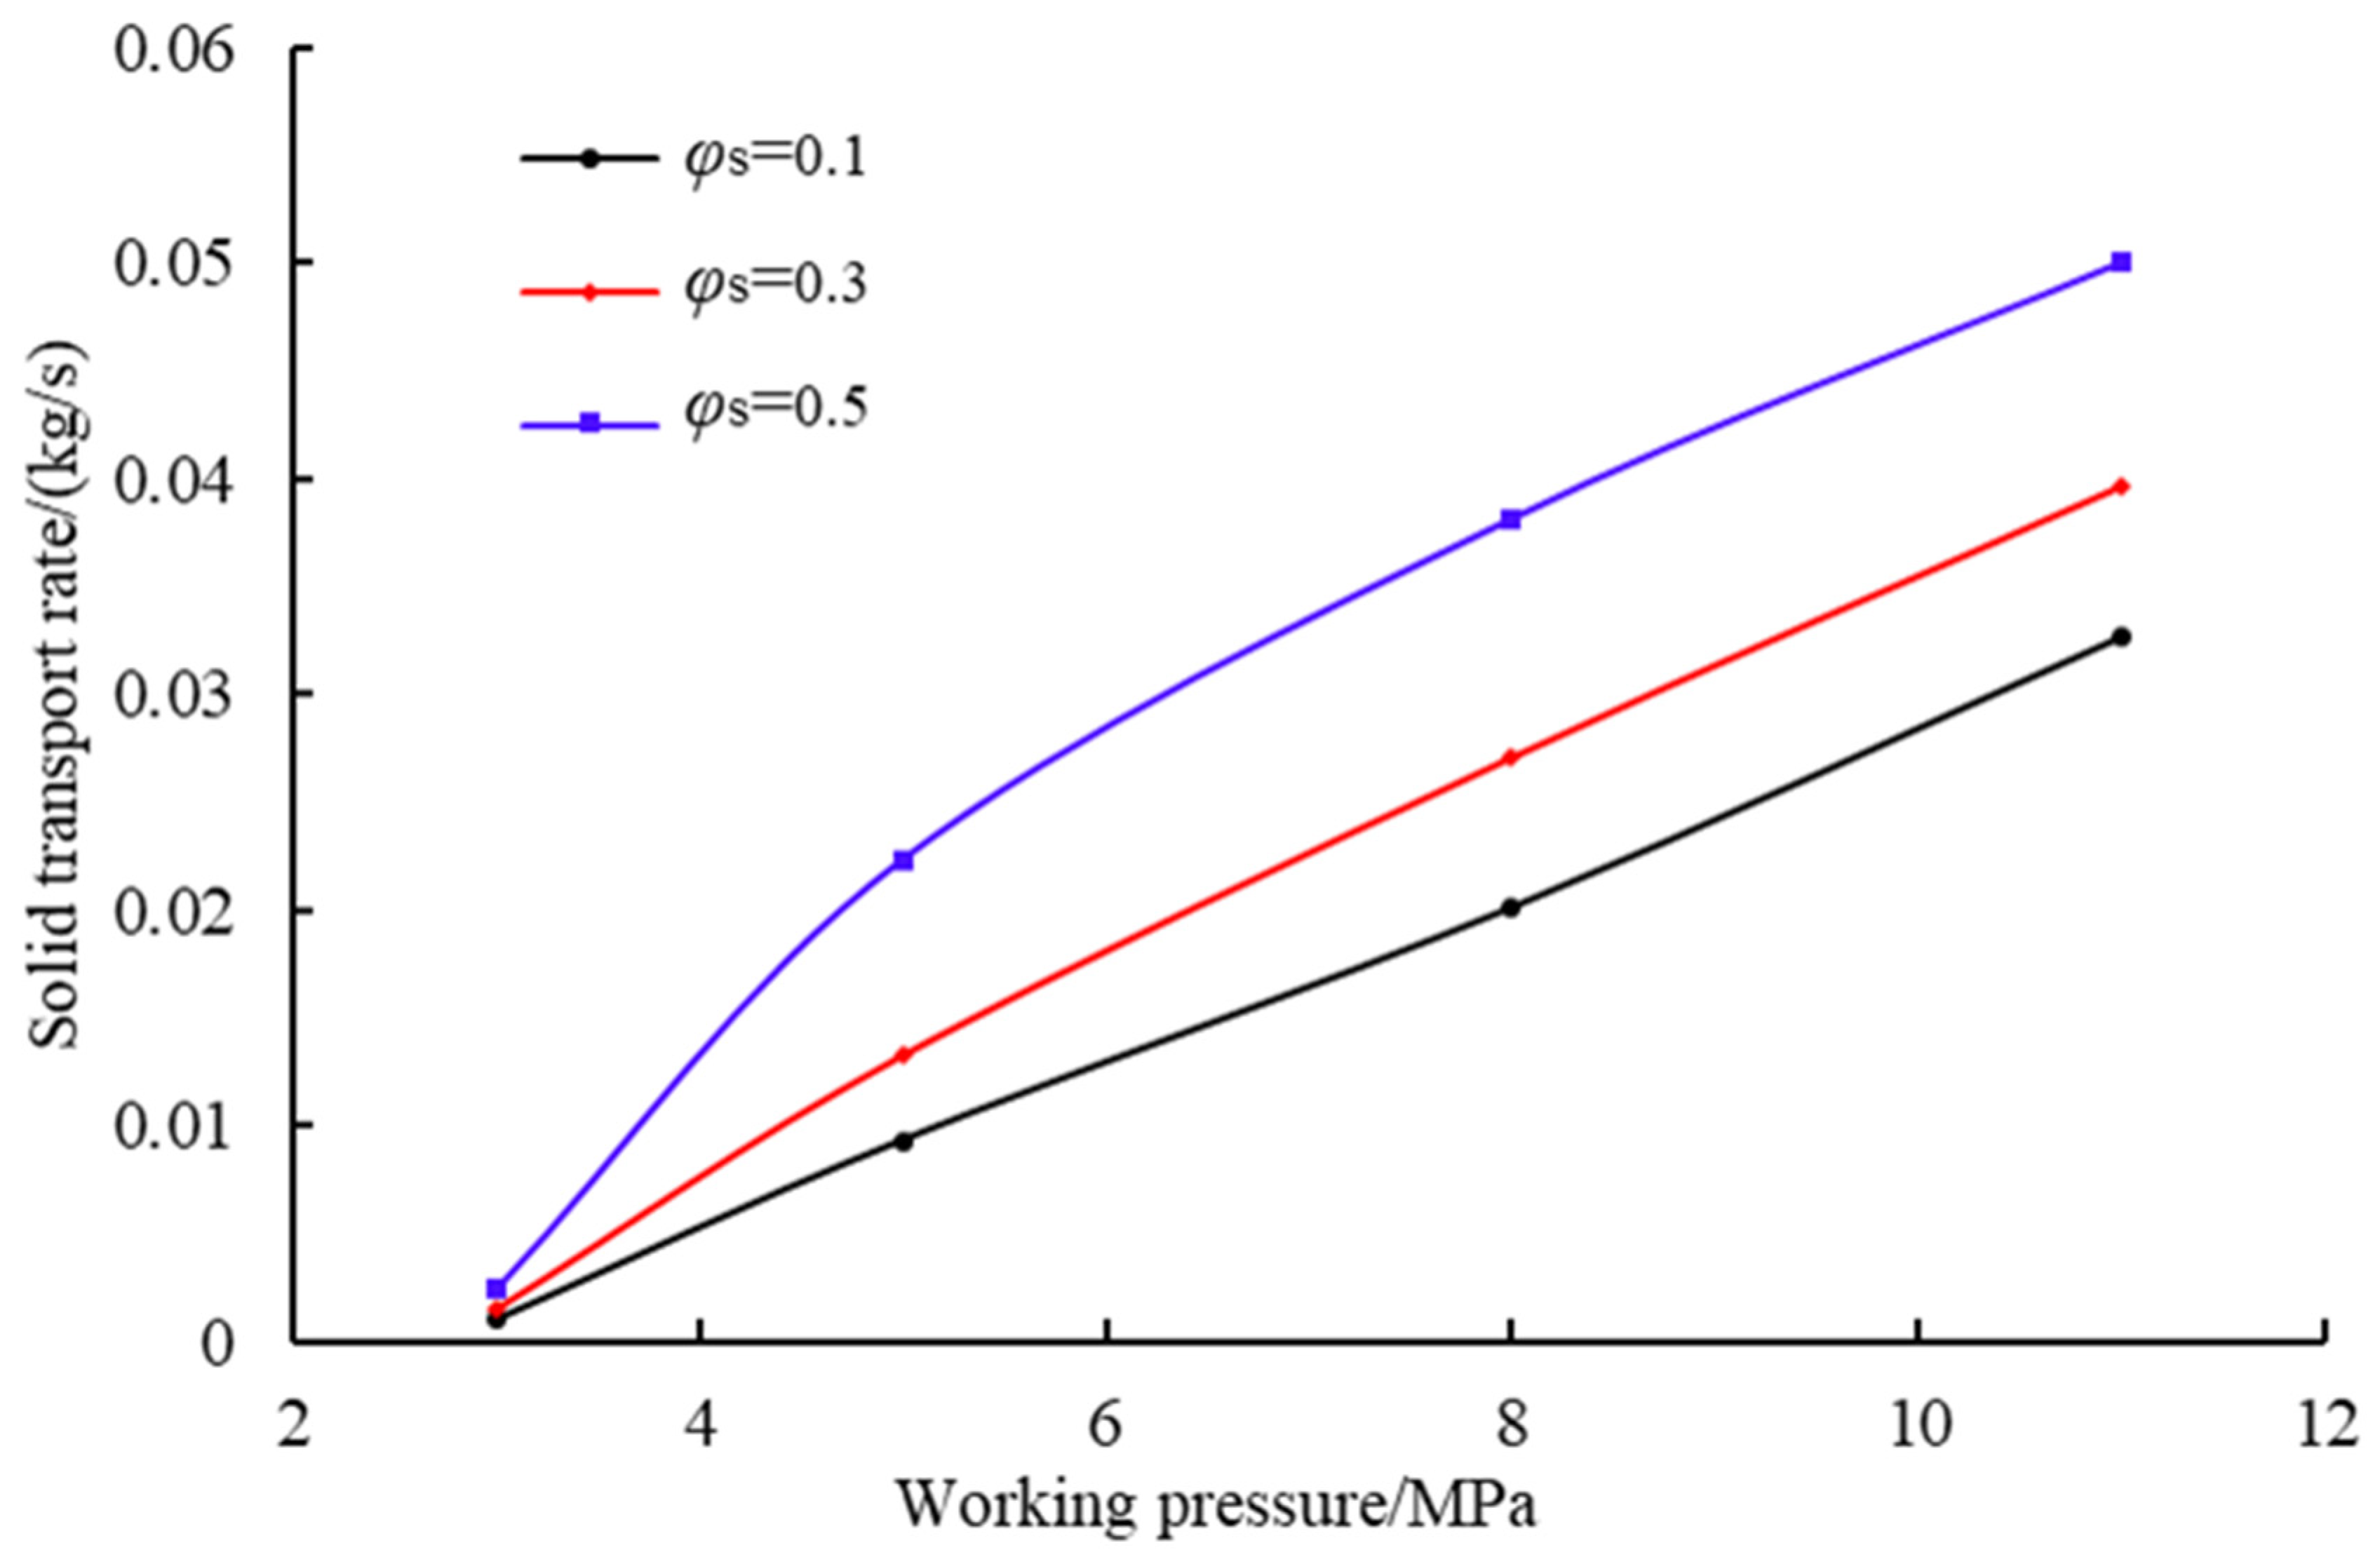
Performance quantification: Figure 10 and Figure 11 reveal dual effects based on the boundary monitoring data: Pump efficiency (E) demonstrates unimodal distribution characteristics, reaching peak values near 13.5% at a working pressure of 5 MPa and a solid volume fraction of 0.1. Beyond this pressure threshold, the efficiency progressively declines due to intensified turbulent dissipation. Conversely, the solid transport rate exhibits sustained positive growth throughout the pressure range. At a solid volume fraction of 0.2, the transport rate increases by approximately 116% when the working pressure increases from 5 to 8 MPa, confirming enhanced particle entrainment capacity at higher energy inputs.
In contrast to the pump efficiency, the solid transport rate exhibited consistent positive growth tendency across the tested pressure range. At a solid volume fraction (φS) of 0.2, the solid transport rate ms underwent a substantial increase of 116% when the working pressure increased from 5 MPa to 8 MPa. This monotonic relationship underscores the direct impact of pressure elevation on particle entrainment capacity.
The negative correlation between E and ms confirms a fundamental engineering trade-off: improving the efficiency of removing sand layers underground requires reducing the energy utilization efficiency. This dichotomy requires balanced operational decisions, especially when selecting work pressure for on-site applications.

4.2. Effect of Discharge Pressure on Jet Pump Solid-Phase Transport Capacity

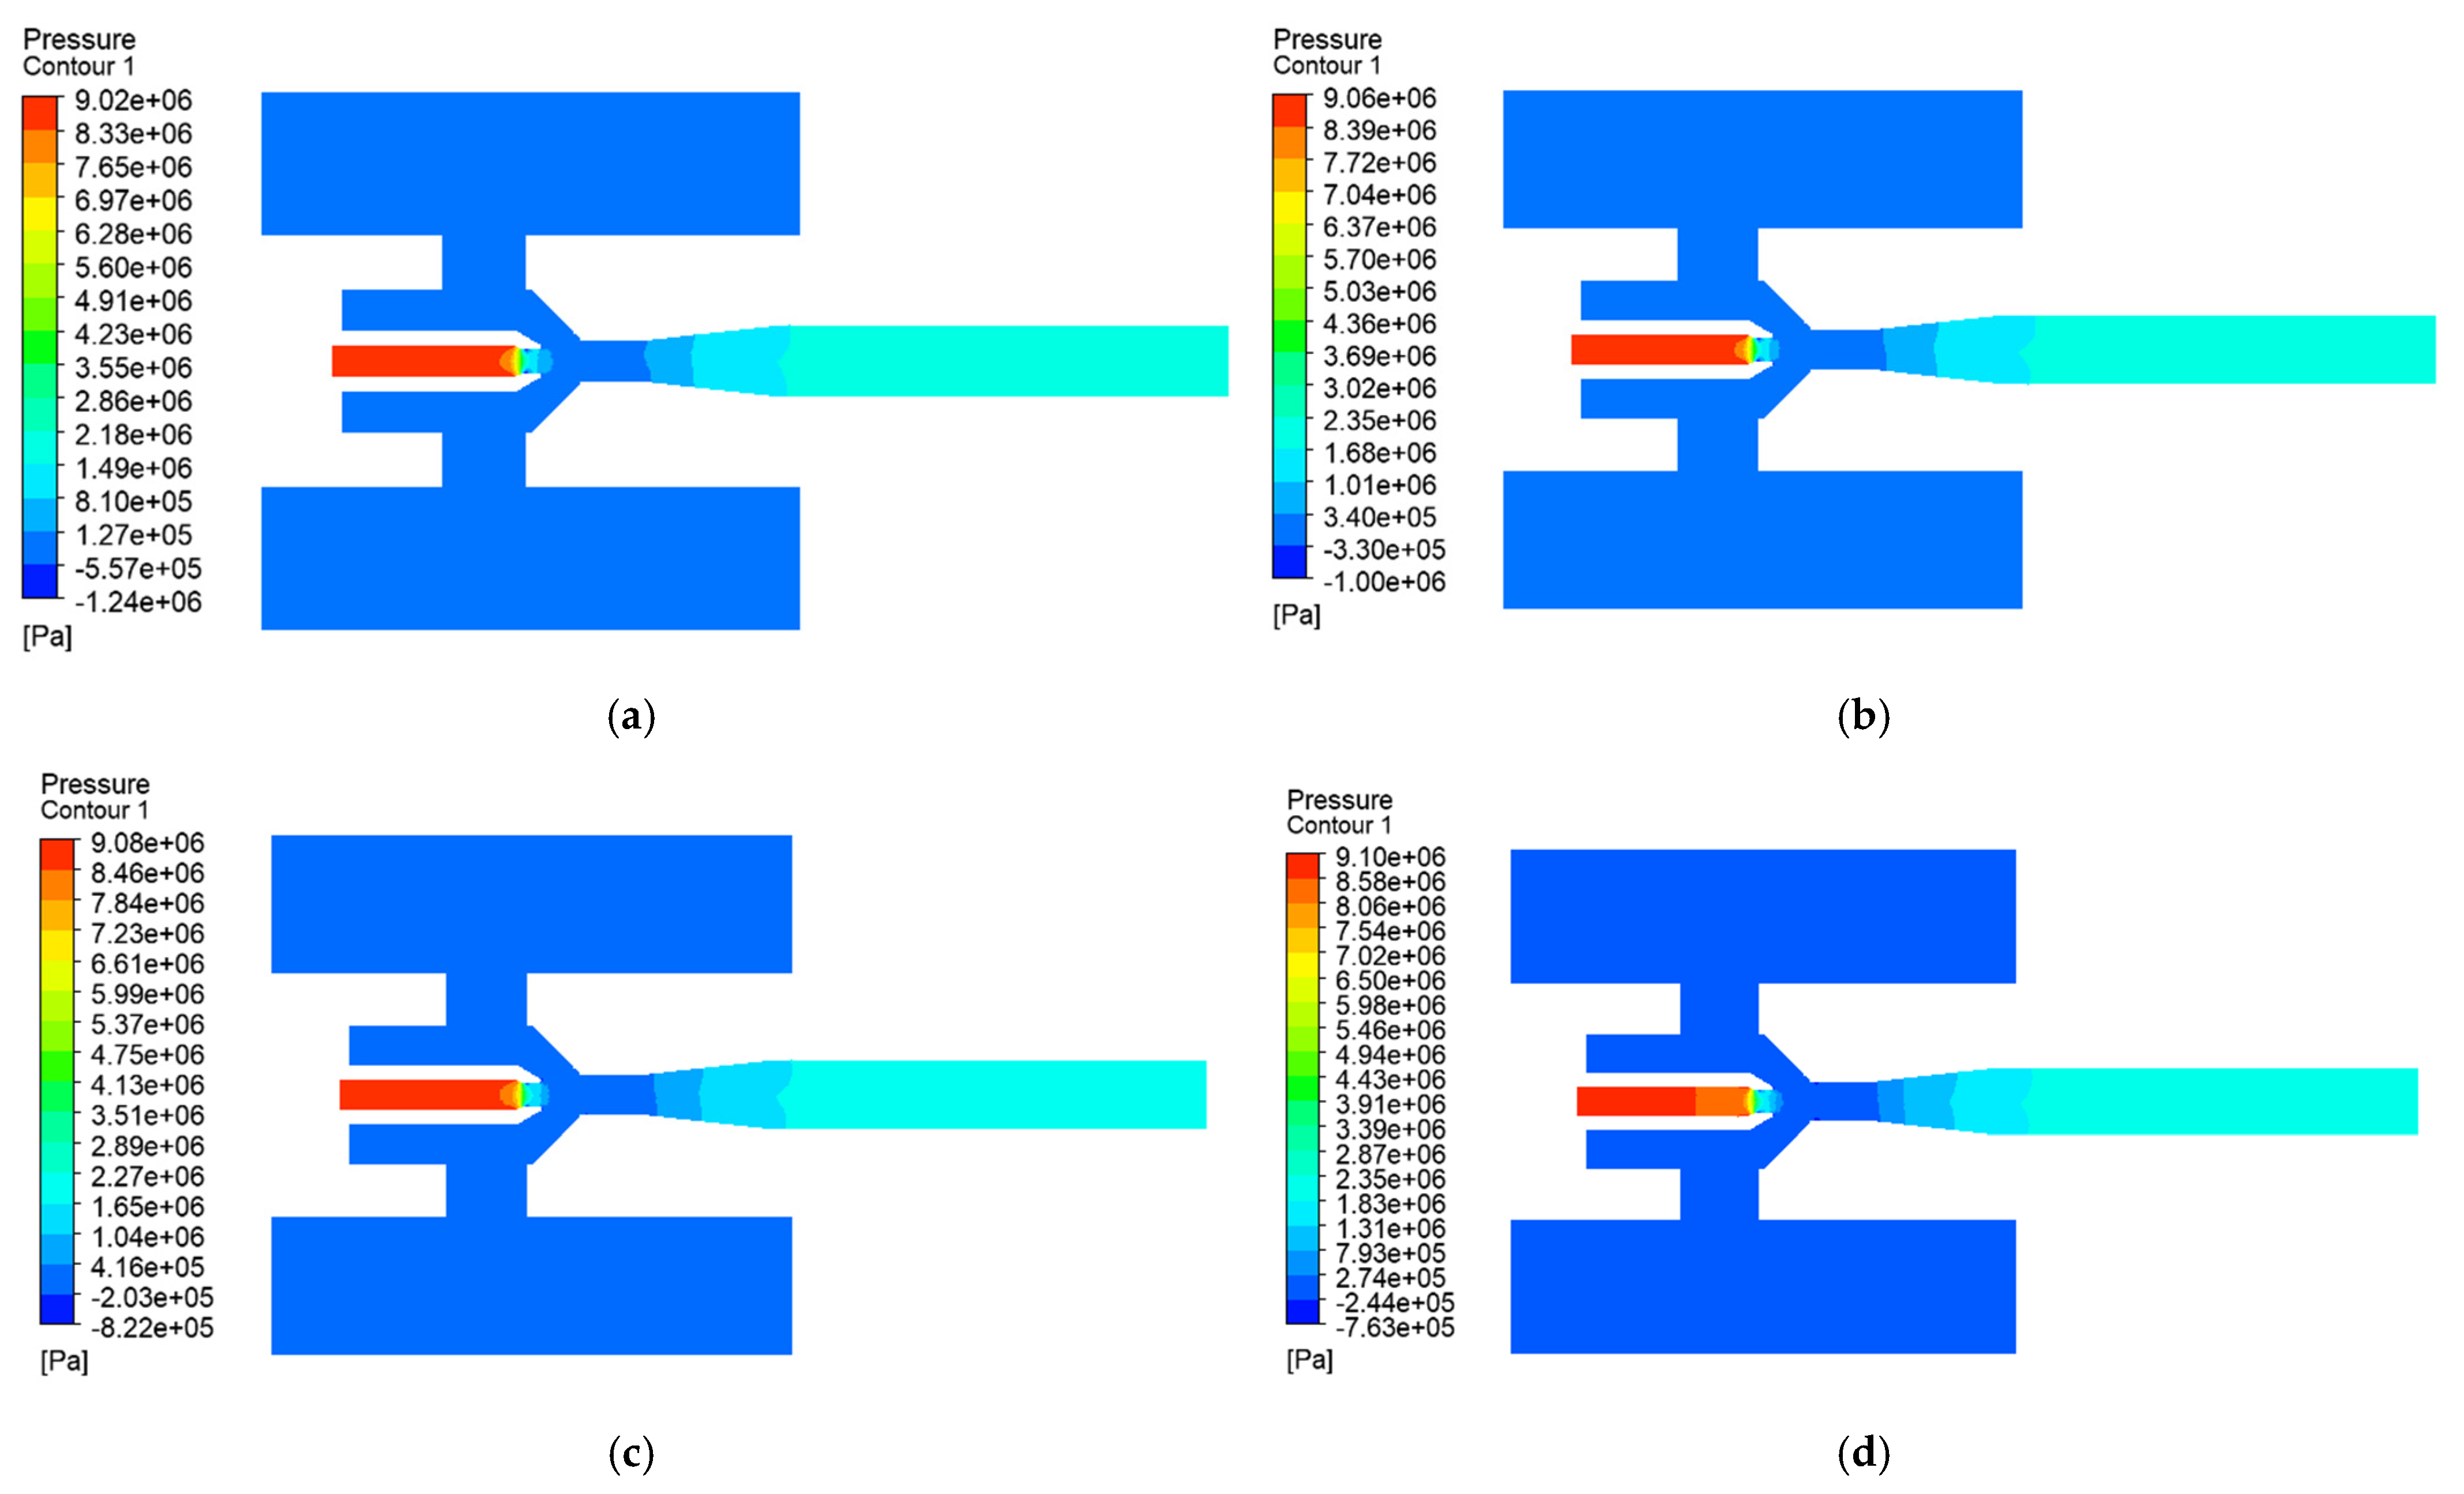
Pressure distribution analysis: Figure 12 demonstrates that as the discharge pressure (P2) increases, the position and extent of the minimum negative pressure region undergo significant changes. At a lower P2 value, the minimum pressure zone is primarily located in the throat section. When P2 increases to 4 MPa, this low-pressure zone moves to the suction inlet with reduced intensity. Simultaneously, the effective suction pressure difference between the throat and suction inlet visibly diminishes, becoming negligible at 4 MPa of the discharge pressure. Increased discharge pressure reduces pressure recovery in the diffuser, destroying the suction pressure differential essential for particle entrainment.
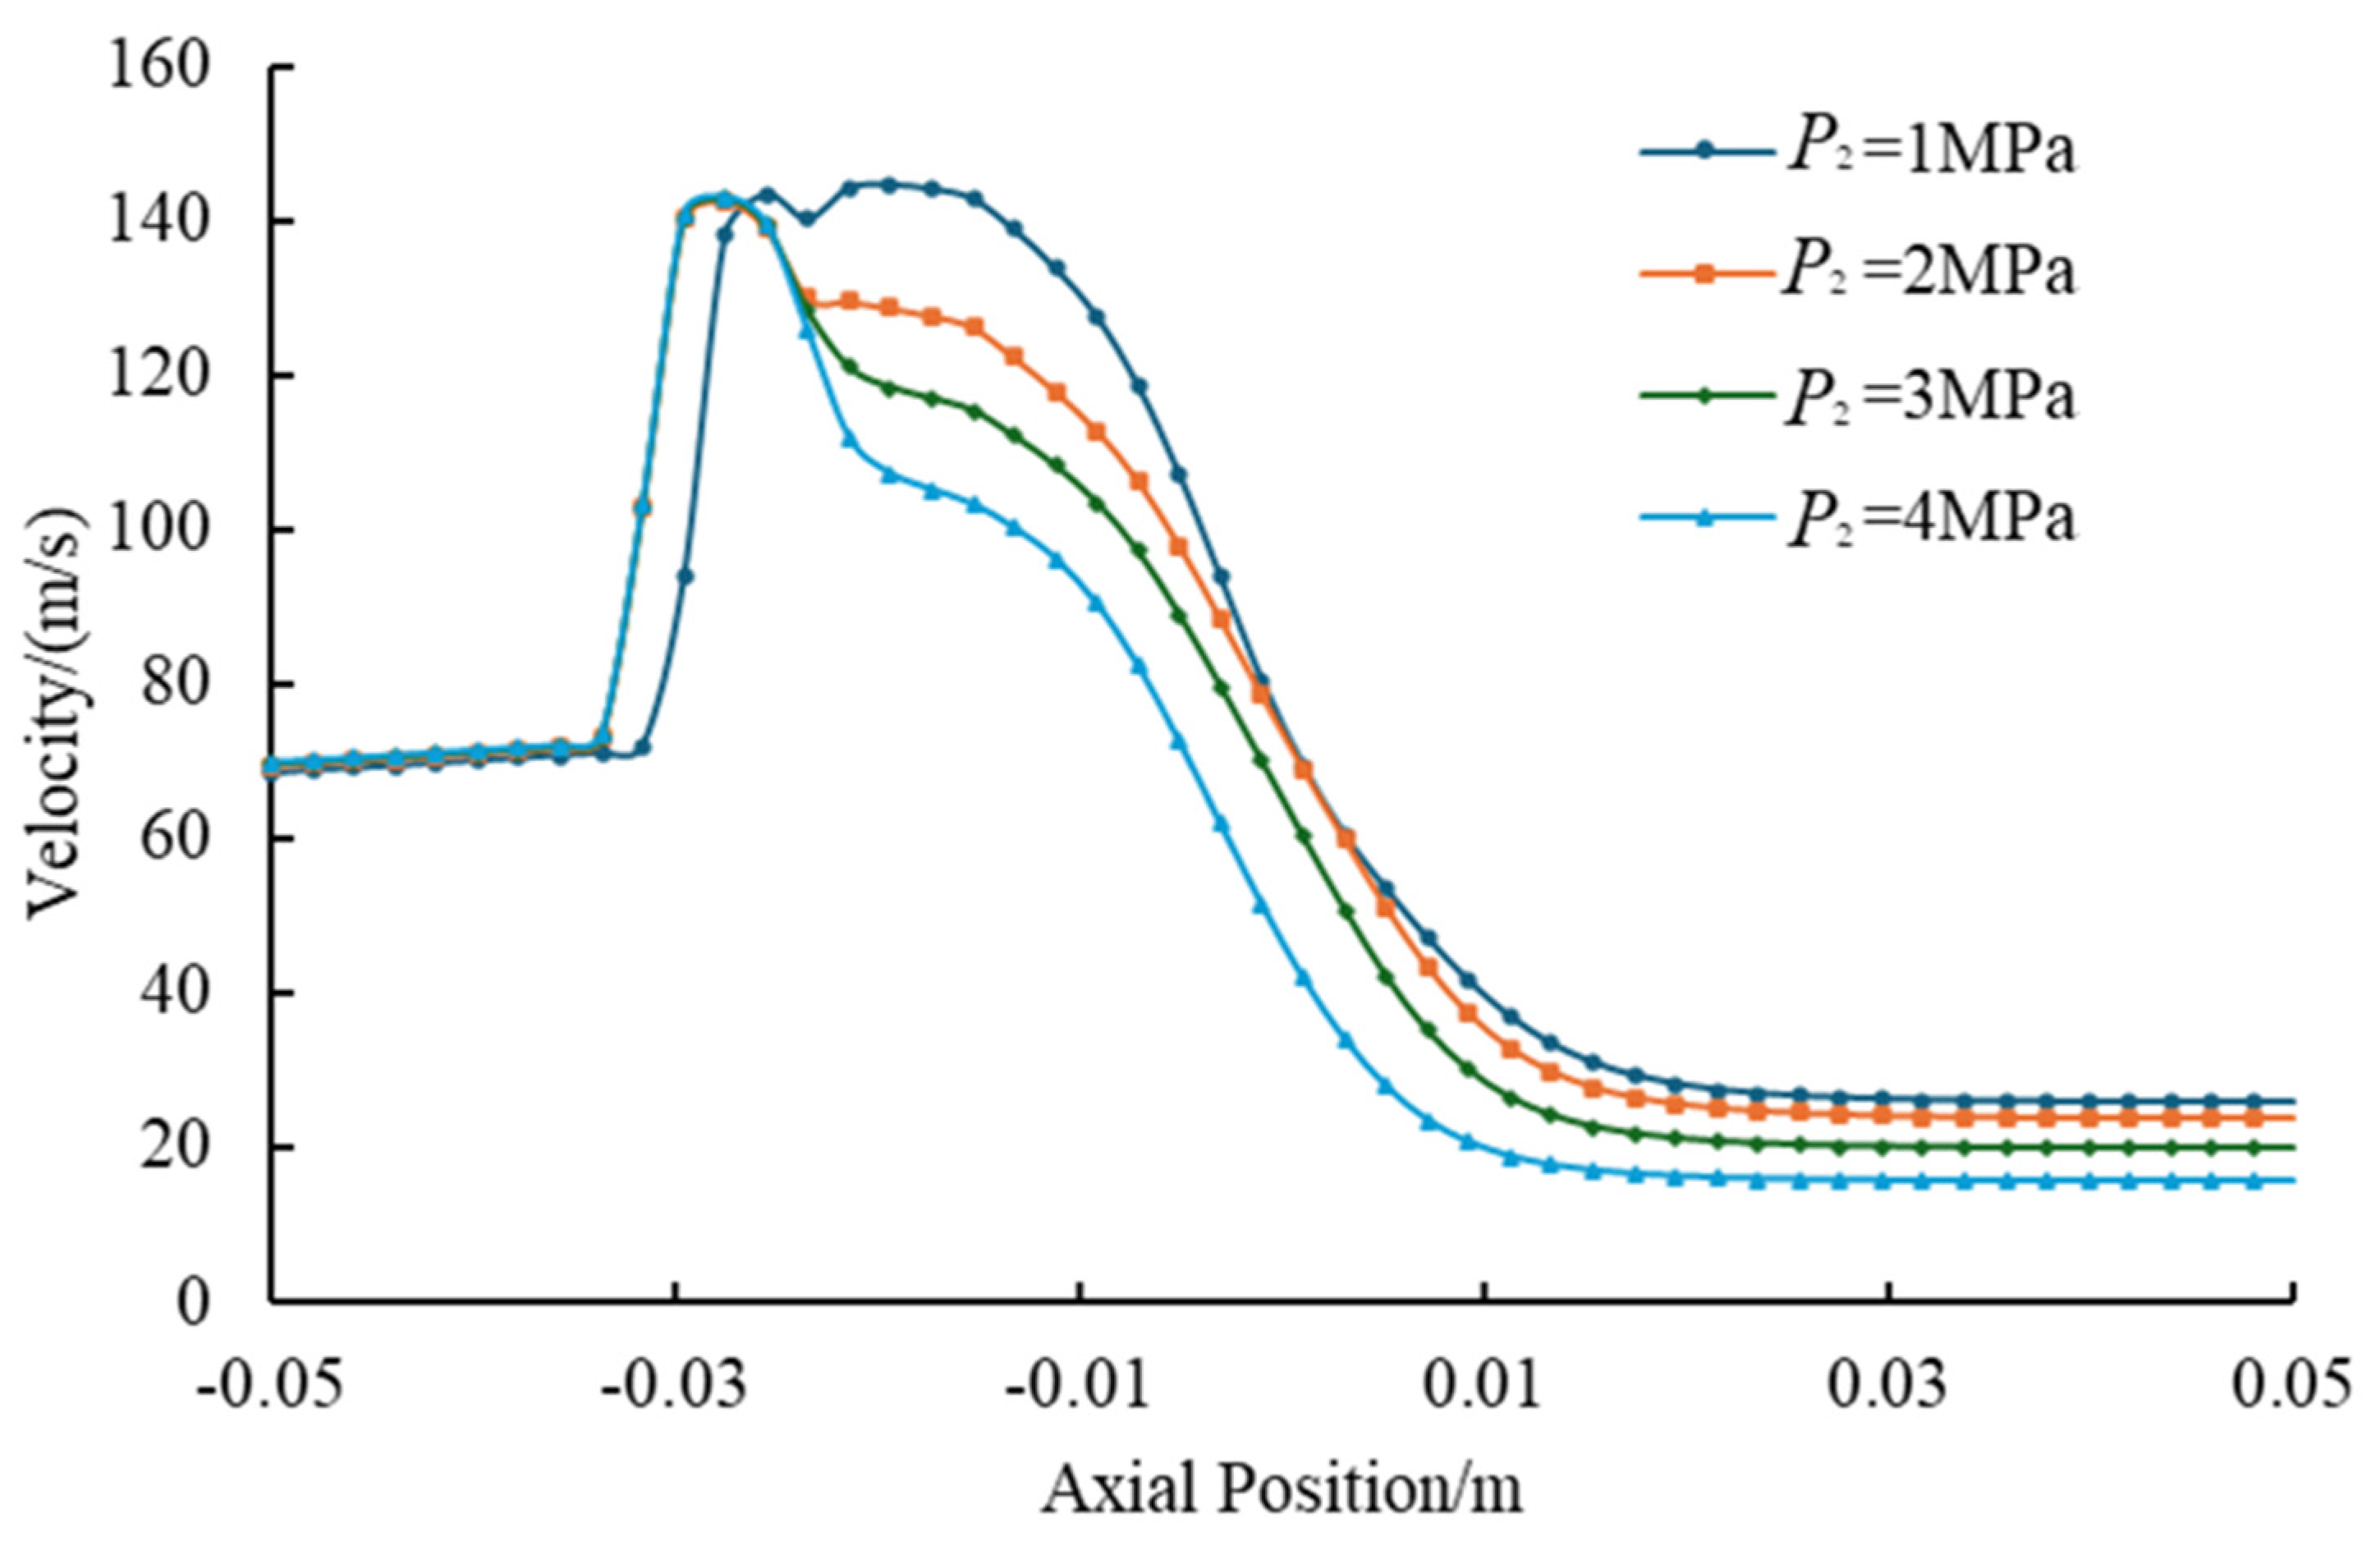
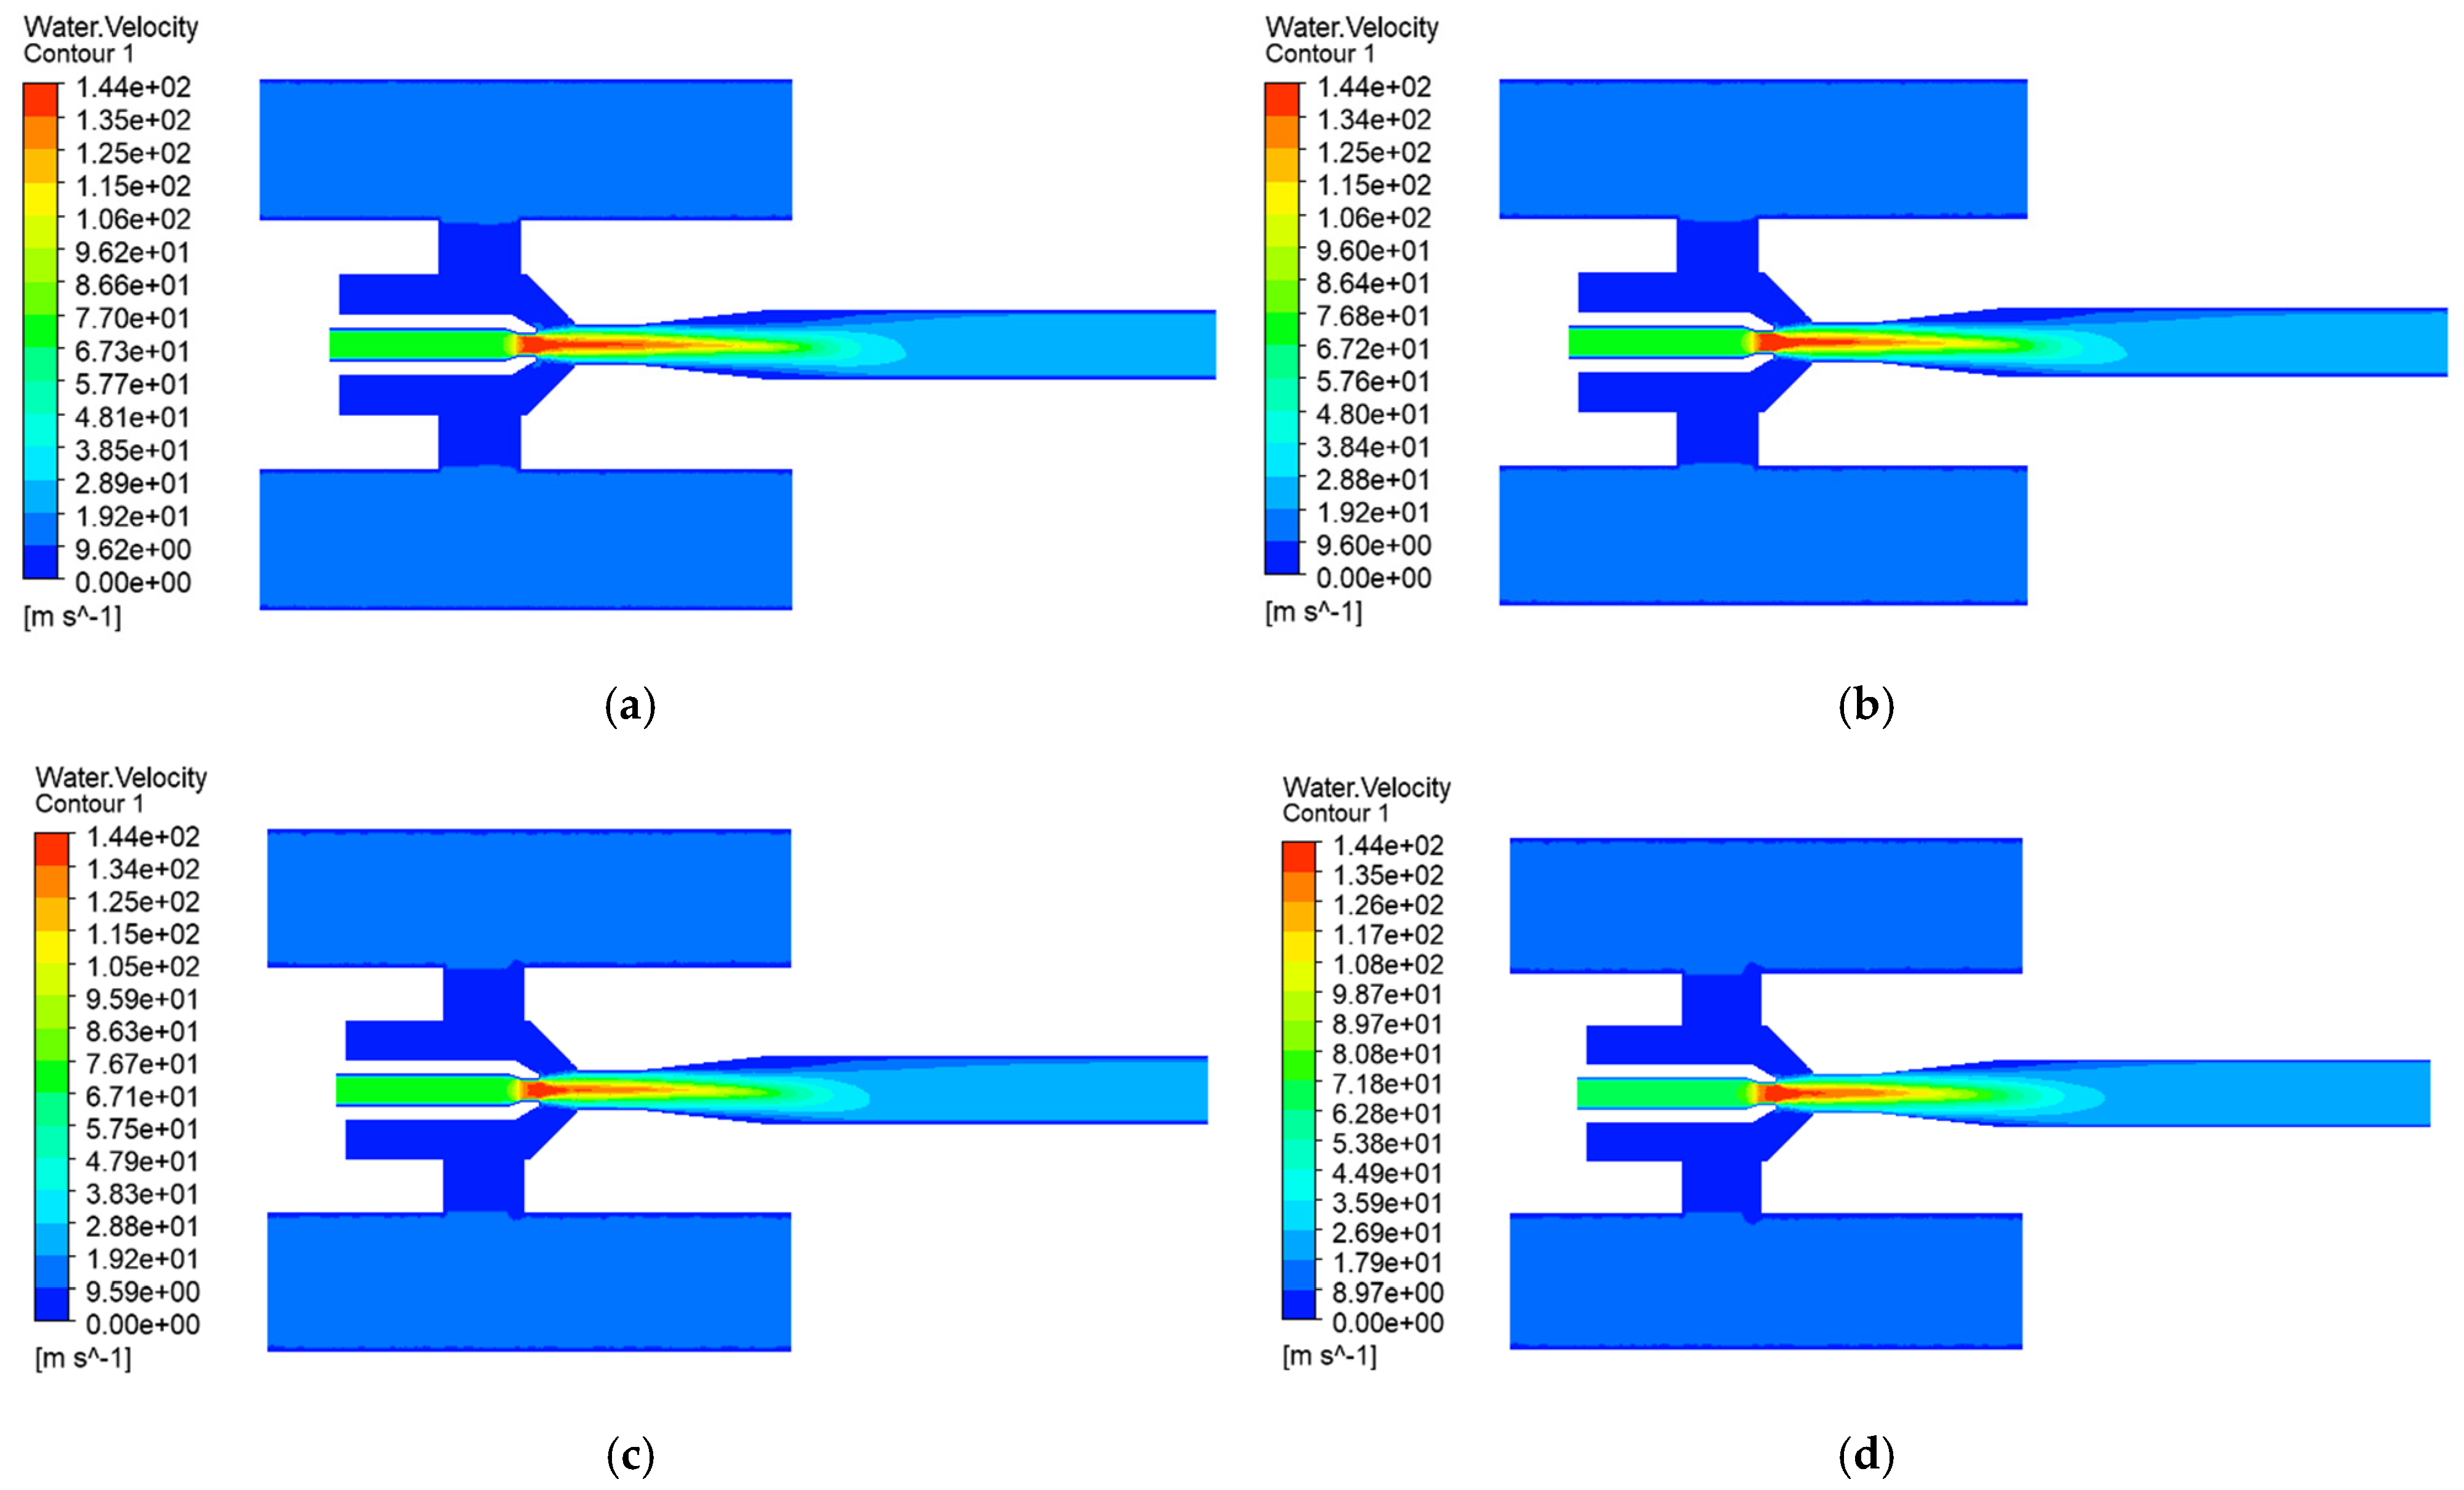
Liquid-phase velocity characteristics: Figure 13 and Figure 14 show that while the velocity of the jet fluid at the nozzle outlet remains essentially constant (nearly 145 m/s) regardless of P2, the downstream flow structure changes significantly. The spatial extent of the high-velocity jet core region markedly decreases in both area and streamwise length. The axial velocity distribution curves (shown in Figure 14) clearly indicate that the velocity along the central axis decreases substantially at identical axial positions as the P2 value increases, with the onset point of velocity decay shifting upstream. These phenomena demonstrate that elevated discharge pressure accelerates kinetic energy decay through enhanced viscous losses and flow separation, as confirmed by axial velocity attenuation.
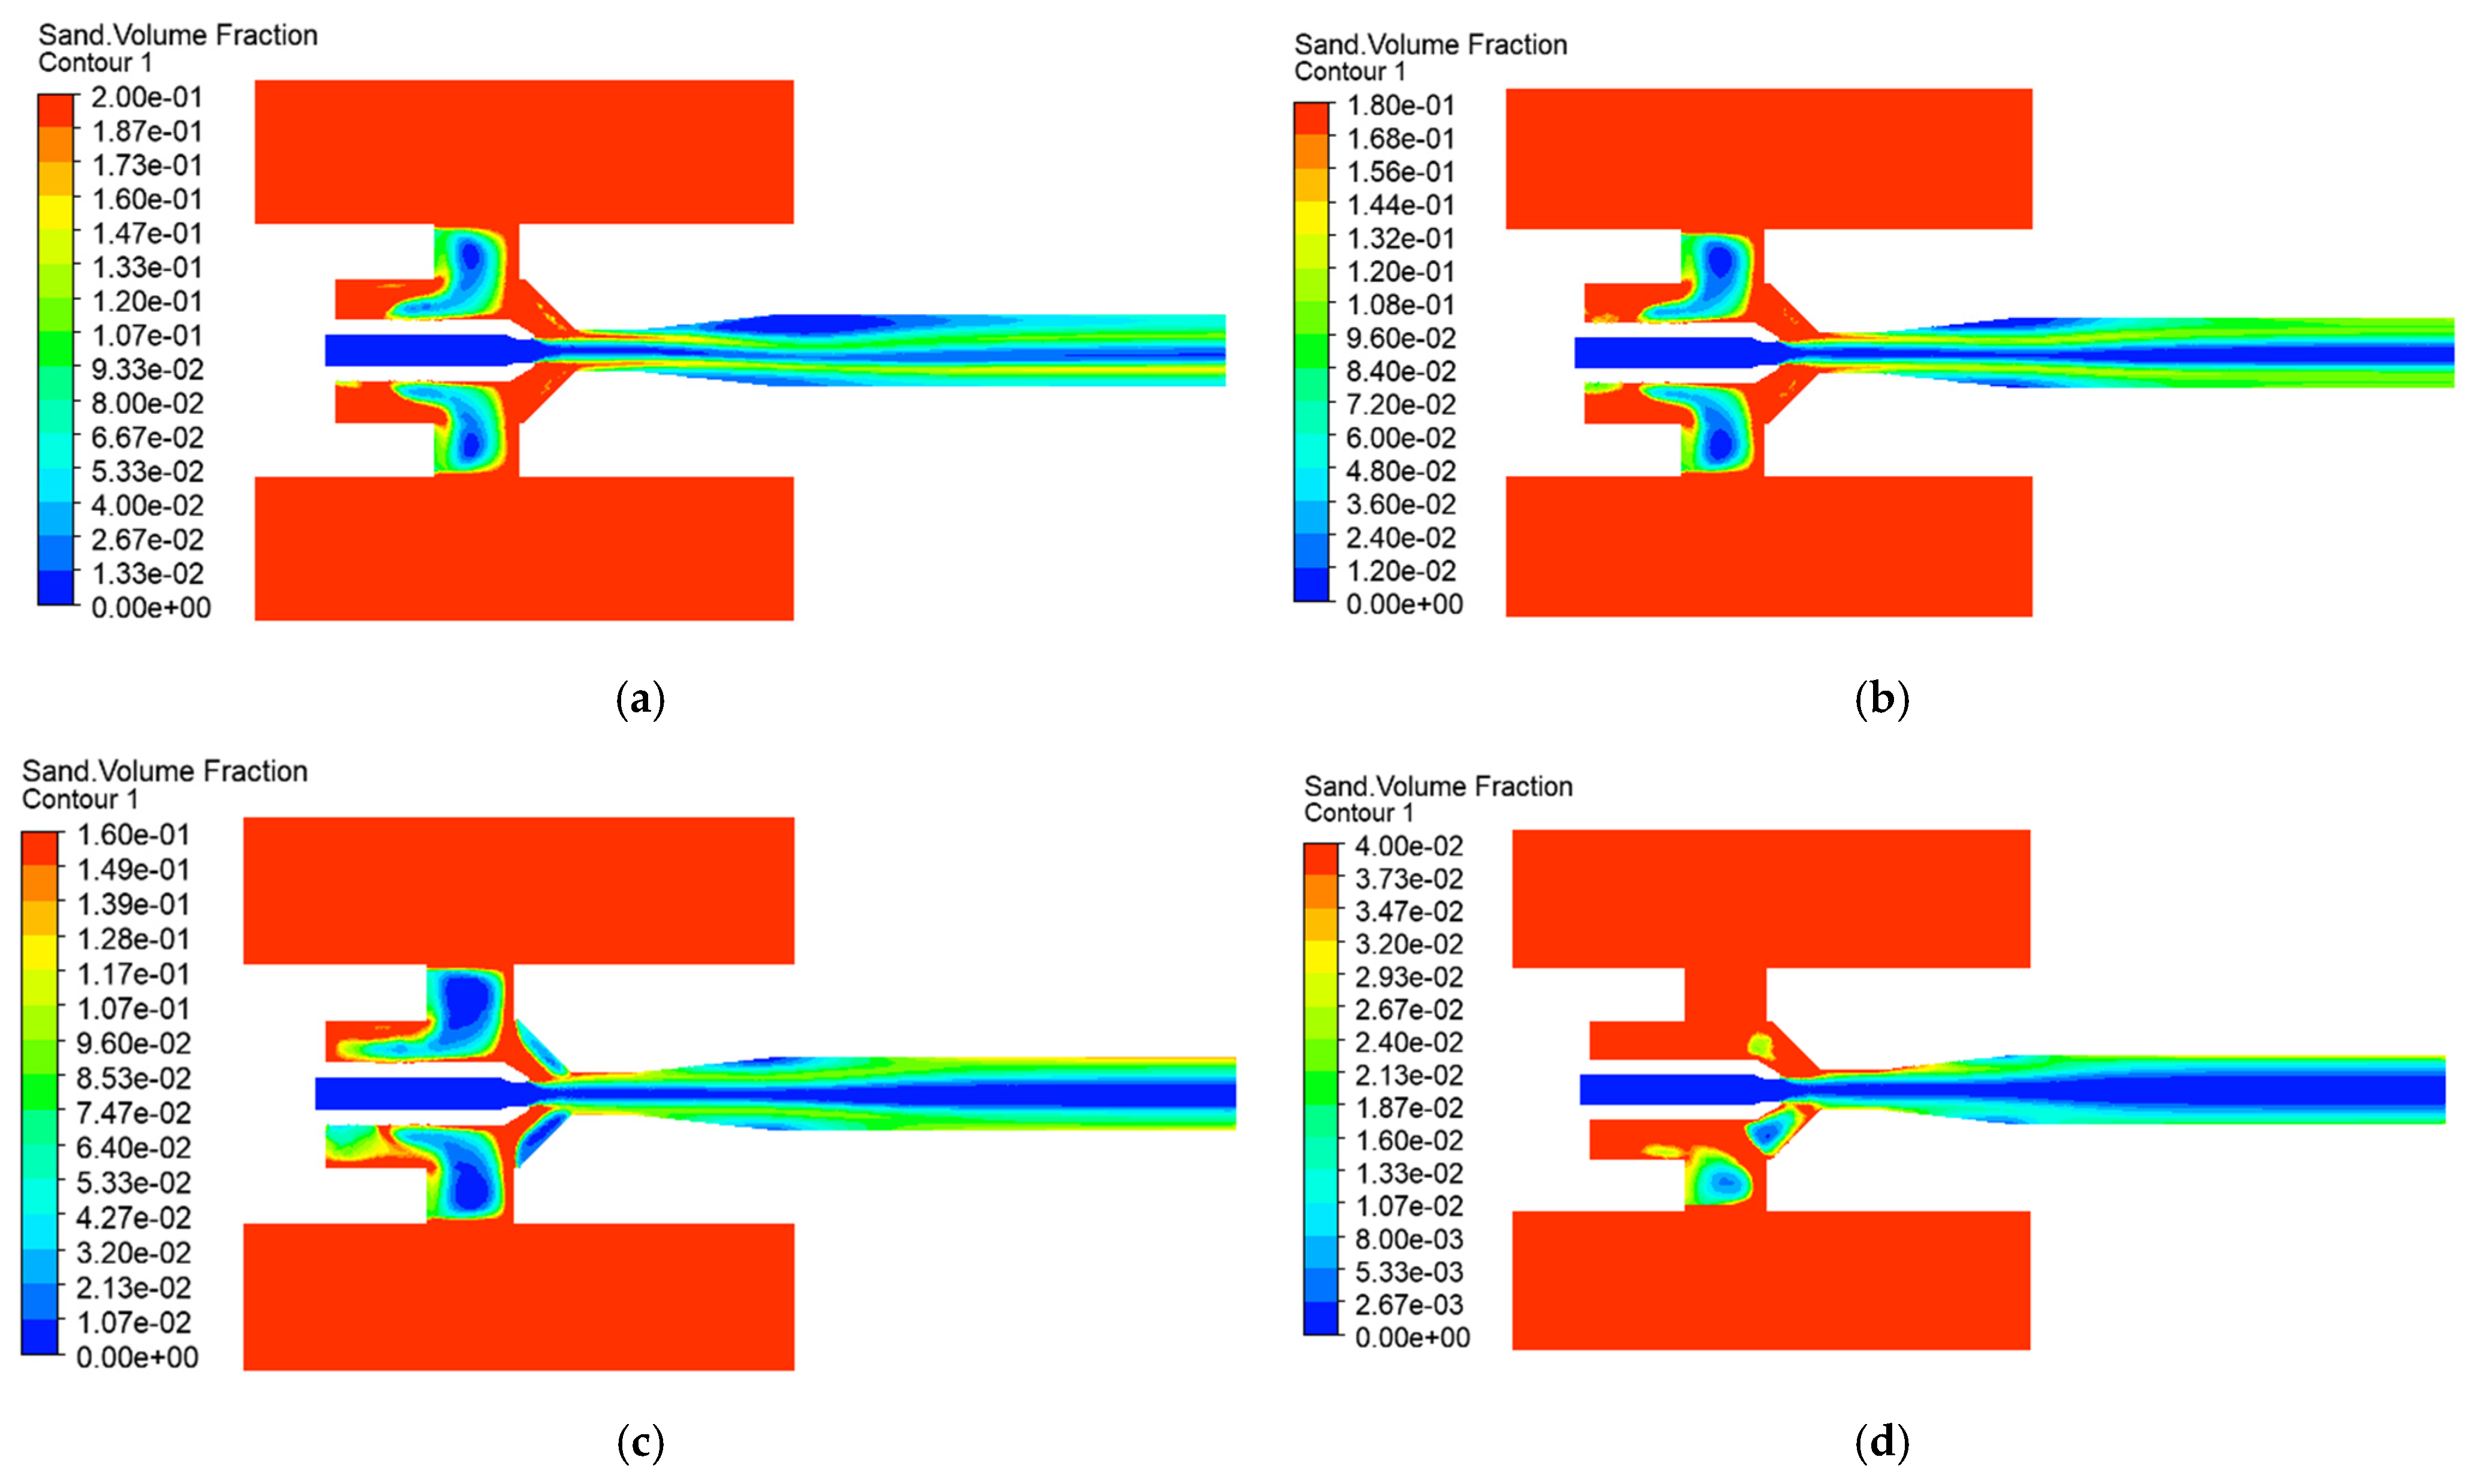
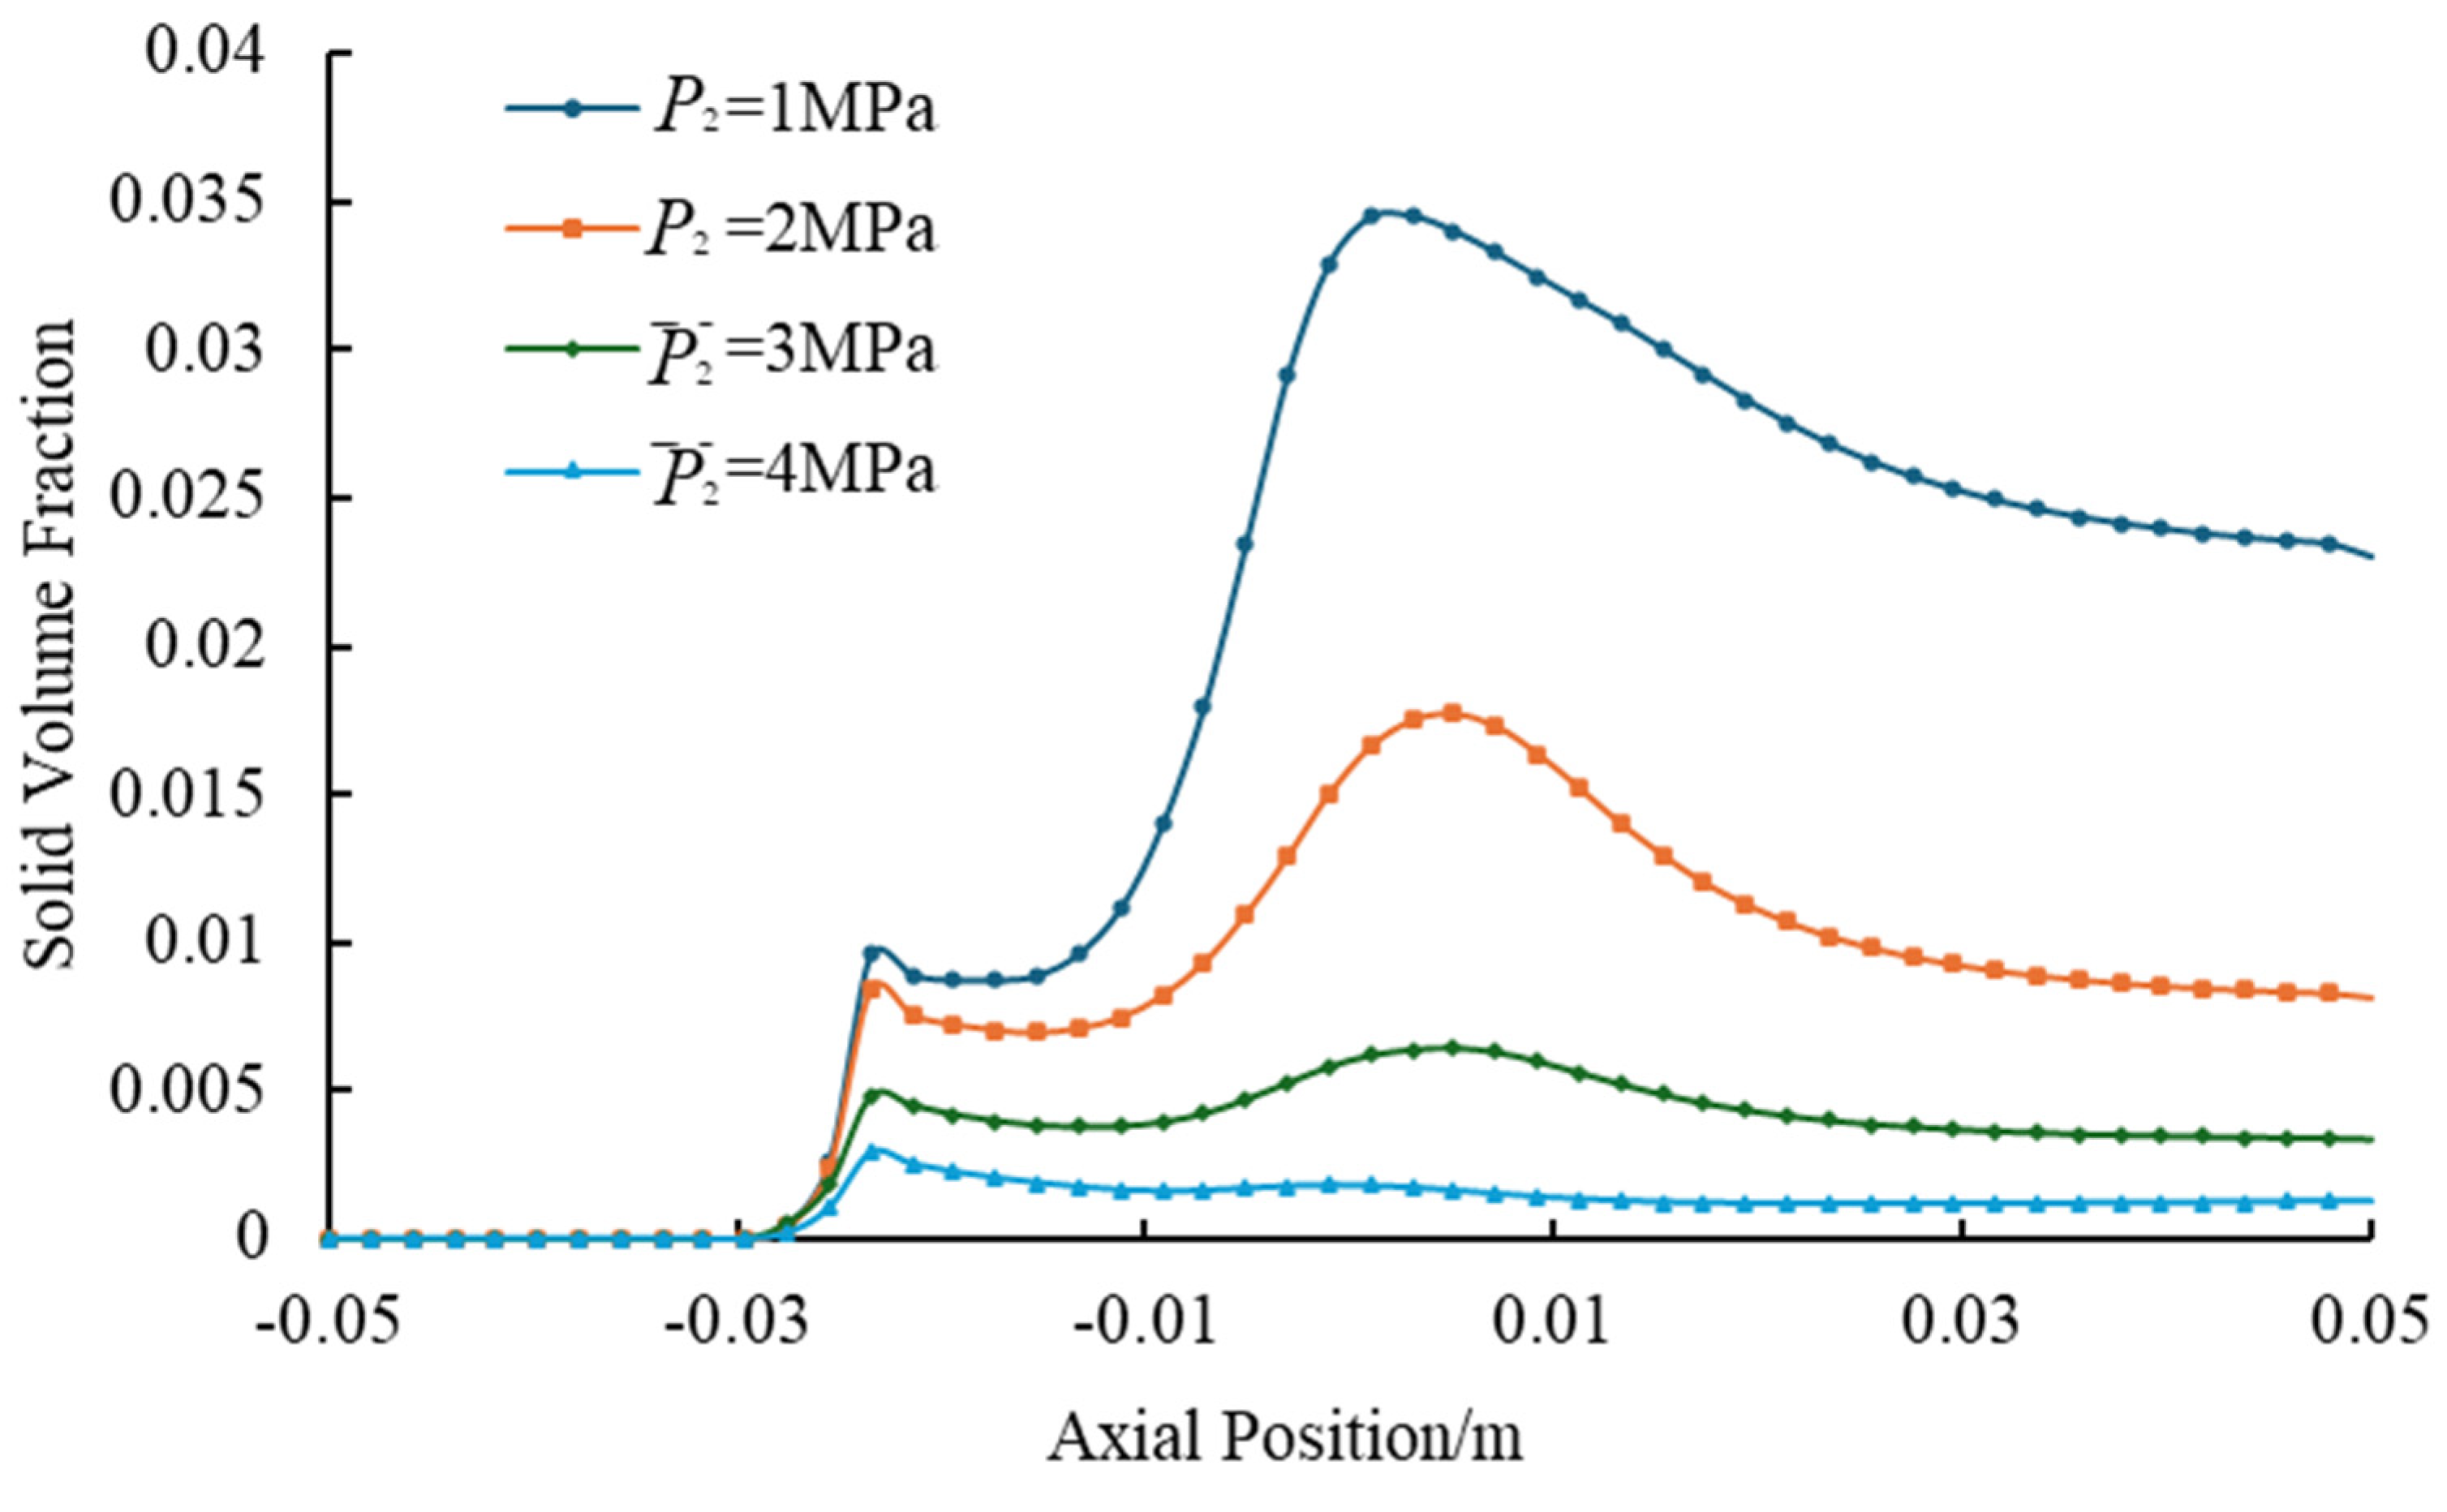
Solid-phase distribution pattern: Figure 15 and Figure 16 vividly illustrate the strong inhibitory effect of discharge pressure on the solid suction. As P2 increases, the solid volume fraction in the throat and diffuser sections decreases dramatically. The area representing a high solid concentration (e.g., warm-toned regions in the contour plot) shrinks significantly, with colors shifting toward cooler tones (lower concentration). The maximum solid volume fraction along the central axis in the throat section plunges from nearly 0.035 at a discharge pressure of 1 MPa to nearly zero at 4 MPa, indicating a catastrophic decline in solid transport capacity.
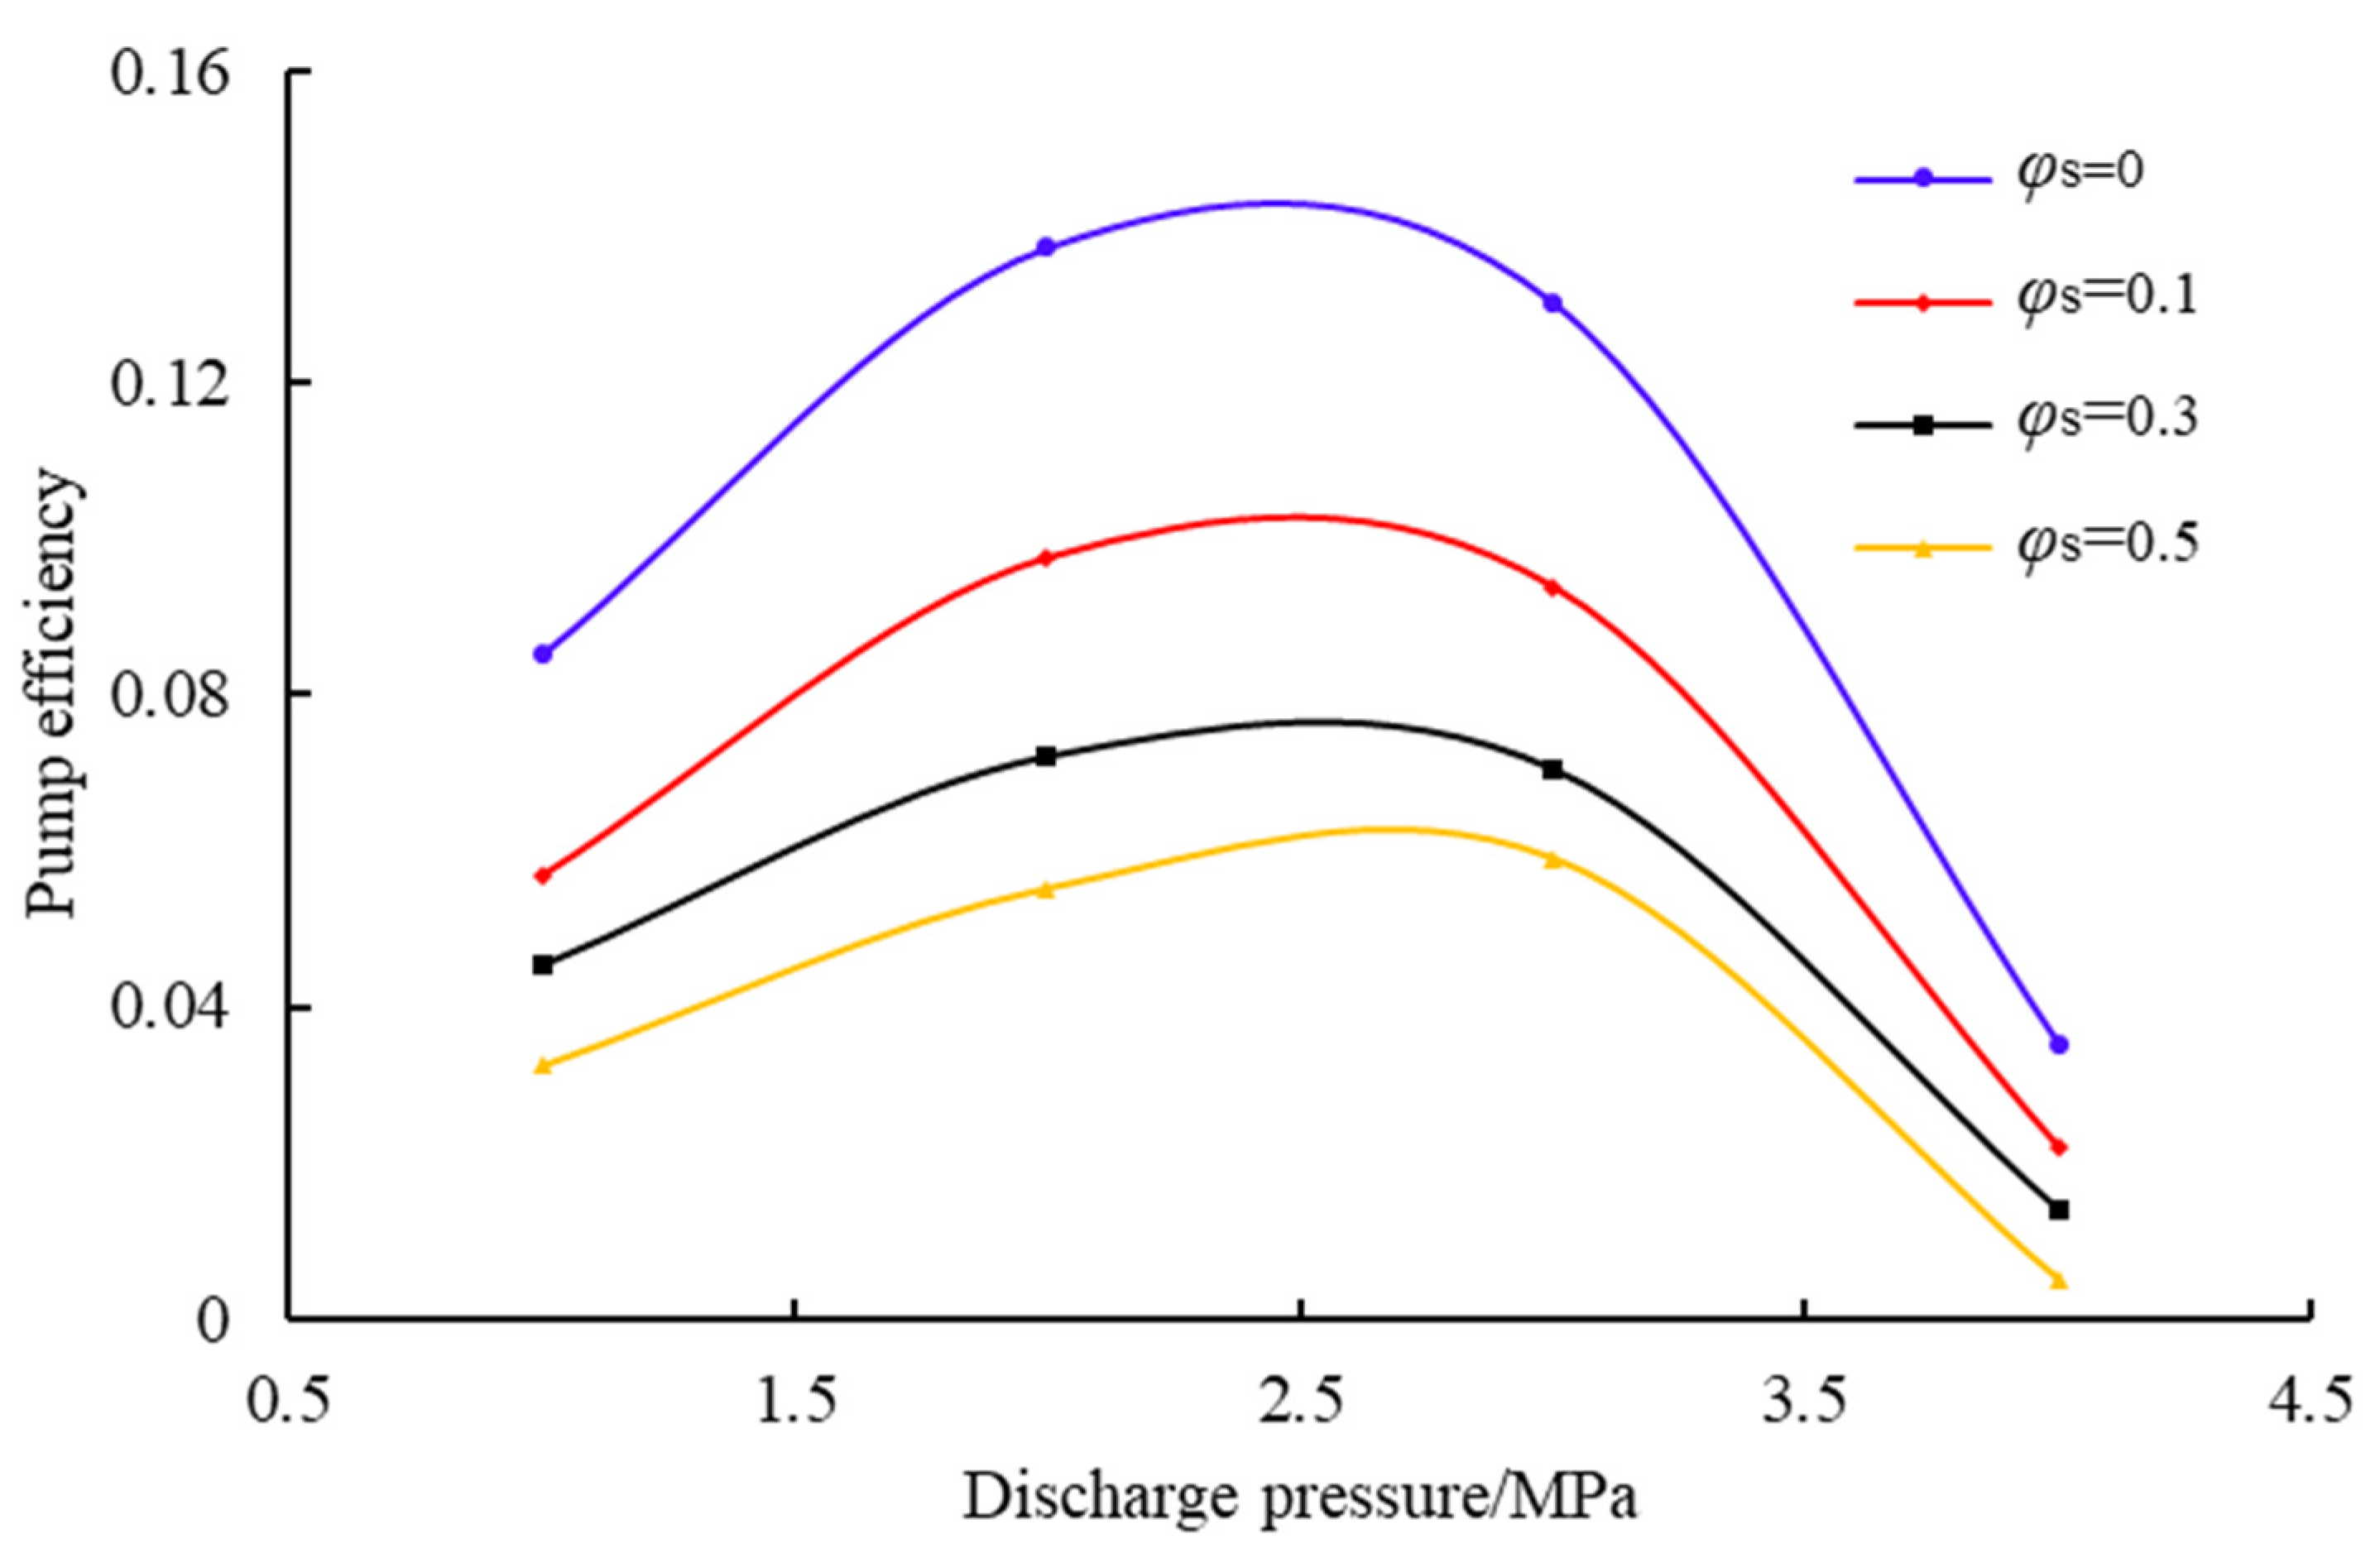
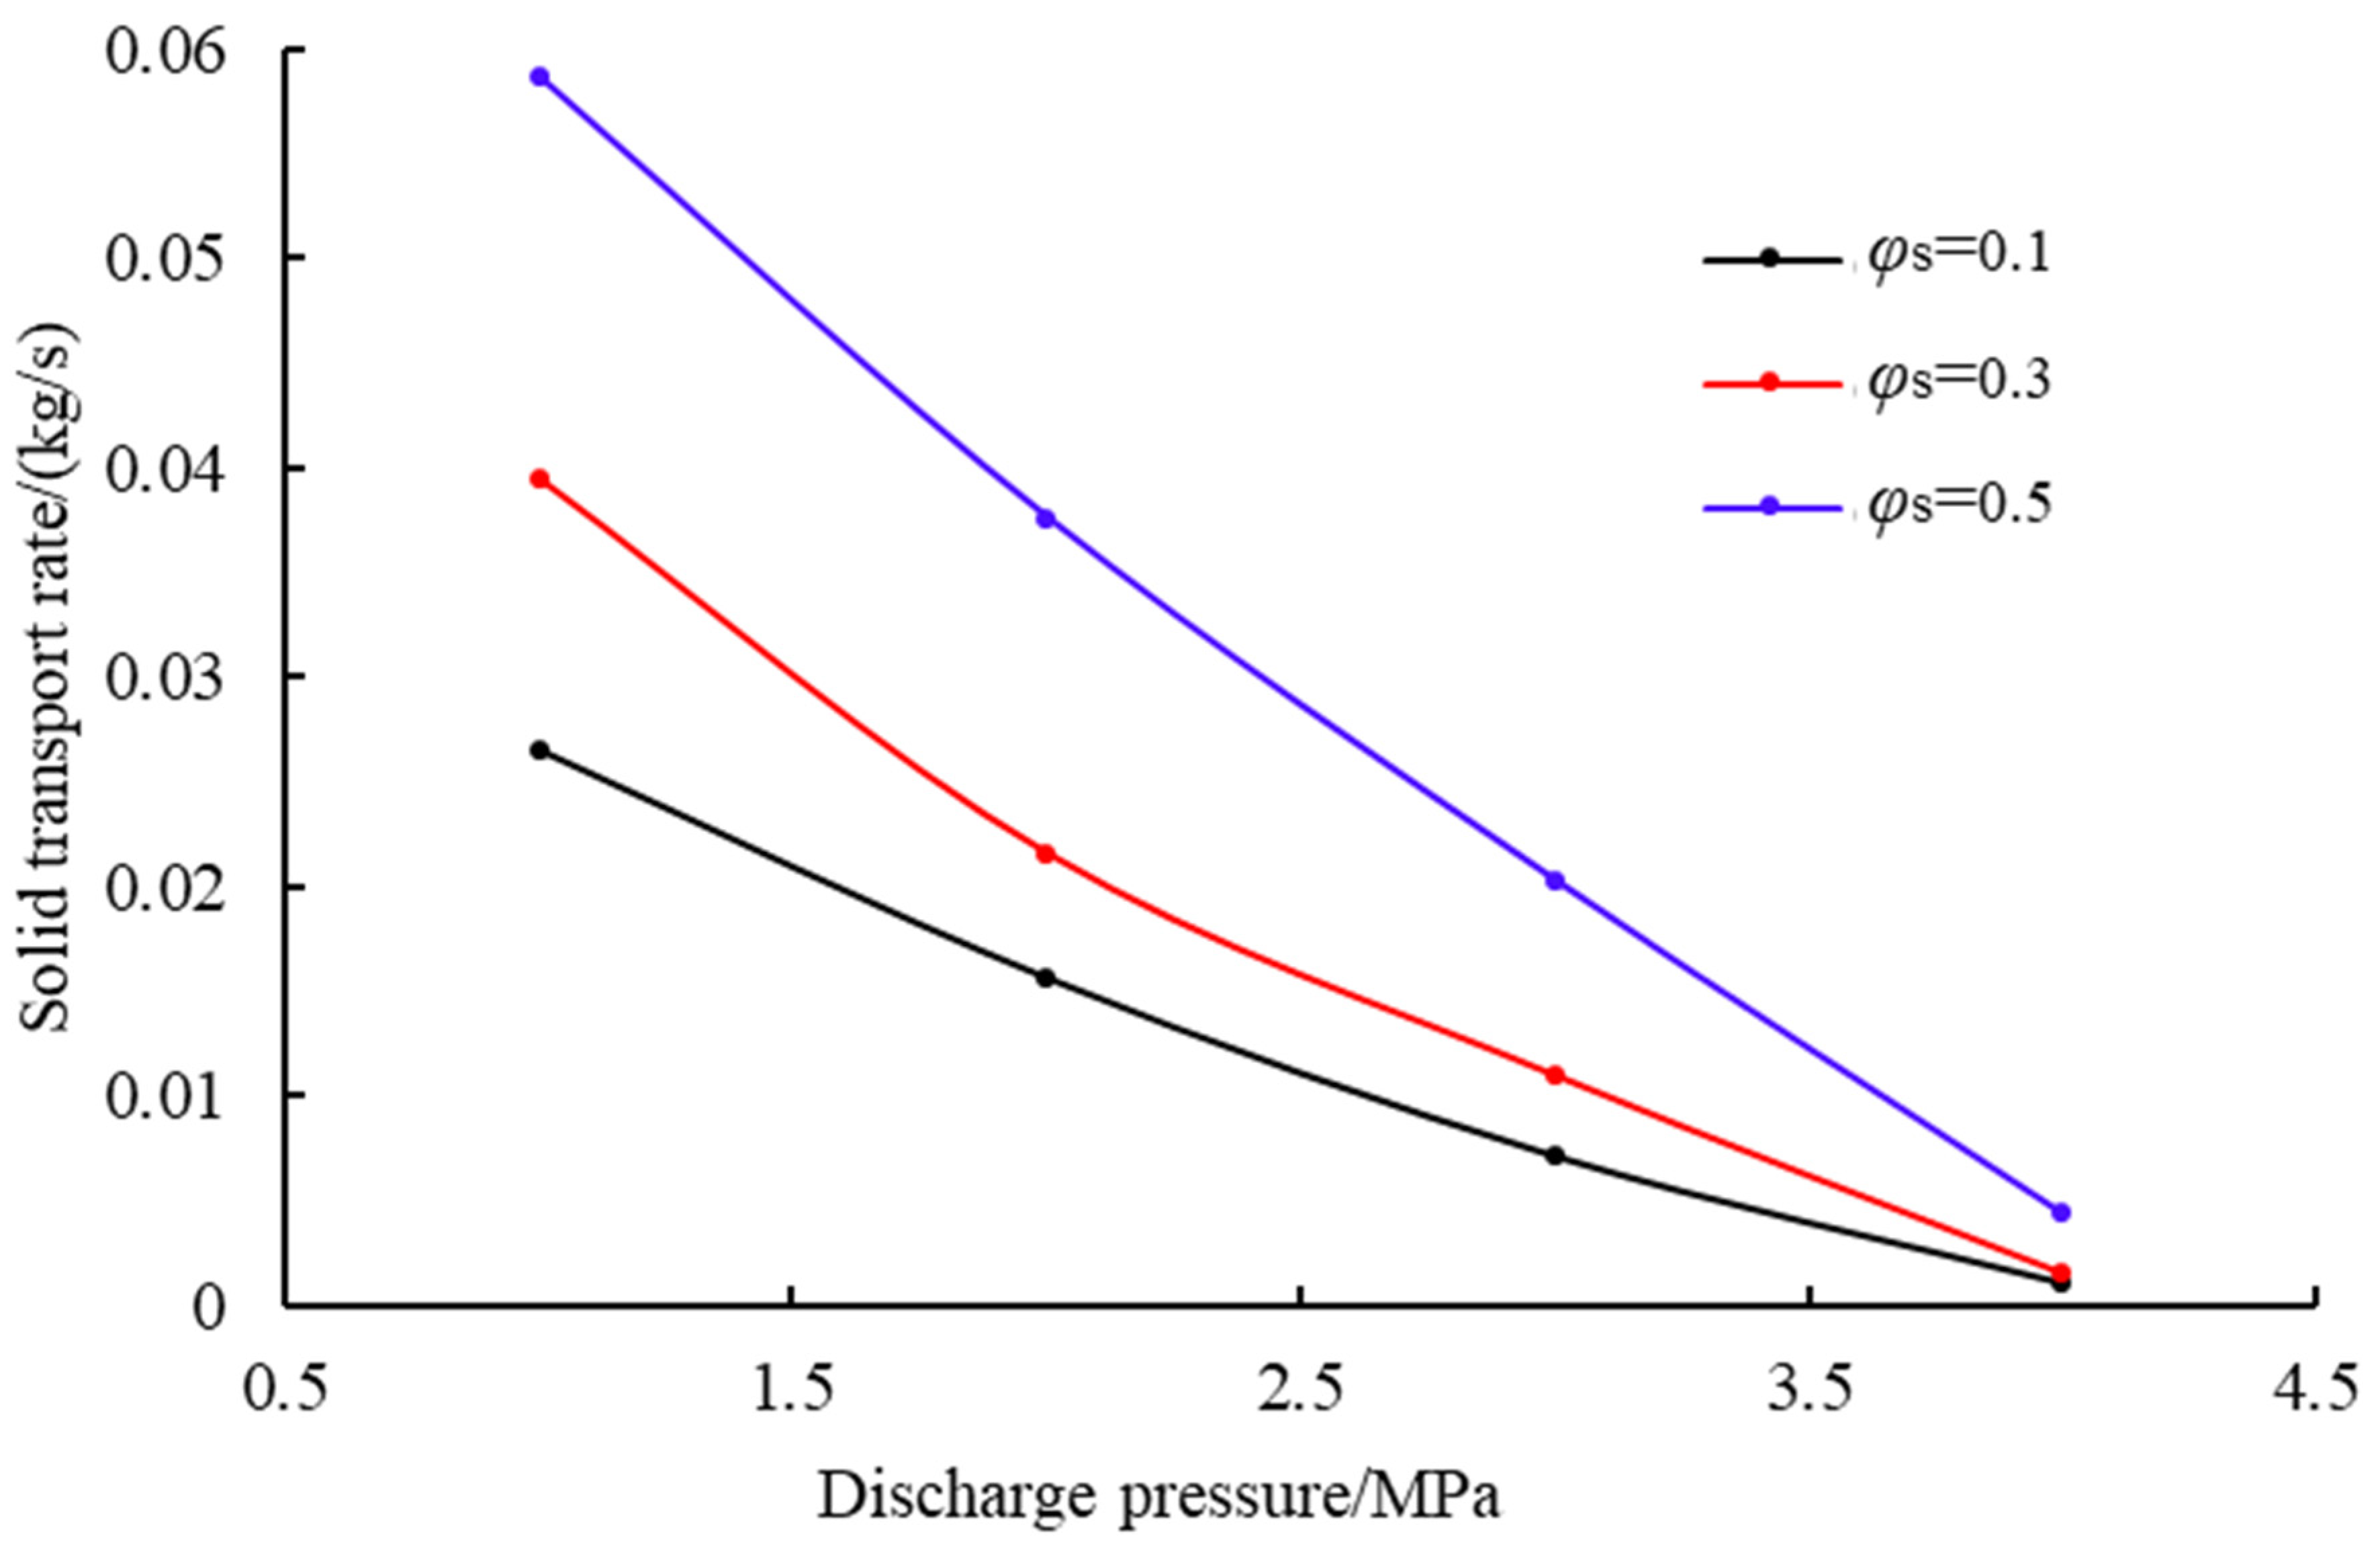
Performance quantification: Figure 17 and Figure 18 reveal the differential impacts and critical threshold phenomena. The pump efficiency (E) exhibits a unimodal distribution, of which the peak value is near 27.9% at a discharge pressure of 2 MPa and a solid volume fraction is 10%. The peak efficiency at a discharge pressure of 2 MPa matches the testing results of Meakhail’s (2012) slurry pump [11]. The subsequent increases in pressure progressively reduces the efficiency due to energy transfer inefficiencies. The solid transport rate (ms) exhibits consistent negative correlation with the discharge pressure. The transport capacity decreases rapidly beyond 2.5 MPa, approaching negligible levels at a discharge pressure of 4 MPa.
Engineering implications: The discharge pressure exerts decisive control over the solid-phase suction capacity. The critical threshold (P2 ≤ 2.5 MPa) must be strictly maintained to maximize sand-bed clearance efficiency. When the field condition necessitates a discharge pressure at or above this threshold, the working pressure must be proportionally increased to compensate for energy losses and maintain downhole suction capacity. Optimization requires integrated consideration of pump efficiency, a solid transport rate, and operational constraints.

4.3. Effects of Solid-Phase Parameters on Jet Pump Solid-Phase Transport Capacity

(1) 
Initial Solid Volume Fraction
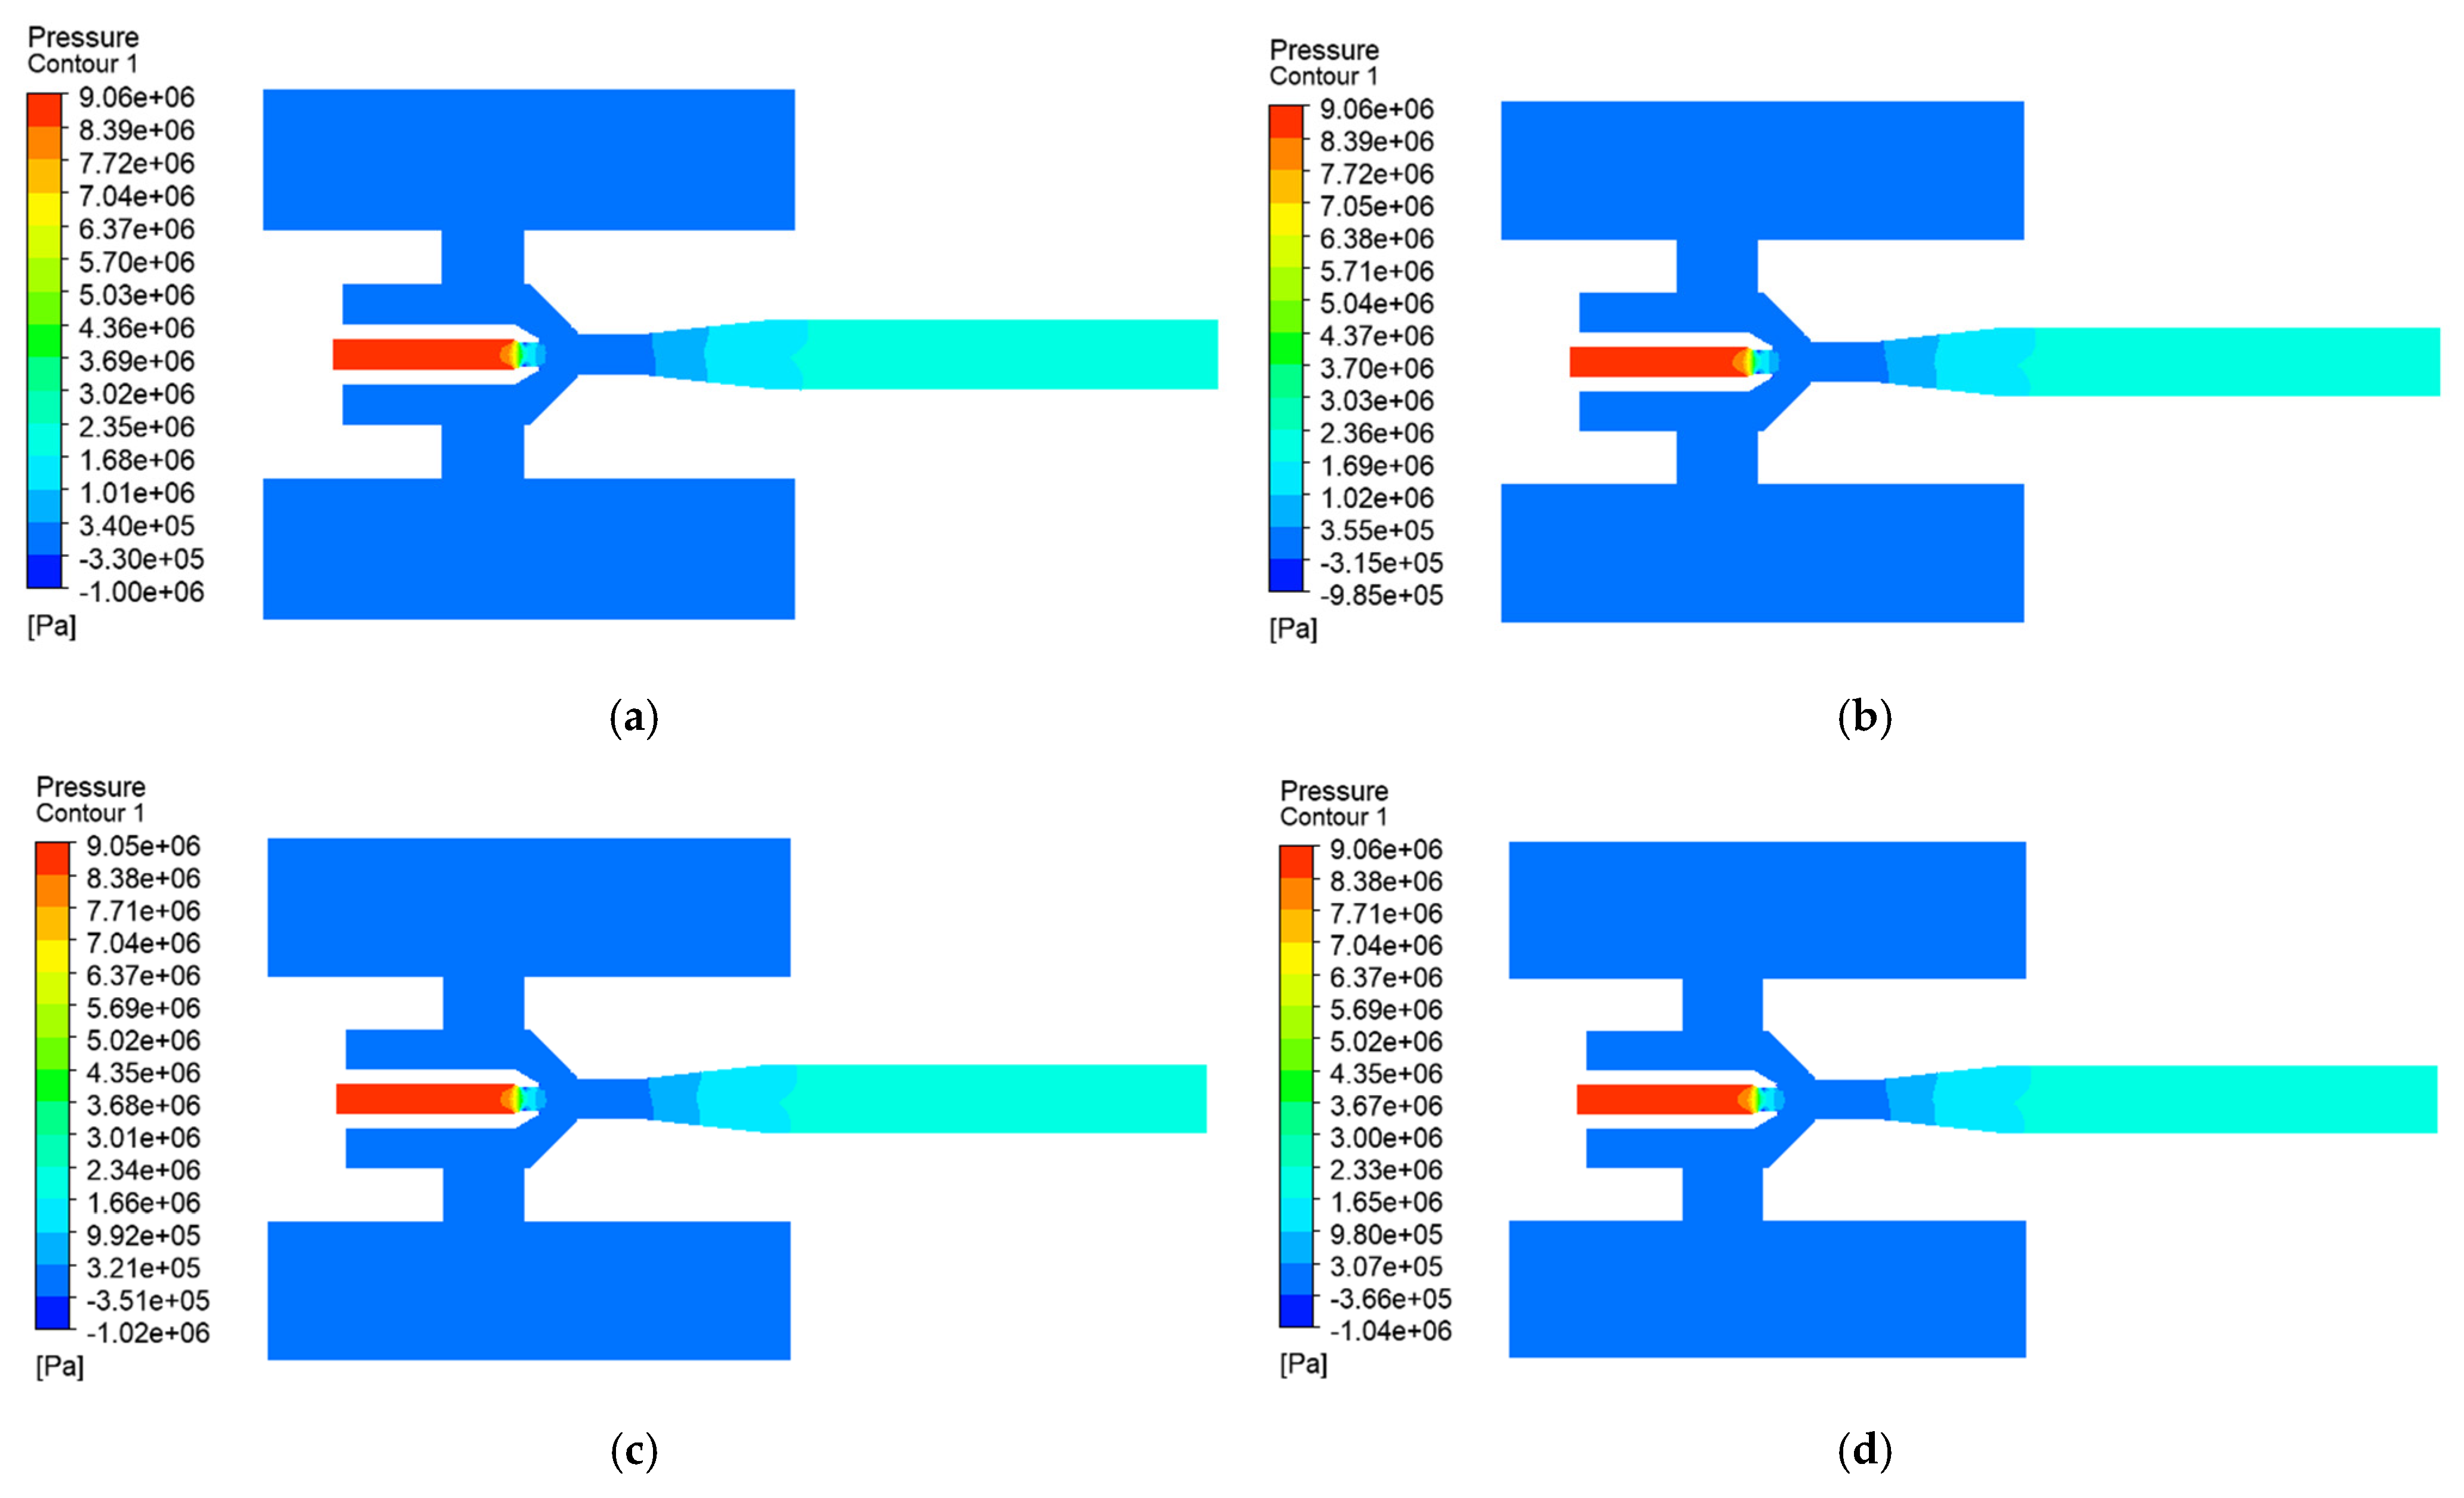
Pressure distribution analysis: Figure 19 shows the pressure distribution patterns under different discharge pressures. However, with the increase in the initial solid volume fraction (φS), the minimum pressure in the throat region increases, and the spatial extent of the low-pressure zone changes, which indicates that higher solid concentrations increase particle–fluid interactions, elevating the effective viscosity and generating additional flow resistance that weakens the suction capability.
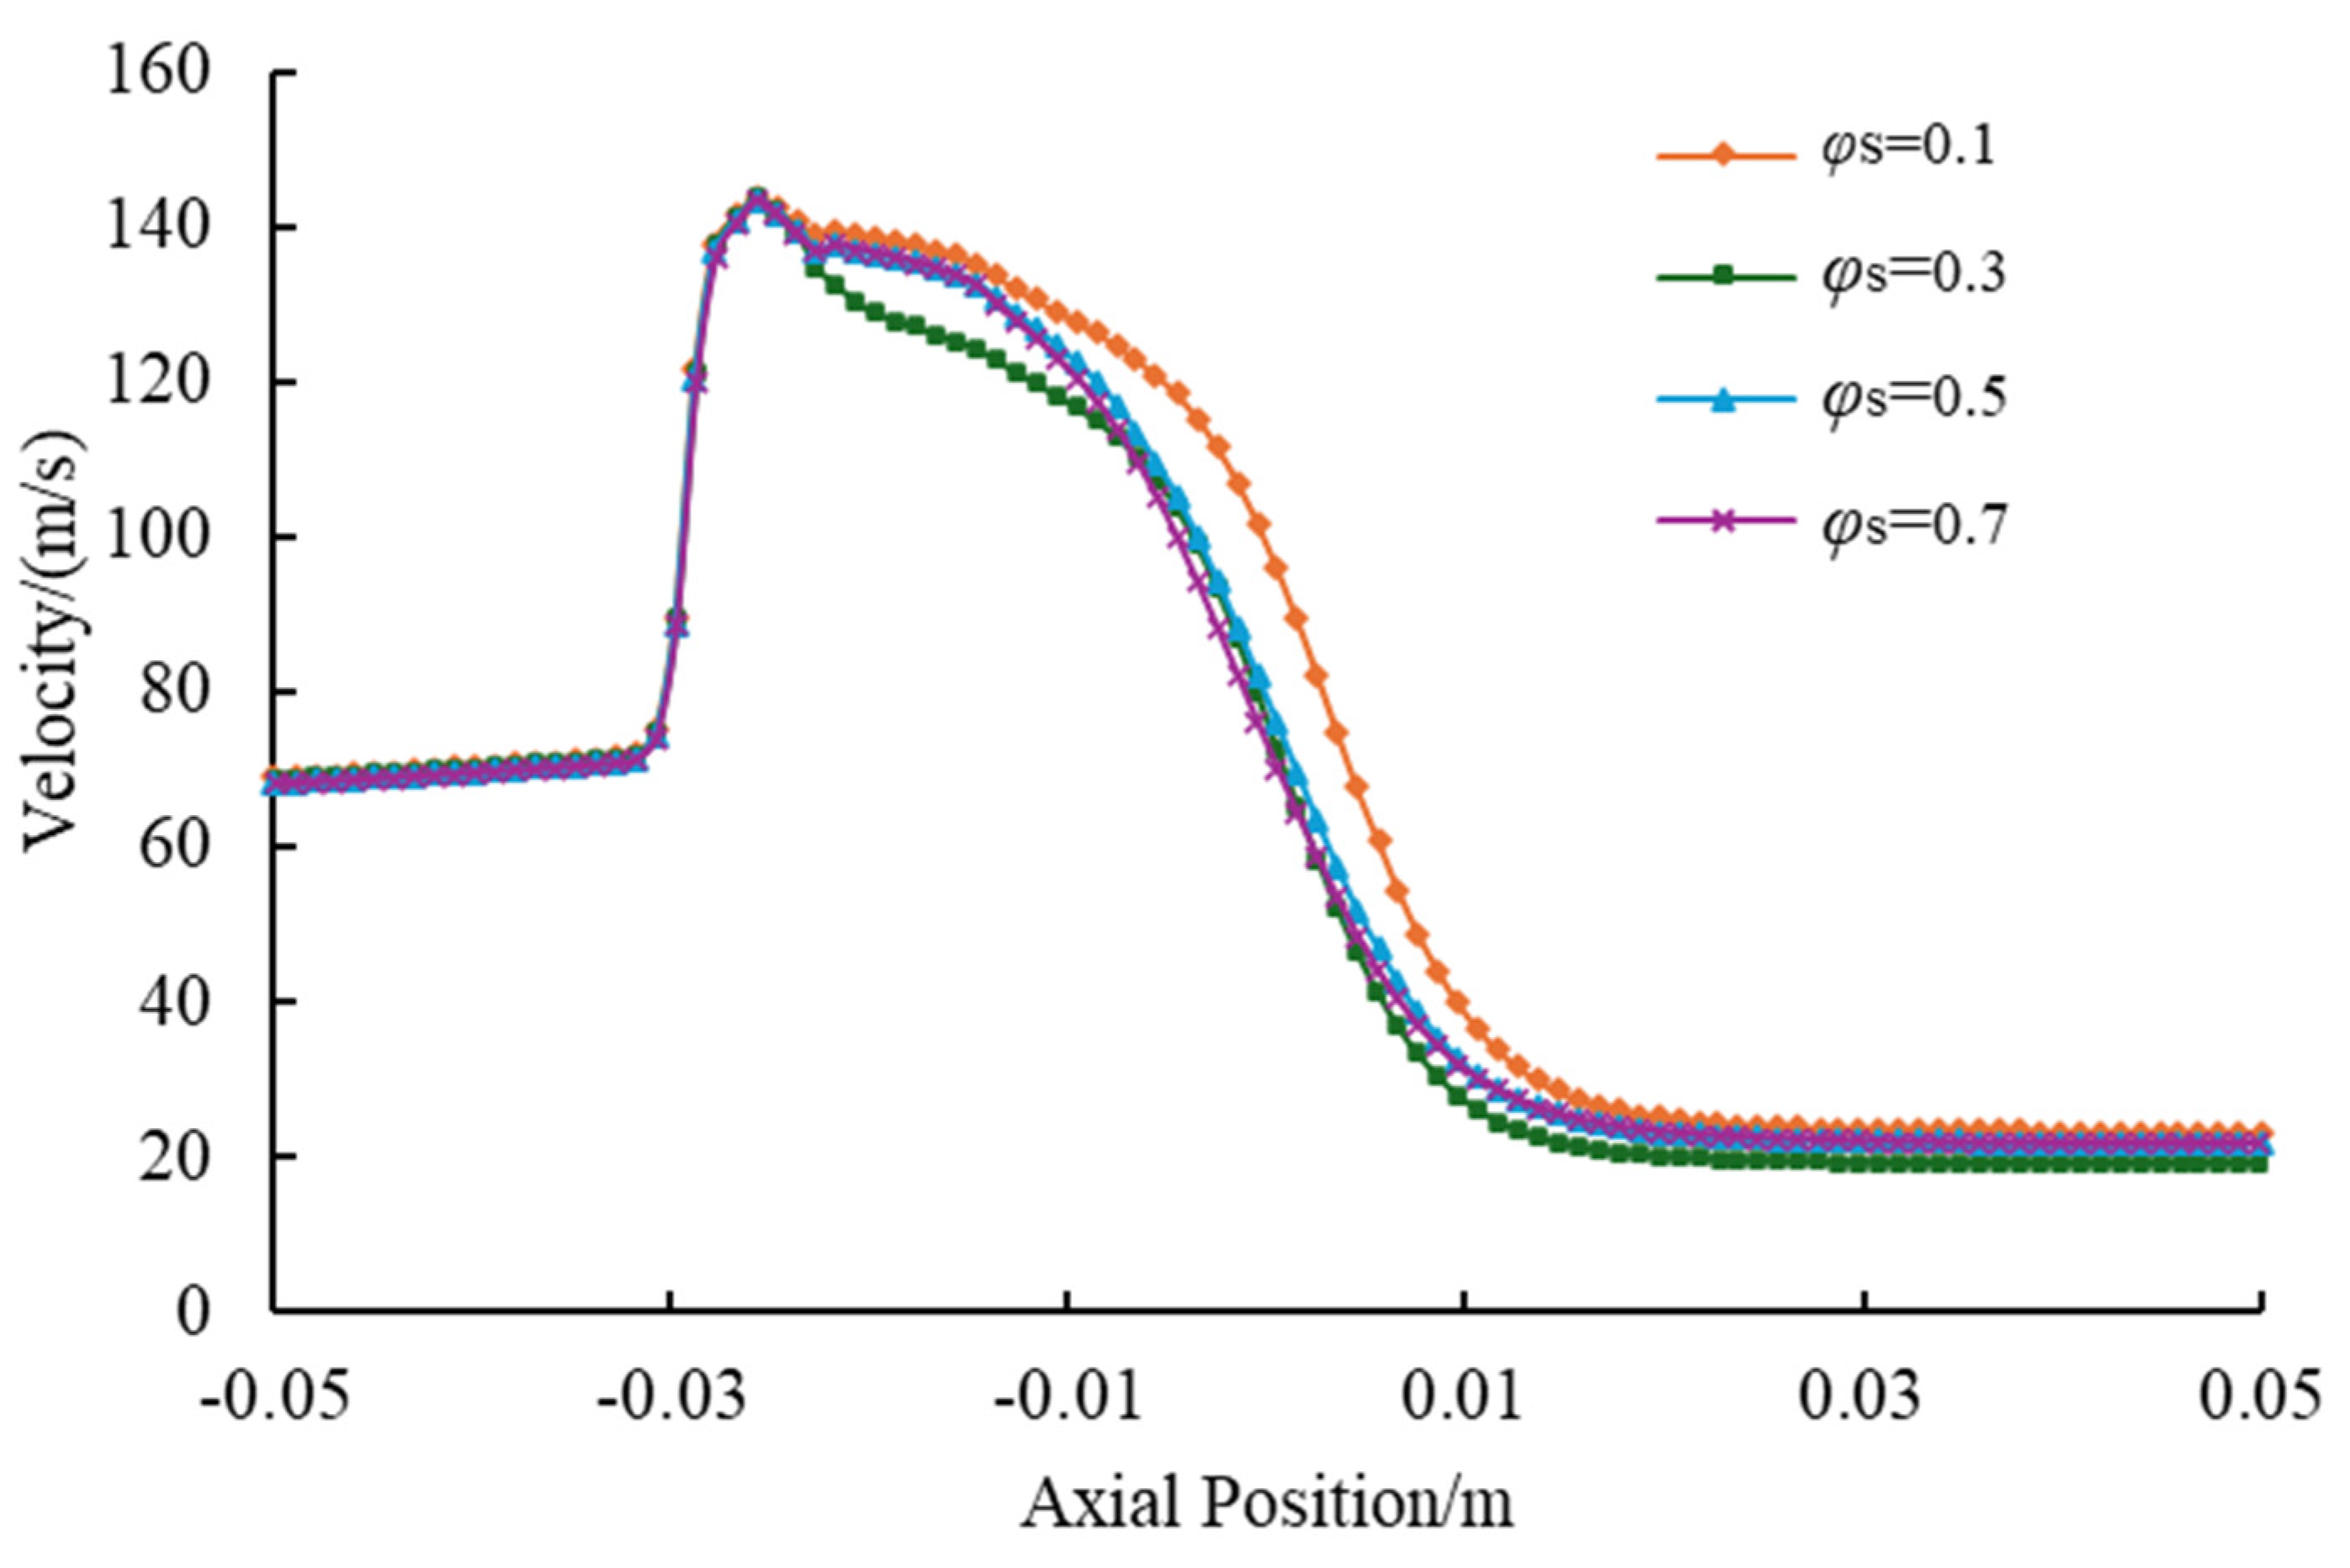
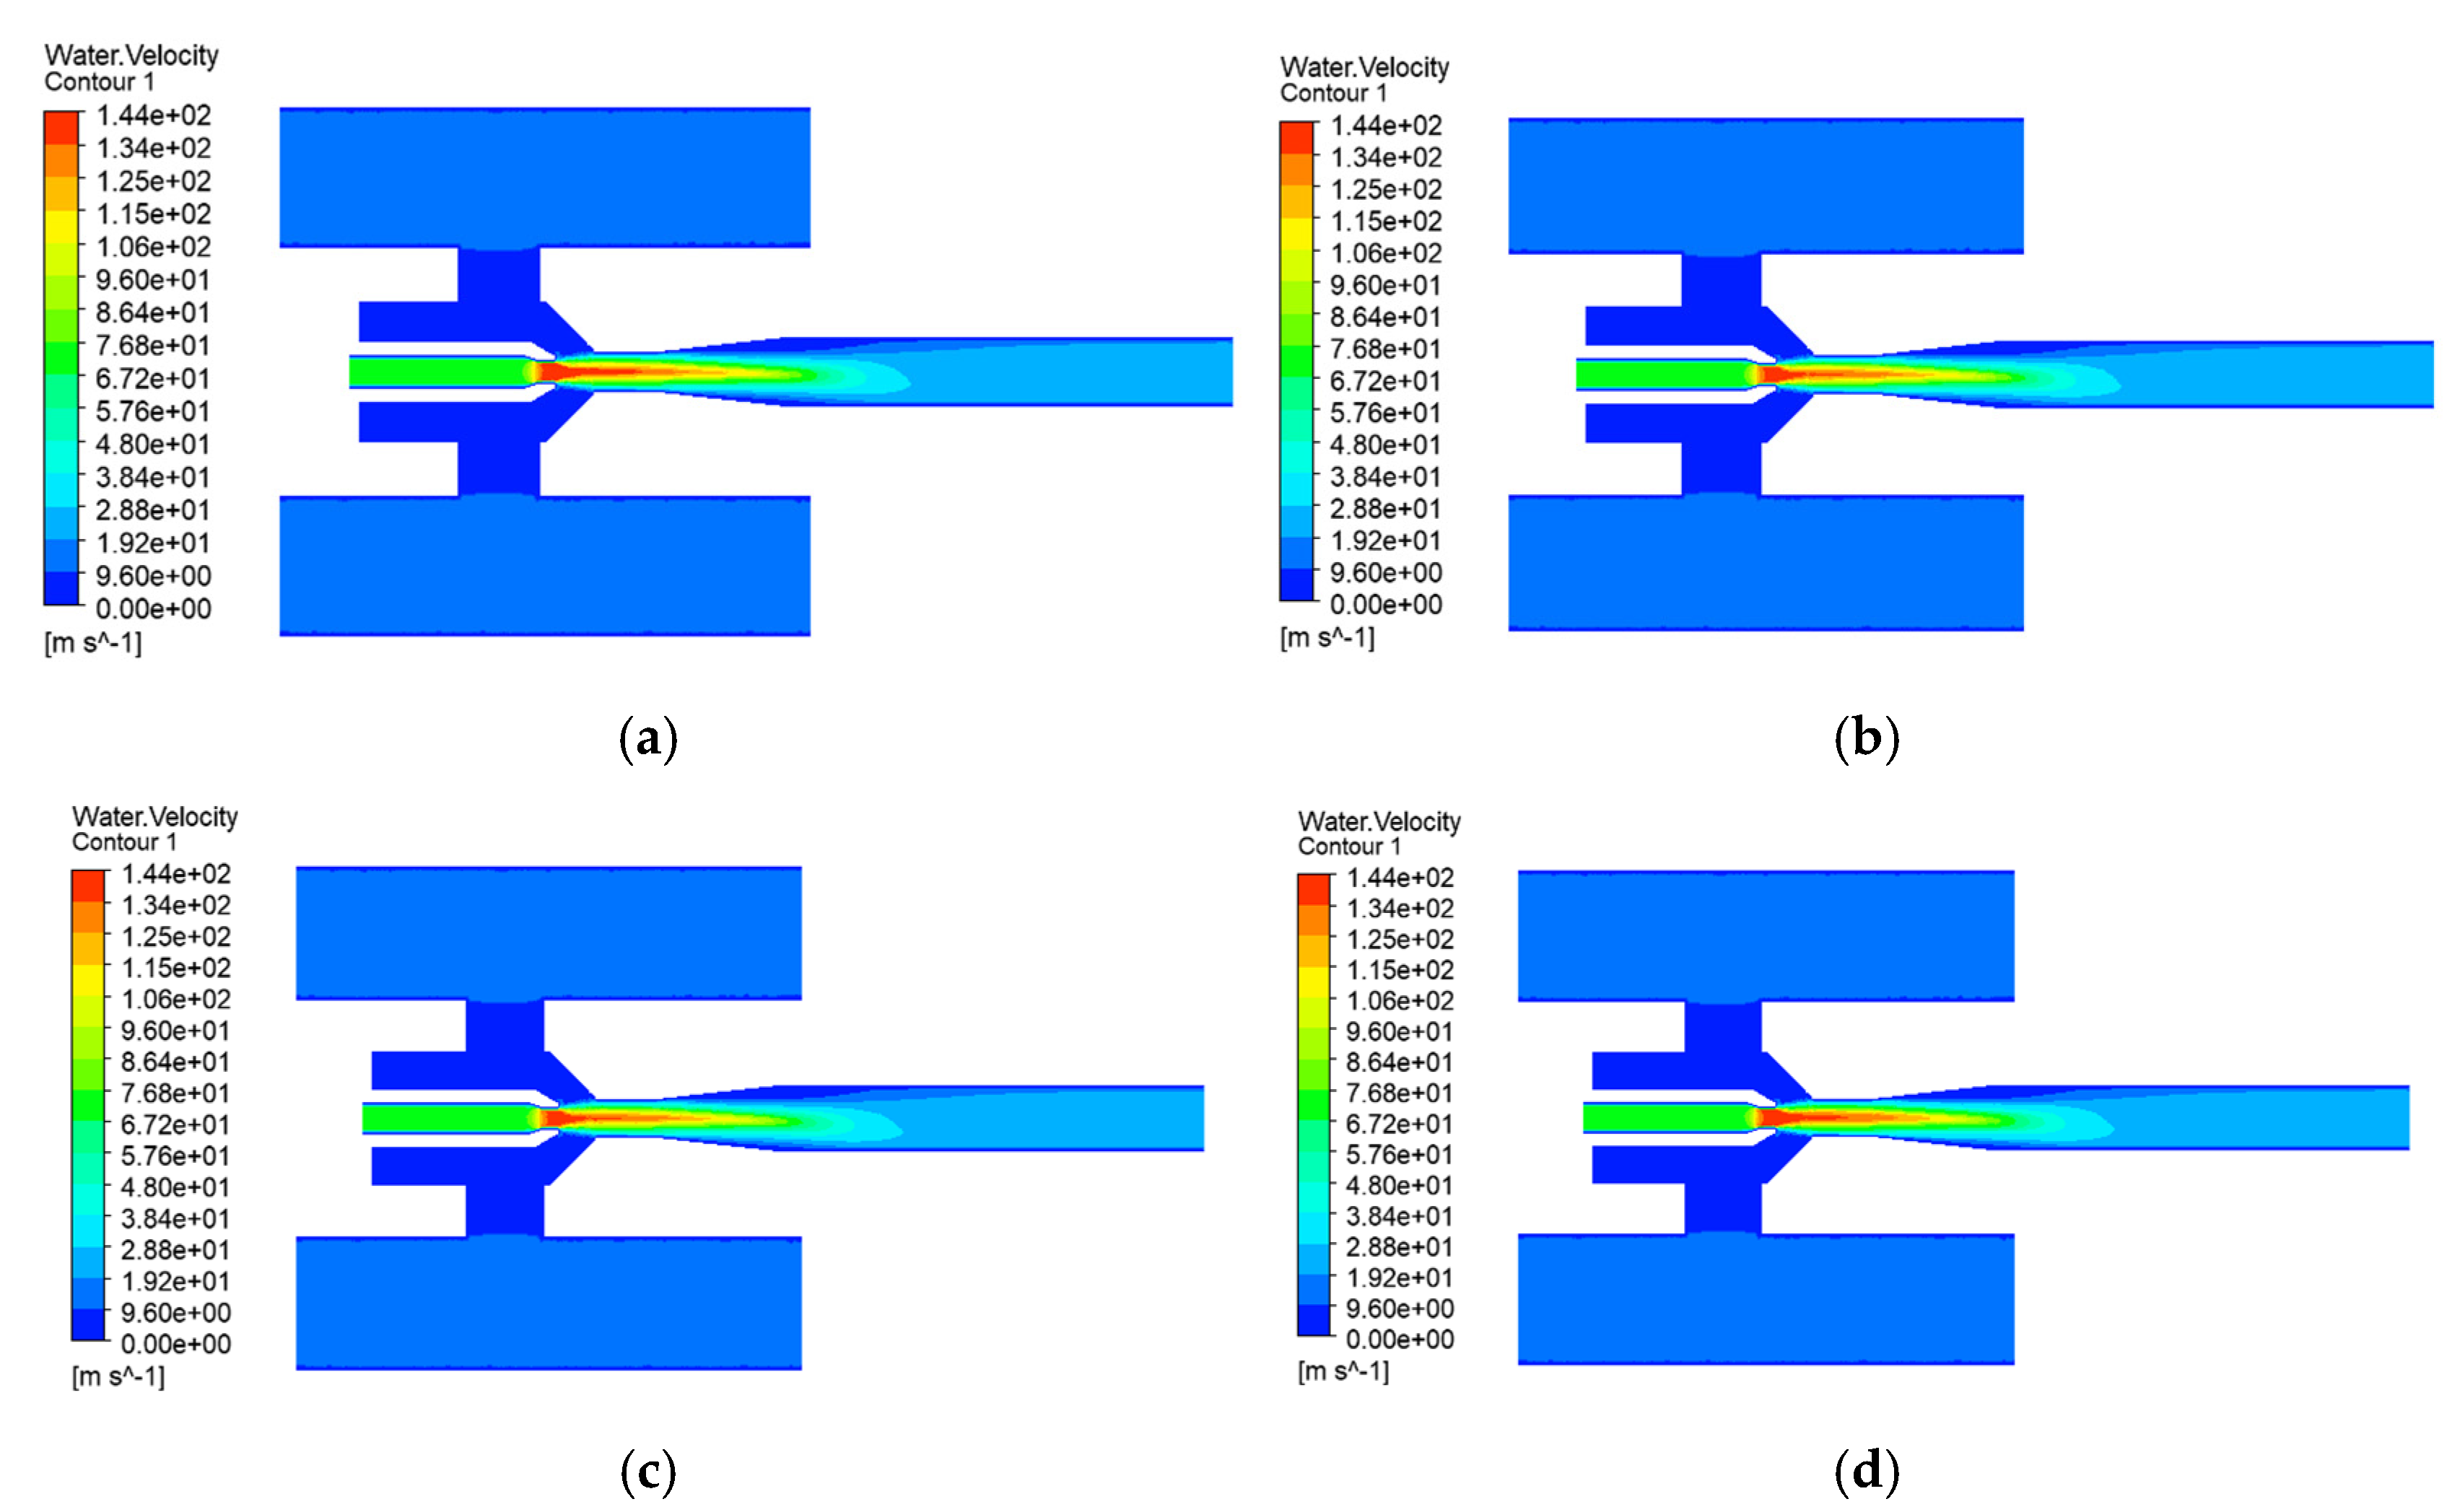
Liquid-phase velocity characteristics: Figure 20 and Figure 21 express that the initial solid volume fraction (φS) substantially compresses the jet core morphology near the nozzle outlet. The spatial extension and streamwise dimensions of the high-velocity region demonstrate significant contraction as the solid loading intensifies. When the peak axial velocity of the jet fluid remains 145 m/s, the longitudinal span of the throat section, where the velocity of the jet fluid exceeding 100 m/s, is significantly reduced. This observable contraction directly correlates with amplified kinetic energy dissipation and flow instability, indicating that elevated solid volume fractions increase flow resistance through particle crowding effects, as directly evidenced by pressure gradient intensification.
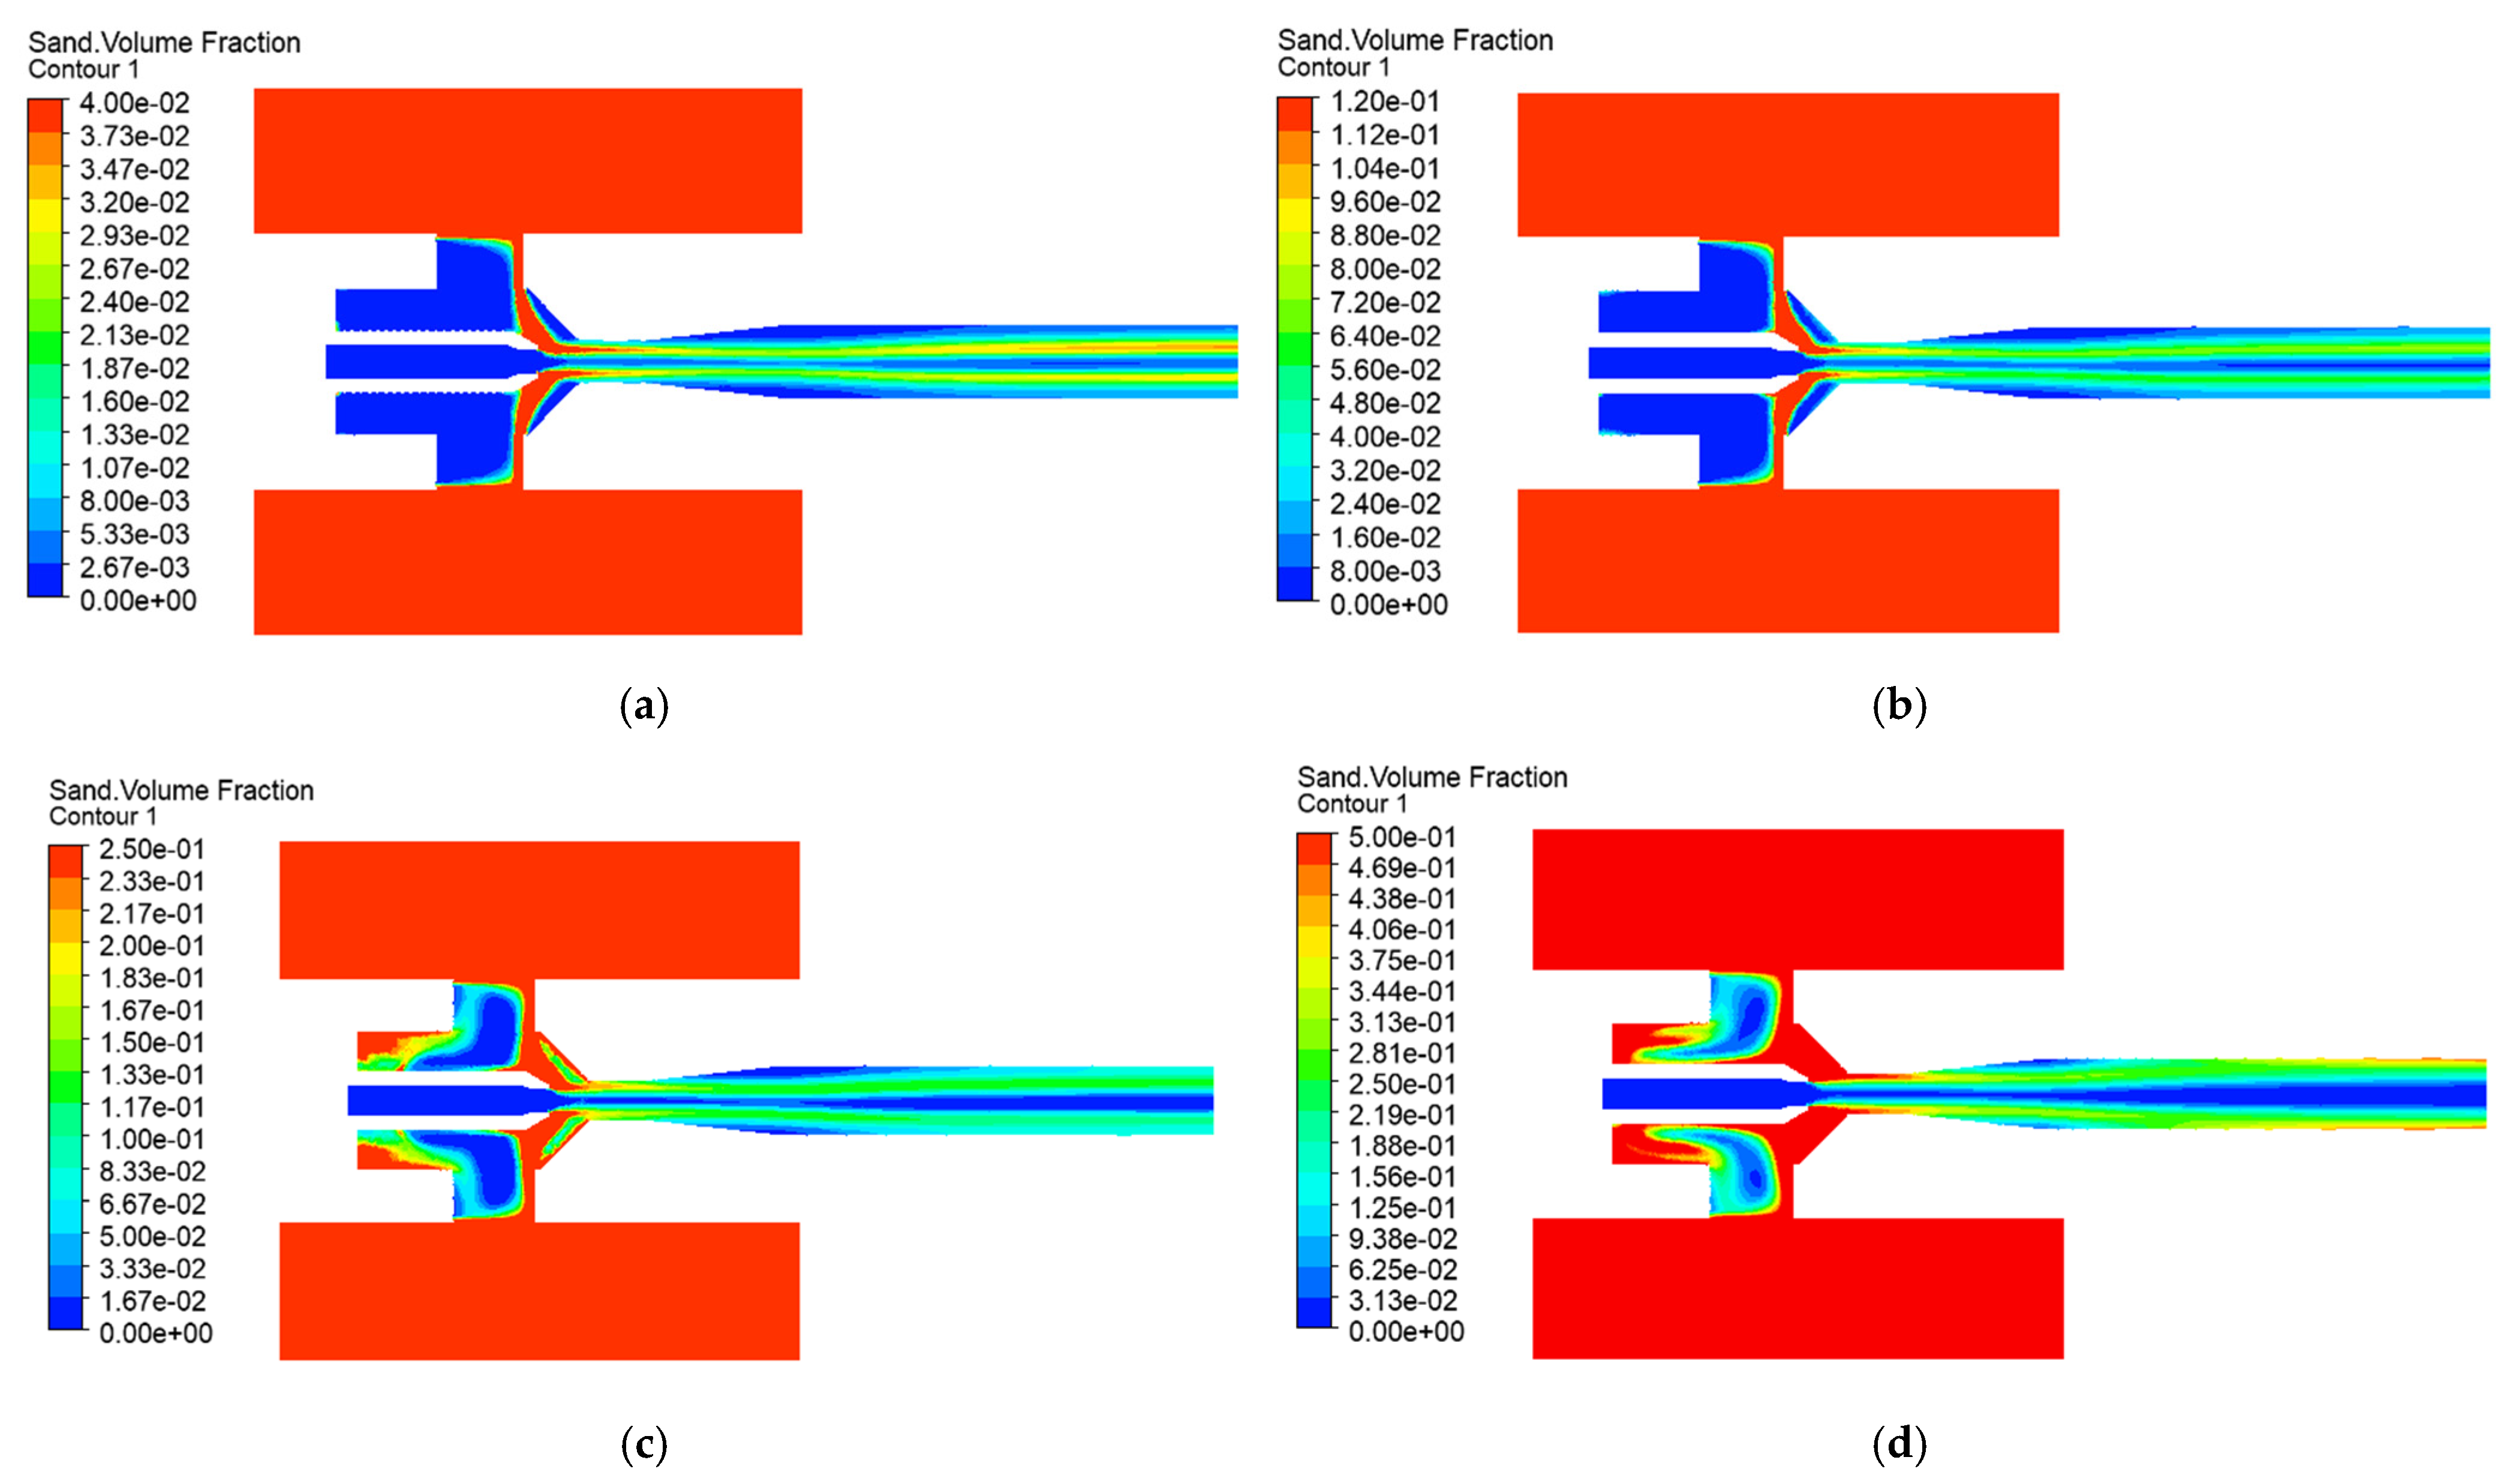
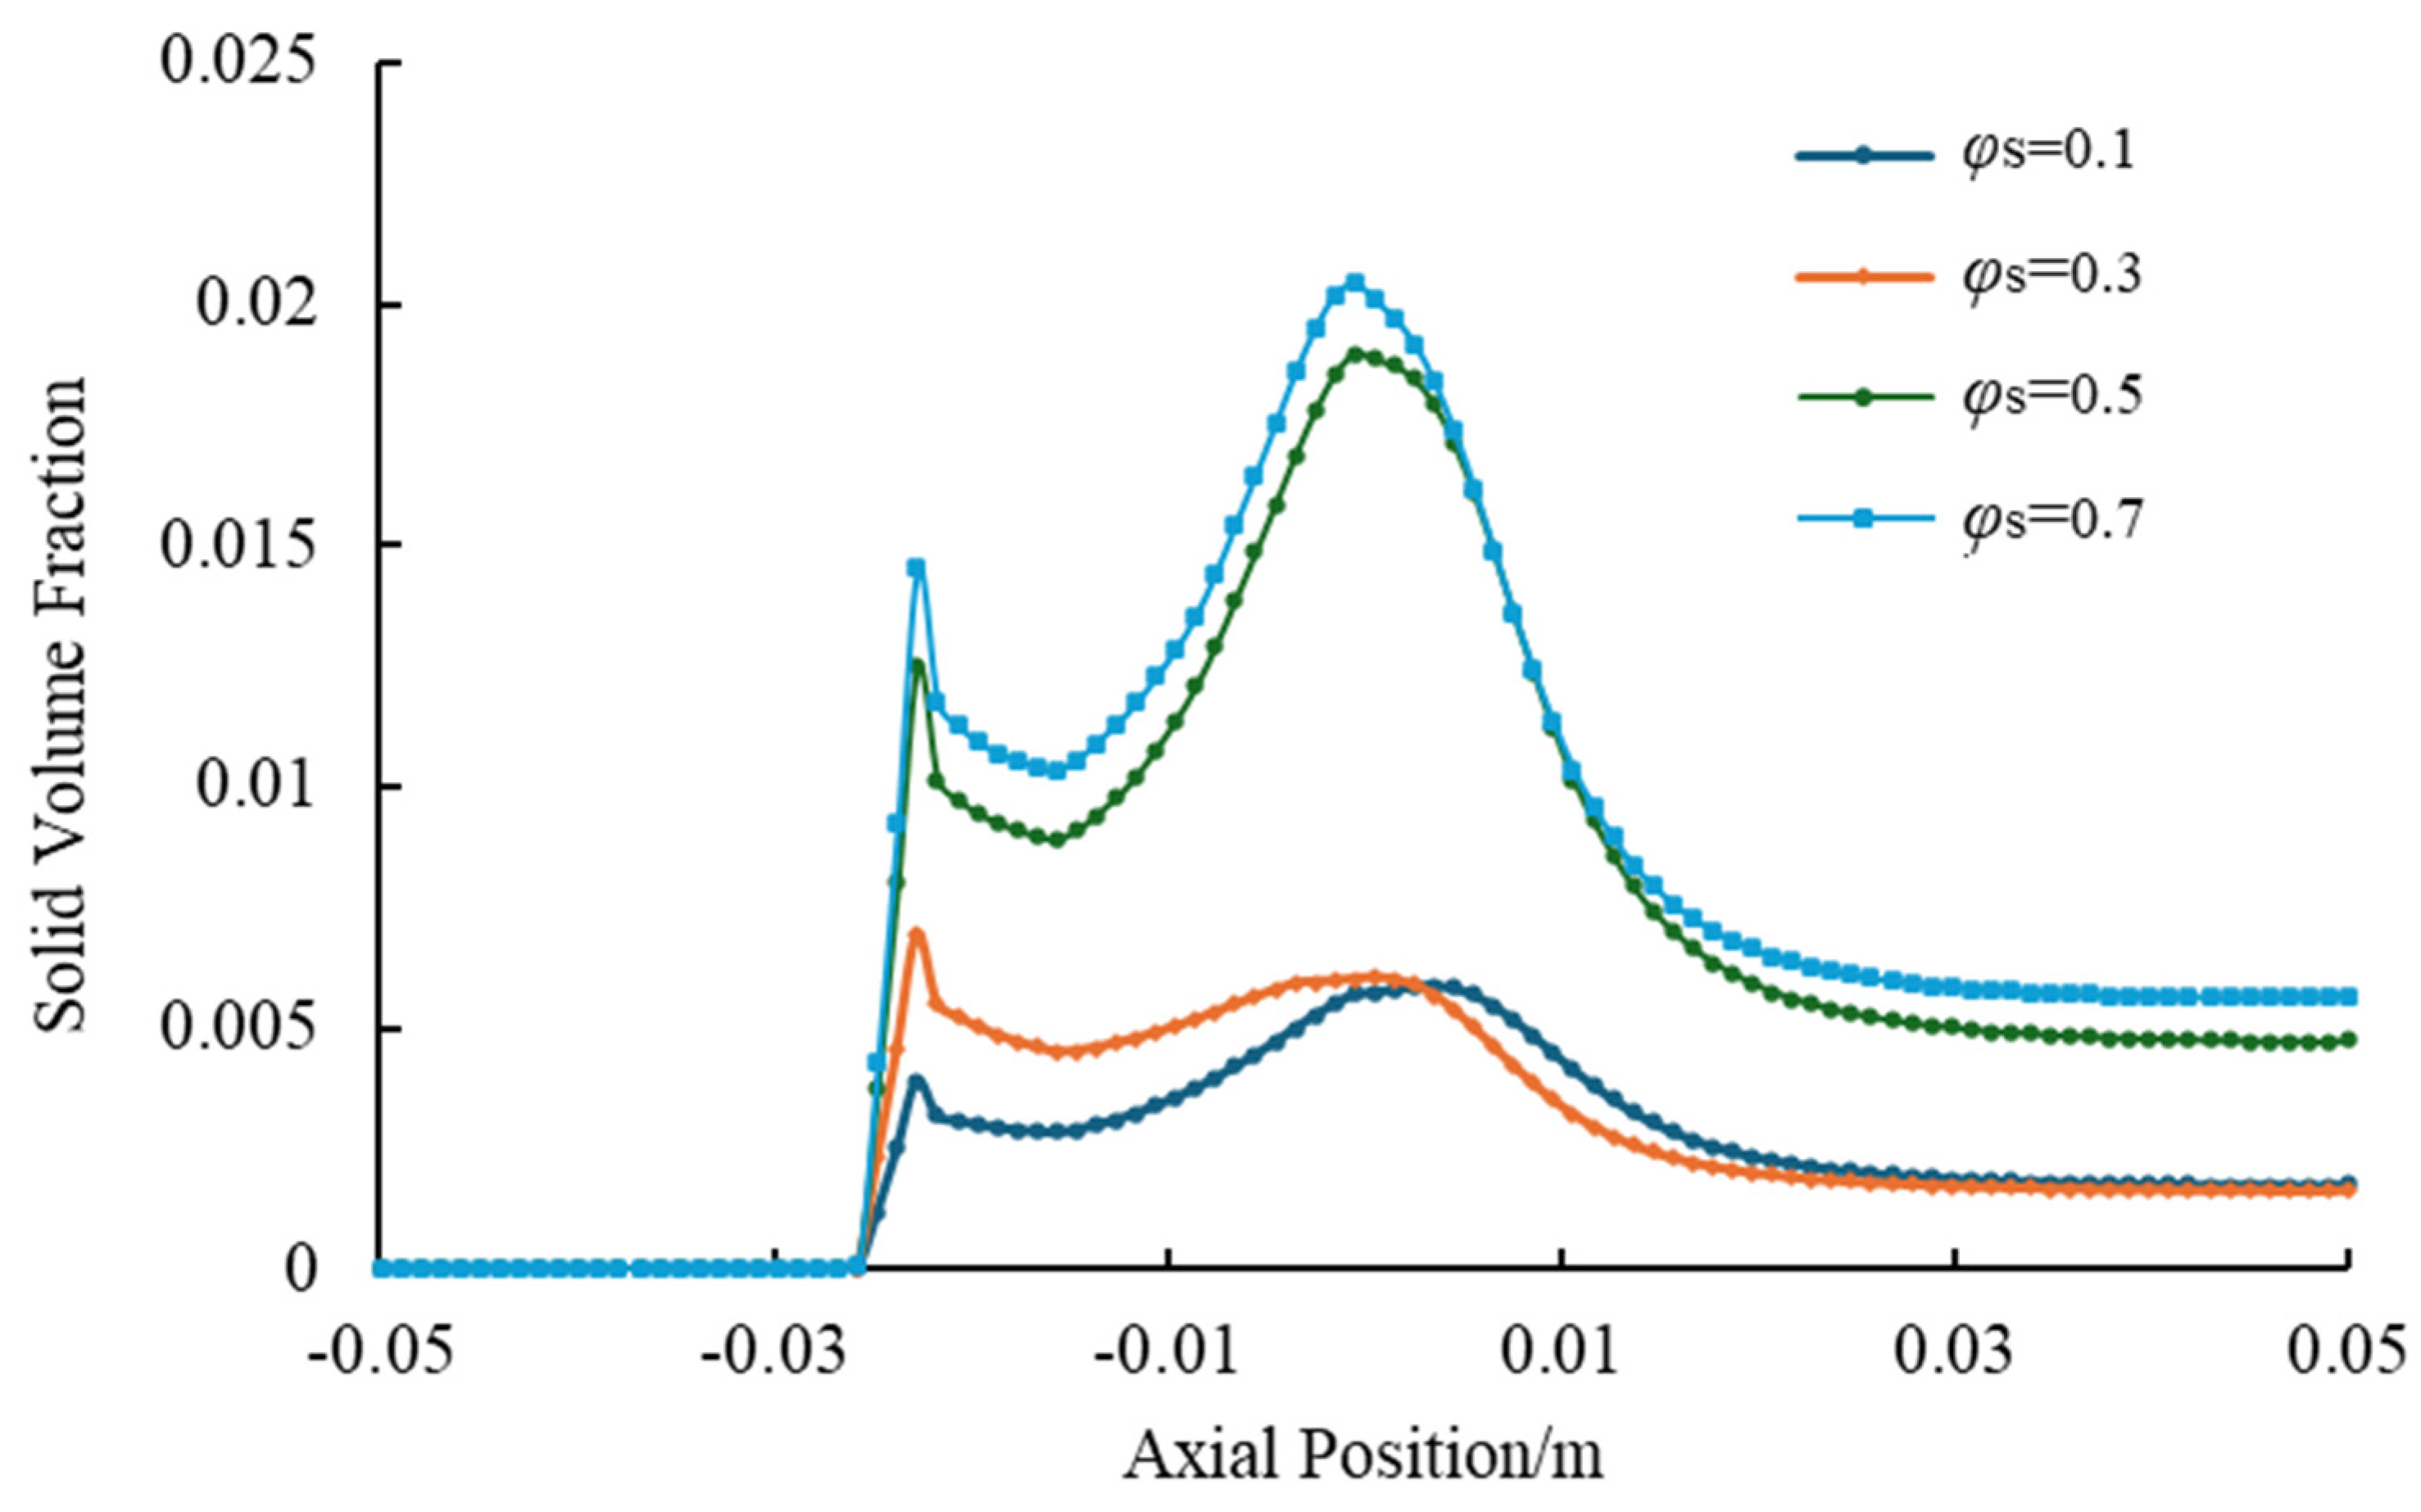
Solid-phase distribution pattern: Figure 22 and Figure 23 demonstrate that the increase in the solid volume fraction significantly exacerbates the particle concentration in the throat and diffuser sections. The maximum concentration value increased from approximately 0.04 to a level exceeding 0.55, and the peak axial solid volume fraction increased from 0.0057 to 0.02. This concentration enhancement directly augments the transported solid mass capacity.
(2) 
Solid Particle Diameter
Pressure distribution analysis: Figure 24 shows that the time-averaged pressure distribution in the throat changes as the particle diameter (d) increases from 0.1 mm to 0.7 mm. Pressure gradients intensify at the throat inlet and diffuser sections, demonstrating particle-size-dependent flow modifications.
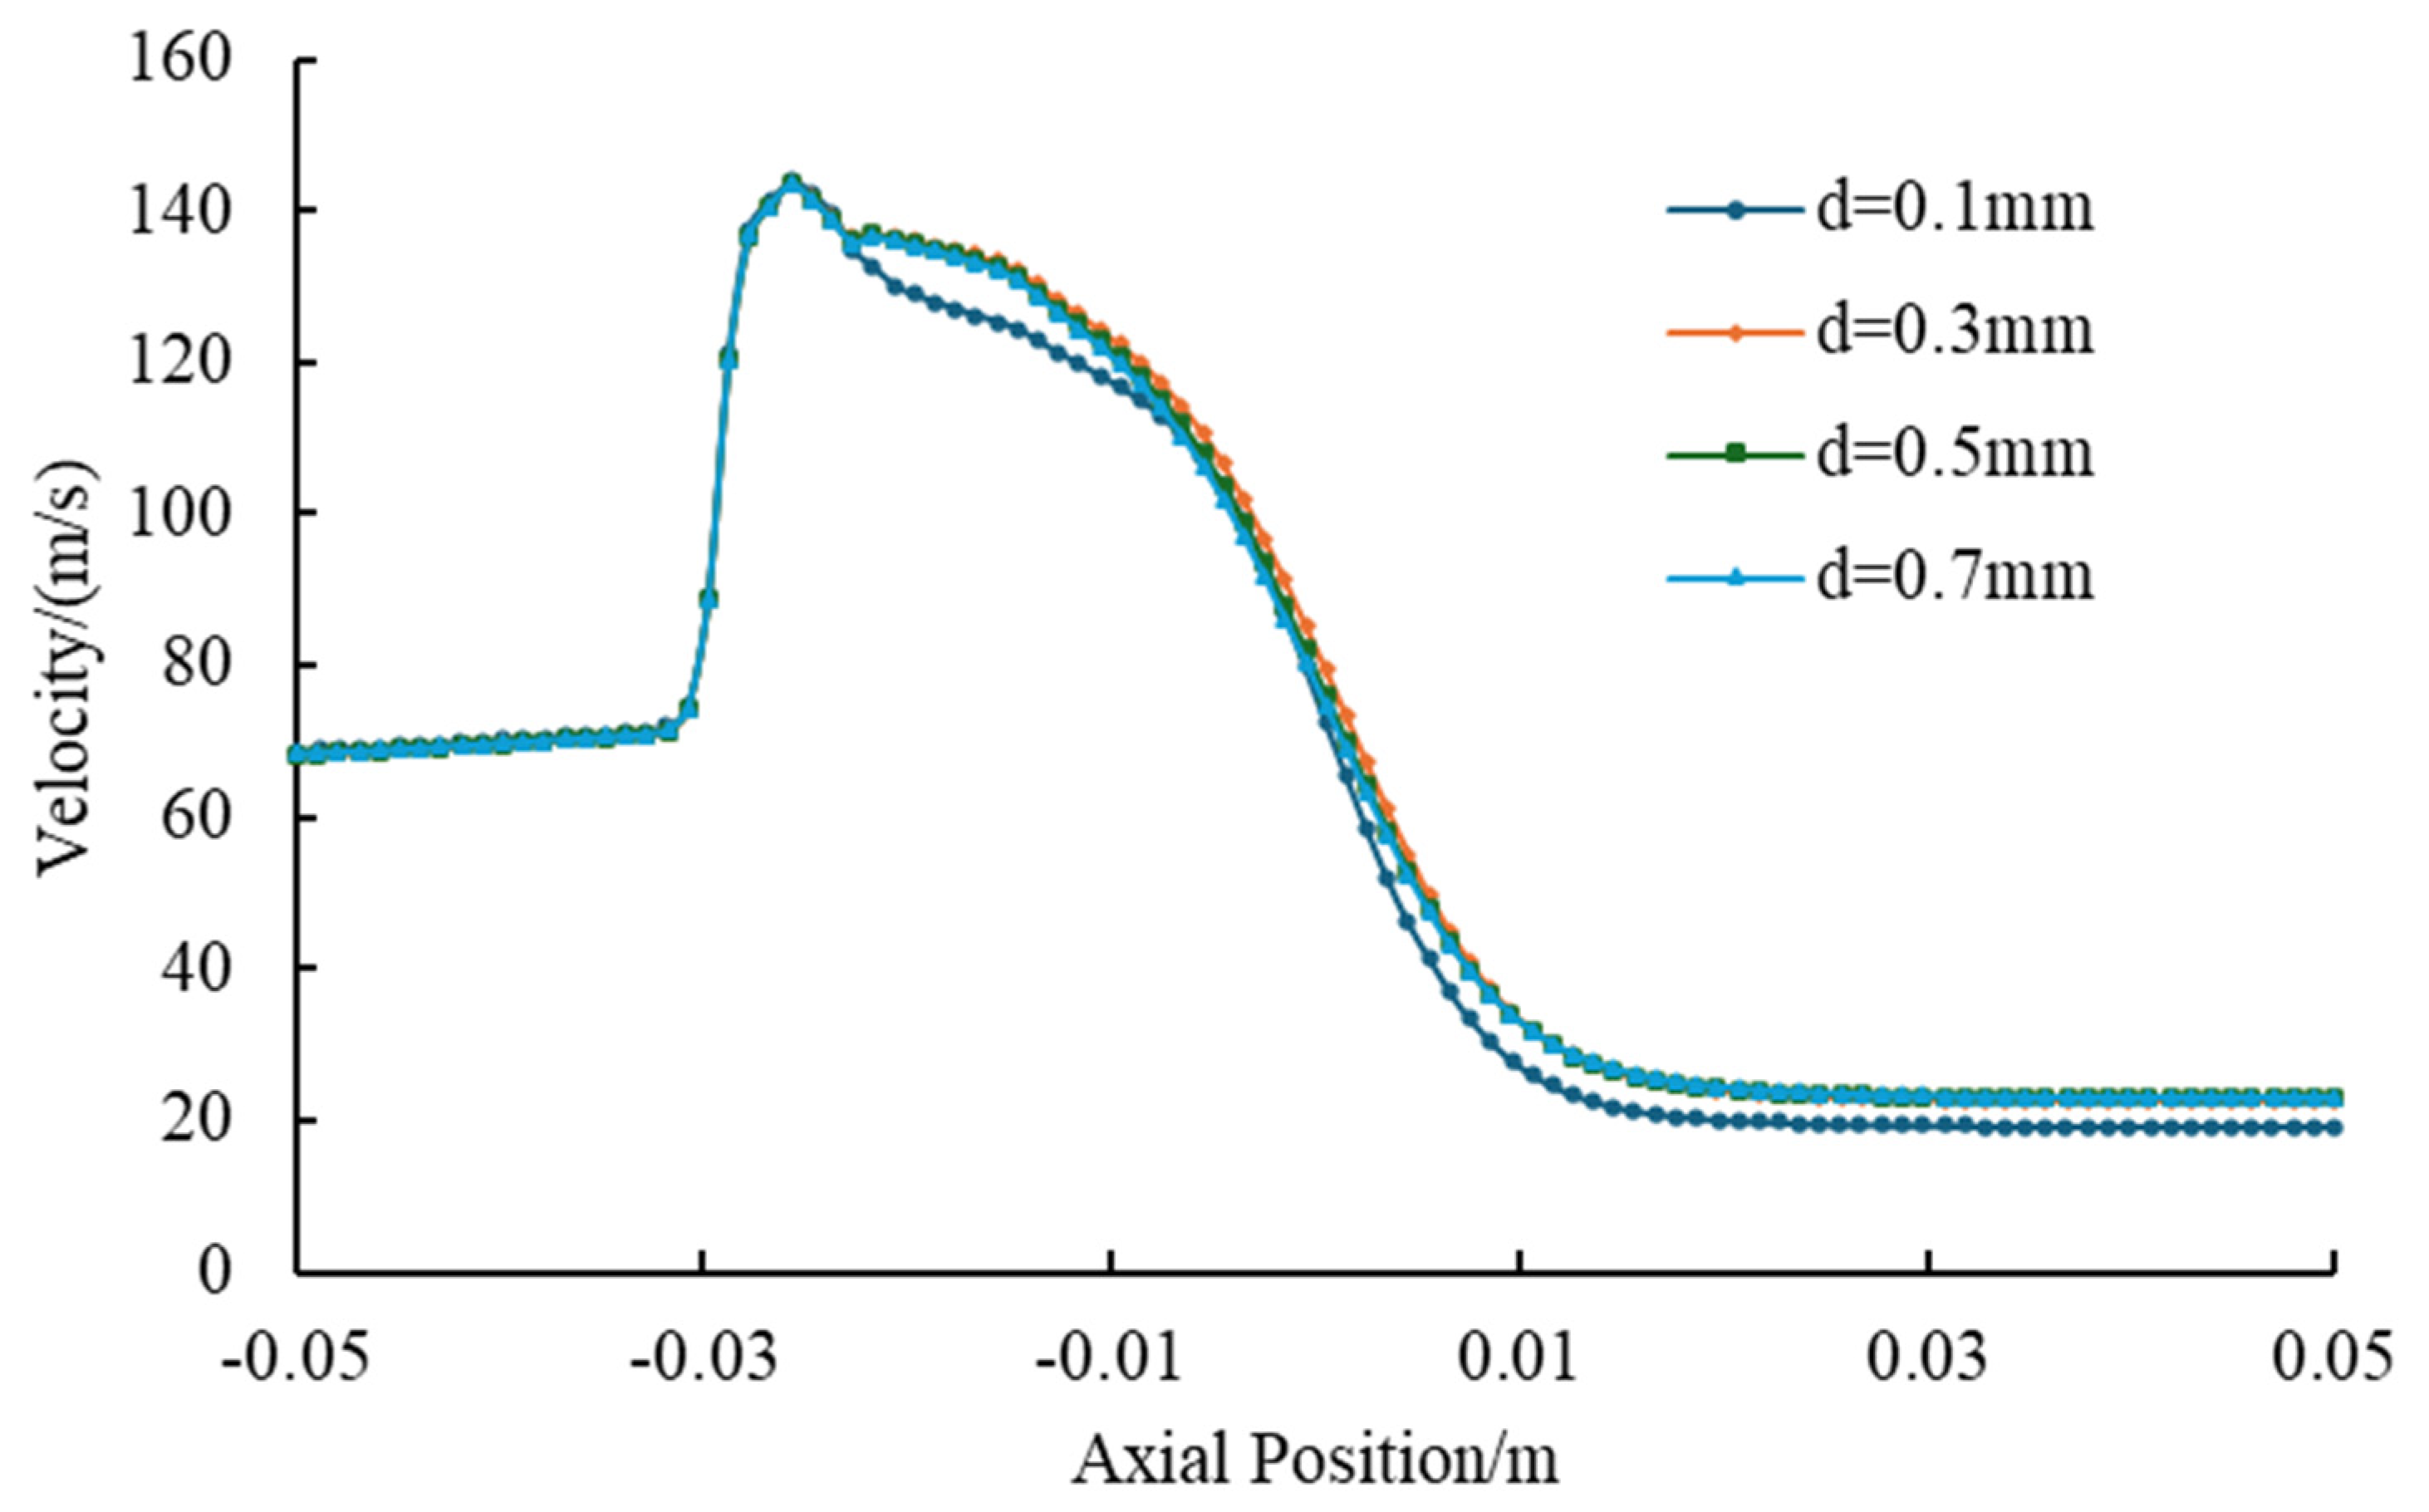
Liquid-phase velocity characteristic: Figure 25 and Figure 26 show that larger particles can distort the shape and stability of the jet core. The velocity distribution becomes increasingly non-uniform in the throat section, with contracted high-velocity zones and expanded low-velocity regions. The axial velocity curves exhibit a faster decay rate in the throat, indicating energy loss.
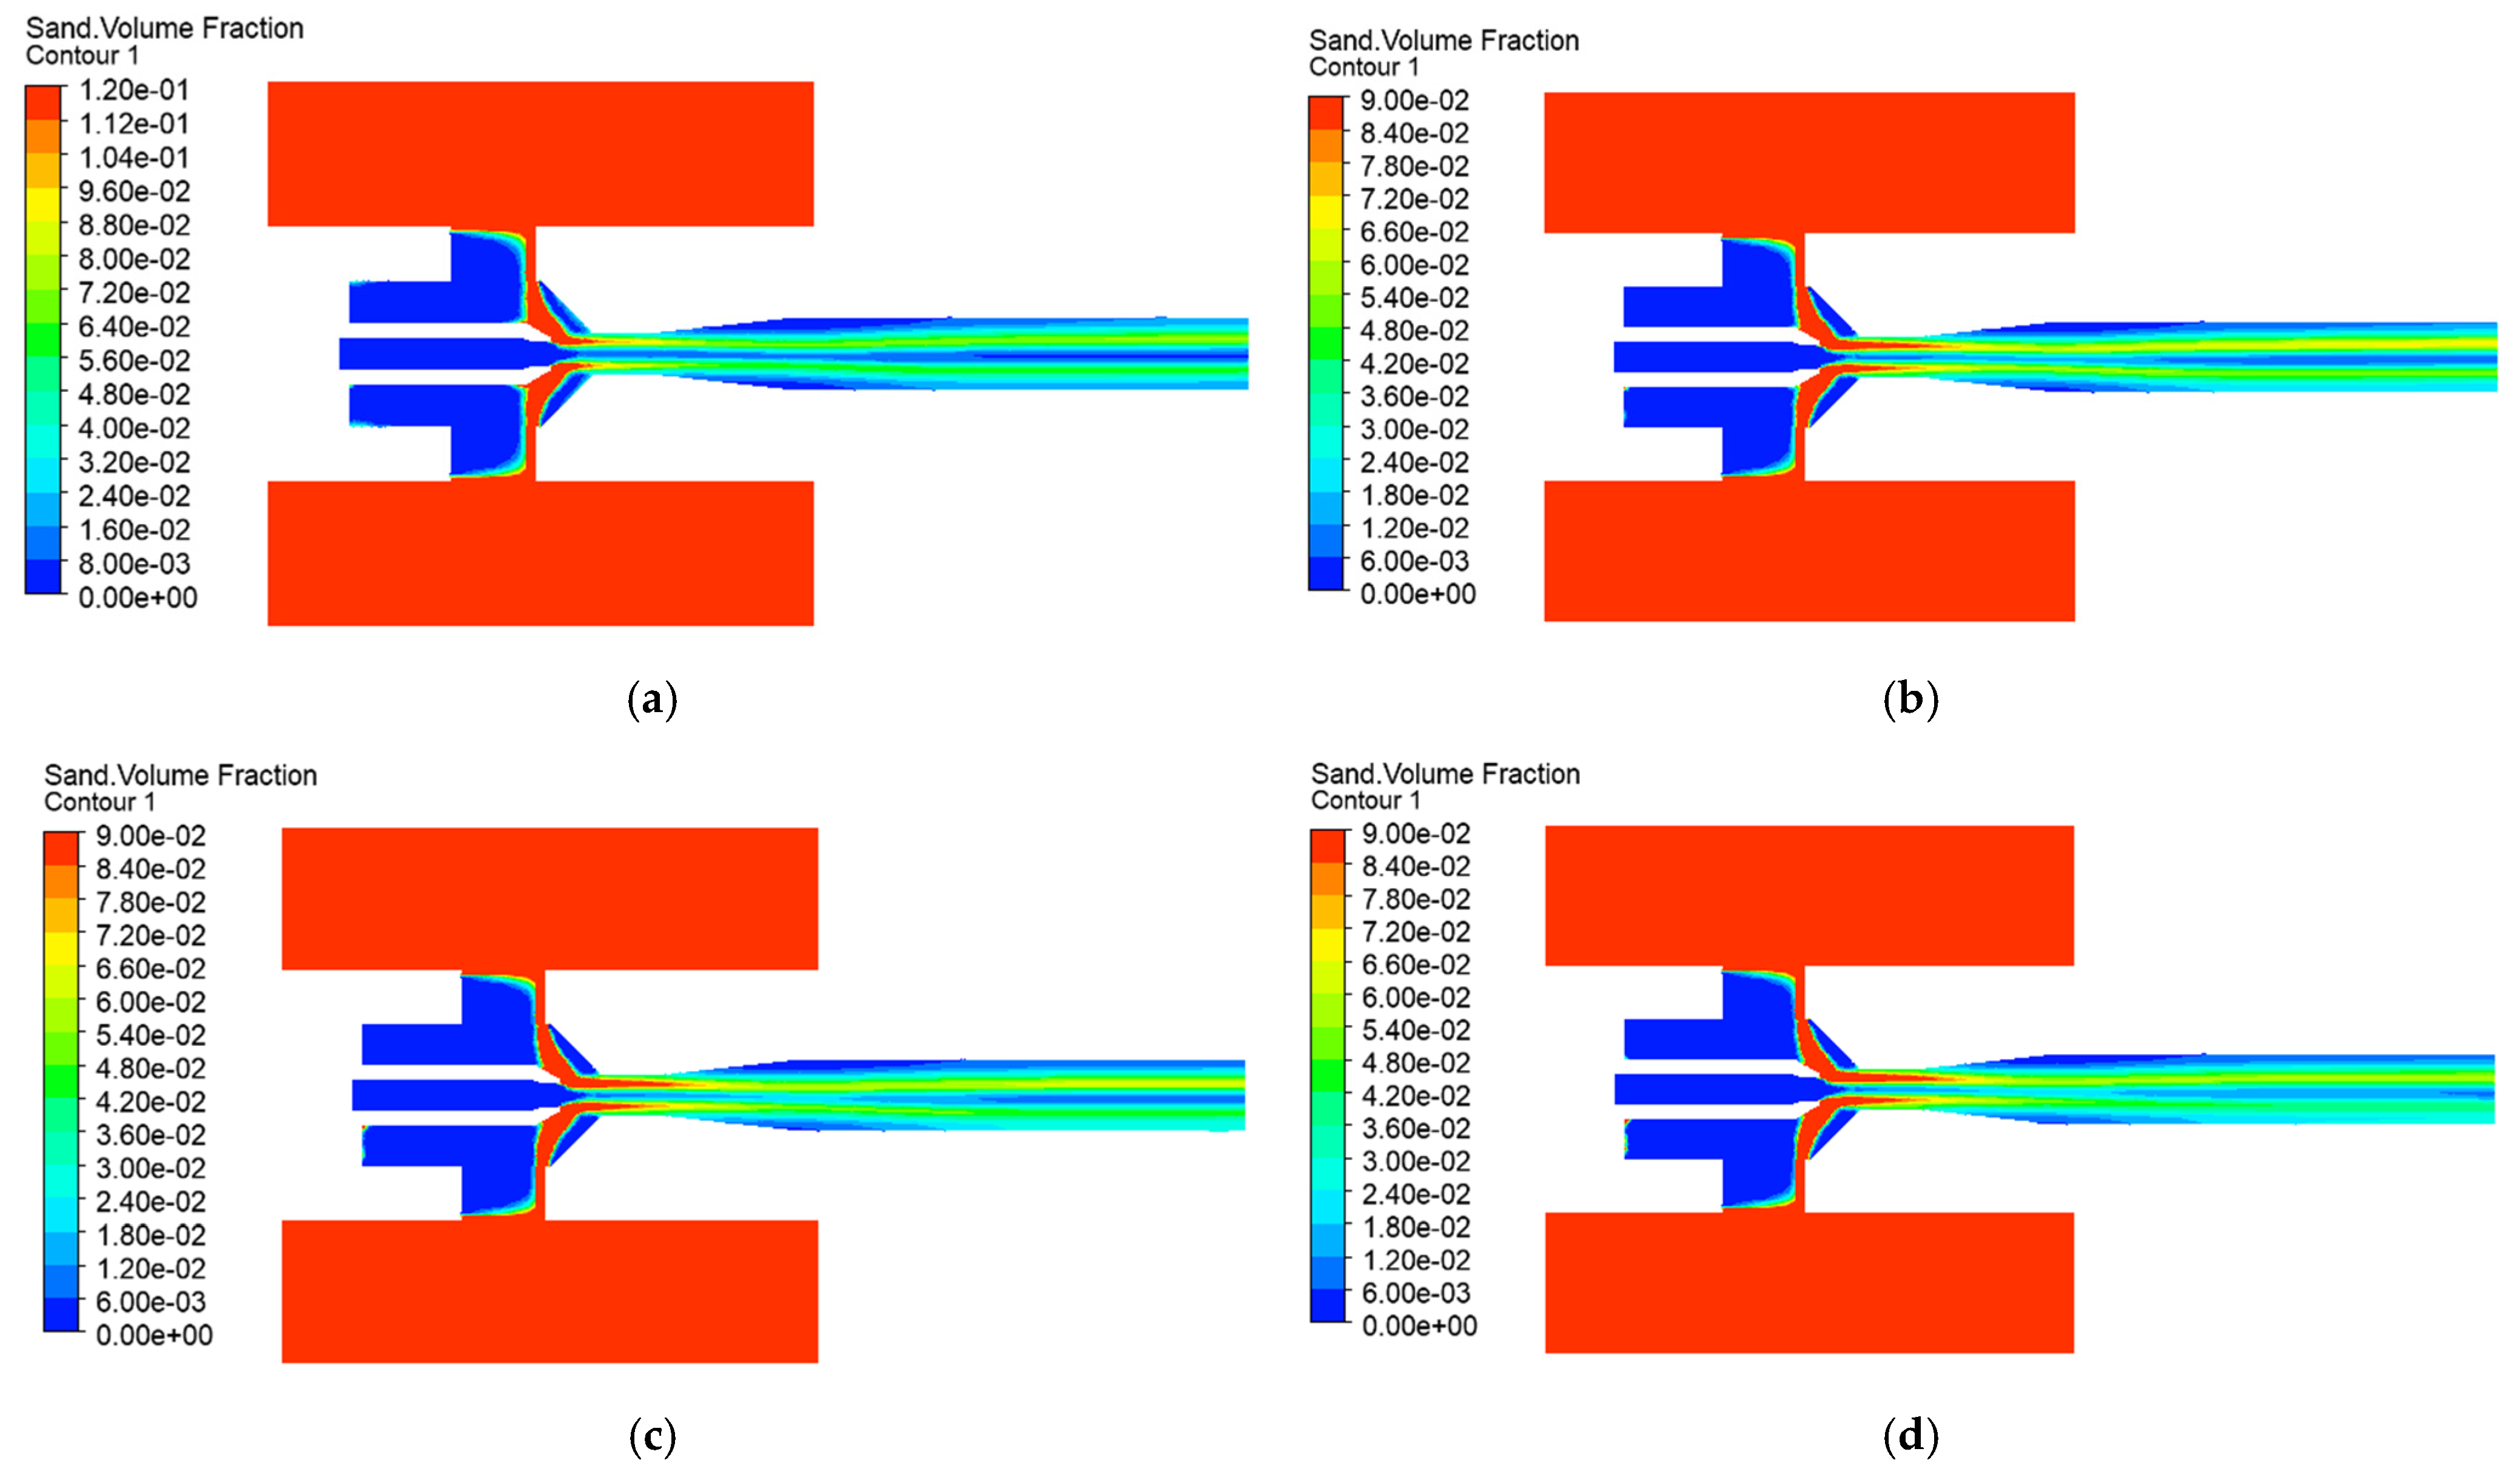
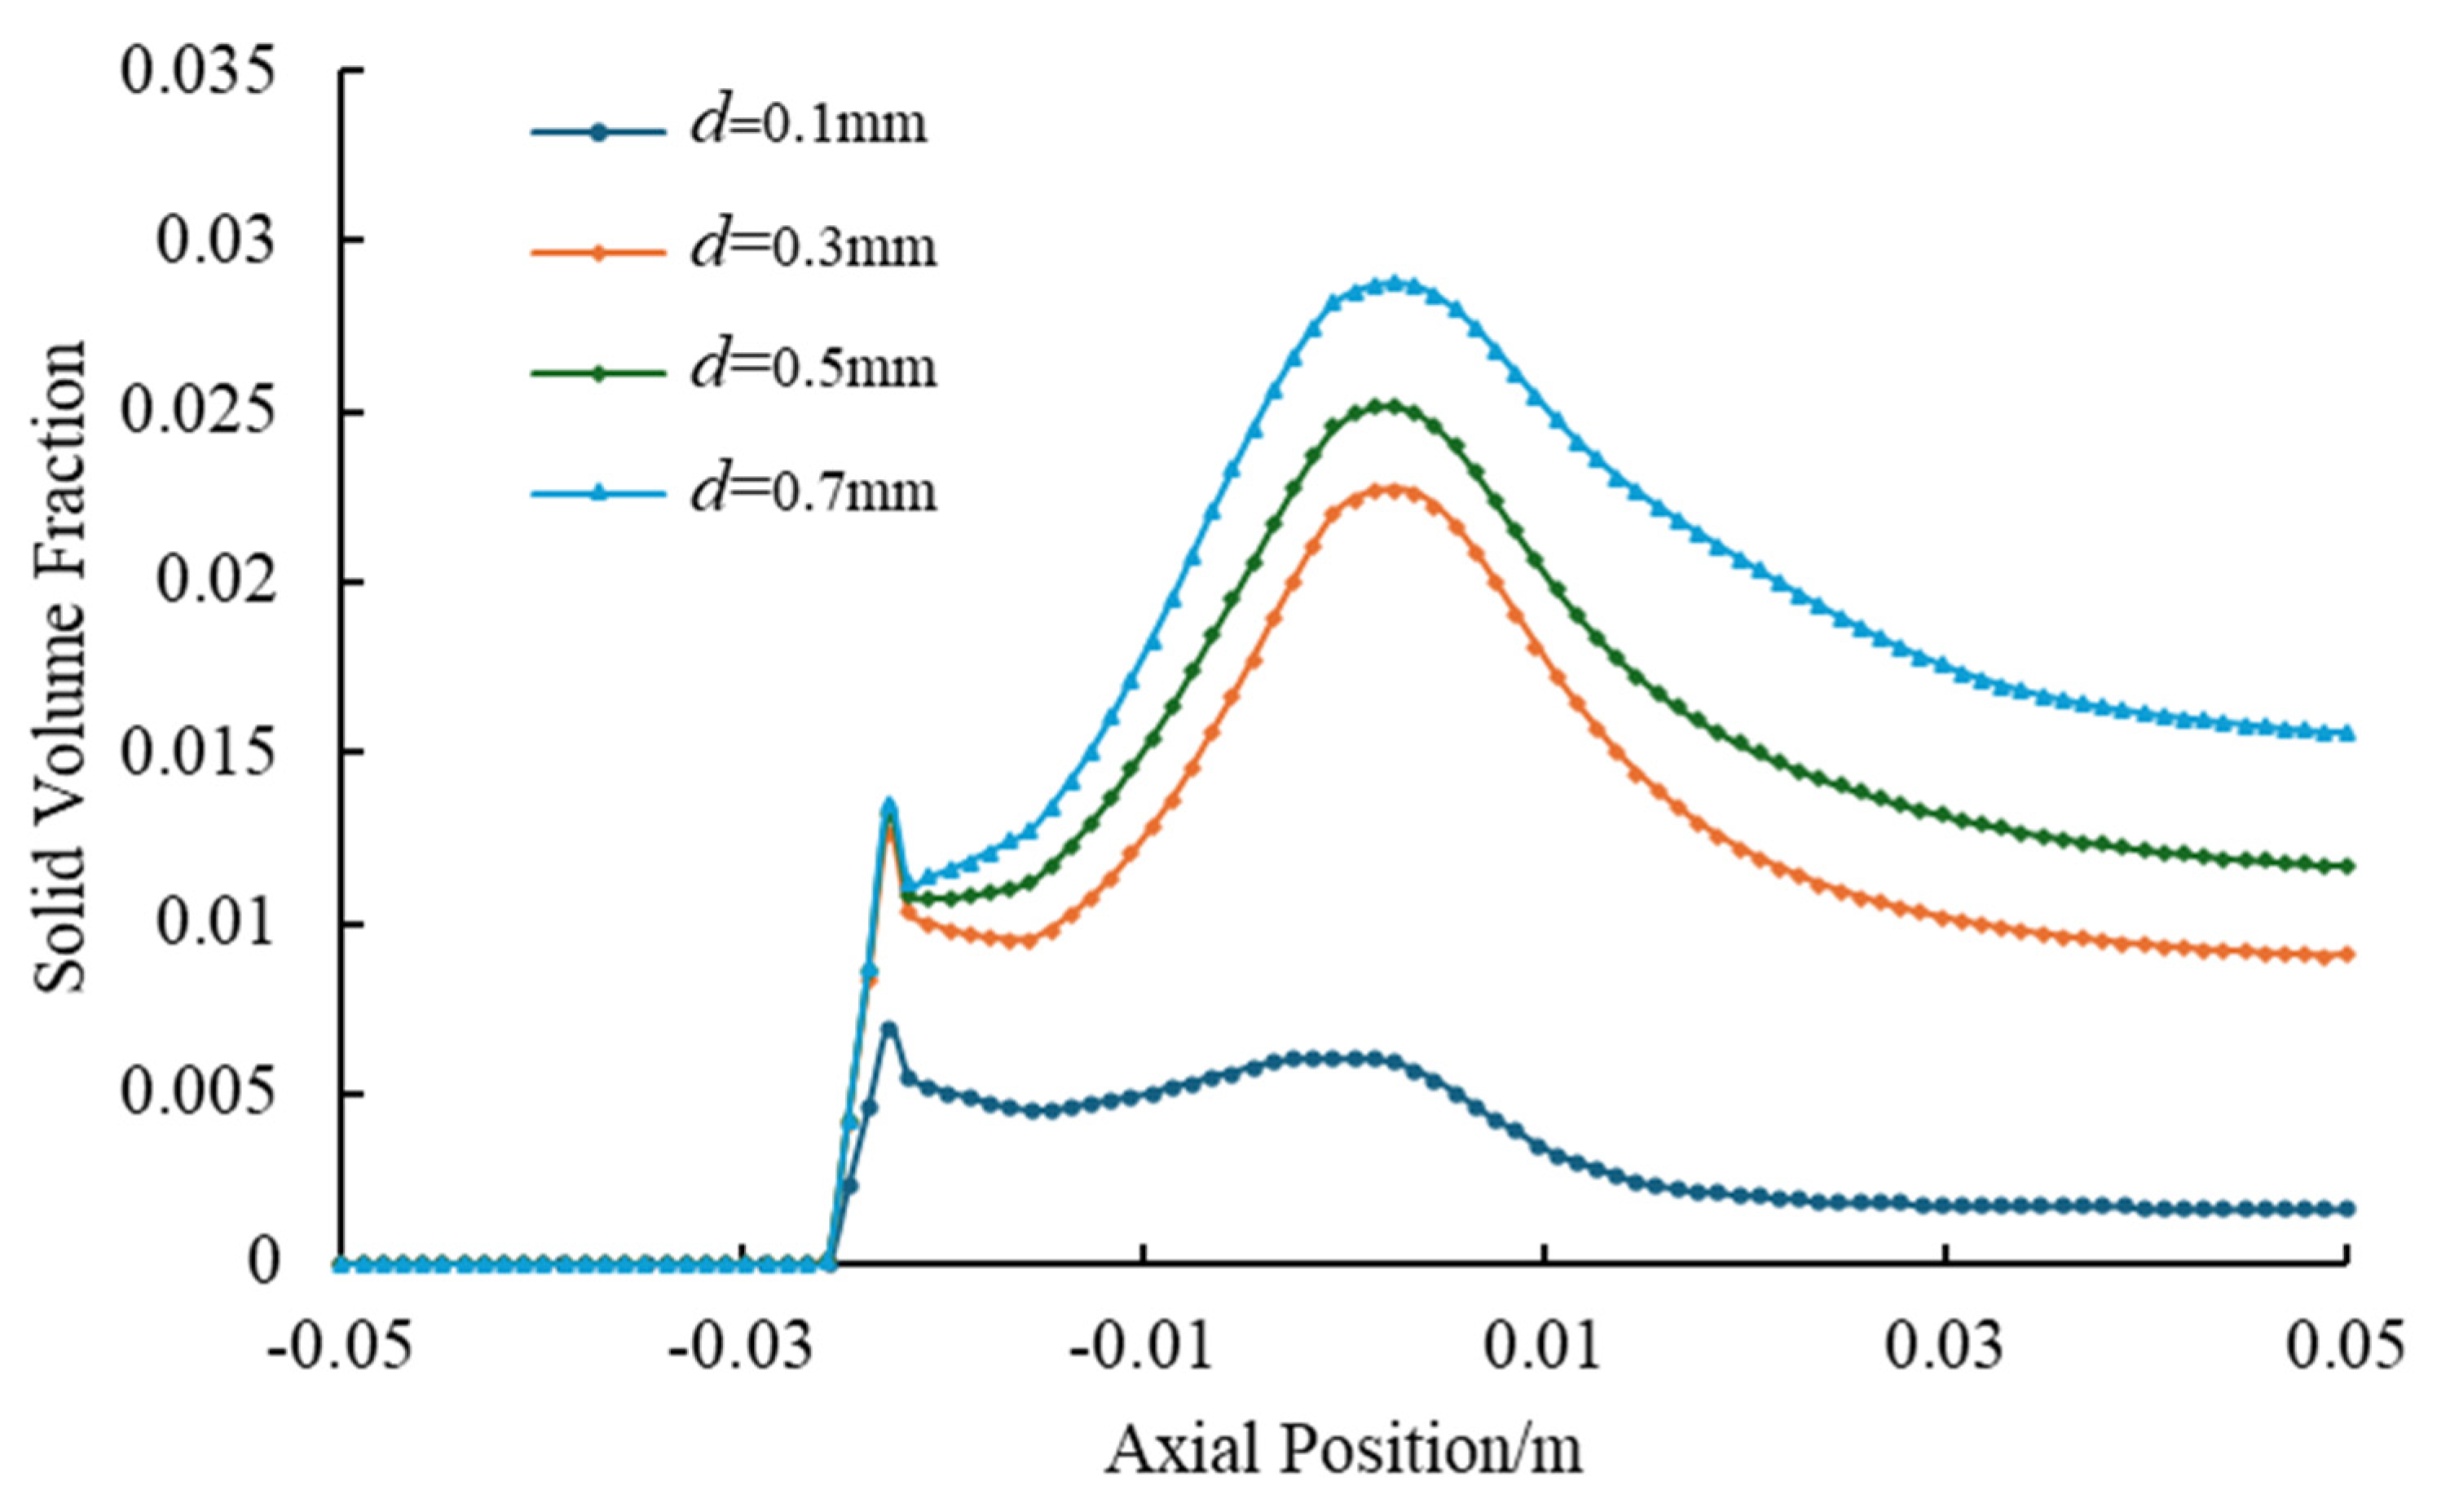
Solid-phase distribution pattern: Figure 27 and Figure 28 reveal a critical threshold. When the particle diameter is d ≤ 0.5 mm, the maximum axial solid volume fraction (0.006 to 0.029) increases with increases in particle size. At a particle diameter of 0.7 mm, the peak concentration decreases (<0.029) with worsened distribution uniformity, signaling reduced transport efficiency.
(3) 
Performance Analysis and Critical Efficiency
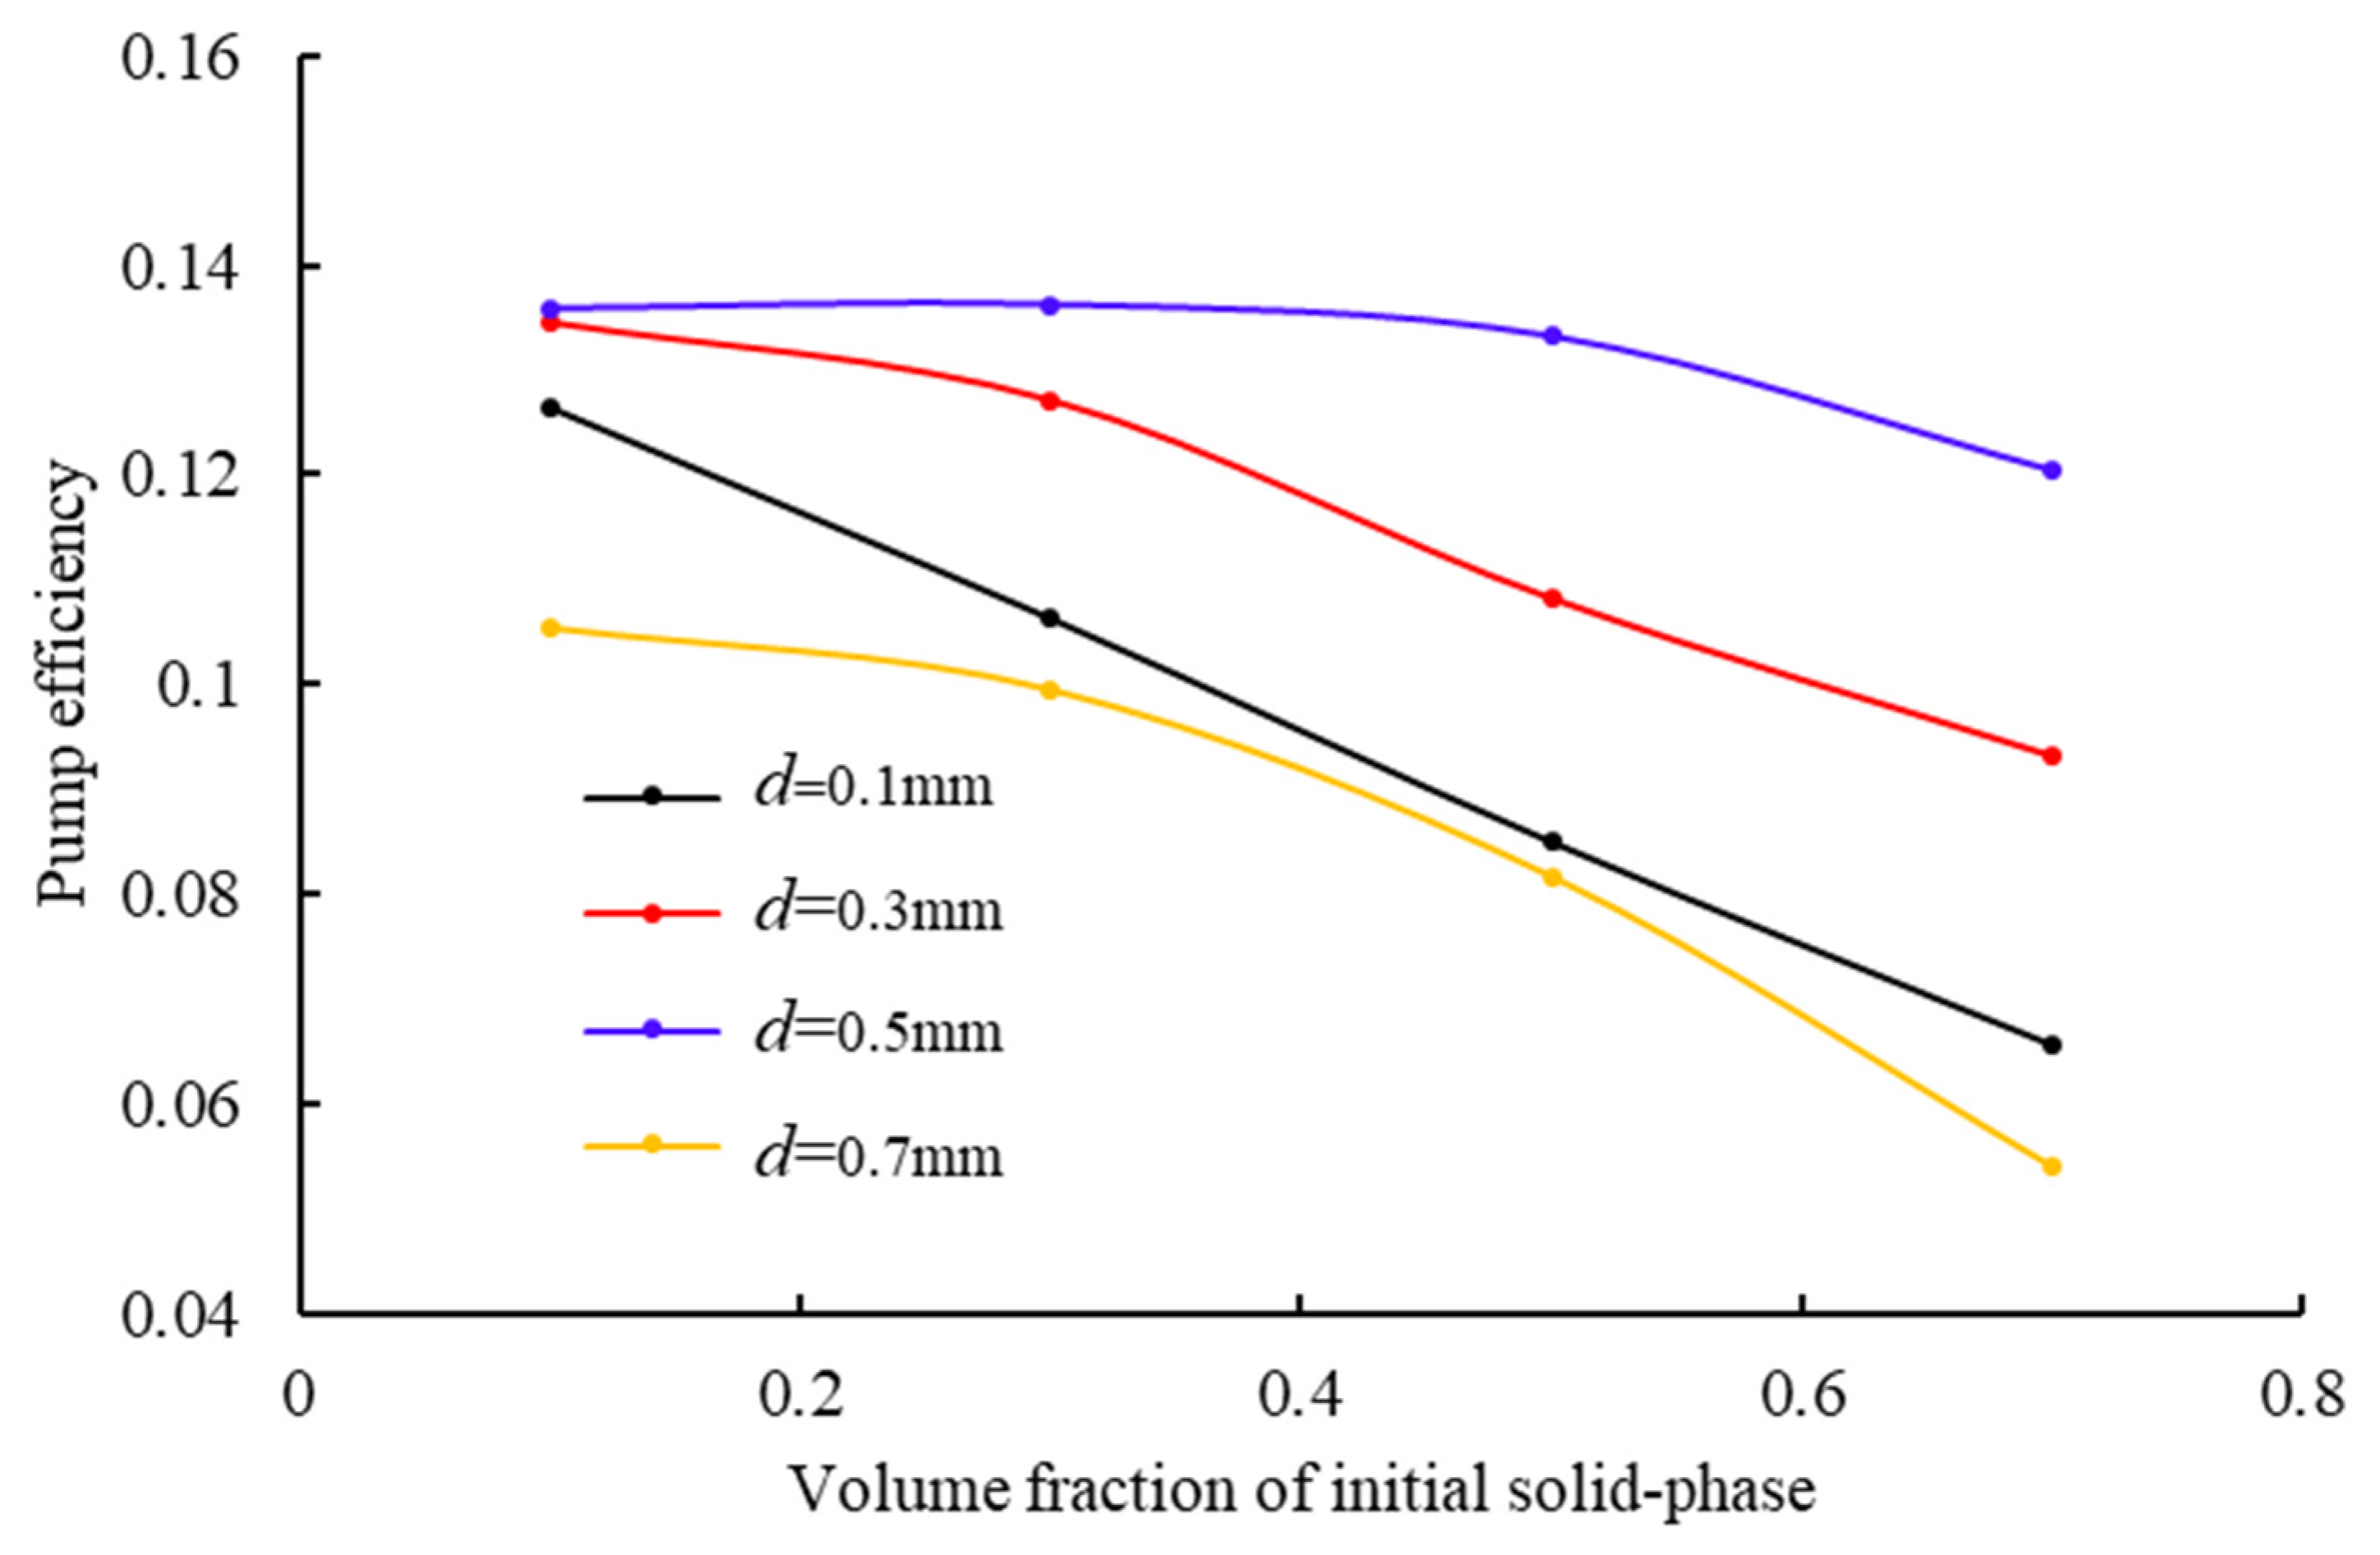
The curves (Figure 29 and Figure 30) validate the direct impact of the aforementioned flow field phenomena on performance. Figure 29 shows that the pump efficiency E decreases monotonically with an increasing initial solid volume fraction, which indicates that a high solid-phase concentration leads to a reduction of the energy conversion efficiency, consistent with the intensified kinetic energy dissipation revealed by the velocity distribution. Figure 30 shows that the solid transport rate ms increases significantly with the increasing initial solid volume fraction φS, directly corresponding to the increased volume fraction observed in the solid-phase distribution. In summary, the increasing the initial solid volume fraction can improve the solid-phase transport capacity, which significantly reduces the pump efficiency, primarily due to intensified kinetic energy dissipation and reduced energy conversion efficiency.
Figure 29 and Figure 30 reveal the effects of the core pattern on the influence of the solid particle diameter. When the solid particle diameter (d) is in the range of 0.1 to 0.5 mm, the pump efficiency slightly improves or remains relatively stable as the particle diameter increases, while the solid transport rate ms steadily rises with an increasing initial solid volume fraction, which shows a similar pattern in this particle size range. However, when the particle diameter exceeds 0.5 mm and increases to 0.7 mm, the performance significantly declines: Figure 29 shows that the pump efficiency decreases sharply, and Figure 30 shows that the solid transport rate ms also decreases significantly. This aligns with the decrease in the central axis volume fraction and potentially worsened distribution observed in the solid-phase distribution diagrams for a solid particle diameter of 0.7 mm. The intensified flow field non-uniformity and increased kinetic energy loss observed in the flow field diagrams are likely the main reasons for sudden performance degradation at this critical solid particle diameter (d > 0.5 mm).
In summary, the flow field simulation clearly revealed the significant impact of solid-phase parameters (φS, d) on the internal pressure field, velocity field, and solid-phase concentration field of the jet pump. Increasing the initial solid volume fraction can directly improve the solid-phase transport capacity but significantly reduces the pump efficiency, mainly due to intensified kinetic energy dissipation. The influence of particle diameter is critical: the performance is relatively stable when the particle diameter is d ≤ 0.5 mm; when the particle diameter is d > 0.5 mm, the intensified flow field turbulence causes both the pump efficiency and the solid transport rate to decrease sharply. Therefore, in engineering applications, solid-phase parameters must be strictly controlled: the initial solid volume fraction φ should not be too high (recommended value of less than 0.3 to balance the pump efficiency), and the solid particle diameter d must be limited below the critical value (recommend particle diameter of d ≤ 0.5 mm) to avoid cliff-like degradation of the solid-phase suction capacity.

5. Experimental Analysis

Tests were conducted at the China University of Petroleum (East China) in Q3 2024.

5.1. Experimental Apparatus

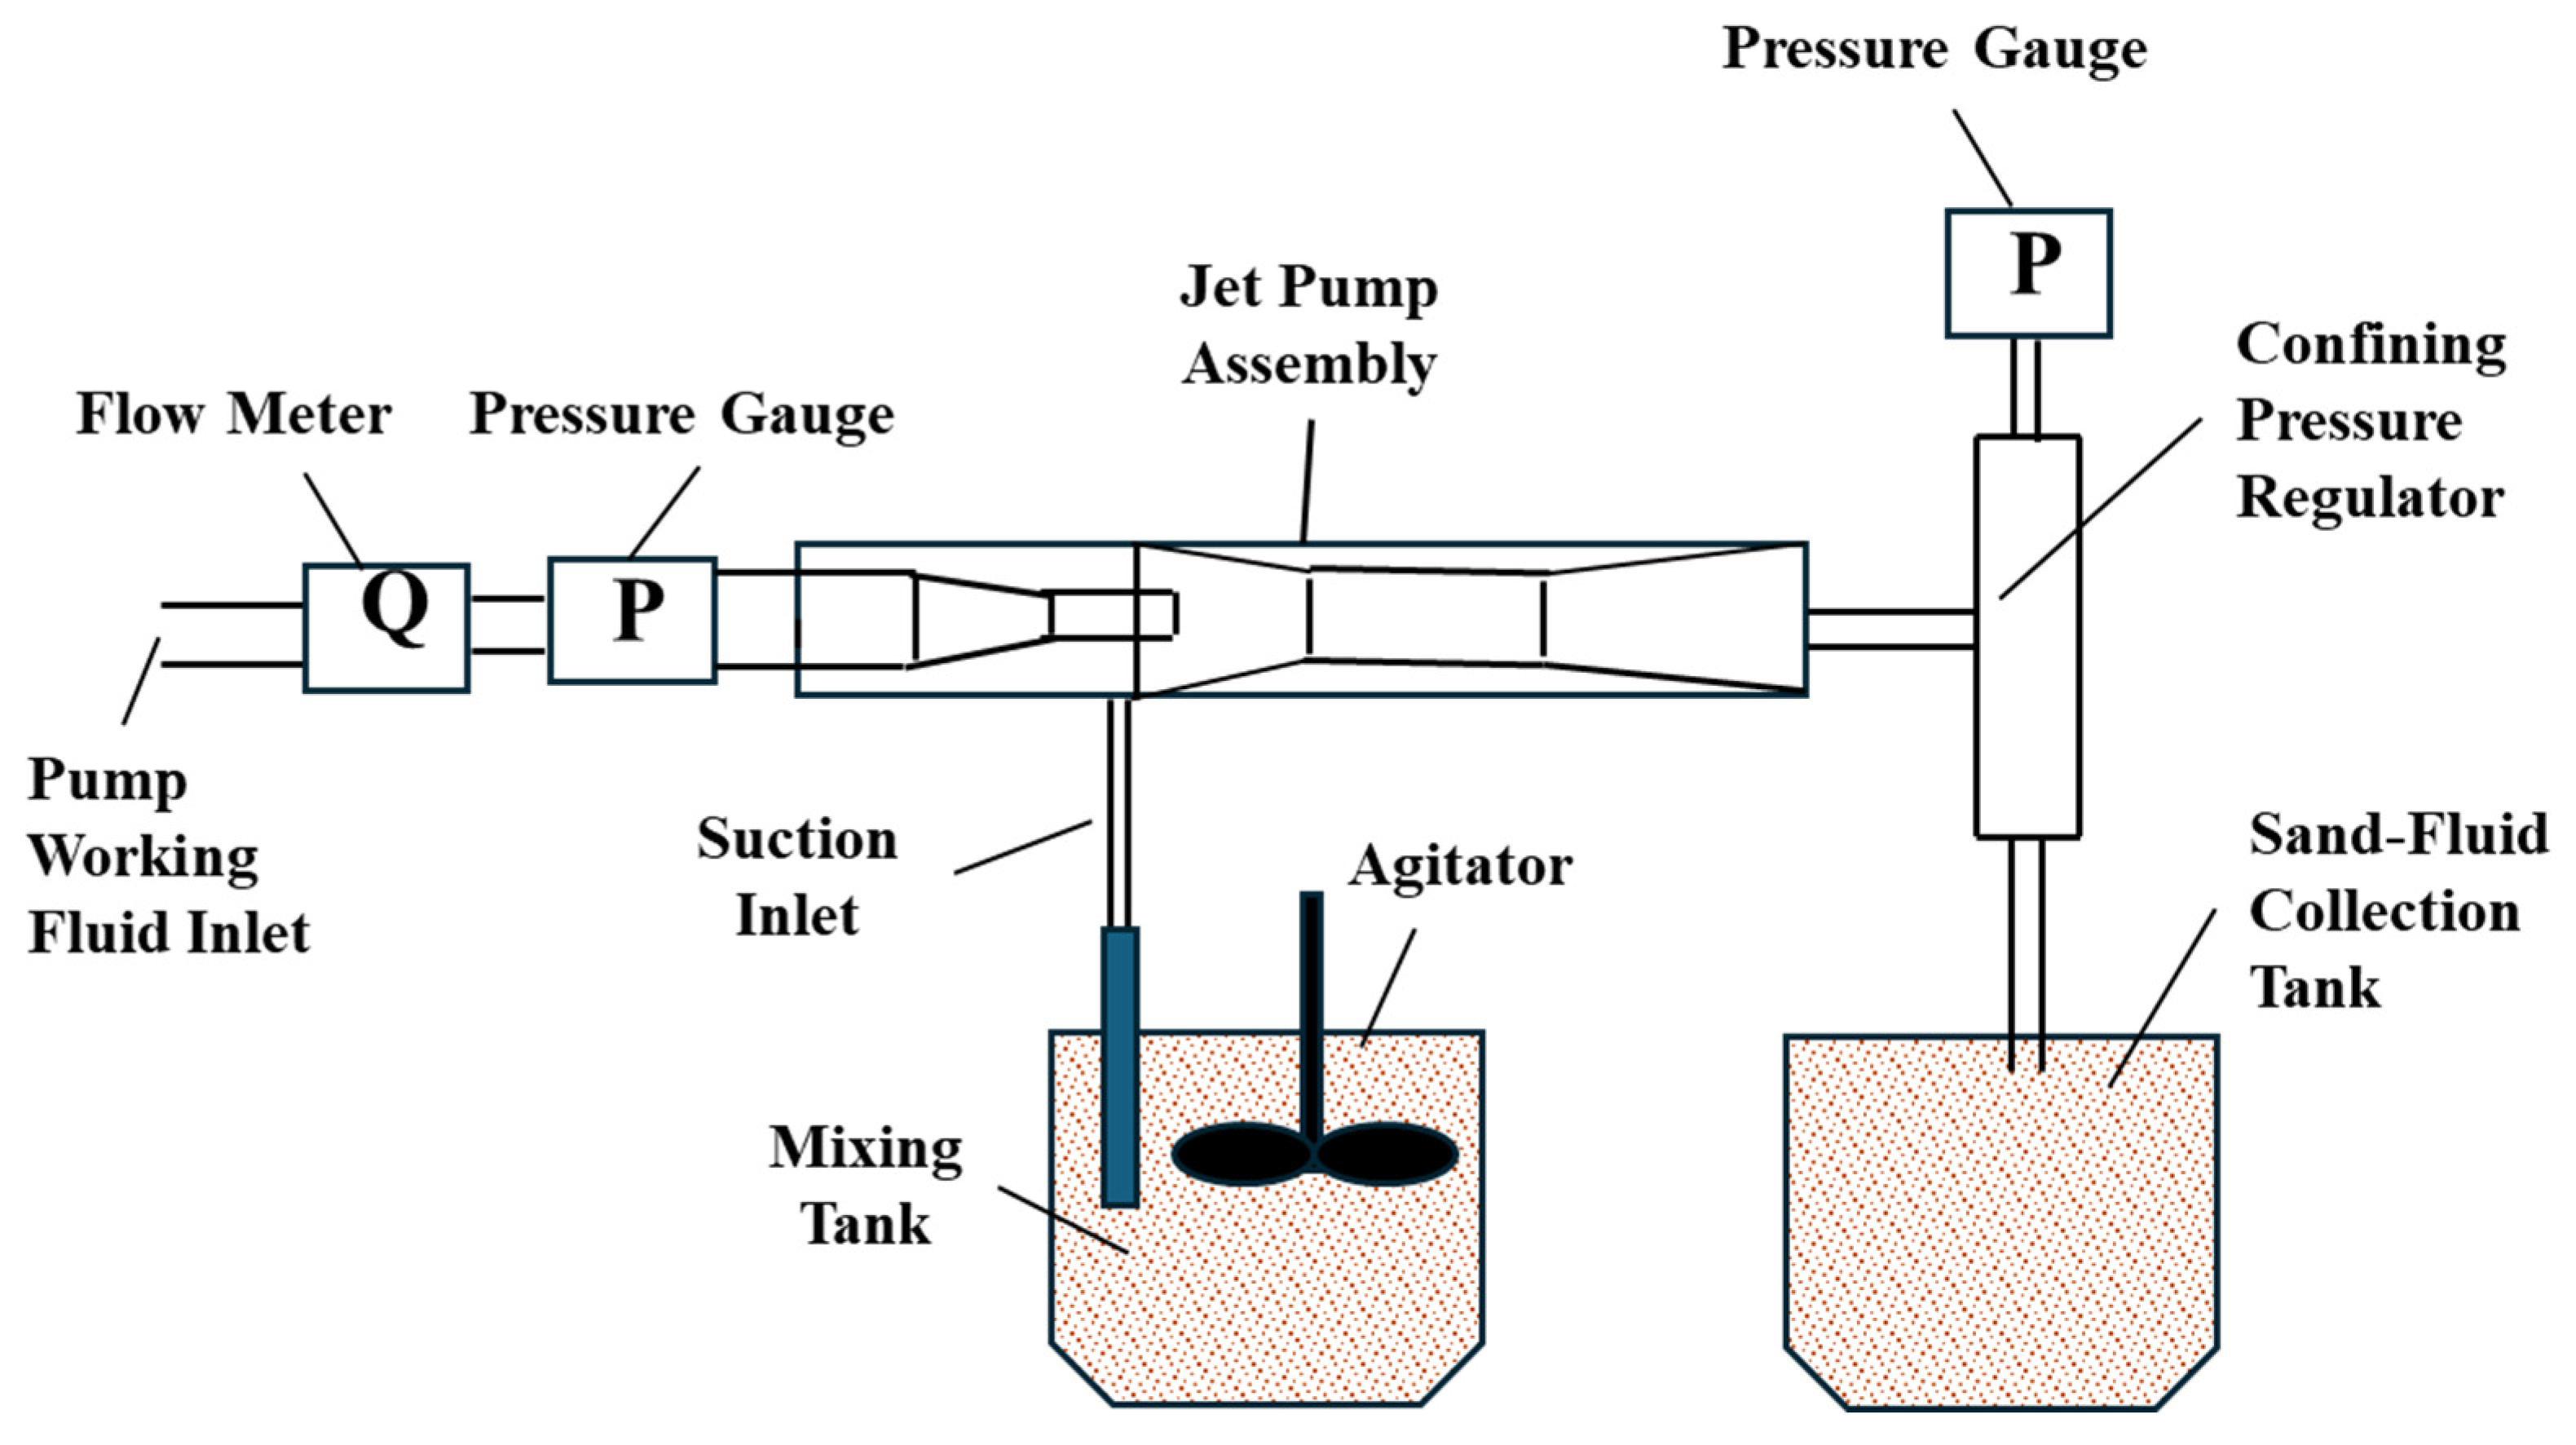
The experimental setup for validating the solid-phase suction performance of the jet pump (Figure 31) comprised five integrated systems:
  • Power system: High-pressure pump array (0–25 MPa operating range);
  • Flow loop: Precision-controlled concentric tubing circuit;
  • Test section: Instrumented jet pump assembly with replaceable components;
  • Data acquisition: Real-time monitoring system with ±0.25% FS accuracy;
  • Sand-fluid collection tank: Functionally critical component for solid-phase capture and volumetric quantification.

5.2. Experimental Method

Step 1: System commissioning.
  • Install a jet pump with a 2.6 mm nozzle, 6 mm throat diameter, and 9 mm nozzle-throat distance.
  • Verify the liquid levels in the suction line buffer tank (>80% capacity).
Step 2: Sand mixture preparation.
  • Mix quartz sand and water at a 2:8 volume in the mixing tank. The density of the mixed sand–fluid slurry (ρmix) can be determined as follows:
ρ mix = ρ s + 4 ρ w a t e r 5
  • Maintain the solid concentration at φ = 0.1 using a helical propeller mixer (300 rpm), and distribute the mixture uniformly through a wellbore simulator.
Step 3: Test execution.
  • Start the pump and gradually ramp up to the target flow rate.
  • Adjust the discharge pressure to P2 = 1 MPa by confining the pressure regulator.
  • Sequentially increase the working pressure from 3 to 11 MPa.
  • Record the parameters at a steady state: working flow rate (q1); working pressure (P1).
Step 4: Solid collection.
  • After stabilization, initiate a 30 s timed collection.
  • Capture discharged solids in the sand–fluid collection tank. Measure the dry sand mass (msand) and suction sand–fluid mixture volume (Vsuction).
  • Calculate the performance parameters:
m s = ρ s m s a n d t c o l l e c t i o n
E = ρ m i x V s u c t i o n ρ w a t e r q 1 t c o l l e c t i o n
where the collection time tcollection = 30 s per test point.
Step 5: Repeat triplicate measurements per pressure setpoint.

5.3. Experimental Data Comparison

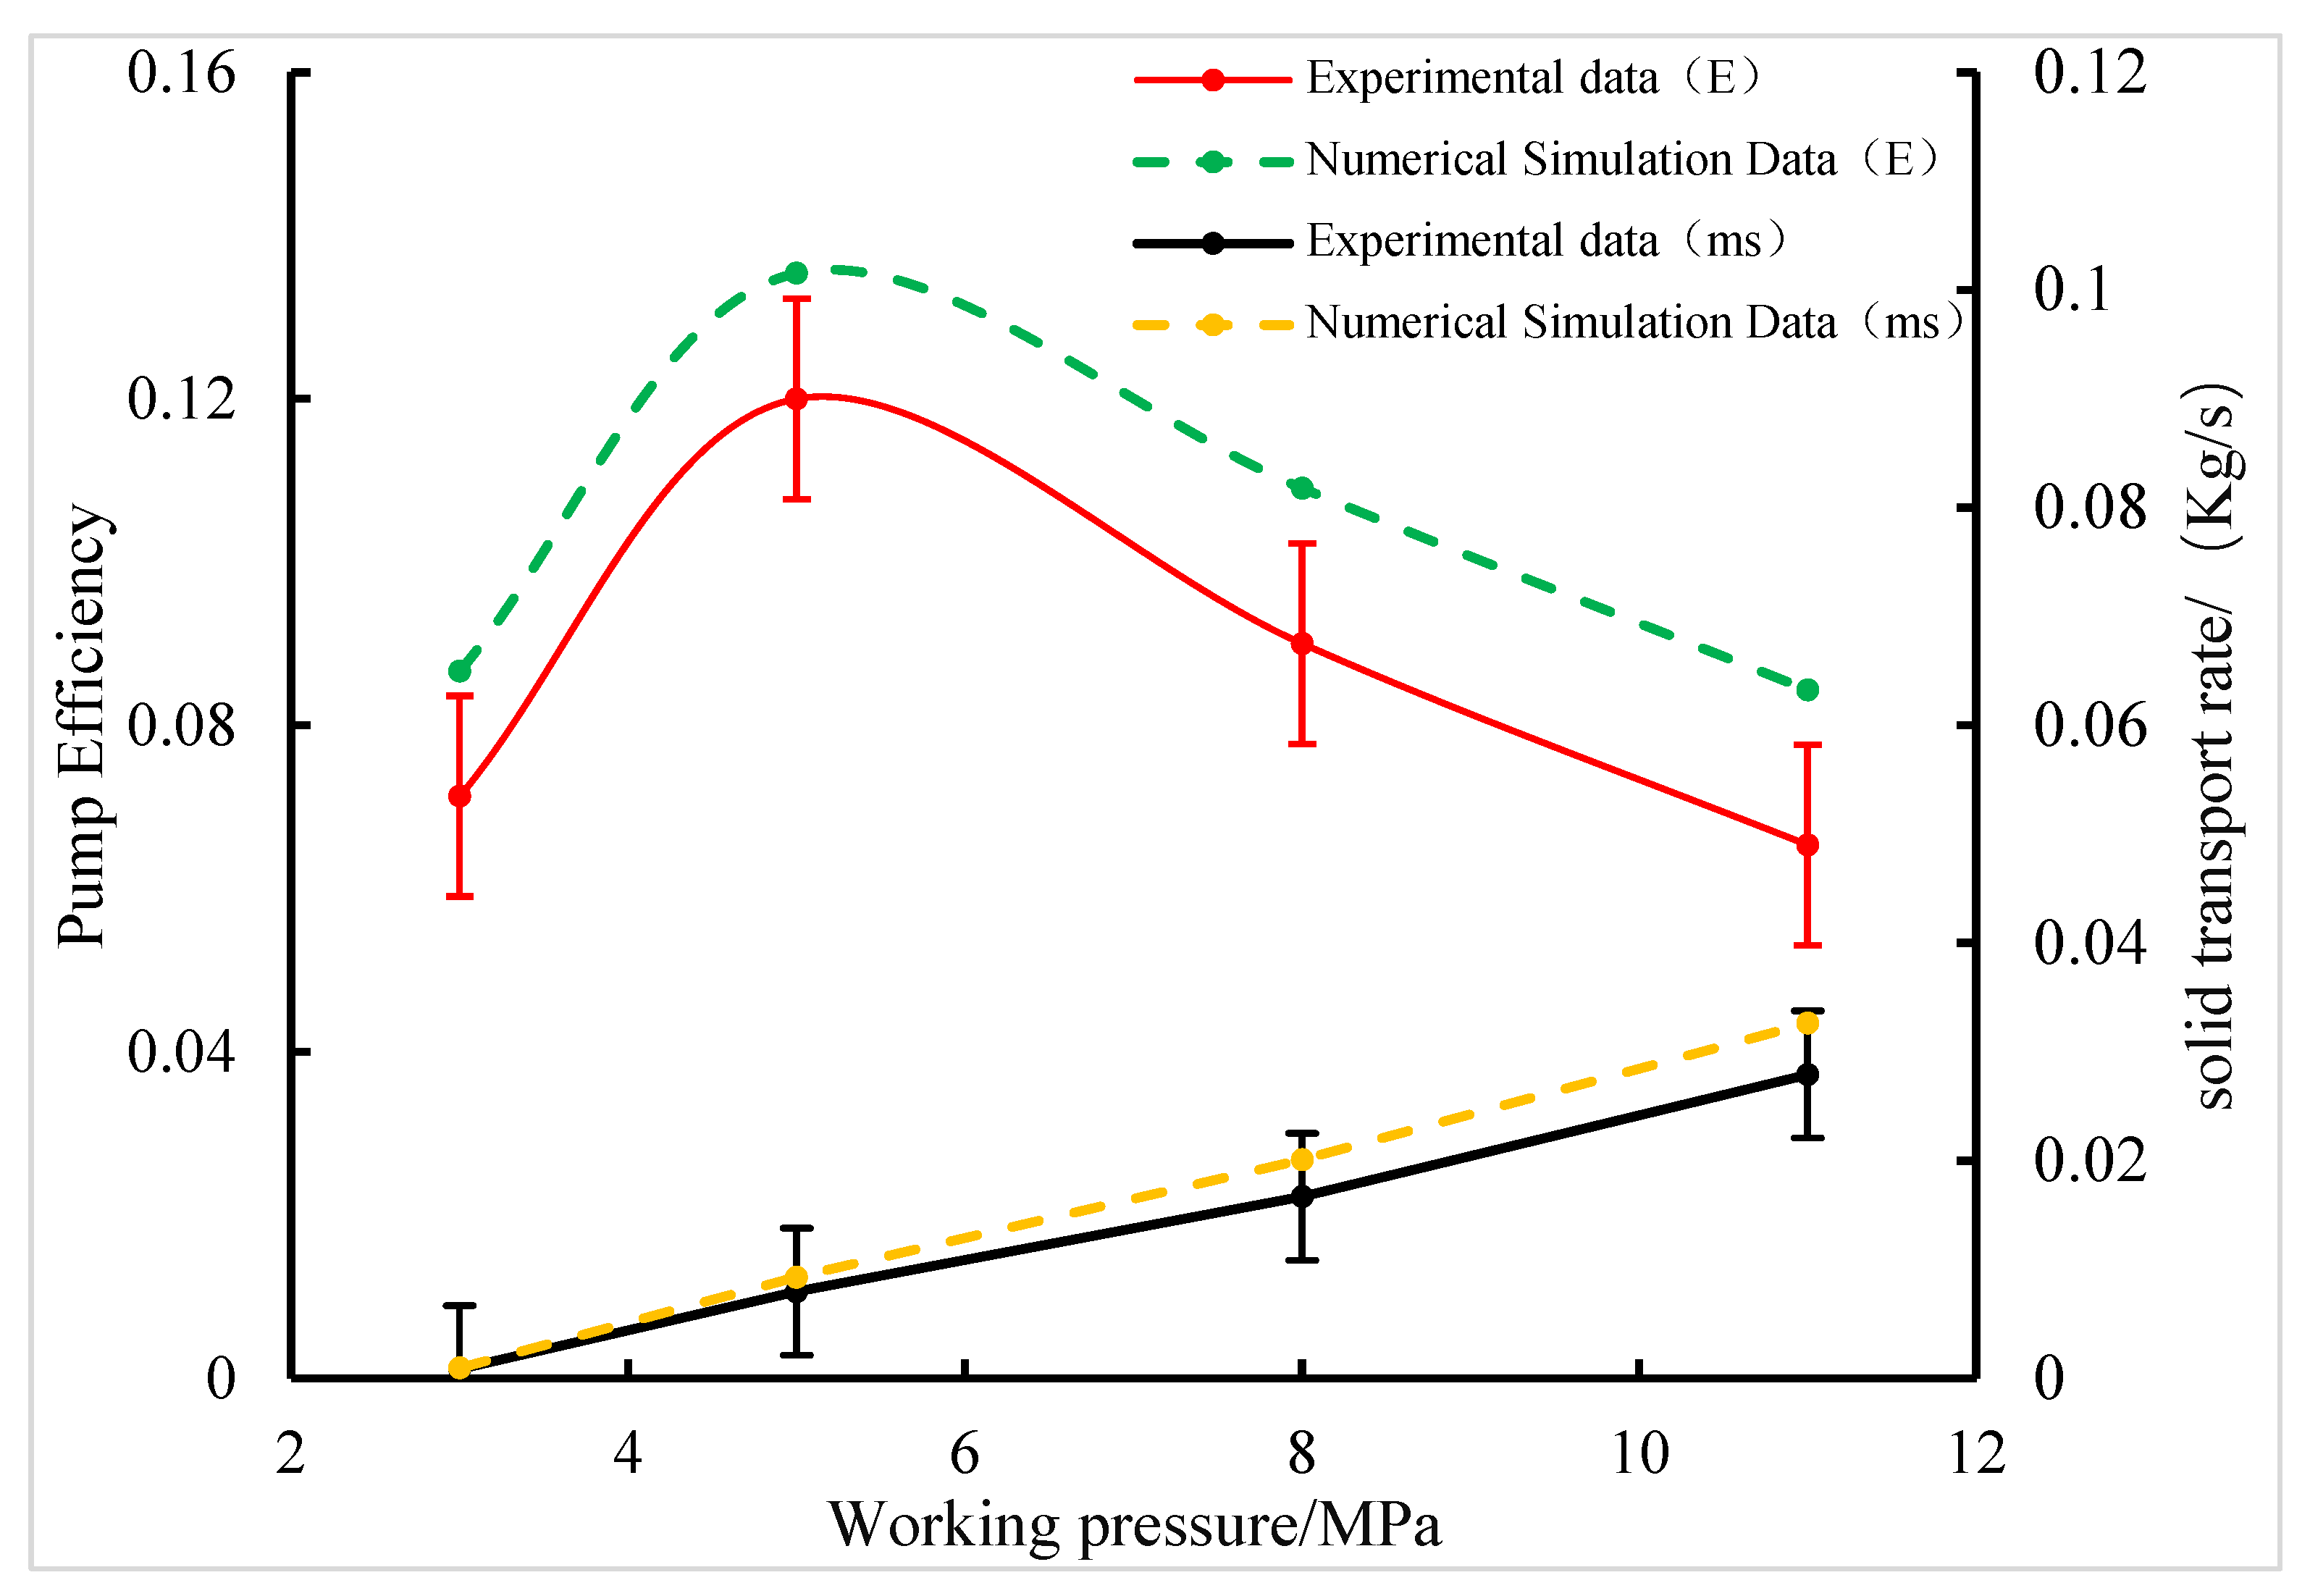
The experimental measurements demonstrate strong agreement with the numerical simulations across all tested working pressures (3–11 MPa). As depicted in Figure 32, both datasets exhibited unimodal distributions for pump efficiency, peaking at 5 MPa (experimental: 11.9% ± 0.9% vs. simulated: 13.5%). The monotonic increase in the solid transport rate with increasing pressure (Figure 32) further confirms model reliability, with the experimental values systematically 8–12% lower than the simulations due to unmodeled particle collision losses and measurement refinements. Crucially, maximum relative deviation remains below 15%, meeting the validation threshold established in Section 3.3.

6. Conclusions

The mechanistic foundations and operational criteria for jet pump optimization in vacuum sand cleanout was established in this paper through rigorous numerical–experimental validation. The following four principal findings emerge:
(1)
Working pressure optimization reveals a critical trade-off: increasing the working pressure to 8 MPa enhances the solid transport rate by 116% compared to the operation condition of 5 MPa, while the turbulent dissipation beyond 5 MPa reduces the pump efficiency by 19.5%. Operational balance is achieved within a range of 5–8 MPa, with 5 MPa maximizing the energy efficiency (peak efficiency 13.5%) and 8 MPa prioritizing the sand clearance capacity, which is particularly essential for deep-well applications.
(2)
The discharge pressure thresholds dictate transport viability: While the pressure in the inlet exceeds 2.5 MPa, the throat pressure difference may decrease by over 90% and the transmission rate of the solid phase decreased by 50%. Engineering protocols mandate discharge pressure at or below 2.5 MPa, with the proportional increase in working pressure compensating for energy loss in unavoidable high-discharge scenarios.
(3)
Solid-phase constraints demonstrate particle-size-dominated failure: diameters beyond 0.5 mm induce a 68.3% efficiency reduction and 42% transport rate decline through inertial collision dominance, while the volume fraction beyond 0.3 reduces efficiency by 35% despite marginal transport gains near 11% due to viscous energy losses. Stringent limits require a maximum particle diameter of 0.5 mm and a maximum solid volume fraction of 0.3 to prevent performance degradation.
(4)
The dual-metric framework validates operational superiority, increasing sand-clearance efficiency under optimized parameters: working pressure of 5–8 MPa, a maximum discharge pressure of 2.5 MPa, a maximum particle diameter of 0.5 mm, and a maximum solid volume fraction of 0.3.

Author Contributions

Conceptualization, X.J., L.Z., Y.Z. and J.L.; Methodology, X.J., H.L., L.Z., Y.Z. and J.L.; Software, X.J., H.L., L.Z., Y.Z. and J.L.; Validation, X.J. and H.L.; Formal analysis, X.J.; Investigation, X.J. All authors have read and agreed to the published version of the manuscript.

Funding

This research received no external funding.

Data Availability Statement

The original contributions presented in this study are included in the article. Further inquiries can be directed to the corresponding author.

Conflicts of Interest

Author Lei Zhang was employed by PetroChina Zhejiang Oilfield Branch Company. Authors Yan Zhang and Jiawei Liu were employed by Jianghan Machinery Research Institute Limited Company of CNPC. The remaining authors declare that the research was conducted in the absence of any commercial or financial relationships that could be construed as a potential conflict of interest.

References

  1. Pineda, R.; Lindsey, B.J.; Taggart, M. A Chronological Review of Concentric Coiled Tubing Vacuum Technology: Past, Present and Future; Technical Report; SPE: Houston, TX, USA, 2010. [Google Scholar]
  2. Davies, A.; Dunning, M.; Kuchel, M.; Roberts, T.; Taggart, M. Pushing the Boundaries of Concentric-Coiled-Tubing Technology to Resurrect Subhydrostatic Gas Wells on an Unmanned Offshore Installation. SPE Prod. Oper. 2012, 27, 67–77. [Google Scholar] [CrossRef]
  3. Li, J.; Bayfield, I.; Paton, G. Effective Heavy Oil Post-Fracturing Proppant Cleanout with Coiled Tubing: Experimental Study and Field Case History. In Proceedings of the 2006 SPE Annual Technical Conference and Exhibition, Dallas, TX, USA, 9–12 October 2006. Paper SPE 101235. [Google Scholar]
  4. Rafferty, P.; Ennis, J.; Skufca, J.; Craig, S. Enhanced Solids Removal Techniques from Ultra Low Pressure Wells Using Concentric Coiled Tubing Vacuum Technology. In Proceedings of the SPE Annual Technical Conference and Exhibition, Anaheim, CA, USA, 11–14 November 2007; SPE: Richardson, TX, USA, 2007. Paper SPE-107010. [Google Scholar]
  5. Dong, P.; Lang, Z.; Xu, X. The Fully Coupled Fluid-Solid Analysis for the Reservoir Rock Deformations Due to Oil Withdrawal. J. Geomech. 2000, 6, 5. [Google Scholar]
  6. Wu, J.; Yu, D.; Wu, G.; Liu, J. Current Situation and Prospect of Jet Pumps. J. Drain. Irrig. Mach. Eng. 2007, 25, 65–68. [Google Scholar]
  7. Liu, B.; Du, J.; Qi, Y.; Zhang, F.; Yu, Y.; Zhao, H. A New Coal Particles Cleanout Technology in Coalbed Methane Wells in China. J. Pet. Sci. Eng. 2015, 127, 445–451. [Google Scholar] [CrossRef]
  8. Sun, W.; Li, M.; Zhu, F.B. Exploration of the Mechanism and Prediction of Jet Pump Feature Structure Optimization for the Enhanced Pumping Performance. Proc. Inst. Mech. Eng. Part A J. Power Energy 2023, 237, 1775–1789. [Google Scholar] [CrossRef]
  9. Deng, H.; Liu, X.; Ma, W. Flow Field Analysis at the Diffuser Outlet of Jet Sand Discharge Pump for Oil Wells. J. Jilin Univ. (Earth Sci. Ed.) 2010, 40, 689–693. [Google Scholar]
  10. Xiao, L.; Long, X.; Li, X.; Zeng, Q.; Yang, X. Numerical Investigation on the Recirculation in Annular Jet Pumps. J. Mech. Sci. Technol. 2013, 27, 1603–1609. [Google Scholar] [CrossRef]
  11. Meakhail, T.; Teaima, I. Experimental and Numerical Studies of the Effect of Area Ratio and Driving Pressure on the Performance of Water and Slurry Jet Pumps. Proc. Inst. Mech. Eng. Part C J. Mech. Eng. Sci. 2012, 226, 2250–2266. [Google Scholar] [CrossRef]
  12. Zhou, L.; Yuan, L. 3D Large Eddy Simulation of Liquid-Solid Two-Phase Flow Characteristics in Jet Pumps. J. Drain. Irrig. Mach. Eng. 2012, 30, 522–526. [Google Scholar]
  13. Itoh, K.; Nishigaki, S.; Honda, I.; Yoshida, T.; Boda, A.; Kumamaru, H.; Shimogonya, Y. Performance of Solid-Liquid Two Phase Jet Pump Vacuuming Up Beach Sand. In Proceedings of the ASME 2010 International Mechanical Engineering Congress and Exposition, Vancouver, BC, Canada, 12–18 November 2010; ASME: New York, NY, USA, 2010; pp. 503–509. [Google Scholar]
  14. Liu, B.; Sun, W.; Wu, J.; Wang, H.; Xu, L.; Qi, Y.; Zhang, F. Influence of Initial Solid Concentration on the Performance of Jet Pump for Fracturing Flowback Fluid. J. China Coal Soc. 2018, 43 (Suppl. S2), 634–640. [Google Scholar]
  15. Shen, J. Flow Field Characteristic Analysis of Double-Tube Sand-Carrying Jet Pump. Master’s Thesis, Yangtze University, Jingzhou, China, 2021. [Google Scholar]
  16. Fan, L.; Mao, Z.; Yang, C. Numerical Simulation of Laminar Solid-Liquid Two-Phase Flow in Stirred Tanks. Chem. Eng. Commun. 2007, 194, 291–308. [Google Scholar] [CrossRef]
  17. Ge, Y.; Ge, Q.; Yu, J. Numerical Simulation and Confirming of Optimal Range on the Nozzle-to-Throat Clearance of Liquid-Gas Jet Pump. Fluid Mach. 2012, 40, 21–24. [Google Scholar]
  18. Jia, X.; Liao, H.; Hu, Q.; He, Y.; Wang, Y.; Niu, W. Optimization Method of Jet Pump Process Parameters and Experimental Study on Optimal Parameter Combinations. Processes 2023, 11, 2841. [Google Scholar] [CrossRef]
  19. Wang, C.; Li, J.; Shen, X. Numerical Simulation and Experiment on the Turbulent Flow in the Jet Pump. J. Chem. Eng. Chin. Univ. 2006, 20, 175–179. [Google Scholar]
  20. Wibisono, K.; Sitaresmi, R. Evaluation of Hydraulic Jet Pump Application in Sembakung Field. J. Earth Energy Sci. Eng. Technol. 2020, 3, 75–83. [Google Scholar] [CrossRef]
  21. Falk, K.; Fraser, B. Concentric Coiled Tubing Application for Sand Cleanouts in Horizontal Wells. J. Can. Pet. Technol. 1998, 37, 46–50. [Google Scholar] [CrossRef] [PubMed]
  22. Li, J.; Luft, H.B.; Wilde, G.; Alingig, G.; Jumawid, F. Cleanouts with Coiled Tubing in Low Bottom Hole Pressure Wellbores. In Proceedings of the 2008 SPE/ICoTA Coiled Tubing and Well Intervention Conference and Exhibition, The Woodlands, TX, USA, 1–2 April 2008. Paper SPE 113841. [Google Scholar]
  23. Mann, J.A.; Young, R.J. A Theoretical and Experimental Study of Ejector Performance with Two-Phase Flow. J. Fluids Eng. 1972, 94, 301–310. [Google Scholar]
  24. ANSYS, Inc. ANSYS Fluent Theory Guide, Release 2021R1, Section 16.3: Multiphase Mixture Model; ANSYS, Inc.: Canonsburg, PA, USA, 2021. [Google Scholar]
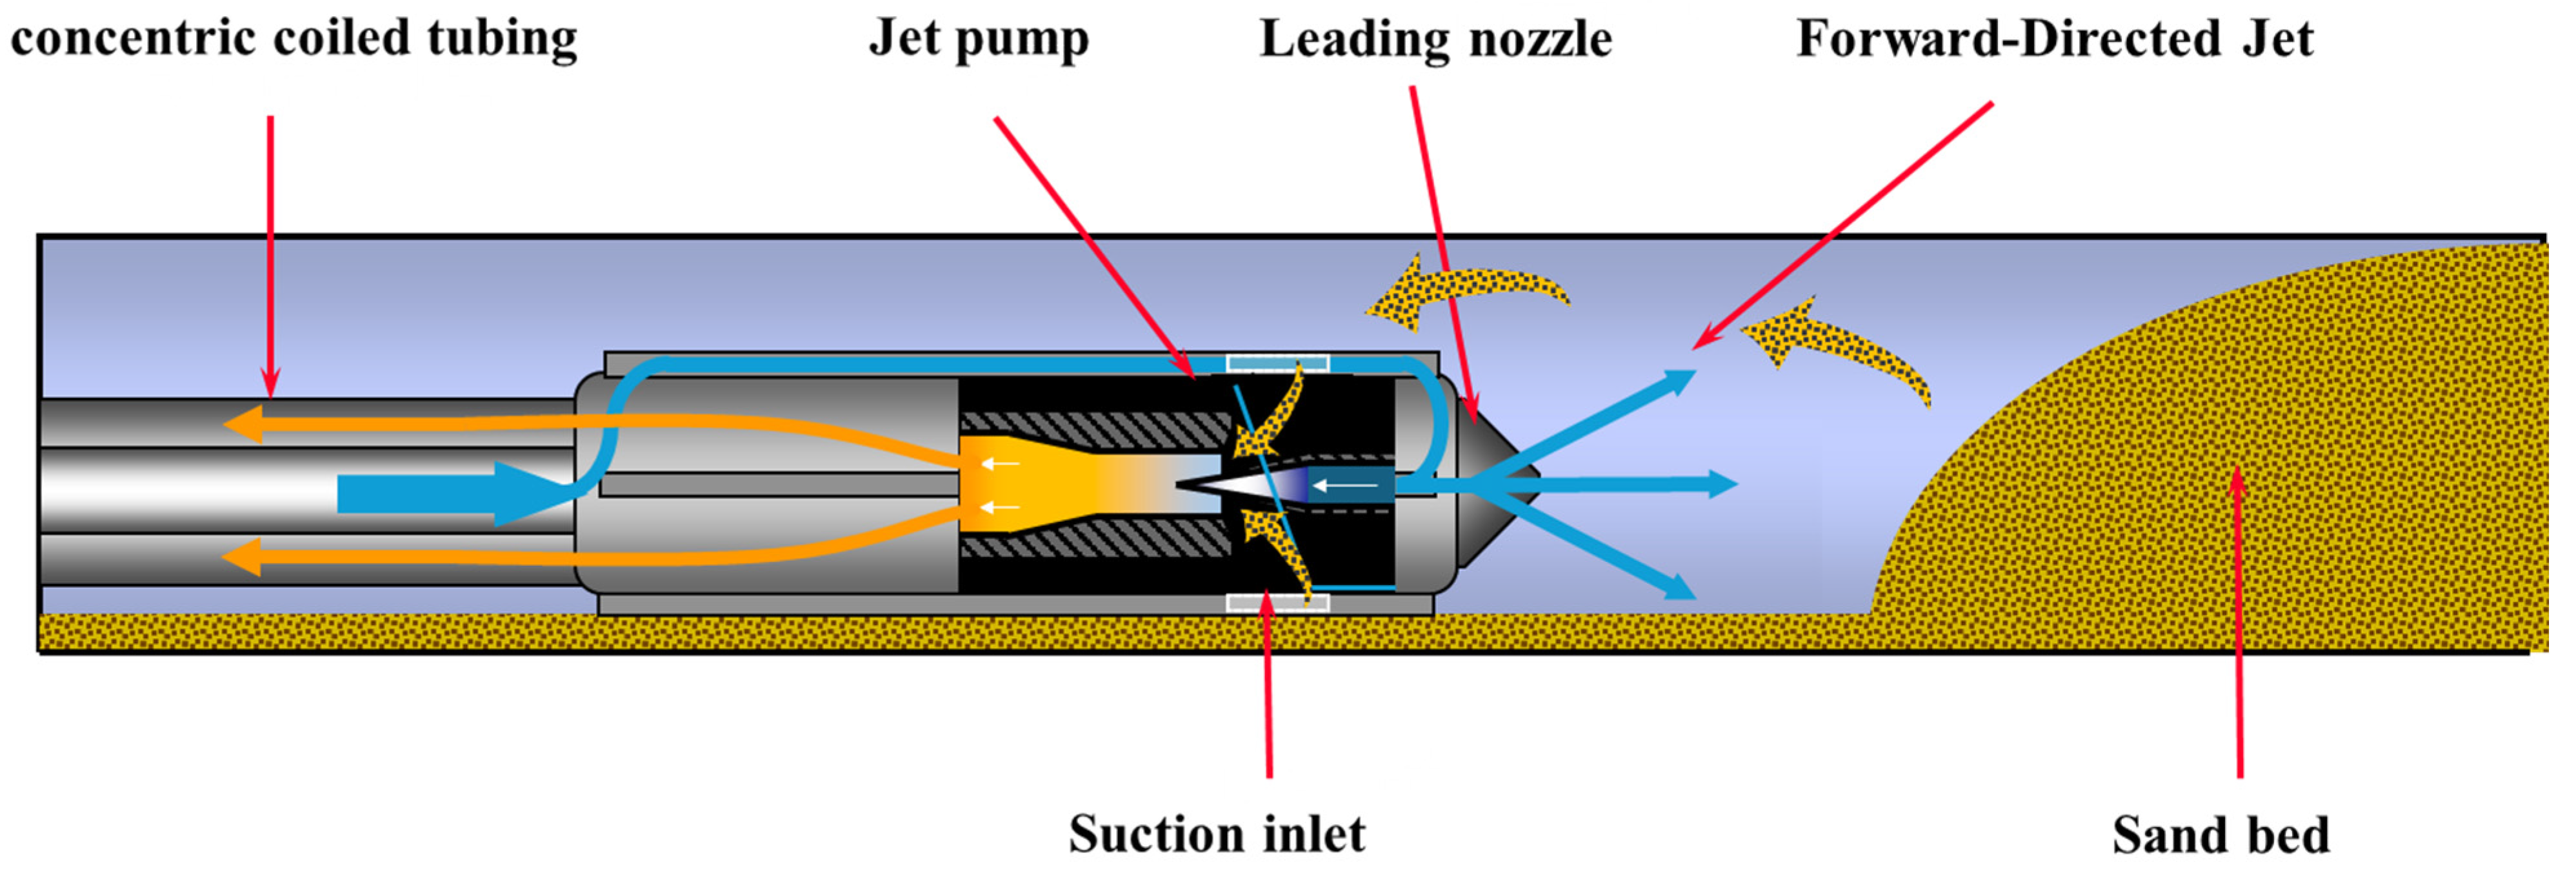
Figure 1. Schematic diagram of vacuum sand cleanout tool assembly.
Processes 13 02639 g001
Figure 2. Schematic configuration of jet pump components.
Processes 13 02639 g002
Figure 3. Physical simulation model of the jet pump of the vacuum sand cleanout tool.
Processes 13 02639 g003
Figure 4. Grid model of the jet pump of the vacuum sand flushing tool.
Processes 13 02639 g004
Figure 5. Contours of the pressure distribution under different working pressures. (a) P1 = 3 MPa; (b) P1 = 5 MPa; (c) P1 = 8 MPa; (d) P1 = 11 MPa.
Processes 13 02639 g005
Figure 6. Contours of liquid-phase velocity distribution under different working pressure. (a) P1 = 3 MPa; (b) P1 = 5 MPa; (c) P1 = 8 MPa; (d) P1 = 11 MPa.
Processes 13 02639 g006
Figure 7. Axial velocity of the liquid-phase under different working pressures.
Processes 13 02639 g007
Figure 8. Contours of the solid-phase volume fraction under different working pressures. (a) P1 = 3 MPa; (b) P1 = 5 MPa; (c) P1 = 8 MPa; (d) P1 = 11 MPa.
Processes 13 02639 g008
Figure 9. Axial volume fraction of the solid phase under different working pressures.
Processes 13 02639 g009
Figure 10. Curves of the working pressure and pump efficiency corresponding to various volume fractions of the initial solid phase.
Processes 13 02639 g010
Figure 11. Curves of the working pressure and suction capacity corresponding to various volume fractions of the initial solid phase.
Processes 13 02639 g011
Figure 12. Contours of pressure distribution under different discharge pressures. (a) P2 = 1 MPa; (b) P2 = 2 MPa; (c) P2 = 3 MPa; (d) P2 = 4 MPa.
Processes 13 02639 g012
Figure 13. Contours of liquid-phase velocity distribution under different discharge pressures. (a) P2 = 1 MPa; (b) P2 = 2 MPa; (c) P2 = 3 MPa; (d) P2 = 4 MPa.
Processes 13 02639 g013
Figure 14. Axial liquid-phase velocity profiles under varying discharge pressures.
Processes 13 02639 g014
Figure 15. Contours of solid-phase distribution under different discharge pressures. (a) P2 = 1 MPa; (b) P2 = 2 MPa; (c) P2 = 3 MPa; (d) P2 = 4 MPa.
Processes 13 02639 g015
Figure 16. Curves of axial solid-phase volume fractions under different discharge pressures.
Processes 13 02639 g016
Figure 17. Curves of the lift pressure and the pump efficiency under different volume fractions of the initial solid phase.
Processes 13 02639 g017
Figure 18. Curves of the lift pressure and the suction capacity of solid phase under different volume fractions of the initial solid phase.
Processes 13 02639 g018
Figure 19. Contours of pressure distribution under different initial solid volume fractions. (a) φS = 0.1; (b) φS = 0.3; (c) φS = 0.5; (d) φS = 0.7.
Processes 13 02639 g019
Figure 20. Contours of liquid-phase velocity distribution under different initial solid volume fractions. (a) φS = 0.1; (b) φS = 0.3; (c) φS = 0.5; (d) φS = 0.7.
Processes 13 02639 g020
Figure 21. Curves of axial liquid-phase velocity under different initial solid volume fractions.
Processes 13 02639 g021
Figure 22. Contours of solid-phase distribution under different initial solid volume fractions. (a) φS = 0.1; (b) φS = 0.3; (c) φS = 0.5; (d) φS = 0.7.
Processes 13 02639 g022
Figure 23. Curves of axial solid-phase volume fraction under different initial solid volume fractions.
Processes 13 02639 g023
Figure 24. Contours of pressure distribution with different particle diameters. (a) d = 0.1 mm; (b) d = 0.3 mm; (c) d = 0.5 mm; (d) d = 0.7 mm.
Processes 13 02639 g024
Figure 25. Contours of liquid-phase velocity distribution with different particle diameters. (a) d = 0.1 mm; (b) d = 0.3 mm; (c) d = 0.5 mm; (d) d = 0.7 mm.
Processes 13 02639 g025
Figure 26. Curves of axial liquid-phase velocity with different particle diameters.
Processes 13 02639 g026
Figure 27. Contours of solid-phase distribution with different particle diameters. (a) d = 0.1 mm; (b) d = 0.3 mm; (c) d = 0.5 mm; (d) d = 0.7 mm.
Processes 13 02639 g027
Figure 28. Curves of axial solid-phase volume fraction with different particle diameters.
Processes 13 02639 g028
Figure 29. Curves of the volume fraction of the initial solid-phase and pump efficiency with different solid particle diameters.
Processes 13 02639 g029
Figure 30. Curves of the volume fraction of the initial solid-phase and the suction capacity with different solid particle diameters.
Processes 13 02639 g030
Figure 31. Schematic of experimental setup for solid-phase suction of the jet pump.
Processes 13 02639 g031
Figure 32. Experimental data vs. numerical simulation data.
Processes 13 02639 g032
Table 1. Boundary conditions.
Boundary NameTypePhase AssociationValue
Water inletPressure inletLiquid phaseP1 = 3–11 MPa
Wellbore annulus inletPressure inletSolid–liquid mixtureφs = 0.1–0.4; d = 0.1–0.7 mm
Mixed fluid outletPressure outletSolid–liquid mixtureP2 = 1–4 MPa
Wellbore annulus outletPressure outletSolid–liquid mixtureP3 = 0.1 MPa
WallNo-slip wall (turbulent flow)/Standard wall function (turbulent flow)
Disclaimer/Publisher’s Note: The statements, opinions and data contained in all publications are solely those of the individual author(s) and contributor(s) and not of MDPI and/or the editor(s). MDPI and/or the editor(s) disclaim responsibility for any injury to people or property resulting from any ideas, methods, instructions or products referred to in the content.