Abstract
Honey is recognized as a nutritionally rich and functional option, often used as a natural sweetener due to its content of glucose, fructose, vitamins, minerals, enzymes and antioxidants. Its antioxidant, antibacterial and anti-inflammatory properties are well known. Recently, interest has grown in functional honey enriched with bioactive plant components, such as extracts of rosemary, lavender, oregano, and sage, which can enhance phenolic content and antioxidant capacity. However, such enrichment may alter honey’s sensory characteristics and introduce contaminants, including heavy metals, necessitating comprehensive quality assessment. This study aimed to evaluate the chemical and functional quality of honey enriched with aromatic plant extracts from Kosovo, Albania, and North Macedonia, using an integrated approach. The research included the quantification of total phenolic compounds (TPCs), analysis of heavy metal content, and the application of near-infrared (NIR) spectroscopy with two devices (laboratory and portable). The results showed that geographical origin and herbal additions significantly affect TPC and heavy metal concentrations. Honey from Kosovo had the highest TPC, while Albanian honey showed higher concentrations of iron and nickel. Enrichment with oregano and rosemary significantly increased TPC and, levels of heavy metals such as lead and nickel. These findings underscore both the nutritional potential and safety considerations of enriched honey products. Accurate, non-destructive techniques like NIR spectroscopy offer valuable tools for quality control; however, further work is needed to evaluate sensory acceptance and long-term safety of enriched honey.
1. Introduction
Honey is considered a more nutritionally rich and functional option and is increasingly used as a natural sweetener instead of refined sugar, as it contains not only glucose and fructose, but also vitamins, minerals, enzymes, and antioxidants [1]. Honey is known for its (i) antioxidant properties (especially due to phenolic compounds and flavonoids), (ii) antibacterial and anti-inflammatory effects, and (iii) beneficial effects on the digestive and respiratory systems [2,3] and it helps with wound healing, cough relief, and immune support [4]. Its quality is traditionally determined based on its physicochemical properties, botanical and geographical origin, and the content of bioactive compounds [5,6]. In the last decade, there has been increasing interest in research and industry in so-called functional honeys—products enriched with bioactive plant components such as extracts of aromatic and medicinal plants [7,8,9]. The addition of aromatic plants, such as lavender (Lavandula spp.), rosemary (Rosmarinus officinalis), and oregano (Origanum vulgare), has been shown to increase the phenolic content and antioxidant capacity of honey [9]. However, enriching honey with aromatic plants may also introduce contaminants, including heavy metals, depending on the plant source and environmental conditions. Phenolic compounds, including flavonoids and phenolic acids, are key to the biological activity of honey and are associated with its anti-inflammatory and antimicrobial effects [10]. In addition to improving health value, plant additives can also affect the color, flavor, and aroma of honey, which requires precise product characterization [11].
To fully characterize such complex products, there is a need for modern, non-destructive analytical methods that can rapidly and reliably assess honey quality. Near-infrared (NIR) spectroscopy has proven highly effective in food quality control, offering rapid, precise, and real-time analysis without the need for sample preparation [12,13,14]. NIR spectroscopy is a non-destructive, non-invasive and fast analysis based on the interaction of NIR light (in the range 800–2500 nm) with the sample’s molecule bonds [13]. It measures the vibrations involving C–H, O–H, N–H and S–H bonds [14]. The application of chemometric models, such as principal component analysis (PCA) and partial least squares regression (PLSR), further increases the value of the NIR technique in the classification and quantification of honey composition [15].
Since consumer safety in honey consumption is crucial, it is also necessary to monitor the accumulation of heavy metals (e.g., Pb, Cd, As, Hg) in honey, which can arise from environmental pollution, and thus pose a health risk [16]. For this reason, numerous studies have analyzed the presence of heavy metals in honey as an indicator of environmental quality and product safety [17,18,19].
However, little is known about how herbal enrichment, especially in different geographical regions, may affect both the health-promoting and safety-related aspects of honey. The Western Balkans, specifically Kosovo, Albania, and North Macedonia, are home to diverse aromatic flora and strong traditions of honey production, yet functional honeys from this region remain underexplored. Therefore, the aim of this study was to assess the quality of honey enriched with selected aromatic plant extracts from these three countries using an integrated approach: (i) quantification of total phenolic content (TPC) and antioxidant activity, (ii) application of NIR spectroscopy using both laboratory and portable devices, and (iii) analysis of heavy metal content as an indicator of environmental and health safety. These findings are intended to support the development of standardized methodologies for the quality evaluation of functional honeys and provide a scientific basis for future efforts in labeling, quality assurance, and geographical indication protection.
2. Materials and Methods
2.1. Materials
Honey samples were collected in a period from October to December 2023 from three different countries: Kosovo (n = 3), Albania (n = 3), and North Macedonia (n = 3), yielding a total of 9 base samples. Each base honey sample was enriched with five types of aromatic plants: (i) rosemary (Rosmarinus officinalis), (ii) lavender (Lavandula angustifolia), (iii) oregano (Origanum vulgare), (iv) sage (Salvia officinalis), and (v) white pine essential oil (Pinus sylvestris), at three concentrations: 0.5%, 0.8%, and 1.0%. Each enrichment combination was prepared individually (i.e., only one plant type per sample), including a 0% control. This design led to 5 plant types x 3 concentrations x 9 honey bases + 9 controls = 144 total samples. The powdered plant materials were purchased from Harissa Spice Store (online) and the white pine oil from Terra Organica (online). All additions were made at 35 °C to ensure uniform dispersion. Samples were then stored in sterile, labeled glass jars in dark conditions at room temperature until analysis.
2.2. Total Phenolic Content
The total phenolic content (TPC) of enriched honey samples was measured spectrophotometrically, using the modified Folin–Ciocalteu method, with a honey sugar analogue (40% fructose, 30% glucose, 8% maltose, and 2% sucrose) as the blank sample [20,21]. A volume of 100 µL of the 30% honey aqueous solutions (30 g/100 mL), corresponding to 10 mg of fresh honey, was mixed with 1 mL of Folin–Ciocalteu reagent (10%) and 1 mL of sodium carbonate (7.5%). Prepared samples were stored in the dark for 30 min at room temperature after which their absorbance was measured at 760 nm. TPC was calculated from the gallic acid calibration curve (0–500 mg/L) and the results were expressed as mg gallic acid equivalents (GAEs) per gram of the sample. TPC measurements were performed in duplicate and the results were expressed as the average value ± standard deviation.
2.3. Determination of Heavy Metals
A Teflon microwave tube (vessel) is placed on an analytical balance, and the sample to be subjected to the mineralization process is weighed. A mass of 0.5 g of the sample is then treated with 9 mL of 65% Nitric Acid and 1 mL of 30% Hydrogen Peroxide (note: the total volume of reagents should not exceed 50 mL). The vessel, capped securely, is placed in a fume hood (digestor) to allow for vapor absorption for approximately 30 min. Subsequently, the microwave vessel is sealed with a pressure cap and positioned in the appropriate rotor. The same procedure is applied to the blank sample as it is to the real sample. Both the real sample and the blank sample are placed in the microwave for mineralization. The mineralization process lasts for 55 min, during which the temperature adapts to the ambient temperature.
The vessel is then thoroughly emptied and cleaned of any residues, with the final solution being transferred to a 50.0 mL Teflon tube for further analysis using inductively coupled plasma–optic emission spectrophotometry (ICP-OES).
2.4. Near Infrared Spectroscopy
Continuous near infrared spectra of honey samples (144 samples, in total) were recorded using two different spectrometers. The first, benchtop NIR spectrophotometer, NIR-128-1.7-USB/6.25/50 µm (Control Development, South Bend, IN, USA) with the installed SPEC32 software version 1.6 (Control Development, South Bend, IN, USA) and a halogen light source (HL-2000), is operating within the wavelength range from 904 nm to 1699 nm. The second one, a portable NIR spectrometer, NIR-S-G1 (Innospectra, Hsinchu, Taiwan), with the installed ISC NIRScan software version 2.18 (Innospectra, Hsinchu, Taiwan), is operating within the wavelength range from 900 nm to 1700 nm. Honey samples were placed in 1 mm pathlength plastic cuvettes. Each sample was scanned three times, and the average spectrum was used for analysis [21,22]. Background correction and calibration using a white reference and dark scan were performed before each set of measurements.
Reproducibility and Repeatability of NIR Spectra
As a measure of accuracy, the spectra were examined for repeatability and reproducibility prior to any pre-processing and modeling. Selected samples should be scanned ten times in two different ways, as recommended by Posom and Sirisomboon [16]. Repeatability will be achieved when the computation is based on ten consecutive scans in which the sample should not be moved. For samples that are reloaded and rescanned, the repeatability should be computed also on ten NIR scans. For the aforementioned scans, the average absorbance at specific wavelengths and the standard deviation (SD) were computed. The relative standard deviation (RSD = SD/average) per observed wavelength was used to display the outcome (10 consecutive scans: RSDrepeatability; 10 rescans of the same sample but reloaded 1 time: RSDreproducibility). The analogue and three honey samples were randomly selected (each from one region): H1_W1, H4_L1, and H9 were used for those computations (related to Table 1). Key wavelengths are chosen for the RSD calculation in accordance with the specific peeks related to OH stretches [23,24].

Table 1.
Analyzed honey samples from three different countries.
The raw NIR spectra were inspected for noise, baseline shift, and outliers before pre-processing [25]. For each of the 144 samples, a curve was drawn for three parallels and the mean value to visually identify deviations. The differences in absorption values at a given wavelength were calculated to determine the potential deviation (the maximum tolerated difference was 0.01%). A principal component analysis (PCA) was also applied, in which an outlier would deviate in a way that it was far from the main cluster.
The standard normal variable (SNV) pre-processing method was used precisely to minimize variations caused by light scattering and changes in the optical path (due to particle size, sample density, etc.). The Savitzky–Golay algorithm was used to reduce the influence of random noise in the spectrum. Derivatives will resolve peak overlap, and in this study, we used the 2nd derivative. The combination of pre-processing helps in creating cleaner spectra for further chemometric analysis.
2.5. Data Analysis
For all measured honey samples (144 in total), of which 9 were pure honeys, 5 aromatic herbs (rosemary, lavender, oregano, sage, and white pine oil) were added to each of the pure honeys in 3 different concentrations (0.5%, 0.8%, and 1%), resulting in an additional 135 samples. In the data, presentation was used for the mean value and the associated standard deviation. One-way ANOVA and Kruskal–Wallis H test were used to investigate potential statistically significant differences of means of TPC and heavy metals between the regions. The modeling was conducted by using chemometric multi-variate analysis techniques. Data were analyzed and grouped or separated, based on similarities and differences, using the principal component analysis (PCA) [22].
To assess statistical differences in honey composition across the three regions (Kosovo, Albania, and North Macedonia), we applied both parametric and non-parametric methods.
The one-way analysis of variance (ANOVA) was used to evaluate whether the mean values of each parameter significantly differed between regions. The ANOVA F-statistic (Equation (1)) is computed as follows:
where MSbetween is the mean square between groups and MSwithin is the mean square within groups. These are obtained by dividing the respective sums of squares (SSbetween, SSwithin) by their degrees of freedom. A statistically significant F-value (p < 0.05) indicates that at least one group mean differs from the others.
Since some variables did not meet the assumptions of normality and homoscedasticity, the Kruskal–Wallis H test was conducted as an alternative to ANOVA. The H statistic (Equation (2)) is defined as follows:
where N is the total number of observations, k is the number of groups, Ri is the sum of ranks in group , and is the number of observations in group i. The test evaluates whether the distributions of the groups differ and approximates a chi-square distribution with k − 1 degrees of freedom under the null hypothesis.
These statistical tests provided a robust framework for identifying regional variability in the physicochemical and antioxidant properties of honey.
The raw NIR spectra were inspected for noise, baseline shift, and outliers before pre-processing. For each of the 144 samples, a curve was drawn for three parallels and the mean value to visually identify deviations. The differences in absorption values at a given wavelength were calculated to determine the potential deviation (the maximum tolerated difference was 0.01%). A principal component analysis (PCA) was also applied, in which an outlier would deviate in a way that it was far from the main cluster.
In the following order, Multiplicative Scatter Correction (MSC), de-trending, Standard Normal Variate (SNV), and normalization were among the several spectra pre-processing techniques that were examined [26]. For the presented models, SNV to the raw data, followed by the SG 2nd derivative, were used. Before modeling, the variable importance for projection (VIP) was calculated. The key criterion for VIP is the score larger than 1 [27]. The standard normal variable (SNV) pre-processing method was used to minimize variations caused by light scattering and changes in the optical path (due to particle size, sample density, etc.). The Savitzky–Golay algorithm was used to reduce the influence of random noise in the spectrum. This combination of pre-processing helps in creating cleaner spectra for further chemometric analysis.
The data matrix was randomly divided into three sets: (i) 94 samples for calibration (~65%), (ii) 36 samples for validation (25%), and (iii) 14 samples for testing (~10%). However, as the addition of aromatic plants in different concentrations did not show a clear trend in the previous research [28] in this paper, the results are presented as mean values for each plant. On the pre-processed NIR scan data, the partial least square regression (PLSR) was performed. The following parameters were used to assess the success of model validation: (i) the coefficient of determination (R2), (ii) root mean square error of validation (RMSEV), and (iii) the ratio of standard error of performance to standard deviation (RPD) [29]. As the country of origin of honey and added aromatic plants are categorial variables, the partial least squares discriminant analysis (PLS-DA) was applied. For PLS-DA models, absorbance values of NIR scans were used as input variables. The XLSTAT program Version 2022.4.5 (AddinSoft, Paris, France) was used to process all experimentally obtained data. The Unscrambler X 10.5.1 (CAMO, Oslo, Norway) was used for chemometric modeling.
3. Results
3.1. Total Phenolic Content of the Honey Samples
In presenting the results for nine honey samples to which five aromatic herbs were added (rosemary, lavender, oregano, sage, white pine oil) in three different concentrations (0.5%, 0.8%, and 1%), we were guided by comparisons at the level of three different countries from which the honey originates, but also by highlighting the influence of the addition of aromatic herbs to honey. We started with this in Figure 1, where an overview of the content of total phenols is provided.
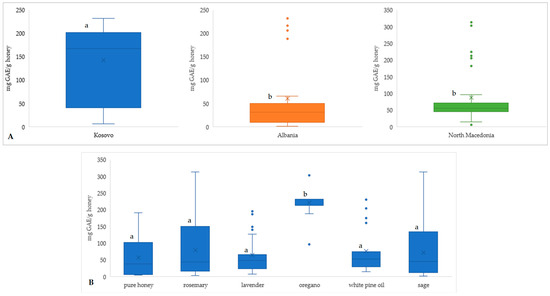
Figure 1.
Total phenolic content (TPC mg GAE/g honey) per countries of purchased honey (A) and differences based on the added aromatic plant (B), regardless of the added concentration. Different letters for the same parameter indicate a statistically significant difference (p < 0.05).
The boxplots (Figure 1) illustrate the total phenolic content (TPC), expressed in mg GAE/g honey, across different regions (Kosovo, Albania, and North Macedonia (Figure 1A) and in honeys enriched with various aromatic plants (Figure 1B). A comparison among the countries shows that honeys from Kosovo have the highest median and mean TPC (average: 167.5 mg GAE/g and median: 142.7 mg GAE/g), followed by North Macedonia (average: 87.3 mg GAE/g) and Albania (average: 61.1 mg GAE/g). Kosovo’s honeys also exhibit the broadest range and interquartile spread, suggesting a diverse phenolic composition, potentially due to floral variety or environmental factors. In contrast, Albania’s honeys display the lowest median TPC (31.6 mg GAE/g) and a tighter distribution, though with some high-value outliers. Honey samples enriched with aromatic plants generally show higher TPC than pure honey. Among them, oregano stands out with the highest median (221.8 mg GAE/g) and smallest interquartile range (213.1–232.5 mg GAE/g), indicating consistently high phenolic enrichment. Rosemary and sage also show elevated TPC levels, though with greater variability, suggesting that these additives can substantially boost phenolic content, albeit inconsistently. Lavender and white pine oil added to honey exhibit lower TPC, but enrichment still results in moderate increases compared to the control (pure honey; average TPC 57.3 mg GAE/g).
To statistically validate the observed differences in total phenolic content (TPC) among the regions (Kosovo, Albania, and North Macedonia), both parametric and non-parametric tests were applied. One-way ANOVA (Table 2) indicated no statistically significant difference in mean TPC between the regions (F = 2.98, p = 0.0678), potentially due to deviations from normality and unequal variances. Therefore, the Kruskal–Wallis H test, which does not assume normality, was conducted and revealed a statistically significant difference among the regions (H = 6.68, p = 0.0355). This result supports the interpretation that at least one region differs significantly in TPC distribution, corroborating the patterns observed in Figure 1A. These findings suggest that regional differences in floral diversity and environmental conditions influence the polyphenol content of honey.
Table 2.
Results of ANOVA and Kruskal–Wallis tests for honey composition parameters across Kosovo, Albania, and North Macedonia.
3.2. Heavy Metals and Mineral Content
The next step was to identify heavy metals and minerals in honey samples that need to be controlled due to their potentially harmful effects on health. However, it should be emphasized here that the paper does not discuss the content of metals in honey from the perspective of safety risks to human health, as the aim of the paper is focused on the potential of the method in determining the presence of metals. Trends of heavy metal presence in honey samples are shown in Figure 2 according to the countries of origin of the honey, and according to the added aromatic plants (Figure 2B, and in more detail, Figure S1).
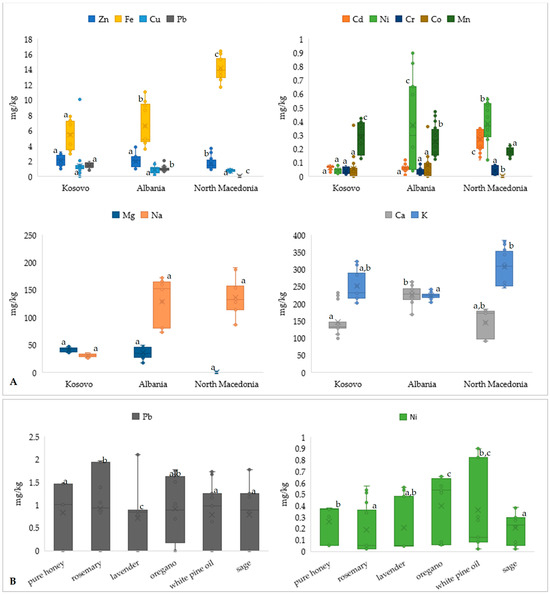
Figure 2.
Concentration of heavy metals in samples of honey from different regions (A), with isolated examples of changes in heavy metal concentrations depending on the added aromatic plant, for Pb and Ni (B), regardless of the added concentration. Different letters for the same parameter indicate a statistically significant difference (p < 0.05).
Heavy metal and mineral content in honey samples from Kosovo, Albania, and North Macedonia (Figure 2A), as well as in honey enriched with aromatic plants (Figure 2B) show certain characteristics according to the region and the added aromatic plant. The changes in all heavy metals in honey samples, depending on the added plant, are shown in the Supplementary Material as Figure S1. Among heavy metals, iron (Fe) and zinc (Zn) are the most abundant across all regions, though levels vary significantly. Notably, Albanian honeys exhibit the highest concentrations of Fe (up to~16 mg/kg), indicating potential environmental or floral sources rich in iron or possible contamination. Copper (Cu) is relatively consistent across regions, while lead (Pb), a toxic element, remains within lower ranges but is slightly elevated in some Albanian and North Macedonian samples. Figure 2A is presenting in the right upper part, cadmium (Cd), nickel (Ni), chromium (Cr), cobalt (Co), and manganese (Mn). Nickel levels are highest in Albanian honeys (average: 0.370 mg/kg) and show greater variation (0.043–0.660 mg/kg), raising concerns due to the Ni potential toxicity at elevated levels. Cadmium and cobalt are generally low, though some samples from Albania show elevated Cd, possibly from anthropogenic sources. Mn is highest in Kosovo (0.286 mg/kg) and Albania (0.256 mg/kg), reflecting natural mineral richness in the soils of these regions. Essential macro-elements such as magnesium (Mg), sodium (Na), calcium (Ca), and potassium (K) are also depicted, in the lower part of Figure 2A. North Macedonian honeys have significantly higher Na (136.1 mg/kg) and Ca levels (307.2 mg/kg), while Kosovo and Albania show elevated Mg (41.6 mg/kg and 36.4 mg/kg, respectively). These differences highlight the influence of geography and flora on the mineral profile of honey. Figure 2B shows the impact of aromatic plant enrichment on Pb and Ni levels. Pb concentrations are highest in rosemary (0.9 mg/kg) and oregano-enriched samples (0.7 mg/kg), though still within moderate limits. The content of Ni notably increases with oregano (0.40 mg/kg), white pine oil (0.36 mg/kg), and sage (0.21 mg/kg), suggesting plant-based accumulation. While enrichment enhances phenolic content (as previously shown in Figure 1), it may also introduce or concentrate certain metals, emphasizing the need for monitoring to ensure consumer safety in functional honey products.
To statistically evaluate significant differences in honey composition among different regions, namely, Kosovo, Albania, and North Macedonia, one-way ANOVA and Kruskal–Wallis H tests were performed on a range of parameters, including heavy metals and macro-elements. The ANOVA test revealed statistically significant (p < 0.05) variations in all the variables, including Zn, Cd, Ca, Fe, Cu, Ni, Pb, Co, Mg, Mn, K, Na—as well as antioxidant parameters (TPC, DPPH, IC50), among the three countries. Cr and As did not differ significantly among countries, revealing low concentrations of honey in the three nations. Since some variables failed the normality and homoscedasticity assumptions, we complemented the analysis by applying the non-parametric Kruskal–Wallis test. The procedure reaffirmed the presence of drastic regional disparities for 15 out of 17 parameters examined. Because some variables did not meet the assumptions of normality and homoscedasticity, we also performed the non-parametric Kruskal–Wallis tests for all parameters. The Kruskal–Wallis tests confirmed large significant differences by region for 15 of the 17 parameters examined. The significant statistical differences were detected and confirmed for all elements. As well, it was confirmed that the concentrations of Cr (H = 3.26, p = 0.196) and As (H = 0.00, p = 1.00) were not significantly different between all sampling locations. The statistical calculations confirm that the geographical regions of honey have a key role in determining its elemental and antioxidant characteristics. The differences are most likely indicative of environmental variation, vegetation sources, and localized farming practices, and therefore serve to justify the multivariate models described in the succeeding section.
3.3. Multivariate Analyses
By identifying trends and changes depending on the country and the added aromatic plant, a deeper analysis is possible using multivariate analysis, more precisely principal component analysis (PCA). Figure 3 shows a biplot in which the relationship between TPC and some heavy metals can be observed.
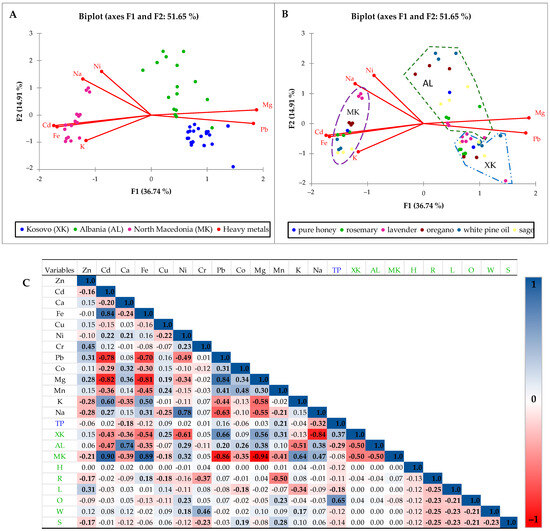
Figure 3.
Biplot of the principal component analysis (PCA) for total phenols (TPs) and heavy metal values (Zn, Cd, Fe, Cu, Ni, Cr, Pb, Co, Mg, Mn, K, and Na) in three regions (Kosovo—XK, Albania (AL), and North Macedonia (MK) with added aromatic plants (R—rosemary, L—lavender, O—oregano, W—white pine oil, and S—sage), regardless of the added concentration. PCA is presented with countries as qualitative variables (A) and aromatic plants as qualitative variables (B). Pearson’s correlation matrix interrelationships in the observed set of variables (C) where the correlation indicates a strong relationship (value 1, blue in the legend) and an inversely proportional relationship that can go to —1, red in the legend.
Figure 3 presents the first multivariate analysis, relating total phenol content and heavy metal concentrations in honey samples using the principal component analysis (PCA) and Pearson correlation matrix. Figure 3A shows the PCA biplot categorizing honey samples by geographic origin (Kosovo—XK, Albania—AL, and North Macedonia—MK), while Figure 3B classifies them based on aromatic plant enrichment. Figure 3C shows a Pearson correlation matrix revealing inter-variable relationships. In Figure 3A,B, the PCA biplot explains 51.65% of the total variance (F1: 36.74%, F2: 14.91%). The grouping of honey samples from Kosovo (XK) is distinct from Albania (AL) and North Macedonia (MK), indicating region-specific metal and phenolic profiles. Albanian samples show strong associations with Na, Ni, Fe, Cd, and K—elements generally elevated in these honeys, as supported by earlier boxplots. The rest of the minerals were not included in the analysis due to their low factor loading. In contrast, Kosovo samples cluster closely with Mg and Zn, suggesting a cleaner profile with a mineral composition influenced more by natural floral sources than contamination. North Macedonian samples align more with Pb, implying a potential environmental exposure. Figure 3B introduces aromatic plants as categorical variables. Samples enriched with rosemary, oregano, and sage tend toward the direction of Pb, Mg, and Ni vectors, indicating these enrichments may increase certain heavy metal levels [28,30]. This aligns with previous observations that plant additives, especially oregano and white pine oil, elevate total phenol content but may also introduce or concentrate trace metals. The correlation matrix in Figure 3C supports these patterns. Total phenols (TPC) are significantly correlated with heavy metals, (i) negatively with Ca (–0.18) and Na (–0.12), while (ii) positively with Mn (0.21), suggesting phenolic richness may not stem from metal content. A significance level, α = 0.05, indicates values in bold. Strong positive correlations between metals (e.g., Pb–Mg: 0.84; Na–N: 0.78) suggest shared sources or pathways. Extremely negative correlations were determined in North Macedonia for Pb (−0.86) and Mg (−0.94), while positively correlating with Cd (0.90) and Fe values (0.89). Such results are important because accumulation of heavy metals can be toxic for the human body. For example, accumulated Cd can result in poisoning with severe impacts on bone and kidney health, as well as reduced bone mineral density due to renal damage [31].
3.4. NIR Spectroscopy and PLS Models
The typical shape of NIR spectra is presented in Figure S2. According to the literature, the NIR region with characteristic bands for phenolics is in the range from 1415 to 1512 nm [32], while for metals the suggested spectral ranges between 1110–1300 nm and 1500–1700 nm are specified [33]. The first range corresponds to the dominance of C-H bonds in carbohydrates and sugars, aromatic compounds, and a smaller influence of water. The second range corresponds to C-H, O-H, and N-H bonds and can be associated with the presence of carbohydrates and proteins. Metals will bind to some of the groups, which will indirectly enable their detection. NIR spectra show vibrations involving hydrogen bonds (e.g., C–H, O–H, N–H, S–H), i.e., molecules containing hydrogen (organic compounds, water) are strong absorbers in the NIR region, while metals and minerals (in pure form) do not vibrate in the NIR region because they do not have covalent bonds with hydrogen that would produce absorption bands in the NIR region [34]. However, NIR spectroscopy can be used for indirect detection and/or quantification of metals through chemometric models (such as PLS), exploiting their indirect influence on the sample matrix (through the formation of metal–organic complexes with organic molecules that are active in the NIR region (e.g., amino acids, proteins, phenols, carbohydrates, or specific ligands added to the sample). When a metal ion forms a complex, it can modify the vibrational characteristics of these organic ligands (e.g., changes in O–H or C–H vibrations), which is then reflected in the form of subtle changes in the NIR spectrum. Chemometrics is key here because the model “learns” the correlations between the NIR spectrum and the metal concentration. Since the quality of a food product such as honey is variable, the analysis is extremely important. Furthermore, for the analysis, fast, cheap but still reliable methods that are environmentally friendly are preferred, such as NIR spectroscopy. In this work, we used two devices, a desktop and a portable one, with the same wavelength range (900–1700 nm). However, the information about the reliability and precision of the two NIR devices, are crucial in order to assess the potential of their application [22], and this is shown in Table 3.
Table 3.
Precision testing based on the relative standard deviation (RSD) calculated for repeatability and reproducibility of scanning for two NIR devices (benchtop and portable).
Repeatability results were performed based on absorbance values for ten NIR measurements in which the sample was not moved, at three wavelengths (964 nm, 1433 nm, and 1688 nm). These wavelengths are related to the growth of OH bonds and, in addition to water (wavelength 964 nm), are associated with glucose (1688 nm) and sucrose (1433 nm) [23,24]. Reproducibility is based on absorbance data at the same wavelengths, also for 10 measurements, but these measurements are the result of moving and repositioning the sample. The results indicate significantly better performance for the benchtop device, which is in line with the study by Klinar et al. [22]; however, the RSD values for the portable device are slightly higher at certain wavelengths (e.g., repeatability at 964 nm and/or reproducibility at 1433 nm), which is promising when considering the affordability of portable NIR devices compared to benchtop ones.
Considering the number of advantages that NIR devices offer, the goal was to verify its ability to qualitatively and/or quantitatively connect NIR spectra with TPC and metals and recognize samples according to the country from which the honey sample originates.
Therefore, the NIR spectra were associated with the sample data and the TPC and heavy metal content, and PLS regression analyses were performed separately for each device. The results are shown in Table 4.
Table 4.
Results of PLS regression presented with parameters indicating model efficiency based on NIR scans of two devices.
The presented table (Table 4) illustrates the results of partial least squares (PLSs) regression used to assess the performance of benchtop and portable near-infrared (NIR) devices in predicting concentrations of various heavy metals and total phenols (TPs) in honey samples. These parameters are evaluated using coefficients of determination (R2), RMSEV, and RPD, reflecting model accuracy, error, and predictive power, respectively. Those RPD values can be contextualized through findings from the study by Sundaram et al. [34], where higher RPD values (above 3.0) were considered indicative of good predictive performance, suitable for screening or even quality control purposes when values approached or exceeded 5. This aligns directly with our table, where parameters such as Pb, Co, Mg, and TP achieved RPD values over 5 using benchtop devices, suggesting strong model reliability and suitability for quality control.
For the benchtop device, the R2 values are generally very high (≥0.99 for most elements), indicating strong linear relationships between predicted and observed values. RPD values above 5 (e.g., Pb: 9.9, Co: 9.5, Mg: 9.8) suggest highly robust prediction models, consistent with the findings in the referenced study, where a model with an RPD of 4.46 was deemed optimal. However, elements like Cd and Mn showed lower RPDs (2.8 and 2.6), indicating weaker models, suitable perhaps only for rough screening rather than accurate quantification. In contrast, portable device, though generally showing lower Rv2 and RPD values, still demonstrated decent performance [29]. For instance, TPCs (RPD = 9.2) and Mg (RPD = 9.3) on portable devices showed strong predictive ability, confirming that portable NIR tools, while slightly less accurate, can still offer significant utility, especially in field applications where benchtop instruments may not be feasible. The RMSEV values follow expectations—lower values correlate with higher predictive accuracy. For example, Cd and Ni showed very low RMSEV values with the portable device (0.0030 and 0.0833, respectively), highlighting minimal prediction error.
The partial least squares discriminant analysis (PLS-DA) was used to investigate the performance of two near-infrared (NIR) devices—benchtop and portable—in accurately classifying honey samples based on their country of origin and the type of added aromatic plant. Confusion matrix was used and the results of the % of correct classifications are presented. The results are summarized in Table 5, using the “% correct” value, which reflect the success rate of the model in identifying the correct category for each observed variable.
Table 5.
Prediction of qualitative variables, country of origin of the honey, and type of added aromatic plants, regardless of the added concentration, by use of PLS-DA models.
In the PLS-DA models, NIR spectra were used as quantitative input variables and the qualitative outputs were “country of origin” and “added aromatic plant”. The literature confirms that the regional character is difficult to establish in this geographical area [28]. In terms of country of origin classification (Table 5), the portable device showed excellent accuracy for Kosovo honey (100%) and strong results for Albania (88.9%). However, it performed less effectively for North Macedonia (76.1%), suggesting possible spectral similarities or sample variability that reduced classification accuracy. In contrast, the benchtop device showed consistently high performance across all countries, with North Macedonia achieving the highest accuracy (97.9%), followed by Albania (90.6%) and Kosovo (87.5%). This demonstrates the superior analytical capabilities of the benchtop instrument in detecting subtle differences in honey composition linked to geographical origin.
Regarding the identification of added aromatic plant extracts, the benchtop device again outperformed the portable one, especially for rosemary (85.7%) and oregano (53.3%). It failed, however, to correctly identify samples with lavender, sage, or white pine. The portable device was most successful with oregano (100%) but less reliable with other additives, achieving only 50% accuracy for rosemary and failing entirely with white pine.
4. Discussion
The importance of phenolic components is reflected in a series of studies that support their health benefits [35]. In this study, total phenolic content (TPC) was expressed in gallic acid equivalents (GAEs), a standard approach that facilitates comparison across studies. Our findings confirm that both geographical origin and botanical enrichment significantly influence the phenolic profile of honey. Notably, honeys enriched with oregano and rosemary exhibited the highest TPC, aligning with existing literature on the strong antioxidant properties of these herbs. These phenolic-rich samples likely contribute to enhanced antioxidant potential, partly due to their ability to chelate pro-oxidant metals, thus protecting cellular structures from oxidative stress [35,36].
On the other hand, healthy food, such as honey, may contain undesirable elements that are present as a result of pollution and/or mixing with plants that are also medicinal, but contain high levels of heavy metals (which also ended up in the plant due to air, water and/or soil pollution). Therefore, the importance of their detection is crucial.
Heavy metals are chemical elements that are generally dangerous to human health and the environment and the key elements in this group include lead (Pb), cadmium (Cd), cobalt (Co), chromium (Cr), copper (Cu), iron (Fe), arsenic (As), nickel (Ni), zinc (Zn), and mercury (Hg) [37,38]. Due to the expansion of industries, intensive agriculture, and car traffic, the levels of these contaminants in the environment have significantly increased [28], posing a serious problem due to potential risks to consumers and the need for continuous monitoring. Heavy metals do not dissolve easily and accumulate in the environment, making them mobile and susceptible to bioaccumulation in water resources and, consequently, in food such as vegetables, meat, fish, and milk [36]. Once they enter the body, they are oxidized and form stable bonds with enzymes or protein molecules, leading to dysfunctions, abnormalities, or damage [28,29,30,34,35]. Honey is considered a useful bio-indicator of environmental pollution, used to assess the presence of inorganic and organic contaminants. Bees, traveling up to 5–10 km in search of food, are highly susceptible to contaminants from polluted plants, soil, water, and air, transferring them into honey and other bee products. Therefore, the analysis of honey allows for monitoring contamination in areas where apiaries are located [39,40]. Heavy metals are potentially toxic in high amounts or after long-term exposure. These elements can move and concentrate in different organs, leading to various health issues, for example, Pb affects the normal activity of enzymes and is linked with carcinogenesis, mutagenesis, and teratogenesis in experimental animals [36]; Cd is a cumulative toxicant that affects the urinary and respiratory systems [29]; Cr toxicity refers to allergic reactions, anemia, pathophysiological defects, burns, and respiratory and gastrointestinal cancers [35]; Co accumulates in the human body and causes allergic contact dermatitis, asthma, hepatotoxicity, memory loss, heart disease, and reduced fertility [37]; and Ni toxicity includes headaches, dizziness, and tachycardia [36]. Table S1 lists the tolerable values for heavy metal intake; therefore, it is definitely advisable to check the level of heavy metals in plants and adjust the concentration of the supplement to the daily recommendations. The recommendations for children are even lower than those listed; therefore, for this population group, we should be extremely careful and responsible.
All of the above points to the need for regular and quick control, which encourages the development and application of methods such as near-infrared spectroscopy. Our results confirm that geographical origin and botanical enrichment significantly affect the phenolic content of honey as well as the concentration of heavy metals. The observed differences might be due to varying environmental conditions, floral sources, and the phenolic profile of the added plants. Notably, oregano and rosemary show the most promise for functional enhancement of honey’s antioxidant properties. Such findings support the development of value-added honeys with improved health benefits [41]. Overall, PCA and correlation analyses confirm that both geographical origin and plant enrichment significantly influence the chemical profile of honey, with implications for safety and nutritional quality. Certainly, the application of PCA has confirmed its effectiveness and consistency in this work as well as on any other data set [22].
Growing consumer demand for quality assurance, authenticity, and traceability significantly influences the global honey market. This is particularly important for premium products such as honey enriched with aromatic plant extracts, due to their added health benefits and distinct sensory profiles [42,43,44]. In this context, the development of fast, non-destructive and environmentally friendly techniques to analyze the honey quality is challenging. To address food authentication and traceability, various analytical methodologies have been developed [44]. Among them, the application of near-infrared technology in the fresh food and food processing industry emerged for the last decades. Numerous studies have shown the efficiency of NIR spectroscopy, in combination with chemometric tools, in predicting varying physicochemical properties, all crucial for honey quality assessment [16,21,45,46,47,48,49]. The application of NIR spectroscopy in quantifying bioactive compounds like total polyphenolic content has been explored for various plant extracts and food matrices [50,51]. The NIR spectral regions are suitable for this purpose due to their sensitivity to the vibrations of O–H, C–H, and N–H bonds, which are common in sugars, water, organic acids, proteins, and poly-phenols [51,52,53]. However, interpretation of NIR spectra becomes demanding owing to the complex matrix resulting from the combination of honey and plant extracts. The diverse range of bioactive compounds as a result of the novel matrix can significantly alter the overall spectral fingerprint of the honey, requiring multivariate data analysis methods [21,50].
Beyond general quality parameters, the presence of heavy metals in honey poses a critical concern for consumer safety and product integrity. Heavy metals such as Pb, Cd, Cu, Ni, Cr, Co, Mn are toxic contaminants that can enter honey through various environ-mental pathways as well as through contaminated beekeeping practices or processing equipment [37,41]. While NIR spectroscopy has proven highly effective for predicting various organic constituents in honey, its direct application for quantifying heavy metals is challenging because these inorganic elements do not exhibit the characteristic vibrational overtones in the NIR region. Although high concentrations of certain heavy metals might indirectly influence the NIR spectral fingerprint by altering the honey’s organic matrix, NIR spectroscopy cannot be used for direct quantification. However, in combination with more precise analytical techniques such as inductively coupled plasma, mass spectrometry or atomic absorption spectrometry, it could be applied as a heavy metals screening method [54,55,56].
In conclusion, the findings mirror those of other studies [21,22,57] in affirming NIR spectroscopy’s utility for rapid chemical analysis. Benchtop devices consistently deliver superior performance, while portable devices provide practical, albeit slightly less precise, alternatives for in-field assessments. This supports the broader adoption of NIR tools for both laboratory and on-site analytical needs. Although this study provides an insight into the diversity of honey quality (looking at the content of metals, minerals, and total phenols) in enriched honey with aromatic plants, the following limitations should definitely be highlighted: (i) limited scope and concentrations of added herbs (only three, arbitrarily chosen concentrations for five aromatic plants were tested, for which the qualitative parameter values were not compared with the limits—which is crucial in food safety), (ii) sample sensitivity (to humidity, temperature), and (iii) the use of two NIR devices (which collects less data in the NIR spectrum and certainly the RPD values for the desktop and portable devices do not have the same “weight”. Although a reproducibility and repeatability test were carried out that did not indicate significant differences—Figures S3 and S4 show that the deviations of the test samples also had statistically significant deviations in the predicted concentrations of heavy metals (Cd, Pb, and Co) compared to those determined in the laboratory (p < 0.05).
Overall, the benchtop NIR device offers higher reliability in classifying both origin and aromatic plant additions. Nonetheless, the portable device shows promise, particularly in field settings, especially for origin classification, though its limitations in detecting specific additives should be noted.
5. Conclusions
This study comprehensively assessed the quality of honey enriched with aromatic plants from Kosovo, Albania and North Macedonia, focusing on total phenolic compounds (TPCs), the presence of heavy metals and the applicability of near-infrared (NIR) spectroscopy. The aim was to contribute to the development of standardized methodologies for assessing the quality and authenticity of honey.
Geographical origin and enrichment with aromatic plants were confirmed to significantly influence the phenolic profile of honey, and among the enriched honeys, oregano stood out with the highest median TPC, as did rosemary and sage, which also showed elevated TPC levels. The Kruskal–Wallis H test confirmed statistically significant differences in the distribution of TPC among regions (H = 6.68, p = 0.0355), suggesting the influence of regional floral diversity and environmental conditions. The results also indicate the need to control heavy metals due to their potentially harmful effects on health. Iron (Fe) and zinc (Zn) were the most abundant metals in all regions, with the highest Fe concentrations in Albanian honeys (up to ~16 mg/kg). However, enrichment of honey with aromatic plants can also introduce or concentrate certain heavy metals; lead (Pb) was highest in samples enriched with rosemary and oregano, while Ni significantly increased with the addition of oregano, white pine oil and sage.
NIR spectroscopy has proven to be an efficient, rapid, non-destructive and environmentally friendly method for monitoring TPC, and certainly showed the potential for indirect monitoring of metals that have bound to organic matrices and thus enabled monitoring of changes in O–H or C–H bond vibrations. Despite these limitations, the study confirms the usefulness of NIR spectroscopy for rapid chemical analysis. Benchtop NIR devices provide greater reliability and precision for classifying the origin and added aromatic plants, while portable devices offer a practical, albeit somewhat less precise, alternative for field assessments, which supports the wider application of NIR tools in laboratory and field conditions. Future studies should include determination of the compliance of qualitative parameters with regulatory limits, which is crucial for food safety.
These findings support the development of standardized methodologies for assessing the quality of functional honeys and provide a scientific basis for future efforts in labeling, quality assurance, and geographical origin protection. The application of NIR technology, especially in combination with chemometric tools, is essential to meet the growing consumer demand for quality assurance, authenticity, and traceability in the global honey market. Continuous monitoring of heavy metals is essential for consumer safety, and NIR spectroscopy can serve as a screening method in combination with more precise techniques.
Supplementary Materials
The following supporting information can be downloaded at https://www.mdpi.com/article/10.3390/pr13082598/s1. Figure S1: Concentrations of heavy metals in pure honey samples and in samples with added aromatic plants; Figure S2: NIR spectra, scanned with a portable device, for the honey analogue (lines), and the 144 honey samples (the yellow surface); Figure S3: PLSR for the benchtop NIR device, visual presentation of the calibrated, validated and tested samples. R2C—coefficient of determination of the calibration; R2V—coefficient of determination of the validation; p-value—paired t-Student data analysis between the data obtained in the laboratory and the data predicted by the chemometric models (p > 0.05 indicates no statistically significant differences between the predicted (tested) and measured means); Figure S4: PLSR for the portable NIR device, visual presentation of the calibrated, validated and tested samples. R2C—coefficient of determination of the calibration; R2V—coefficient of determination of the validation; p-value—paired t-Student data analysis between the data obtained in the laboratory and the data predicted by the chemometric models (p > 0.05 indicates no statistically significant differences between the predicted (tested) and measured means). Table S1: Tolerable daily intake of heavy metals [58,59].
Author Contributions
Conceptualization, J.G.K., T.J. and B.D.; methodology, J.G.K., T.J., A.J.T., M.B., D.V., V.K., B.D., S.R., G.P. and V.M.; software, J.G.K., T.J., A.J.T., M.B. and D.V.; validation J.G.K., T.J., A.J.T., M.B., D.V. and V.K.; formal analysis, J.G.K., T.J., B.D., S.R. and V.K.; investigation, T.J., A.J.T., M.B., D.V., B.D. and V.M.; resources, J.G.K., T.J., V.K., B.D., S.R. and V.M.; data curation, J.G.K., T.J., A.J.T., M.B., D.V., V.K., B.D., S.R. and G.P.; writing—original draft preparation, J.G.K., T.J. and V.K.; writing—review and editing, J.G.K., T.J., A.J.T., M.B., D.V., V.K., B.D., S.R., G.P. and V.M.; visualization, J.G.K., T.J., A.J.T., M.B., D.V., V.K., B.D., S.R., V.M. and G.P.; supervision, J.G.K., V.K. and S.R. All authors have read and agreed to the published version of the manuscript.
Funding
This research received no external funding.
Data Availability Statement
Data are available upon request.
Conflicts of Interest
The authors declare no conflicts of interest.
Abbreviations
The following abbreviations are used in this manuscript:
| AL | Albania |
| MK | North Macedonia |
| XK | Kosovo |
| NIR | Near-infrared |
| TPC | Total phenolic compounds |
| PCA | Principal component analysis |
| PLS | Partial least squares |
| PLS-DA | Partial least squares discriminant analysis |
| Rc2, Rv2 | Coefficient of determination for calibration and validation |
| RMSEV | Root mean square error of validation |
| RPD | Ratio of standard error of performance to standard deviation |
References
- Islam, M.K.; Sostaric, T.; Lim, L.Y.; Hammer, K.; Locher, C. A Comprehensive HPTLC-Based Analysis of the Impacts of Temperature on the Chemical Properties and Antioxidant Activity of Honey. Molecules 2022, 27, 8491. [Google Scholar] [CrossRef]
- Erejuwa, O.O.; Sulaiman, S.A.; Ab Wahab, M.S. Honey: A novel antioxidant. Molecules 2012, 17, 4400–4423. [Google Scholar] [CrossRef] [PubMed]
- Al-Waili, N.; Salom, K.; Al-Ghamdi, A.; Ansari, M.J. Antibiotic, pesticide, and microbial contaminants of honey: Human health hazards. Sci. World J. 2012, 930849. [Google Scholar] [CrossRef]
- Vică, M.L.; Glevitzky, M.; Dumitrel, G.A.; Bostan, R.; Matei, H.V.; Kartalska, Y.; Popa, M. Qualitative Characterization and Antifungal Activity of Romanian Honey and Propolis. Antibiotics 2002, 11, 1552. [Google Scholar] [CrossRef] [PubMed]
- Khalil, M.I.; Sulaiman, S.A.; Gan, S.H. High 5-hydroxymethylfurfural concentrations are found in Malaysian honey samples stored for more than one year. Food Chem. Toxicol. Int. J. Publ. Br. Ind. Biol. Res. Assoc. 2010, 48, 2388–2392. [Google Scholar] [CrossRef]
- Terrab, A.; Recamales, A.F.; Hernanz, D.; Heredia, F.J. Characterisation of Spanish thyme honeys by their physicochemical characteristics and mineral contents. Food Chem. 2004, 88, 537–542. [Google Scholar] [CrossRef]
- Paula, V.B.; Sousa-Dias, M.L.; Seixas, N.L.; Combarros-Fuertes, P.; Estevinho, L.M.; Dias, L.G. Phenolic Class Analysis in Honey: Comparison of Classical and Single UV Spectrum Methodologies. Processes 2024, 12, 2297. [Google Scholar] [CrossRef]
- Palma-Morales, M.; Huertas, J.R.; Rodríguez-Pérez, C. A Comprehensive Review of the Effect of Honey on Human Health. Nutrients 2023, 15, 3056. [Google Scholar] [CrossRef]
- Zawawi, N.; Chong, P.J.; Mohd Tom, N.N.; Saiful Anuar, N.S.; Mohammad, S.M.; Ismail, N.; Jusoh, A.Z. Establishing Relationship between Vitamins, Total Phenolic and Total Flavonoid Content and Antioxidant Activities in Various Honey Types. Molecules 2021, 26, 4399. [Google Scholar] [CrossRef] [PubMed]
- Zullkiflee, N.; Taha, H.; Usman, A. Propolis: Its Role and Efficacy in Human Health and Diseases. Molecules 2022, 27, 6120. [Google Scholar] [CrossRef]
- Pimentel, T.C.; Rosset, M.; de Sousa, J.M.B.; de Oliveira, L.I.G.; Mafaldo, I.M.; Pintado, M.M.E.; de Souza, E.L.; Magnani, M. Stingless bee honey: An overview of health benefits and main market challenges. J. Food Biochem. 2022, 46, e13883. [Google Scholar] [CrossRef]
- Tsavea, E.; Vardaka, F.P.; Savvidaki, E.; Kellil, A.; Kanelis, D.; Bucekova, M.; Grigorakis, S.; Godocikova, J.; Gotsiou, P.; Dimou, M. Physicochemical Characterization and Biological Properties of Pine Honey Produced across Greece. Foods 2022, 11, 943. [Google Scholar] [CrossRef]
- Ghorab, A.; Rodríguez-Flores, M.S.; Nakib, R.; Escuredo, O.; Haderbache, L.; Bekdouche, F.; Seijo, M.C. Sensorial, Melissopalynological and Physico-Chemical Characteristics of Honey from Babors Kabylia’s Region (Algeria). Foods 2021, 10, 225. [Google Scholar] [CrossRef] [PubMed]
- Karabagias, I.K.; Badeka, A.V.; Kontakos, S.; Karabournioti, S.; Kontominas, M.G. Botanical discrimination of Greek unifloral honeys with physico-chemical and chemometric analyses. Food Chem. 2014, 165, 181–190. [Google Scholar] [CrossRef] [PubMed]
- El Hajj, R.; Estephan, N. Advances in infrared spectroscopy and chemometrics for honey analysis: A comprehensive review. Crit. Rev. Food Sci. Nutr. 2024, 1–14. [Google Scholar] [CrossRef]
- Caredda, M.; Ciulu, M.; Tilocca, F.; Langasco, I.; Núñez, O.; Sentellas, S.; Saurina, J.; Pilo, M.I.; Spano, N.; Sanna, G. Portable NIR Spectroscopy to Simultaneously Trace Honey Botanical and Geographical Origins and Detect Syrup Adulteration. Foods 2024, 13, 3062. [Google Scholar] [CrossRef] [PubMed]
- Fakhlaei, R.; Selamat, J.; Khatib, A.; Razis, A.F.A.; Sukor, R.; Ahmad, S.; Babadi, A.A. The Toxic Impact of Honey Adulteration: A Review. Foods 2020, 9, 1538. [Google Scholar] [CrossRef]
- Bereksi-Reguig, D.; Bouchentouf, S.; Allali, H.; Adamczuk, A.; Kowalska, G.; Kowalski, R. Trace Elements and Heavy Metal Contents in West Algerian Natural Honey. J. Anal. Methods Chem. 2022, 2022, 7890856. [Google Scholar] [CrossRef]
- Cucu, A.A.; Pașca, C.; Cucu, A.B.; Moise, A.R.; Bobiş, O.; Dezsi, Ș.; Blaga Petrean, A.; Dezmirean, D.S. Evaluation of the Main Macro-, Micro- and Trace Elements Found in Fallopia japonica Plants and Their Traceability in Its Honey: A Case Study from the Northwestern and Western Part of Romania. Plants 2024, 13, 428. [Google Scholar] [CrossRef]
- Seraglio, S.K.T.; Schulz, M.; Brugnerotto, P.; Silva, B.; Gonzaga, L.V.; Fett, R.; Costa, A.C.O. Quality, composition and health-protective properties of citrus honey: A review. Food Res. Int. 2021, 143, 110268. [Google Scholar] [CrossRef]
- Valinger, D.; Longin, L.; Grbeš, F.; Benković, M.; Jurina, T.; Gajdoš Kljusurić, J.; Jurinjak Tušek, A. Detection of honey adulteration—The potential of UV-VIS and NIR spectroscopy coupled with multivariate analysis. LWT 2021, 145, 111316. [Google Scholar] [CrossRef]
- Klinar, M.; Benković, M.; Jurina, T.; Jurinjak Tušek, A.; Valinger, D.; Tarandek, S.M.; Prskalo, A.; Tonković, J.; Gajdoš Kljusurić, J. Fast Monitoring of Quality and Adulteration of Blended Sunflower/Olive Oils Applying Near-Infrared Spectroscopy. Chemosensors 2024, 12, 150. [Google Scholar] [CrossRef]
- Williams, P. Near Infrared Technology—Getting the Best Out of Light; African Sun Media: Stellenbosch, South Africa, 2019. [Google Scholar] [CrossRef]
- Giangiacomo, R.; Magee, J.B.; Birth, G.S.; Dull, G.G. Predicting concentrations of individual sugars in dry mixtures by near-infrared reflectance spectroscopy. J. Food Sci. 1981, 46, 531–534. [Google Scholar] [CrossRef]
- Huang, J.; Rommero-Torres, S.; Moshgbar, M. Practical Considerations in Data Pre-treatment for NIR and Raman Spectroscopy. 2010. Available online: https://www.americanpharmaceuticalreview.com/Featured-Articles/116330-Practical-Considerations-in-Data-Pre-treatment-for-NIR-and-Raman-Spectroscopy/ (accessed on 14 April 2025).
- Rinnan, A.; Van den Berg, F.; Engelsen, S.B. Review of the most common pre-processing techniques for near-infrared spectra. TrAC Trends Anal. Chem. 2009, 28, 1201–1222. [Google Scholar] [CrossRef]
- Mata, M.M.D.; Rocha, P.D.; Farias, I.K.T.; Silva, J.L.B.D.; Medeiros, E.P.; Silva, C.S.; Simões, S.D.S. Distinguishing cotton seed genotypes by means of vibrational spectroscopic methods (NIR and Raman) and chemometrics. Spectrochim. Acta Part A Mol. Biomol. Spectrosc. 2022, 266, 120399. [Google Scholar] [CrossRef]
- Gajdoš Kljusurić, J.; Knights, V.; Durmishi, B.; Rizani, S.; Jankuloska, V.; Velkovski, V.; Jurinjak Tušek, A.; Benković, M.; Valinger, D.; Jurina, T. Data Analyses and Chemometric Modeling for Rapid Quality Assessment of Enriched Honey. Chemosensors 2025, 13, 246. [Google Scholar] [CrossRef]
- Fearn, T. Assessing Calibrations: SEP, RPD, RER and R2. NIR News 2002, 13, 12–13. [Google Scholar] [CrossRef]
- Nyarko, F.; Tack, F.M.G.; Mouazen, A.M. Potential of visible and near infrared spectroscopy coupled with machine learning for predicting soil metal concentrations at the regional scale. Sci. Total Environ. 2022, 841, 156582. [Google Scholar] [CrossRef]
- Karami, E.; Goodarzi, Z.; Ghanbari, A.; Dehdashti, A.; Bandegi, A.R.; Yosefi, S. Atorvastatin prevents cadmium-induced renal toxicity in a rat model. Toxicol. Ind. Health 2023, 39, 218–228. [Google Scholar] [CrossRef] [PubMed]
- Toledo-Martín, E.M.; García-García, M.d.C.; Font, R.; Moreno-Rojas, J.M.; Salinas-Navarro, M.; Gómez, P.; Del Río-Celestino, M. Quantification of Total Phenolic and Carotenoid Content in Blackberries (Rubus fructicosus L.) Using Near Infrared Spectroscopy (NIRS) and Multivariate Analysis. Molecules 2018, 23, 3191. [Google Scholar] [CrossRef] [PubMed]
- Revilla, I.; Hernández Jiménez, M.; Martínez-Martín, I.; Valderrama, P.; Rodríguez-Fernández, M.; Vivar-Quintana, A.M. The Potential Use of Near Infrared Spectroscopy (NIRS) to Determine the Heavy Metals and the Percentage of Blends in Tea. Foods 2024, 13, 450. [Google Scholar] [CrossRef] [PubMed]
- Sundaram, J.; Mani, S.; Kandala, C.; Holser, R. Application of NIR Reflectance Spectroscopy on Rapid Determination of Moisture Content of Wood Pellets. Am. J. Anal. Chem. 2015, 6, 923–932. [Google Scholar] [CrossRef]
- Nobahar, A.; Carlier, J.D.; Miguel, M.G.; Costa, M.C. A review of plant metabolites with metal interaction capacity: A green approach for industrial applications. Biometals 2021, 34, 761–793. [Google Scholar] [CrossRef]
- Goncharuk, E.A.; Zagoskina, N.V. Heavy Metals, Their Phytotoxicity, and the Role of Phenolic Antioxidants in Plant Stress Responses with Focus on Cadmium: Review. Molecules 2023, 28, 3921. [Google Scholar] [CrossRef]
- Mititelu, M.; Neacșu, S.M.; Busnatu, S.S.; Scafa-Udriște, A.; Andronic, O.; Lăcraru, A.-E.; Ioniță-Mîndrican, C.-B.; Lupuliasa, D.; Negrei, C.; Olteanu, G. Assessing Heavy Metal Contamination in Food: Implications for Human Health and Environmental Safety. Toxics 2025, 13, 333. [Google Scholar] [CrossRef]
- Scutaras u, E.C.; Trincă, L.C. Heavy Metals in Foods and Beverages: Global Situation, Health Risks and Reduction Methods. Foods 2023, 12, 3340. [Google Scholar] [CrossRef]
- Naccari, C.; Ferrantelli, V.; Cammilleri, G.; Barbaccia, G.; Riolo, P.; Ferrante, M.C.; Procopio, A.; Palma, E. Study of Toxic Metals and Microelements in Honey as a Tool to Support Beekeeping Production and Consumer Safety. Foods 2025, 14, 1986. [Google Scholar] [CrossRef]
- Šerevičienė, V.; Zigmontienė, A.; Paliulis, D. Heavy Metals in Honey Collected from Contaminated Locations: A Case of Lithuania. Sustainability 2022, 14, 9196. [Google Scholar] [CrossRef]
- Godebo, T.R.; Stoner, H.; Taylor, P.; Jeuland, M. Metals in honey from bees as a proxy for environmental contamination in the United States. Environ. Pollut. 2025, 364, 125221. [Google Scholar] [CrossRef]
- Tarapatskyy, M.; Gumienna, A.; Sowa, P.; Kapusta, I.; Puchalski, C. Bioactive phenolic compounds from Primula veris L. Influ. Extr. Cond. Purif. Mol. 2021, 26, 997. [Google Scholar] [CrossRef]
- Czernicka, M.A.; Sowa-Borowiec, P.; Dudek, T.; Cichoński, J.; Puchalski, C.; Chrzanowski, G. Antioxidant capacity of honey enriched by wildflowers. Appl. Sci. 2024, 14, 2018. [Google Scholar] [CrossRef]
- Tripodi, G.; Merlino, M.; Torre, M.; Condurso, C.; Verzera, A.; Cincotta, F. Characterization of aroma, sensory properties, and consumer acceptability of honey from Capparis spinosa L. Foods 2025, 14, 1978. [Google Scholar] [CrossRef]
- Biancolillo, A.; Marini, F.; Ruckebusch, C.; Vitale, R. Chemometric Strategies for Spectroscopy-Based Food Authentication. Appl. Sci. 2020, 10, 6544. [Google Scholar] [CrossRef]
- Escuredo, O.; Carmen Seijo, M.; Salvador, J.; Inmaculada González-Martín, M. Near infrared spectroscopy for prediction of antioxidant compounds in the honey. Food Chem. 2013, 141, 3409–3414. [Google Scholar] [CrossRef]
- Belščak-Cvitanović, A.; Valinger, D.; Benković, M.; Jurinjak Tušek, A.; Jurina, T.; Komes, D.; Gajdoš Kljusurić, J. Integrated approach for bioactive quality evaluation of medicinal plant extracts using HPLC-DAD, spectrophotometric, near infrared spectroscopy and chemometric techniques. Int. J. Food Prop. 2017, 20, S2463–S2480. [Google Scholar] [CrossRef]
- Escuredo, O.; Rodríguez-Flores, M.S.; Meno, L.; Seijo, M.C. Prediction of physicochemical properties in honeys with portable near-infrared (microNIR) spectroscopy combined with multivariate data processing. Foods 2021, 10, 317. [Google Scholar] [CrossRef] [PubMed]
- Rysha, A.; Kastrati, G.; Biber, L.; Sadiku, V.; Rysha, A.; Zogaj, F.; Kabashi-Kastrati, E. Evaluating the physicochemical properties of some Kosovo’s and imported honey samples. Appl. Sci. 2022, 12, 629. [Google Scholar] [CrossRef]
- Johnson, J.B.; Walsh, K.B.; Naiker, M.; Ameer, K. The use of infrared spectroscopy for the quantification of bioactive compounds in food: A review. Molecules 2023, 28, 3215. [Google Scholar] [CrossRef]
- Fodor, M.; Matkovits, A.; Benes, E.L.; Jókai, Z. The role of near-infrared spectroscopy in food quality assurance: A review of the past two decades. Foods 2024, 13, 3501. [Google Scholar] [CrossRef] [PubMed]
- Dufour, E. Principles of infrared spectroscopy. In Infrared Spectroscopy for Food Quality Analysis and Control; Sun, D.-W., Ed.; Academic Press: Burlington, MA, USA, 2009; pp. 1–27. [Google Scholar]
- Abbas, O.; Compère, G.; Larondelle, Y.; Pompeu, D.; Rogez, H.; Baeten, V. Phenolic compound explorer: A mid-infrared spectroscopy database. Vib. Spectrosc. 2017, 92, 111–118. [Google Scholar] [CrossRef]
- Bora, F.D.; Babeş, A.C.; Călugăr, A.; Jitea, M.I.; Hoble, A.; Filimon, R.V.; Bunea, A.; Nicolescu, A.; Bunea, C.I. Unravelling heavy metal dynamics in soil and honey: A case study from Maramures, region, Romania. Foods 2023, 12, 3577. [Google Scholar] [CrossRef]
- Daci-Ajvazi, M.; Mehmeti, A.; Zeneli, L.; Daci, N. Evaluation of antioxidant activity, heavy metals and colour intensity of honeys from different parts of Kosovo. J. Environ. Prot. Ecol. 2017, 18, 737–748. [Google Scholar]
- Guindo, M.L.; Kabir, M.H.; Chen, R.; Liu, F. Potential of Vis-NIR to measure heavy metals in different varieties of organic-fertilizers using Boruta and deep belief network. Ecotoxicol. Environ. Saf. 2021, 228, 112996. [Google Scholar] [CrossRef] [PubMed]
- Vaudour, E.; Cerovic, Z.G.; Ebengo, D.M.; Latouche, G. Predicting Key Agronomic Soil Properties with UV-Vis Fluorescence Measurements Combined with Vis-NIR-SWIR Reflectance Spectroscopy: A Farm-Scale Study in a Mediterranean Viticultural Agroecosystem. Sensors 2018, 18, 1157. [Google Scholar] [CrossRef] [PubMed]
- Wong, C.; Roberts, S.M.; Saab, I.N. Review of regulatory reference values and background levels for heavy metals in the human diet. Regul. Toxicol. Pharmacol. RTP 2022, 130, 105122. [Google Scholar] [CrossRef]
- Aghamirlou, H.M.; Khadem, M.; Rahmani, A.; Sadeghian, M.; Mahvi, A.H.; Akbarzadeh, A.; Nazmara, S. Heavy metals determination in honey samples using inductively coupled plasma-optical emission spectrometry. J. Environ. Health Sci. Eng. 2015, 13, 39. [Google Scholar] [CrossRef]


Disclaimer/Publisher’s Note: The statements, opinions and data contained in all publications are solely those of the individual author(s) and contributor(s) and not of MDPI and/or the editor(s). MDPI and/or the editor(s) disclaim responsibility for any injury to people or property resulting from any ideas, methods, instructions or products referred to in the content. |
© 2025 by the authors. Licensee MDPI, Basel, Switzerland. This article is an open access article distributed under the terms and conditions of the Creative Commons Attribution (CC BY) license (https://creativecommons.org/licenses/by/4.0/).