Abstract
The thermal insulation performance of liquid hydrogen (LH2) storage tanks is critical for long-distance transportation. The active cooled shield (ACS) technologies, such as the liquid nitrogen cooled shield (LNCS) and the vapor hydrogen cooled shield (VHVCS) are important thermal insulation methods. Many researchers installed the VHVCS inside the multilayer insulation (MLI) and obtained the optimal position. However, the MLI layer is often thinner than the vacuum interlayer between the inner and outer tanks, and there is a large vacuum interlayer between the outermost side of MLI and the inner wall of the outer tank. It is unknown whether the insulation performance can be improved if we install ACS in the mentioned vacuum interlayer and separate a portion of the MLI to be installed on the outer surface of ACS. In this configuration, the number of inner MLI (IMLI) layers and the ACS position are interdependent, a coupling that has not been thoroughly investigated. Therefore, thermodynamic models for MLI, MLI-LNCS, and MLI-VHVCS schemes were developed based on the Layer-by-Layer method. By applying Robin boundary conditions, the temperature distribution and heat leakage of the MLI scheme were predicted. Considering the coupled effects of IMLI layer count and ACS position, a co-optimization strategy was adopted, based on an alternating iterative search algorithm. The results indicate that for the MLI-LNCS scheme, the optimal number of IMLI layers and LNCS position are 36 layers and 49%, respectively. For the MLI-VHVCS scheme, the optimal values are 21 layers and 39%, respectively. Compared to conventional MLI, the MLI-LNCS scheme achieves an 88.09% reduction in heat leakage. However, this improvement involves increased system complexity and higher operational costs from LN2 circulation. In contrast, the MLI-VHVCS scheme achieves a 62.74% reduction in heat leakage, demonstrating that using sensible heat from cryogenic vapor can significantly improve the thermal insulation performance of LH2 storage tanks. The work of this paper provides a reference for the design and optimization of the insulation scheme of LH2 storage tanks.
1. Introduction
Mitigating climate change and environmental pollution has become a global priority [1,2], with the acceleration of the energy transition emerging as a strategic response to global energy challenges [3]. Hydrogen energy, as a clean and carbon-neutral alternative, offers abundant availability and broad applicability. As an energy carrier, hydrogen enables large-scale grid balancing, inter-seasonal, and cross-regional energy storage and supports decarbonization across the industrial, construction, and transportation sectors [4,5,6]. Primary applications of hydrogen include synthetic fuels for aviation propulsion [7], fuel cell systems [8], feedstocks for chemical synthesis [9], and thermal energy carriers in building heating systems [10]. The global hydrogen industry is undergoing rapid industrialization, with growing demand anticipated for large-scale applications. Regarding hydrogen storage and transportation, high-pressure gaseous storage remains the most mature technology, although it suffers from limitations in volumetric density and transportation range. Cryogenic LH2 storage and transportation offer superior performance, providing up to ten times the transport capacity while enhancing operational efficiency and reducing costs. Consequently, LH2 emerges as the optimal solution for large-scale industrial deployment, improving regional resource allocation and utilization efficiency.
During the transportation of LH2 by storage tanks, the significant temperature gradient of approximately 280 K between the LH2 and the ambient environment necessitates advanced thermal insulation technologies. Cryogenic insulation, a passive thermal protection method, typically employs a double-walled tank design with an evacuated annular space between the inner and outer walls. The vacuum interlayer is commonly filled with MLI materials to minimize heat leakage into the inner tank. Vacuum MLI is the most critical and widely adopted technology among cryogenic insulation schemes. It is extensively applied in cryogenic engineering fields, including cryogenic fluid storage, aerospace systems, and scientific research.
Many scholars have investigated cryogenic insulation schemes. Cunnington [11] modeled MLI as a continuous homogeneous medium, considering only radiative and conductive heat transfer. Jacob et al. [12] experimentally investigated the relationship between MLI’s effective thermal conductivity and the number of radiation shield layers. The results showed that the thermal conductivity reaches a minimum at approximately 40 layers, and heat leakage is minimized at 50 layers. Therefore, the MLI scheme with 40–50 radiation shield layers is optimal for cryogenic storage tanks operating below 77 K. McIntosh [13] developed the Layer-by-Layer and Lockheed methodologies for modeling MLI heat transfer. Bapat [14] analyzed MLI heat transfer models, demonstrating that residual gas conduction becomes non-negligible when the interlayer pressure falls below 1.33 × 10⁻² Pa. Krishnaprakas [15] evaluated MLI insulation performance using empirical models. Daryabeigi [16] predicted MLI behavior across 300–1300 K using anisotropic scattering and gray-medium assumptions within a two-flux radiation model. Johnson [17,18] optimized MLI layer density, identifying 26 layers/cm as optimal under boundary conditions of 77 K (cold boundary) and 305 K (hot boundary). The analysis indicated solid conduction dominating the cold, and radiation dominating the hot, boundary. Wang et al. [19] found that in a 40-layer MLI scheme with a density of 20 layers/cm, the first 15 layers near the cold boundary account for over 98% of total entropy generation from solid conduction, thermal radiation, and residual gas conduction. Hastings et al. [20] employed an 18 m3 Multipurpose Hydrogen Test Bed (MHTB) to demonstrate 45-day orbital storage feasibility using 45-layer MLI (double-aluminized polyester film with Dacron spacers), achieving a heat flux of 0.22 W/m2 at 305 K. Li et al. [21] observed a heat flux reduction from 1.947 W/m2 to 0.5246 W/m2 when increasing the number of radiation shields from 10 to 30 layers, with diminishing returns beyond 50 layers. Camplese et al. [22] evaluated polyester-based MLI under fire conditions, observing rapid thermal performance degradation in LH2 tank scenarios. Wang et al. [23] analyzed the effects of radiation shield position, emissivity, and the radiative properties of fibrous materials on MLI performance. Their results indicated that placing the shield closer to the thermal boundary enhances insulation, with distinct mechanisms observed on the upper and lower surfaces. Rahman et al. [24] applied machine learning methods to predict MLI’s effective thermal conductivity (0.019–0.266 mW/(m·K)), identifying material type, vacuum level, and layer density as key parameters under fixed boundary conditions.
With advances in cryogenic insulation technologies, researchers have proposed ACS technologies that introduce external cryogens or cryogenic vapor from the storage tank into the vacuum interlayer through coiled pipes to cool the thermal shield. These shields act as cryogenic barriers, further suppressing radiative heat transfer within the interlayer [25]. Typical ACS technologies include the LNCS and VHVCS. The LNCS integrates LN2 into the insulation scheme, using its latent heat of vaporization (with a daily boil-off rate of 10–15%) [26] to absorb heat leakage and improve thermal insulation performance. The VHVCS utilizes the significant sensible cooling capacity of cryogenic vapor extracted from the tank, recovering this energy to enhance insulation performance and reduce the boil-off rate of the stored medium. Therefore, the effectiveness of VHVCS insulation is primarily determined by the ratio of sensible to latent heat in the cryogenic vapor; a higher ratio enables greater recovery of sensible cooling energy [27,28]. The NIST database provides the latent and sensible heat values of LH2 at different temperatures. Figure 1 shows the sensible-to-latent heat ratio for LH2 vapor. At 300 K, this ratio reaches 7.8, suggesting that incorporating VHVCS into the LH2 storage tank insulation scheme can harness its cooling potential more effectively. By combining MLI with ACS, two composite insulation schemes are derived: MLI-LNCS and MLI-VHVCS.
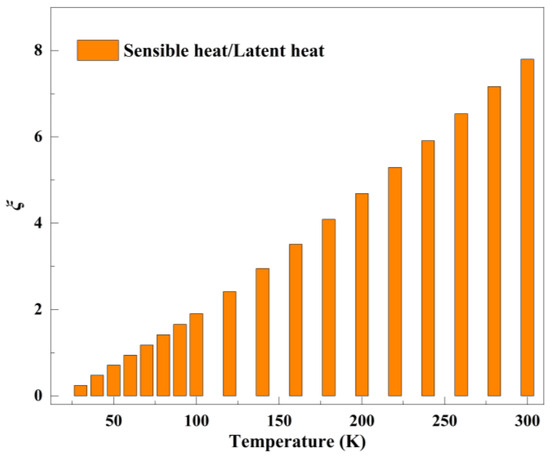
Figure 1.
Ratio of sensible heat to latent heat of LH2.
Regarding VHVCS combined MLI insulation, Zheng [27] conducted optimization research on VHVCS integrated with MLI insulation for LH2 storage tanks. Compared to without-VHVCS configurations, single-layer VHVCS reduces heat leakage by 50.16%, while a double-layer VHVCS achieves a 59.44% reduction. Zheng [28] found that increasing the number of VHVCS layers from one to three led to heat leakage reductions of 57.36%, 65.29%, and 68.21%, respectively. Jiang [29] investigated the effect of VHVCS position on insulation performance in LH2 and LN2 storage tanks. Sana Syed [30] employed a finite-difference method to evaluate the effects of VHVCS quantity, shield location, net boil-off rate, and Dewar neck size on insulation performance. Zheng’s analysis [31] identified optimal VHVCS position at 50% of the cold wall distance for uniform-density MLI (83.12% heat leakage reduction) and 30% for variable-density MLI (66.32% heat leakage reduction). Chen [32] used a cryocooler to condense boil-off gas from the cooled shield and a 55 L LH2 tank, finding that total vapor condensation requires 14.4 W with an LNCS and 121.7 W without it. Chato et al. [33] concluded that no more than three VHVCS layers should be used, and that installing VHVCS closer to the cold boundary yields better insulation performance. Babac et al. [34] developed a 2D model to evaluate insulation performance in LH2 tanks, finding 59% and 60% reductions in heat flux for single and dual VHVCS configurations, respectively. Kim et al. [35] compared three combinations of MLI and VHVCS to optimize VCS arrangement, revealing that a series-arranged dual-VHVCS configuration improves insulation performance by approximately 16% over a parallel configuration. Xu et al. [36] developed a thermodynamic model coupling variable-density MLI with ortho-para hydrogen conversion and VHVCS, achieving a 56.44% maximum heat leakage reduction when installing VHVCS within an optimized 43-layer configuration.
Zhu et al. [37] proposed a coupled model to analyze the influence of coiled-tube structures on VHVCS insulation performance. The results showed that increasing the diameter and number of coiled tubes enhances heat transfer between the VHVCS coils and the MLI scheme, achieving 32.04% and 49.14% reductions in heat leakage, respectively. Moreover, the maximum temperature gradient across VHVCS remains below 1 K, indicating a near-uniform temperature distribution. Sun et al. [38] developed a quasi-two-dimensional thermodynamic model for NASA’s LH2 storage systems, incorporating variable-density MLI and VHVCS insulation. They found that optimizing the VHVCS position can reduce MLI’s average temperature gradient and decrease the daily boil-off rate by 69.73%. Li et al. [39] established a heat transfer model for MLI-VHVCS insulation, optimizing the dimensionless VHVCS position and the mass flow rate. The optimal VCS position was found to range from 0.489 to 0.533. Lv et al. [40] designed an MLI-VHVCS insulation scheme for LH2 tanks, incorporating para-to-orthohydrogen (PeO) conversion catalysts. The results revealed that a dual-VHVCS configuration reduces heat leakage by 25.6% compared to a single-VHVCS configuration. Li et al. [41] constructed a transient self-pressurization model for LH2 tanks, coupling fluid heat and mass transfer with MLI-VHVCS conduction. Optimal VCS positions were identified at 0.622 for single-VHVCS and 0.333/0.644 for dual-VHVCS configurations. Liang et al. [42] considered the influence of periodic space radiation and proposed a transient thermodynamic model for LH2 tanks with integrated MLI-VHVCS insulation. The results showed a 77% reduction in heat leakage with VHVCS integration. Leng et al. [43] evaluated the insulation performance of the LH2 storage system combining solid oxide fuel cells, MLI, VHVCS, and continuous para-orthohydrogen conversion. Optimization demonstrated a 9.1% improvement in dual-VHVCS over single-VHVCS configurations. Jiang et al. [44] developed a thermodynamic model for coupled VHVCS insulation in LH2–LO2 combined tanks, analyzing optimal VCS position and temperature distribution. Compared with the non-VHVCS scheme, single-VHVCS integration reduced heat flux by 64.0% in LH2 tanks and 54.8% in LO2 tanks. Shi et al. [45] developed a composite insulation scheme of variable-density MLI and VHVC, investigating factors affecting performance. Single-VHVCS reduced heat leakage by 61.1%, while multiple VHVCS achieved up to 79.9% reduction. Wang et al. [46] proposed and optimized an integrated cryogenic energy utilization scheme combining LNG and LH2 cooling shields with MLI for dual-fuel heavy-duty trucks, in which the optimized shield placement reduced the daily boil-off rates of LNG and LH2 tanks by 60.2% and 26.8%, respectively, while extending their dormancy periods.
Based on the aforementioned studies, research on MLI schemes for cryogenic tanks (e.g., LN2, LNG, and LH2) has achieved a relatively mature stage. Significant efforts have focused on analyzing heat transfer mechanisms, assessing vacuum level effects, optimizing layer densities, and improving insulation schemes. Currently, integrating ACS with MLI has become a research hotspot, with an emphasis on optimizing shield position. For instance, Zheng [24] researched the VHVCS position in LH2 storage tanks, determining the optimal installation position. Although the reported work can guide our study with modeling, thermal insulation analysis, and ACS position optimization, there are still several issues that need to be addressed: (1) in existing studies, many researchers installed the VCS inside MLI and obtained the optimal installation position. However, the MLI layer is often thinner than the vacuum interlayer between the inner and outer tanks, and there is a large vacuum interlayer between the outermost side of MLI and the inner wall of the outer tank. It is unknown whether the insulation performance can be improved if we install ACS in the mentioned vacuum interlayer and separate a portion of the MLI to be installed on the outer surface of ACS. However, there are no research reports on this issue. (2) In this case, the number of MLI layers inside and outside of the ACS are interdependent of the position of the ACS. Thus, a co-optimization approach is required to address the coupling problem. (3) Unlike the VHVCS, which utilizes the sensible heat of cryogenic vapor, the LNCS relies on the latent heat of LN2 for insulation. However, a quantitative comparison between the performance of LNCS and VHVCS remains lacking.
This study addressed the aforementioned issues by focusing on a 300 m3 LH2 storage tank. It established thermodynamic models for MLI, MLI-LNCS, and MLI-VHVCS schemes based on the Layer-by-Layer method. The MLI schemes’ temperature distribution and heat leakage were numerically predicted using MATLAB R2018a software (MathWorks, Natick, MA, USA) by applying Robin boundary conditions. As the core innovation of the paper, we, for the first time, in this study took into account the coupled effect between the ACS position and the inner-layer MLI, and proposed an alternating iterative search method to co-optimize the ACS installation position and the number of IMLI layers for both MLI-LNCS and MLI-VHVCS schemes. Finally, the insulation performance of the three schemes was quantitatively compared.
The paper is organized as follows: Section 2 introduces the basic parameters of the LH2 storage tank. Section 3 presents the thermodynamic model with Robin boundary conditions and validates the model. Section 4 discusses temperature distribution, thermal resistance, and heat leakage in MLI, along with the co-optimization results of the optimal cooled shield position and the number of MLI layers on both sides of the cooled shield for MLI-LNCS and MLI-VHVCS schemes. Section 5 concludes the paper.
2. LH2 Storage Tank and Insulation System
Chen [47] designed a 300 m3 transportable LH2 storage tank, which was certified by the National Quality Supervision and Inspection Center for Cryogenic Vessels. The tank was designed with an operating pressure of 0.66 MPa. The inner tank is made of S32168 stainless steel, with a diameter of 4.2 m and a cylindrical length of 20.184 m. The outer tank is constructed from 16MnDR cryogenic steel, with a diameter of 4.8 m and a cylindrical length of 21.148 m. The tank was designed with a daily boil-off rate of 0.25%. The tank employs an MLI scheme for thermal insulation, with the vacuum interlayer alternately wrapped with 80 insulation layers at a density of 25 layers/cm. The radiation shields consist of double-sided aluminized films, and the spacers are made of alkali-free glass cloth. The inner and outer tanks are connected by a leg-type support structure, with each support pipe measuring 1.944 m in length and having a cross-sectional area of 0.02089 m2. The support structure is also S32168 stainless steel, consistent with the inner tank material. The tank’s piping system consists of six S32168 stainless steel pipes, with lengths ranging from 4.2 m to 7 m. It should be noted that the material of the MLI scheme and the number of layers of the reflector in our study are consistent with those of Chen [47]. Meanwhile, the structure and size of the support system and pipeline are the same as those of Chen [47]. The paper mainly focuses on the optimization of the insulation scheme.
3. Thermodynamic Model and Experimental Verification
3.1. Assumptions
The following reasonable assumptions were made in this study.
- (1)
- The absorption effect of spacers in MLI materials on radiative heat transfer was neglected.
- (2)
- Due to the high vacuum level within the MLI, convection caused by residual gas was neglected.
- (3)
- Thermal expansion and delamination between the MLI materials were not considered.
- (4)
- The internal pressure of the LH2 storage tank was maintained at 0.1 MPa with a temperature stabilized at 20 K.
- (5)
- The paper mainly focused on the condition where the ACS and coil reach steady state; that is, the temperature of the ACS was equal everywhere, without considering the temperature difference in ACS.
3.2. Thermodynamic Model of MLI and MLI-ACS
3.2.1. Thermodynamic Model of MLI
The thermodynamic model of the MLI scheme consists of three components: the heat transfer model between the inner and outer tank walls, the MLI heat transfer model, and the heat transfer model of the vacuum interlayer between the inner and outer tanks. Figure 2 shows schematic diagrams of MLI and MLI-ACS heat transfer mechanisms and temperature node divisions. In the MLI-LNCS/MLI-VHVCS schemes, installing LNCS or VHVCS divides the MLI into the outer MLI (OMLI) and the inner MLI (IMLI). The sum of insulation layers for the IMLI and OMLI equals that of MLI layers; in other words, the number of the IMLI layer increases when that of the OMLI decreases.
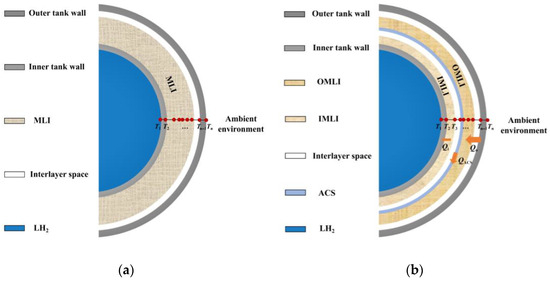
Figure 2.
Schematic diagram of the MLI and MLI-ACS heat transfer mechanisms. (a) MLI; (b) MLI-LNCS and MLI-VHVCS.
- (1)
- Heat transfer model of tank wall
Based on the one-dimensional steady-state Fourier’s law, the heat transfer model for the inner and outer tank walls was established. The heat leakage through the inner tank wall (QITW) and the outer tank wall (QOTW) were calculated using Equation (1) and Equation (2), respectively.
where LT is the length of the tank, including the equivalent cylindrical length of the head, m; λITW and λOTW are the thermal conductivity of the inner and outer tank walls, respectively, W/(m·K); T1 and T2 are the temperatures of the inner and outer surfaces of the inner tank wall, respectively, K; Tn−1 and Tn are the temperatures of the inner and outer surfaces of the outer tank wall, respectively, K; DITW,I and DITW,O are the inner and outer diameters of the inner tank wall, respectively, m; DOTW,I and DOTW,O are the inner and outer diameters of the outer tank wall, respectively, m.
- (2)
- Heat transfer model of MLI
The total heat leakage through the MLI (QMLI) comprises radiative heat transfer (QR), solid conduction (QS), and residual gas conduction (QG), as expressed in Equation (3).
- -
- Radiative heat transfer
The radiative heat transfer between the ith and (i − 1)th radiation shields within the MLI scheme was calculated using Equation (4).
where σ is the Stephan–Boltsman constant, with a value of 5.675 × 10⁻⁸ W/(m2·K4); Ti and Ti−1 are the temperatures of the ith and (i − 1)th radiation shields, respectively, K; and are the diameters at the insulation material positions of the ith and (i − 1)th layer, respectively, m; εi and εi−1 are the emissivities of the ith and (i − 1)th radiation shields, respectively. The emissivity of the radiation shields is temperature-dependent [19] and can be calculated using Equation (5).
- -
- Solid conduction
The solid conduction in MLI includes conduction through the radiation shields, conduction from the radiation shields to the spacers, and conduction through the spacers. According to the principles of solid heat transfer, the solid conduction in MLI was calculated using Equation (6).
where C is the empirical constant, with a value of 0.008; f is the relative density of the spacer material compared to the solid materials; and k is the thermal conductivity of the spacer material, W/(m·K).
- -
- Residual gas conduction
The vacuum level inside MLI materials is typically 10−3 Pa, corresponding to a Knudsen number (Kn) greater than 10, which indicates that the residual gas is in the free molecular regime. Therefore, the residual gas conduction was calculated using the Corruccini Equation (7) [48].
where p is the vacuum pressure between the radiation shields, Pa; α is the thermal accommodation coefficient, 0.9; R is the gas constant, 8.314 J/(mol·K); M is the molar mass of gas, g/mol; γ = cp/cv, cp is the isobaric specific heat and cv is the isochoric specific heat, J/(kg·K); and Ta is the ambient temperature, K.
- (3)
- Heat transfer model of interlayer
The interlayer between the MLI materials and the inner wall of the outer tank is typically in the free molecular regime. Therefore, the interlayer’s heat transfer includes radiative heat transfer and residual gas conduction. The total heat transfer rate through the interlayer (QVL) was calculated using Equation (8), the radiative heat transfer (QVLR) was calculated using Equation (9), and the residual gas conduction (QVLG) was calculated using Equation (10).
To facilitate the solution and analysis of the heat transfer model, this section developed a thermal resistance model for the MLI insulation scheme, based on fundamental heat transfer principles and the previously established heat transfer models. The total thermal resistance (RT) of the MLI is the series–parallel combination of all thermal resistances along the heat transfer path. Figure 3 shows the schematic diagram of the MLI scheme thermal-resistance model.
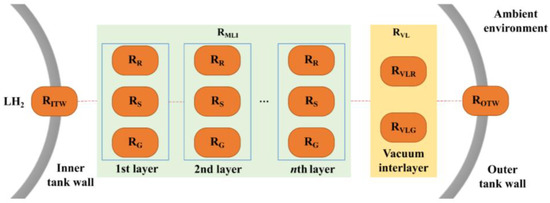
Figure 3.
Schematic diagram of the MLI scheme thermal-resistance model.
It can be seen that the thermal resistance of MLI (RMLI) is obtained through the parallel and series combinations of the radiative thermal resistance between adjacent radiation shields (RR), the solid conduction thermal resistance (RS), and the residual gas conduction thermal resistance (RG), as expressed in Equation (11). The thermal resistance of the vacuum interlayer (RVL) was obtained by combining the radiative thermal resistance (RVLR) and the residual gas conduction thermal resistance (RVLG) in parallel, as expressed in Equation (12).
Based on this, the overall thermal resistance model corresponding to the established heat transfer model was obtained by connecting the inner tank-wall thermal resistance (RITW), the MLI thermal resistance (RMLI), the vacuum interlayer thermal resistance (RVL), and the outer tank-wall thermal resistance (ROTW) in series, as expressed in Equation (13).
The thermal resistance of the inner tank wall (RITW) and outer tank wall (ROTW) can be determined based on the definition of thermal resistance. In cylindrical coordinates, RITW and ROTW were calculated using Equations (14) and (15), respectively.
RMLI was obtained by combining RR, RS, and RG in parallel. RR, RS, and RG were calculated using Equations (16)–(18), respectively.
RVL was obtained by combining RVLR and RVLG in parallel. RVLR and RVLG were calculated using Equations (19) and (20).
3.2.2. Thermodynamic Model of MLI-LNCS/MLI-VHVCS
In the MLI-LNCS/MLI-VHVCS schemes, installing LNCS or VHVCS divides the MLI into the outer MLI (OMLI) and the inner MLI (IMLI). The heat transfer through the IMLI corresponds to the heat leakage from the inner storage tank. Figure 2b shows the heat transfer schematic and temperature node division for MLI-LNCS/MLI-VHVCS.
According to the heat transfer path, the environmental heat (QOML) leakage through the OMLI scheme (including thermal bridges such as support systems and piping) is partially absorbed (QACS) by the cryogenic vapor in the ACS. The remaining heat (QIMLI) enters the inner tank, directly contributing to LH2 evaporation. Figure 4 shows the schematic diagram of MLI-LNCS/MLI-VHVCS schemes.
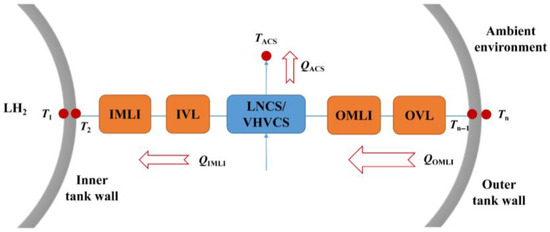
Figure 4.
Schematic diagram of MLI-LNCS/MLI-VHVCS schemes.
Based on the principles and assumptions of ACS insulation technology, the thermodynamic model for MLI-LNCS/MLI-VHVCS insulation schemes was established according to the energy conservation principle, as shown in Equation (21).
where QOMLI is the heat leakage from the environment through OMLI to the ACS, W; QIMLI is the heat leakage through IMLI to the inner tank, W; and QACS is the heat absorbed by the ACS, W.
- (1)
- Heat transfer in OMLI
The total heat leakage to the ACS (QOMLI) comprises two components: the heat leakage through the insulation scheme and the heat leakage through the thermal bridges, as shown in Equation (22).
where QOMLI1 is the heat transfer through OMLI into the ACS, W, and QOMLI2 is the heat transfer through thermal bridges into OMLI to the ACS, W. QOMLI1 can be calculated using the MLI heat transfer model, while the calculation method for QOMLI2 will be presented subsequently.
- (2)
- Heat leakage through IMLI
Among the total heat leakage into the ACS, the ACS absorbs QACS, and the remaining heat (QIMLI) leaks into the inner tank of the LH2 storage tank. QIMLI was calculated using Equation (23).
where QIMLI1 is the heat leakage through IMLI into the inner tank, W, and is calculated using the MLI heat transfer model; QIMLI2 is the heat leakage through thermal bridges into IMLI to the inner tank, W, with the calculation method to be presented subsequently.
- (3)
- Heat absorption by LNCS
For the LNCS, the latent heat of LN2 is used to absorb the heat flowing into ACS, shown in Equation (24). Here, to take into account both heat leakage and LN2 flow rate, the normalization was performed using dimensionless parameters, given the distinct physical dimensions of heat leakage and LN2 flow rate. Equations (25) and (26) defined the normalization formulations for the MLI heat leakage and the upper limit of the LN2 flow rate, respectively. On this basis, a dimensionless parameter, η, was introduced, as defined by the expression in Equation (27).
where m is the mass flow rate of the LN2 in the ACS, kg/s; ∆H is the latent heat of vaporization of LN2 J/kg; and Q*, m* and η are dimensionless parameters.
- (4)
- Heat absorption by VHVCS
For the VHVCS, the absorbed heat QACS was calculated from the enthalpy difference between the inlet and outlet of the ACS coil. Therefore, QACS is expressed by Equation (28). Equation (29) is the ratio of the sensible heat to the latent heat of LH2.
where m is the mass flow rate of the cryogenic hydrogen gas in the ACS, kg/s; h1 and h2 are the enthalpies of the cryogenic vapor at the inlet and outlet of the ACS coil, respectively, J/kg; QSEN is the sensible heat of the cryogenic vapor, J/kg; ∆H is the latent heat of vaporization of LH2, J/kg; and ξ(T) is the temperature-dependent ratio of sensible heat to latent heat, as given by Equation (30).
Figure 5 shows the schematic diagram of the thermal resistance model of the MLI-LNCS/MLI-VHVCS schemes. Analysis reveals that the thermal resistance of the MLI-LNCS/MLI-VHVCS schemes is essentially the superposition of MLI thermal resistances. Specifically, on the inner side of the ACS, the MLI heat transfer model with cold and hot boundaries at LH2 temperature and ACS temperature, respectively, follows. On the outer side, the ACS also follows the MLI heat transfer model with cold and hot boundaries at ACS and ambient temperatures, respectively.
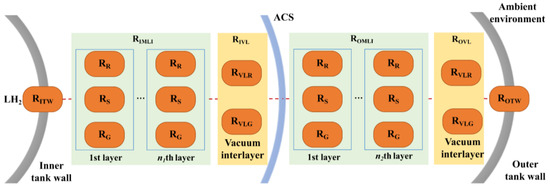
Figure 5.
Schematic diagram of the thermal resistance model of the MLI-LNCS/MLI-VHVCS schemes.
3.2.3. Thermodynamic Model of Thermal Bridge
The support structure and piping system (including fill/discharge pipes, vent pipes, external pressurization pipes, self-pressurization pipes, upper/lower pressure measurement pipes, and liquid-air separation feed pipes) of the LH2 storage tank constitute major thermal bridges.
- (1)
- Thermal bridge model of support system
The heat transfer mechanism in the support system is thermal conduction. Within the MLI insulation scheme, the cold boundary of the support-system thermal bridge is at LH2 temperature, while the hot boundary is at ambient temperature. Under the great temperature difference, the thermal conduction mechanism dominates. The thermal resistance of the support system in the studied 300 m3 LH2 storage tank is given by Equation (31).
where Qsup is the heat leakage through the support-system thermal bridge, W; Ssup is the cross-sectional area of the support-system thermal bridge, m2; Lsup is the length of the support-system thermal bridge, m; Rsup is the thermal resistance of the support-system thermal bridge, K/W; Tn and T1 are the temperatures of the hot and cold boundaries, respectively, K; and λH and λL are the integral thermal conductivities at hot and cold boundaries, W/(m·K), calculated using Equations (32) and (33).
For MLI-LNCS/MLI-VHVCS insulation schemes, the installation of ACS forms a cryogenic barrier that divides the support-system thermal bridge into two parts: the inner ACS thermal bridge and the outer ACS thermal bridge. The thermal resistances of the inner and outer ACS thermal bridges were calculated using Equations (34) and (35), respectively.
where Qisup and Qosup are the heat leakage through the inner and outer ACS thermal bridges, respectively, W; Risup and Rosup are the thermal resistances of the inner and outer ACS thermal bridges, K/W; and χ is the position percentage of ACS in the insulation space (0 to 1), where 0 indicates ACS at the cold boundary, 1 at the hot boundary, and 0.5 at 50% position. λACS is the integral thermal conductivity at ACS temperature, W/(m·K), calculated using Equation (36). This paper establishes a temperature-dependent function f(TACS) for the integral thermal conductivity at ACS temperature.
- (2)
- Thermal bridge model of piping system
Like the support-system thermal bridge, the heat transfer mechanism in the piping system is thermal conduction. Within the MLI insulation scheme, the cold and hot boundaries of the piping-system thermal bridge are at LH2 temperature and ambient temperature, respectively. The piping system of the 300 m3 LH2 storage tank studied in this paper includes six pipelines. The thermal resistance of the piping-system thermal bridge is given by Equation (37).
where Qpipe is the heat leakage through the piping-system thermal bridge, W; Spipe,j is the cross-sectional area of the jth pipe thermal bridge, m2; Lpipe,j is the length of the jth pipe thermal bridge, m; Rpipe is the thermal resistance of the piping system, K/W; and j represents the number of each pipe.
For MLI-LNCS/MLI-VHVCS insulation schemes, the ACS installation divides the piping thermal bridge into two parts: the inner VCS piping thermal bridge and the outer VCS piping thermal bridge. The thermal resistances of the inner and outer ACS piping thermal bridges were calculated using Equations (38) and (39), respectively.
where Qipipe and Qopipe are the heat leakage through the inner and outer ACS piping thermal bridges, respectively, W; and Ripipe and Ropipe are the thermal resistances of the inner and outer ACS piping thermal bridge, respectively, K/W.
3.3. Boundary Conditions and Calculation Procedure
This paper applied the Robin boundary condition to solve the heat transfer model. The convective heat transfer boundary condition is expressed in Equation (40).
where hW is the heat transfer coefficient between the outer tank wall and environment, W/(m2·K).
Consequently, the relationship among the outer wall temperature, convective heat transfer coefficient, and ambient temperature in cylindrical coordinates is expressed by Equation (41).
The calculation adopts forced convection boundary conditions, with the surface heat transfer coefficient (hW) calculated using Equation (42).
where Nu is the Nusselt number, representing the dimensionless temperature gradient on the outer tank wall; and λamb is the thermal conductivity of air, W/(m·K).
Forced convection heat transfer mode was considered for the outer wall of the storage tank [49], and the Churchill–Bernstein correlation for forced convection over a single cylinder was employed to calculate the Nusselt number. Equation (43) shows the forced convection correlation.
where Re is the Reynolds number, which measures the ratio of inertial forces to viscous forces. The shipping speed of transport tanks typically ranges between 5 and 15 knots. For conservative reasons, a speed of 15 knots (7.7167 m/s) is adopted as the environmental wind speed. Pr is the Prandtl number, which measures the ratio of momentum diffusivity to thermal diffusivity.
The heat transfer model was solved iteratively using MATLAB, incorporating the aforementioned boundary conditions. The basic parameters were initially set, temperature nodes were divided, and boundary conditions were defined, including the cold boundary at 20 K (LH2 temperature) and the hot boundary at 300 K (ambient temperature, based on a sea surface range of 271–303 K). Convective boundary conditions were also applied. A linear initial temperature distribution across the MLI was assumed. The key basic parameters were shown in Table 1. Based on this assumption, the thermal resistance of each insulation layer and the total MLI thermal resistance were calculated. The temperature distribution was then updated using Equation (44), and the iterative process continued until convergence was achieved. The convergence criteria are the following: (1) the maximum residual of the temperature distribution between adjacent iterations is less than 0.001 K. (2) The relative deviation between the heat leakage through the outer tank wall and the MLI heat leakage is within 1%.
where Ti is the temperature at the current node, K; T1 and Tn are the cold- and hot-boundary temperatures, respectively, K; and ∑Ri is the cumulative thermal resistance up to the current node, K/W.

Table 1.
Key basic parameters.
Based on the obtained temperature distribution, the heat leakage through the support system and piping system was calculated, ultimately determining the total heat leakage of the LH2 storage tank. The material configuration of the MLI-LNCS/MLI-VHVCS insulation schemes remained consistent with that of the MLI scheme, and the ACS was made of copper. In the iterative solution process, the position of the VCS was first specified, and an initial temperature was assumed. Then, each heat transfer term in the energy balance equation was calculated to determine the heat leakage into the inner tank. This process was repeated for each installation position until the convergence criterion (∆QVCS < 0.5%) was satisfied. The calculation flow chart is shown in Figure 6.
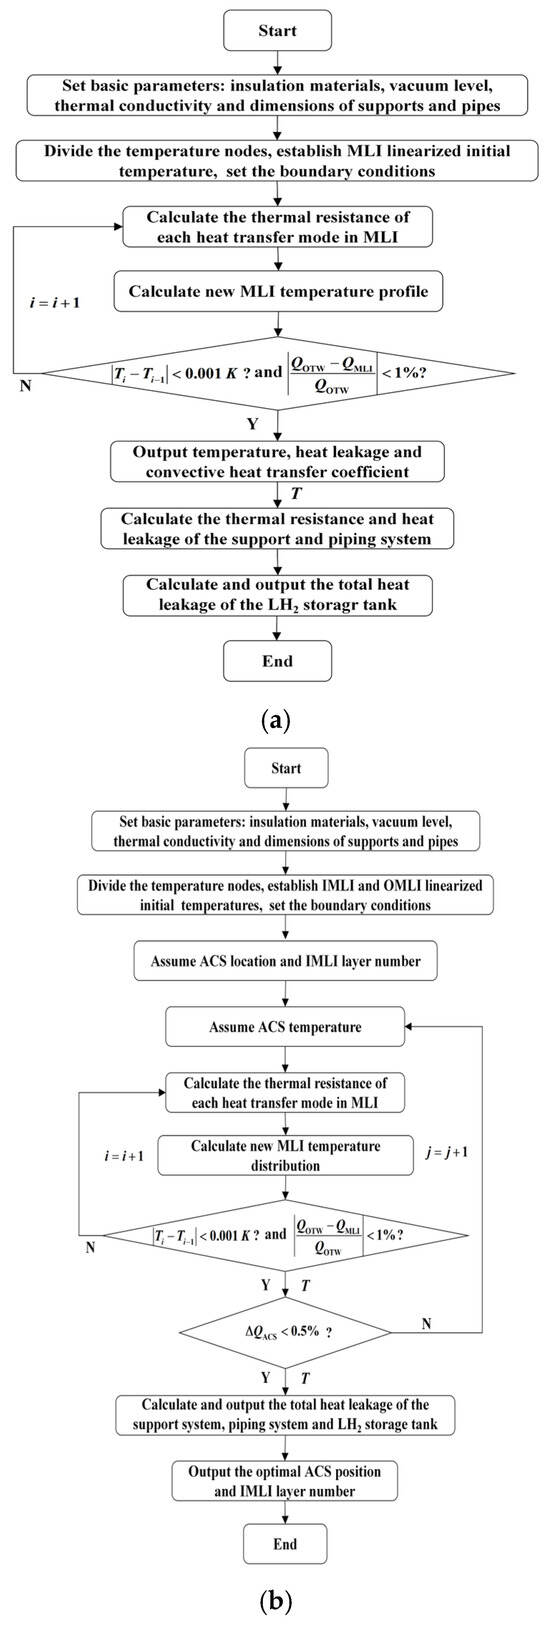
Figure 6.
Flowchart for calculation procedure. (a) Flowchart for solving the MLI heat transfer model; (b) Flowchart for solving the MLI-ACS heat transfer model.
3.4. Experimental Validation
This paper’s MLI heat transfer model was validated using experimental results from Stoch et al. [50] at the Lewis Research Center. They conducted a series of experiments to investigate the thermal performance of MLI under LH2 temperature conditions. The experiment system included a measurement tank between two guard tanks, with an overall diameter of 762 mm and a height of 1900 mm. The guard tanks were designed to eliminate heat flow through the ends of the measurement tank and minimize edge effects on heat transfer measurements. The experiment system was installed in a spherical vacuum chamber with a diameter of 7610 mm to reduce heat transfer via gas conduction and convection. The insulation system of the experiment setup comprised 20, 40, 60, and 100 layers of aluminized polyester films with fiberglass spacers. The calorimeter was made of a 12.7 mm thick 1100 aluminum alloy. All tests were conducted with a cold-boundary temperature of 20.9 K. Detailed experimental procedures can be found in the reference.
Given that the 300 m3 LH2 storage tank in this paper used an 80-layer MLI, the experimental temperature distributions for 20, 40, 60, and 100 MLI layers were sequentially used to validate the developed heat transfer model. Figure 7 shows the experimental validation results.
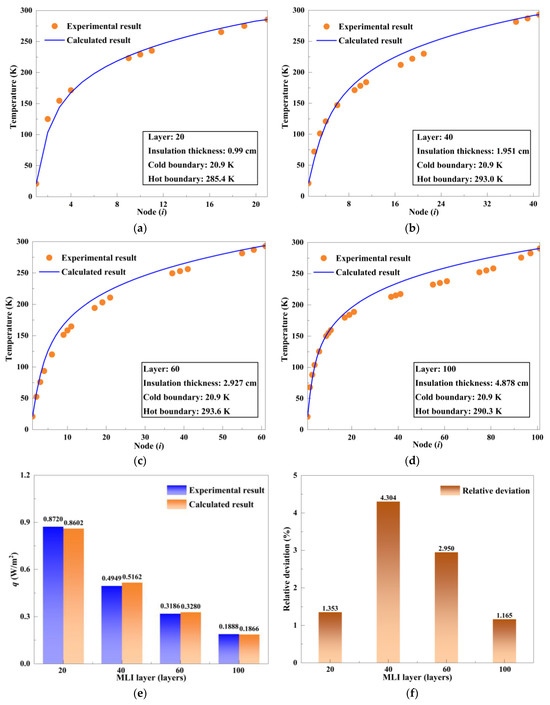
Figure 7.
Experimental validation results of MLI heat transfer model. (a) 20-layer MLI. (b) 40-layer MLI; (c) 60-layer MLI; (d) 100-layer MLI; (e) Comparison between calculated and experimental heat flux; (f) Relative deviation.
As shown in Figure 7, the temperature distributions predicted by the model exhibit strong agreement with the experimental data for MLI configurations comprising 20, 40, 60, and 100 layers. The calculated heat flux values closely match the experimental measurements of 0.8721 W/m2, 0.4949 W/m2, 0.3186 W/m2, and 0.1888 W/m2, respectively. The corresponding model predictions are 0.8602 W/m2, 0.5162 W/m2, 0.3280 W/m2, and 0.1866 W/m2. The relative deviations between the calculated and experimental values are 1.353%, 4.304%, 2.950%, and 1.165%, all within 5%. These results verify the accuracy and reliability of the proposed model in predicting the thermal performance of MLI insulation under LH2 temperature conditions.
4. Results and Discussion
4.1. Heat Transfer in MLI
4.1.1. Temperature Distribution and Heat Leakage
It is worth noting that the emissivity of the model in this paper was determined using an exponential equation. On the other hand, Chen [27] adopted a constant emissivity of 0.05 for the radiation shields in the heat leakage calculations of the LH2 tank, which is insufficient. To further assess the accuracy of the proposed model, comparative calculations were conducted using the constant emissivity (0.05) and the emissivity derived from the exponential equation. Figure 8 shows the temperature distribution and heat leakage of the MLI scheme, where the boil-off rate of the LH2 tank is calculated as follows:
where Qleakage is heat leakage through the tank, W; ρ is the LH2 density, kg/m3; and V is the tank capacity, m3.
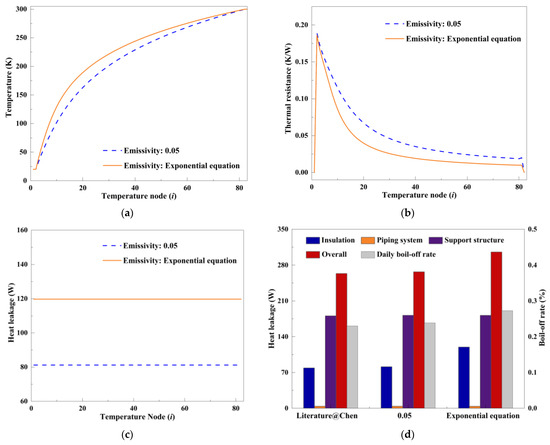
Figure 8.
Temperature distribution and heat leakage of the MLI scheme. (a) Temperature distribution; (b) Thermal resistance; (c) Heat leakage; (d) Comparison of heat leakage via different pathways.
Ti is the temperature at the current node, K; T1 and Tn are the cold- and hot-boundary temperatures, respectively, K; and ∑Ri is the cumulative thermal resistance up to the current node, K/W.
As shown in Figure 8a–c, the temperature and heat leakage of the insulation scheme are higher when the emissivity is calculated by the exponential equation, compared to the results obtained using constant emissivity (0.05). Correspondingly, the overall thermal resistance is relatively lower. This discrepancy is primarily attributed to the variation in emissivity: the emissivity calculated by the exponential equation is lower than 0.05 near the cold boundary and higher near the hot boundary, where radiative heat transfer dominates. The resulting variation in thermal resistance leads to increased heat leakage. Specifically, the heat leakage calculated using the exponential emissivity model reaches 119.731 W, representing a 47.41% increase relative to the 81.223 W obtained using the constant emissivity (0.05).
Figure 8d shows a comparative analysis of heat leakage through different pathways. When the exponential equation calculates the emissivity, the total heat leakage of the tank is 305.4 W. In contrast, using constant emissivity (0.05) yields a total heat leakage of 266.9 W. This value closely matches the result reported by Chen (263.5 W), with a relative deviation of only 1.29%. Among the three leakage pathways, the support structure accounts for the most significant proportion of total heat leakage, followed by the insulation scheme, with pipeline leakage contributing the least. As detailed in Table 2, when using the exponential emissivity model, the proportions of heat leakage through the support structure, insulation, and pipelines are 59.52%, 39.21%, and 1.27%, respectively. When using the constant emissivity (0.05), the corresponding proportions are 68.11%, 30.43%, and 1.46%. Moreover, the daily boil-off rate of the storage tank is 0.285% under the exponential emissivity model, compared to 0.24% under the constant emissivity. This result is in close agreement with Chen’s reported value of 0.23%, with a relative deviation of 4.35%. Here, we conducted a benchmark test to verify that the developed model can obtain effective and reasonable solutions.
Table 2.
Proportion of three heat transfer pathways.
4.1.2. Heat Leakage Distribution and Proportion in MLI
Figure 9 shows the heat leakage distribution and proportion of the MLI scheme. As shown in Figure 9a,b, radiation heat leakage is minimal near the cold boundary and increases progressively toward the outer layers. The rate of increase diminishes with distance. Solid conduction exhibits a higher heat leakage in the low-temperature region, gradually decreasing outward. This is because the emissivity of materials near the cold boundary is low, and radiative heat transfer is not significant, while solid conduction is significant. As the temperature of the radiation shield increases, the radiation heat transfer gradually increases. Residual gas conduction remains relatively minor throughout the scheme, with a slight downward trend. At the 10th node, the heat leakage due to radiation, solid conduction, and residual gas conduction is 54.88 W, 57.71 W, and 7.14 W, respectively—corresponding to 45.83%, 48.20%, and 5.97% of the total. By contrast, at the 30th node, these values are 97.47 W, 19.96 W, and 2.30 W, accounting for 81.41%, 16.67%, and 1.92% of the total, respectively.
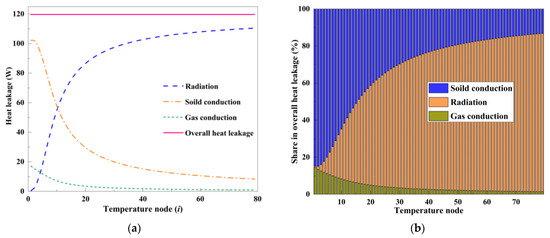
Figure 9.
Heat leakage distribution and proportion of the MLI scheme. (a) Heat leakage distribution; (b) Heat leakage proportion.
4.2. Co-Optimization of MLI-LNCS Scheme
4.2.1. Optimization of IMLI-Layer Count Based on Initial LNCS Position
An alternating search method was utilized to determine the optimal number of IMLI layers and the position of the LNCS. Initially, the LNCS was assumed to be installed at 50% of the interlayer space, where the optimal number of IMLI layers was obtained. Based on this result, the optimal LNCS position was subsequently determined through an inverse search process. Figure 10 shows the relationships among heat leakage, LN2 flow rate, the dimensionless parameter (η), boil-off rate, and the number of IMLI layers. As shown in Figure 10a, near the cold boundary, the discrepancy between the OMLI heat leakage and the heat absorbed by the LNCS is greater than that near the hot boundary. Such a distribution leads to a progressive decline in IMLI heat leakage with increasing IMLI layers. From Figure 10b, we can see that the variation in the LN2 flow rate reveals that both its upper and lower limits tend to increase with the number of IMLI layers. This trend becomes more pronounced near the hot boundary, where the LN2 flow rate gradient shows a steeper rise.
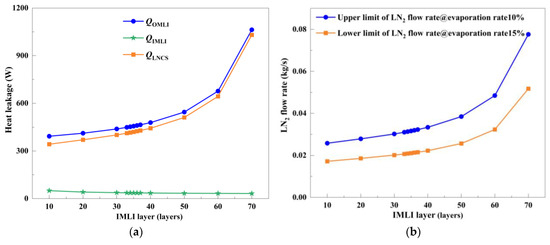
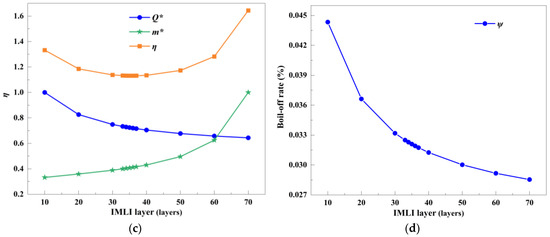
Figure 10.
Relationships among heat leakage, LN2 flow rate, η, boil-off rate, and the number of IMLI layers. (a) Heat leakage; (b) LN2 flow rate; (c) Optimal number of IMLI layers; (d) Boil-off rate.
The IMLI heat leakage negatively correlates with the number of IMLI layers. In contrast, the upper and lower limits of the LN2 flow rate show a positive correlation with the IMLI layer count. Consequently, an optimal number of IMLI layers exists, at which the heat leakage is maintained at an acceptable value while the LN2 flow rate remains within a reasonable range.
Figure 10c indicates that the η exhibits a decreasing trend with increasing IMLI layer count, reaching a minimum value of 1.1314 at 36 layers. At this point, the normalized Q* and m* are 0.7197 and 0.4117, respectively. Given that the optimal number of IMLI layers determined under the initial LNCS installation position (50% of the interlayer space) is 36, the corresponding IMLI heat leakage and the upper limit of LN2 flow rate are 36.1520 W and 0.0213 kg/s, respectively. As illustrated in Figure 10d, the daily boil-off rate of the tank decreases progressively with an increasing number of IMLI layers. At 36 layers, the daily boil-off rate reaches 0.0319%.
4.2.2. Optimization of LNCS Position Based on IMLI Layer Count
Based on the optimal IMLI layer count obtained in the preceding analysis, the corresponding optimal position of the LNCS was subsequently determined under this fixed condition. Figure 11 shows the relationships among heat leakage, LN2 flow rate, the dimensionless parameter (η), boil-off rate, and the LNCS position. As shown in Figure 11a, both the OMLI heat leakage and the heat absorbed by the LNCS increase progressively as the LNCS position shifts toward the hot boundary. In contrast, the IMLI heat leakage demonstrates a decreasing trend with the increasing number of IMLI layers. From Figure 11b, we can see that the upper and lower limits of the LN2 flow rate increase gradually as the LNCS moves closer to the hot boundary. This increase becomes more significant near the hot boundary, where the gradient of the LN2 flow rate is notably steeper.
Figure 11.
Relationships among heat leakage, LN2 flow rate, η, boil-off rate, and the LNCS position. (a) Heat leakage; (b) LN2 flow rate; (c) Optimal installation position; (d) Boil-off rate.
Figure 11c indicates that the η decreases as the LNCS position moves toward the hot boundary, reaching a minimum value of 0.51849 when the LNCS is installed at 49% of the interlayer space. At this position, the normalized Q* and m* are 0.25200 and 0.26648, respectively. Accordingly, the optimization results reveal that for an IMLI scheme of 36 layers, the optimal LNCS position is at 49%, and the corresponding IMLI heat leakage, and the upper limit of LN2 flow rate are 36.362 W and 0.0211 kg/s, respectively. As illustrated in Figure 11d, the daily boil-off rate of the tank decreases progressively as the LNCS is positioned closer to the hot boundary. When the LNCS is installed at 49%, the daily boil-off rate reaches a minimum of 0.0321%.
4.2.3. Co-Optimization of IMLI Layer Count and LNCS Position
Based on the optimal LNCS position identified in the previous step, a third-step iterative search was conducted to determine the corresponding optimal IMLI layer count at the LNCS position of 49%. The results indicate that, under this condition, the optimal number of IMLI layers remains at 36. Figure 12 shows the co-optimization results of the IMLI layer count and LNCS position. The first iteration—conducted with an initial LNCS position of 50%—identified 36 layers as the optimal IMLI count. Based on this scheme, the second iteration determined 49% as the optimal LNCS position. Subsequently, the third iteration, performed under the fixed LNCS position of 49%, reconfirmed that 36 layers remain optimal for the IMLI scheme. Therefore, the iterative optimization process conclusively establishes the optimal insulation configuration. The result is a 36-layer IMLI scheme with the LNCS installed at 49% of the interlayer space.
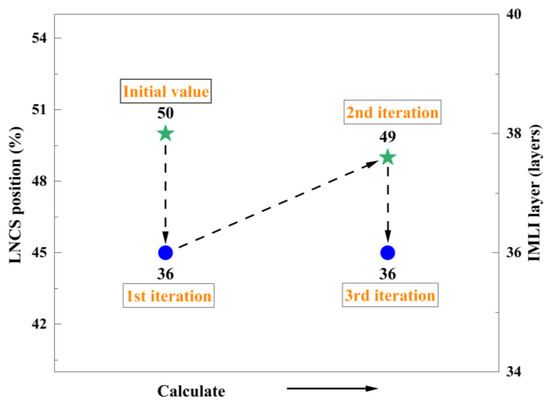
Figure 12.
Co-optimization results of the IMLI layer count and LNCS position.
4.3. Co-Optimization of MLI-VHVCS Scheme
4.3.1. Iterative Co-Optimization of VHVCS Position and IMLI Layer Count
- (1)
- First iteration step
The initial value of the IMLI layer count does not affect the final calculation results, but it affects the computational process. Since the optimal layer count was not yet determined, the previously obtained value (i.e., 36 layers) was used as the initial condition for optimizing the VHVCS installation position. Figure 13 shows the optimization of the VHVCS position for a configuration with 36 IMLI layers. As shown in Figure 13a, the heat leakage through the OMLI and the heat absorbed by the VHVCS increase as the VHVCS position shifts toward the hot boundary. In contrast, the heat transferred to the IMLI decreases and increases. When the VHVCS is located at approximately 50% of the interlayer space, the heat transferred to the IMLI reaches a minimum value of 116.80 W. As shown in Figure 13b, this result confirms 50% as the optimal installation position for the VHVCS. Simultaneously, the VHVCS temperature increases progressively toward the hot boundary, with steeper temperature gradients near the hot boundary. At the optimal position, the VHVCS temperature is 148.3 K.
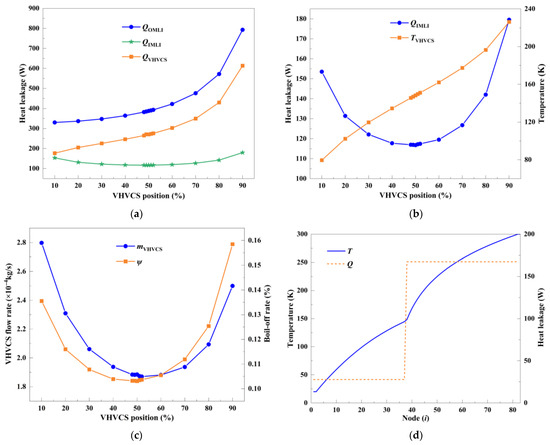
Figure 13.
Optimization of the VHVCS position for 36 IMLI layers. (a) Heat leakage; (b) Heat leakage and VHVCS temperature; (c) VHVCS flow rate and boil-off rate; (d) Temperature distribution and heat leakage.
From Figure 13c, we can see that both the tank boil-off rate and the VHVCS flow rate exhibit a non-monotonic trend, initially decreasing and increasing as the VHVCS shifts toward the hot boundary. The minimum boil-off rate of 0.103% is observed when the VHVCS is 50%. The minimum vapor flow rate, 1.87 × 10⁻⁴ kg/s, occurs at 52%, slightly lagging behind the minimum IMLI heat leakage position. As illustrated in Figure 13d, the incorporation of the VHVCS significantly improves thermal insulation performance, reducing the total heat leakage from 167.39 W (OMLI) to 27.78 W (IMLI). The VHVCS introduces a distinct discontinuity in the original temperature distribution of the MLI, resulting in lower temperature values on both the VHVCS and the standard MLI scheme. Notably, the temperature discontinuity and the abrupt change in heat leakage associated with the VHVCS occur at the 37th node in the figure. As the horizontal axis represents temperature nodes and the first node corresponding to the inner surface of the tank wall, the corresponding number of IMLI layers is given by the number of nodes minus one.
- (2)
- Second iteration step
With the VHVCS fixed at the 50% position within the interlayer space, the search for the optimal IMLI layer count was conducted. Figure 14 shows the corresponding optimization process. As shown in Figure 14a, both the heat leakage through the OMLI and the heat absorbed by the VHVCS increase with the IMLI layer count, while the heat transferred to the IMLI first decreases and then increases. As clearly illustrated in Figure 14b, this heat transfer reaches a minimum of 114.86 W at 25 layers, identifying 25 layers as the optimal IMLI configuration. Meanwhile, the VHVCS temperature rises progressively with increasing IMLI layers, exhibiting steeper gradients near the hot boundary. At 25 layers, the VHVCS temperature is 139.4 K.
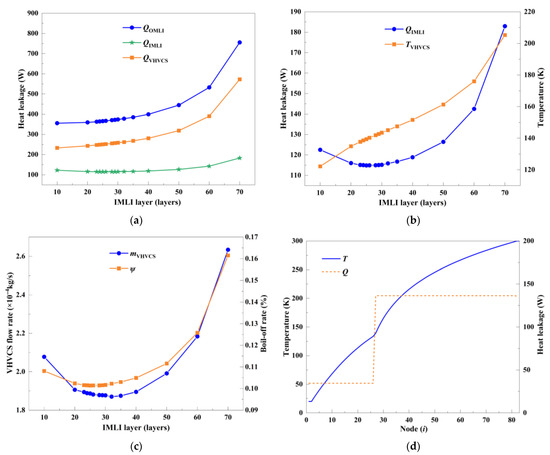
Figure 14.
Optimization of the IMLI layer count for VHVCS at 50% position. (a) Heat leakage; (b) Heat leakage and VHVCS temperature; (c) VHVCS flow rate and boil-off rate; (d) Temperature distribution and heat leakage.
From Figure 14c, the tank boil-off rate and the VHVCS flow rate decrease initially and then increase with the IMLI layer count. The minimum boil-off rate of 0.101% is observed at 25 layers, whereas the minimum vapor flow rate of 1.87 × 10⁻⁴ kg/s occurs at 32 layers, slightly lagging behind the point of minimum IMLI heat leakage. As illustrated in Figure 14d, the introduction of the VHVCS results in a distinct temperature discontinuity at the 26th node, and reduces the total heat leakage from 136.36 W (OMLI) to 34.51 W (IMLI). Compared with the initial assumption of 36 layers in the first step, the optimal IMLI layer count is reduced to 25 layers in this step, indicating a notable deviation from the initial estimate.
- (3)
- Iteration steps three to seven
With the IMLI layer count fixed at 25, the optimal installation position of the VHVCS was further refined. Figure 15 shows the iterative co-optimization results of the IMLI layer count and VHVCS position. As shown in Figure 15a, the optimal VHVCS position at 25 layers is 44%, corresponding to an IMLI heat leakage of 113.81 W and a VHVCS temperature of 131.7 K. Continuing the iterative process, Figure 15b indicates that, with the VHVCS fixed at 44%, the optimal IMLI layer count becomes 23 layers, resulting in a minimum heat leakage of 113.77 W and a VHVCS temperature of 130.1 K. Figure 15c shows that at 23 layers, the optimal VHVCS position shifts to 39%, where the corresponding VHVCS temperature is 123.8 K. Further optimization, as illustrated in Figure 15d, identifies 21 layers as the optimal IMLI configuration when the VHVCS is located at 39%, yielding a minimum heat leakage of 113.79 W and a VHVCS temperature of 122.3 K. Figure 15e confirms the iterative search process has converged. At 21 layers, the optimal VHVCS position remains unchanged at 39%, and the minimum heat leakage remains stable at 113.79 W. Therefore, the configuration of 21 IMLI layers and a 39% VHVCS installation position is the final result of the co-optimization.
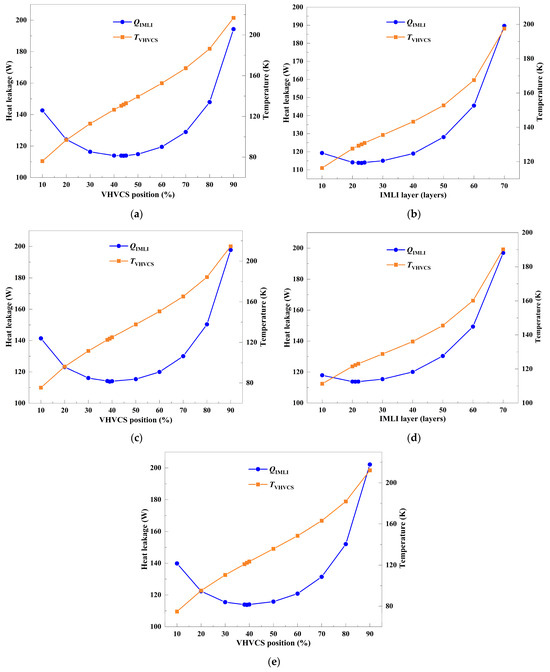
Figure 15.
Iterative co-optimization results of the IMLI layer count and VHVCS position. (a) Third iteration: 25-layer IMLI; (b) Fourth iteration: 44% VHVCS position; (c) Fifth iteration: 23-layer IMLI; (d) Sixth iteration: 39% VHVCS position; (e) Seventh iteration: 21-layer IMLI.
4.3.2. Convergence Characteristics of Co-Optimization Process
Figure 16 shows the convergence characteristics of key parameters throughout the iterative co-optimization process. As shown in Figure 16a, the heat transfer through the IMLI decreases significantly during the initial three iterations and then stabilizes at 113.79 W by the seventh step. This is because the initial value of the iteration is close to the optimal solution. Meanwhile, the VHVCS temperature gradually declines with each iteration, reaching a steady value of 122.3 K, confirming the co-optimization process’s convergence. Figure 16b shows that the tank’s boil-off rate decreases significantly during the first three iterations, approaching a steady-state value of 0.1004% by the seventh iteration. In contrast, the VHVCS vapor flow rate exhibits a continuous upward trend during the iterative process, stabilizing at 1.92 × 10⁻⁴ kg/s.
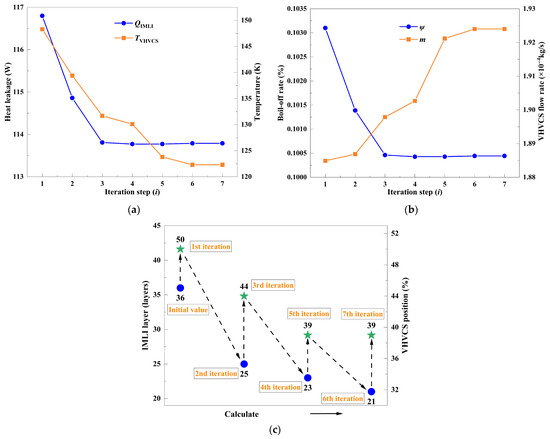
Figure 16.
Convergence characteristics of key parameters throughout the iterative process. (a) Heat leakage and VHVCS temperature; (b) VHVCS flow rate and boil-off rate; (c) VHVCS position and IMLI layer count.
From Figure 16c, we can see that the optimal VHVCS installation positions identified during the first, third, fifth, and seventh iterations are 50%, 44%, 39%, and 39%, respectively. Meanwhile, the corresponding optimal IMLI layer counts determined in the second, fourth, and sixth iterations are 25, 23, and 21 layers, respectively. Based on these results, the final co-optimization yields an optimal configuration comprising 21 IMLI layers and a VHVCS installation position at 39%.
4.3.3. Evolution of Heat Leakage and MLI Temperature Distribution
Figure 17 shows the evolution of heat leakage and temperature distribution in the insulation scheme throughout the iterative co-optimization process. In Figure 17a,b, the heat leakage on the outer side of the VHVCS decreases monotonically during the first, third, and fifth iterations, and the heat leakage on the inner side shows oscillatory behavior. In contrast, the second, fourth, and sixth iterations consistently decrease heat leakage on both sides of the VHVCS. The corresponding values on the inner side are 34.51 W, 32.44 W, and 31.18 W, respectively. The heat leakage of 31.18 W on the inner side corresponds to the optimal VHVCS position and IMLI-layer count configuration.
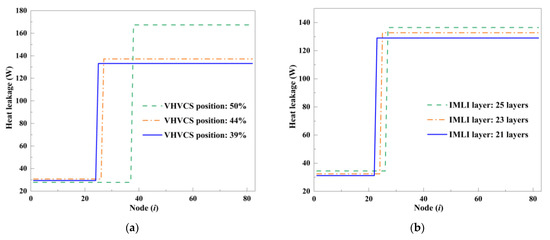
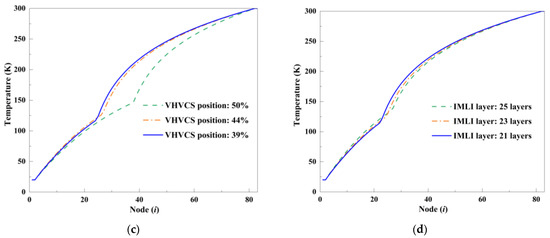
Figure 17.
Evolution of heat leakage and temperature distribution throughout the iterative process. (a) Iterations 1, 3, and 5; (b) Iterations 2, 4, and 6; (c) Iterations 1, 3, and 5; (d) Iterations 2, 4, and 6.
Figure 17c,d show the corresponding temperature distributions of the MLI–VHVCS scheme. As the iterations proceed, a progressive reduction in temperature is observed on the inner side of the VHVCS, indicating enhanced suppression of heat transfer from the ambient environment toward the cold boundary.
4.4. Comparison of Three Insulation Schemes
Figure 18 shows a comparison of heat leakage and boil-off rates among three insulation schemes. The results indicate that incorporating an LNCS into the MLI scheme—forming the MLI-LNCS scheme—reduces heat leakage by 88.09%, with the corresponding boil-off rate decreasing from 0.2728% to 0.0321%. Despite the substantial improvement in thermal insulation, the high LN2 consumption—approximately 76 kg/h under the optimal LNCS position and IMLI layer count—results in considerable operational costs on the cryogenic circulation system. Integrating a VHVCS into the MLI scheme—forming the MLI-VHVCS scheme—yields a 62.74% reduction in heat leakage, and lowers the daily boil-off rate to 0.1004%. These results demonstrate that utilizing the sensible cooling capacity of cryogenic vapor effectively enhances the thermal insulation of the LH2 storage tank, with associated costs primarily related to the materials, fabrication, and installation of the VHVCS and coil assembly. Although the MLI-LNCS scheme achieves a 68.04% greater reduction in heat leakage compared to the MLI-VHVCS scheme, the latter offers superior cost-effectiveness. This suggests that the recovery of sensible heat from cryogenic vapor presents a more economically viable and efficient approach to insulation improvement than the recovery of latent heat from an auxiliary cryogen source.
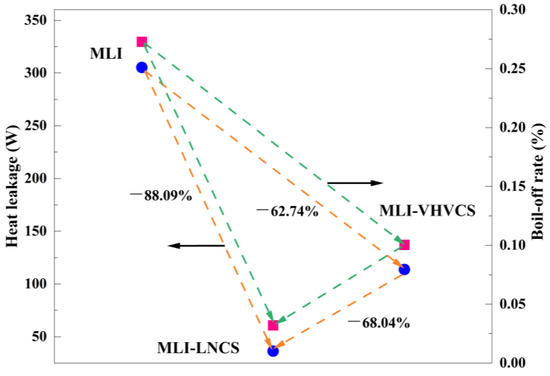
Figure 18.
Comparison of heat leakage and boil-off rates among three insulation schemes.
5. Conclusions
This paper used a Layer-by-Layer method to establish thermodynamic models for MLI, MLI-LNCS, and MLI-VHVCS insulation schemes. The temperature distribution and heat leakage of the MLI scheme were predicted. For the MLI-LNCS and MLI-VHVCS schemes, the optimal installation positions of the ACS and the corresponding number of IMLI layers were co-optimized. A comparative evaluation of the thermal insulation performance among the three schemes was subsequently conducted. The main conclusions are drawn as follows:
- (1)
- The established model demonstrated good performance in predicting the thermal performance of MLI insulation under LH2 temperature conditions. The relative deviations between the calculated values and experimental values are within 5%. The thermal resistance of the insulation scheme gradually decreases from the inner side to the outer side. A significant temperature gradient is observed near the cold boundary, while the gradient becomes more moderate near the warm boundary.
- (2)
- For the MLI-LNCS scheme, the optimal number of IMLI layers is 36, with the optimal LNCS position installed at 49% of the interlayer space. For the MLI-VHVCS scheme, the optimal number of IMLI layers is 21, and the corresponding optimal VHVCS installation position is identified at 39%.
- (3)
- Compared to the conventional MLI scheme, the MLI-LNCS scheme reduces heat leakage by 88.09%. However, the LN2 circulation system results in high operational costs. The MLI-VHVCS scheme achieves a 62.74% reduction in heat leakage, demonstrating that harnessing the sensible cooling capacity of cryogenic vapor effectively enhances the thermal insulation performance of LH2 storage tanks. Although the MLI-LNCS scheme provides a 68.04% reduction in heat leakage compared to the MLI-VHVCS scheme, the latter proves more favorable when considering economic considerations.
This study offers a valuable reference for enhancing the insulation performance of LH2 storage tanks, and provides insights into the optimization of the insulation scheme for cryogenic equipment, including refrigerators and cryogenic pipelines.
Author Contributions
Conceptualization, J.L.; methodology, J.L. and L.C.; software, J.L. and X.Z.; validation, J.L. and X.Z.; formal analysis, X.Z.; investigation, J.L.; resources, L.C.; data curation, J.L.; writing—original draft preparation, J.L.; writing—review and editing, J.L. and X.Z. All authors have read and agreed to the published version of the manuscript.
Funding
This research received no external funding.
Data Availability Statement
The data presented in this article are not readily available because the data are part of the subject being researched. Requests to access the datasets should be directed to the corresponding author.
Conflicts of Interest
The authors declare no conflicts of interest.
Nomenclature
| LT | length of the tank, m | Q* | dimensionless heat leakage |
| QMLI | heat leakage through the MLI, W | m* | dimensionless mass flow rate |
| σ | Stephan–Boltsman constant | η | dimensionless evaluation parameter |
| ε(T) | emissivity of the radiation shield | λH | conductivity at hot boundary, W/(m·K) |
| T1 | inner-surface temperature of inner tank, K | λL | conductivity at cold boundary, W/(m·K) |
| T2 | outer-surface temperature of inner tank, K | TACS | ACS temperature, K |
| Tn−1 | inner-surface temperature of outer tank, K | λACS | conductivity of acs, W/(m·K) |
| Tn | outer-surface temperature of outer tank, K | λamb | conductivity of air, W/(m·K) |
| C | empirical constant, 0.008 | Nu | Nusselt number |
| f | relative solid density | Re | Reynolds number |
| k | conductivity of spacer, W/(m·K) | Pr | Prandtl number |
| Ta | ambient temperature, 300 K | ψ | daily boil-off rate |
| p | vacuum pressure, Pa | ρ | LH2 density, kg/m3 |
| γ | specific heat ratio, γ = cp/cv | V | tank capacity, m3 |
| α | accommodation coefficient, 0.9 | LH2 | liquid hydrogen |
| RT | total thermal resistance, K/W | LN2 | liquid nitrogen |
| QOMLI | heat leakage through OMLI, W | MLI | multilayer insulation |
| QIMLI | heat leakage through IMLI, W | OMLI | outer-multilayer insulation |
| QACS | heat absorbed by ACS, W | IMLI | inner-multilayer insulation |
| m | mass flow rate, kg/s | ACS | active cooled shield |
| ∆H | latent heat of vaporization, kJ/kg | LNCS | liquid-nitrogen cooled shield |
| QSEN | sensible heat of cryogenic vapor, J/kg | VHVCS | vapor-hydrogen cooled shield |
References
- Labidine Messaoudani, Z.; Rigas, F.; Hamid, M.D.B.; Hassan, C.R.C. Hazards, safety and knowledge gaps on hydrogen transmission via natural gas grid: A critical review. Int. J. Hydrogen Energy 2016, 41, 17511–17525. [Google Scholar] [CrossRef]
- Masson-Delmotte, V.; Zhai, P.; Pirani, A.; Connors, S.L.; Péan, C.; Berger, S.; Caud, N.; Chen, Y. IPCC 2021: Summary for policymakers. In Climate Change 2021: The Physical Science Basis; Contribution of Working Group I to the Sixth Assessment Report of the Intergovernmental Panel on Climate Change; Cambridge University Press: Cambridge, UK, 2021. [Google Scholar] [CrossRef]
- Chen, C.; Li, C.; Reniers, G.; Yang, F. Safety and security of oil and gas pipeline transportation: A systematic analysis of research trends and future needs using WoS. J. Clean. Prod. 2021, 279, 123583. [Google Scholar] [CrossRef]
- Mahajan, D.; Tan, K.; Venkatesh, T.; Kileti, P.; Clayton, C.R. Hydrogen Blending in Gas Pipeline Networks: A Review. Energies 2022, 15, 3582. [Google Scholar] [CrossRef]
- Qadrdan, M.; Abeysekera, M.; Wu, J.; Jenkins, N.; Winter, B. The Future of Gas Networks. In The Role of Gas Networks in a Low Carbon Energy System; SpringerBriefs in Energy; Springer: Cham, Switzerland, 2020. [Google Scholar]
- Kong, M.; Feng, S.; Xia, Q.; Chen, C.; Pan, Z.; Gao, Z. Investigation of mixing behavior of hydrogen blended to natural gas in gas network. Sustainability 2021, 13, 4255. [Google Scholar] [CrossRef]
- Seyam, S.; Dincer, I.; Agelin-Chaab, M. Economic and environmental impact assessments of hybridized aircraft engines with hydrogen and other fuels. Int. J. Hydrogen Energy 2022, 47, 11669–11685. [Google Scholar] [CrossRef]
- Harichandan, S.; Kar, S.K.; Bansal, R.; Mishra, S.K. Achieving sustainable development goals through adoption of hydrogen fuel cell vehicles in India: An empirical analysis. Int. J. Hydrogen Energy 2023, 48, 4845–4859. [Google Scholar] [CrossRef]
- Li, C.; Li, M.; Zheng, Y.; Fang, B.; Lin, J.; Ni, J.; Lin, B.; Jiang, L. Revealing hydrogen migration effect on ammonia synthesis activity over ceria-supported Ru catalysts. Appl. Catal. B Environ. 2023, 320, 121982. [Google Scholar] [CrossRef]
- Cherrad, N. Pumping of hydrogen by free heating for buildings supply from a safe storage bed. Therm. Sci. Eng. Prog. 2019, 13, 100370. [Google Scholar] [CrossRef]
- Cunnington, G.R.; Tien, G.L. A study of heat-transfer process in multiplayer insulation. In Progress in Astronautics and Aeronautics; Academic Press: New York, NY, USA, 1970; Volume 23, pp. 111–126. [Google Scholar]
- Jacob, S.; Kasthurirengan, S.; Karunanithi, R. Investigations into the thermal performance of multilayer insulation (300-77 K) Part 1: Calorimetric studies. Cryogenics 1992, 32, 1137–1146. [Google Scholar] [CrossRef]
- McIntosh, G.E. Layer by Layer MLI calculation using a seperated mode equation. In Advance in Cryogenic Engineering; Springer: Berlin/Heidelberg, Germany, 1994; Volume 39, pp. 1683–1690. [Google Scholar]
- Bapat, S.L.; Narayankhedkar, K.G.; Lukose, T.P. Performance prediction of multilayer insulation. Cryogenics 1990, 30, 700–710. [Google Scholar] [CrossRef]
- Krishnaprakas, C.K.; Narayana, K.B.; Dutta, P. Heat transfer correlations for multilayer insulation systems. Cryogenics 2000, 40, 431–435. [Google Scholar] [CrossRef]
- Daryabeigi, K. Heat transfer in high-temperature fibrous insulation. J. Thermophys. Heat Transf. 2003, 17, 10–20. [Google Scholar] [CrossRef]
- Johnson, W.L. Thermal Performance of Cryogenic Multilayer Insulation at Various Layer Spacings. Master’s Thesis, University of Central Florida Orlando, Orlando, FL, USA, 2010. [Google Scholar]
- Johnson, W. Thermal analysis of low layer density multilayer insulation test results. Adv. Cryog. Eng. 2012, 1314, 1519–1526. [Google Scholar]
- Wang, B.; Wang, H.; Gao, Y.; Yu, J.; He, Y.; Xiong, Z.; Lu, H.; Pan, Q.; Gan, Z. Theoretical analysis of entropy generation in multilayer insulations: A casestudy of performance optimization of variable density multilayerinsulations for liquid hydrogen storage systems. Int. J. Hydrogen Energy 2024, 85, 175–190. [Google Scholar] [CrossRef]
- Hastings, L.J.; Martin, J.J. Experimental testing of a foam/multilayer insulation (FMLI) thermal control system (TCS) for use on a cryogenic upper stage. Space Technol. Appl. Int. Forum. 1998, 420, 331–341. [Google Scholar]
- Li, K.; Chen, J.; Tian, X.; He, Y. Study on the performance of variable density multilayer insulation in liquid hydrogen temperature region. Energies 2022, 15, 9267. [Google Scholar] [CrossRef]
- Camplese, D.; Scarponi, G.E.; Chianese, C.; Hajhariri, A.; Eberwein, R.; Otremba, F.; Cozzani, V. Modeling the performance of multilayer insulation in cryogenic tanks undergoing external fire scenarios. Process Saf. Environ. Prot. 2024, 186, 1169–1182. [Google Scholar] [CrossRef]
- Wang, K.; Li, J.; Hu, X.; Yang, S.; Zhang, C.; Guo, A.; Du, H. Validation of heat transfer models and optimization of heat shielding performance of high-temperature multilayer insulations for hypersonic vehicles. Appl. Therm. Eng. 2025, 258, 124840. [Google Scholar] [CrossRef]
- Rahman, A.A.; Wang, B.; Yu, J.; Gao, Y.; He, Y.; Jin, T.; Gan, Z. Machine learning approaches for the prediction of thermal performance of multilayer insulation materials at low temperatures. Appl. Therm. Eng. 2025, 264, 125527. [Google Scholar] [CrossRef]
- Yin, L.; Yang, H.; Ju, Y. Review on the key technologies and future development of insulation structure for liquid hydrogen storage tanks. Int. J. Hydrogen Energy 2024, 57, 1302–1315. [Google Scholar] [CrossRef]
- Tanaka, S. Transport of Liquid Helium. Low Temp. Eng. 1977, 5, 52–53. Available online: https://www.semanticscholar.org/paper/The-Transport-of-Liquid-Helium-Tanaka/87916b61ce707406b149662343498fb3aa85b317 (accessed on 20 September 2024). [CrossRef]
- Zheng, J.; Chen, L.; Wang, J.; Zhou, Y.; Wang, J. Thermodynamic modelling and optimization of self-evaporation vapor cooled shield for liquid hydrogen storage tank. Energy Convers. Manag. 2019, 184, 74–82. [Google Scholar] [CrossRef]
- Zheng, J.; Chen, L.; Wang, P.; Zhang, J.; Wang, J.; Zhou, Y. A novel cryogenic insulation system of hollow glass microspheres and self-evaporation vapor-cooled shield for liquid hydrogen storage. Front. Energy 2019, 14, 570–577. [Google Scholar] [CrossRef]
- Jiang, W.B.; Zuo, Z.Q.; Huang, Y.H.; Wang, B.; Sun, P.J.; Li, P. Coupling optimization of composite insulation and vapor-cooled shield for onorbit cryogenic storage tank. Cryogenics 2018, 96, 90–98. [Google Scholar] [CrossRef]
- Syed, S.; Goyal, M.; Atrey, M.D. Optimum Design of Liquid Helium Dewar with Vapour Cooled Shields. Indian J. Cryog. 2016, 41, 63. [Google Scholar] [CrossRef]
- Zheng, J.; Chen, L.; Wang, J.; Xi, X.; Zhu, H.; Zhou, Y.; Wang, J. Thermodynamic analysis and comparison of four insulation schemes for liquid hydrogen storage tank. Energy Convers. Manag. 2019, 186, 526–534. [Google Scholar] [CrossRef]
- Chen, L.B.; Zheng, J.P.; Wu, X.L.; Cui, C.; Zhou, Y.; Wang, J.J. Research of the cold shield in cryogenic liquid storage. In IOP Conference Series: Materials Science and Engineering; IOP Publishing: Bristol, UK, 2017; Volume 278, p. 012194. [Google Scholar] [CrossRef]
- Chato, J.C.; Khodadadi, J.M. Optimization of cooled shields in cryogenic insulations. J. Heat Transfer. 1984, 106, 871–875. [Google Scholar] [CrossRef]
- Babac, G.; Sisman, A.; Cimen, T. Two-dimensional thermal analysis of liquid hydrogen tank insulation. Int. J. Hydrogen Energy 2009, 34, 6357–6363. [Google Scholar] [CrossRef]
- Kim, S.Y.; Kang, B.H. Thermal design analysis of a liquid hydrogen vessel. Int. J. Hydrogen Energy 2000, 25, 133–141. [Google Scholar] [CrossRef]
- Xu, Z.; Tan, H.; Wu, H. Performance comparison of multilayer insulation coupled with vapor cooled shield and different para-ortho hydrogen conversion types. Appl. Therm. Eng. 2023, 234, 12125. [Google Scholar] [CrossRef]
- Zhu, X.Y.; Lee, J.H.; Kim, K.H.; Lim, C.H.; Lee, S.H. Coupled CFD modeling and thermal analysis of multi-layered insulation structures in liquid hydrogen storage tanks for various vapor-cooled shield. Case Stud. Therm. Eng. 2024, 63, 105317. [Google Scholar] [CrossRef]
- Sun, Z.; Li, M.; Qu, Z.; Tian, D.; Zhang, J. A quasi-2D thermodynamic model for performance analysis and optimization of liquid hydrogen storage system with multilayer insulation and vapor-cooled shield. J. Energy Storage 2023, 73, 109128. [Google Scholar] [CrossRef]
- Li, K.; Wen, J.; Wang, S. Insulation and cost optimization of vapor-cooled shield coupled with para-to-ortho hydrogen conversion based on self-pressurization model of liquid hydrogen tank and NSGA-II. J. Energy Storage 2024, 99, 113229. [Google Scholar] [CrossRef]
- Lv, H.; Zhang, Z.; Chen, L.; Zhang, Z.; Chen, S.; Hou, Y. Thermodynamic analysis of vapor-cooled shield with para-to-ortho hydrogen conversion in composite multilayer insulation structure for liquid hydrogen tank. Int. J. Hydrogen Energy 2024, 50, 1448–1462. [Google Scholar] [CrossRef]
- Li, K.; Wen, J.; Xin, B.; Zhou, A.; Wang, S. Transient-state modeling and thermodynamic analysis of self-pressurization liquid hydrogen tank considering effect of vacuum multi-layer insulation coupled with vapor-cooled shield. Energy 2024, 286, 129450. [Google Scholar] [CrossRef]
- Liang, J.; Li, C.; Ma, Y.; Liu, X.; Zhang, S.; Zhou, Z.; Li, Y. Study on transient thermal performance of coupled vapor-cooled shield insulation for liquid hydrogen tank during the on-orbit period. Appl. Therm. Eng. 2025, 266, 125665. [Google Scholar] [CrossRef]
- Leng, Y.; Zhang, S.; Wang, X.; Pu, L.; Xu, P. Comparative study on thermodynamic performance of liquid hydrogen storage insulation system incorporating vapor-cooled shield with para-ortho hydrogen conversion by one-dimensional and quasi-two-dimensional model. Energy Convers. Manag. 2024, 321, 119068. [Google Scholar] [CrossRef]
- Jiang, W.; Zuo, Z.; Sun, P.; Li, P.; Huang, Y. Thermal analysis of coupled vapor-cooling-shield insulation for liquid hydrogen-oxygen pair storage. Int. J. Hydrogen Energy 2022, 47, 8000–8014. [Google Scholar] [CrossRef]
- Shi, C.; Zhu, S.; Wan, C.; Bao, S.; Zhi, X.; Qiu, L.; Wang, K. Performance analysis of vapor-cooled shield insulation integrated with para-ortho hydrogen conversion for liquid hydrogen tanks. Int. J. Hydrogen Energy 2023, 48, 3078–3090. [Google Scholar] [CrossRef]
- Wang, X.; Zhu, M.; Han, W.; Wu, Z.; Chen, S. Cold energy utilization analysis of cryogenic dual-energy heavy-duty trucks coupled LH2/LNG cooled shield. Int. J. Hydrogen Energy 2024, 71, 387–399. [Google Scholar] [CrossRef]
- Chen, C. Development of 300 m3 Liquid Hydrogen Storage Tank for Transportation Vehicle; Harbin Industrial University: Harbin, China, 2014. [Google Scholar]
- Corruccini, R.J. Gaseous heat conduction at low pressures and temperatures. Vacuum 1959, 7, 19–29. [Google Scholar] [CrossRef]
- Xu, J.; Liu, F.A.; Zhang, J.; Li, C.; Liu, Q.; Li, C.; Jia, W.; Fu, S.; Li, L. Numerical Study on Heat Leakage, Thermal Stratification, and Self-Pressurization Characteristics in Liquid Helium Storage Tanks. Energies 2024, 17, 6254. [Google Scholar] [CrossRef]
- Stochl, R.J. Basic Performance of a Multilayer Insulation System Containing 20 to 160 Layers; NASA TN D-7659; National Aeronautics and Space Administration: Washington, DC, USA, 1974.


Disclaimer/Publisher’s Note: The statements, opinions and data contained in all publications are solely those of the individual author(s) and contributor(s) and not of MDPI and/or the editor(s). MDPI and/or the editor(s) disclaim responsibility for any injury to people or property resulting from any ideas, methods, instructions or products referred to in the content. |
© 2025 by the authors. Licensee MDPI, Basel, Switzerland. This article is an open access article distributed under the terms and conditions of the Creative Commons Attribution (CC BY) license (https://creativecommons.org/licenses/by/4.0/).