1. Introduction
The quality of stored agri-food products, particularly staple cereals such as wheat (
Triticum aestivum L.), is a critical factor in ensuring long-term nutritional value, technological stability, and commercial competitiveness of the harvest. In this context, effective wheat preservation requires consideration of a complex interplay of biotic and abiotic factors, with particular emphasis on the climatic parameters of the storage environment [
1,
2,
3]. Among these, air temperature, relative humidity within storage facilities, and the internal moisture content of the grains play a decisive role in maintaining the physico-chemical integrity and functional value of the product [
2].
Research conducted by Mujumdar [
1] and Brooker et al. [
2] has demonstrated that, in the absence of strict control over these factors, accelerated degradation processes may occur, including fungal colonization, insect infestation, and loss of germination capacity. Exceeding critical thresholds of 20 °C for temperature and 65% for relative humidity significantly increases the likelihood of these adverse phenomena. To prevent such effects, the literature [
3,
4,
5] recommends maintaining grain moisture content below 14% and storing at temperatures under 15 °C, conditions that contribute to extending shelf life without compromising initial quality.
In temperate climate regions, the lack of proper management of internal microclimatic conditions within silos or storage facilities often results in annual quantitative losses estimated between 5% and 10%, alongside significant deterioration in key quality parameters such as protein content, gluten levels, and the baking performance of wheat [
4]. These losses are not only physical but also functional, as they compromise the technological and nutritional value of the grain. Moreover, fluctuations in temperature and relative humidity within storage environments can accelerate biochemical degradation processes, including enzymatic activity and microbial proliferation, which further reduce the commercial value of the stored product. This vulnerability highlights the critical need for systematic evaluation of the influence of climatic factors on wheat quality during the post-harvest period. Understanding the cumulative impact of these variables is essential, as it directly contributes to both biochemical deterioration and measurable economic losses, both direct (e.g., reduced market value) and indirect (e.g., increased processing costs, reduced shelf life), across the agri-food supply chain [
5,
6,
7,
8].
Cereal storage requires the maintenance of a tightly regulated internal microclimate, where environmental factors, particularly temperature, air humidity, grain moisture content, and ventilation, directly influence the physical, chemical, and biological stability of the agricultural product [
9,
10,
11]. Research has emphasized the importance of defining optimal storage thresholds, indicating that temperatures between 10 and 15 °C, combined with a grain moisture content below 14%, can significantly extend the effective preservation period of wheat by 12 to 18 months [
12,
13]. These conditions help inhibit microbial activity, enzymatic degradation, and oxidative reactions that compromise grain quality. In contrast, exceeding these thresholds may lead to rapid deterioration of the harvest, sometimes within the first 3 to 6 months of storage, due to the onset of fermentation, mold growth, or compaction of the grain mass, all of which negatively affect both quality and storability [
14,
15,
16].
According to data published in the literature [
4,
17,
18,
19,
20], wheat stored at a moisture content between 16% and 18% presents a biological spoilage risk more than four times higher than under controlled conditions, particularly when combined with elevated ambient temperatures and excessive atmospheric humidity. These unfavorable conditions create an ideal environment for microbial proliferation, enzymatic activity, and oxidative degradation, all of which compromise the physical and nutritional integrity of the grain. Furthermore, research by Magan and Aldred (2007) indicates that under such conditions, specifically, temperatures exceeding 25 °C and relative humidity above 70%, quantitative losses can reach up to 20% of the total harvested mass within relatively short storage periods of approximately six months [
21]. More critically, biological contamination with pathogenic fungal species such as Aspergillus flavus and Penicillium spp. not only affects sensory attributes (e.g., color, odor) but also leads to the formation of toxic secondary metabolites, particularly aflatoxins. These mycotoxins pose serious risks to food safety and public health, as they are known to be carcinogenic and hepatotoxic even at low concentrations [
22,
23,
24].
Recent research [
11,
14] has demonstrated the effectiveness of modern monitoring technologies, such as infrared spectroscopy and acoustic analysis, in the early detection of wheat degradation during storage. These methods enable rapid interventions and significantly reduce quality losses. Moreover, the use of automated sampling and analysis equipment allows for real-time monitoring of over 20 quality parameters, including: moisture content, falling number, and test weight, which are essential for maintaining baking standards [
11,
25,
26,
27,
28].
Recent empirical studies have demonstrated that insufficient ventilation during wheat storage significantly increases the risk of aflatoxin contamination, particularly aflatoxin B1, which is commonly produced by Aspergillus flavus under conditions of elevated temperature and humidity. In multiple documented cases, toxin levels surpassed the European Union’s regulatory threshold of 2 ppb in under five months following harvest [
29,
30]. These outcomes highlight the essential role of environmental regulation in preserving grain safety and quality during storage.
To address these challenges, advanced environmental monitoring and control systems, such as digital sensors for temperature and humidity, automated aeration mechanisms, and predictive data analytics, have proven highly effective in minimizing quality deterioration. Predictive modeling based on real-time environmental inputs has been shown to enhance grain preservation by up to 85% when compared to traditional storage practices [
31,
32].
Given these insights, a comprehensive understanding of how climatic variables influence the physicochemical integrity of stored wheat is vital for refining post-harvest management protocols. This knowledge directly supports efforts to reduce storage-related losses, uphold food safety standards, and streamline logistics across the grain supply chain [
11,
28,
33].
The objective of this study is to investigate the influence of environmental conditions on the quality of stored wheat by continuously monitoring temperature and relative humidity over a 12-month period, evaluating the evolution of key physicochemical parameters (including internal moisture, temperature, protein and gluten content, and test weight), identifying statistical correlations between climatic variables and grain quality attributes, and developing regression-based models capable of predicting wheat behavior under varying storage conditions.
2. Materials and Methods
In this study, the material used was common wheat (
Triticum aestivum), obtained from the 2023 harvest, classified as RO 1 according to the Romanian standard SR 13548/2013 [
22,
34].
Table 1 presents a set of specific characteristics of this product. The values were recorded following the completion of harvesting and cleaning operations.
Parameters subjected to analysis in this study, which are specific to the product under investigation, included initial moisture, initial temperature, hectoliter weight, gluten content, and protein content.
It is well known that the grain storage process is influenced by numerous factors affecting product quality; in addition to those already specified, other relevant aspects include ventilation, biological activity (e.g., insects, fungi), and air composition (e.g., CO
2) [
9,
10,
11,
35]. However, in this article, we focus exclusively on the parameters previously presented. Furthermore, it is important to note that prior to being introduced into storage, the grain undergoes a sorting and selection process to ensure superior quality, with the proportion of foreign matter reduced to nearly 0%.
The analyzed data were collected over the course of one year, specifically from September 2023 to August 2024. This time frame was selected because, in September, the contracted product was returned under a loan quota system. The one-year duration of the study was chosen to highlight the influence of environmental factors, particularly the variation in temperature and atmospheric humidity.
The total quantity of product analyzed was approximately 500,000 kg. From this amount, over 140 samples were collected, from which a composite sample was prepared for analysis. Sampling was conducted from different locations within the storage facility, ensuring that no two samples were taken from the same spot [
36]. This procedure was repeated four times each month, in sets of three replicates. In total, 48 samples were collected for this study.
To determine the parameters presented in this study, a series of laboratory instruments and standardized methods were employed: (i) Equipment used for determining the protein and moisture content of the analyzed product included the Granomat and Granolyzer. These devices are calibrated and verified annually by the Romanian Institute of Metrology and are also subject to yearly certification by the manufacturer, Sartorom Romania; (ii) The determination of wet gluten was performed in accordance with SR EN ISO 15141:2007 [
37], while both the hectoliter weight and the bulk density (also referred to as “hectoliter mass”) were assessed using the standard SR EN ISO 7971-3:2010:Cereals [
38], applying a practical method for the latter; all of these standards are referenced in [
22].
At the time the product was introduced into storage, the recorded environmental parameters were as follows: the storage space temperature was 24 °C, the relative humidity inside the storage was 45%, while the outdoor temperature and humidity were 25 °C and 40%, respectively.
This study was conducted at the National Administration of State Reserves and Special Issues in Podoleni, Neamț County. The storage facility is located in a region characterized by a temperate continental climate with four distinct seasons. Some of the climatic characteristics specific to the region are presented in
Figure 1.
The Podoleni area is characterized by an annual average temperature that shows a clear upward trend after 2016, reaching its peak in 2024, which may indicate a phenomenon of local warming. Additionally, the annual average relative humidity decreases until 2018, then rises sharply until 2022, after which it stabilizes, suggesting a possible shift in precipitation patterns or air circulation. The correlation between average annual temperature and relative humidity over the 2015–2024 period is approximately 0.752, indicating a moderately strong positive relationship between these two climatic variables. Moreover, a very strong positive correlation was identified between average annual temperature and wind speed (≈0.964), suggesting that rising temperatures may be associated with intensified atmospheric circulation in the region. Regarding the annual average wind speed, it remained constant between 2015 and 2020, then increased rapidly until 2022 and maintained a higher level, which could reflect changes in regional atmospheric dynamics.
It should be noted that cereals are stored in the facility for a period of four years, in accordance with SR 13548:2013 [
34]. Throughout the entire storage period, samples are collected at regular intervals. At the end of the storage period, the cereals are intended for industrial processing.
In order to be suitable for industrial use, wheat must meet the minimum quality requirements specified in the SR 13591-1:2005 standard [
39], including a minimum protein content of 10.5%, gluten content of 22%, a maximum moisture level of 14.5%, a falling number of at least 220 s (for baking purposes), a low level of foreign matter (1%), and it must be free from active infestations [
34].
To monitor environmental parameters, the storage unit is equipped with an SMT-LR1 monitoring system, which includes a LoRaWAN communication device (MikroTik, Riga, Latvia, WAP-LR8; the data update frequency is from 1 to 45 min) and an application server consisting of a DELL OPTIPLEX 300 MT PC (Xiamen, China). Additionally, the storage space is fitted with temperature sensor probes with local display and LoRaWAN radio transmission (B METERS, Brescia, Italy, SST-LR1), as well as three sensors and a probe equipped with temperature and humidity sensors, local display, and LoRaWAN radio transmission (Hunan HKT Technology Co., Ltd., Changsha, China, TUT-LR1) [
40,
41,
42,
43]. A total of 475 sensors are installed in the storage facility, arranged in a linear configuration. When the system detects an anomaly, the corresponding probe is automatically excluded from the calculation.
3. Results
Following the analysis of the results obtained from monitoring the physico-chemical characteristics of the analyzed product, a series of graphical representations were created with the aim of identifying potential correlations between these parameters.
This section outlines the variations observed in the studied parameters over a one-year period, with a focus on the influence of climatic factors on the specific physico-chemical properties of wheat seeds. The analysis is further detailed in the following subsections.
3.1. Identification of the Temporal Variation in Atmospheric Humidity and Product Moisture
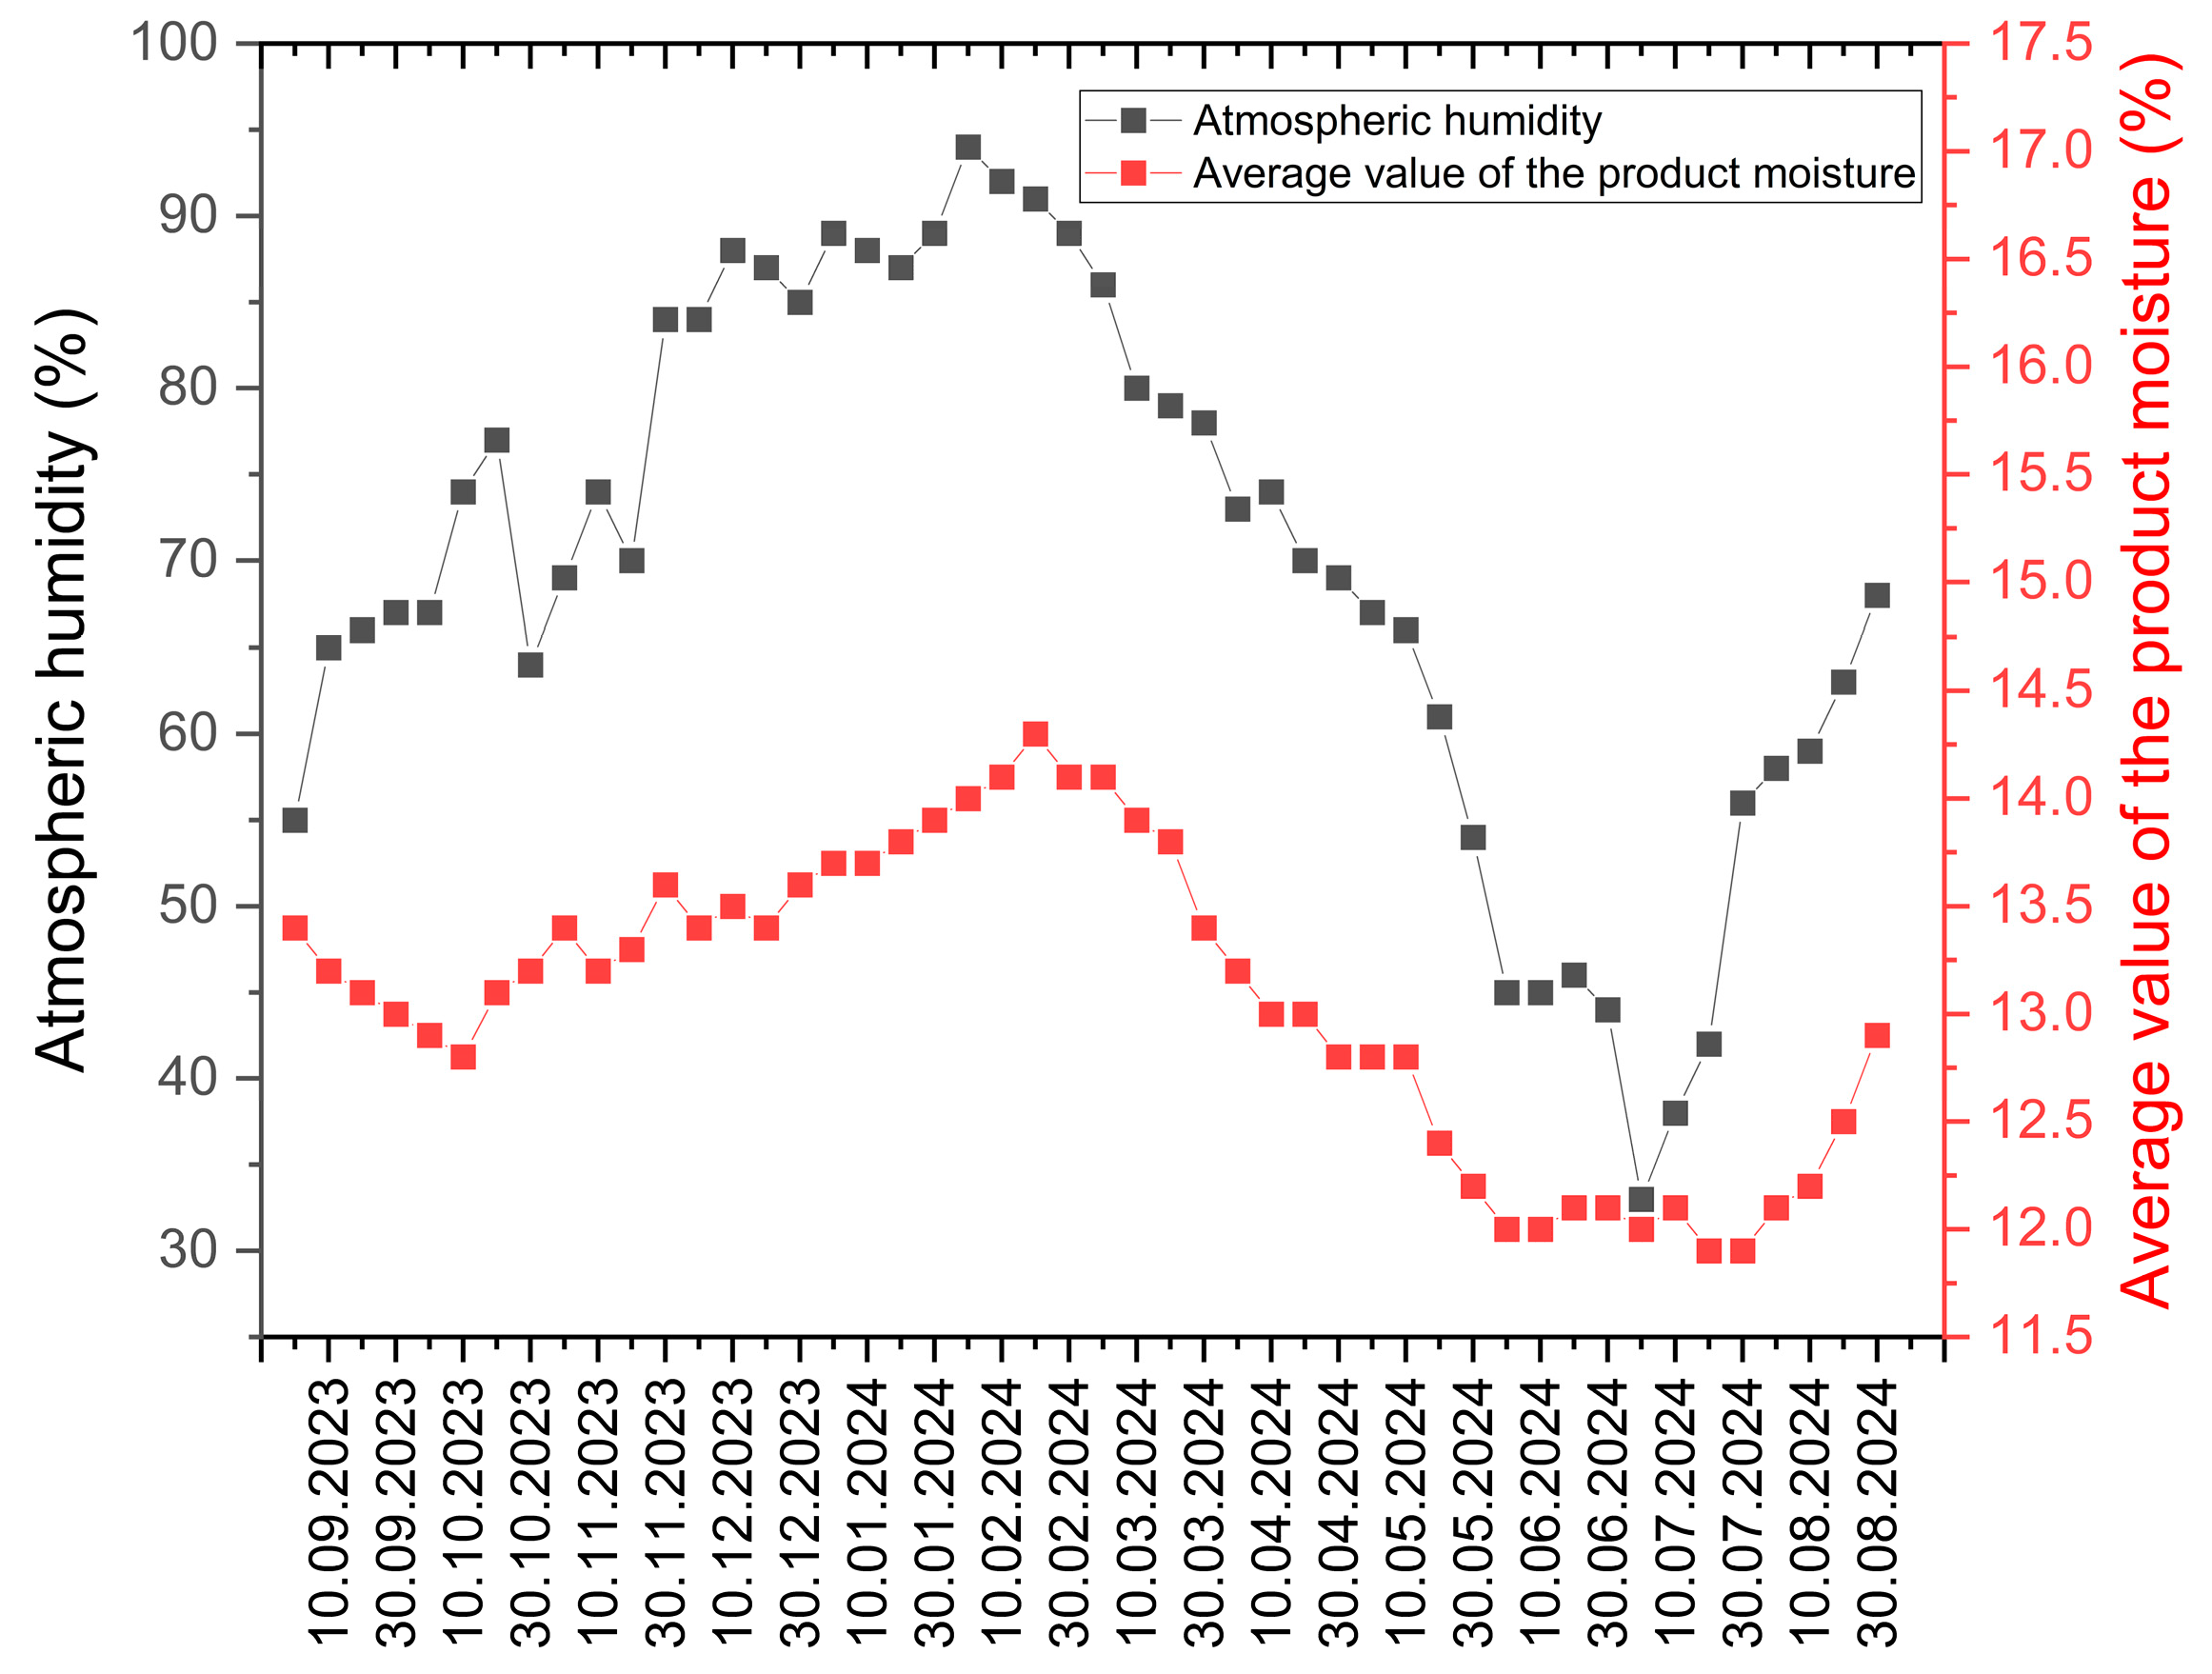
The variation in atmospheric humidity and product moisture throughout the analysis period is illustrated in
Figure 2, from which a strong correlation between the two parameters can be observed.
Based on the analysis presented in
Figure 2, a clear correlation can be observed between the two parameters, indicating a direct influence of the external environment on the hygroscopic behavior of the stored product. Atmospheric humidity exhibits a pronounced seasonal variation, peaking at over 94% during the winter months (February 2024), followed by a sharp decline to approximately 34% in the summer months (July 2024). The product’s moisture content follows a similar trend, albeit with lower amplitude, reaching a maximum of nearly 14% in February–March and a minimum below 12% in June–July. This trend confirms that stored wheat responds to ambient humidity fluctuations, although with a certain delay and attenuation due to the hygroscopic inertia of the grain mass. The strength of the relationship between atmospheric humidity and product moisture is confirmed by a correlation coefficient of approximately 0.99, highlighting the close interdependence of these variables. Therefore, controlling atmospheric humidity becomes essential for maintaining product quality, and the use of monitoring technologies and automated aeration systems is scientifically justified.
3.2. Identification of the Temporal Variation in Atmospheric and Product Temperature
The variation in atmospheric temperature and product temperature throughout the analysis period is illustrated in
Figure 3. Here as well, a strong direct relationship between the two studied parameters can be observed (correlation coefficient ≈ 0.995).
Based on the graphical analysis presented in
Figure 3, the following conclusions can be drawn:
a clear seasonal variation in atmospheric temperature is observed, with higher values during the autumn months (September–October), a progressive decrease during the winter months (December–February), followed by a steady increase throughout spring and summer (March–August);
the product temperature follows the same general trend, but with lower amplitude and a noticeable time lag, reflecting the thermal inertia of the stored wheat mass.
This difference between the two curves is essential for understanding the thermal behavior of the product under storage conditions. During the colder months, the product retains heat for a longer period, while in the warmer months, it heats up more slowly than the surrounding air. This phenomenon can be explained by the physical properties of wheat, which has a high heat capacity and low thermal conductivity.
3.3. Identification of the Temporal Variation in Gluten and Protein Content
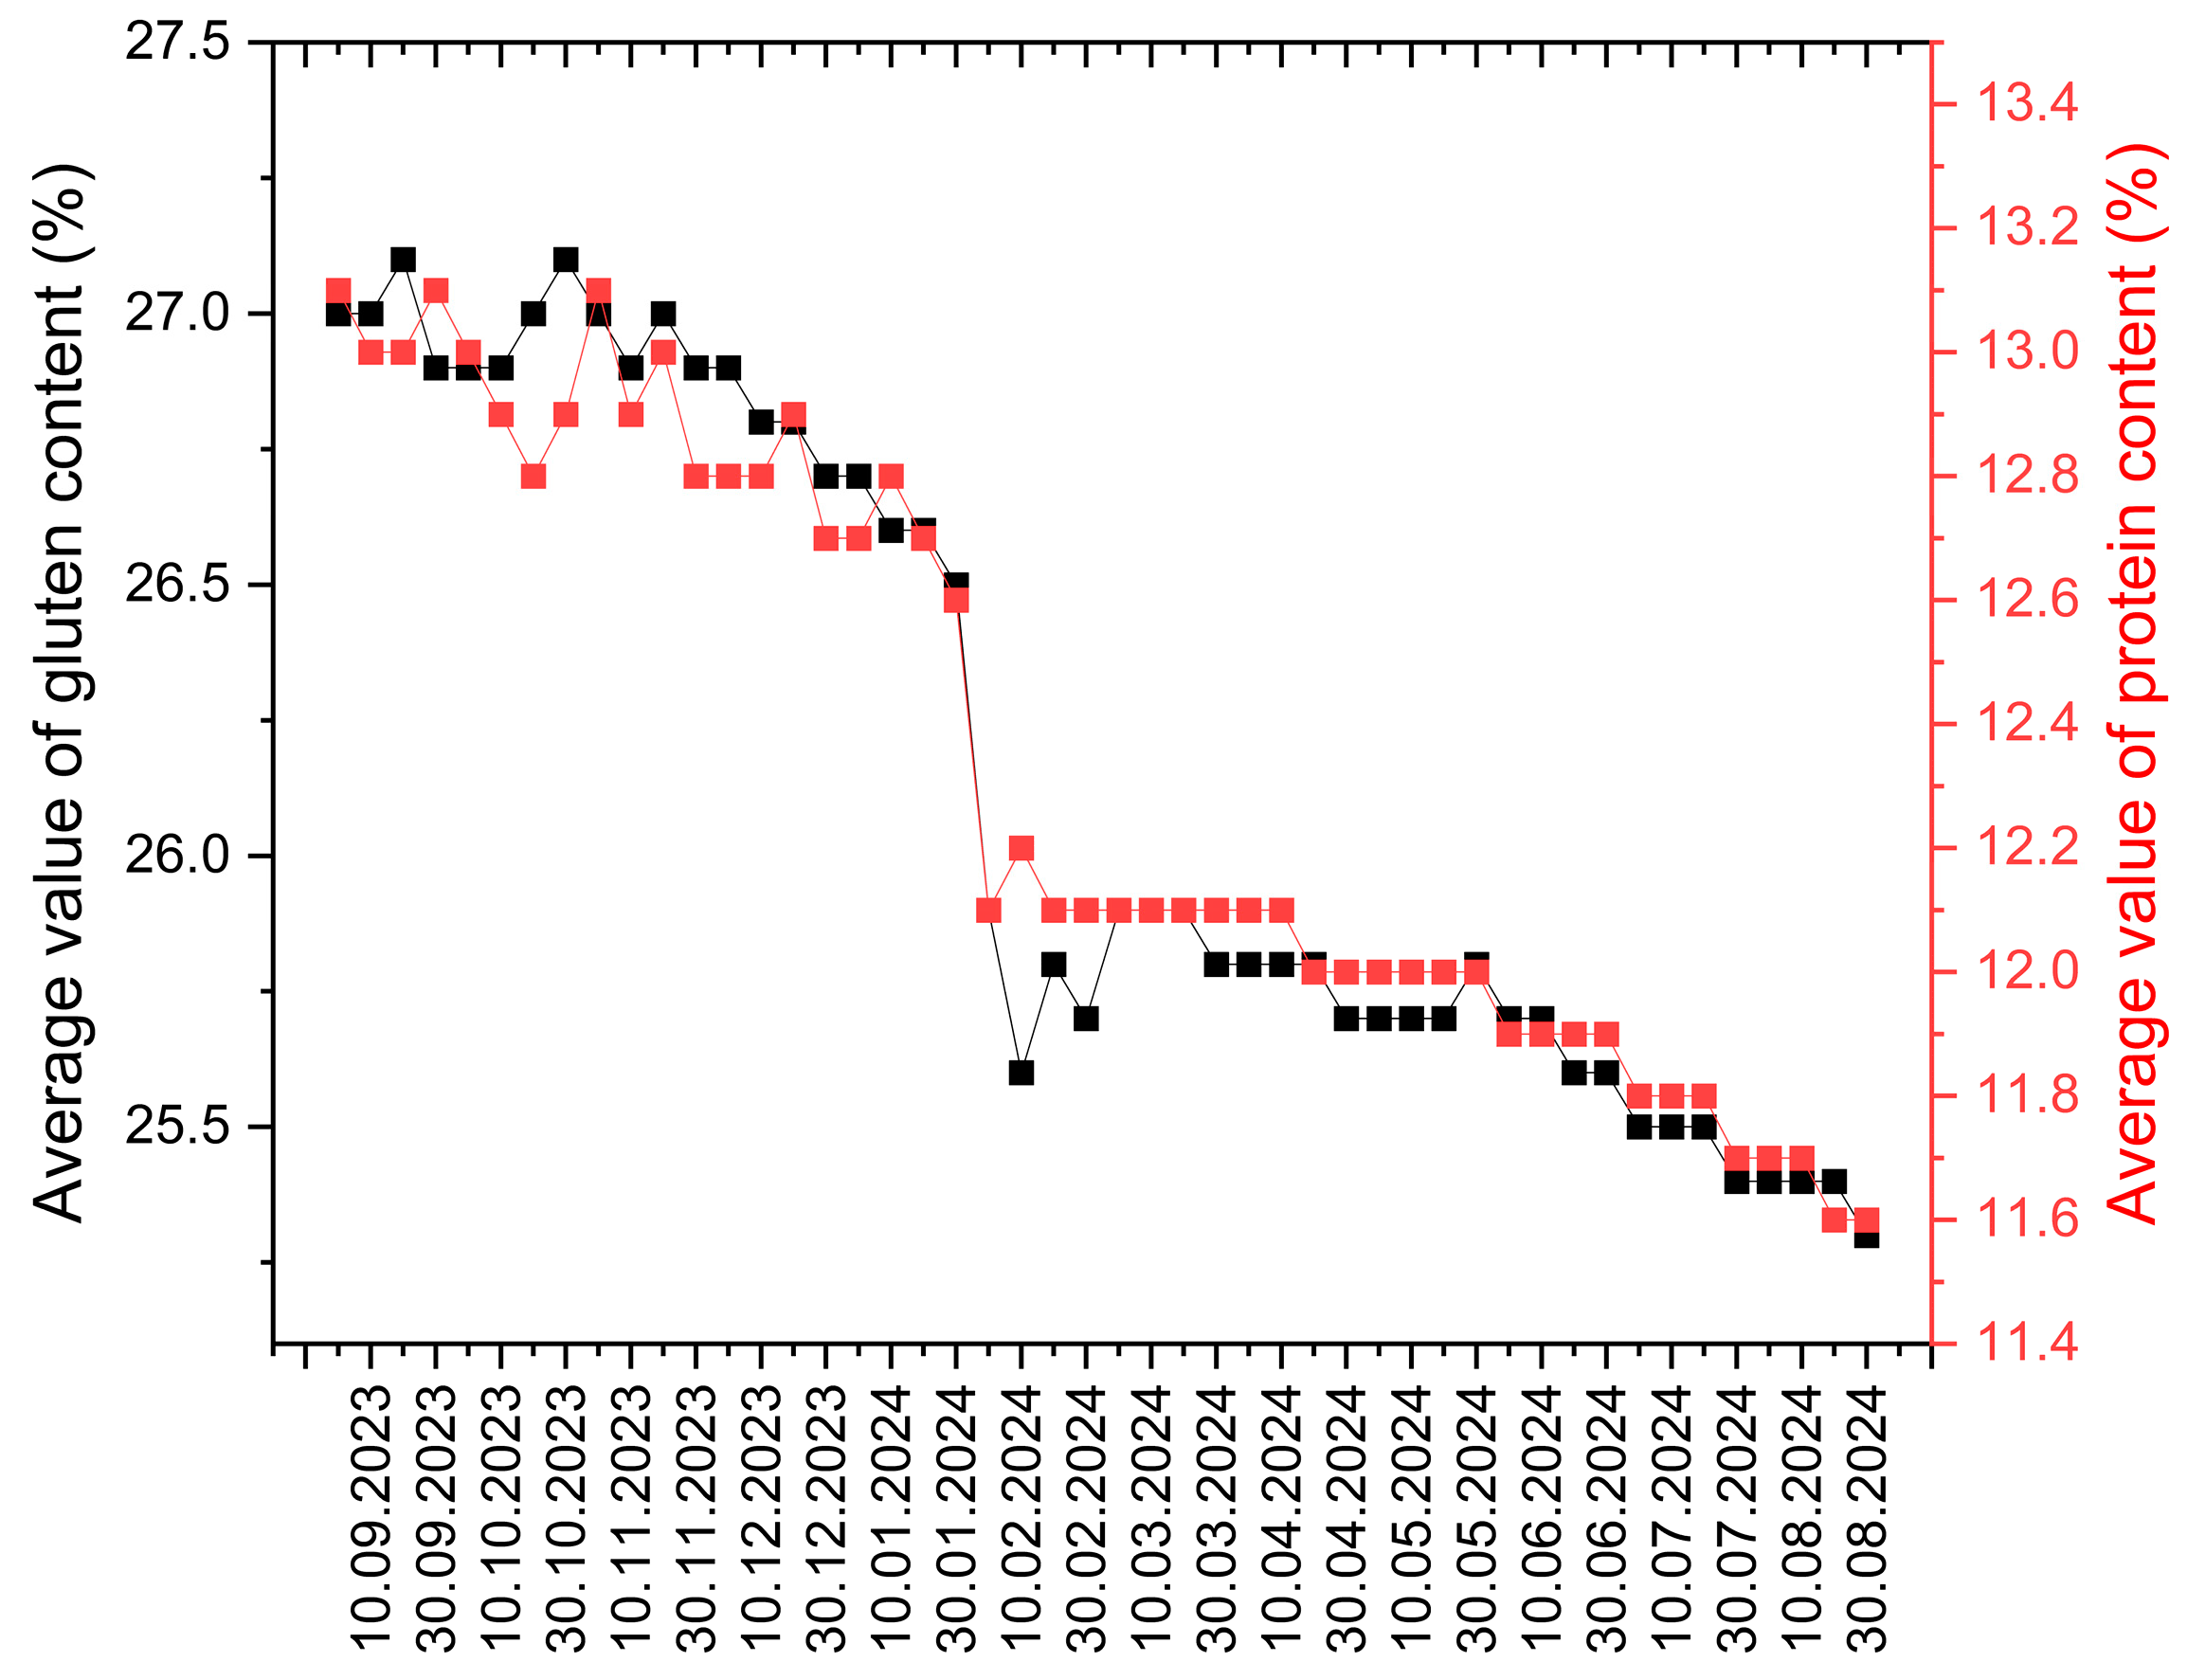
Analyzing the temporal variation of gluten and protein content reveals a strong correlation between the two parameters (correlation coefficient ≈ 0.993), as illustrated in
Figure 4.
Based on the graphical analysis presented in
Figure 4, several key observations can be made. Over the one-year monitoring period, both gluten and protein content exhibit a general downward trend. At the beginning of the storage period, when the product was first placed in the warehouse, these values were relatively high, with gluten content around 27.1% and protein content close to 13.1%. As storage time increased, both parameters showed a stepwise decline, reaching their lowest levels during the summer months (July–August 2024), when gluten dropped below 26% and protein approached 11.6%.
This evolution suggests a progressive degradation in wheat quality during storage, likely influenced by climatic factors such as temperature and humidity. The reduction in protein and gluten content negatively impacts both the nutritional value and the baking quality of the wheat, which has direct implications for its industrial use.
Moreover, the correlation between the two variables is evident, as both follow a synchronized downward trend. This indicates a strong biochemical relationship between them, which can be explained by protein denaturation and enzymatic degradation processes, phenomena that are intensified under thermohygrometric stress conditions.
In addition, the observed decline may also reflect the cumulative effect of internal metabolic processes that continue post-harvest. Although the grain is no longer biologically active in the same way as during growth, residual enzymatic and oxidative reactions persist, gradually altering the molecular structure of the storage proteins. These subtle but continuous transformations contribute to the loss of functional properties, particularly those related to gluten elasticity and protein solubility, which are essential for processing performance.
3.4. Identification of the Temporal Variation in Hectoliter Mass
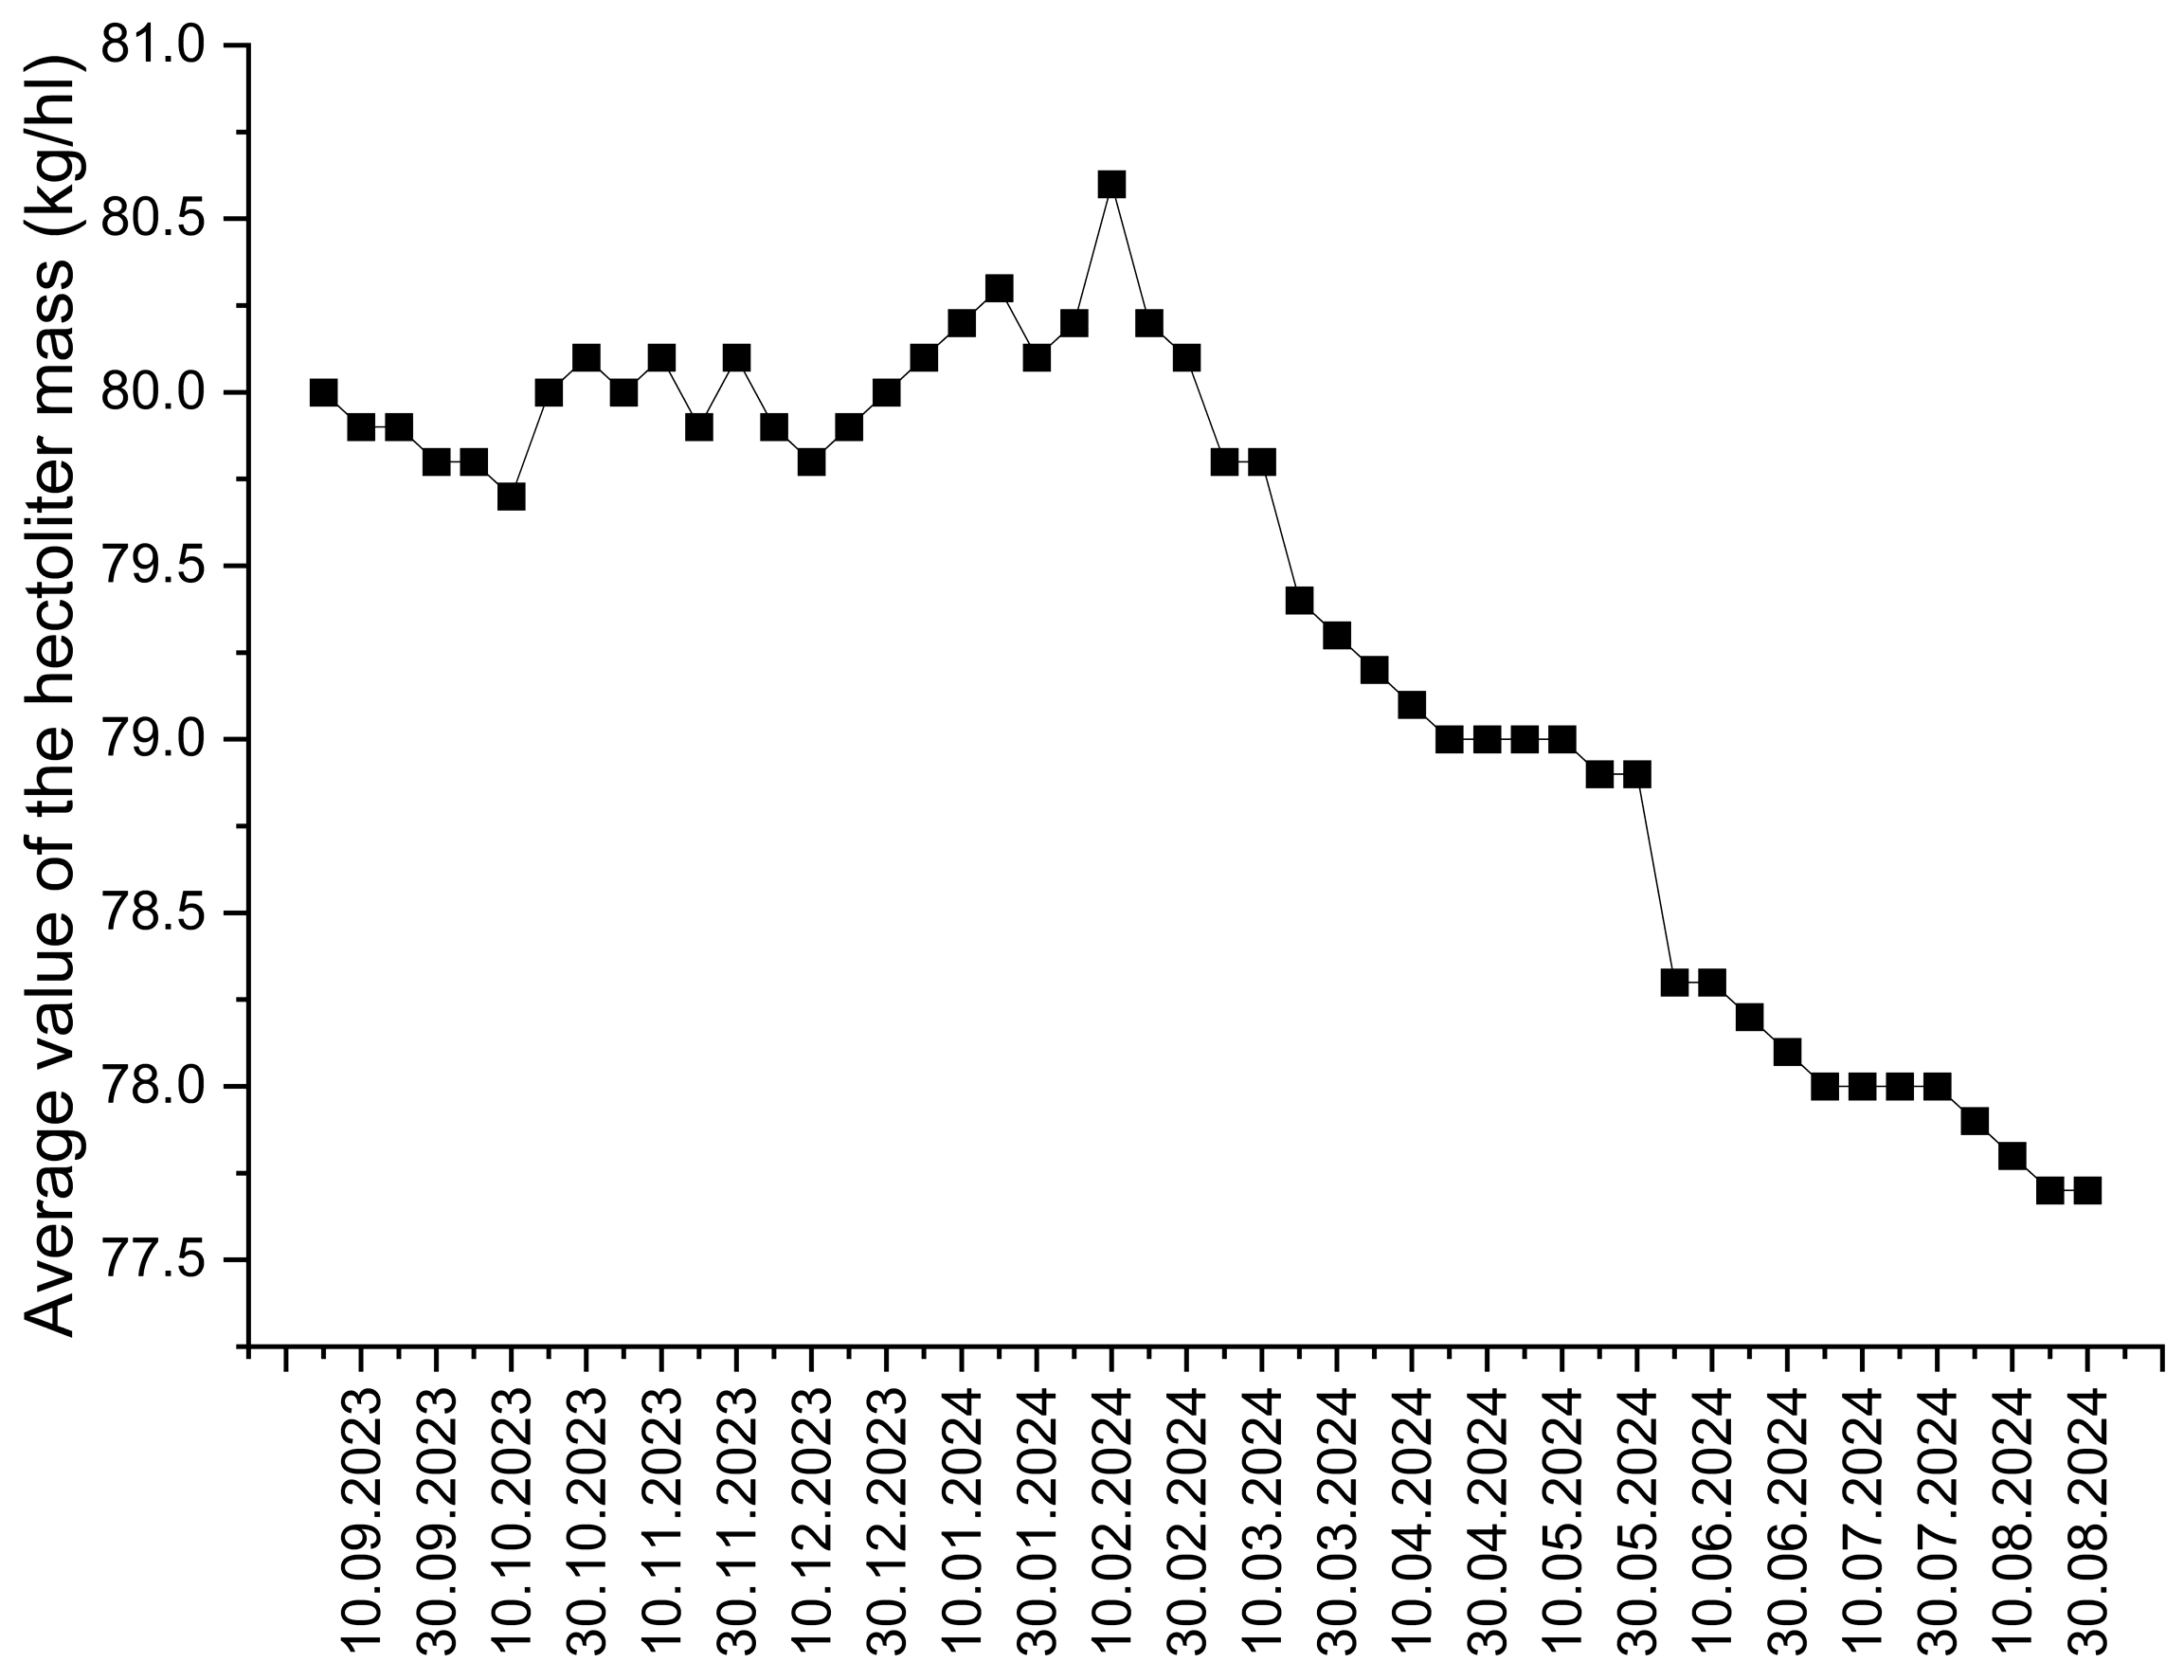
After a period of stability lasting until January 2024, the hectoliter mass began to decline progressively, reaching its lowest point in August 2024 (
Figure 5). This downward trend coincided with a significant increase in temperature during the same period, suggesting an indirect negative correlation between climatic factors and the physico-chemical quality of the stored wheat (correlation coefficient ≈ –0.981).
Based on the graphical analysis presented in
Figure 5, the following conclusions can be drawn:
First, hectoliter mass is a key indicator of the physical quality of cereals, reflecting bulk density and, implicitly, the preservation state of the product. At the beginning of the analyzed period, the hectoliter mass was around 80 kg/hl, indicating good quality of the freshly harvested wheat. During the initial months (autumn to early winter), the values remain relatively stable, suggesting favorable storage conditions. Starting in January 2024, a progressive downward trend became apparent, intensifying during the spring and summer months. By August 2024, the hectoliter mass dropped below 78 kg/hl, indicating a significant deterioration in the physical quality of the wheat. This decline can be attributed to moisture loss. The downward trend highlighted in the graph confirms the vulnerability of wheat to prolonged thermohygrometric stress and underscores the importance of continuous environmental monitoring in storage facilities.
4. Statistical Analysis
Beyond the previously identified correlations between the temporal variation of certain product characteristics and specific climatic factors, this study also aimed to statistically explore more complex interrelationships among these components. The statistical analysis was conducted using OriginLab 2019 software [
44]. Two types of statistical analyses were performed, the details of which are presented in the following section.
4.1. Principal Component Analysis (PCA)
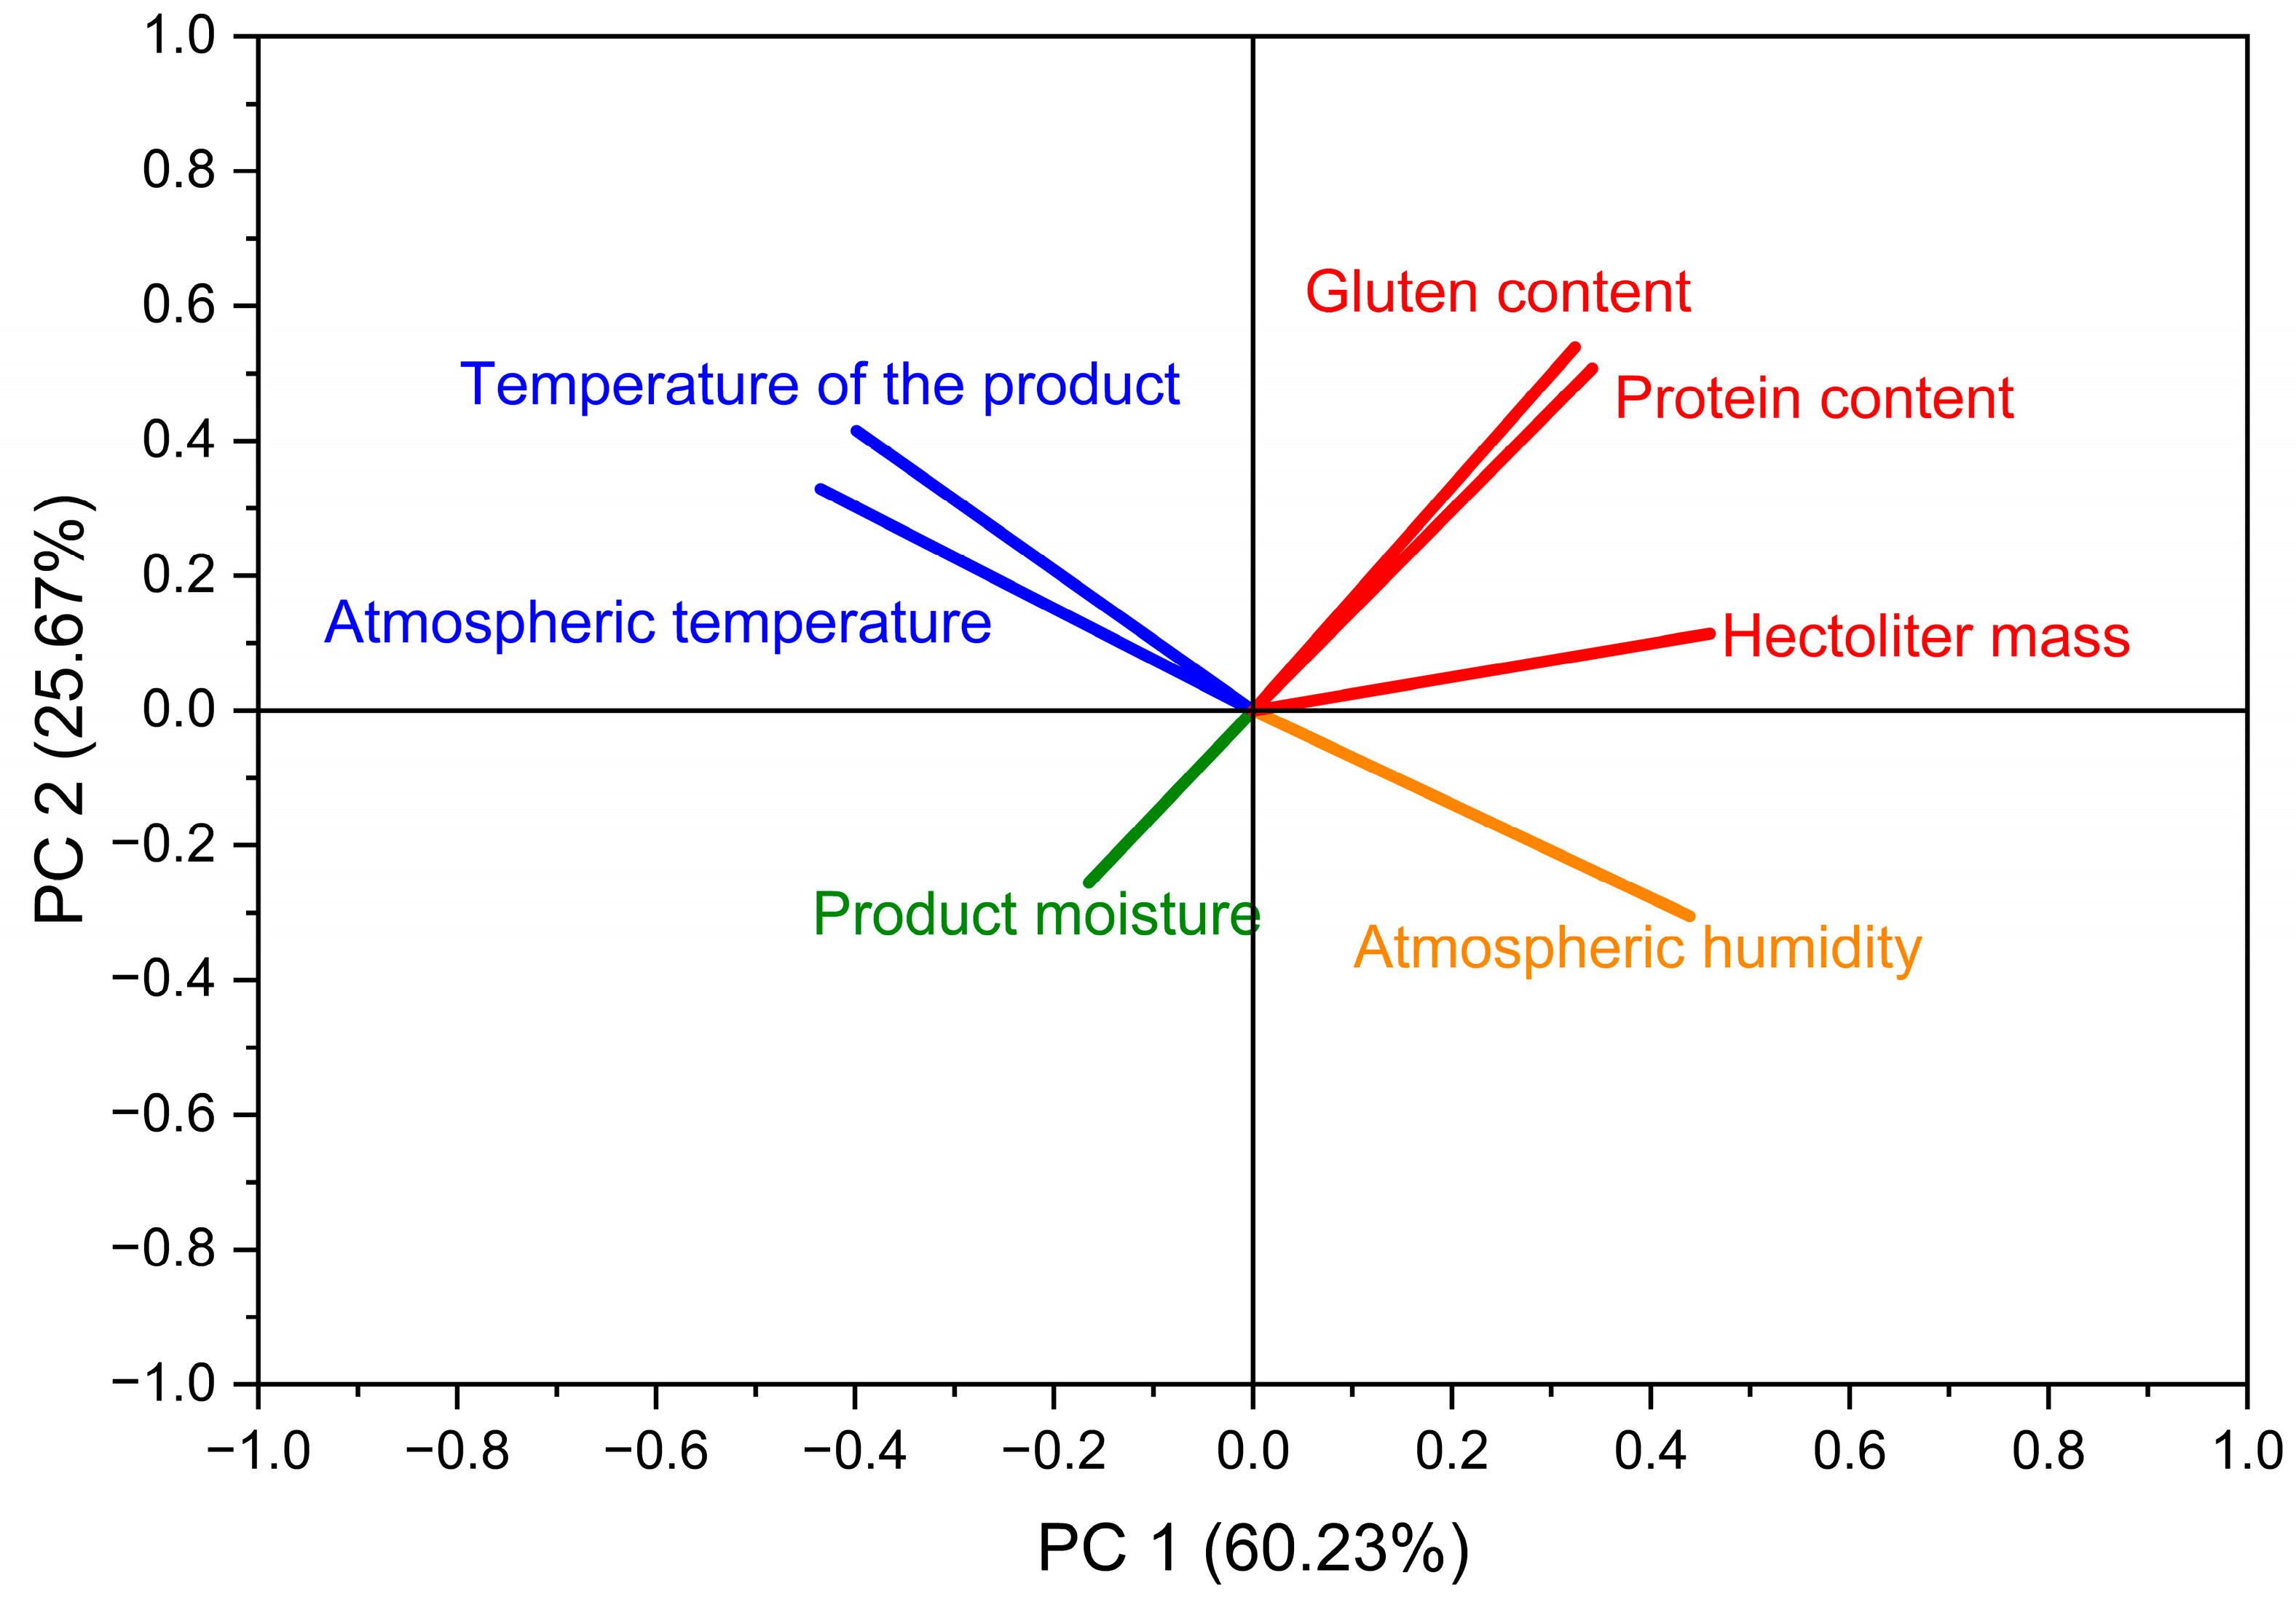
The first statistical analysis performed was PCA, and the resulting output is presented in
Figure 6.
Based on the biplot generated through PCA, a statistical method used to reduce the dimensionality of complex datasets while preserving as much of the essential information (i.e., total variance) as possible, several conclusions can be drawn.
The first two principal components provide a meaningful summary of the dataset. PC1, represented on the X-axis, accounts for 60.23% of the total variance, while PC2, shown on the Y-axis, explains an additional 25.67%. Together, they capture 85.9% of the total variance, indicating that the biplot offers a highly accurate representation of the data structure used in this study.
In terms of variable relationships, “Gluten content,” “Protein content,” and “Hectoliter mass” are strongly and positively associated with PC1, suggesting that these variables tend to vary together and contribute significantly to the first component. In contrast, “Product moisture” shows a negative correlation with PC1, indicating an inverse relationship with the previously mentioned variables. Meanwhile, “Temperature of the product” and “Atmospheric temperature” are positively correlated with PC2, implying that they influence the second component more strongly. “Atmospheric humidity” stands out by being negatively correlated with both PC1 and PC2, suggesting an inverse relationship with most of the other variables included in the analysis.
From a practical standpoint, this type of analysis is particularly useful for identifying clusters of correlated variables, reducing data redundancy, and simplifying the visualization of complex interdependencies. It also serves as a valuable tool for classification, clustering, or identifying the main factors influencing a process, for instance, assessing the quality of a food product in relation to environmental conditions and its compositional attributes.
The PCA biplot highlights a strong relationship between protein and gluten content, both of which are negatively correlated with product moisture. Additionally, atmospheric conditions, specifically temperature and humidity, exert differing influences on the product’s quality-related variables. This suggests that these environmental factors may play a significant role in modeling or controlling quality, depending on the processing or storage environment.
4.2. Hierarchical Cluster Analysis (HCA)
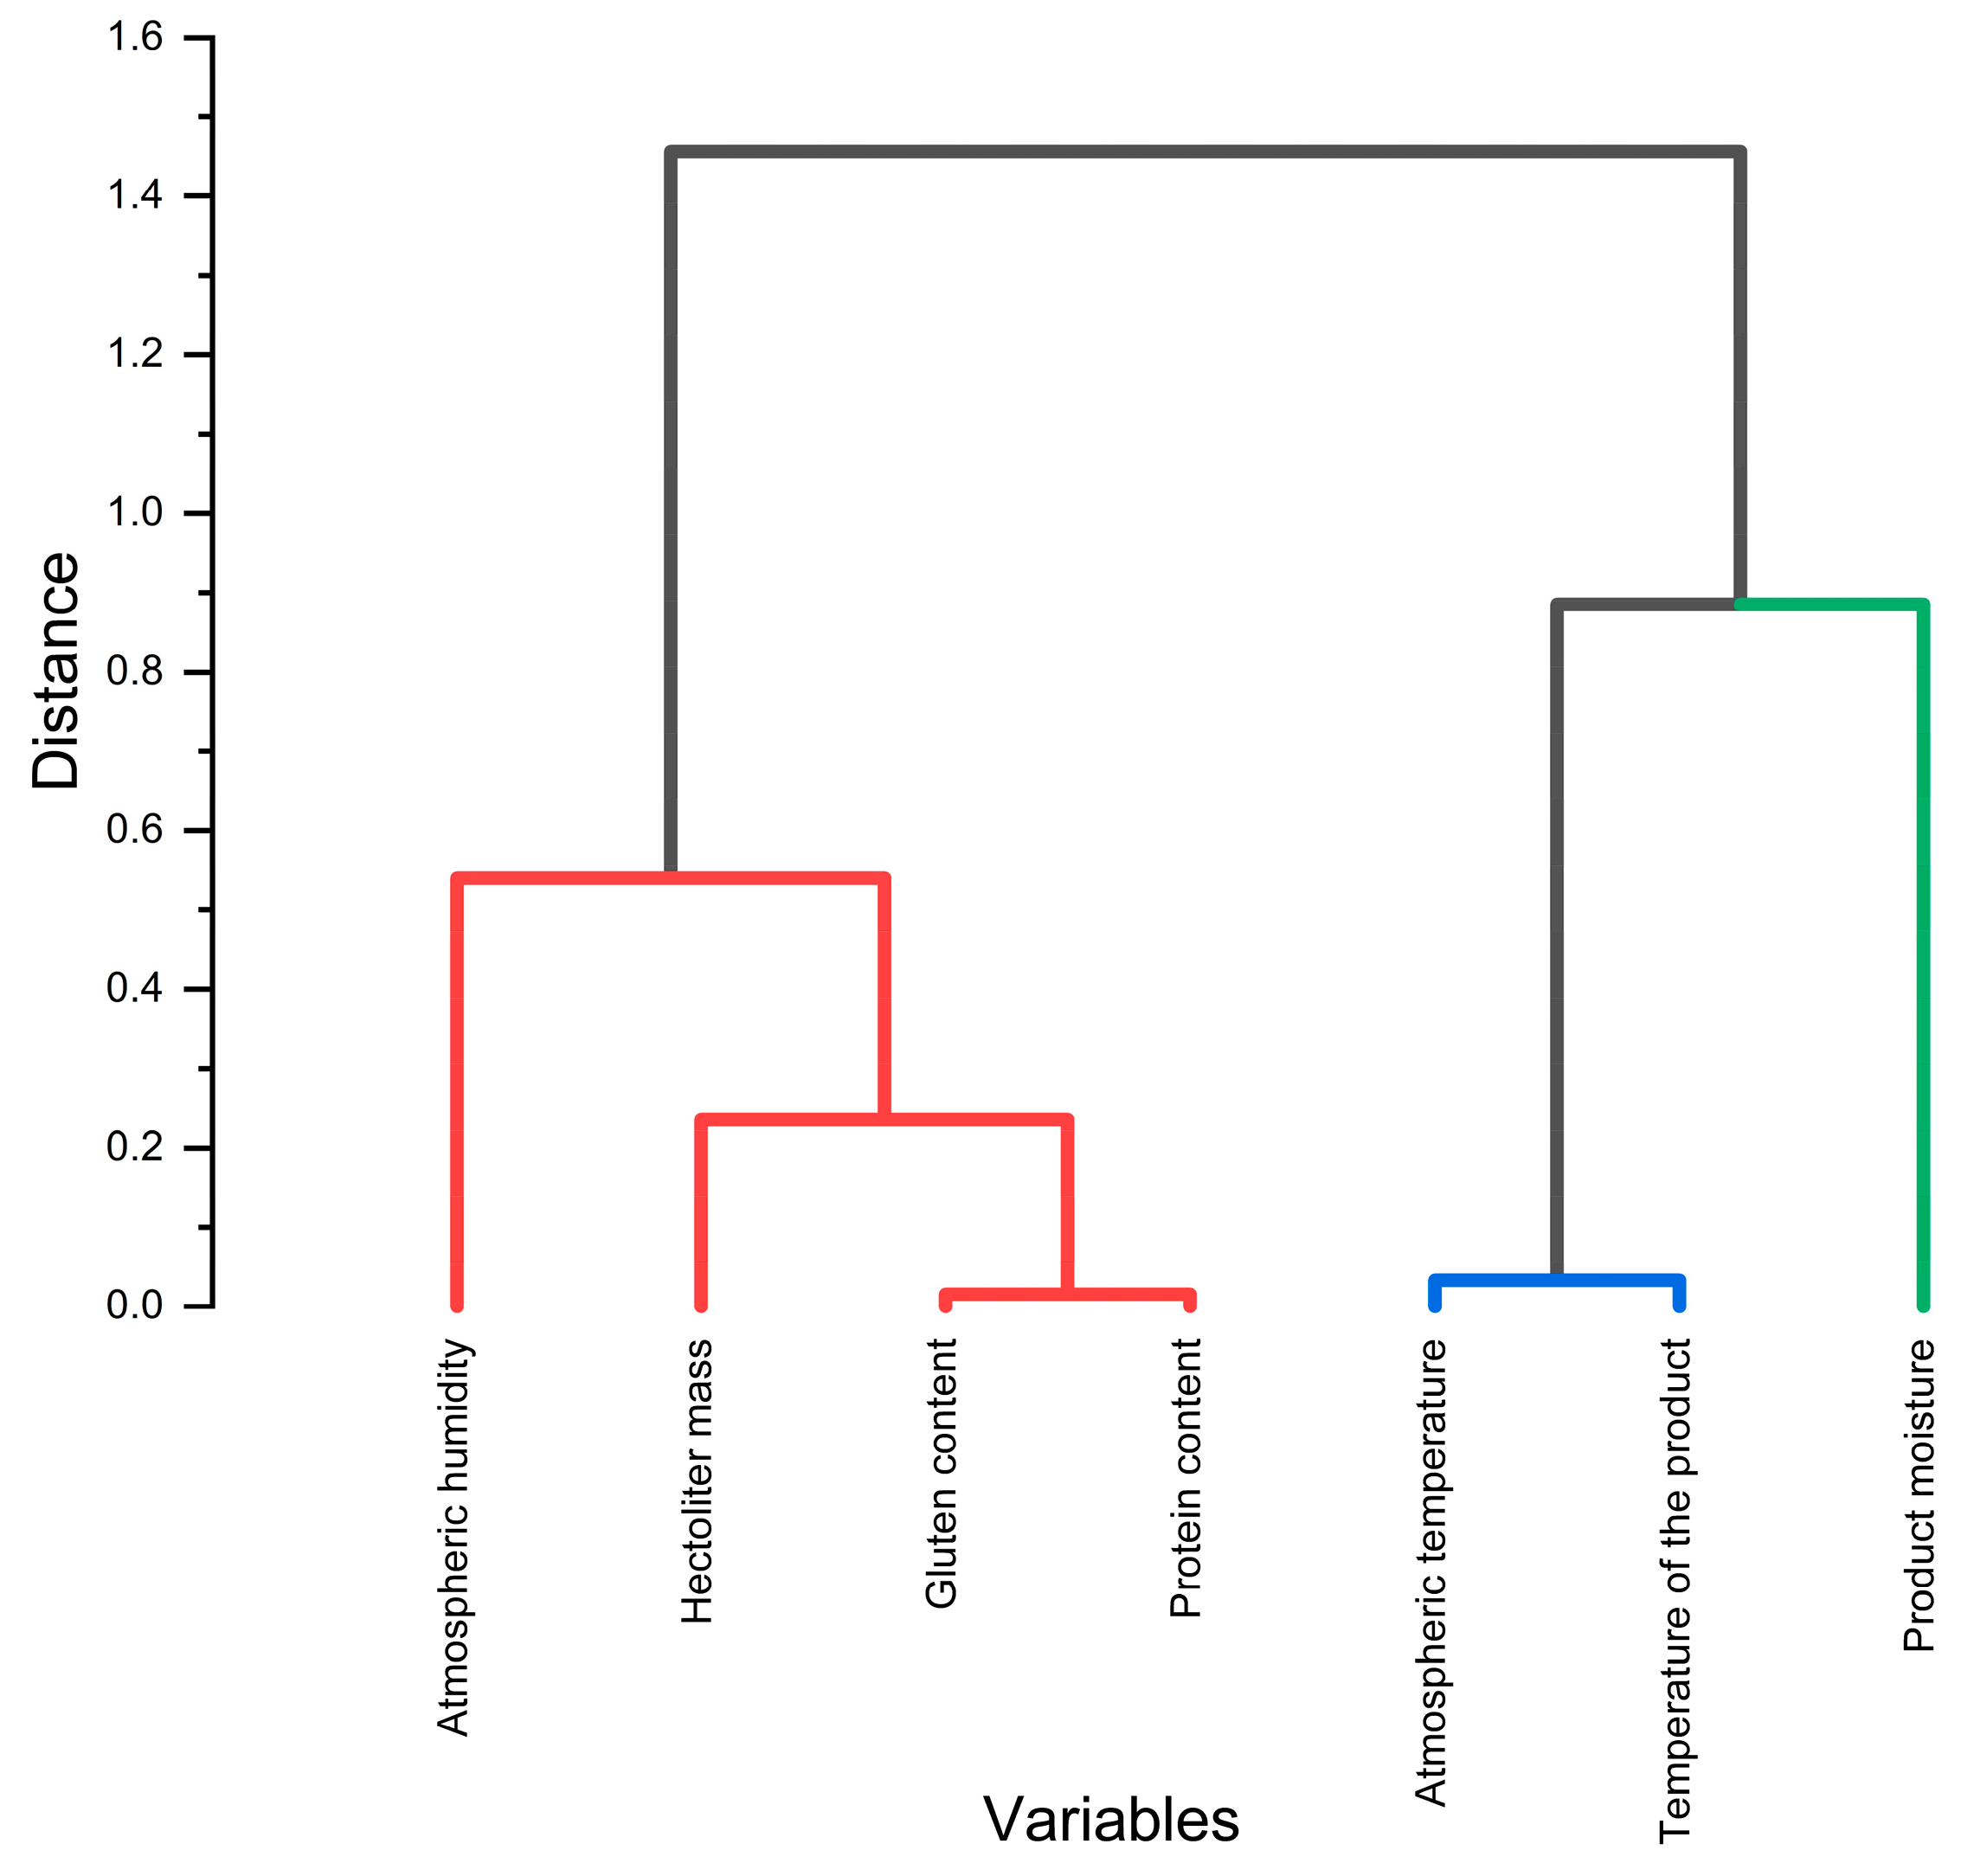
Following the results obtained through PCA, a second statistical method HCA, was applied. The outcome of this analysis is presented in
Figure 7.
Following the analysis of the graphical representation in
Figure 7, several conclusions can be drawn. The Y-axis represents distance or dissimilarity. It indicates the degree of difference between clusters. A higher value corresponds to greater dissimilarity between the merged groups. In this case, the distances range from 0.0 to 1.6. Regarding the dendrogram structure, variables that are closer together (linked at a shorter distance on the Y-axis) are statistically more similar. Based on this observation, the following clusters were identified. First order clusters include the grouping of gluten content and protein content at a short distance, suggesting a strong correlation between them, forming cluster 1. Similarly, atmospheric temperature and temperature of the product are closely linked, which is physically logical, forming cluster 2. Second-order clusters show that hectoliter mass is closely correlated with cluster 1. Product moisture is correlated with cluster 2, although the impact is approximately 20 percent. The third-order cluster indicates that atmospheric humidity has a minor influence on the first second-order cluster
As a result of this type of statistical analysis, a distance matrix was also generated, which is presented in
Table 2.
The dendrogram confirms the observations obtained from the PCA statistical analysis. There is a clear core of correlated variables, namely protein, gluten, and hectoliter mass. The temperature variables are correlated with each other but form a separate group. Product moisture behaves distinctly and, in some cases, varies inversely with the quality-related variables such as protein and gluten.
5. Generation of Mathematical Models
To highlight the quantitative relationships between environmental parameters (temperature and humidity) and the quality characteristics of stored wheat (moisture content, temperature, hectoliter mass, protein content, and gluten content), a series of mathematical models were generated using TableCurve 3D v4.0.05 software [
45]. This tool enables the identification of optimized regression functions that accurately describe the behavior of the analyzed variables in relation to climatic factors. The generated models provide a three-dimensional representation of the interdependencies between temperature, humidity, and the physicochemical parameters of the product, contributing to a deeper understanding of degradation phenomena.
The most relevant equations and resulting graphs are presented below (
Figure 8), derived primarily from the statistical analysis previously discussed. The first generated model illustrates the variation in product moisture as a function of atmospheric humidity and storage time (with time converted from calendar format to number of days, where day 0 represents the day the product was placed in storage). This dependency is not evident in the graphical representations resulting from the statistical analysis (
Figure 6 and
Figure 7), but it was selected based on logical reasoning.
Corresponding to this surface, we have Equation (1), a simple Fourier Series model of order 2 × 6, with a correlation coefficient (r
2) of 0.99.
In this equation, the terms a, b, c,…, ac represent coefficients specific to this variation, while x″ and y″ denote the scaled x and y parameters, normalized to the interval from 0 to π.
The second generated model corresponds to the variation in product temperature as a function of ambient temperature over a one-year period (
Figure 9). This dependency is supported by both types of statistical analyses.
The equation identified for this response surface corresponds to Equation (1), and for the parameter studied in this case, the correlation coefficient (r2) is 0.99. The terms a, b, c,..., ac represent coefficients specific to this variation.
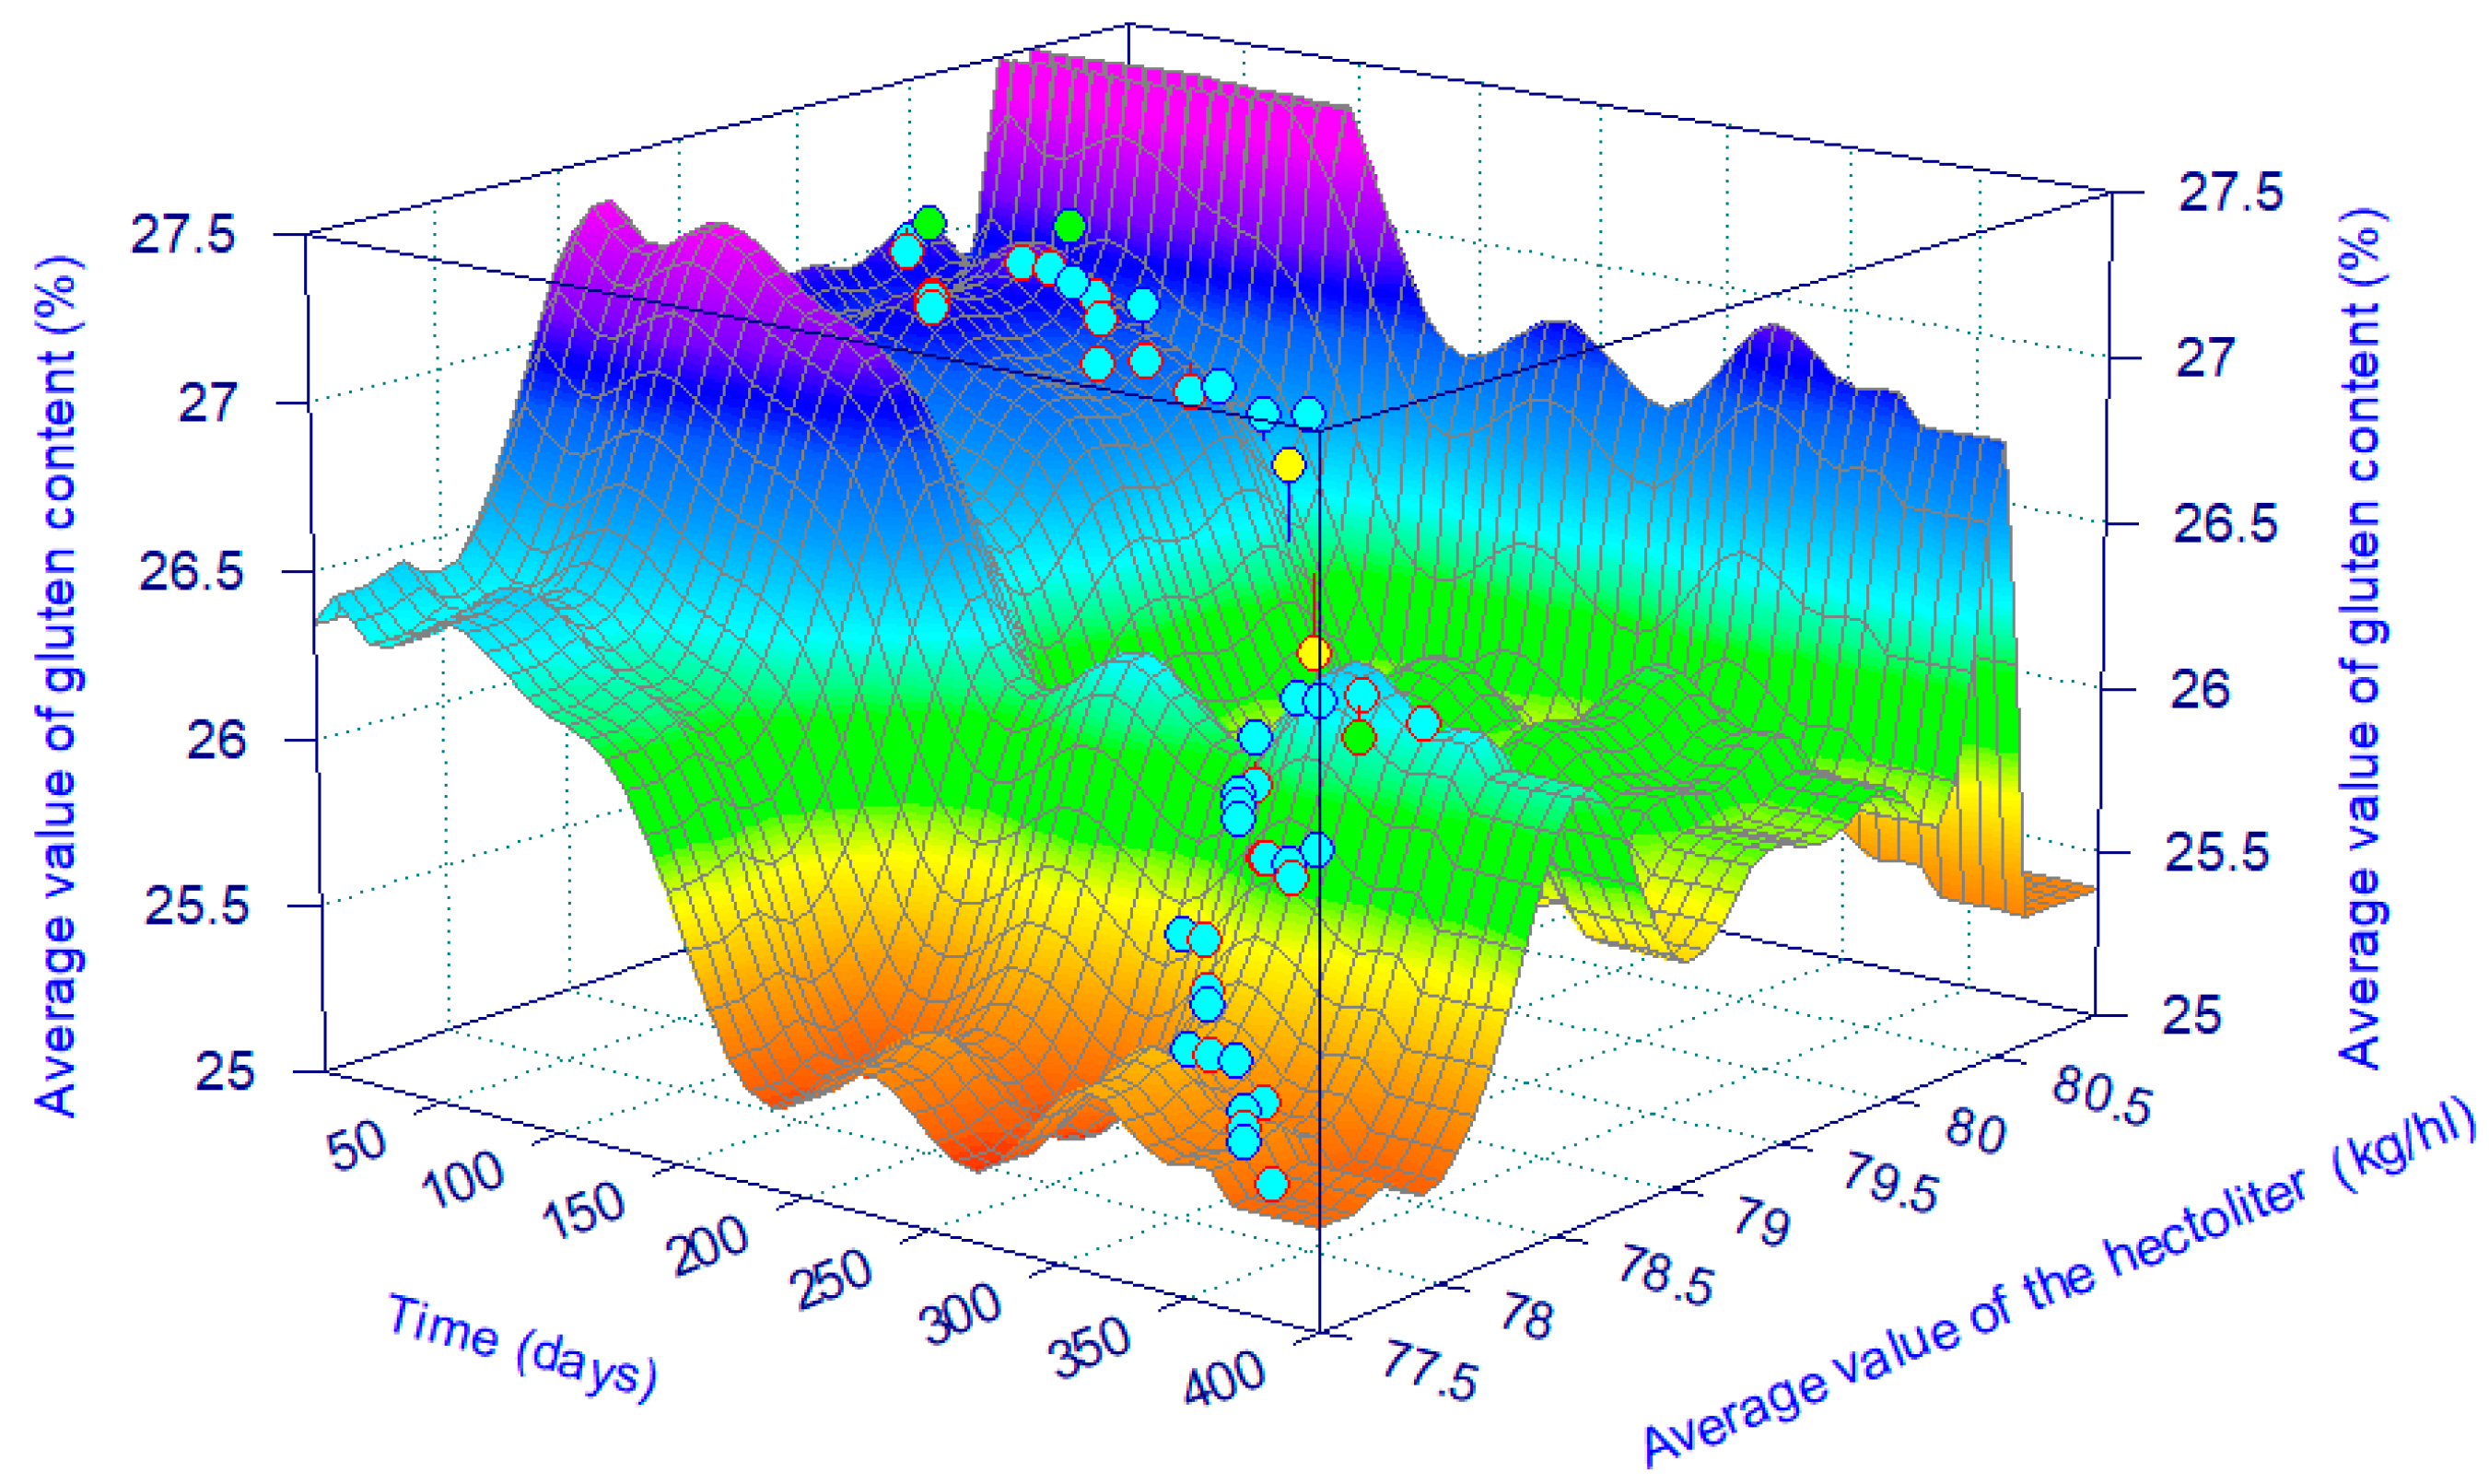
As a result of the statistical analysis, a set of three characteristics was identified as being strongly interdependent: hectoliter mass, protein content, and gluten content. Therefore, the next two mathematical models were developed based on these components. The first model describes the variation in protein content as a function of the variation in hectoliter mass over the studied period (
Figure 10).
For this parameter, Equation (1) was selected, with a correlation coefficient (r
2) of 0.98. The second model describes the variation in gluten content as a function of the variation in hectoliter mass over a one-year period (
Figure 11).
The same Equation (1) was selected for this parameter as well, but in this case, the correlation coefficient (r
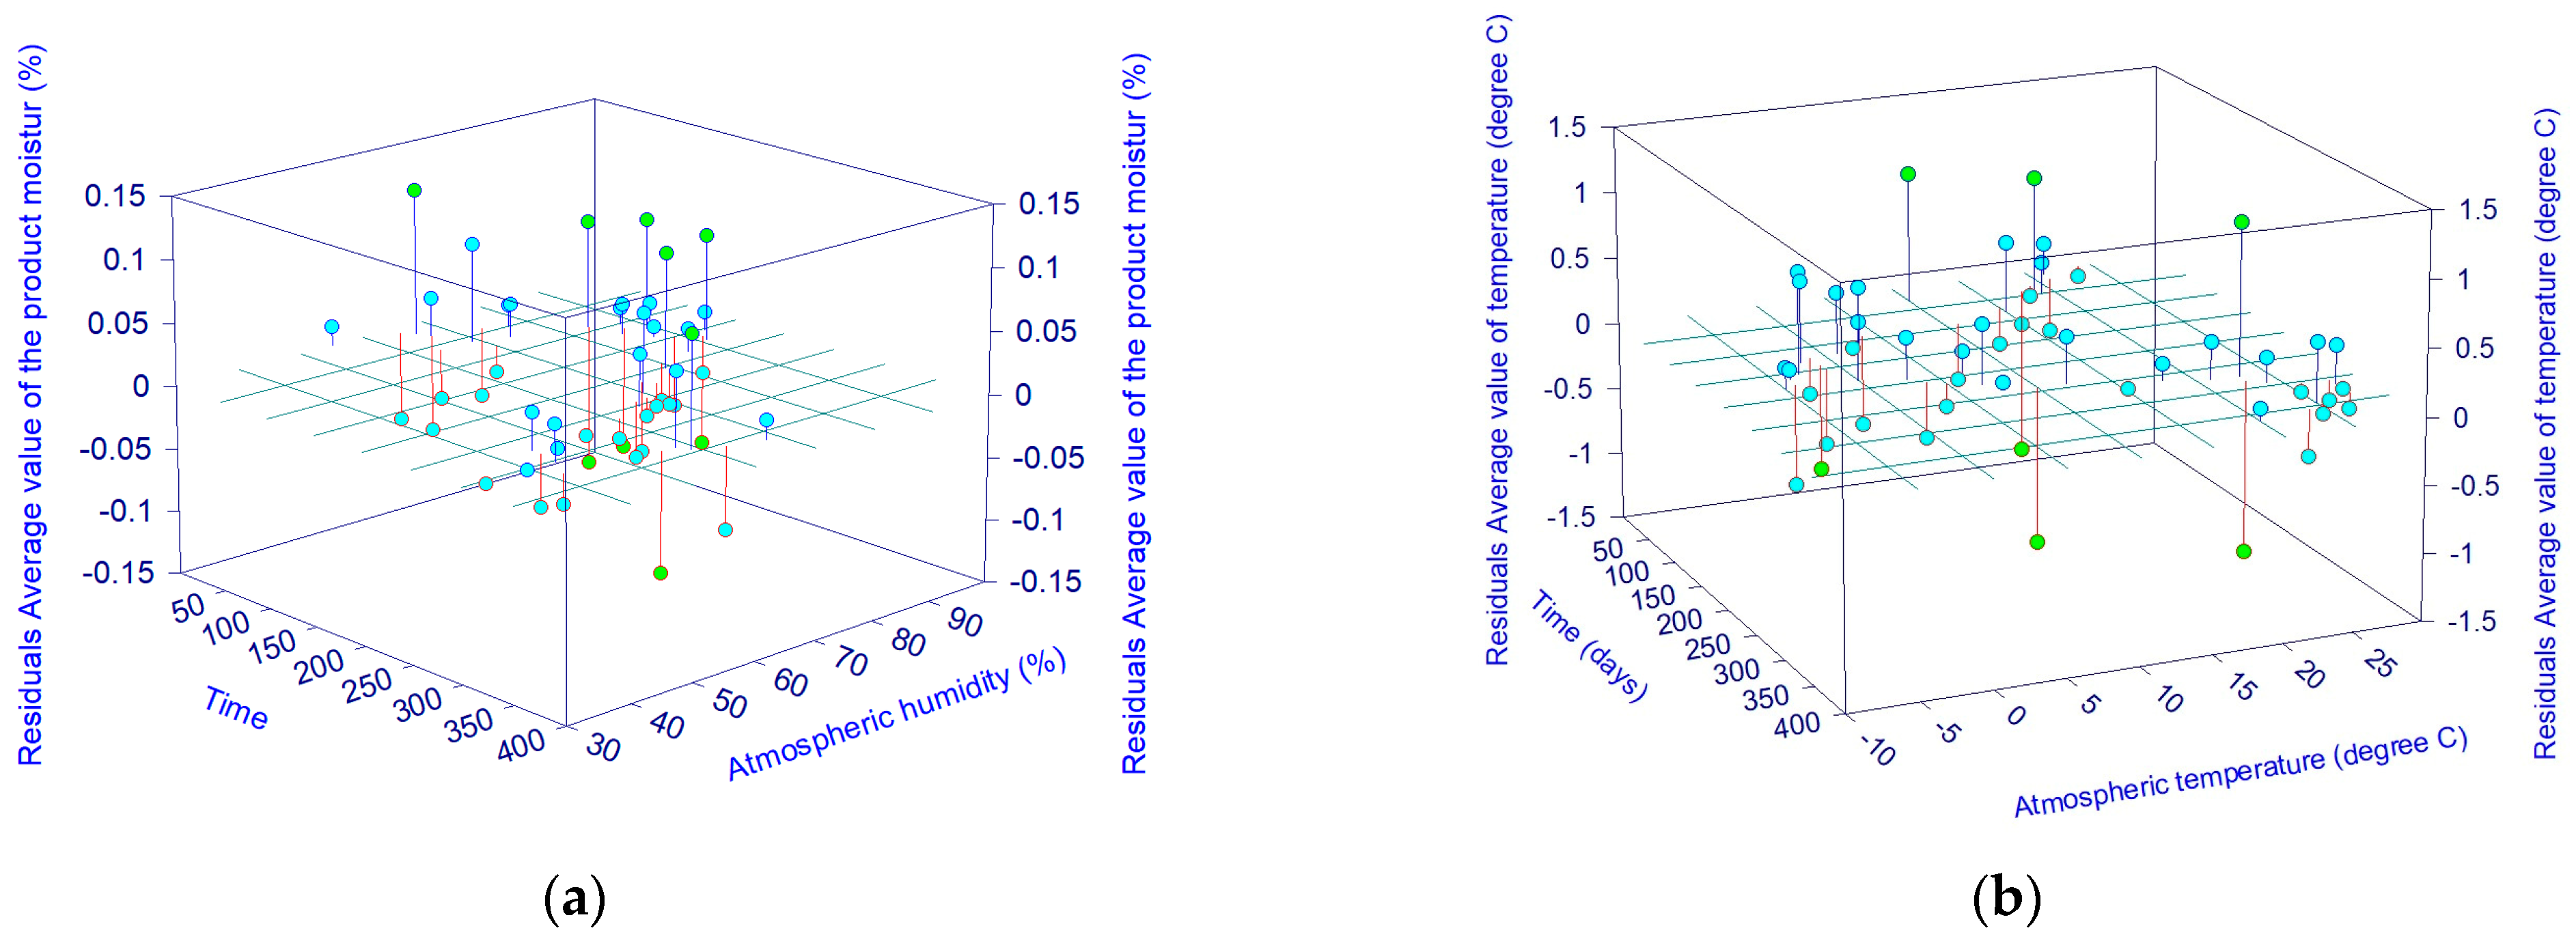
2) is 0.97. The residual plots (graphs representing the difference between the values obtained using the mathematical equations generated by the TableCurve 3D model and the actual values used in this study) are presented in
Figure 12.
Based on the analysis of the representations in
Figure 12, the following observations can be made. The largest difference, corresponding to the maximum values in these plots, is observed in the case of the mathematical model generated to describe the variation in product temperature as a function of ambient temperature over a one-year period. The smallest difference, also corresponding to the maximum values in these plots, is observed in the case of the mathematical model generated to describe the variation in product moisture as a function of atmospheric humidity and storage time.
6. Discussion
The analysis of data obtained in this study reveals several significant relationships between climatic parameters and the physicochemical properties of wheat stored over extended periods.
A key finding is the wheat’s varied response to seasonal fluctuations in temperature and humidity. Although the average values of quality indicators (gluten, protein, hectoliter weight) showed a gradual decline, the rate and extent of these changes were influenced by both the intensity and duration of exposure to adverse climatic conditions. This indicates that not only are the absolute values of temperature and humidity critical, but also the persistence of these conditions over time is essential.
Multivariate statistical analysis (PCA and HCA) enabled the identification of variable clusters that evolve in synchrony, as well as independent influencing factors. For instance, product moisture was directly affected by atmospheric humidity, yet it exhibited an inverse correlation with nutritional quality parameters. This suggests that internal moisture can serve as an early indicator of degradation, preceding noticeable changes in gluten or protein content. Beyond ambient conditions, the decline in protein and gluten content can be attributed to endogenous enzymatic activity, particularly that of proteases, which gradually degrade storage proteins during the storage period. These enzymes may become active even under moderate humidity, contributing to the loss of gluten quality. Additionally, oxidative stress and metabolic processes associated with the natural aging of grains can alter the three-dimensional structure of proteins, affecting their solubility and ability to form functional networks in dough. Thus, even under controlled storage conditions, these physiological mechanisms can lead to the deterioration of protein integrity and functionality, with direct implications for the technological quality of the product.
The mathematical models developed in this study offer predictive insights into the evolution of wheat quality under varying environmental conditions. Although the high correlation coefficients (r2 > 0.97) demonstrate a strong fit with experimental data, it is important to emphasize that these models are specific to the study’s context (natural storage, temperate climate). Applying them to different conditions would require recalibration and further validation.
Another noteworthy aspect is the effectiveness of modern monitoring systems (LoRaWAN), which facilitated not only automated data collection but also the integration of this data into analytical and decision-making processes. This highlights the potential of digital technologies in agriculture, particularly in the context of climate change, where adaptability and rapid response are increasingly vital.
In conclusion, the findings underscore that sustained wheat quality preservation over a 12-month period is not determined by a single factor, but rather by the complex interplay between environmental conditions, the product’s physicochemical characteristics, and the monitoring and control technologies employed. This study thus provides a robust foundation for developing integrated conservation strategies with practical and research applications.
Nevertheless, this study presents several limitations. Firstly, it was conducted in a single location in Romania (Podoleni, Neamț County), characterized by a temperate-continental climate. As a result, the findings cannot be generalized to regions with different climatic conditions (e.g., tropical, arid, oceanic) without further recalibration and validation. Secondly, the research focused solely on natural storage, without active control of temperature or humidity, which limits its applicability to modern storage systems. Although a one-year period is significant, cereal degradation may continue beyond this timeframe. This study did not investigate long-term effects (beyond 12 months), which could be relevant for strategic reserves or large-scale commercial stocks. Additionally, only the common wheat variety RO 1 (Triticum aestivum L.) was used; other varieties may behave differently under similar conditions, meaning the conclusions are not universally applicable. While the predictive models developed (with r2 > 0.97) demonstrate high accuracy, they are valid only under the specific conditions and parameters studied, and their application in other contexts requires recalibration. This study also refers to qualitative losses but does not address quantitative losses or provide a concrete assessment of economic impact (e.g., financial losses, additional processing costs). Finally, although the risk of mycotoxin contamination is acknowledged, no microbiological data or sensory analyses (such as smell, taste, or appearance) are presented.
Consistent with findings reported in the literature, the present study highlights the impact of temperature and humidity on wheat quality during storage. Across all referenced works, including this one, a decline in protein content, gluten strength, and hectoliter mass was observed, particularly under conditions exceeding 25 °C and relative humidity above 65%. In both this study and [
13], a measurable reduction in protein and gluten levels during storage was confirmed. Additionally, [
12] demonstrated that temperatures above 40 °C lead to significant losses in germination capacity and vigor in stored cereals.
7. Conclusions
Following the analysis conducted in this study, several key conclusions have emerged:
The preservation of wheat quality over a 12-month period is strongly influenced by the dynamics of climatic factors, particularly fluctuations in temperature and relative humidity. This investigation confirms that variations in these parameters lead to significant changes in the physicochemical properties of wheat, notably reflected in reduced protein content, deterioration of the gluten network, and decreased hectoliter weight, all critical indicators of both technological and nutritional quality.
Unfavorable thermo-hygrometric conditions, specifically ambient temperatures above 25 °C and relative humidity exceeding 65%, accelerate biochemical degradation processes in wheat. These conditions stimulate microbial activity and promote the proliferation of filamentous fungi, leading to the accumulation of secondary toxic metabolites (e.g., aflatoxins), which negatively impact food safety and the suitability of wheat for baking applications [
5]. In situations where the ambient relative humidity exceeds 65% for more than 48 h, it is recommended to initiate controlled ventilation by opening the air vents during periods of lower external relative humidity, typically early in the morning or late in the evening. Conversely, ventilation should be avoided when external humidity levels exceed 70% in order to prevent the introduction of additional moisture into the storage environment.
The application of multivariate statistical methods, PCA and HCA, revealed significant correlations between wheat quality parameters (gluten, protein, hectoliter weight) and environmental variables. PCA showed that the first two principal components account for 85.9% of the total data variability, indicating a coherent and robust internal structure of variable interdependencies.
A direct association was observed between ambient relative humidity and the internal moisture content of the grains, highlighting the strong influence of the external environment on the product’s hygroscopic behavior. Additionally, the internal temperature of the wheat mass lagged behind ambient temperature changes, a phenomenon attributed to the thermal inertia of granular biological material.
Throughout the 12-month storage period, wheat quality degradation progressed gradually, with more pronounced effects during warmer seasons (spring - summer). This was quantified by reductions in hectoliter weight, protein content, and gluten network integrity, underscoring the product’s vulnerability to prolonged thermo-hygrometric stress.
Beyond statistical analysis, this study also aimed to identify mathematical models using TableCurve 3D software. For each parameter studied, a single equation type was selected, with correlation coefficients (r2) ranging from 0.97 to 0.99.
These mathematical models demonstrated a high predictive capacity for wheat quality parameters in relation to climatic factors. They can serve as decision-support tools in grain storage management, enabling climate scenario simulations and optimization of storage conditions.
Residual analysis of the models showed a high degree of fidelity between simulated and actual values, particularly in the model correlating product moisture with atmospheric humidity and storage duration. This finding validates the methodological robustness and supports the practical applicability of the results.
The correlations identified between quality parameters (gluten, protein, hectoliter weight) and climatic factors suggest that these indicators can serve as sensitive markers for monitoring product degradation over time. Integrating these variables into an early warning system could help prevent significant losses in the agri-food chain.
The use of advanced climate monitoring and control technologies, such as LoRaWAN sensors, automated aeration systems, and digital analysis platforms, proved essential in maintaining quality parameters within acceptable limits. This study supports the implementation of such modern technological solutions as integral components of strategies to adapt to increasing climatic variability.
The results obtained hold high practical value for both fundamental and applied scientific research, as well as for the agro-industrial sector. They can form the scientific basis for public policies aimed at modernizing storage infrastructure, improving post-harvest efficiency, and reducing both qualitative and quantitative losses. The results of this study enable the prediction of wheat quality degradation based on climatic conditions, which can support early interventions, such as ventilation or relocation, to maintain quality parameters within industrial standards and optimize storage duration. The predictive models developed may be applied to stock rotation planning and adjustment of storage conditions, providing a practical tool for enhancing the efficiency of cereal management.
The validity of the conclusions is reinforced by their convergence with recent international research conducted in diverse climatic contexts (e.g., Tunisia, Hungary) [
5,
46]. This alignment highlights the global nature of cereal preservation challenges and the need for adaptive, scalable technological solutions to address emerging agro-climatic realities.
Finally, the study’s findings can contribute to the development of best practice guidelines for natural-condition cereal storage, tailored to regional climatic specifics. These guidelines could include recommendations on critical temperature and humidity thresholds, monitoring frequency, and the use of automated control equipment.
This study emphasizes the necessity of an interdisciplinary approach that combines expertise in agronomy, engineering, materials science, and information technology to develop integrated cereal preservation solutions. Such an approach is essential in the context of climate change and increasingly stringent food safety requirements.

