1. Introduction
In drilling operations, the ability of drilling fluids to transport cuttings significantly influences hole-cleaning efficiency, rate of penetration (ROP), and downhole operational safety—particularly in horizontal and extended-reach wells [
1,
2,
3,
4]. In recent years, fiber-reinforced drilling fluids have gained increasing attention for their enhanced suspension stability, modified rheological structure, and improved cutting transport efficiency in complex formations and large-particle environments [
5,
6].
Compared to conventional drilling fluids, fiber-containing fluids exhibit more intricate rheological behaviors, including nonlinear shear responses, viscoelasticity, and intensified particle–fluid–fiber interactions. The introduction of fibers not only alters macroscopic flow properties but also generates microscale network structures that substantially influence particle settling dynamics. However, the settling behavior of particles in fiber-laden non-Newtonian fluids remains inadequately characterized, with limited experimental data and the absence of a unified predictive framework.
For Newtonian fluids, both theoretical and empirical models describing particle settling and drag coefficients are well established and widely applied [
7,
8,
9,
10]. However, drilling fluids often exhibit non-Newtonian characteristics, with viscosity depending strongly on shear rate, making Newtonian-based models insufficient under such conditions [
11,
12].
To address this, various drag prediction models have been proposed for non-Newtonian fluids. Khan and Richardson [
13] incorporated shear-thinning effects, particle size, and interaction forces in their formulation. Wilson et al. [
14] introduced a generalized Reynolds number to account for apparent viscosity. Kelessidis and Mpandelis [
15] revised the Haider and Levenspiel model [
16] to better represent non-Newtonian flow regimes.
Further developments include Shah’s formulation linking drag to flow index and Reynolds number [
17], Song’s experimental model of wall factor effects in power-law fluids [
18], Okesanya’s quantification of rheological influence on settling velocity using a modified Reynolds numbers [
19], and Yan’s drag correlations for spherical and irregular sand particles in both power-law and Herschel–Bulkley fluids [
20].
Nonetheless, the presence of fibers introduces significantly more complexity into the multiphase flow dynamics of drilling fluids. Unlike conventional particulate additives, fibers not only alter the bulk rheological properties—often inducing viscoelastic or thixotropic properties—but also impose microscale structural constraints on particle mobility. These effects stem from fiber–particle entanglement, hydrodynamic shielding, and spatial confinement, which together disrupt flow uniformity and introduce anisotropic drag forces not accounted for by classical drag models.
In particular, fibers form interconnected networks that evolve with shear history, resulting in time-dependent resistance effects and potential yield stress amplification. These networks can act as dynamic scaffolds, modifying the effective viscosity non-uniformly across the flow field. This results in heterogeneous shear distributions, altered boundary layer behavior, and secondary flow phenomena, especially under inclined or eccentric annular flow conditions. Furthermore, the orientation and deformability of fibers add further degrees of freedom that influence both macroscopic transport and localized stress fields.
Despite these complexities, existing research on fiber-containing drilling fluids remains fragmented and narrowly focused. Natural fibers—such as lignin, coconut husk, and jute—have primarily been investigated for their environmental compatibility, biodegradability, and cost-effectiveness. However, their inconsistent morphology, batch-to-batch variability, and limited rheological tunability hinder broader applicability in engineered systems. Conversely, synthetic fibers—such as polypropylene, polyester, and nylon—offer greater consistency and design flexibility in terms of aspect ratio, surface chemistry, and thermal resistance, yet research on synthetic fibers has mostly concentrated on formulation and rheological tuning, with relatively few studies devoted to systematically evaluating their effects on particulate transport, drag evolution, or flow stability.
Current studies on particle settling in fiber-laden systems remain dispersed, relying on a mix of numerical simulations and experimental analysis. Harlen et al. [
21] showed that neglecting fiber contact forces underestimated drag in low-density fiber suspensions. Feist et al. [
22] demonstrated that settling velocity depends on fiber-to-particle size ratio and solution pH. Elgaddafi et al. [
23] proposed a semiempirical correlation linking fiber-induced drag to projected area and density differences. Liu et al. [
5] confirmed that fiber entanglement forms network structures that impede particle mobility.
In summary, particle settling in fiber-containing non-Newtonian fluids is governed by the interacting effects of fiber concentration, length, orientation, and the base fluid’s viscoelasticity. While various drag models for fiber suspensions have been proposed, none has successfully unified non-Newtonian rheological behavior and fiber structural effects into a comprehensive predictive framework.
This study aimed to systematically examine the settling behavior of spherical particles in power-law and Herschel–Bulkley fluids with varying fiber parameters. The novelty of this study lies in the inclusion of fiber-induced drag, which is absent in existing models based on fiber-free fluids. A composite drag coefficient model incorporating both fiber concentration and length is developed to elucidate the dominant force mechanisms acting on particles. The proposed model seeks to improve generality, parameterization, and engineering applicability, providing a rigorous theoretical basis and experimental support for the optimized design of fiber-containing drilling fluids.
3. Experimental Analysis of Sphere Settling Behavior in Non-Newtonian Fluids
To systematically investigate the settling characteristics of particles in different non-Newtonian fluids, a total of 107 valid datasets were obtained for spherical particle settling in power-law fluids and 81 datasets in Herschel–Bulkley fluids. These datasets span a wide range of particle diameters, densities, and fluid shear parameters, ensuring sufficient representativeness and diversity for comprehensive analysis.
To evaluate the applicability of existing drag coefficient models under such conditions, five representative empirical or semiempirical models were selected from the literature, including those developed by Khan and Richardson [
13], Kelessidis et al. [
15], Yan et al. [
20], and Okesanya et al. [
19]. These models, originally derived for power-law or Herschel–Bulkley systems, are summarized in
Table 4.
To quantitatively assess the prediction accuracy of these models, two error metrics were employed: Root Mean Square Error (RMSE) and Mean Relative Error (MRE). RMSE reflects the average deviation between predicted and experimental drag coefficients, while MRE provides a normalized measure of overall relative error across the dataset. The definitions are given by:
where
Nz is the number of data points,
Ctsm is the experimentally measured drag coefficient, and
Ctsp is the predicted value from the model.
The RMSE and MRE values are summarized in
Table 5.
As shown in
Table 4, the Kelessidis model exhibits the best overall performance for power-law fluids in terms of MRE, with an MRE of 10.71%, indicating robust predictive stability across the dataset. While the Yan model yields the lowest RMSE (1.22), suggesting high local accuracy, its higher MRE (14.41%) implies greater error dispersion across different flow regimes. The Khan model demonstrates moderate performance on both metrics. Taking into account both predictive accuracy and applicability across varied conditions, the Kelessidis model is deemed the most reliable for power-law fluids in engineering contexts.
In terms of terminal settling velocity prediction, further analysis reveals that both the Khan and Yan models yield results that align well with experimental observations. Considering both drag coefficient and terminal velocity predictions, the Kelessidis model consistently demonstrates superior stability and is recommended as a reference model for subsequent development and field application.
For Herschel–Bulkley fluids, as shown in
Table 4, the Yan model achieves the lowest RMSE, indicating improved local fitting. However, its MRE remains high at 22.33%, indicating limited global reliability. The Okesanya model, though theoretically incorporating yield stress and shear consistency effects, performs poorly under the present experimental conditions, with both RMSE and MRE reaching 30.77 and 26.90%, respectively, reflecting its narrow applicability range. In contrast, the Khan model, despite a slightly higher RMSE (29.18), produces the lowest MRE (16.31%) among the three, indicating more consistent performance across diverse conditions.
In summary, based on experimental data, the Kelessidis model is recommended for power-law fluids due to its balanced accuracy and engineering applicability, while the Khan model is identified as the most reliable for Herschel–Bulkley fluids, owing to its superior mean relative accuracy across varied rheological scenarios.
4. Rheological Characterization of Fiber-Containing Non-Newtonian Fluids
To elucidate the reinforcement mechanism by which fibers influence the rheological properties of non-Newtonian fluids, this study systematically investigated the effects of polyester fibers with varying concentrations and lengths on two representative base fluid systems: power-law fluids and Herschel–Bulkley fluids. These base fluids were prepared using Carbopol U20 aqueous solutions: unneutralized solutions represented power-law fluids, while neutralized solutions (via triethanolamine) represented Herschel–Bulkley fluids. As seen in
Figure 2, polyester fibers with a density of 1330 kg/m
3 were selected due to their chemical stability and engineering applicability, making them common additives for borehole stabilization and cutting transport enhancement.
A full-factorial experimental design was employed, covering four fluid concentrations (0.06%, 0.1%, 1%, and 2%), five fiber concentrations (0.03% to 0.15%), and three fiber lengths (6 mm, 9 mm, and 12 mm), resulting in 60 rheological datasets. Rheological measurements and model fitting were performed using an Anton Paar MCR 92 rheometer under controlled temperature conditions.
Table 6 summarizes the key nondimensional parameters used in this study, including particle Reynolds number ranges, fiber length, and fiber concentrations.
4.1. Effect of Fiber Concentration on Drilling Fluid Rheology
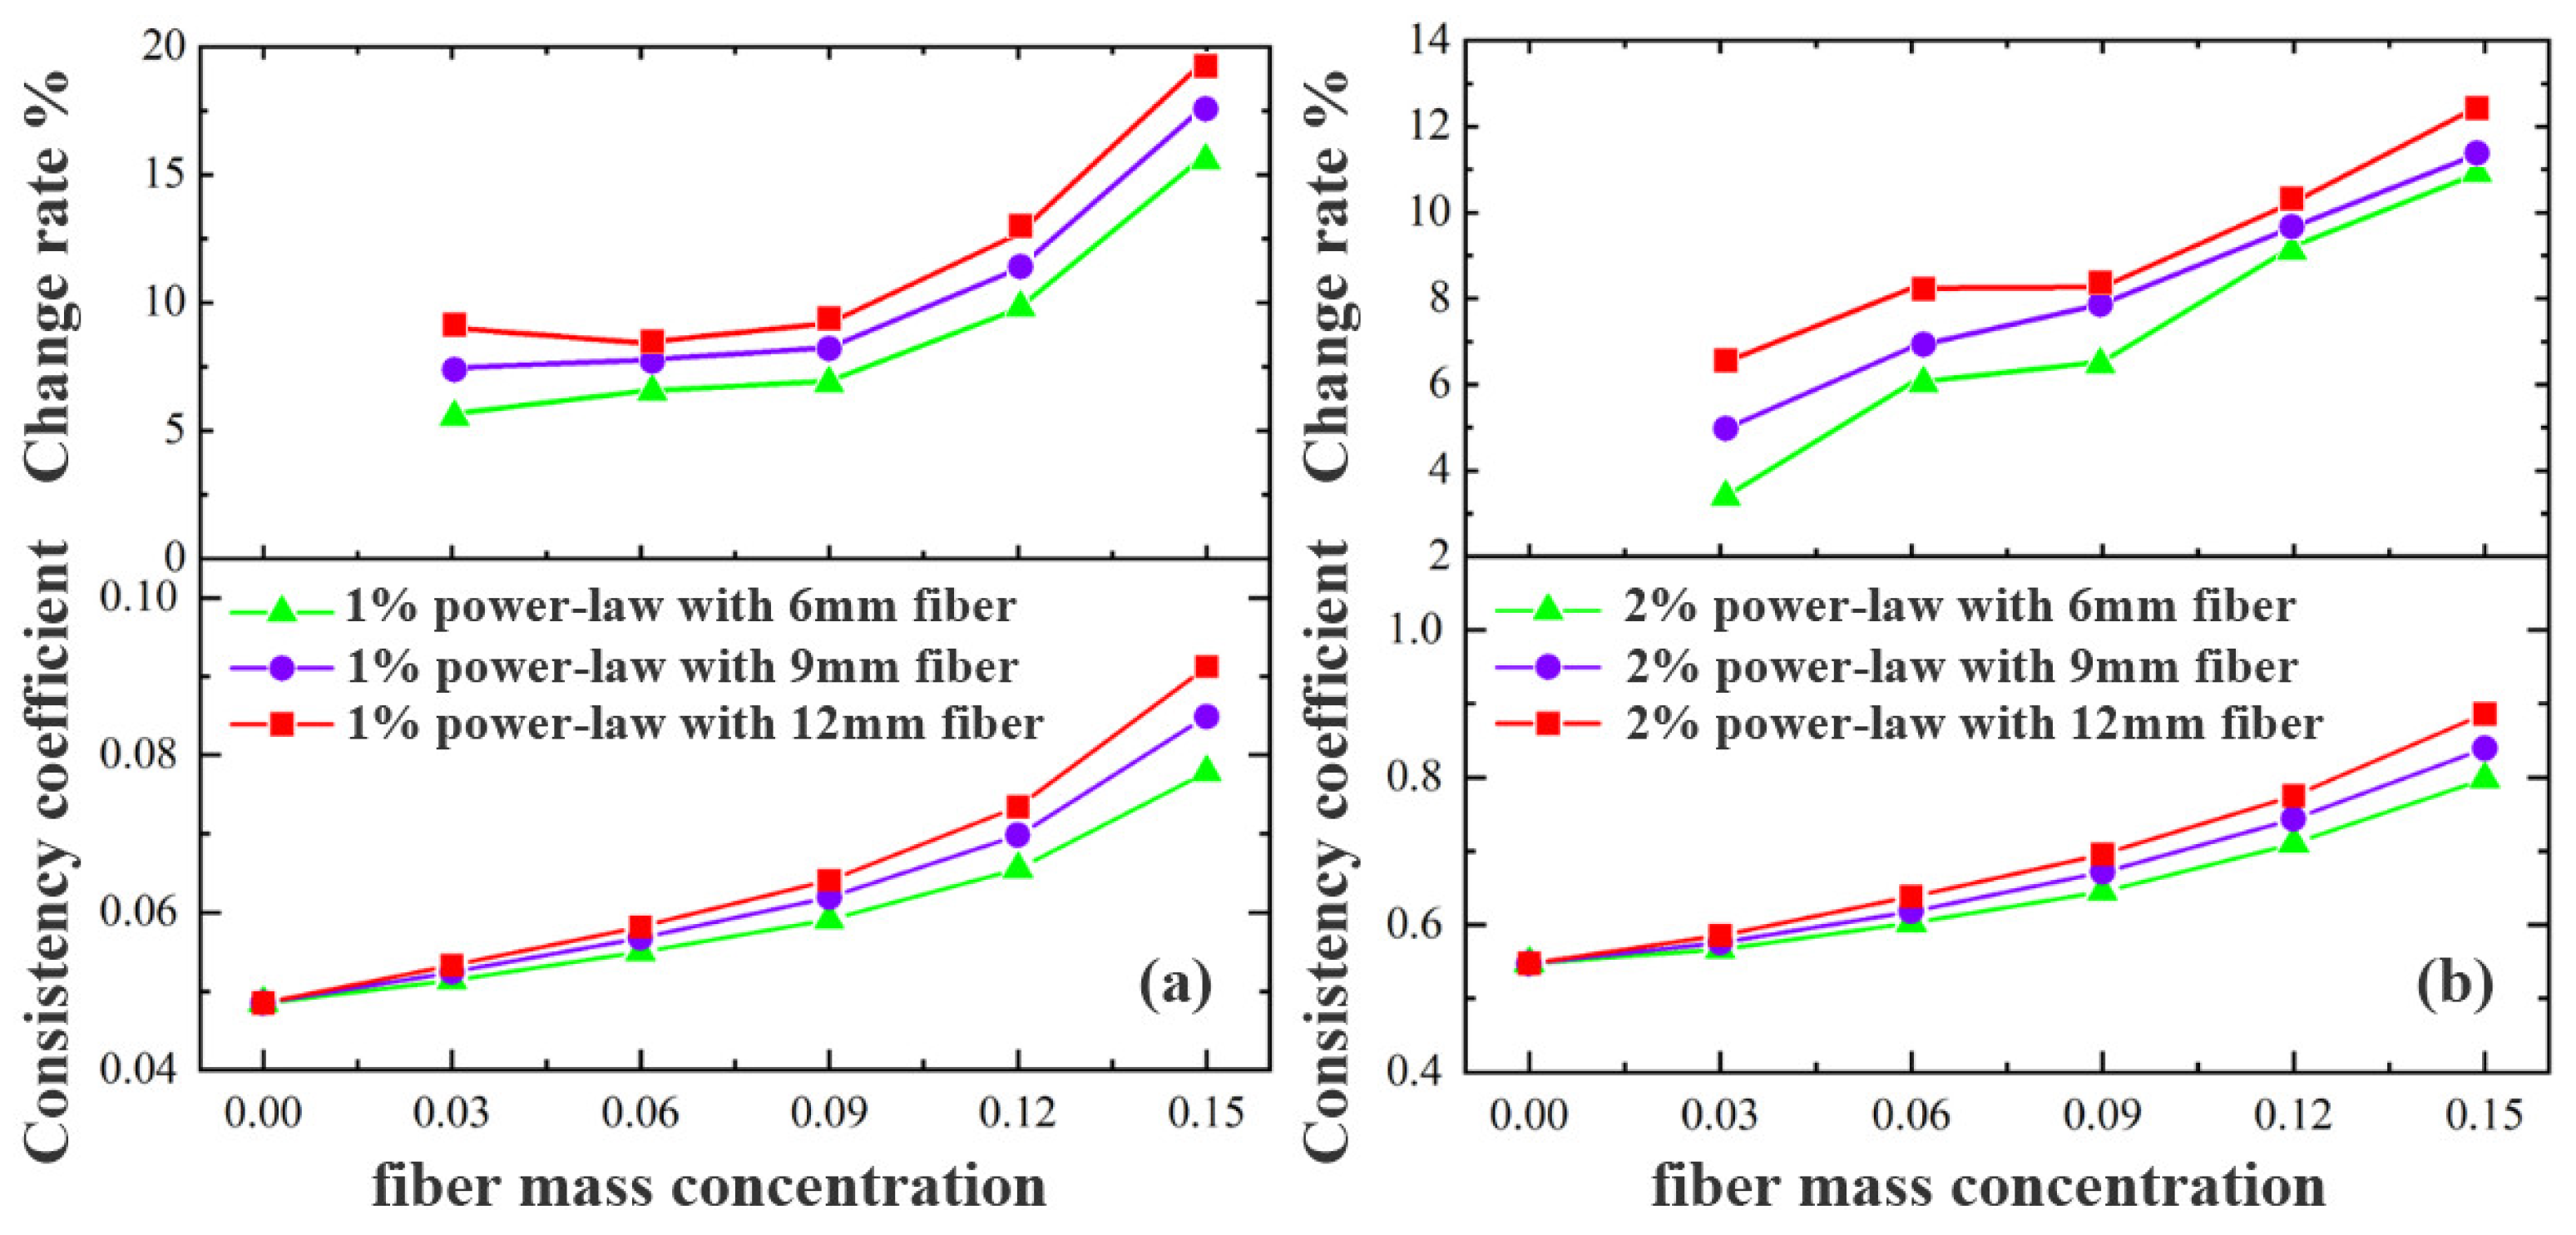
Figure 3 and
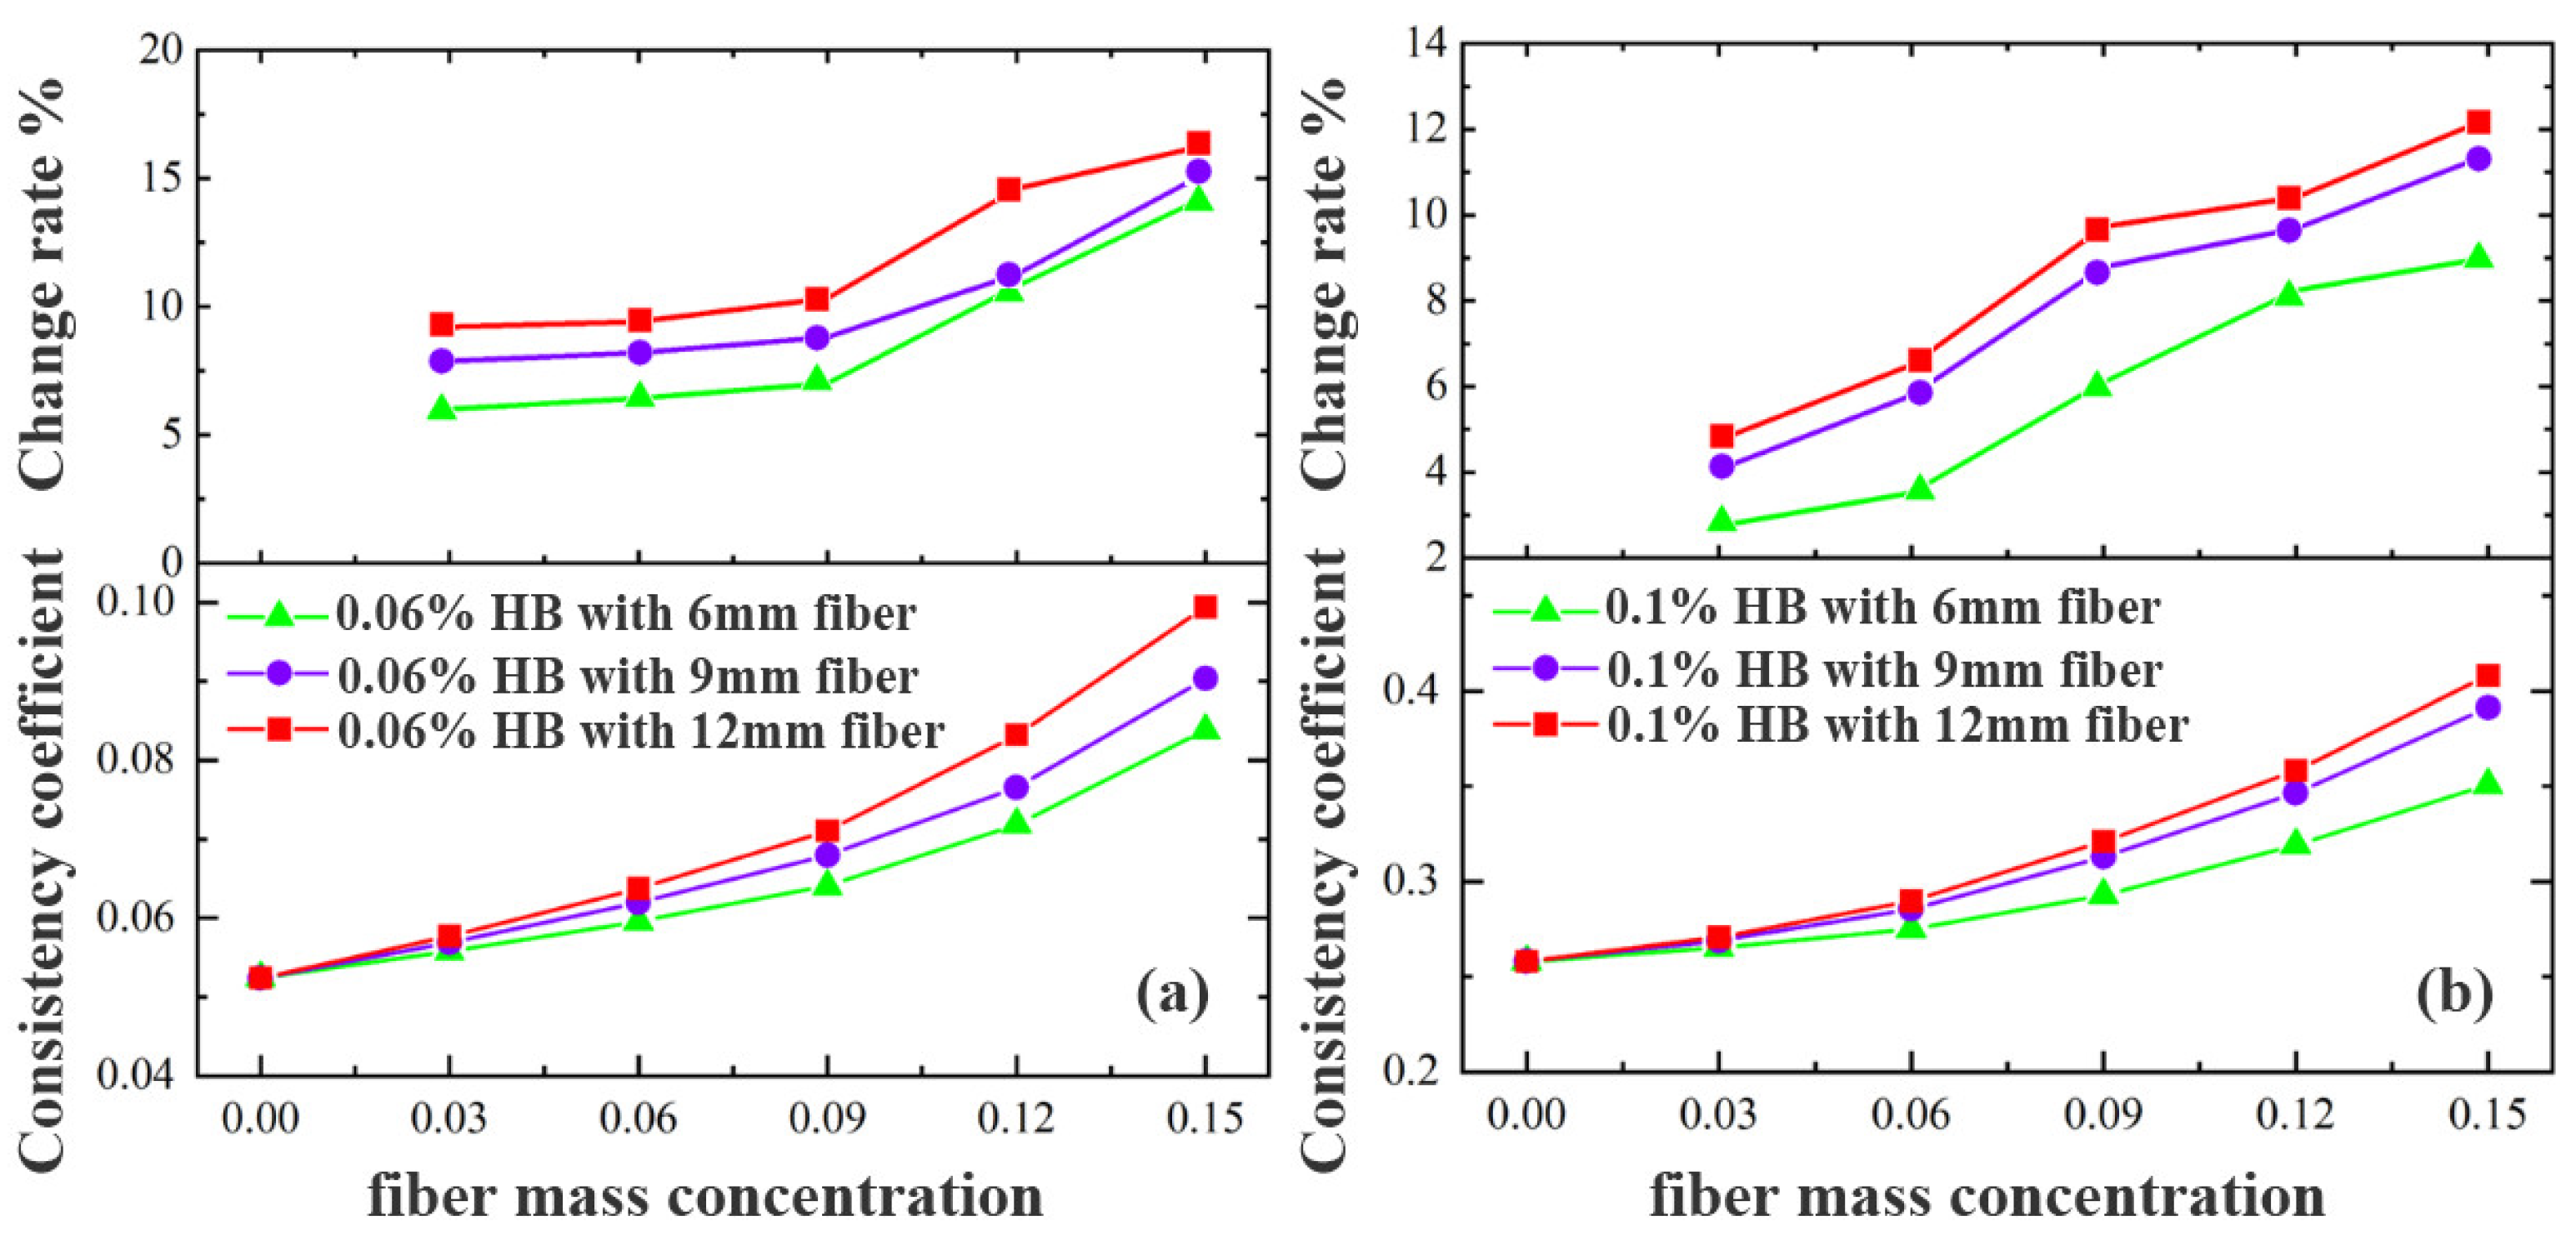
Figure 4 illustrate the viscosity trends of power-law and Herschel–Bulkley fluids, respectively, with increasing fiber concentration. The results indicate a nonlinear increase in viscosity, attributed to the interplay between the viscoelasticity of the base fluid and the strength of fiber–fluid interactions.
In low-viscosity base fluids (e.g., 1% power-law or 0.06% Herschel–Bulkley), fiber concentrations below 0.09% had minimal impact on viscosity, suggesting that the fiber network was relatively loose. However, beyond 0.09%, viscosity increased sharply, indicating a critical threshold for fiber entanglement. For example, in a 1% power-law fluid with 9 mm fibers, increasing the fiber concentration from 0 to 0.09% led to a 7.8% rise in viscosity, while increasing it to 0.15% resulted in a 14.5% increase, highlighting the “structural thickening” and percolation effects of the fiber network.
In contrast, in high-viscosity base fluids (e.g., 2% power-law or 0.1% Herschel–Bulkley), the impact of fiber concentration on viscosity was less pronounced. For instance, a 2% power-law fluid with 12 mm fibers exhibited only a 9.1% increase in viscosity across the same fiber concentration range, implying that existing intermolecular interactions in high-viscosity systems limit the additional thickening effects from fiber addition.
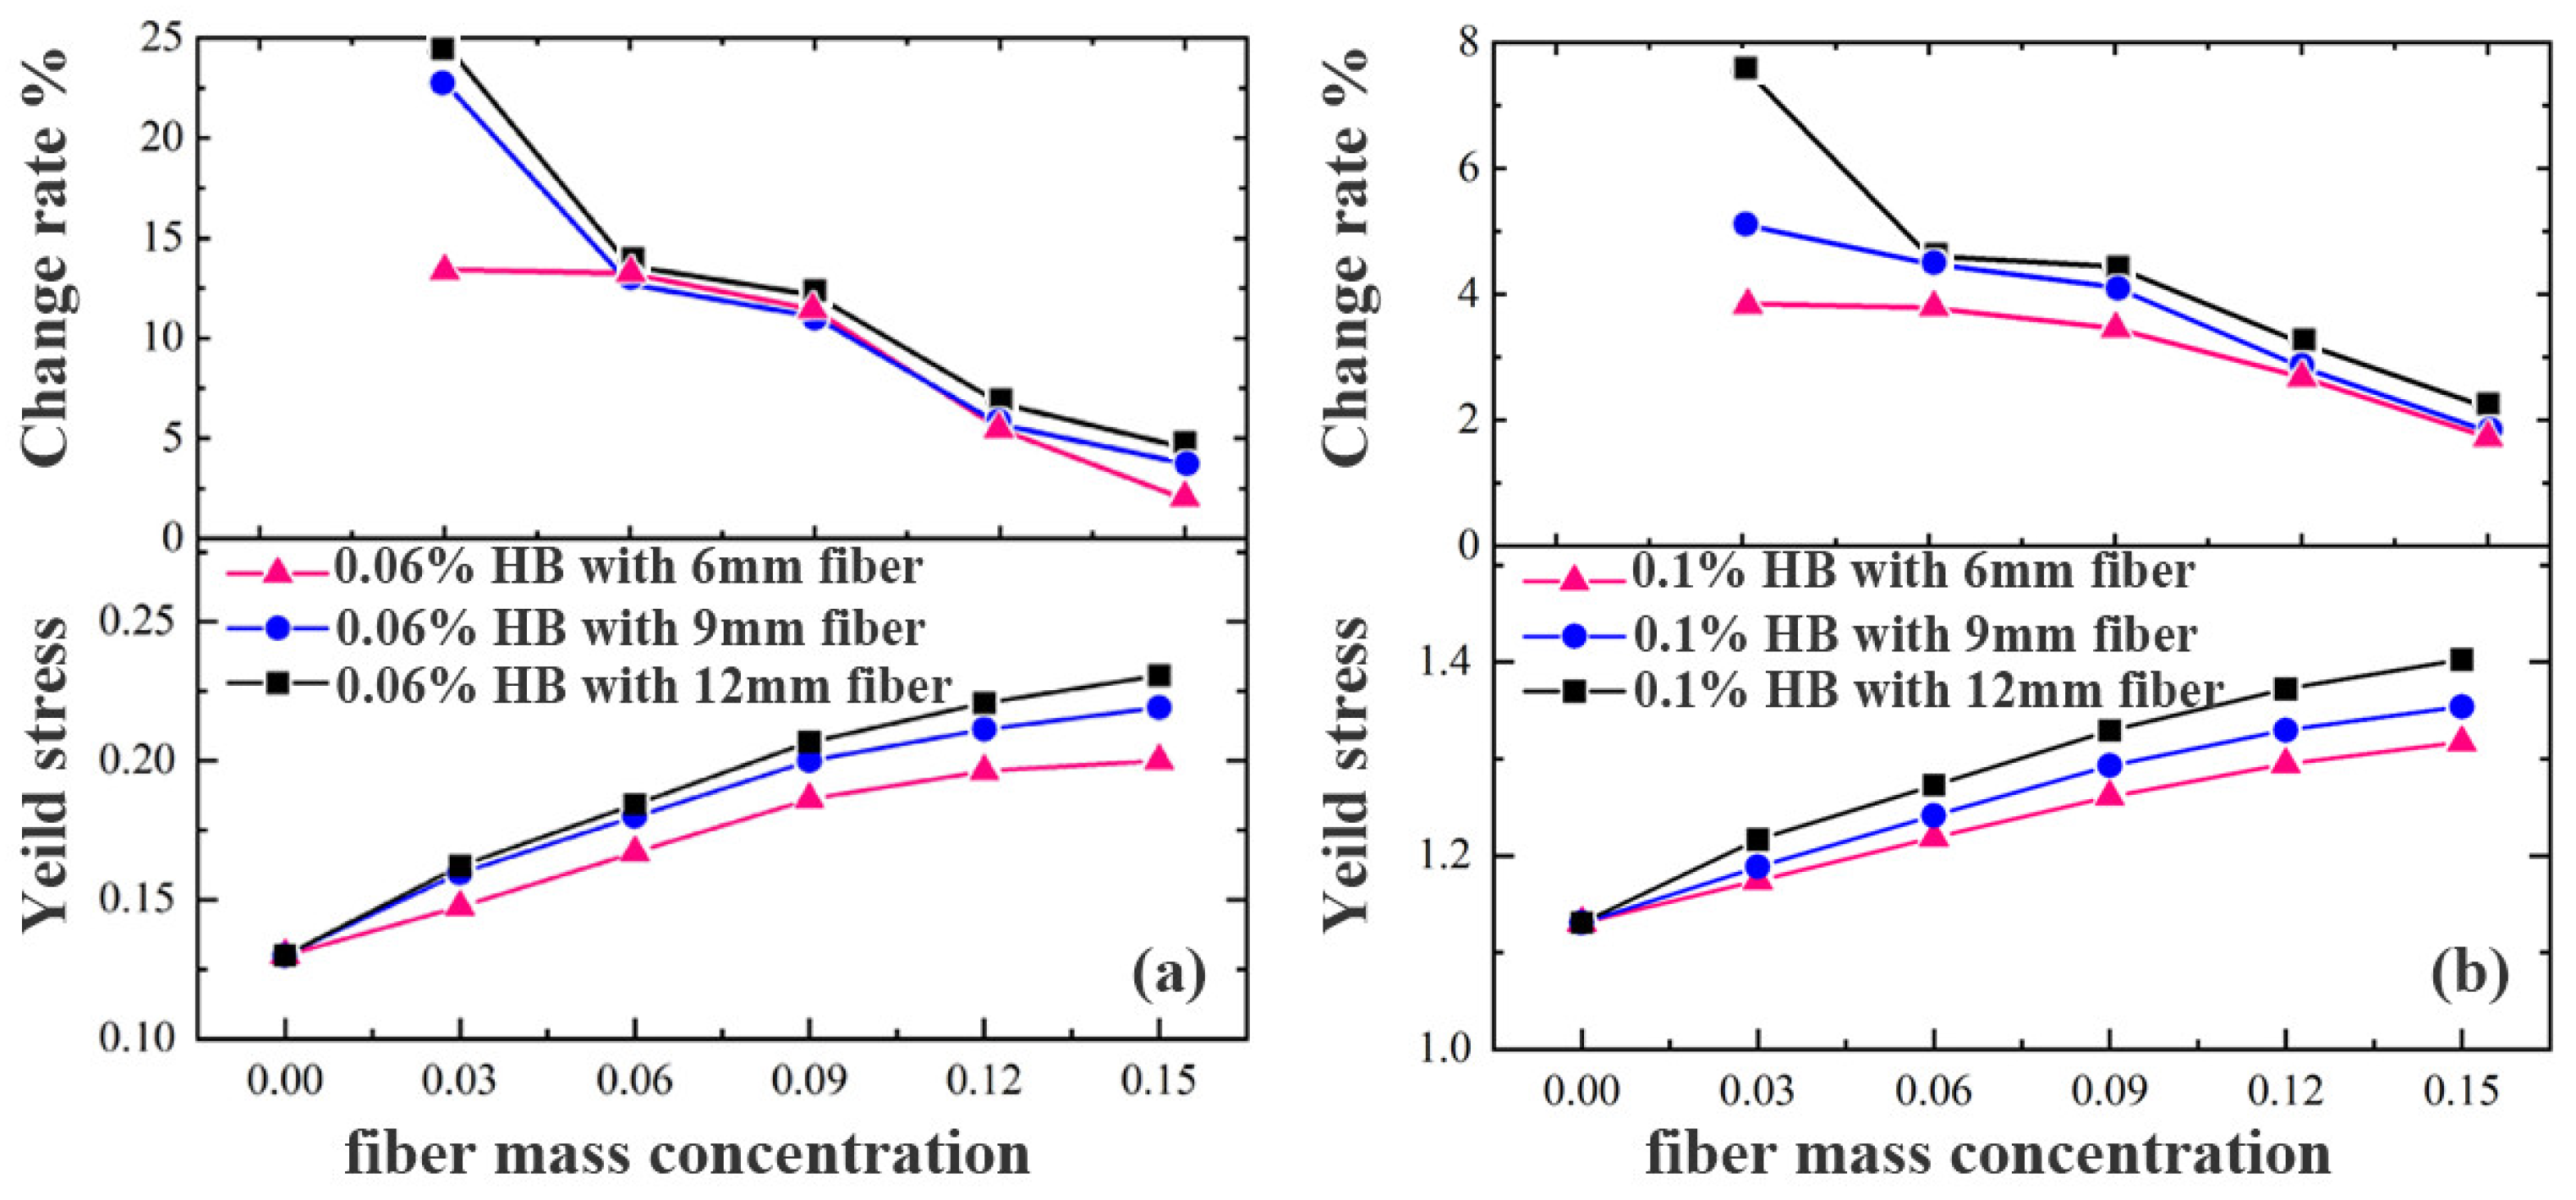
Regarding yield stress,
Figure 5 shows the relationship between fiber concentration and dynamic yield stress in Herschel–Bulkley fluids. A general increase was observed, but with diminishing marginal gains, especially at higher base fluid viscosities. For instance, in a 0.06% Herschel–Bulkley fluid with 9 mm fibers, increasing fiber concentration from 0.03% to 0.15% raised yield stress by 11.2%, whereas the same increase in a 0.1% base fluid only produced a 3.7% increase.
From a microscopic standpoint, fibers form bridging and entangled structures via van der Waals or electrostatic forces, enhancing internal friction. In low-viscosity systems, the initial low yield stress amplifies fiber effects, while in high-viscosity systems, preexisting network rigidity reduces fiber-induced enhancements.
4.2. Effect of Fiber Length on Drilling Fluid Rheology
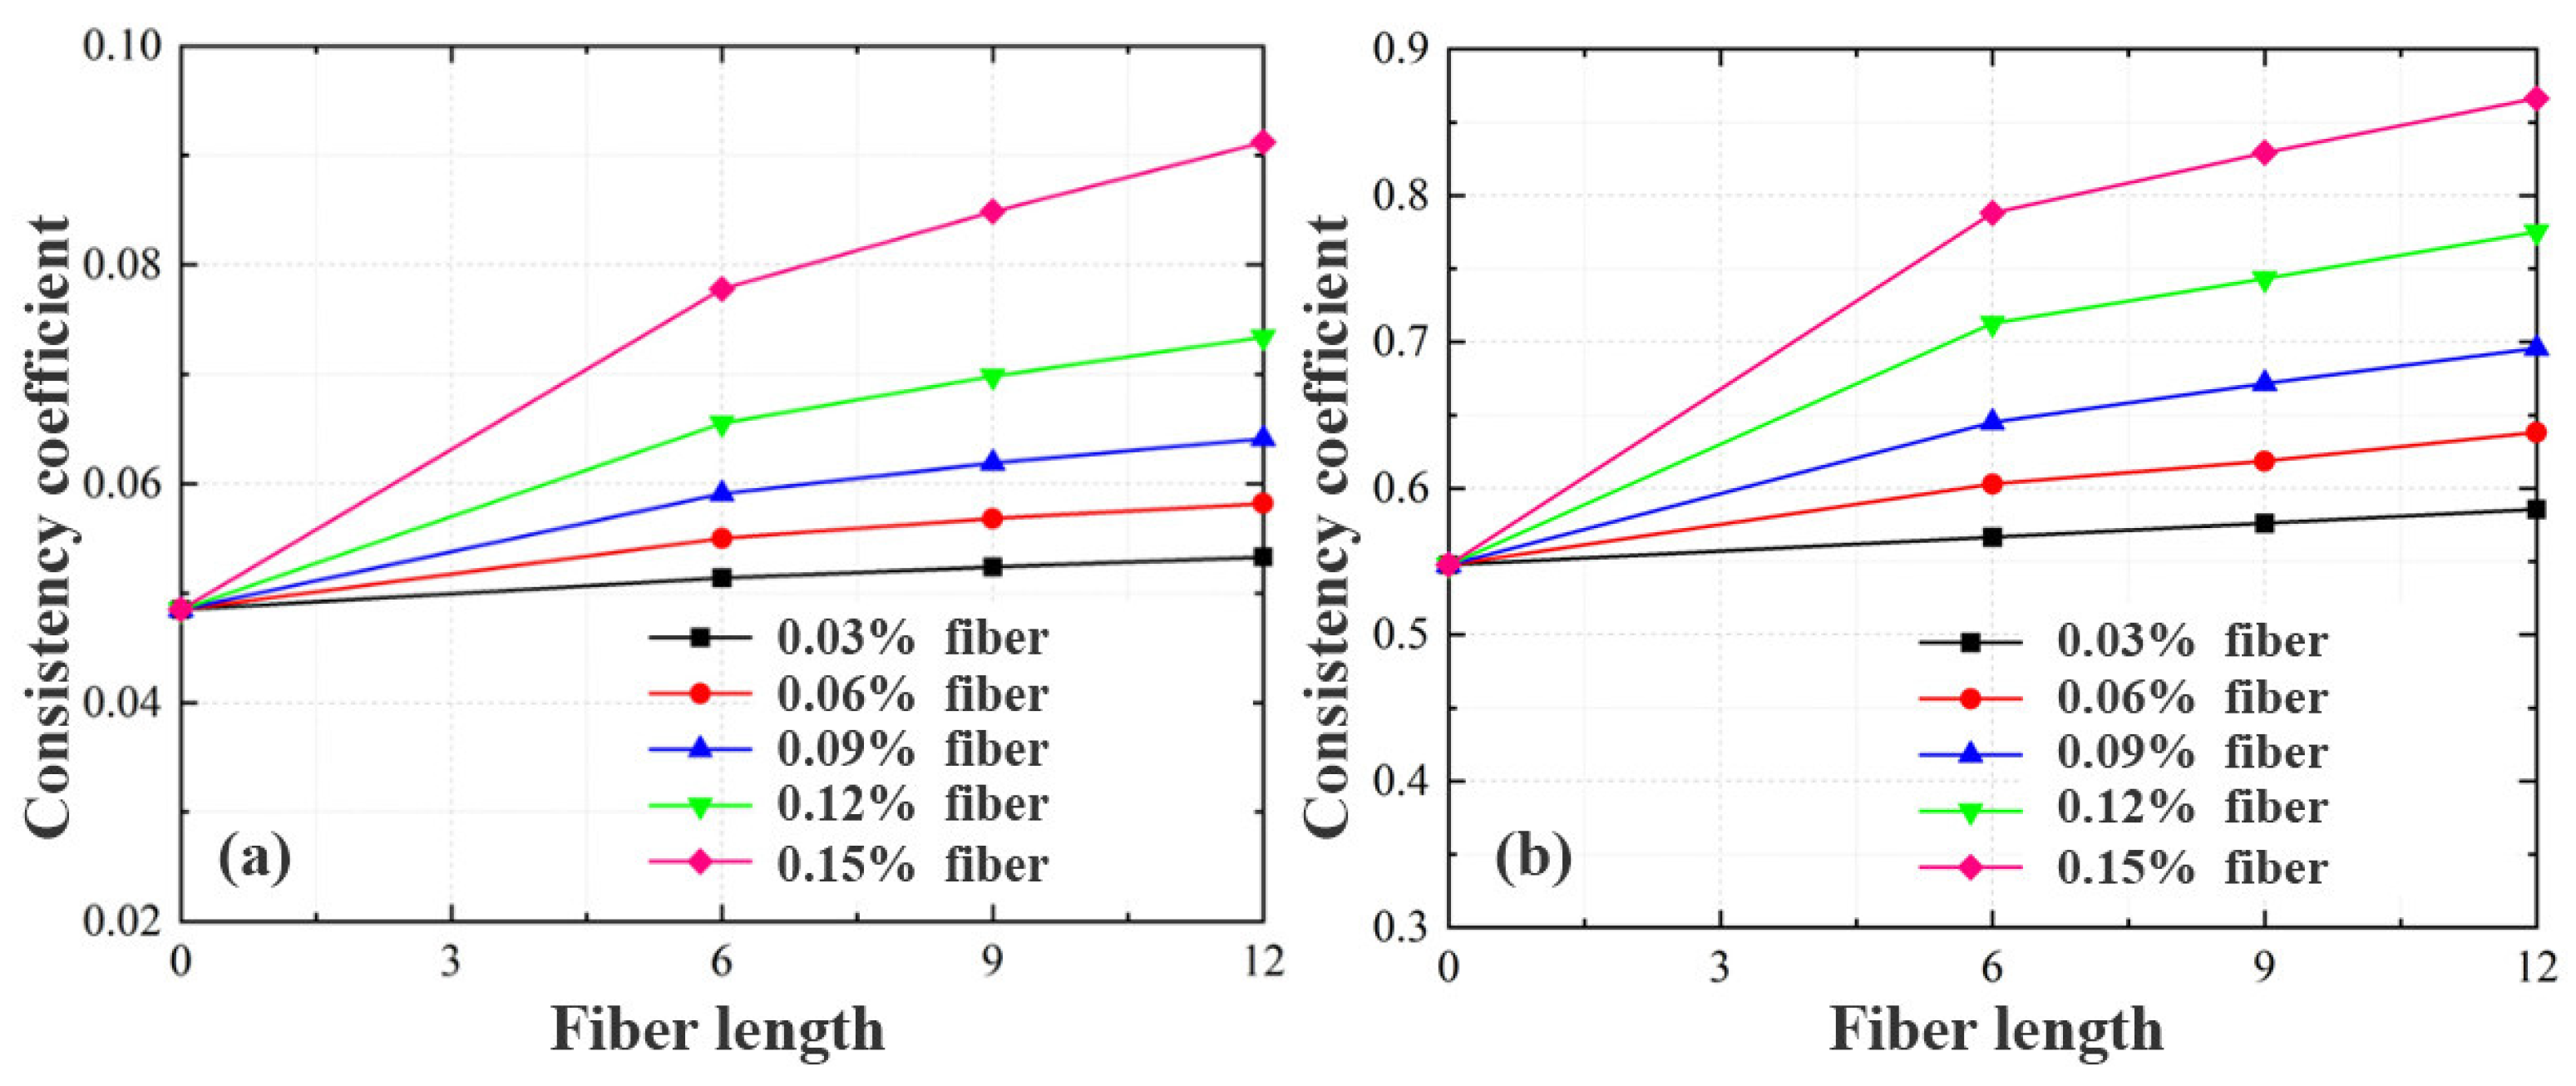
Figure 6 and
Figure 7 depict the influence of fiber length (6 mm, 9 mm, and 12 mm) on solution viscosity in various base fluids. The influence of fiber length is strongly coupled with fiber concentration.
At low fiber concentrations (e.g., 0.03%), fiber length had a negligible effect on viscosity. For example, in a 1% power-law fluid, increasing fiber length from 6 mm to 12 mm led to only a 1.8% increase in viscosity. However, at higher fiber concentrations (e.g., 0.12%), the effect became more significant, resulting in a 7.6% increase, indicating that effective fiber–fiber networking requires sufficient density.
The correlation between fiber length and viscosity was stronger in high-viscosity fluids, where fiber mobility is restricted, allowing longer fibers to form interconnected and stable microstructures, enhancing bulk resistance.
Yield stress followed a similar trend. As shown in
Figure 8, in a 0.06% Herschel–Bulkley fluid with 0.06% fiber concentration, increasing fiber length from 6 mm to 12 mm resulted in a 4.8% increase in yield stress. This effect is due to the greater curvature radius and structural flexibility of long fibers, which promote multi-scale entanglement and generate more uniform three-dimensional networks, unlike shorter fibers, which tend to cluster locally and weaken network integrity.
In summary, fiber concentration controls spatial density, while fiber length determines network connectivity and strength. The base fluid viscosity further modulates these interactions: low-viscosity fluids enable dynamic structure formation, while high-viscosity fluids suppress network development. This section provides critical insights into the nonlinear structure–property relationships of fiber-containing non-Newtonian fluids, forming the foundation for the drag force and particle settling analyses in the subsequent sections.
5. Experimental Investigation of Particle Settling in Fiber-Containing Non-Newtonian Fluids
Building upon the analysis and model validation of fiber-free systems in
Section 3, a series of systematic experiments was conducted to examine particle settling behavior in fiber-containing non-Newtonian fluids. The objective was to elucidate the mechanistic role of fibers in regulating particle settling dynamics and to develop a predictive drag coefficient model that incorporates fiber structural effects, thereby enhancing the engineering predictability of settling behavior in practical drilling scenarios.
5.1. Experimental Procedure and Measurement Method
Carbomer U20 aqueous solutions were used to formulate power-law base fluids, which were subsequently neutralized with triethanolamine to produce Herschel–Bulkley fluids. Four fluid concentrations (0.06%, 0.1%, 1%, and 2%) were selected. Polyester fibers with three different lengths (6 mm, 9 mm, and 12 mm) were introduced into these solutions to construct a fiber–fluid matrix.
The preparation procedure was as follows. After thorough mixing and standing to ensure homogeneity, the fluid was carefully poured into the settling column to eliminate trapped air. Rheological parameters were measured under isothermal conditions, and single-particle settling experiments were conducted to determine the terminal settling velocity, as shown in
Figure 9. Each test condition was repeated five times, and averaged results were used. Trajectories disturbed by aggregation or off-center descent were excluded. To ensure stability and repeatability, the fluid was stirred between trials to prevent fiber agglomeration.
A total of 201 valid datasets were collected for fiber-containing power-law fluids and 158 datasets for fiber-containing Herschel–Bulkley fluids. These were used to construct drag coefficient prediction models by fitting the relationship between fiber drag and particle Reynolds number, with fiber concentration and fiber length introduced as key parameters in a unified prediction framework.
5.2. Drag Force Decomposition in Fiber-Containing Fluids
In fiber-laden systems, the total drag force
Fdt can be decomposed into two components: viscous drag
Fdv and fiber-induced drag
Fdf, such that:
The viscous component was computed using existing empirical models. Although the Kelessidis model performs well in fiber-free power-law fluids and the Khan model in Herschel–Bulkley fluids, subsequent analysis revealed that applying the Kelessidis model in fiber-containing power-law fluids introduced significant deviations. Therefore, for consistency and reliability, the Khan model was adopted uniformly to estimate the viscous drag in both fluid systems.
5.3. Relationship Between Fiber Drag Coefficient and Particle Reynolds Number
Inspired by Elgaddafi et al., the fiber-induced drag
Fdf is expressed analogously to classical fluid drag, as a function of the fiber drag coefficient
Cdf, terminal velocity
Vt, projected particle area, and density difference:
Building upon this, Xu et al. introduced fiber structural parameters and proposed:
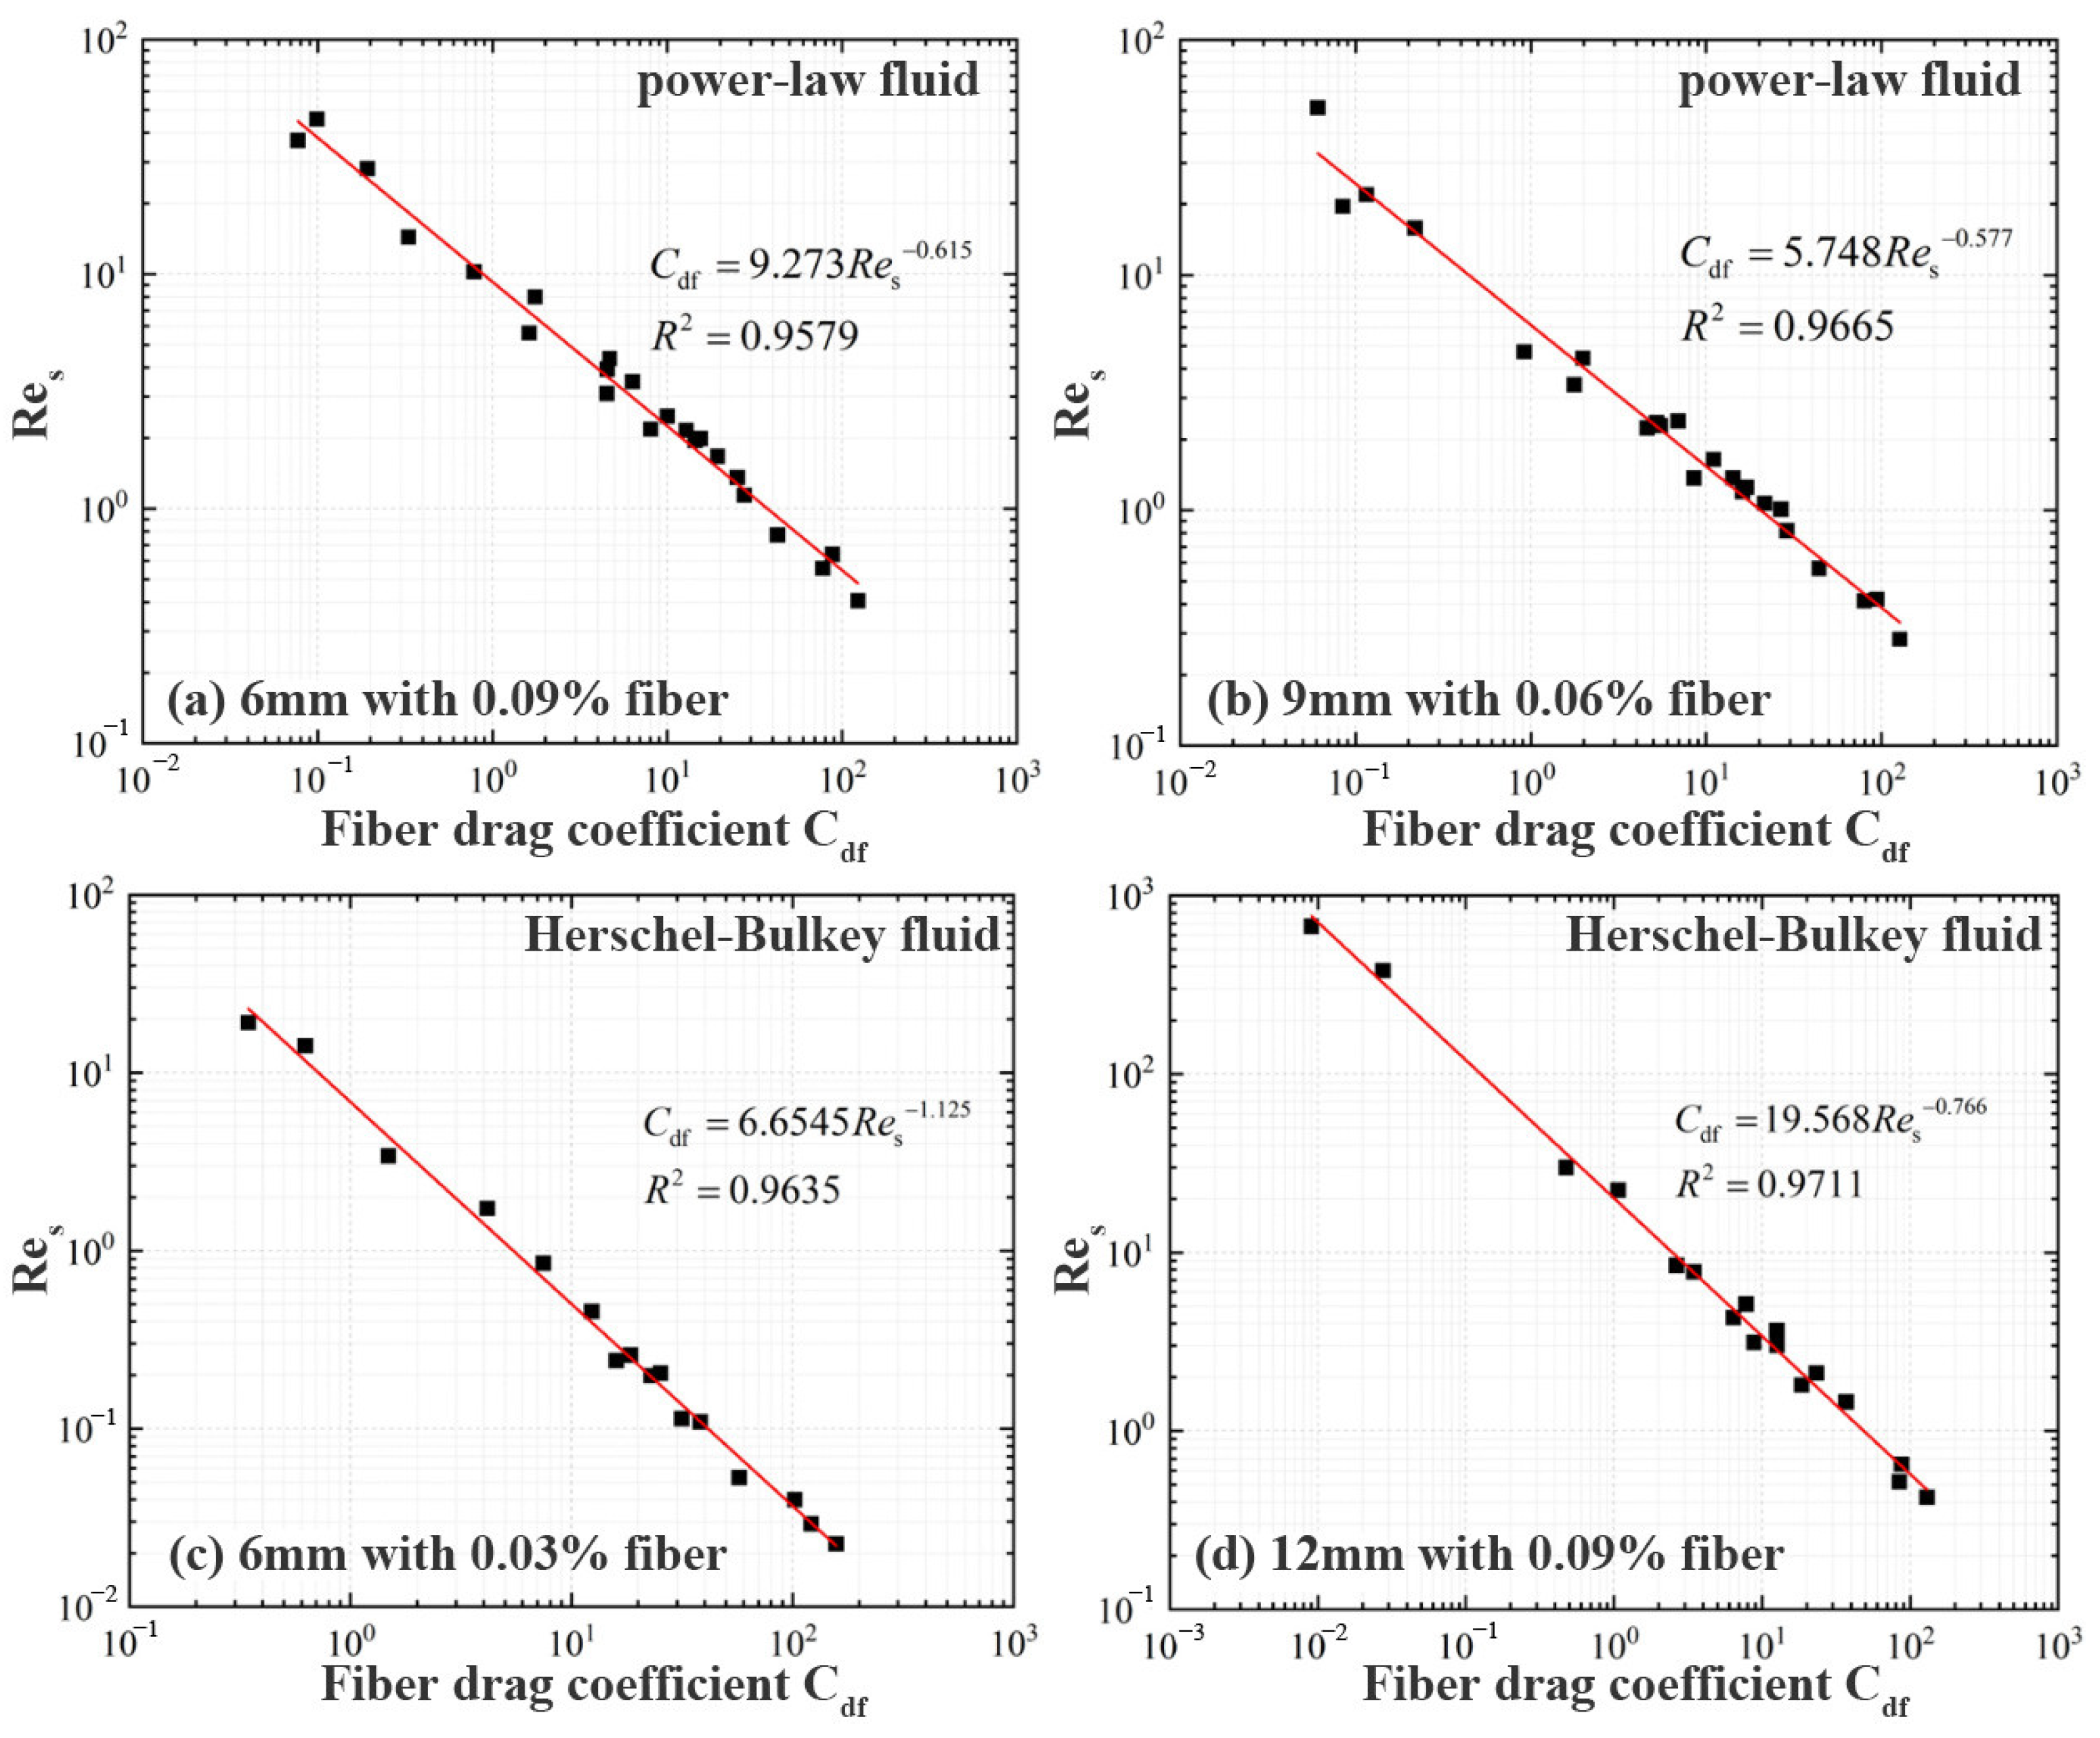
Figure 10 illustrates the empirical relationship between the dimensionless drag coefficient
Cdf and particle Reynolds number
Res for both fluid types. An initial attempt using linear regression showed an apparent trend, but poor fitting performance, with R
2 values consistently below 0.8. This suggests that the linear formulation oversimplifies the complex hydrodynamic interactions present in fiber-laden non-Newtonian systems and fails to account for the inherent nonlinearity in the drag–inertia coupling.
Upon reanalysis using a power-law fitting approach, the correlation quality improved substantially, with R
2 values exceeding 0.9 across the majority of tested conditions. This significant enhancement confirms that fiber-induced drag in shear-dependent fluids is governed by a nonlinear functional form rather than a proportional relationship. In physical terms, this implies that as inertial effects begin to emerge—especially at moderate-to-high Reynolds numbers—the contribution of fiber-induced resistance grows disproportionately due to microstructural disturbances and complex wake formation around the fiber–particle matrix.
Furthermore, the improved performance of the power-law model highlights its flexibility in adapting to different flow regimes. At low Res, where viscous forces dominate, fiber networks act primarily as rheological modifiers. However, as the flow transitions toward inertial regimes, the combined effects of yield stress, shear-thinning, and fiber entanglement introduce secondary flow structures that are more accurately described by nonlinear drag scaling. The power-law formulation inherently accommodates this regime-dependent behavior, making it a more physically consistent and scalable tool for practical use.
Fitted parameters
A and
B under different fiber conditions are listed in
Table 7 and
Table 8.
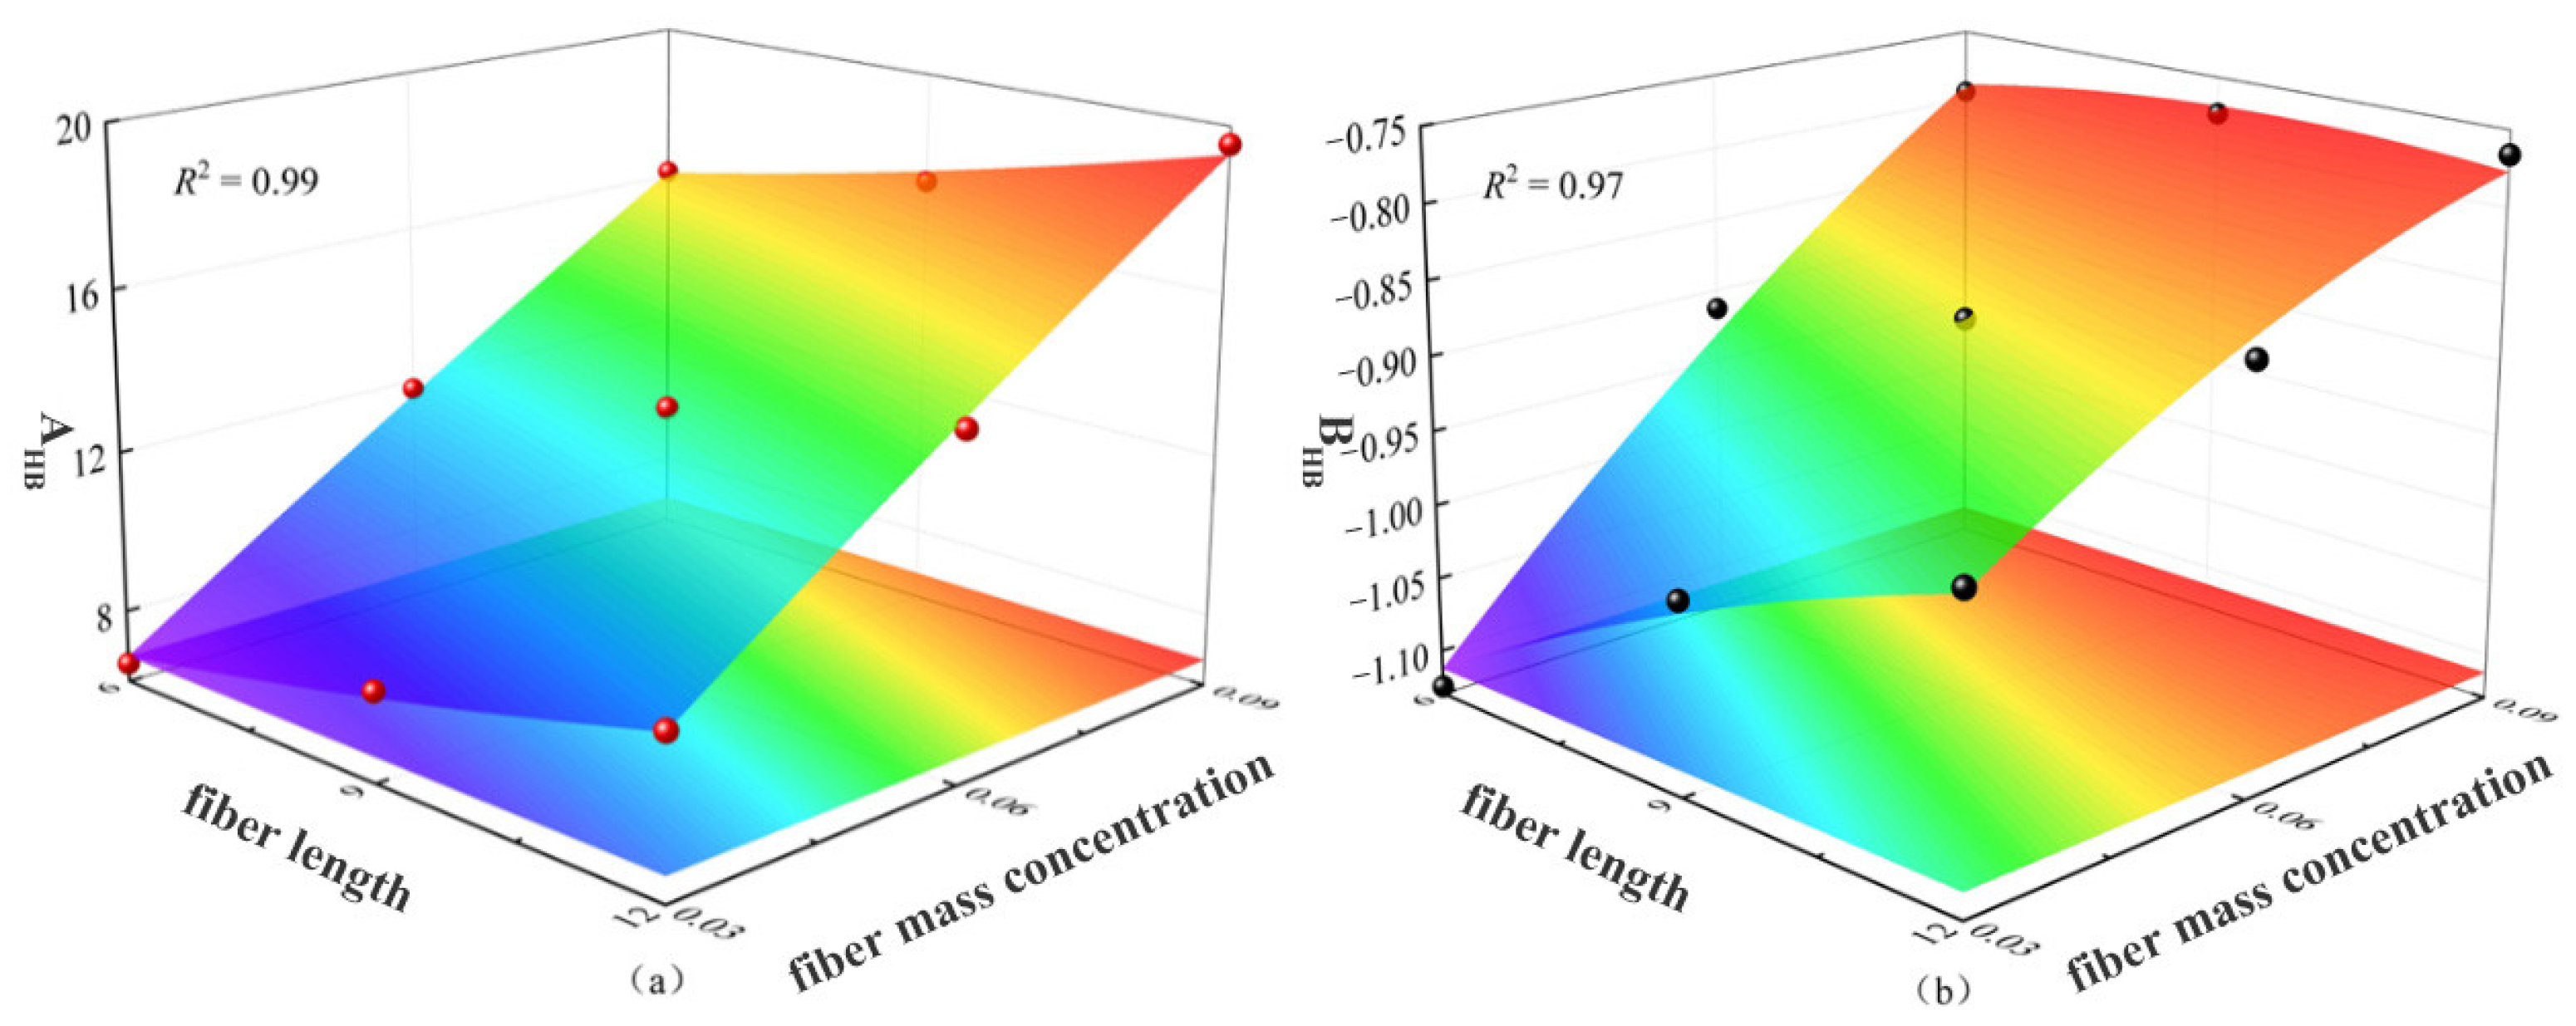
To generalize the model and eliminate segmented empirical fitting, a parametric coupling strategy was proposed. The parameters
A and
B were expressed as continuous functions of fiber concentration
Cf and length
Lf:
This coupling enables the integration of fiber structural parameters into a unified, continuous predictive model. It retains the physical interpretability of Cf and Lf while avoiding segmentation-induced errors common in traditional multi-model strategies.
The fitted surface equations for
A and
B in power-law fluids are shown in Equations (19) and (20), with the corresponding surface plots presented in
Figure 11.
Similarly, for Herschel–Bulkley fluids, the surface fitting results are expressed through Equations (21) and (22), with
Figure 12 illustrating the three-dimensional fitted surfaces corresponding to total drag coefficient and terminal velocity as functions of fiber length and concentration. The regression models achieved high R
2 values (0.86–0.99), indicating excellent model robustness. The model captures the transition from dilute to semi-dense regimes and the influence of fiber-induced structure formation, particularly in yield-stress fluids, where threshold stress and microstructural confinement dominate.
The high R2 values suggest that the effects of both fiber length and concentration on hydrodynamic resistance and settling kinetics are well represented within the fitted model surfaces. Specifically, the model successfully encapsulates the transition from dilute fiber regimes—where individual fibers contribute modestly to drag enhancement—to semi-dense regimes, where network effects and entanglement significantly alter the local flow field and lead to nonlinear drag amplification. This progression is particularly relevant in yield-stress fluids, where the interplay between fiber-induced microstructure and apparent viscosity manifests as a shift in both the threshold and slope of drag variation.
Notably, the slightly lower R2 values observed in certain fitting regions (e.g., near the transition between flow initiation and steady settling) can be attributed to local experimental variability and the sensitivity of yield-stress fluids to minor disturbances in stress distribution. Despite this, the overall model behavior remains stable and predictable, indicating strong generalizability across typical operational fiber concentrations and geometries used in drilling fluid formulations.
From a practical standpoint, the availability of such empirical surface models significantly enhances the utility of the unified framework. Engineers can rapidly estimate drag and settling behavior across a spectrum of fluid compositions without resorting to time-consuming numerical simulations or laboratory trials. Moreover, the parametric surfaces serve as a bridge between rheological measurements and field-scale transport predictions, supporting real-time decision-making during fiber-assisted hole-cleaning operations.
5.4. Comparison Between Experimental Data and Model Predictions
A unified model for total drag coefficient was constructed by superimposing viscous and fiber-induced drag:
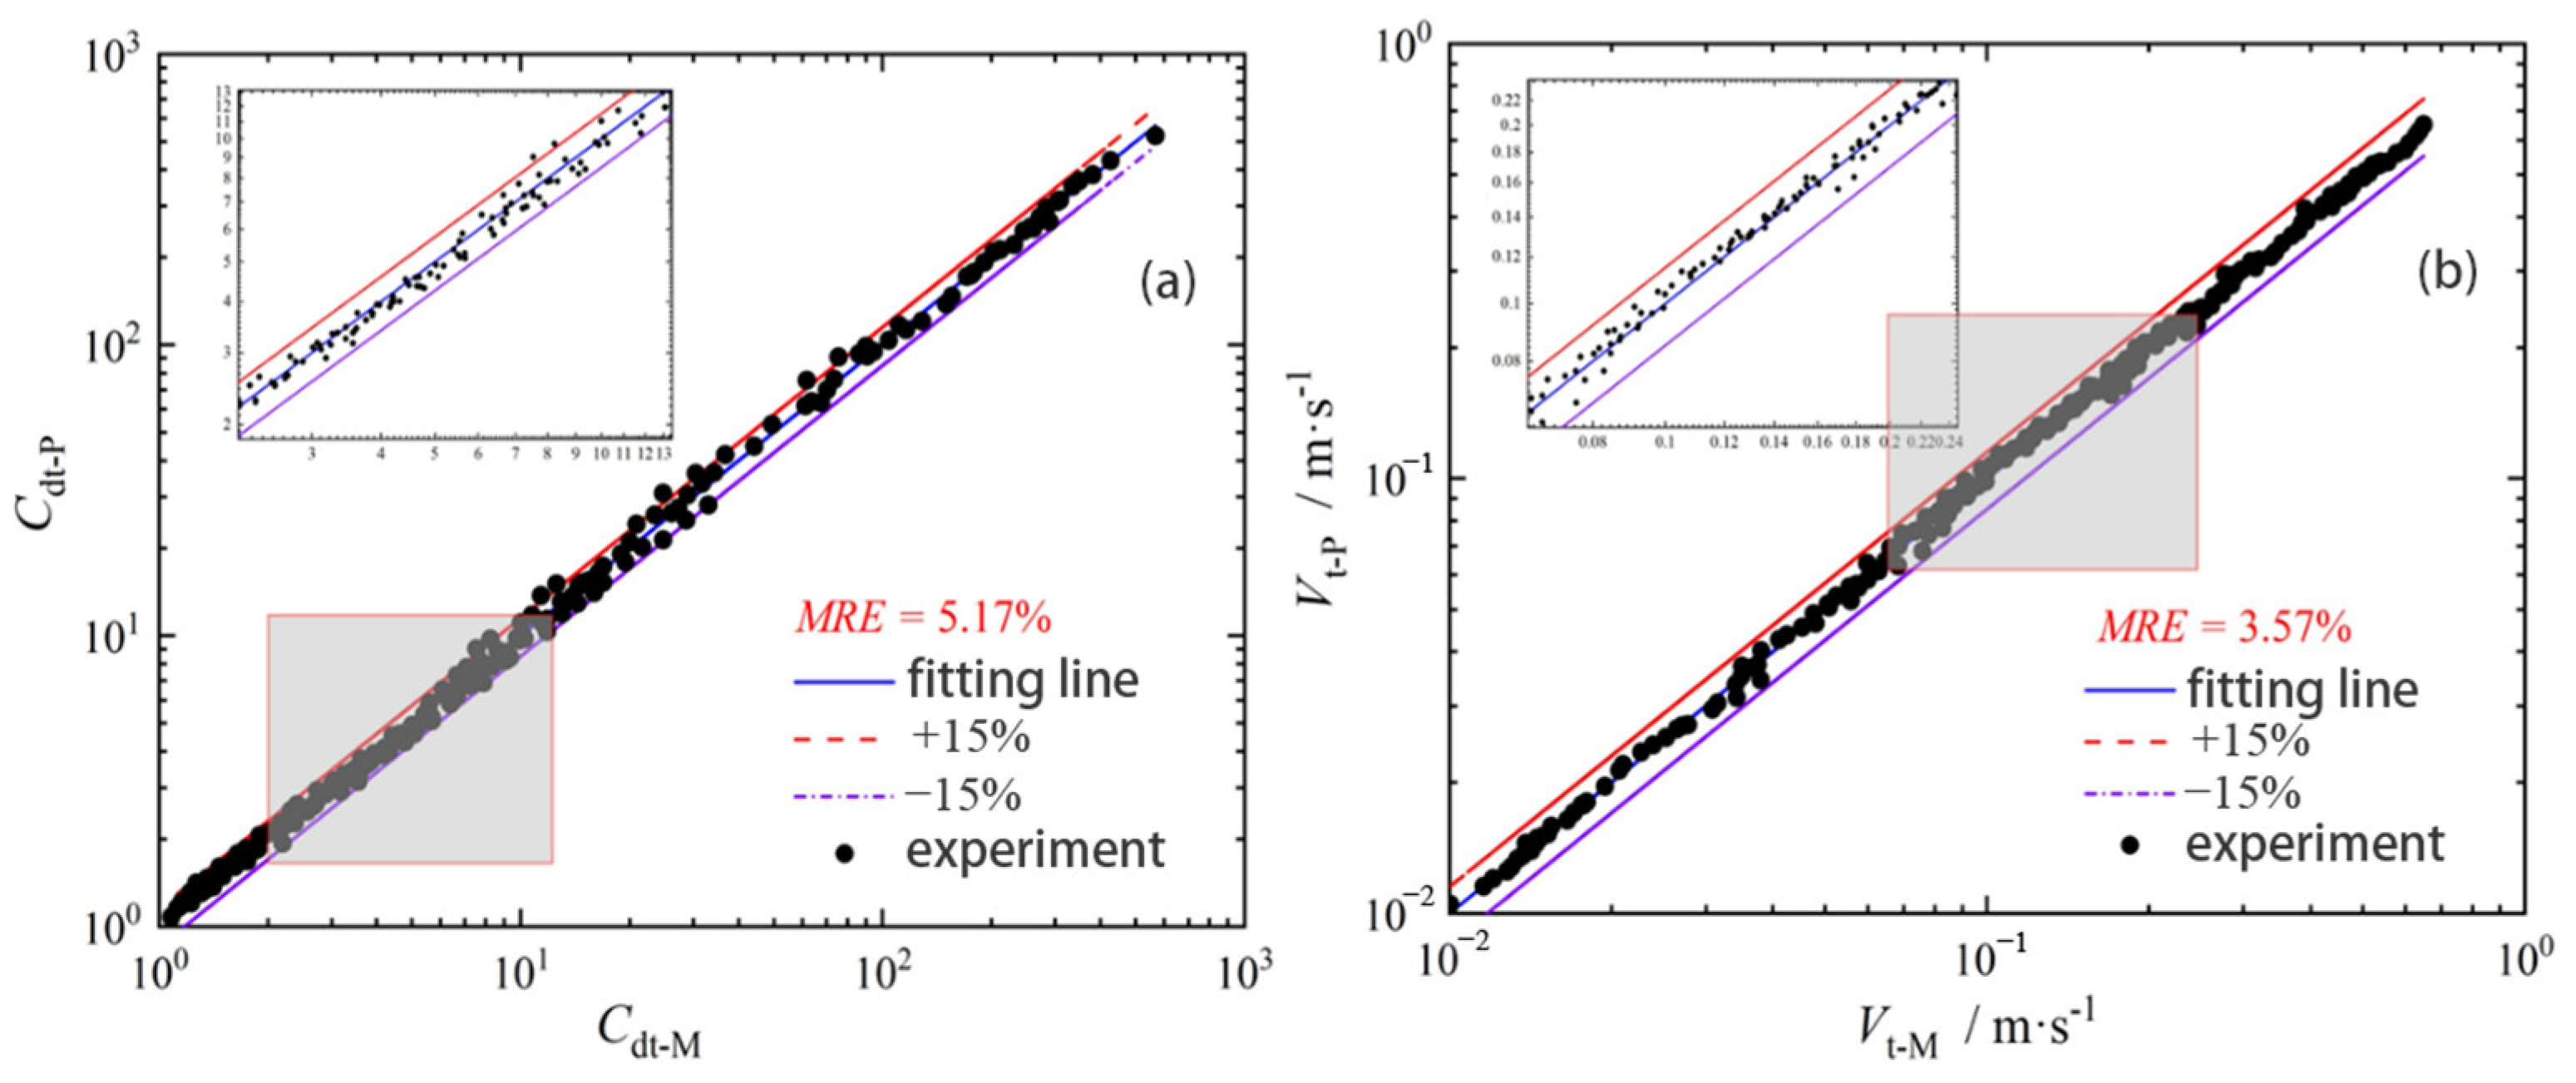
An iterative algorithm was used to solve for the implicit variables and compute the predicted total drag coefficients and terminal velocities under various conditions. After excluding data points with relative errors exceeding 40%, the remaining dataset was used to refit the model and assess its accuracy using mean relative error (MRE) as the performance metric.
Figure 13 and
Figure 14 compare predicted and experimental values for power-law and Herschel–Bulkley fluids.
In power-law systems, MRE values for total drag and terminal velocity were 5.17% and 3.57%, respectively, with maximum deviations of 24.65% and 10.43%. These relatively low error margins indicate that the unified prediction model is capable of effectively capturing the composite drag behavior induced by fiber addition, even under the inherent nonlinearity of shear-thinning rheology. The slightly higher maximum deviation for total drag suggests that local fiber–particle interactions or microstructural heterogeneities may introduce intermittent deviations, especially under conditions of low shear rates or inhomogeneous fiber dispersion.
For Herschel–Bulkley systems, which combine yield stress and shear-thinning, the model achieved MREs of 9.95% for total drag and 5.12% for terminal velocity. This performance underscores the robustness of the model’s parameterization strategy, particularly its ability to generalize over the combined effects of yield stress and fiber-induced structural resistance. The slightly elevated error values in these systems can be attributed to the difficulty in accurately resolving the onset of motion (yield point) and its influence on the drag evolution during the settling process.
Importantly, the model exhibited superior performance in power-law systems compared to Herschel–Bulkley fluids. This disparity may reflect the simpler rheological behavior of power-law fluids, where the absence of a yield stress allows for a more straightforward mapping between flow field evolution and fiber–particle drag interactions. In contrast, the presence of a threshold stress in Herschel–Bulkley systems introduces additional complexity, particularly in regimes where fiber networks contribute to an apparent increase in yield threshold or modulate local flow activation.
From an engineering perspective, this unified model provides a reliable predictive tool for optimizing fiber-laden drilling fluids, particularly in horizontal and extended-reach wells, where accurate drag estimation is critical. The unified drag model enhances prior approaches by enabling more accurate prediction of particle settling in fiber-containing non-Newtonian drilling fluids, thereby offering practical utility for real-time cutting transport simulations in complex wellbore environments. The low average and peak errors validate the model’s applicability for design evaluation, real-time parameter optimization, and performance analysis. Furthermore, the model shows potential for integration into field-scale multiphase flow simulators, supporting advanced applications in hole cleaning and sand transport. Future work could explore model extensions to irregular particle shapes, dynamic flow conditions, and integration into CFD simulations for broader engineering applications.
It should be noted that the proposed model was developed based on experiments with spherical particles in dilute suspensions. Its direct applicability to irregularly shaped particles or highly concentrated systems may be limited and requires further investigation. Future work could extend the present model to semi-dilute or concentrated fiber suspensions by incorporating fiber–fiber interactions, orientation dynamics, and local microstructural effects into the drag formulation.
6. Conclusions and Outlook
This study systematically investigated the settling behavior of spherical particles in fiber-containing non-Newtonian fluids, and developed a unified predictive model for total drag by incorporating fiber structural parameters. The main findings are summarized as follows.
An increase in fiber concentration and length leads to a marked rise in fluid viscosity and yield stress. This effect is particularly pronounced in low-concentration base fluids, indicating that the fiber network structure plays a key role in modulating the rheological behavior of the system.
Experimental results confirmed that fiber-induced drag significantly reduces the terminal settling velocity of particles. Existing drag models for non-Newtonian fluids produce notable prediction errors when directly applied to fiber-laden systems, underscoring the necessity for fiber-specific modeling frameworks.
By embedding fiber concentration and length into the parameter expressions of the drag model, the proposed formulation avoids the redundancy of traditional piecewise fitting and enhances continuity, scalability, and engineering applicability across diverse conditions.
The unified predictive model demonstrates good agreement with experimental data for both power-law and Herschel–Bulkley fluids. The mean relative errors for both terminal velocity and total drag coefficient remained within acceptable ranges, confirming the model’s robustness and practical utility.
Overall, the findings of this study offer both theoretical insights and practical modeling tools for the design optimization of fiber-enhanced drilling fluids, facilitating improved hole-cleaning efficiency and enhanced control over particle settling behavior in complex downhole environments.
Despite these advances, some limitations should be acknowledged. The random orientation and distribution of fibers in the suspension can lead to local variations in resistance forces, which are not explicitly captured by the current model. Additionally, wall effects—particularly for particles settling near the container boundary—may influence settling trajectories despite efforts to mitigate them. Furthermore, time-dependent microstructural changes in the fiber network (e.g., flocculation or shear-induced alignment) are not considered, although the experiments were conducted under quasi-steady-state conditions.
Future work will aim to refine the model by incorporating fiber orientation statistics and exploring the role of dynamic rheological behavior. Expanding the framework to account for higher fiber concentrations and non-spherical particles may also enhance the generalizability of the proposed correlations to more complex real-world applications, such as real-time drilling simulations and fiber-laden hydraulic fracturing fluids.


