Article

Study on the Microscopic Mechanism of Supercritical CO2 and Active Water Alternating Flooding in a Tight Oil Reservoir

Production Technology Research Institute, PetroChina Xinjiang Oilfield Company, Karamay 834000, China
*
Author to whom correspondence should be addressed.
Processes 2025, 13(8), 2535; https://doi.org/10.3390/pr13082535
Submission received: 22 June 2025 / Revised: 6 August 2025 / Accepted: 7 August 2025 / Published: 12 August 2025

Abstract

Tight oil reservoirs are characterized by low porosity, low permeability, and low saturation, making it difficult to achieve economic development through conventional water injection. This study experimentally evaluated different injection media and oil displacement methods and used nuclear magnetic resonance methods to explain the micro mechanisms of oil displacement during different oil displacement processes. The experiments showed that supercritical CO2 flooding and supercritical CO2 and active water alternating flooding were much more useful for low-permeability reservoirs compared with conventional water flooding. This technology can increase the recovery rate by more than 12.0%, which is 33.24% higher than the rate achieved with conventional water injection. In addition, it can effectively improve the rapid increase in water content caused by the rapid advance in the water front during the water injection process. The NMR results indicated good consistency for the recovery efficiency of pores under different oil displacement conditions. When the aperture varied between 0.1 µm and 1 µm (type III), the utilization rate was highest, followed by type IV (1–10 µm), type II (0.01–0.1 µm), and type I (0.001–0.01 µm). By comparison, conventional water and CO2 alternating flooding was more effective for type III pores, increasing oil recovery by 12.58%, while active water + CO2 alternating flooding can further drive oil, increasing oil recovery by 33.24% and greatly displacing oil in micro-pores and macro-pores.

1. Introduction

Low permeability and pressure droop are the main factors affecting oil recovery in tight sand oil reservoirs. Due to the characteristics of carbon dioxide, which can mix with oil and reduce its viscosity, carbon dioxide flooding has played an important role in sand oil reservoirs [1,2,3,4]. Carbon dioxide flooding is advantageous due to its non-miscible injection mode, which indicates that the injection pressure is less than the minimum miscible pressure; mixing injection mode, in which the injection pressure is greater than the minimum mixing pressure; and supercritical carbon dioxide injection mode, where the pressure and temperature are higher than the critical temperature and critical pressure in the carbon dioxide system [5,6,7]. In the process of supercritical carbon dioxide flooding, it is necessary to ensure that supercritical carbon dioxide can fully contact crude oil. Determining the distribution of crude oil in reservoirs is of great significance in discovering the mechanisms of carbon dioxide flooding. Generally, the oil remaining in the reservoir after water flooding exists in three forms [6,8,9]: (1) the oil droplet is surrounded by water in the pore, as is common in hydrophilic rocks; (2) the oil is adsorbed on the rock surface, which is common in oil-philic rocks; and (3) these two conditions coexist, which is common in miscible wetted rocks [10].
To date, many scholars have conducted experimental studies on the water resistance effect in water injection development. The results indicate that under high water saturation conditions, water resistance has a significant impact on the remaining oil saturation. Meanwhile, the wettability of rock has a great effect on the oil recovery in tight oil reservoirs [11]. In water wetted rock or miscible wetted rock, oil recovery was quite low [12,13]. Changing the wettability of rock surfaces by alternating CO2 water and gas flooding can effectively improve oil recovery. The contact angle measurement experiment also confirmed this conclusion [14,15]. The change in the wettability of rock surfaces remains an unresolved issue which is mainly affected by the rock properties, differences in composition, and type of reservoir fluid, and the chemical reaction between the reservoir rock and fluid during or after carbon dioxide injection [16,17]. Meanwhile, the water mass in water-wet dense sandstone is very different from that in the CO2–water alternating flooding process. The results show that CO2 flooding is much more efficient than three-times oil recovery. Meanwhile, the increase in the oil recovery rate during secondary oil recovery is mainly attributed to the reduction in water mass [17,18,19]. In addition, the precipitation of organic matter generated during CO2 flooding can significantly impact the CO2 flooding effect [20]. The results showed that CO2 flooding induced a serious amount of asphaltene precipitation, which was significantly related to the liquid–liquid equilibrium but not to the bubble point pressure of the system [21]. Meanwhile, CO2-generated organic matter precipitation alters the wettability of the rock, making it more oil-wetted. Experiments have demonstrated that resin and paraffin precipitate from crude oil, and organic matter precipitation promotes mass transfer during miscibility, with no significant organic matter precipitation after miscibility [22,23]. The amount and composition of carbon dioxide-induced organic matter precipitation is influenced by small- and medium-molecular-weight paraffins in the crude oil. When the asphaltene content in crude oil exceeds 4.6%, the reservoir rock will change from water-phase wetting to oil-phase wetting, thus reducing the oil recovery rate [23]. Asphaltenes in crude oil were found to be unstable in carbon dioxide and hydrocarbon gases but stable in reservoir fluids at reservoir temperatures. It was also shown that although asphaltene precipitation occurred during carbon dioxide charging, there was no clogging problem because the asphaltene particles were much smaller than the pore throat. Therefore, the permeability of the reservoir rock does not decrease significantly after CO2 charging. During supercritical carbon dioxide charging, physicochemical reactions between the reservoir crude oil, formation water, carbon dioxide, and reservoir rock occur, resulting in changes in the permeability, pore throat radius, and other properties of the reservoir rock. The changes in the reservoir pore throat and permeability are mainly caused by mineral dissolution and asphaltene precipitation of reservoir rocks. The dissolution of rock minerals increases the porosity and permeability of reservoir rocks, while the precipitation of asphaltenes leads to a decrease in reservoir rock porosity and permeability [24]. During CO2 flooding, an increase or decrease in reservoir rock permeability mainly depends on the distribution of reservoir rock minerals. CT monitoring of CO2 injection shows that the porosity and permeability of reservoir rocks increase at the initial stage of CO2 injection, but with continuous injection, the porosity and permeability of reservoir rocks decrease at a low injection rate [25]. When the salinity of formation water is low, the porosity and permeability of reservoir rocks decrease slightly. The decrease in the permeability of reservoir rocks is mainly attributed to two mechanisms: (1) the accumulation of small particles such as asphaltene in large pore channels, reducing the flow area of the pore throat, and (2) the blockage of small pore channels by large particles of asphaltene, which reduces the number of flow channels [8,26,27,28,29].
Existing theoretical research on CO2 flooding has mainly focused on organic matter precipitation caused by CO2 flooding, while few studies have been conducted on the utilization of petroleum in different pore throats. In addition, although the concept of alternating carbon dioxide and water flooding has been proposed, its effectiveness has not yet been evaluated and analyzed. This article proposes a new effective flooding mode which uses alternating supercritical CO2 and active waterflooding to improve oil recovery in tight oil reservoirs. The experimental results of conventional water flooding, active water flooding, and CO2 flooding were used to verify the effectiveness of the proposed mode. By combining nuclear magnetic resonance (NMR), the oil remaining in pores was analyzed to characterize the utilization of crude oil by different pore throats, and a downward trend in CO2 flooding technology was determined. The micro mechanism of CO2 oil displacement at the micro-scale was also revealed. Solving this problem is of great significance for improving the CO2 flooding effect and proposing new approaches for secondary oil recovery.

2. Experimental Equipment and Design

2.1. Experimental Samples

A core with a length of 30 cm and a diameter of 2.54 cm was drilled; two cores with similar permeability and properties comprised a 60 cm long core column. The average permeability of the man-made cores was measured using N2 to ensure that the rock permeability showed the same tendency for the target. Taking the Mahu 1 oilfield as the research object, formation water was composed based on its ion composition and salinity (Table 1). Activated water was prepared using 20% betaine and 80% heavy alkylbenzene sulfonate. The experiment was conducted under constant temperature and pressure of 100 °C and 40 MPa, respectively.

2.2. Experimental Equipment

The experimental devices (Figure 1) used included a high-temperature and high-pressure displacement experimental device, which was used to measure reservoir recovery during gas flooding and water flooding, and a constant temperature and pressure pump with an accuracy of 0.0001 mL/min, which was used to saturate water and oil at the early stage and provide a constant flow during the entire stage. A gas pressurization device was used to guarantee stable pressure in the CO2 cylinder. During the experiment, the injection pressure was 40.0 MPa and the experimental temperature was 100 °C. A constant flow rate of 0.1 mL/min was applied, and the injection pressure was 26.5 MPa, which was higher than the miscible pressure.

2.3. Experimental Procedure

To characterize the effect of CO2 + active water alternating flooding on oil recovery in tight oil reservoirs in depth and to verify the effectiveness of the proposed flooding mode, existing flooding modes were evaluated in four experiments, and CO2 + active water alternating flooding was simulated in a final experiment. Based on these experiments, the mechanism of CO2 flooding at the micro-scale was discovered. Table 2 lists the properties of the cores used in the experiments.
Five different experiments using water flooding, active water flooding, CO2 flooding, water + CO2 alternating flooding (WAC), and active water + CO2 alternating flooding (AWAC) were conducted. During the oil flooding experiments, a water content of over 98% meant that the flooding process had been terminated. Meanwhile, the three different flooding modes, namely conventional water flooding, active water flooding, and supercritical CO2 flooding, were applied using Samples 1, 2, and 3. Samples 4 and 5 were used for water and supercritical CO2 alternating flooding and active water with supercritical CO2 alternating flooding, respectively. During the experiments, the total flooding volume was 0.8 PV. The detailed flooding schedule is provided in Table 3.

3. Experimental Results

Figure 2 shows the change in the water cut and oil recovery under different oil flooding models. During water flooding, the oil recovery increased from 0 to 34.52% when the injection volume increased from 0 to 0.8 PV. When the injection volume increased from 0.8 to 1.5 PV, oil recovery increased from 34.52 to 37.42%, which was an increase of 10.81%, while the water cut increased from 93.15 to 99.06%, representing an increase of 12.40%. Taking an injection volume of 0.6 PV as a boundary, when the injection volume was less than 0.8 PV, the water cut and recovery curves increased sharply. When the injection volume exceeded 0.8 PV, the incremental rate of the water cut and recovery curves decreased significantly. For active water flooding, when the active water injection was less than 0.6 PV, the recovery rate increased rapidly from 0 to 37.42%, and the water cut increased obviously from 0 to 91.54%. With continuous injection, when the injection amount of active water reached 1.4 PV, the recovery rate increased to 40.21%, and the water cut increased to 98.22%. Compared with production at 0.6 PV, the recovery increased by 12.11%, and the water cut increased by 23.02% (Table 4).
Subsequently, the effect of supercritical CO2 flooding was analyzed. The experimental results indicated that when the injection volume was less than 0.8 PV, there was almost no water in the produced fluid, and the recovery rate was 37.42%. When the injection volume exceeded 0.8 PV, the water cut increased obviously. At the end of the flooding, the oil recovery reached 41.5%, while the water cut increased to 98.42%.
In order to further understand the effect of alternating injection on oil displacement, two sets of experiments were designed, namely supercritical CO2 + water alternating flooding and supercritical CO2 + active water alternating flooding. It can be seen that when the injection rate of supercritical CO2 + active water alternating flooding was less than 0.6 PV, the recovery rate increased from 0 to 40.82%. When using conventional water injection to inject 1.0 PV, the recovery rate slowly increased from 40.82 to 44.07%, an increase of 7.96%, while the water content rapidly increased from 47.07 to 97.98%, an increase of 108.15%. When injecting supercritical CO2 and active water alternately, the recovery rate increased from 0 to 44.40% when less than 0.6 PV of supercritical CO2 and active water was injected. When using conventional water injection to inject 1.0 PV, the recovery rate slowly increased from 44.40 to 48.74%, an increase of 9.77%. The moisture content rapidly increased from 41.87 to 97.84%, an increase of 133.68%.
Comparing Samples 1 and 2, it can be found that at the same injection amount (0.8 PV), compared with water injection, the oil recovery rate increased from 31.337% to 34.68%, and the water content decreased from 88.27 to 78.64%, which is a decrease of 9.76%. For supercritical CO2 flooding, compared with water flooding, the recovery rate increased from 33.97 to 38.75%, which is an increase of 16.44%. Throughout the entire supercritical CO2 oil recovery process, the water content was almost zero, indicating that supercritical CO2 reservoirs can not only effectively improve oil recovery but also effectively reduce the water content in the produced fluid, achieving the goal of “controlling water and increasing oil production” in oilfield development. Comparing Samples 1, 3, and 4, it was found that during the oil displacement process with alternating water and supercritical CO2, the recovery rate was 40.82% when the injection amount reached 0.8 PV. Compared with Samples 1 and 3, the oil recovery rate increased by 23.80 and 6.75%, respectively, while the water content decreased by 46.09% compared with Sample 1. This indicates that alternating supercritical CO2 and water flooding can not only effectively improve oil recovery but also effectively reduce the water content caused by the rapid advance in the water front during water injection. Comparing Samples 2, 3, and 5, it was found that when the injection volume reached 0.6 PV, the recovery rate increased by 27.29% and 16.08%, respectively, compared with active water injection, while the water content decreased by 47.29%. This experiment not only verified the effectiveness of alternating active water and supercritical CO2 oil displacement but also showed that this approach both effectively improves oil recovery and reduces the water content caused by the rapid advance in the water front during water injection.
In order to further understand the effect of alternating injection on oil flooding, two groups of experiments were designed: supercritical CO2 + water alternating flooding and supercritical CO2 + active water alternating flooding. The experimental results indicated that supercritical CO2 + active water alternating flooding was an effective method of improving oil recovery. When the total injection amount was 0.6 PV, the oil recovery sharply increased to 41.22%. When conventional water flooding was adopted to inject 1.0 PV, the recovery rate increased slowly from 40.82 to 44.07%, with an increase of 7.96%, while the water cut increased rapidly from 47.07 to 97.98%, with an increase of 108.15%. When supercritical CO2 and active water were injected alternately, it can be seen that when less than 0.6 PV of supercritical CO2 and active water was injected, the recovery rate increased from 0 to 44.40%. When conventional water flooding was used to inject 1.0 PV, oil recovery slowly increased from 44.40 to 48.74%, increasing by 9.77%, while the water cut jumped to 97.84% from 41.87%, approaching the termination conditions of the experiment.
The experimental results of Samples 1 and 2 showed that active water flooding has obvious advantages compared with conventional water flooding. When the total injection volume was 0.8 PV, oil recovery increased to 34.88% when active water flooding was used, while the oil recovery was only 30.64% for conventional water flooding. In addition, it should be noted that the water cut decreased when active water was used, with a water cut of 79.61%, while the water cut for conventional water flooding was 87.94%, increasing by 10.27%. When the injection volume of supercritical CO2 reached 0.8 PV, oil recovery saw a continuous increase to 38.77% compared with water flooding, an increase of 16.01%. The use of supercritical CO2 can also delay the water cut increase. When the amount of supercritical CO2 was below 0.8 PV, the water cut was low, approaching zero. Thus, supercritical CO2 flooding can not only increase the oil produced but can also be used to control water production during oil production. Due to the difficulty of mutual dissolution between carbon dioxide and formation water in the reservoir, the Jamin effect took place, which increased the resistance of formation water seepage. When conventional water with supercritical CO2 alternating flooding was simulated, the oil recovery increased to 45.29% when the injection amount was 0.8 PV. Comparing conventional water flooding, active water flooding, and supercritical CO2 flooding, conventional water with supercritical CO2 alternating flooding played a greater role in controlling water production. When the injection amount reached 0.8 PV, the water cut was only 64.27%, decreasing by 26.91 and 19.27%, which indicated that the propulsion speed of the water drive leading edge was significantly reduced due to the enhanced Jamin effect. For active water and supercritical CO2 alternating flooding, the oil recovery saw a further increase to 49.34%, while the water cut was only 59.47% when the injection amount reached 0.8 PV. From the comparison above, it can be concluded that alternating the flooding of active water and supercritical CO2 played a great role in increasing oil recovery and controlling water production, which can effectively reduce the propulsion speed of the water drive leading edge because of the enhanced Jamin effect.

4. Discussion

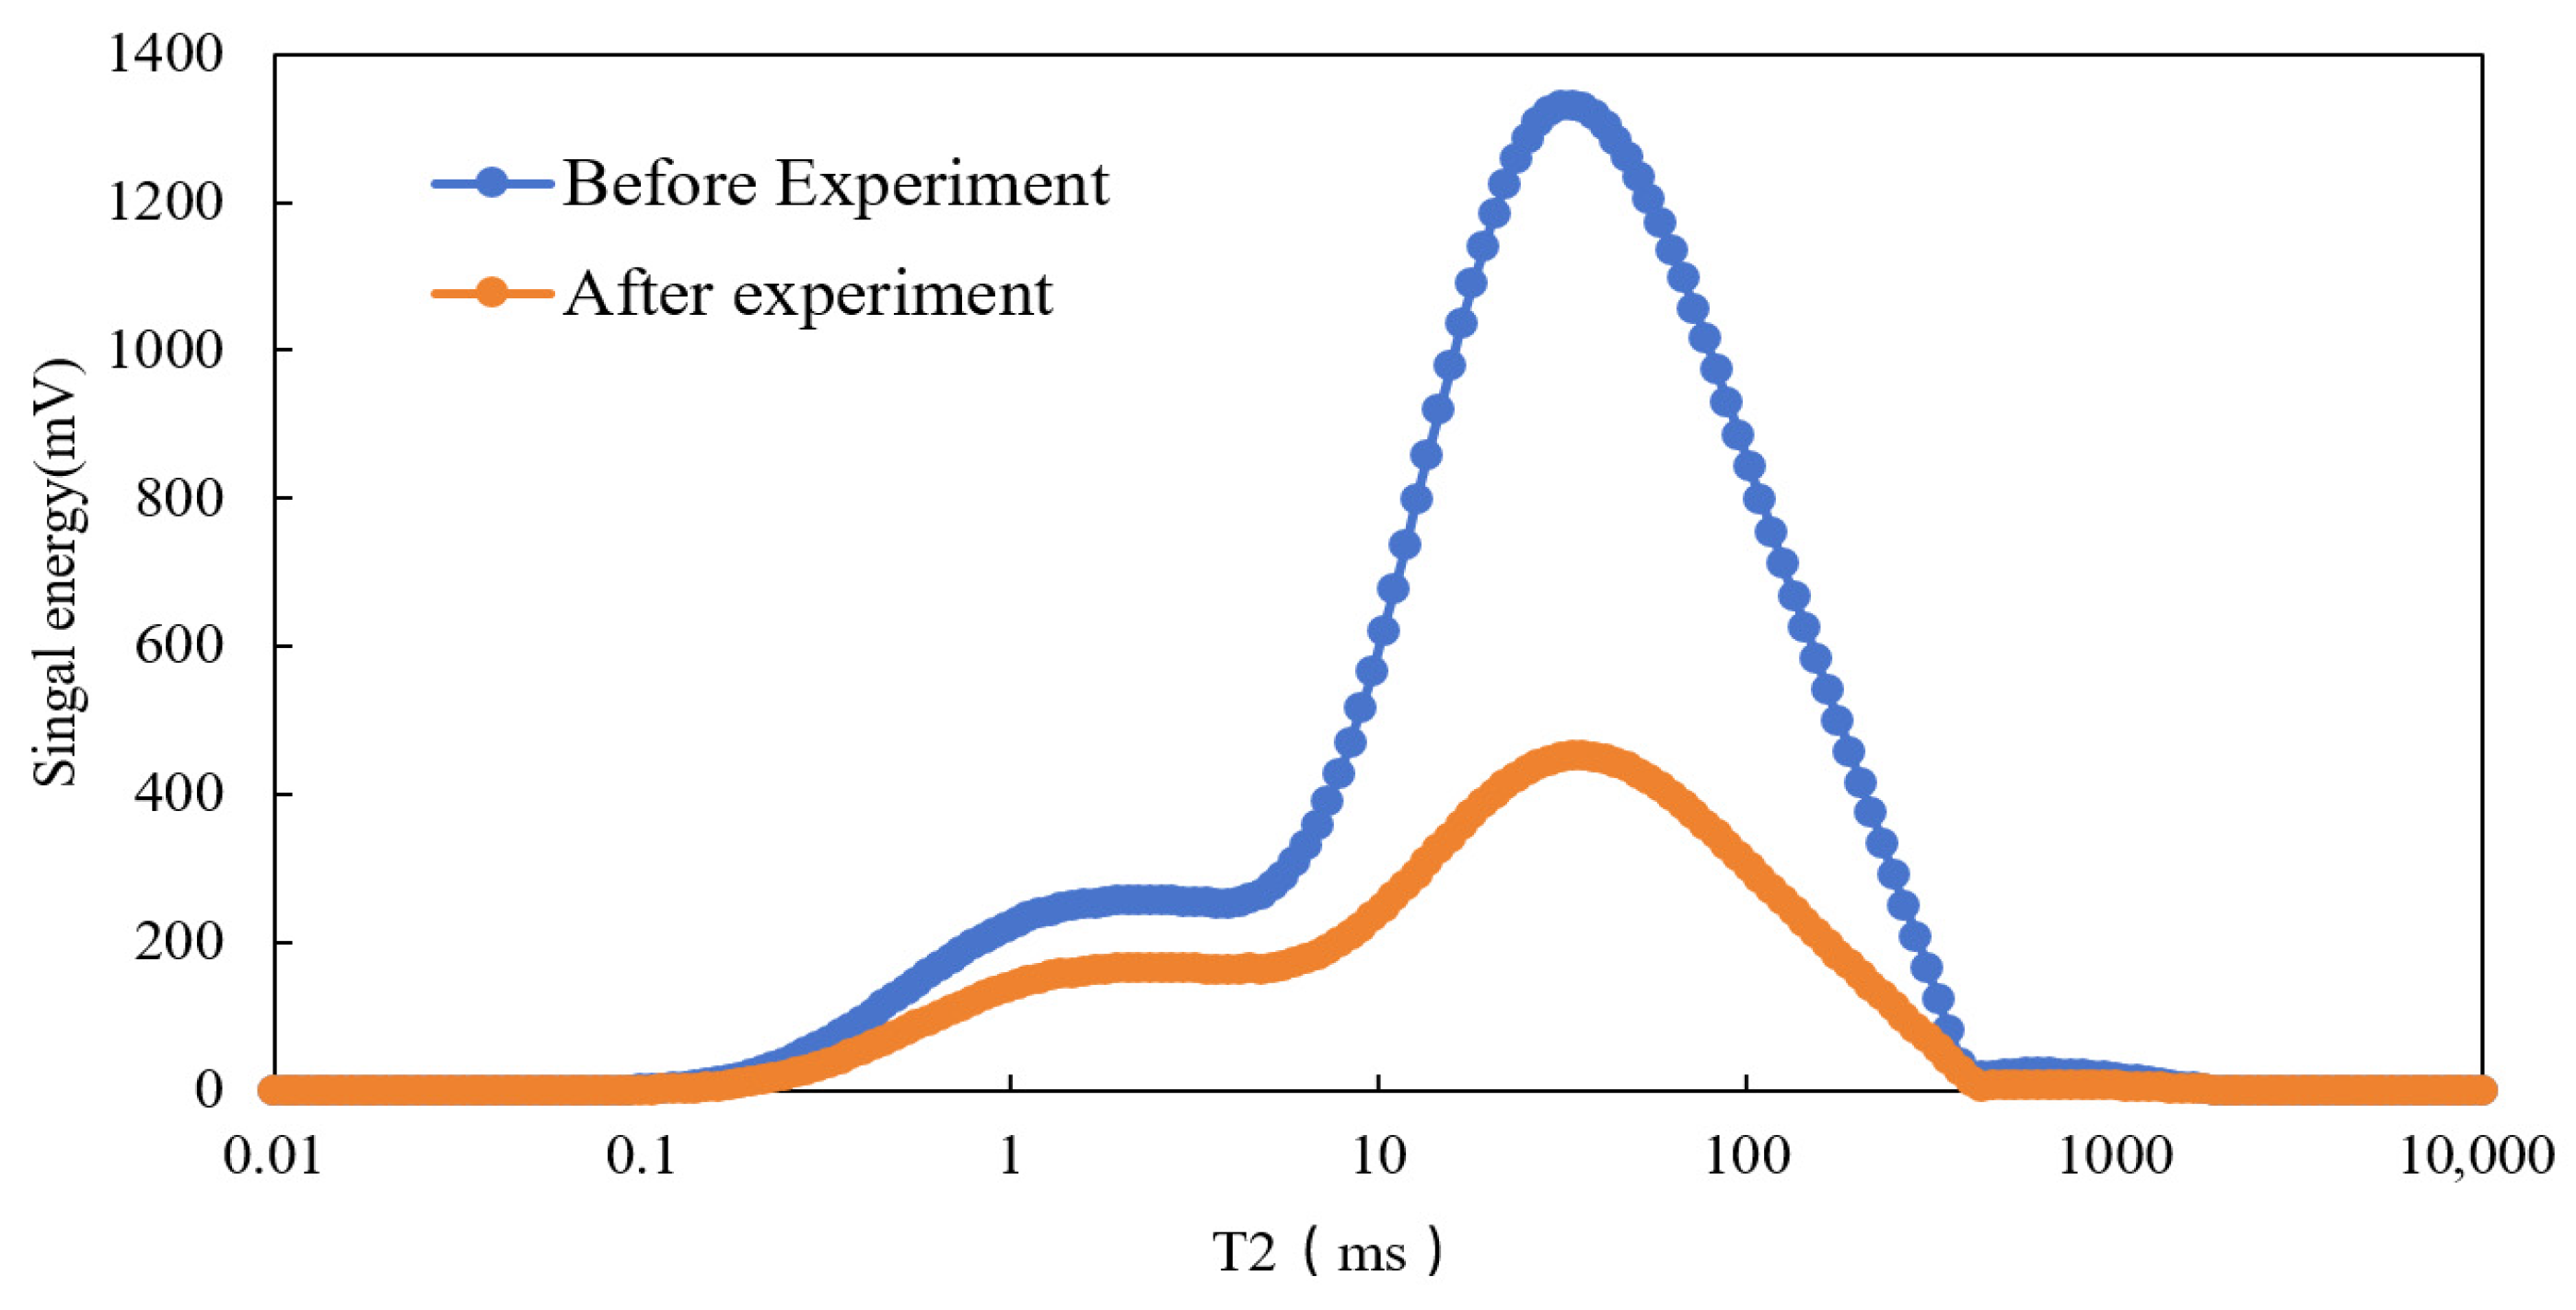
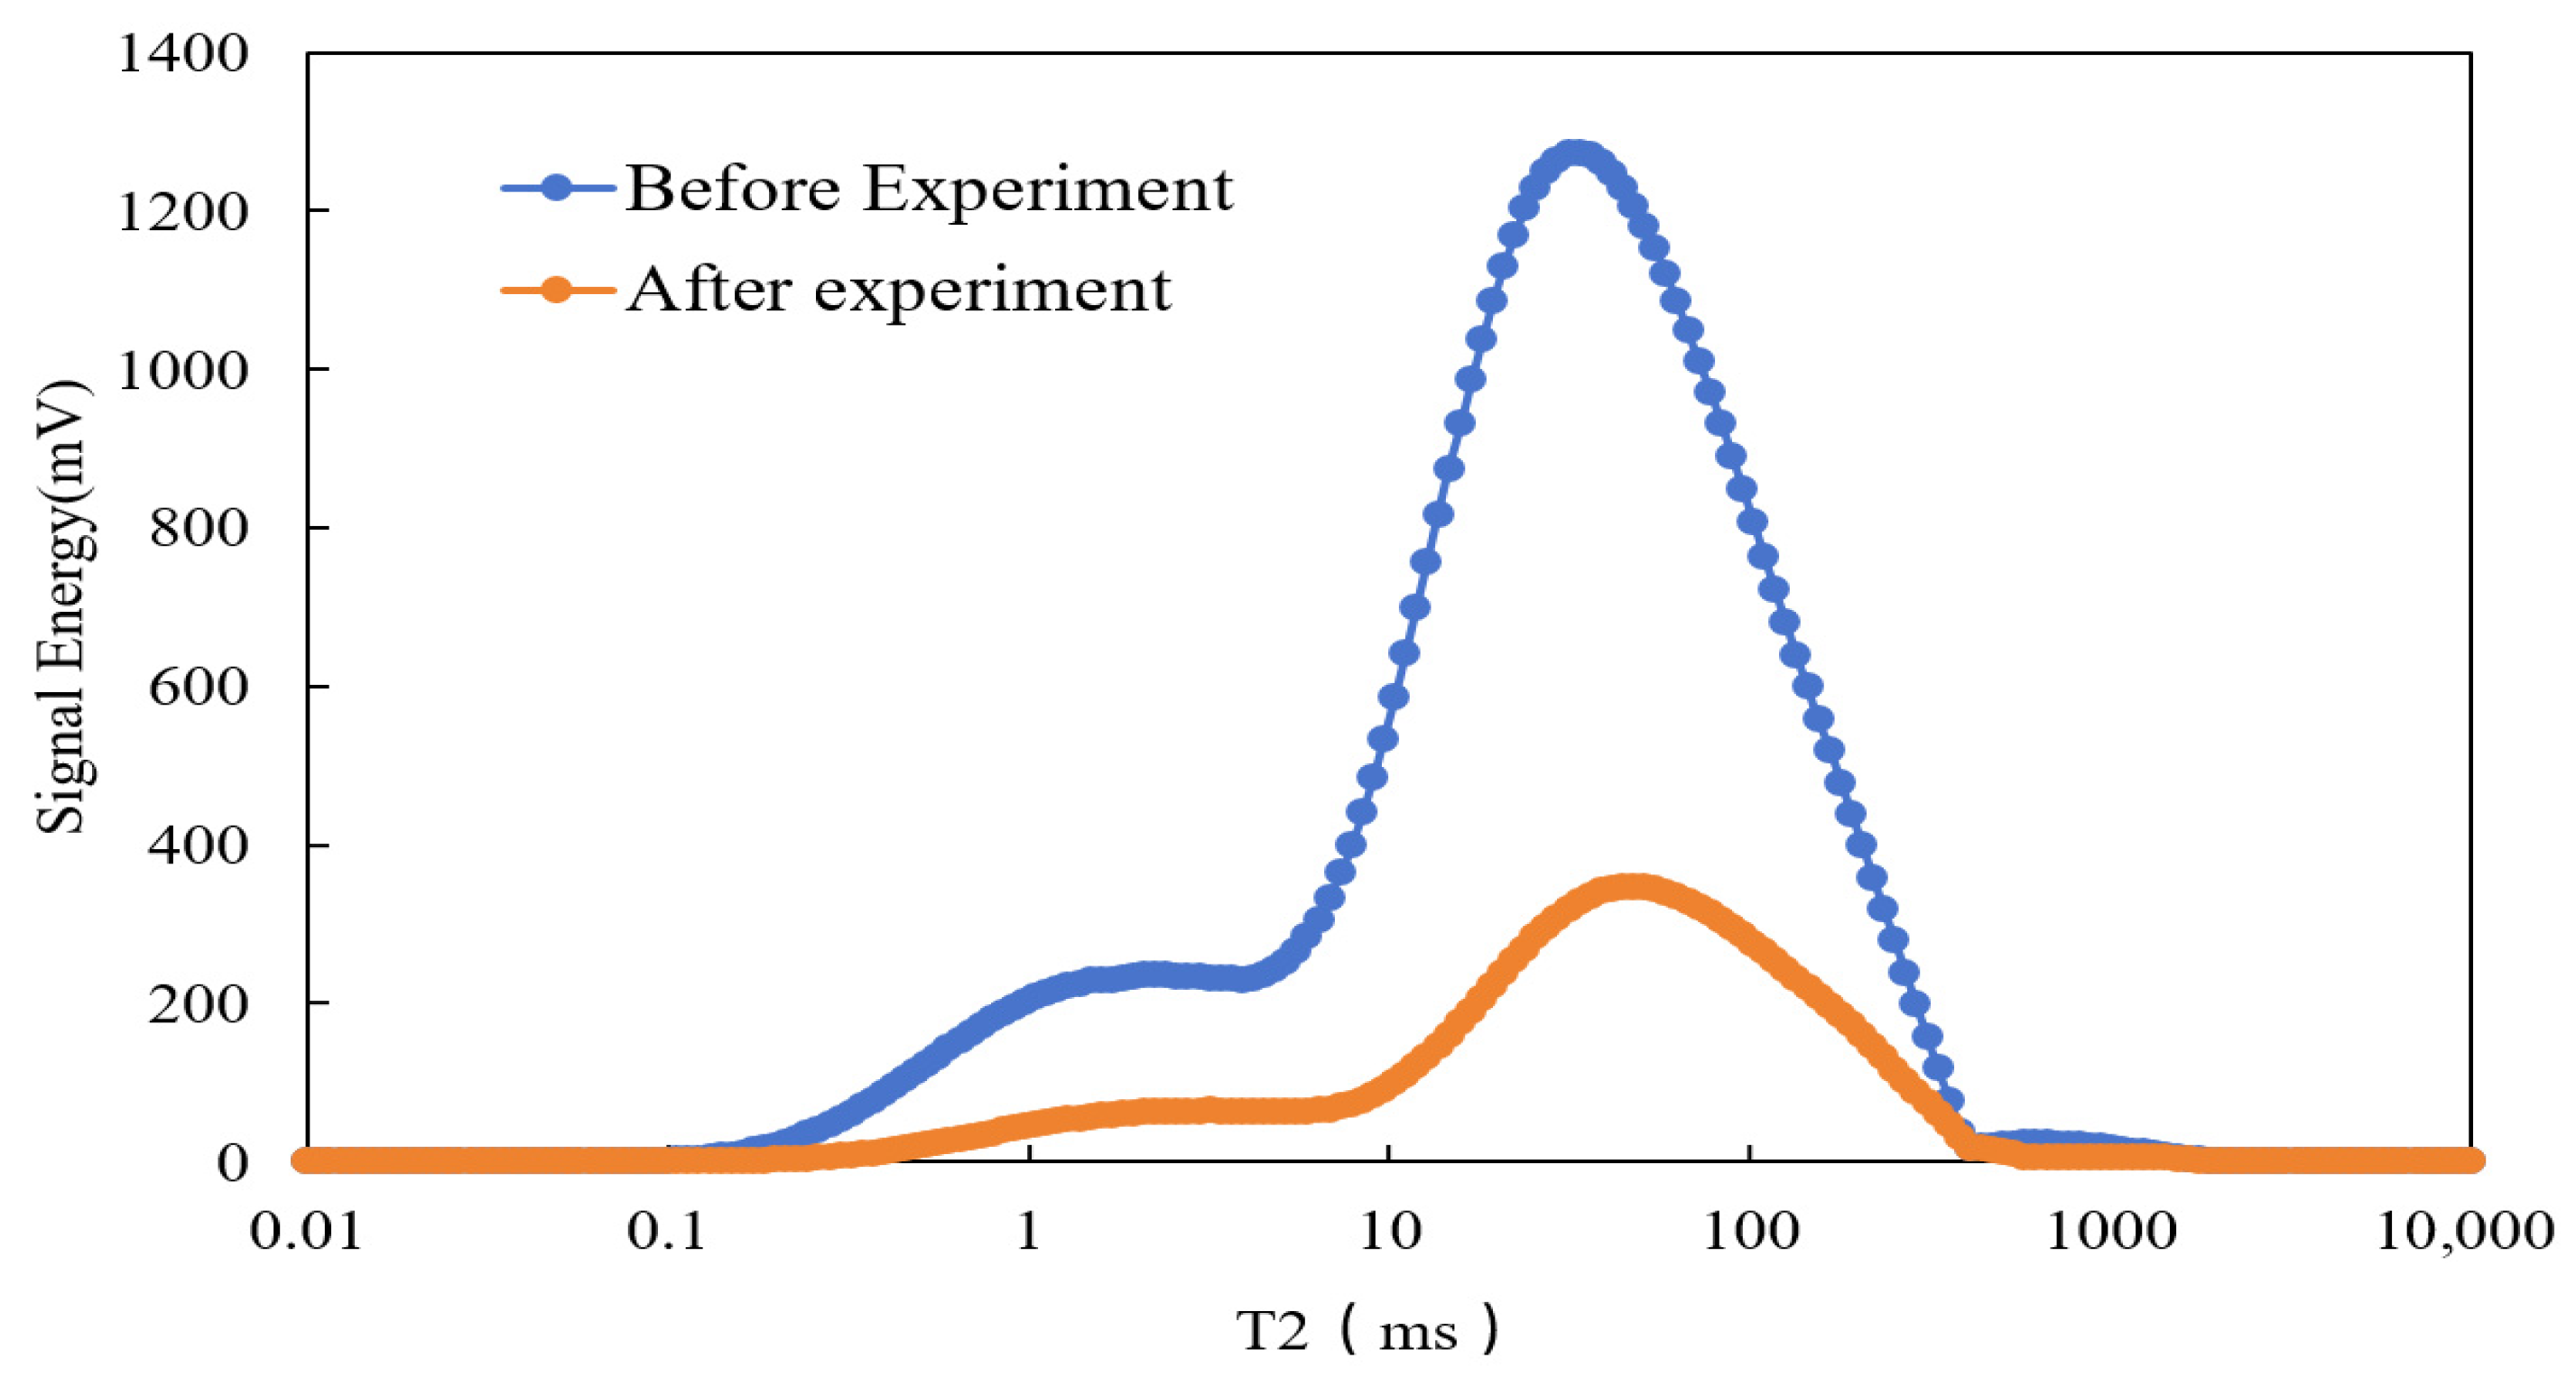
In order to reveal the microscopic mechanism of oil displacement in ultra-low-permeability reservoirs, nuclear magnetic resonance (NMR) tests were conducted on the core samples from the five experiments after oil displacement, and the fluid distribution at different stages was analyzed. As shown in Figure 3, Figure 4, Figure 5, Figure 6 and Figure 7, the T2 spectra of the five saturated single-phase fluid cores indicated that the relaxation time of the peak pore size was between 1 and 600 ms, which meant that the micro-porous structure of the core samples from the five experiments had the same tendency. The effect of pore structure and water saturation on the experimental results can be ignored. Based on a water drive recovery rate of 30.64%, the active water drive recovery rate increased by 7.02%, the CO2 drive recovery rate increased by 13.27%, the CO2 and water alternating drive recovery rate increased by 20.50%, and the CO2 and active water alternating drive recovery rate increased by 33.23%.
In the left peak of the T2 spectrum of the five samples, there is no change in the partial porosity component before and after displacement, but the position of the change in the porosity component of the left peak of the T2 curve differs under different displacement modes. Because the relaxation time (T2) is related to the pore radius (RC), it is necessary to convert the relaxation time into the pore radius RC for further analysis of the influence of different displacement modes on oil recovery in different pore diameters.
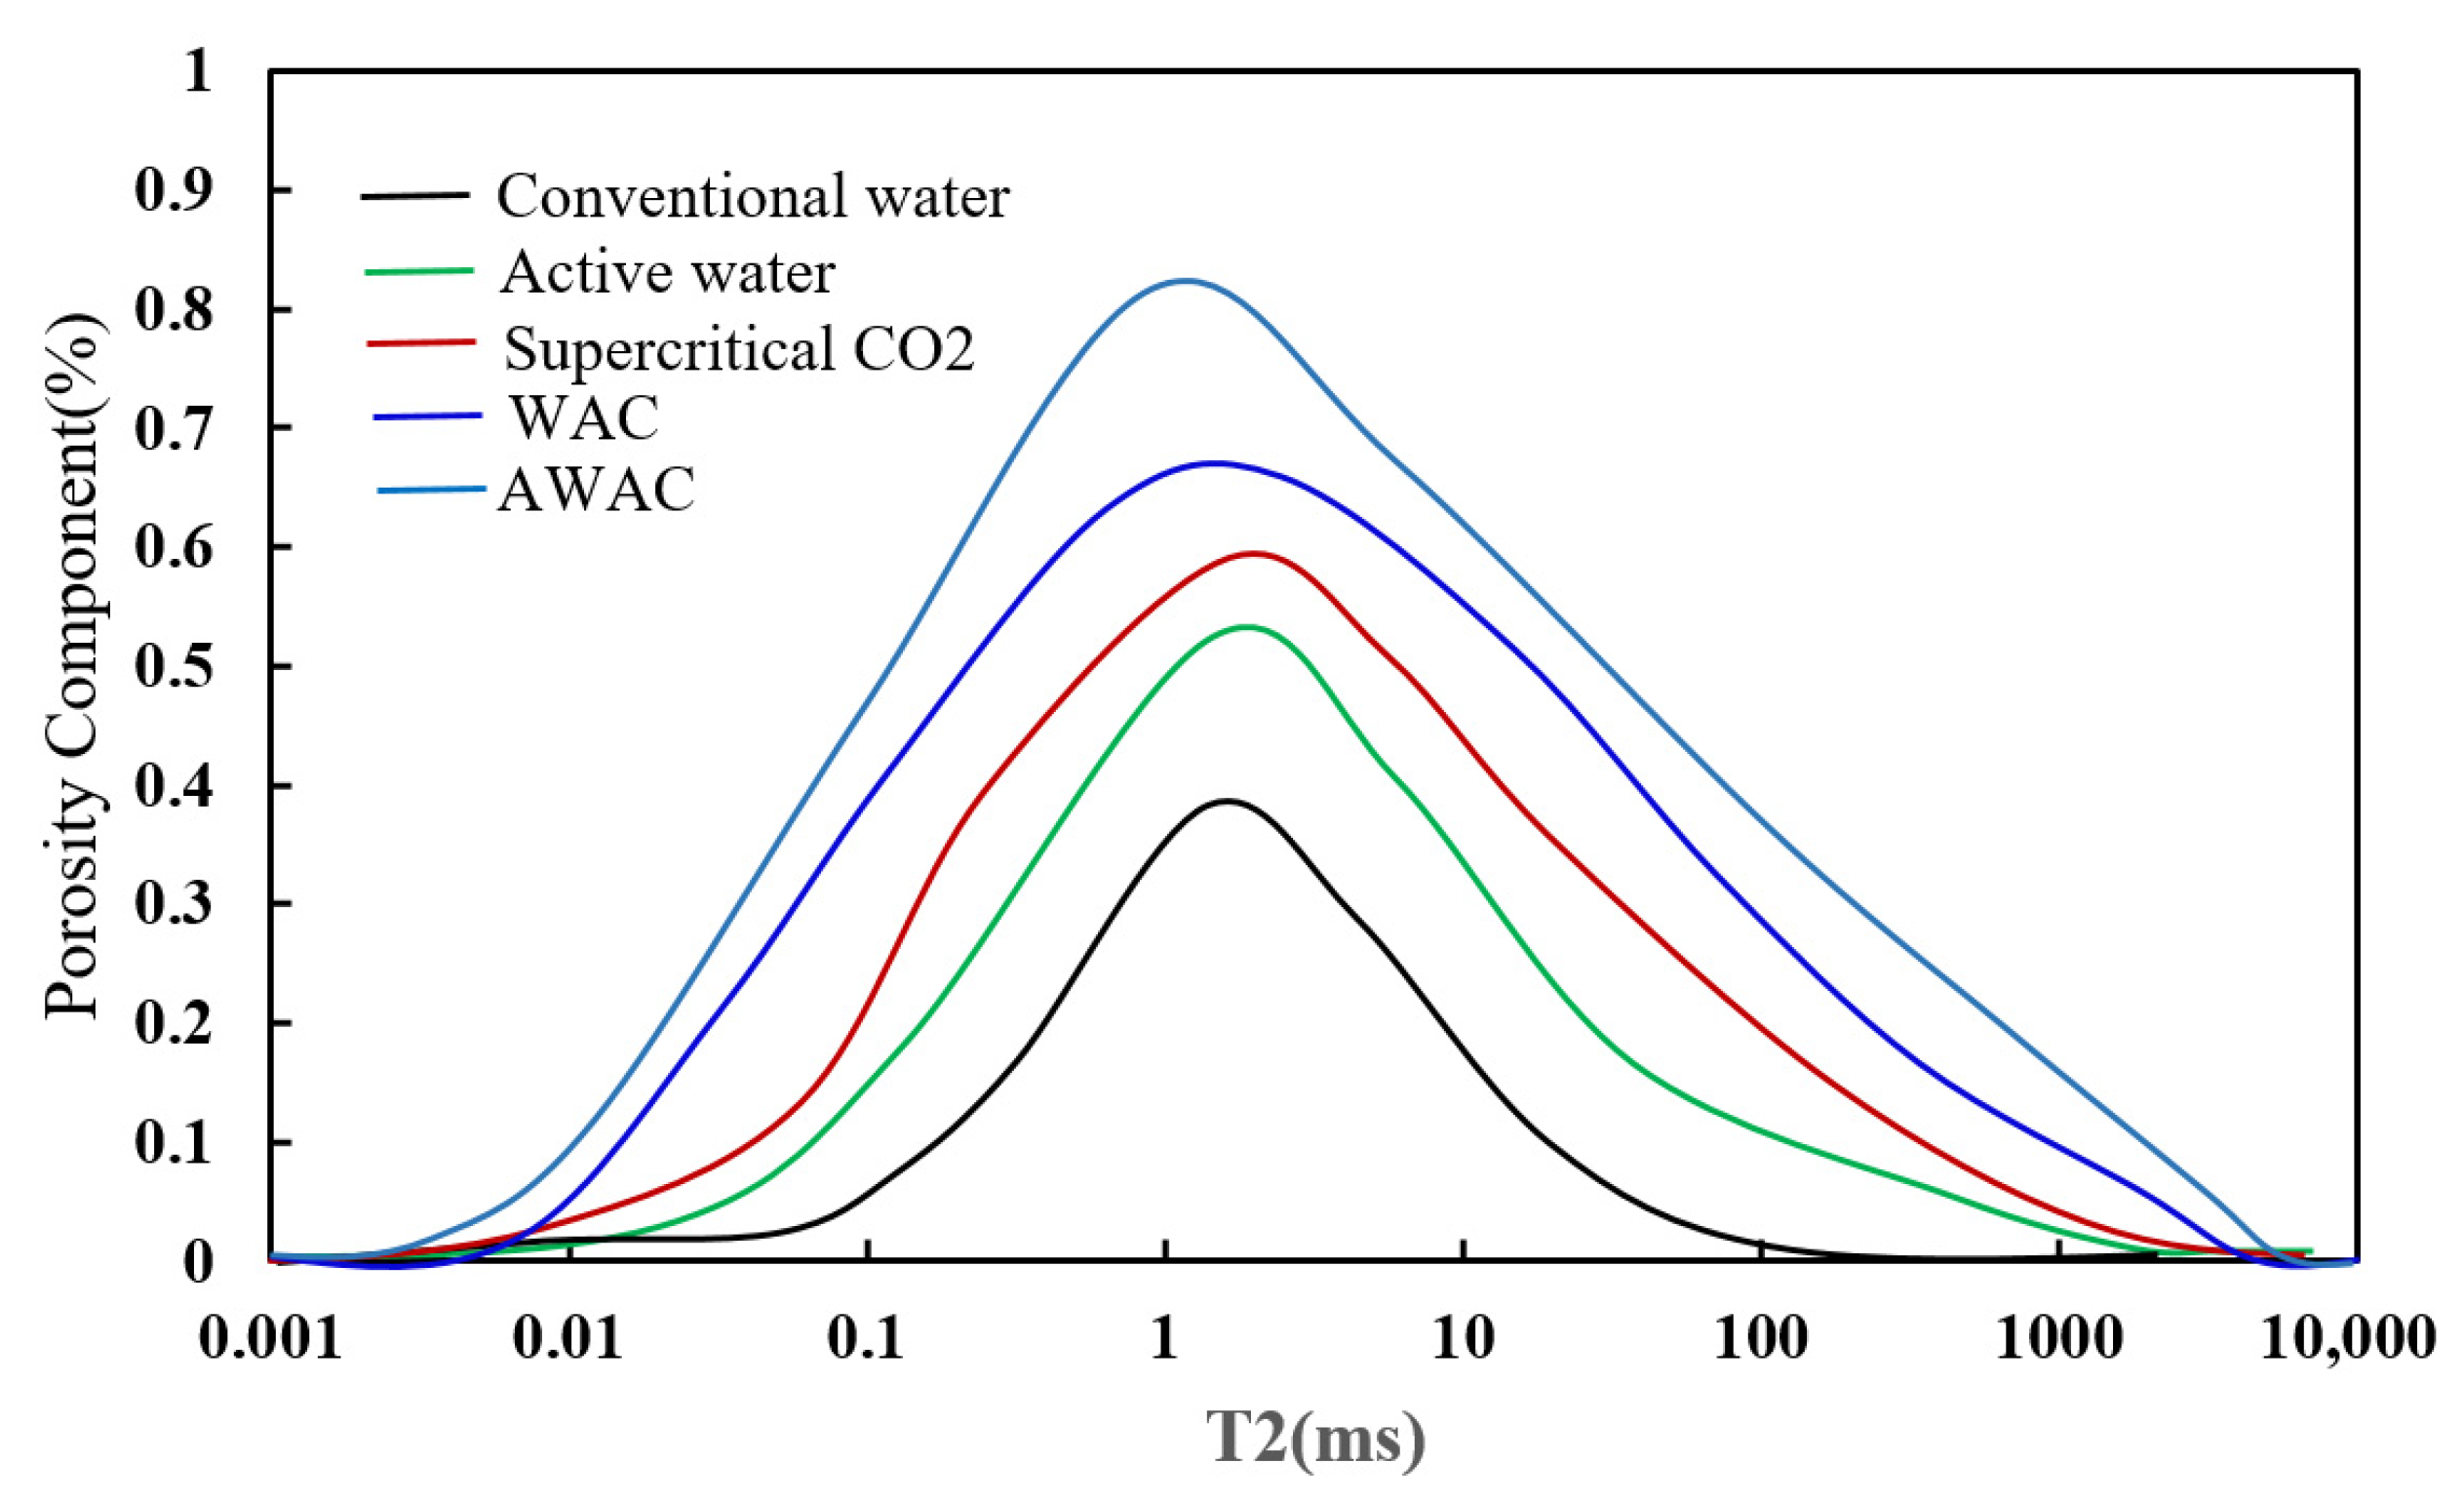
Combined with the NMR results, the porosity distribution of the matrix under different pore throat radii can be obtained by removing the pore distribution of the fractures, as shown in Figure 8. According to Figure 8, the pore throats range from 0.001 to 10 μ m and can be divided into four interval types: type I (0.001–0.01 μ m), type II (0.01–0.1 μ m), type III (0.1–1.0 μ m), and type IV (1.0–10 μ m). Furthermore, the variation in fluid controlled by different pore throat radii can be studied, and the oil utilization in pores controlled by different pore throat radii can be calculated.
By calculating the oil utilization of different pore throats, the following conclusions can be drawn.
(1)
Comparing the initial and remaining oil saturation shows that the initial oil saturation was influenced by the pore structure; oil was mainly distributed in the pore throat range of 0.1–1.0 μm, and oil in the pore throat range of 0.001–0.01 μ m was rare. After the displacement process, the remaining oil saturation in all pore throats was up to 6.0% lower than the irreducible water saturation, which indicates that using supercritical CO2 and active water can effectively improve oil displacement.
(2)
Comparing the different types of pore throats, the utilization of pore throats in five rock samples shows consistency. The highest utilization was found for type III (0.1–1 µm), followed by type IV (1–10 µm), type II (0.01–0.1 µm), and type I (0.001–0.01 µm).
(3)
In terms of oil recovery, the active water flooding recovery is 39.14%, while the water flooding recovery is 36.58%, having increased by 7.01%. The greatest increase in active water flooding was achieved for pore throat type II (0.01–0.1 m), with an increase of 5.48%, followed by type IV (1.0–10.0 m), with an increase of 3.36%. This shows that active water flooding can effectively improve the displacement effect in the pore throat range of 0.01–0.1 µm.
(4)
Comparing CO2 flooding with water flooding, it was found that supercritical CO2 can increase oil recovery by 13.26%. Supercritical CO2 had the most obvious effect on pore throats of 0.001~0.01 µm, with an increase of 9.25%, followed by type II (0.01~0.1 µm) pore throats, with an increase of 8.30%. This indicates that supercritical CO2 flooding can effectively improve oil recovery in pore throats of 0.001~0.1 µm.
(5)
Comparing water + CO2 alternating flooding, active water + CO2 alternating flooding, and water flooding, the highest utilization of water + CO2 alternating flooding occurs in pore throats in the 0.001~0.01 µm range, while when using active water + CO2 alternating flooding, a corresponding recovery process of different types of pore throats is found. This shows that the oil displacement effect is primarily improved by active water flooding in pores with a throat radius of 0.01~0.1 m, while supercritical CO2 flooding can effectively improve oil recovery in pore throats of 0.001~0.1 µm.

5. Conclusions

Based on core displacement experiments, five different oil displacement modes were simulated, namely water flooding, active water flooding, supercritical CO2 flooding, water + CO2 alternating flooding, and active water + CO2 interactive flooding. The micro displacement mechanism of low-permeability reservoirs was revealed through nuclear magnetic resonance detection. The following conclusions can be drawn:
(1)
Compared with water flooding, active water flooding, supercritical CO2 flooding, water + CO2 alternating flooding, and active water + CO2 staggered flooding, the experimental results suggest that active water with CO2 alternating flooding shows great advantages in terms of increasing oil recovery and decreasing water production. The experiments showed that the oil recovery increased by more than 16.4%, while the water cut decreased by 37.8%, which can effectively reduce the propulsion speed of the water drive leading edge due to the enhanced Jamin effect.
(2)
Nuclear magnetic resonance detection under five different displacement modes showed consistency in the utilization of pore throat oil among the five different displacement modes. The highest utilization rate was in type III (0.1~1 µm), followed by types IV (1~10 µm), II (0.01~0.1 µm), and I (0.001~0.01 µm).
(3)
Comparing the oil utilization of pore throats under different displacement methods, it was found that active water injection can effectively improve the oil recovery rate of 0.01~0.1 µm pore throats, while supercritical CO2 displacement can effectively improve the oil recovery rate of 0.001~0.1 µm pore throats. At the same time, it was found that conventional water + CO2 alternating flooding can effectively improve the oil recovery effect of type I pore throats, while active water + CO2 alternating flooding can effectively increase the recovery rate of different types of reservoirs.

Author Contributions

Conceptualization, B.W., J.D. and P.Z.; Methodology, B.W., P.Z. and K.L.; Validation, J.D.; Formal analysis, B.W.; Investigation, B.W., J.D. and K.L.; Resources, B.W. and J.D.; Writing—original draft, B.W., J.D., P.Z. and K.L. All authors have read and agreed to the published version of the manuscript.

Funding

This research received no external funding.

Data Availability Statement

The original contributions presented in this study are included in the article. Further inquiries can be directed to the corresponding author.

Conflicts of Interest

Authors Bin Wang, Jingfeng Dong, Peiyao Zhou and Kaixin Liu were employed by the company Production Technology Research Institute, PetroChina Xinjiang Oilfield Company. The company had no role in the design of the study; in the collection, analyses, or interpretation of data; in the writing of the manuscript, or in the decision to publish the results.

References

  1. Nakagawa, S.; Kneafsey, T.; Daley, T.M.; Freifeld, B.M.; Rees, E.V. Laboratory seismic monitoring of supercritical CO2 flooding in sandstone cores using the Split Hopkinson Resonant Bar technique with concurrent x-ray Computed Tomography imaging. Geophys. Prospect. 2013, 61, 254–269. [Google Scholar] [CrossRef]
  2. Wang, Z.; Cates, E.; Langa, T.R. Seismic Monitoring of CO2 Flooding in a Carbonate Reservoir: Rock Physics Study; Society of Exploration Geophysicists: Houston, TX, USA, 1996; pp. 1886–1889. [Google Scholar]
  3. Alemu, B.L.; Aker, E.; Soldal, M.; Johnsen, Ø.; Aagaard, P. Influence of CO2 on rock physics properties in typical reservoir rock: A CO2 flooding experiment of brine saturated sandstone in a CT-scanner. Energy Procedia 2011, 4, 4379–4386. [Google Scholar] [CrossRef]
  4. Zhou, Y.; Yin, D.; Cao, R.; Zhang, C. The mechanism for pore-throat scale emulsion displacing residual oil after water flooding. J. Pet. Sci. Eng. 2018, 163, 519–525. [Google Scholar] [CrossRef]
  5. Jiang, L.; Nishizawa, O.; Zhang, Y.; Park, H.; Xue, Z. A novel high-pressure vessel for simultaneous observations of seismic velocity and in situ CO2 distribution in a porous rock using a medical X-ray CT scanner. J. Appl. Geophys. 2016, 135, 67–76. [Google Scholar] [CrossRef]
  6. Zhang, Y.; Kogure, T.; Nishizawa, O.; Xue, Z. Different flow behavior between 1-to-1 displacement and co-injection of CO2 and brine in Berea sandstone: Insights from laboratory experiments with X-ray CT imaging. Int. J. Greenh. Gas Control 2017, 66, 76–84. [Google Scholar] [CrossRef]
  7. Kuo, C.-W.; Benson, S.M. Numerical and analytical study of effects of small scale heterogeneity on CO2/brine multiphase flow system in horizontal corefloods. Adv. Water Resour. 2015, 79, 1–17. [Google Scholar] [CrossRef]
  8. Perrin, J.-C.; Krause, M.; Kuo, C.-W.; Miljkovic, L.; Charoba, E.; Benson, S.M. Core-scale experimental study of relative permeability properties of CO2 and brine in reservoir rocks. Energy Procedia 2009, 1, 3515–3522. [Google Scholar] [CrossRef]
  9. Chiquet, P.; Daridon, J.-L.; Broseta, D.; Thibeau, S. CO2/water interfacial tensions under pressure and temperature conditions of CO2 geological storage. Energy Convers. Manag. 2007, 48, 736–744. [Google Scholar] [CrossRef]
  10. Akbarabadi, M.; Piri, M. Relative permeability hysteresis and capillary trapping characteristics of supercritical CO2/brine systems: An experimental study at reservoir conditions. Adv. Water Resour. 2013, 52, 190–206. [Google Scholar] [CrossRef]
  11. Pini, R.; Benson, S.M. Capillary pressure heterogeneity and hysteresis for the supercritical CO2/water system in a sandstone. Adv. Water Resour. 2017, 108, 277–292. [Google Scholar] [CrossRef]
  12. Burnside, N.M.; Naylor, M. Review and implications of relative permeability of CO2/brine systems and residual trapping of CO2. Int. J. Greenh. Gas Control 2014, 23, 1–11. [Google Scholar] [CrossRef]
  13. Tenney, C.M.; Dewers, T.; Chaudhary, K.; Matteo, E.N.; Cardenas, M.B.; Cygan, R.T. Experimental and simulation study of carbon dioxide, brine, and muscovite surface interactions. J. Pet. Sci. Eng. 2017, 155, 78–88. [Google Scholar] [CrossRef]
  14. Rasmusson, K.; Rasmusson, M.; Tsang, Y.; Benson, S.; Hingerl, F.; Fagerlund, F.; Niemi, A. Residual trapping of carbon dioxide during geological storage—Insight gained through a pore-network modeling approach. Int. J. Greenh. Gas Control 2018, 74, 62–78. [Google Scholar] [CrossRef]
  15. Jing, G.; Tang, S.; Li, X.; Wang, H. The analysis of scaling mechanism for water-injection pipe columns in the Daqing Oilfield. Arab. J. Chem. 2017, 10, S1235–S1239. [Google Scholar] [CrossRef]
  16. Mou, J.; Yam, X.; Zhang, S.; Shi, L.; Li, D.; Ma, X. Research on CO2 Matrix Penetration Distance in Tight Reservoirs. Xinjiang Oil Gas 2024, 20, 64–71. [Google Scholar] [CrossRef]
  17. Xiao, W.; Chen, S.; Yi, Y.; Chen, H.; Ren, J. NMR-Based Experiments of Fracturing Fluid Assisted CO2 Huff-n-Puff for Enhancing Shale Oil Recovery. Xinjiang Oil Gas 2024, 20, 83–90. [Google Scholar] [CrossRef]
  18. Buckley, J.S.; Hirasaki, G.J.; Liu, Y.; Von Drasek, S.; Wang, J.X.; Gill, B.S. ASPHALTENE PRECIPITATION AND SOLVENT PROPERTIES OF CRUDE OILS. Pet. Sci. Technol. 1998, 16, 251–285. [Google Scholar] [CrossRef]
  19. Cameron, D.A.; Durlofsky, L.J. Optimization of well placement, CO2 injection rates, and brine cycling for geological carbon sequestration. Int. J. Greenh. Gas Control 2012, 10, 100–112. [Google Scholar] [CrossRef]
  20. Nielsen, L.C.; Bourg, I.C.; Sposito, G. Predicting CO2–water interfacial tension under pressure and temperature conditions of geologic CO2 storage. Geochim. Cosmochim. Acta 2012, 81, 28–38. [Google Scholar] [CrossRef]
  21. Ma, X.; Li, X.; Yang, G.; Huang, W.; Diao, Y.; Hu, L.; Zhang, H.; Wei, S. Study on Field-scale of CO2 Geological Storage Combined with Saline Water Recovery: A Case Study of East Junggar Basin of Xinjiang. Energy Procedia 2018, 154, 36–41. [Google Scholar] [CrossRef]
  22. Shabaninejad, M.; Middlelton, J.; Fogden, A. Systematic pore-scale study of low salinity recovery from Berea sandstone analyzed by micro-CT. J. Pet. Sci. Eng. 2017, 163, S092041051731029X. [Google Scholar] [CrossRef]
  23. Honari, V.; Underschultz, J.; Wang, X.; Garnett, A.; Wang, X.; Gao, R.; Liang, Q. CO2 sequestration-EOR in Yanchang oilfield, China: Estimation of CO2 storage capacity using a two-stage well test. Energy Procedia 2018, 154, 9–14. [Google Scholar] [CrossRef]
  24. Oh, J.; Kim, K.-Y.; Han, W.S.; Park, E.; Kim, J.-C. Migration behavior of supercritical and liquid CO2 in a stratified system: Experiments and numerical simulations. Water Resour. Res. 2015, 51, 7937–7958. [Google Scholar] [CrossRef]
  25. Perrin, J.-C.; Benson, S. An Experimental Study on the Influence of Sub-Core Scale Heterogeneities on CO2 Distribution in Reservoir Rocks. Transp. Porous Media 2010, 82, 93–109. [Google Scholar] [CrossRef]
  26. Park, H.; Jiang, L.; Kiyama, T.; Zhang, Y.; Ueda, R.; Nakano, M.; Xue, Z. Influence of Sedimentation Heterogeneity on CO2 Flooding. Energy Procedia 2017, 114, 2933–2941. [Google Scholar] [CrossRef]
  27. Gonçalves, S.I.; Ligneul, C.; Shemesh, N. Short echo time relaxation-enhanced MR spectroscopy reveals broad downfield resonances. Magn. Reson. Med. 2019, 82, 1266–1277. [Google Scholar] [CrossRef] [PubMed]
  28. Coskun, S.B.; Wardlaw, N.C. Image analysis for estimating ultimate oil recovery efficiency by waterflooding for two sandstone reservoirs. J. Pet. Sci. Eng. 1996, 15, 237–250. [Google Scholar] [CrossRef]
  29. Kewen, W.; Ning, L. Numerical simulation of rock pore-throat structure effects on NMR T2 distribution. Appl. Geophys. 2008, 5, 86–91. [Google Scholar] [CrossRef]
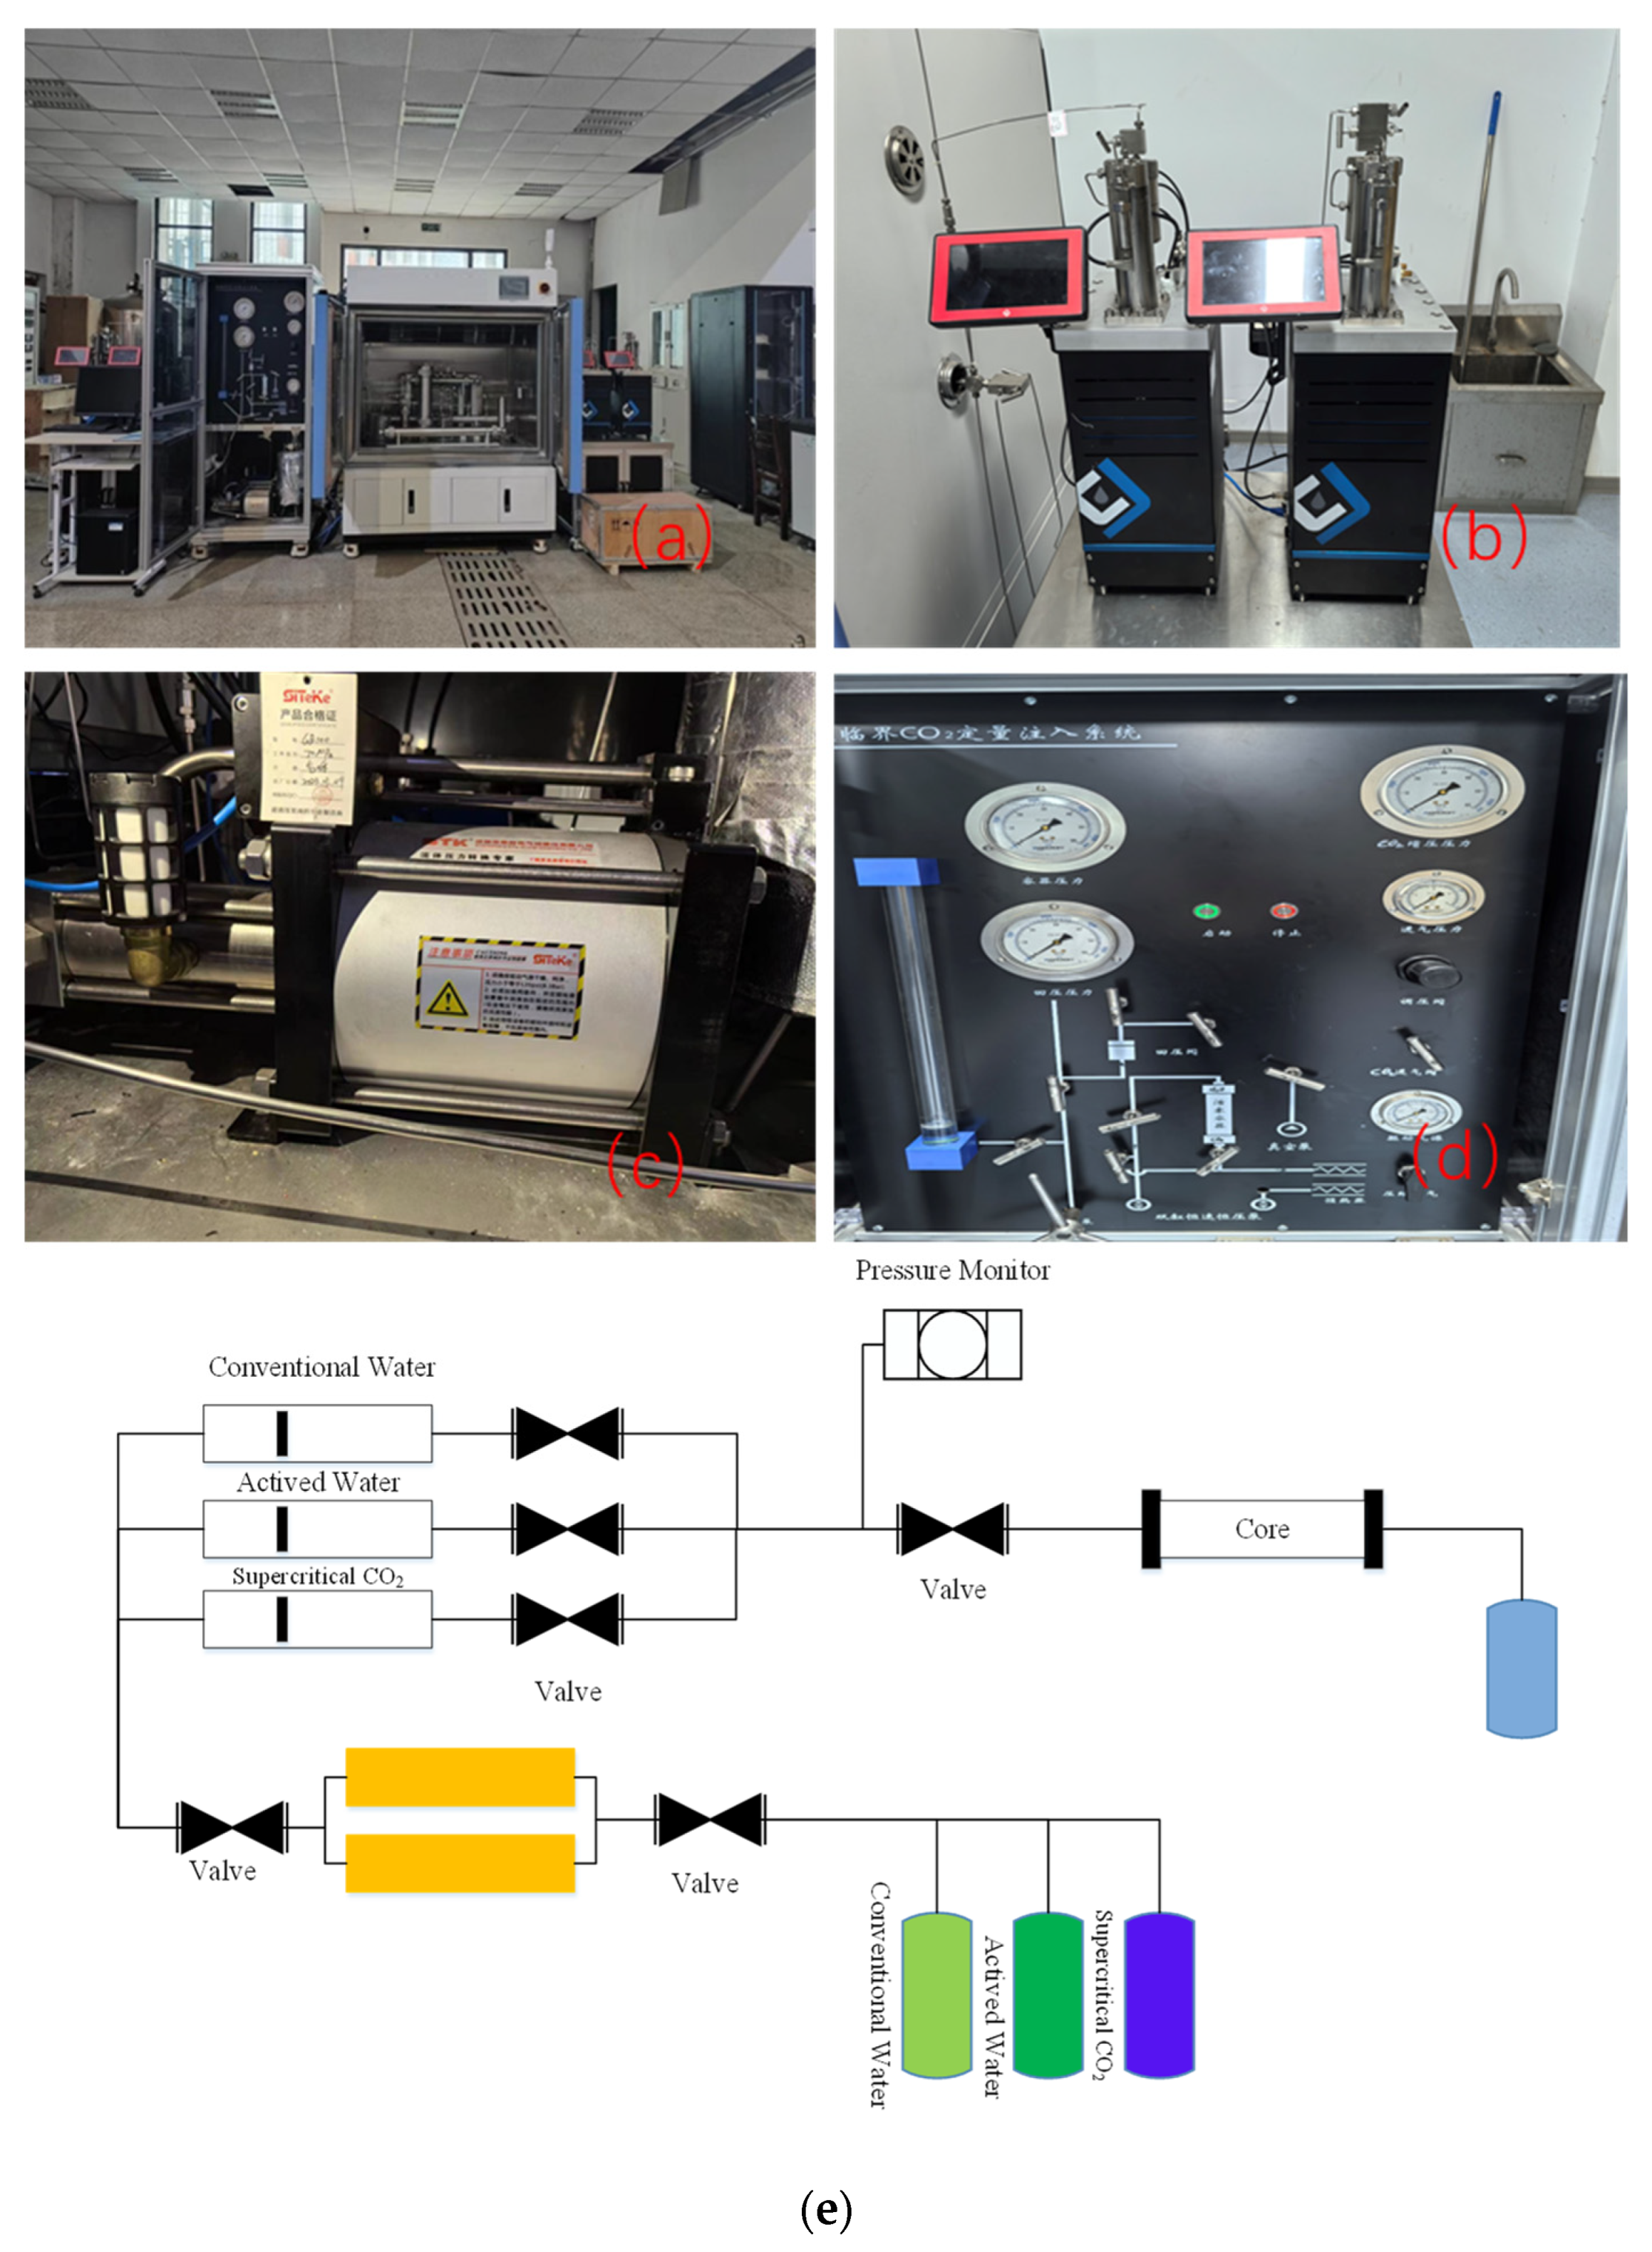
Figure 1. Experimental devices: (a) high-temperature and high-pressure displacement experimental device; (b) constant temperature and pressure pump; (c) gas pressurization device; (d) controlling system; (e) the flooding experimental schedule of different flooding modes.
Processes 13 02535 g001
Figure 2. Change in water cut and oil recovery under different flooding modes.
Processes 13 02535 g002
Figure 3. The distribution of T2 spectra under water flooding.
Processes 13 02535 g003
Figure 4. The distribution of T2 spectra under active water flooding.
Processes 13 02535 g004
Figure 5. The distribution of T2 spectra under CO2 flooding.
Processes 13 02535 g005
Figure 6. The distribution of T2 spectra under WAC flooding.
Processes 13 02535 g006
Figure 7. The distribution of T2 spectra under AWAC flooding.
Processes 13 02535 g007
Figure 8. The porosity distribution of the matrix under different pore throat radii.
Processes 13 02535 g008
Table 1. Formation water ion composition and salinity.
Na++K+Mg2+Ca2+SO42−ClCO32−HCO3Total Salinity/
mg/L
14,570.00336.0471.2336.215,470.2669.0332.132,184.7
Table 2. Basic parameters of experimental cores.
No.Core Size
Length × Diameter
/cm
Permeability
/mD
Porosity
/%
Dry Weight
/g
160 × 2.541.47.32426.8
260 × 2.541.47.32427.4
360 × 2.541.47.32426.4
460 × 2.541.47.32426.7
560 × 2.541.47.32428.1
Table 3. The details of the flooding schedule of different flooding modes.
SampleExperimental Scheme
Sample 1Conventional water flooding (0.8 PV)
Sample 2Active water flooding (0.8 PV)
Sample 3CO2 flooding (0.8 PV)
Sample 40.15 PV conventional water + 0.15 PV CO2 + 0.15 PV conventional water + 0.15 PV CO2 + 0.10 PV conventional water + 0.10 PV CO2 + conventional water flooding
Sample 5Active water (0.15 PV) + 0.15 PV CO2 + active water (0.15 PV) + 0.15 PV CO2 + active water (0.1 PV) + 0.1 PV CO2
Table 4. Comparison of water cut and oil recovery under different flooding modes.
Flooding ModeWater Cut/%Oil Recovery/%
Conventional water flooding99.0637.42
Active water flooding98.2240.21
Supercritical CO2 flooding98.4241.5
Supercritical CO2 + conventional water flooding98.5845.29
Supercritical CO2 + active water flooding97.8949.35
Disclaimer/Publisher’s Note: The statements, opinions and data contained in all publications are solely those of the individual author(s) and contributor(s) and not of MDPI and/or the editor(s). MDPI and/or the editor(s) disclaim responsibility for any injury to people or property resulting from any ideas, methods, instructions or products referred to in the content.