Article

The Influence of the Geometric Configuration of the Drive System on the Motion Dynamics of Jaw Crushers

1
Department of Environmental Engineering, Mechanical Engineering and Agritourism, Faculty of Engineering, “Vasile Alecsandri” University of Bacau, 600115 Bacau, Romania
2
Institute of Vehicles and Construction Machinery Engineering, Warsaw University of Technology, 00-653 Warsaw, Poland
3
Faculty of Mechanical Engineering and Mechatronics, National University of Science and Technology POLITEHNICA Bucharest, 060042 Bucharest, Romania
4
Faculty of Materials Engineering and Mechanics, “Valahia” University of Targoviste, 130004 Targoviste, Romania
*
Authors to whom correspondence should be addressed.
Processes 2025, 13(8), 2498; https://doi.org/10.3390/pr13082498
Submission received: 15 July 2025 / Revised: 1 August 2025 / Accepted: 3 August 2025 / Published: 7 August 2025
(This article belongs to the Section Manufacturing Processes and Systems)

Abstract

This study presents a comparative analysis of two double-toggle drive systems for jaw crushers that are tension based and compression based (this refers to the way in which the connecting rod is mechanically stressed within the drive mechanism), with the objective of identifying the optimal configuration from both kinematic and functional perspectives. Jaw crushers play a critical role in the extractive industry, and their performance is strongly influenced by the geometry and positioning of the drive mechanism. A theoretical approach based on mathematical modeling and numerical simulation was applied to a real constructive model (SMD-117), assessing variations in the linear velocity of the moving links as a function of mechanism placement. The study employed Mathcad 15, Roberts Animator, and GIM (Graphical Interactive Mechanisms) 2025.4 software to perform calculations and simulate motion. Results revealed a sinusoidal velocity pattern with significant differences between the two systems: the tension-based drive achieves peak velocities at the beginning of the angular variation interval, while the compression-based system reaches its maximum toward the end. Link C consistently exhibits higher velocities than link E, indicating increased mechanical stress. Polar graphic analysis identified critical velocity angles, and simulations confirmed the model’s validity with a maximum error of just 1.79%. The findings emphasize the importance of selecting an appropriate drive system to enhance performance, durability, and energy efficiency, offering concrete recommendations for equipment design and operation.

1. Introduction

Jaw crushers are vital equipment in the extractive industry and in processing hard materials, widely used for reducing the sizes of rocks and other mineral substances. Their operational performance is directly influenced by the configuration of the drive mechanism, which determines both the efficiency of the crushing process and the durability of the system components. Due to these characteristics, jaw crushers are commonly found in sorting stations, quarries, and mining operations [1,2,3,4,5,6].
Jaw crushers can be classified according to the type of drive mechanism used. The most common systems include the following: (1) Mechanical Drive relies on a system of levers and gears to transmit motion from a motor to the crusher jaws. It is valued for its simplicity and reliability, though it requires regular maintenance to ensure optimal performance [7,8,9,10,11,12,13]. (2) Hydraulic/Pneumatic Drive utilizes hydraulic or pneumatic cylinders to control the movement of the crusher jaws, enabling precise control over the crushing force and allowing for the rapid adjustment of the jaw opening. This type is preferred in applications requiring high flexibility and rapid adaptation to varying material types [14,15,16,17,18,19]. (3) Electric Drive involves the use of electric motors, offering energy efficiency and precise control of both crushing speed and force [20,21,22,23,24].
Over time, numerous studies have been conducted to evaluate the performance and efficiency of jaw crushers [25,26,27,28,29,30,31], aiming to enhance their design and functionality, as well as identifying best practices for their use in various applications. Performance studies have examined the ability of jaw crushers to process different material types and achieve specific size fractions, involving tests under variable conditions and measurements of production capacity, energy consumption, and component wear [26,31,32,33]. Reliability studies, which are essential for ensuring continuous and efficient operation, have focused on component lifespan, failure frequency and causes, and preventive maintenance measures to reduce downtime [17,34]. Optimization studies have sought the most effective configurations and operating parameters to improve performance and reduce operational costs, also developing mathematical models and simulations to predict crusher behavior under varying conditions [35,36,37,38,39,40,41,42,43]. Environmental impact studies have primarily addressed dust and noise emissions, proposing mitigation strategies to minimize negative environmental effects [44]. Technological innovation studies have investigated the use of advanced materials, the development of novel drive technologies, and the implementation of automated control systems to further improve crusher performance and efficiency [45,46,47].
Among the types of crushers, double-toggle jaw crushers stand out for generating a complex yet controllable motion of the movable jaw. This motion is produced by a crank-slider mechanism, whose geometry and spatial configuration directly influence the trajectory and displacement velocity of the moving components. Depending on how the motion is transmitted, these mechanisms can be classified into two main categories: pull-type drive systems (Figure 1a) [48,49,50,51,52,53,54,55,56] and push-type drive systems (Figure 1b) [57,58,59,60].
The choice of drive type has significant implications for the kinematic behavior of the system, the mechanical stresses imparted to its components, and consequently, the overall efficiency of the equipment [49,61,62,63,64]. Therefore, a rigorous comparative analysis of the two drive configurations is essential for optimizing both the design and operational performance of such machinery. In the specialized literature, studies focused on the kinematic analysis of these mechanisms are relatively scarce [8,9,35,40,49,65], with comparative investigations largely absent. In this context, the use of modern tools for simulation and mathematical modeling becomes crucial for obtaining relevant and practically applicable results.
In the current context, where demands for energy efficiency [48,66], equipment durability [67], and industrial process optimization [35,36,38,39,40,58] are increasingly stringent, a detailed analysis of the kinematic behavior of jaw crushers is well justified. The choice of drive type [7,8,9,10,11,12,13,14,15,16,17,20,21,22,23,24,48,49,50,51,52,53,54,55,56,57,58,59,60] significantly influences the trajectory of the movable jaw, the linear velocity of its components, and consequently, the quality of the crushing process. As comminution is among the most energy-intensive operations within the entire technological chain, optimizing the motion of the movable jaw can contribute to reducing energy consumption and extending the lifespan of wear-prone components. Therefore, studies focusing on the kinematic and dynamic analysis of these mechanisms are highly relevant to the specialized industry [3,17,49,61,62,63,64].
The recent literature highlights a growing interest in optimizing the operation of jaw crushers [38,40,42,43,58,68,69,70,71,72], particularly through the development of mathematical models and numerical simulations that enable the precise analysis of their functional behavior. For instance, the Technical University of Moldova has proposed a universal mathematical model for determining productivity, which integrates dimensional and kinematic parameters to allow accurate performance estimations [73]. Another key aspect is the influence of the geometric positioning of the crank-slider mechanism on the kinematic parameters. Studies show that variations in the positioning angles of the connecting rod and crank can lead to significant changes in linear velocity, motion trajectory, and transmitted forces within the system. These findings are essential for optimizing crusher performance under real-world operating conditions [49].
However, many studies are limited to static analysis or global parameters, without accounting for dynamic variations in motion relative to the angular position of the system components [49,51,74,75,76]. Furthermore, few investigations offer a comparative perspective on the two drive types with respect to the variation in linear velocity of the moving links—an important gap considering their impact on mechanical performance, component wear, and energy consumption. This justifies a detailed theoretical study aimed at comparing both design configurations using modern simulation and mathematical modeling methods. Such research can provide valuable insights for designers, engineers, and operators, contributing to improved equipment performance and reduced operational costs. Therefore, the aim of this study is to conduct a comparative theoretical analysis of the two drive systems, pull-type and push-type, used in double-toggle jaw crushers, in order to identify the optimal configuration in terms of linear velocity, kinematic stability, and functional efficiency. To achieve this objective, the study applies a combination of mathematical modeling, numerical simulation, and graphical analysis to a real constructive model (SMD-117) [49], highlighting behavioral differences between the two systems and offering concrete recommendations for the optimal design and operation of jaw crushers.

2. Methodology

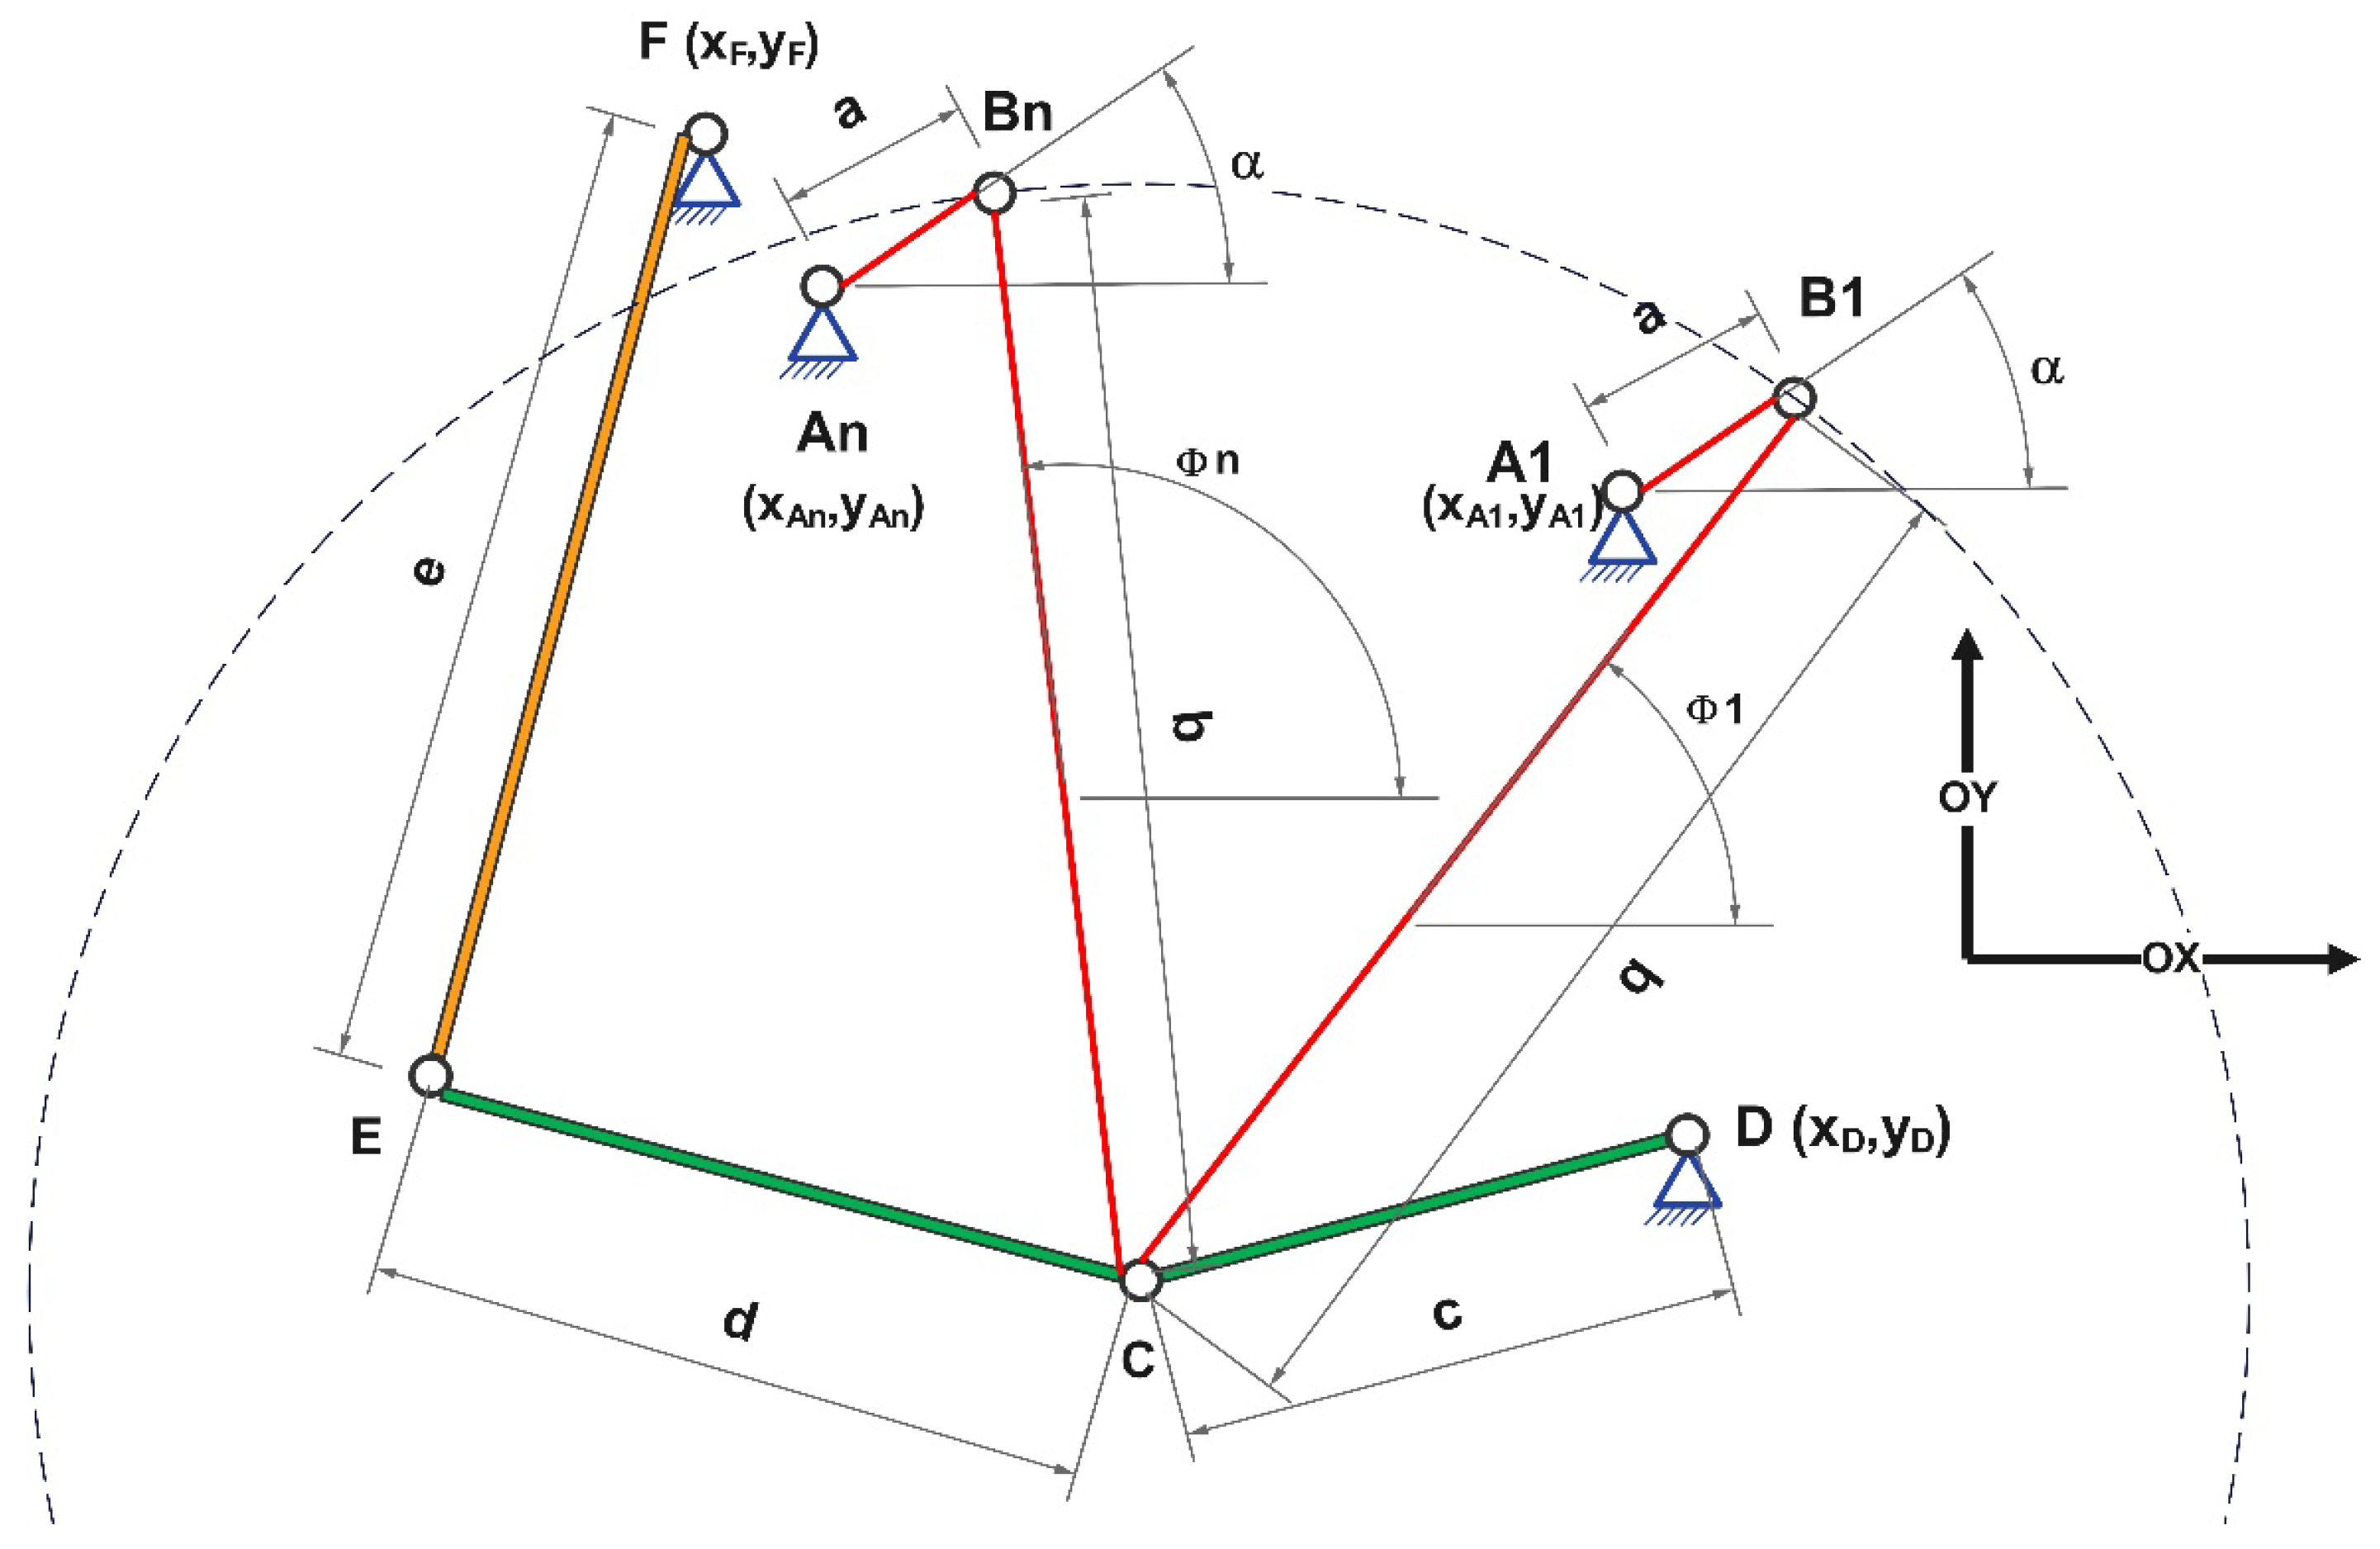
To carry out the theoretical analysis focused on the motion of the movable jaw in both jaw crusher drive systems (Figure 1), the spatial configuration of the crank-slider mechanism was adjusted by varying the angle formed between the connecting rod and the horizontal axis, as illustrated in Figure 2. The analytical procedure followed these steps: (1) Joints F, E, C, and D were initially considered as fixed reference points. (2) A circle was drawn with a center at joint C and a radius equal to the length of element BC (the connecting rod). (3) Joint B was positioned along the perimeter of this circle, with element BC oriented at an angle ϕ relative to the horizontal. The range of variation for this angle is detailed in Chapter 4. (4) Element AB (the crank) was then positioned so that its initial angle α, measured relative to the horizontal axis OX, was set to 0°. This angle α was subsequently varied between 0° and 360° during the simulation. (5) Based on this configuration of fixed and mobile joints, the theoretical analysis presented in this study was conducted.
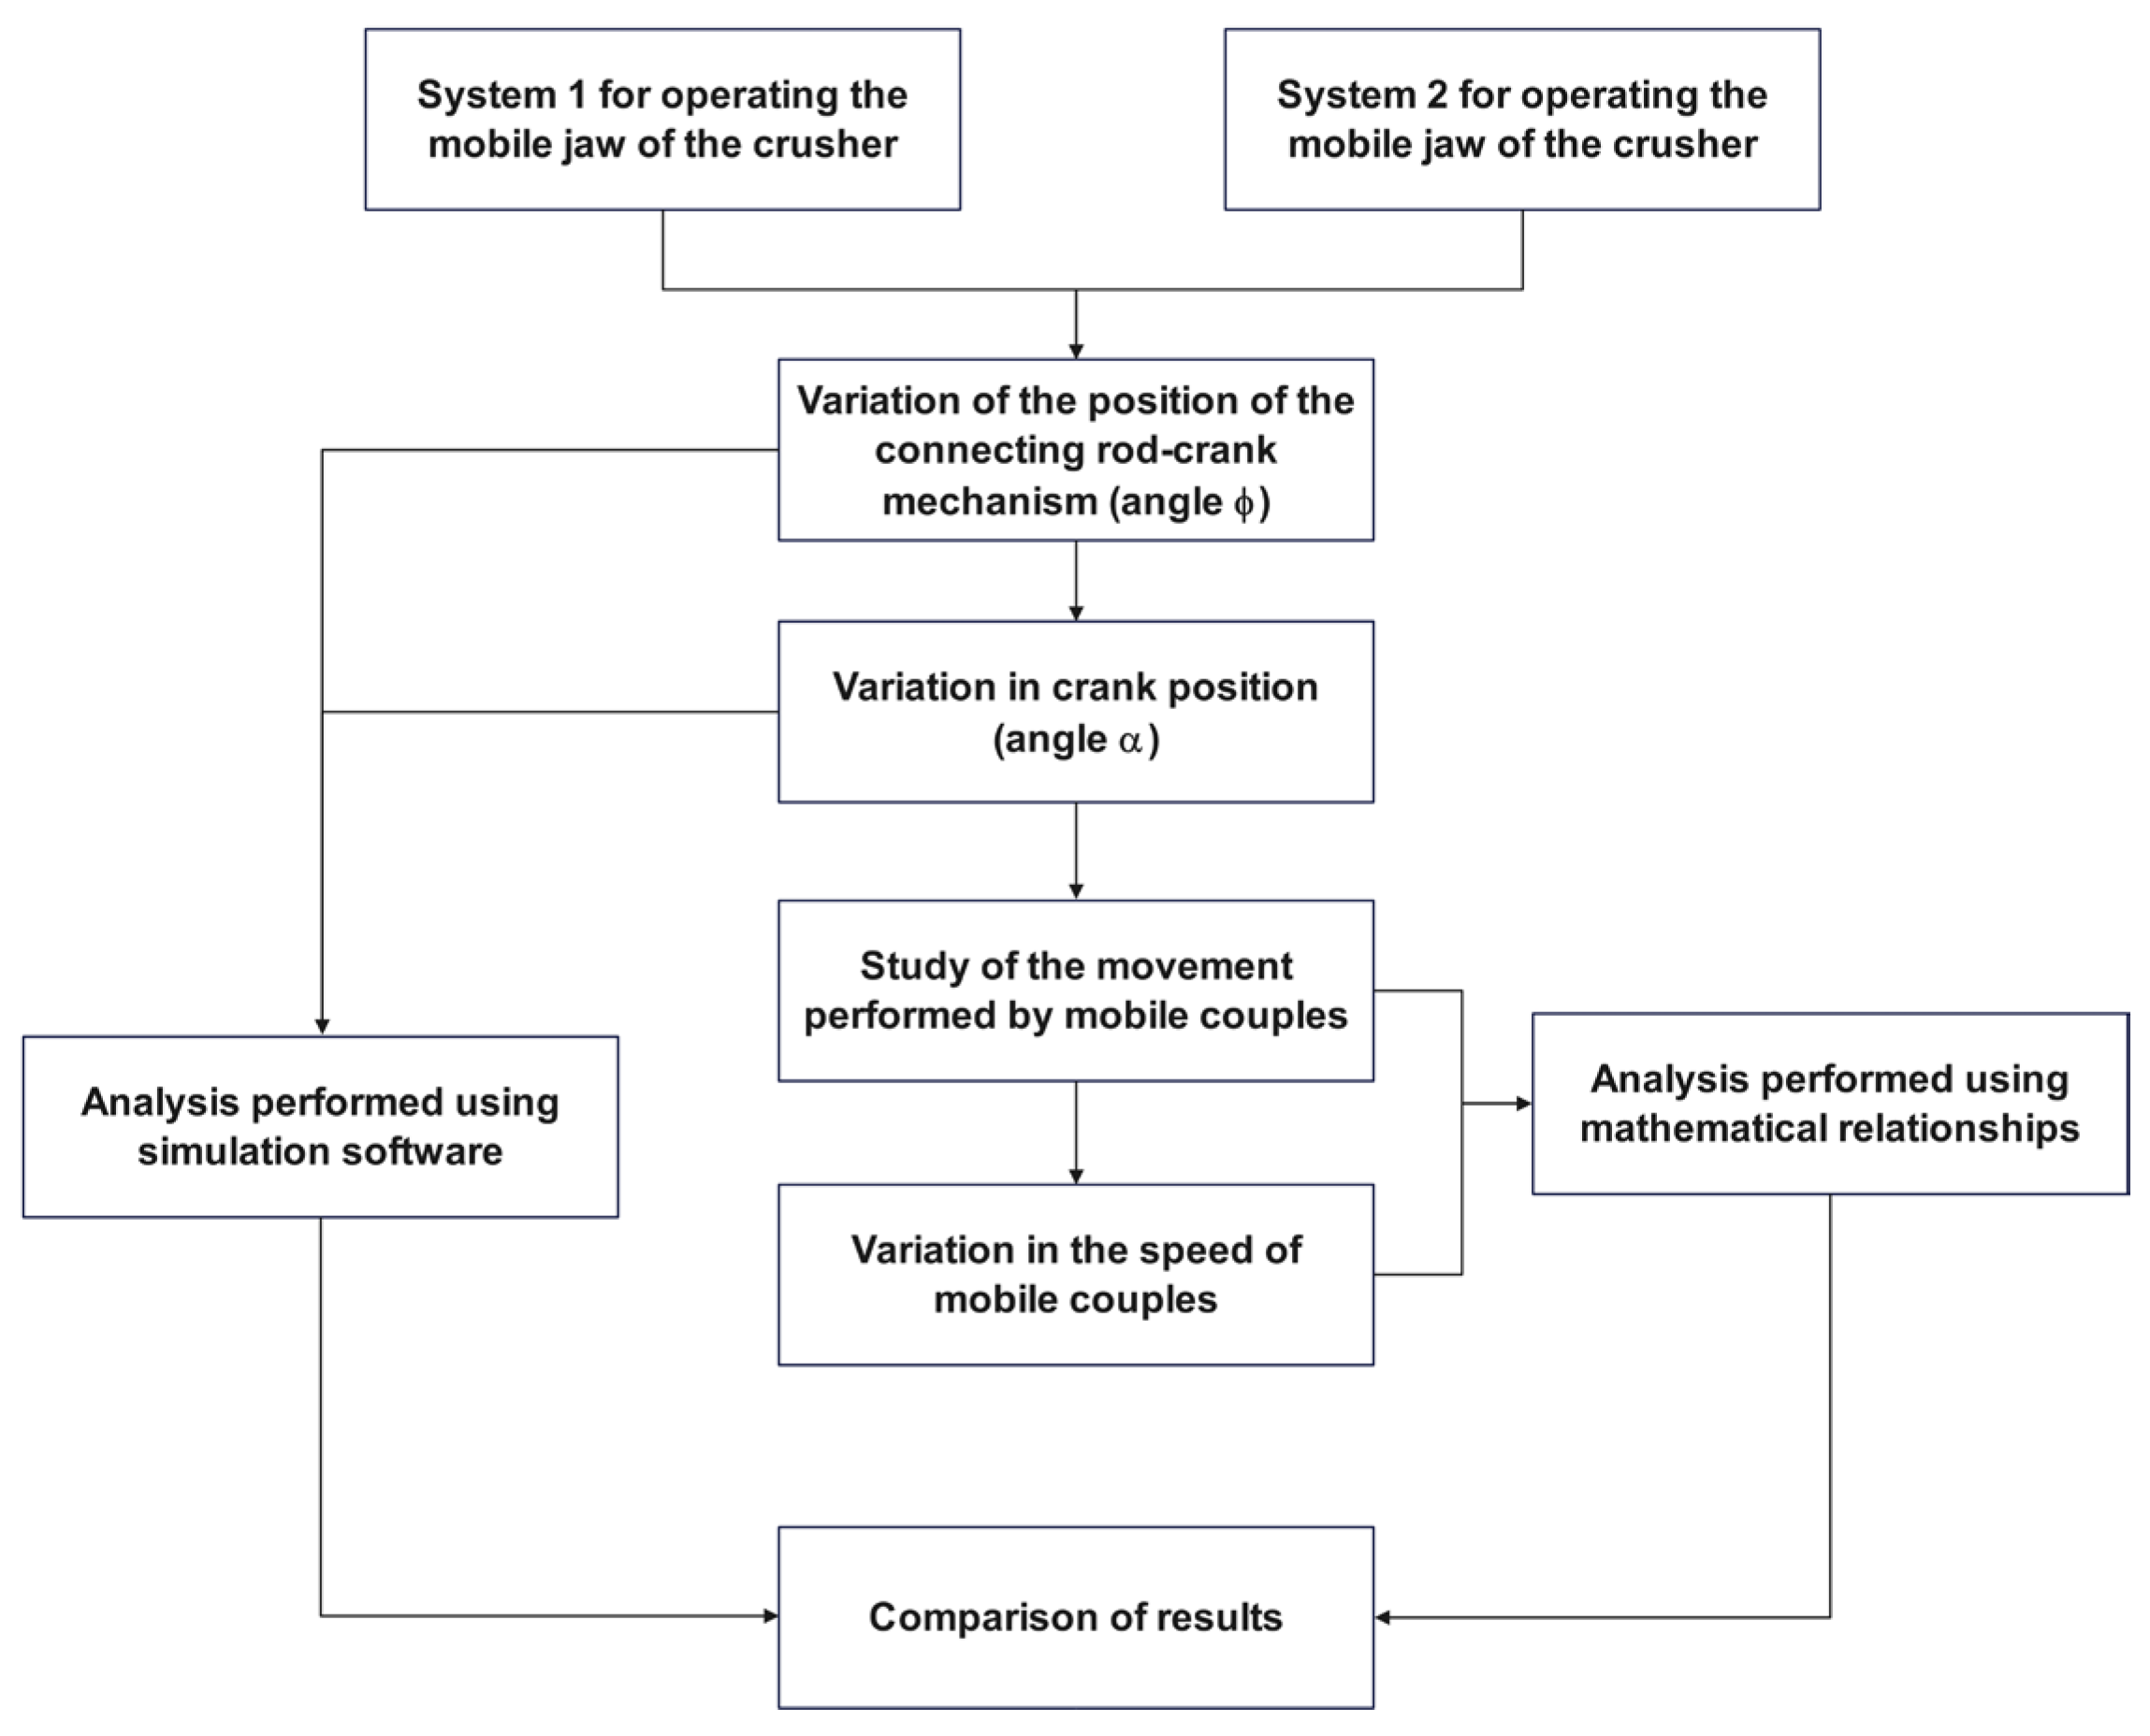
Figure 3 illustrates the methodological framework employed in this study.
Since a laboratory test bench could not be developed for this study to experimentally verify the theoretically obtained values, specialized software tools were utilized instead. As illustrated in Figure 3, the results obtained from both determination methods were compared for the purpose of validating the mathematical relationships applied. To simulate the motion executed by the drive system of the double-toggle jaw crusher, the following software packages were employed, each tailored for analyzing different types of mechanisms: (1) Roberts Animator v. 2.1.0 [77], part of the WATT Mechanism Suite developed by Heron Technologies, is used for planar mechanism analysis and animation; (2) GIM v. 2025.4 [78,79], an educational tool developed by the COMPMECH Research Group at the University of the Basque Country (UPV/EHU), supports the analysis and synthesis of planar mechanisms.

3. Theoretical Considerations

In the specialized literature, a number of computational relationships have been identified for this type of drive mechanism [3,17,49,61,62,63,64]. However, this article adopts the calculation formulas presented in the work referenced as [80], based on the following considerations: (1) the mathematical relationships account for all dimensional components of the mechanism as well as the positioning of fixed joints; (2) they exhibit a generalizable structure that is applicable across various configurations; and (3) they provide a simplified framework for computation.
Regardless of the drive system type applied in the crusher configuration (Figure 1), a set of notations was established to support the analysis: (1) The three fixed joints, A, D, and F, were assigned coordinate labels as follows: Joint A: xA and yA; Joint D: xD and yD; Joint F: xF and yF. (2) The dimensional parameters of the mechanism’s components were defined as follows: Element AB with length a; Element BC with length b; Element CD with length c; Element CE with length d; and Element EF with length e.
Based on the established notations, the following calculation formulas [80] are used to determine the coordinates of the mobile joints:
  • The Equations corresponding to joint B are expressed as follows:
x B = x A + a · c o s   ( α )
y B = y A + a · s i n   ( α )
2.
The calculation relationships corresponding to joint C can be determined using the following Equations:
x C = x D + ( b 2 + c 2 + d 0 2 ) ( a · cos α + x A x D ) 2 d 0 2 + d 1 · ( a · s i n α y A + y D ) 2 d 0 2
y C = y D + d 1 · ( a · c o s α + x A x D ) 2 d 0 2 + ( b 2 + c 2 + d 0 2 ) ( a · sin α + y A y D ) 2 d 0 2
3.
The calculation formulas required to determine the coordinates of joint E are as follows:
x E = x F + ( d 2 + e 2 + d 2 2 ) ( x C x F ) 2 d 2 2 d 3 · ( y C + y F ) 2 d 2 2
y E = y F d 3 · ( x C x F ) 2 d 2 2 + ( d 2 + e 2 + d 2 2 ) ( y C y F ) 2 d 2 2
As can be observed, within calculation Formulas (3)–(6), a series of auxiliary notations were introduced to manage the substantial complexity and dimensionality of the resulting Equations. These notations serve to simplify the mathematical expressions and improve interpretability [80]. The corresponding definitions and formulas for each notation are presented below:
d 0 = ( a · cos α x A + x D ) 2 + ( a · sin α y A + y D ) 2
d 1 = b + c d 0 · b c + d 0 · b + c + d 0 · b + c + d 0
d 2 = ( x C + x F ) 2 + ( y C + y F ) 2
d 3 = d + e d 2 d e + d 2 d + e + d 2 d + e + d 2

4. Results

To conduct the theoretical study, the constructive dimensions of a double-toggle jaw crusher, model SMD-117, were used, whose characteristics are documented in the specialized literature [49]. The dimensional parameters considered in the analysis are detailed below:
  • Component lengths of the jaw crusher’s drive system:
    • Length of element AB: 42 mm;
    • Length of element BC: 2165 mm;
    • Length of element DC: 1099 mm;
    • Length of element CD: 1839 mm;
    • Length of element FE: 2885 mm.
  • Coordinates of the mechanism’s fixed joints:
    • Fixed joint D: xD = 1190 mm, yD = −1800 mm;
    • Fixed joint F: xF = −1625 mm, yF = 1011 mm.
Regarding the coordinates of fixed joint A, as previously mentioned, they will vary due to the multiple positions assumed by the crank-slider mechanism. To identify the position of this joint, the methodology outlined in the previous chapter was applied, following these steps:
  • The mechanism is constructed by respecting the fixed positions of joints D and F.
  • Initially, joint A is positioned at the origin of the coordinate system XOY, with xA = 0 mm and yA = 0 mm.
  • Based on the location of the fixed joints, the mechanism’s elements are then positioned.
  • For the initial crank position (α = 0°), the coordinates of mobile joint C are determined.
  • Considering that the study evaluates two types of drive systems for the movable jaw, two coordinate sets for joint C were obtained:
    • For the crusher where the lower part of the movable jaw is actuated by a pulling motion (Figure 1a), xC1 = 162.76 mm, yC1 = −2190.6 mm;
    • For the crusher where the lower part of the movable jaw is actuated by a pushing motion (Figure 1b), xC2 = 143.85 mm, yC2 = −1463.27 mm.
  • These procedural steps were used to identify the coordinates of joint C, which serve as reference points in the kinematic analysis.
At this stage, all necessary information is available to conduct the mathematical phase of the study and structure it as follows:
  • The fixed joints F, E, C, and D are positioned within the coordinate system;
  • The connecting rod CB is placed at an angle ϕ relative to the horizontal axis;
  • Crank AB is positioned with an initial angle α = 0°. From this configuration, the coordinates of fixed joint A (xA and yA) are determined mathematically using the following calculation formula:
    x A = a + x C + b · c o s ( ϕ )
    y B = y C + b · s i n ( ϕ )
Within this formula, the variables xC and yC are replaced according to the specific type of mechanism under consideration: for the configuration shown in Figure 1a (pull-type drive system), the values of xC1 and yC1 are used; for the configuration illustrated in Figure 1b (push-type drive system), the variables are substituted with xC2 and yC2.
d.
Both the coordinates of fixed joints A, D, and F, as well as the dimensional values of the mechanism’s elements (a, b, c, d and e), will be substituted into calculation Equations (1)–(10).
e.
As previously stated, the mathematical computations were performed using Mathcad 15, a software platform that is capable of handling complex mathematical operations involving numerous parameters and extensive value ranges for each parameter. The following working parameters were varied during the study:
i. 
The angle described by the crank, denoted as α, represents the rotation of the crank with respect to the horizontal axis. This angle was varied within the range of 0° to 360°, using an increment of 1.125°, resulting in a total of 321 discrete values generated by the corresponding calculation formulas.
ii. 
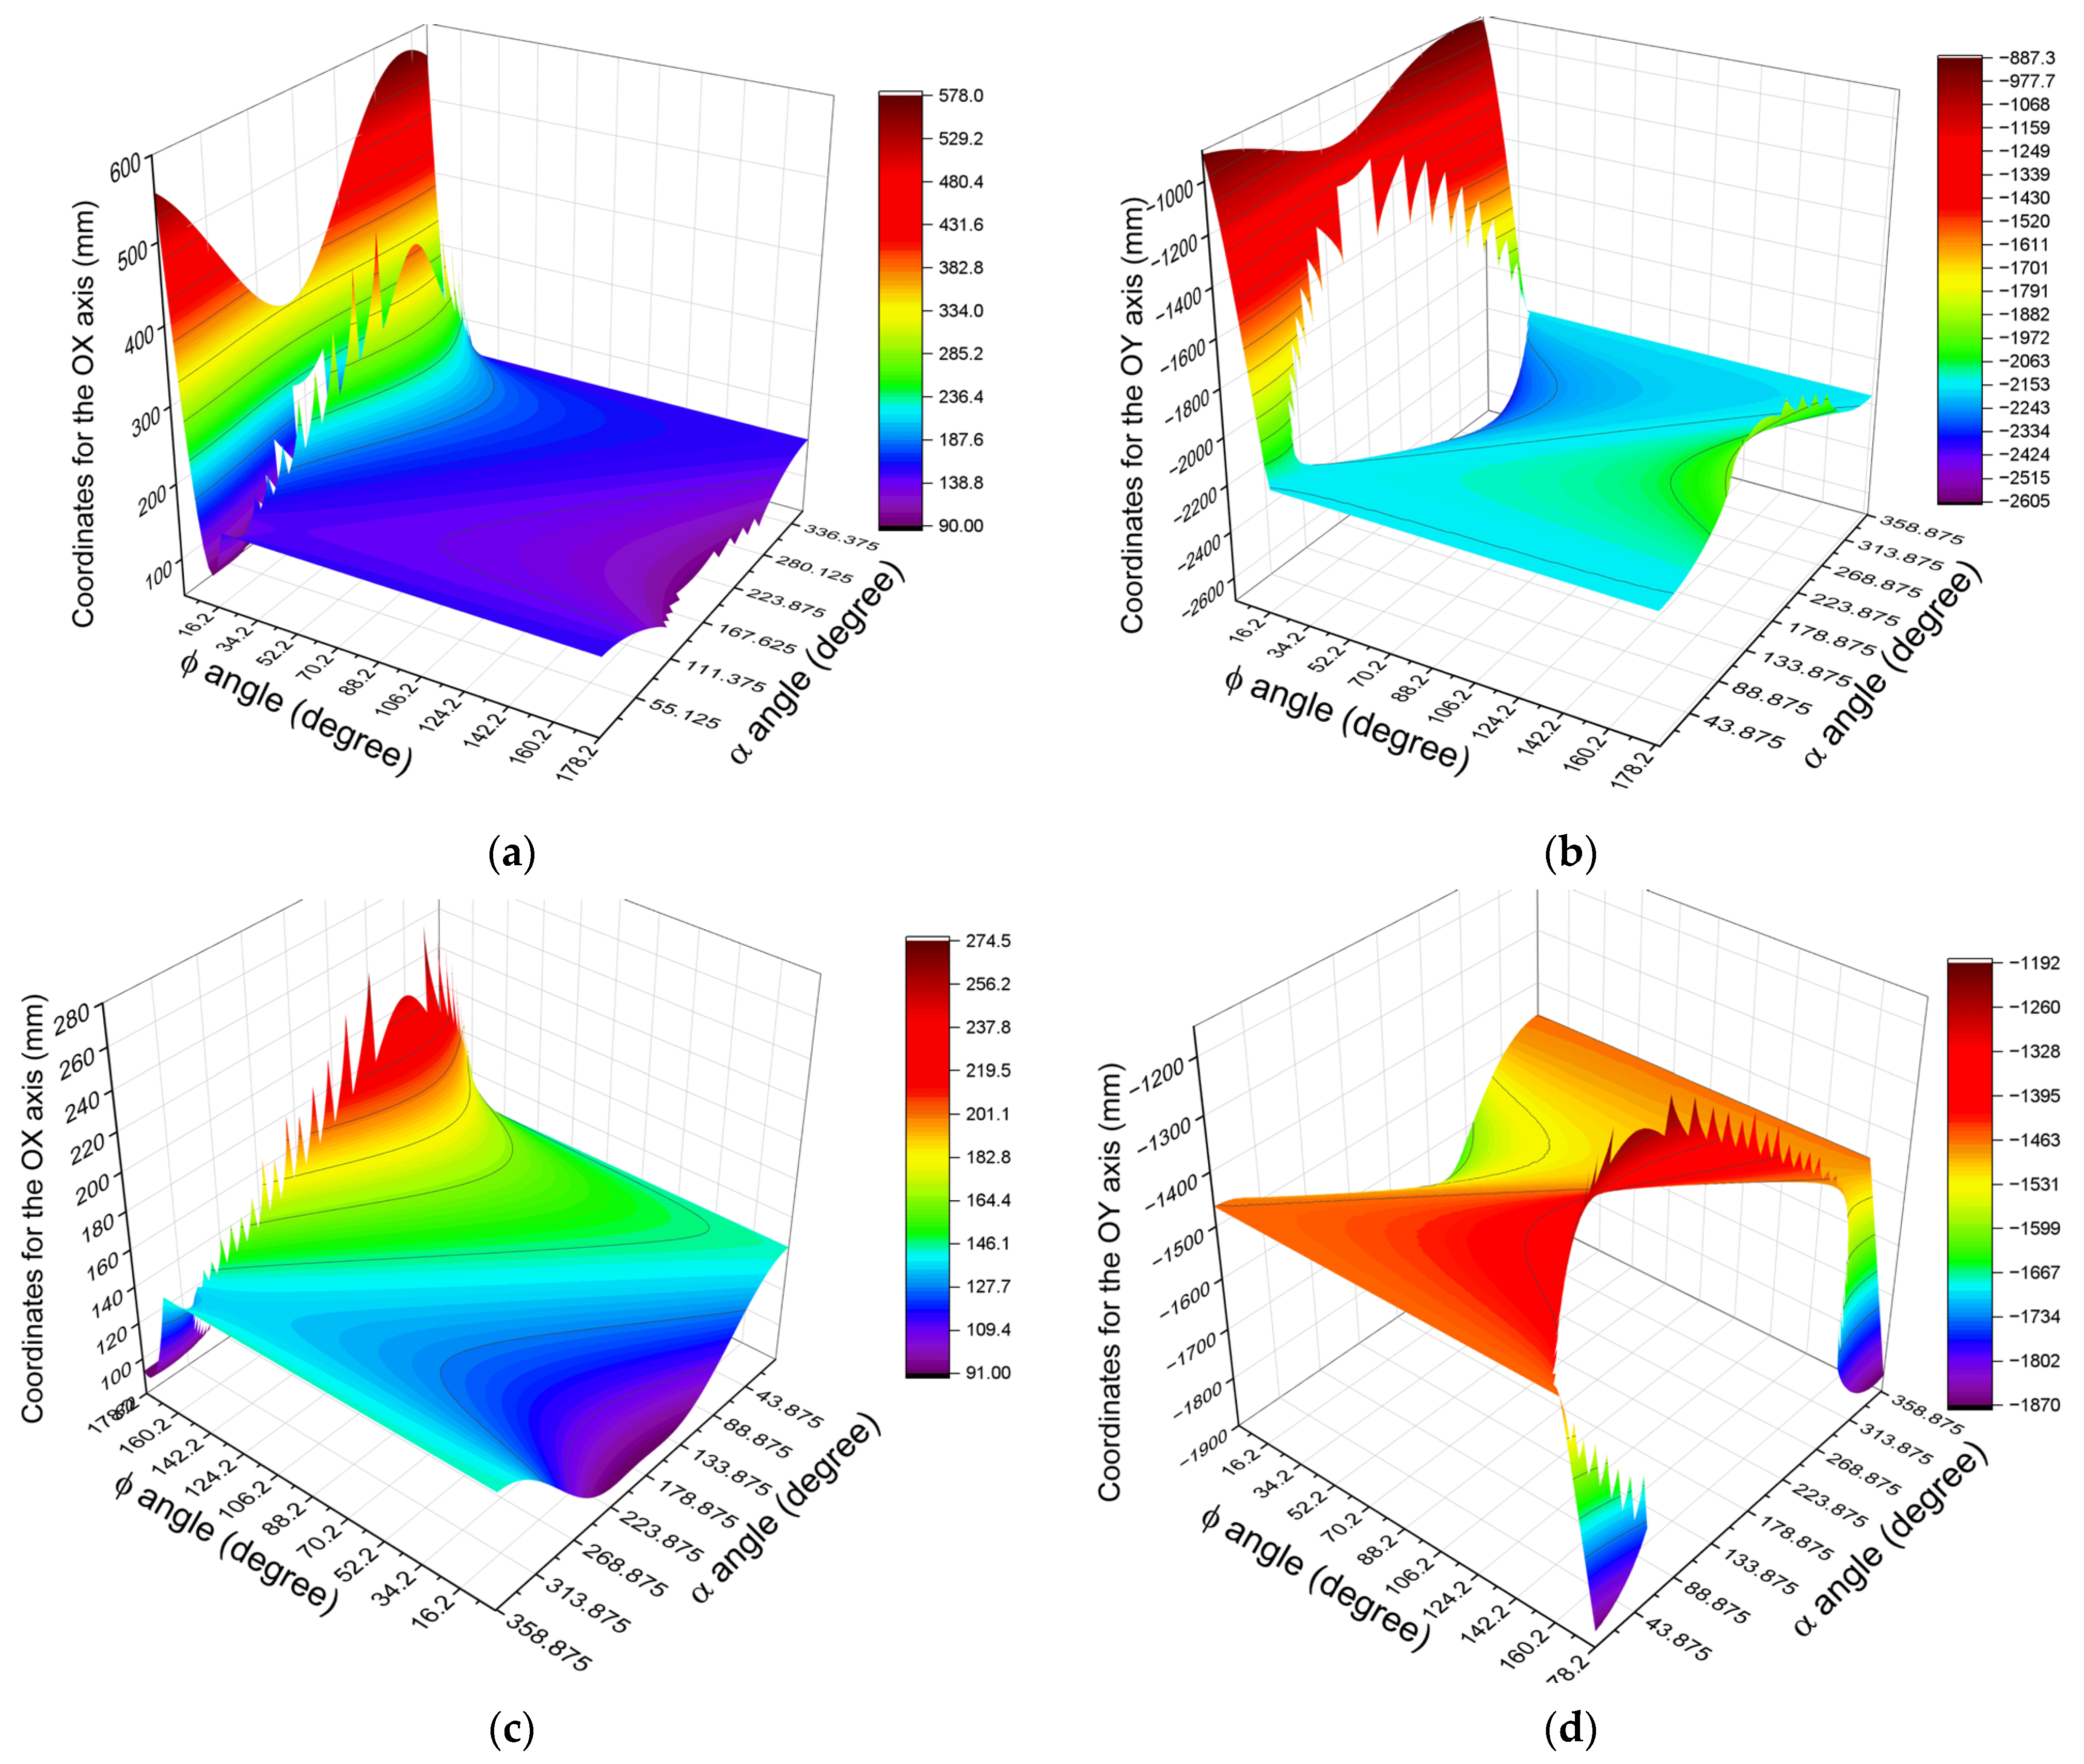
The angle described by the connecting rod relative to the horizontal axis, denoted as ϕ, was selected based on the graphical representation presented in Figure 4. This figure illustrates the trajectory traced by fixed joint C as the angle ϕ varies between 0° and 180°. This analysis was conducted for both drive system configurations.
The key outcome of interest is the mechanism’s ability to execute movements under the imposed constraints, specifically, within the defined range of variation for angle ϕ. Analysis of the graphical representations reveals that, at the extreme ends of the angle ϕ range, certain values emerge that represent computational errors, indicating that the mechanism cannot operate reliably under those conditions.
The following value intervals correspond to the coordinate ranges associated with each mechanism type and reflect the functional operating zones of the mechanism:
  • Drive system corresponding to Figure 1a:
    • Angle ϕ varies within the interval of 34.2° to 171° for the coordinates along the OX axis.
    • For the OY axis, the valid range of angle ϕ is also 34.2° to 171°.
  • Drive system corresponding to Figure 1b:
    • Angle ϕ varies within the interval of 0° to 133° for coordinates along the OX axis.
    • For the OY axis, the angle ϕ varies between 0° and 135°.
Considering the aspects presented earlier, it was decided that the angle ϕ should vary within the range of 40° to 130° (an angle to be adopted for both drive systems), with a step size of 0.5°. This results in a total of 181 angle positions.
Regarding the values corresponding to the angles, the following observations can be made:
  • The step size for angle α is 1.125°. This value was chosen arbitrarily; there is no mathematical or logical basis for this choice. It is entirely up to the person conducting the study and depends on how fine or coarse they wish the mathematical analysis to be.
  • Similarly, the step size used for varying angle ϕ was also selected arbitrarily, just like in the case of angle α.
Following the calculations, and respecting the previously defined variation intervals, the coordinates of the two moving joints were obtained. These values were then used to determine the variation in the linear velocity, using the classical method based on finite differences.
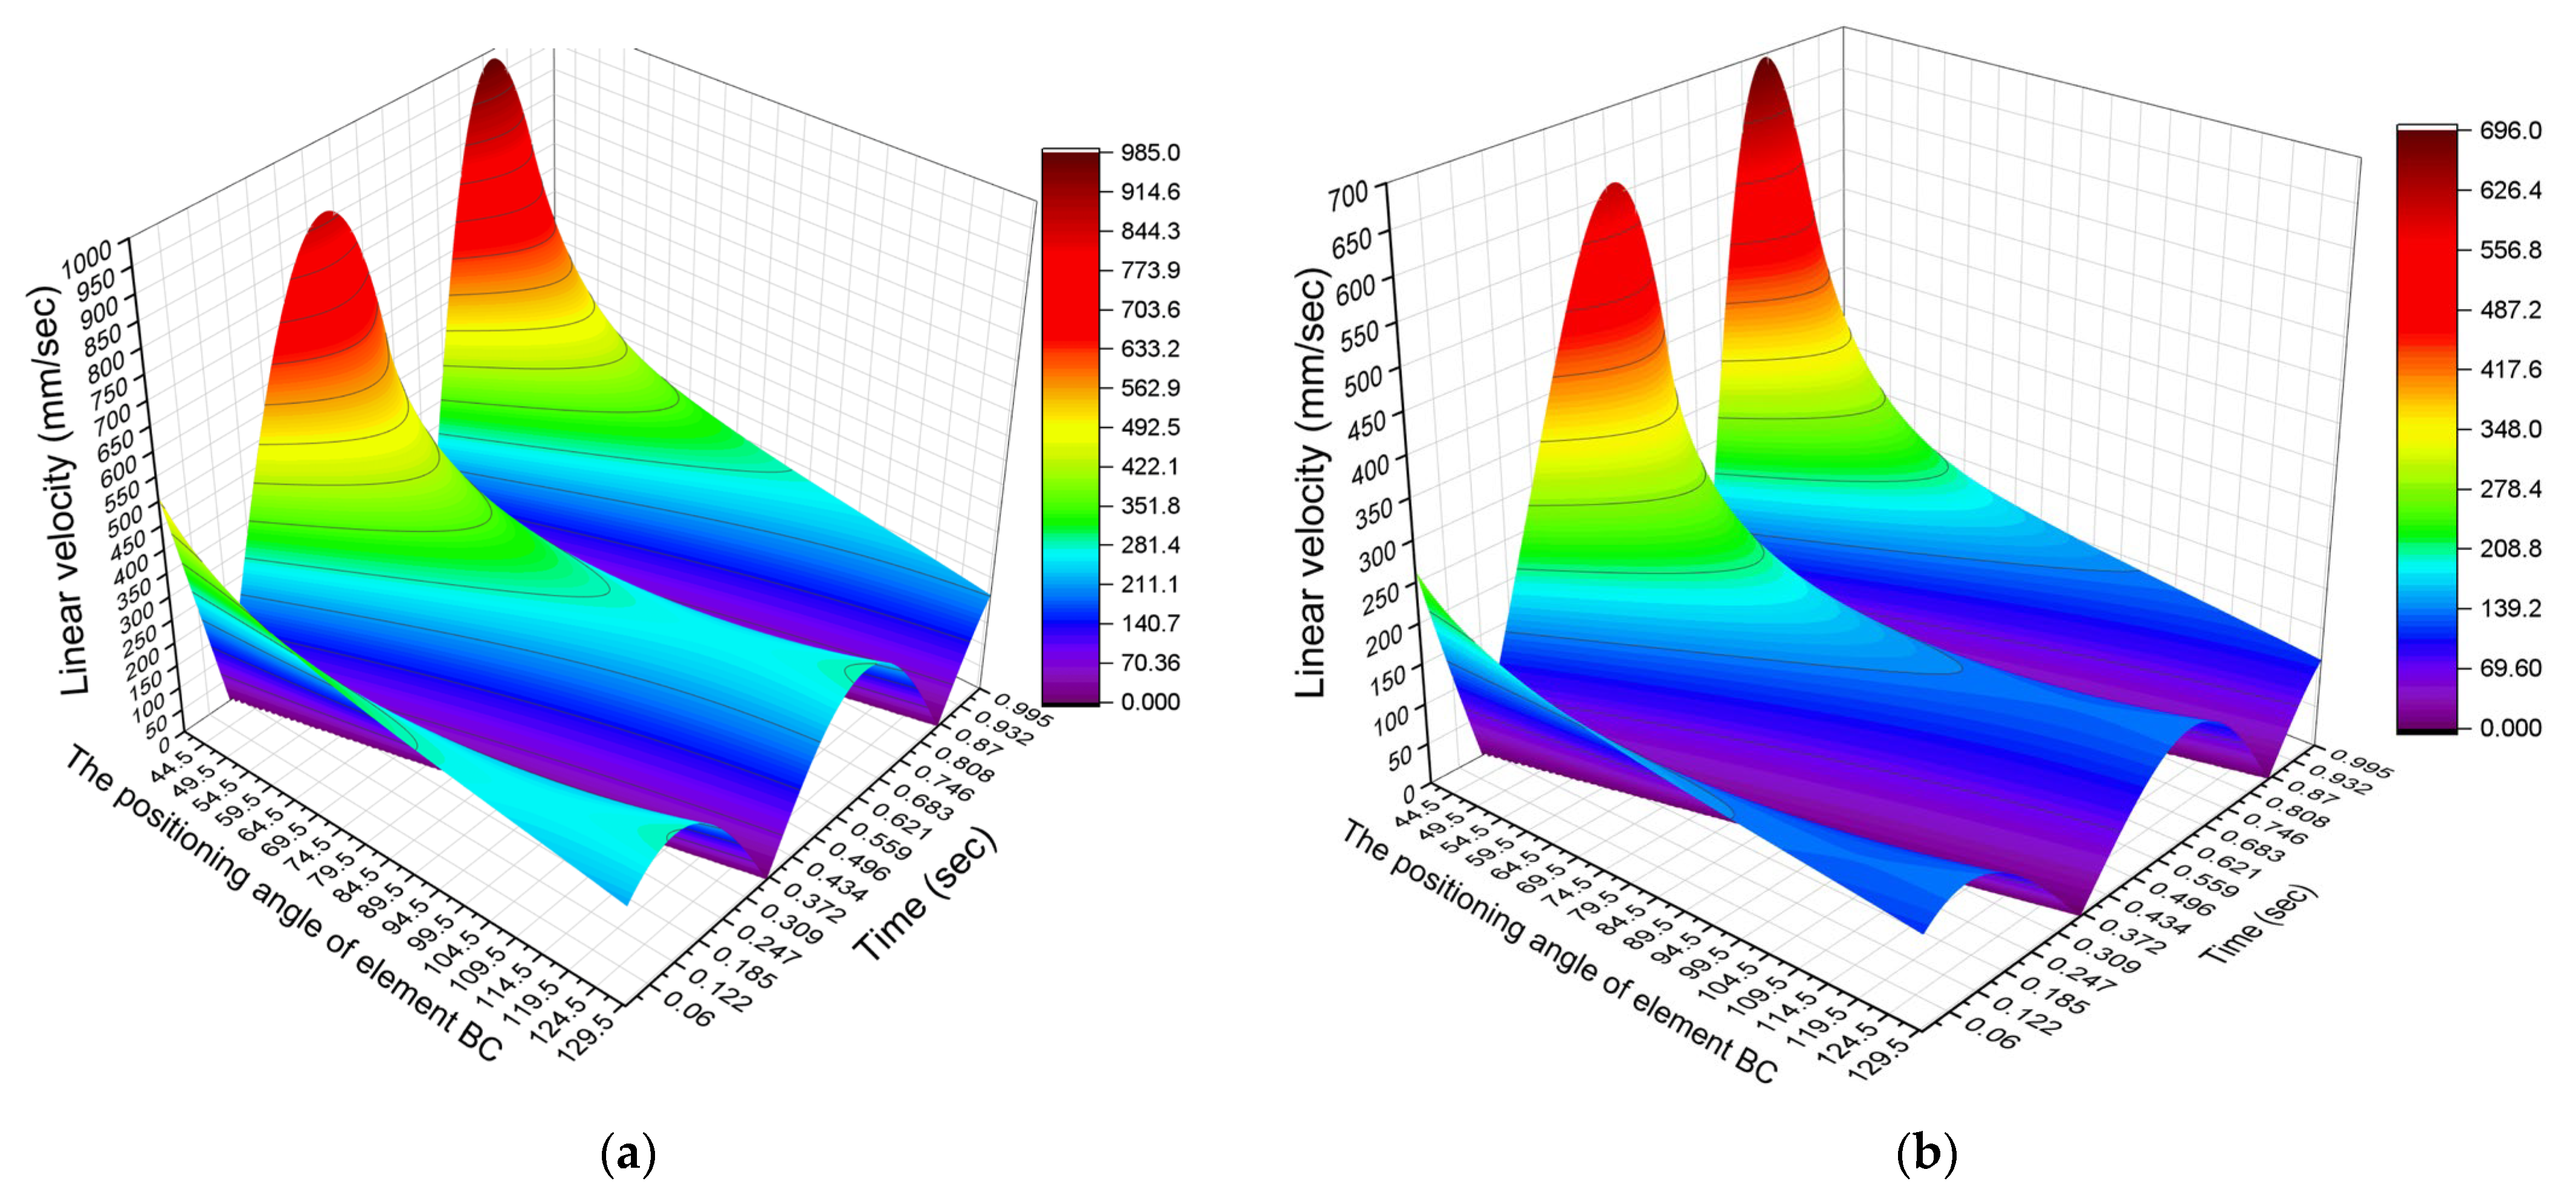
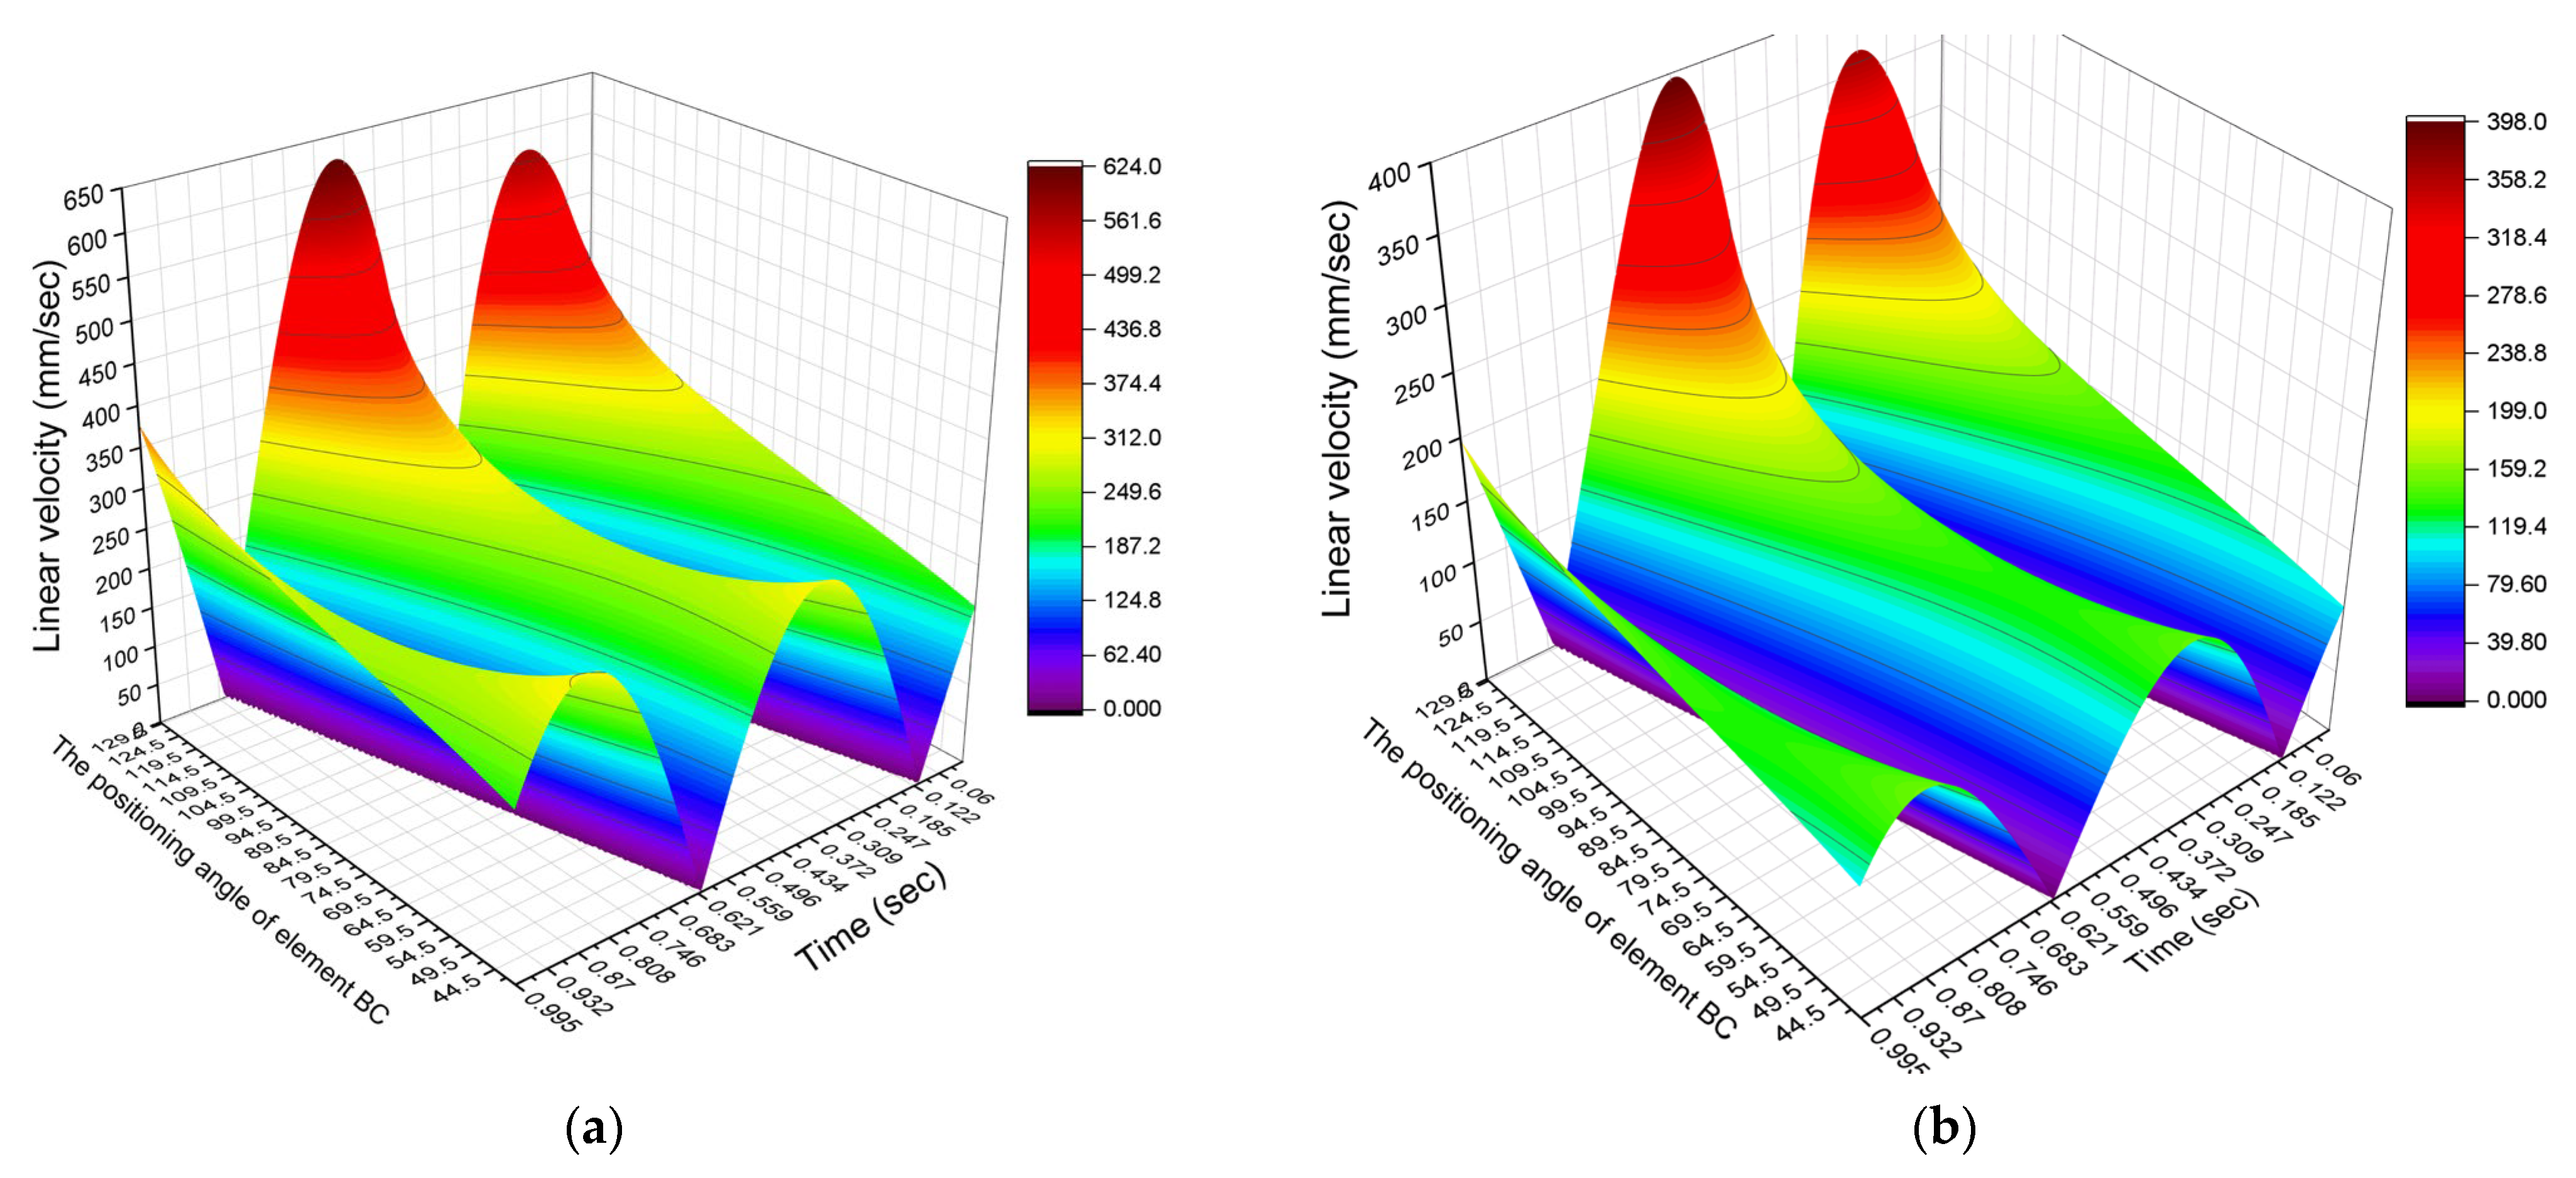
Figure 5 and Figure 6 illustrate these velocity variations. For the graphical representation, only one of the two moving joints was considered, across all studied positions, resulting in a total dataset of 57,920 values.
By analyzing the graphical representations in Figure 5 and Figure 6, the following conclusions can be drawn:
-
For Figure 5a, the linear velocity varies between 0.01 mm/sand 983.241 mm/s;
-
For Figure 5b, the linear velocity varies between 0.0004 mm/s and 695.974 mm/s;
-
For Figure 6a, the linear velocity varies between 0.005 mm/s and 622.66 mm/s;
-
For Figure 6b, the linear velocity varies between 0.002 mm/sand 396.52 mm/s.
Regardless of the specific representation analyzed, the following general observations apply:
-
The velocity variation follows a sinusoidal pattern.
-
The maximum values of the studied parameter are observed at moving joint C. For moving joint E, a decrease in linear velocity is observed. This decrease is consistent across both drive systems and amounts to approximately 64%.
The variation in the studied parameter differs significantly between the two drive systems, as follows:
-
For the initial value of angle ϕ = 40°, the highest linear velocity values are obtained for both moving joints C and E. As the value of angle ϕ increases, the linear velocity decreases, reaching a minimum peak of 264.789 mm/s for joint C and 132.8 mm/s for joint E. These minimum values occur within the angle range ϕ = 105–111°. Beyond this interval, the linear velocity values begin to increase again. This pattern of variation is characteristic of the first drive system.
-
In contrast, for the second drive system of the crusher, the variation in linear velocity is inverted compared to the first system. Specifically, the maximum linear velocity values are obtained at ϕ = 130°, and they decrease to a minimum peak of 264.801 mm/sec (for joint C) and 134.79 mm/s (for joint E). These minimum values are observed within the angle range ϕ = 64.5–69.5°. As with the first system, the parameter values begin to increase again after this interval.
Figure 5 and Figure 6 highlight the variation in linear velocity for joints C and E in the two drive systems. It can be observed that the pull type system (Figure 5) generates higher peak velocities, particularly for joint C, which implies increased mechanical stress. This aspect is essential in the design process, as it indicates the need for stronger materials or damping solutions to reduce wear.
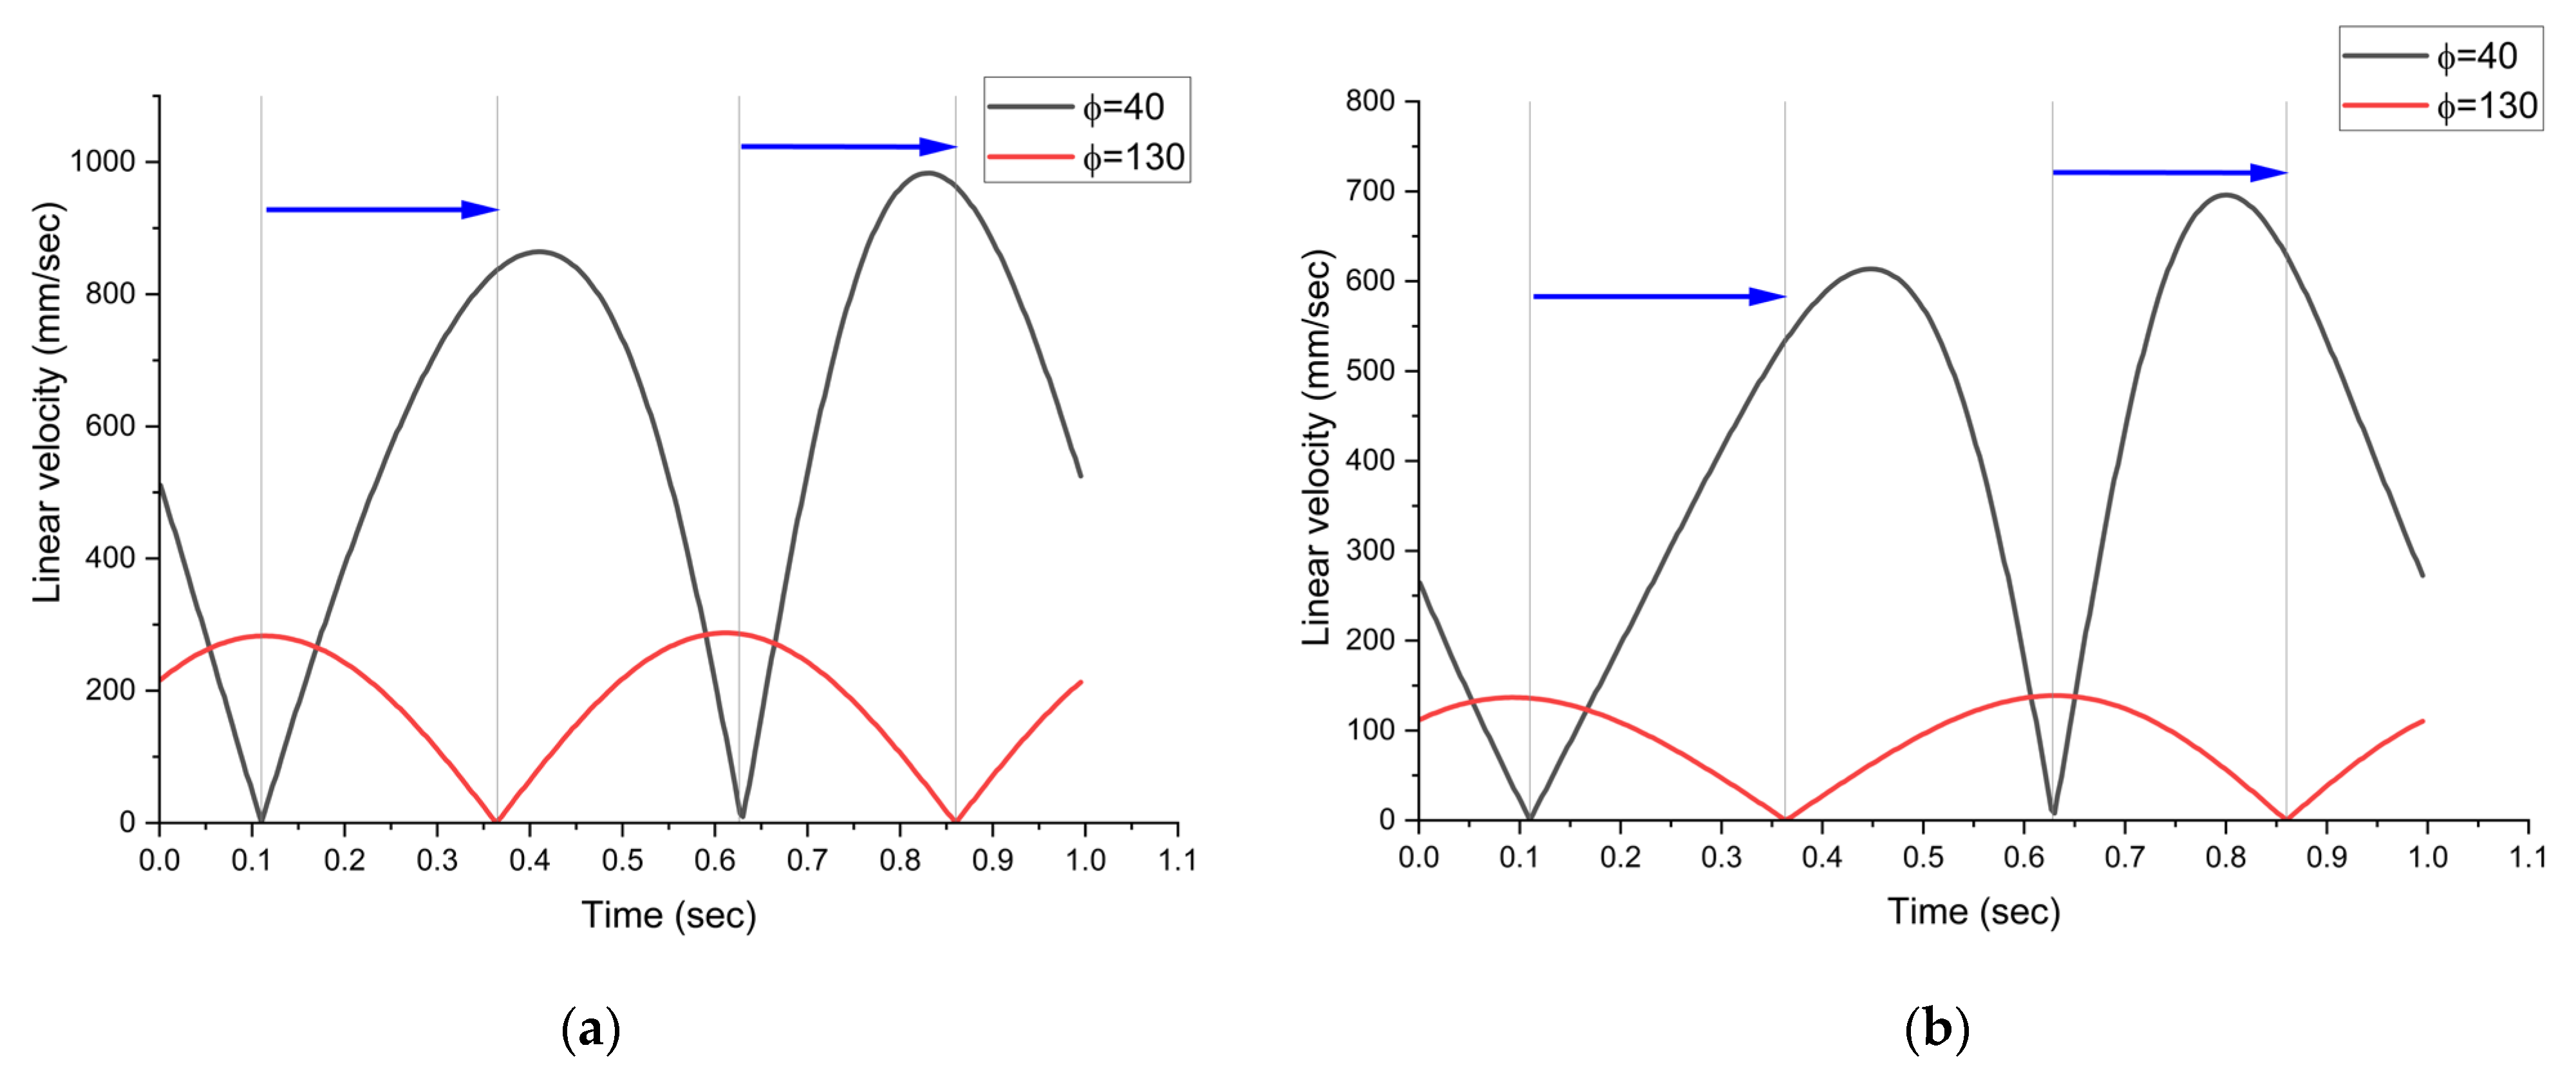
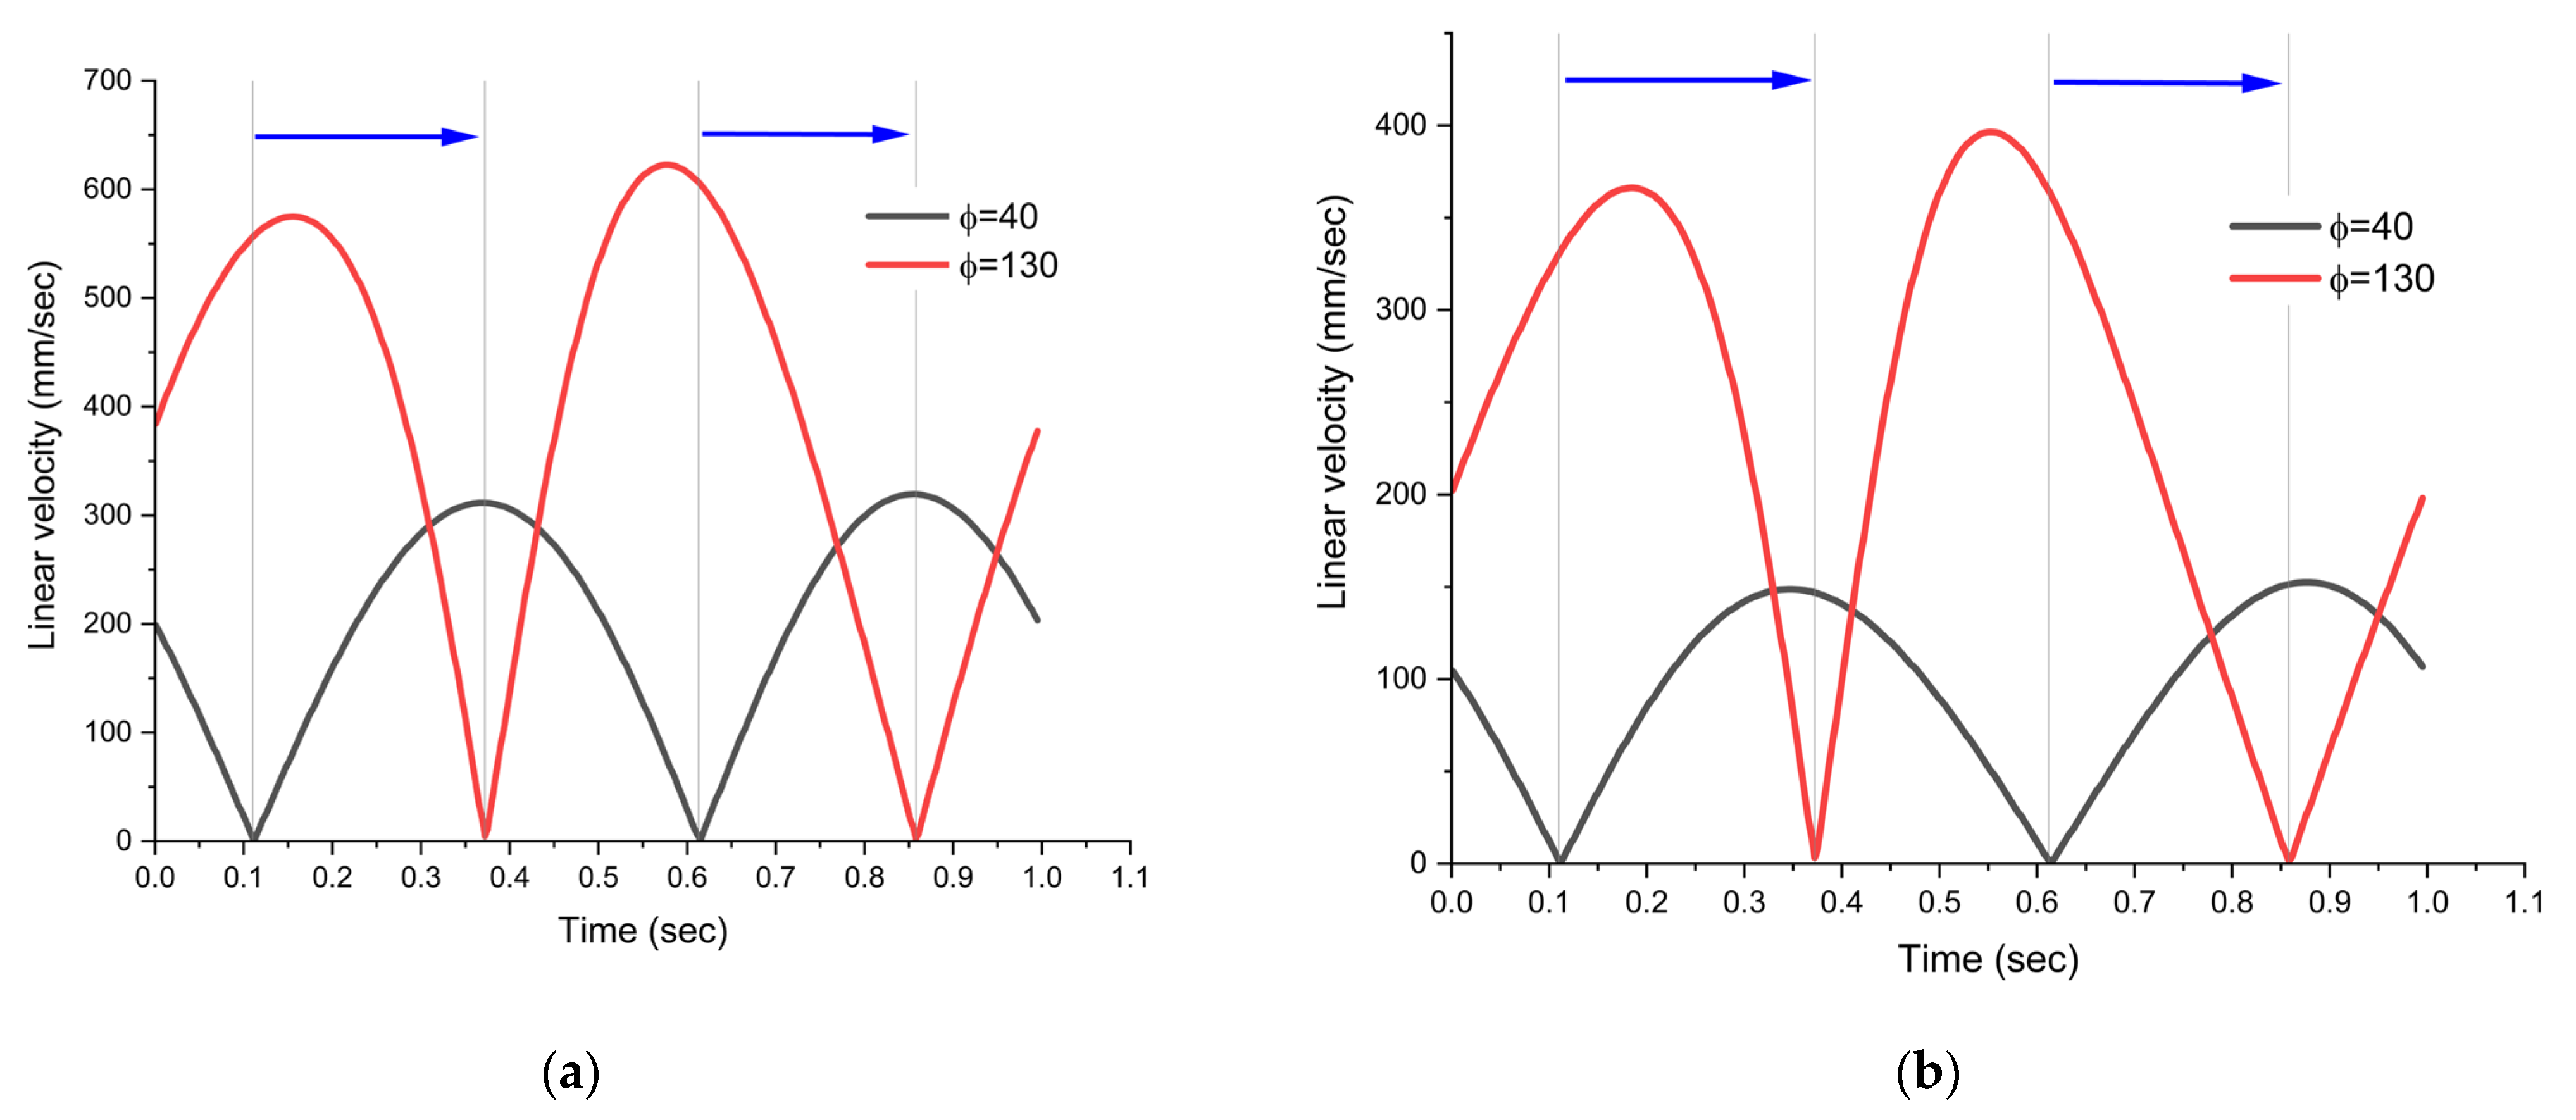
Due to the sinusoidal variation in the studied parameter, it can be observed that for both drive systems, the minimum values, caused by the change in the direction of motion of the observed joint, occur at different time instances, as follows:
-
For the drive system presented in Figure 1a;
-
For the drive system presented in Figure 1b.
From the analysis of the graphical representations in Figure 7 and Figure 8, it can be observed that, regardless of the drive system, the change in the direction of motion of the two analyzed joints occurs at approximately the same time interval. The major difference between the two drive systems lies in the magnitude of the displacement velocity of the two joints, specifically:
-
For the drive system corresponding to Figure 1a, the linear velocity of the two joints decreases as the value of angle ϕ increases.
-
For the drive system corresponding to Figure 1b, the variation in the linear velocity is inversely proportional to the variation in angle ϕ.
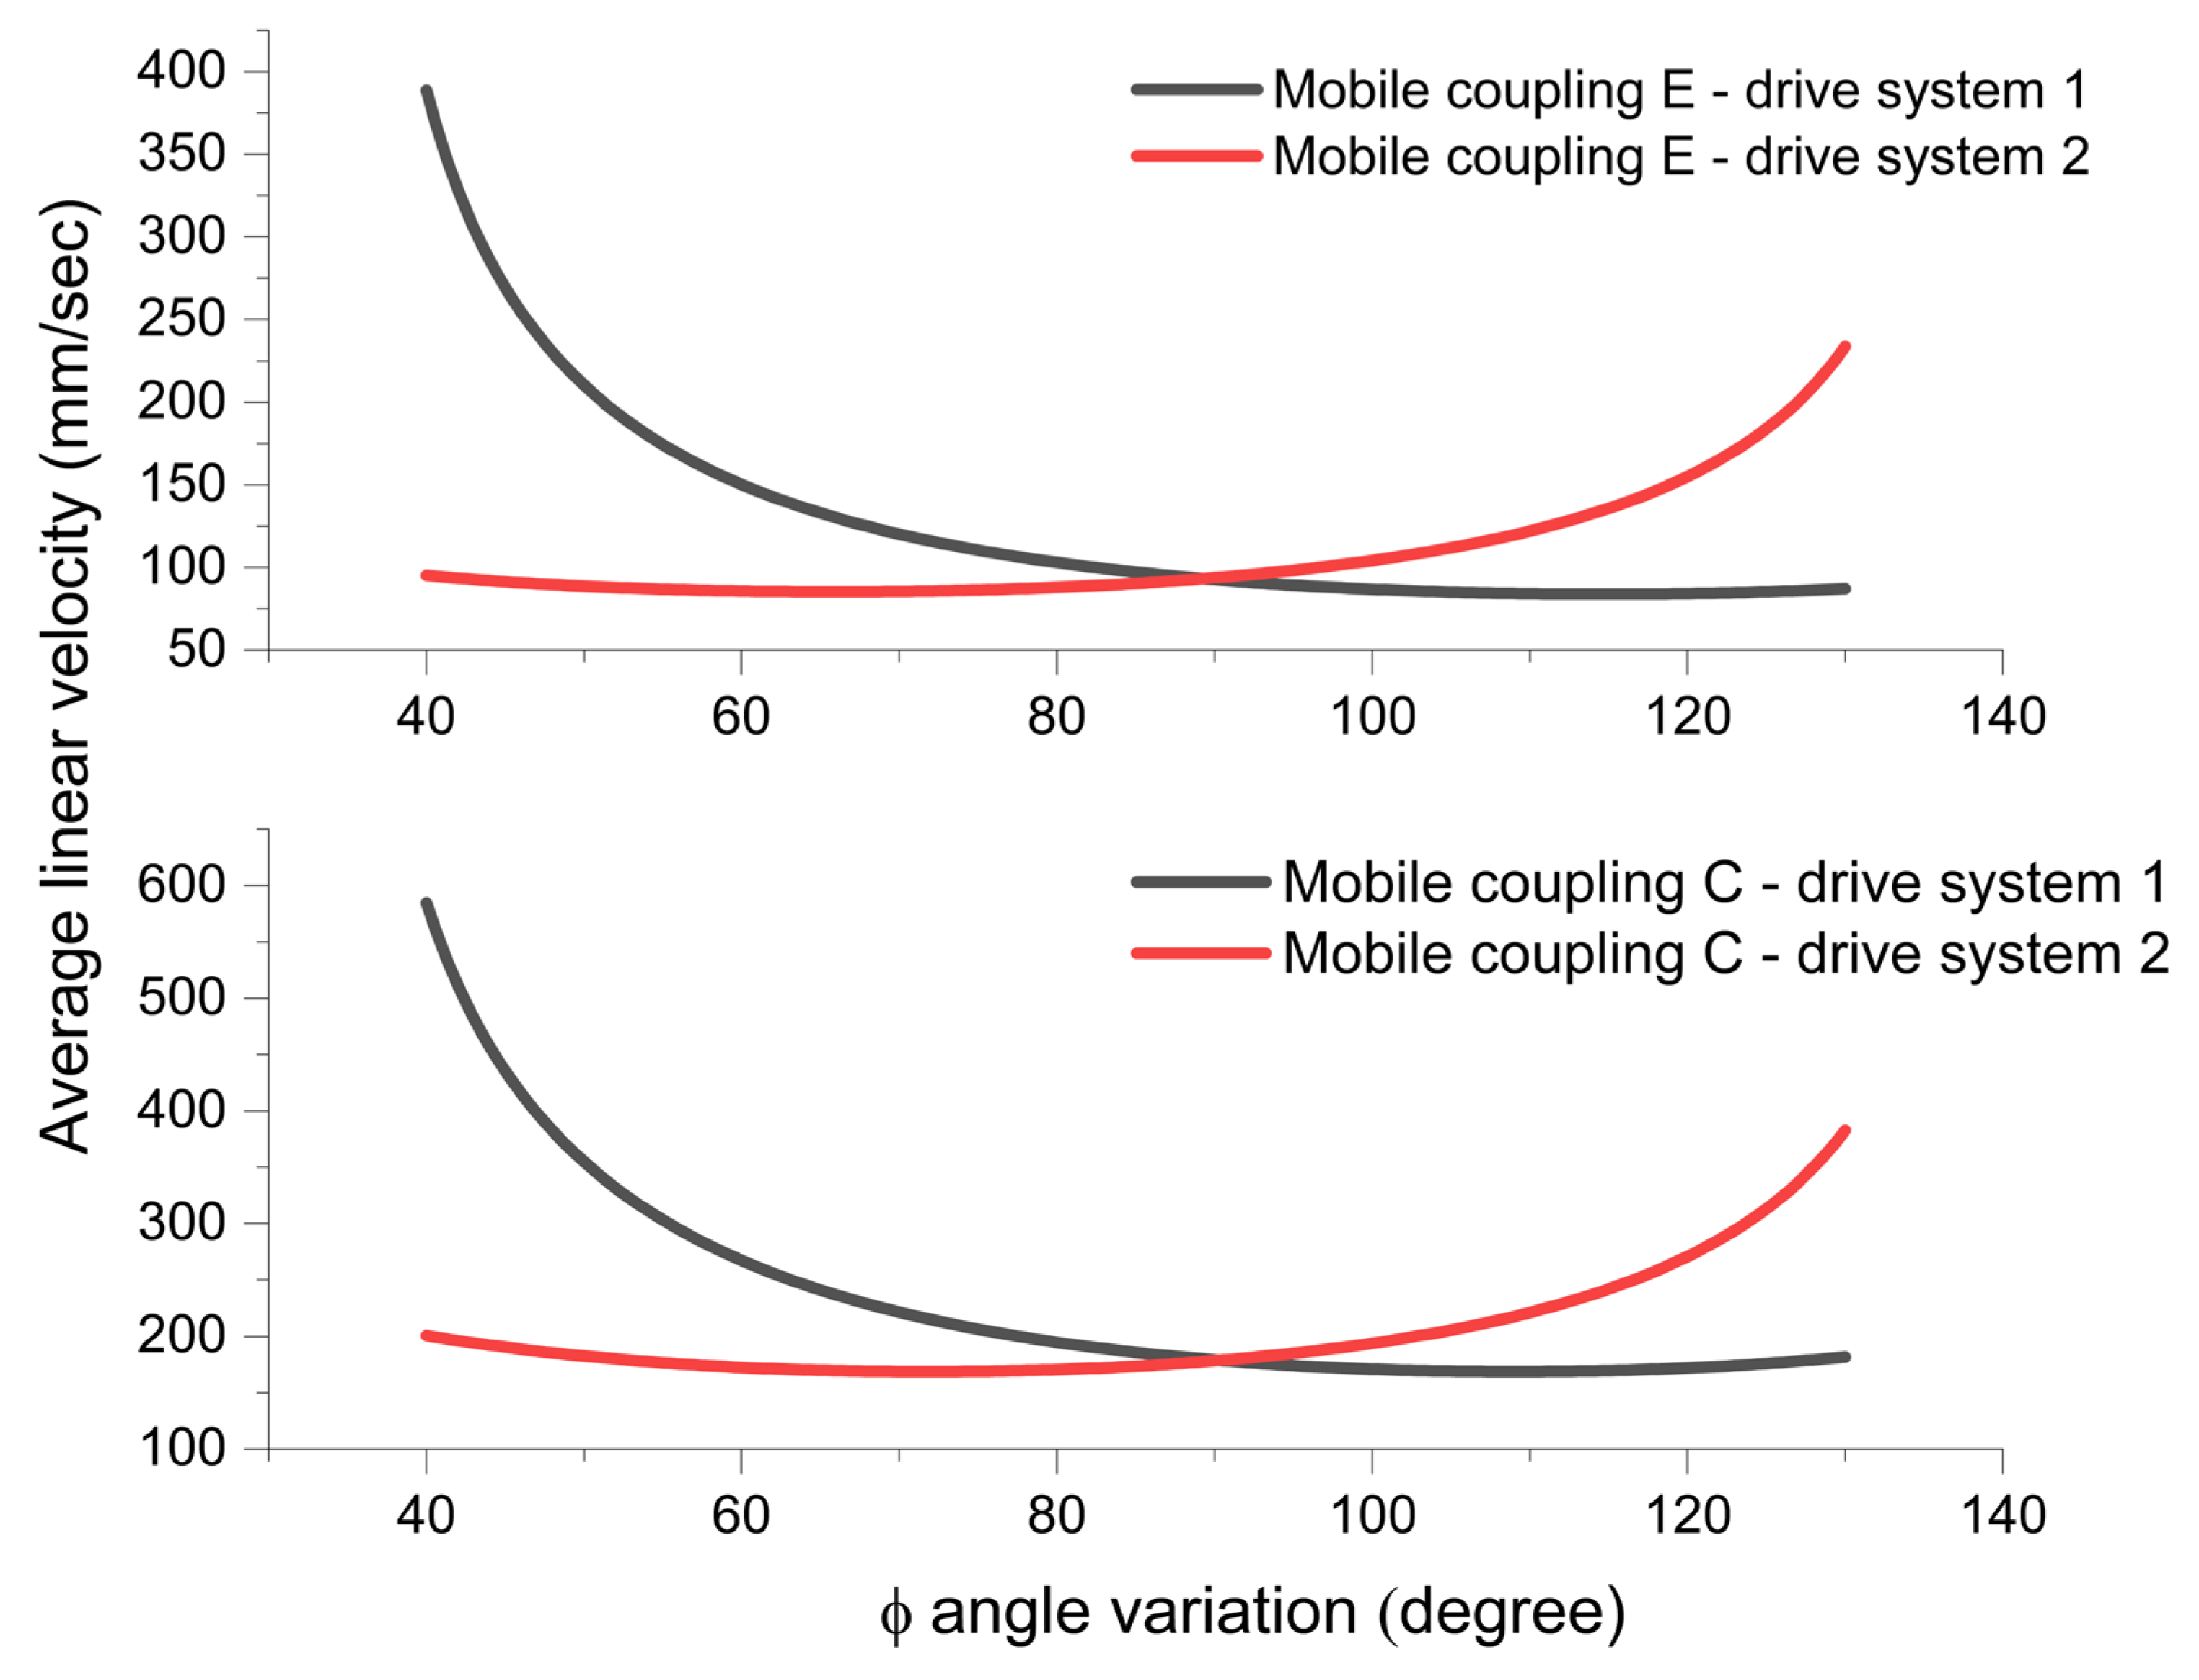
For each value of angle ϕ, Figure 9 presents a representation of the average velocity values obtained from the motion generated by the crank, corresponding to the variation in angle α. These graphical representations also highlight the significant differences between the two types of drive systems. For both moving joint C and moving joint E, the variations in average linear velocity are opposite, despite the same variation in angle ϕ being maintained.
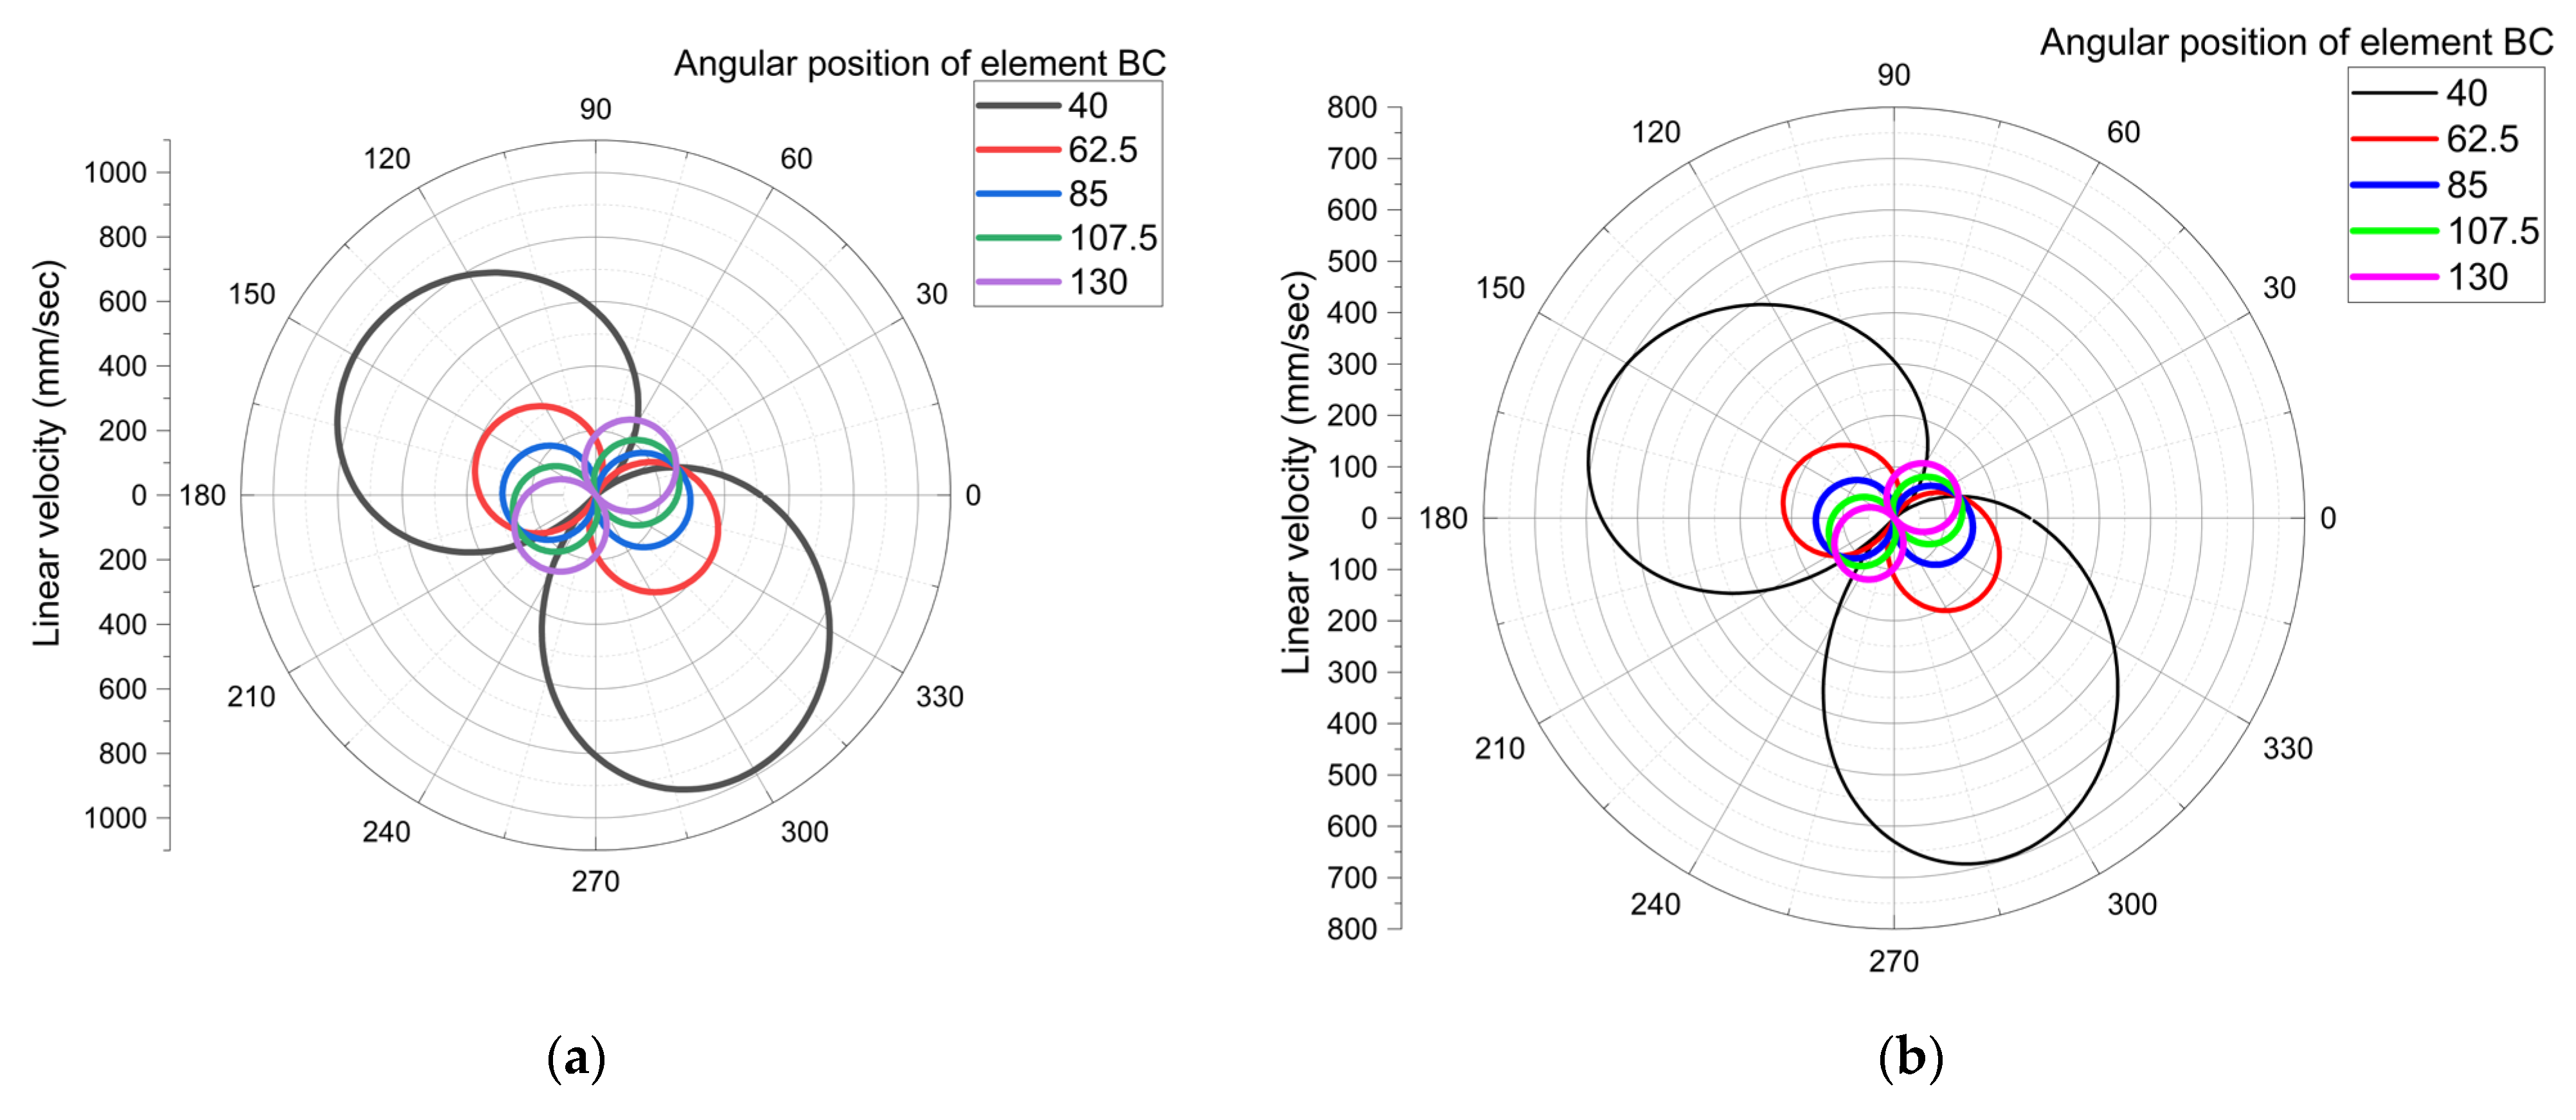
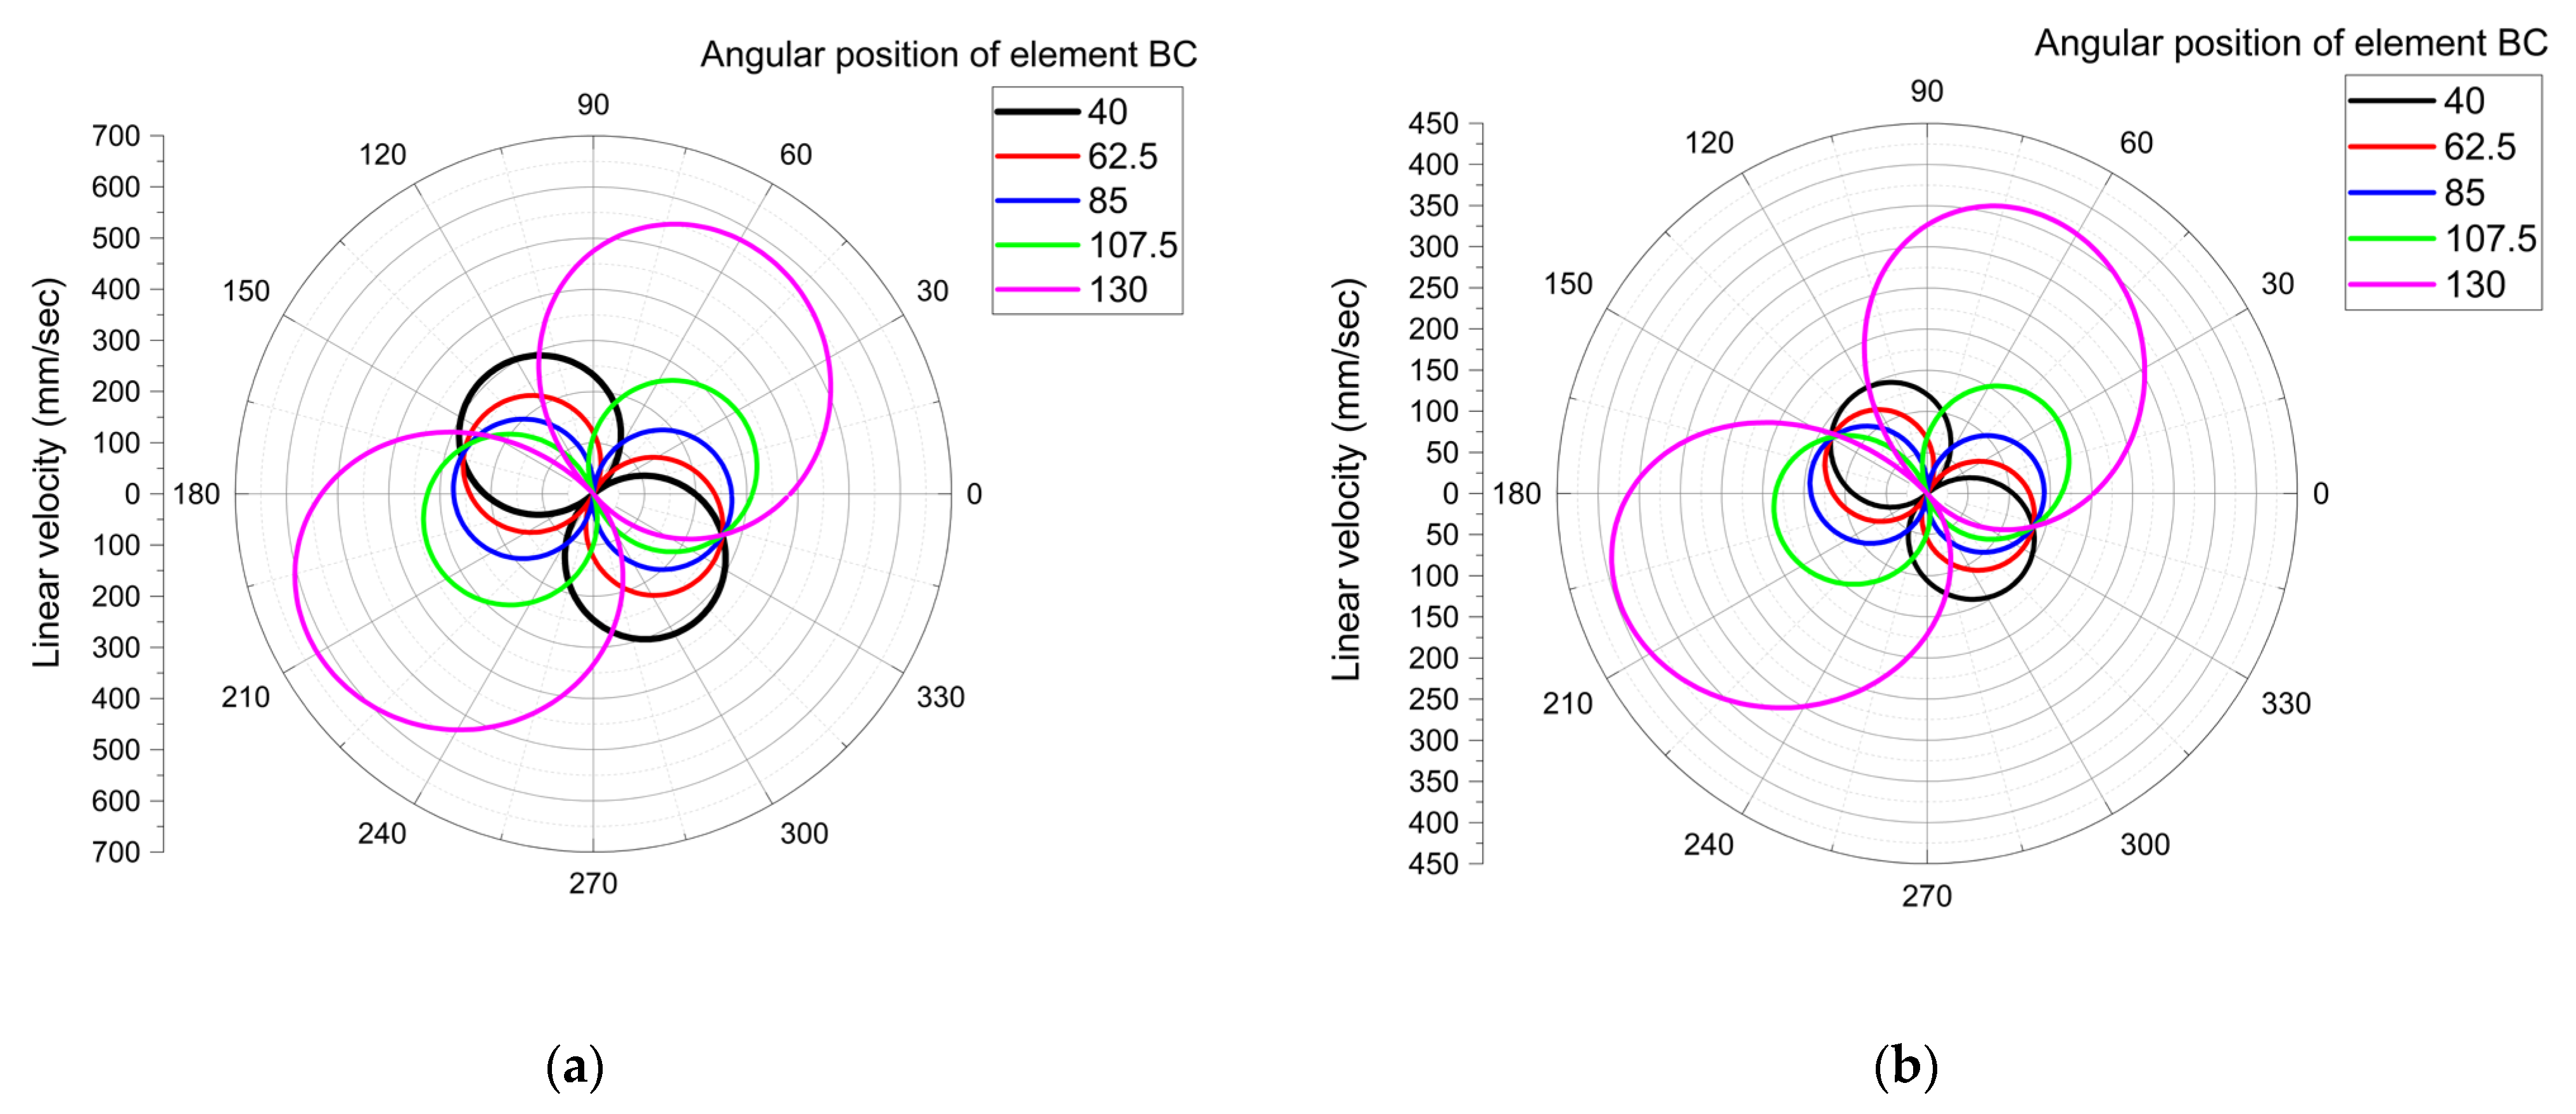
In addition to analyzing the variation in linear velocity over time, the influence of the drive mechanism’s position is also considered. For this reason, Figure 10 and Figure 11 illustrate the variation in this parameter as a function of angle ϕ, highlighting potential symmetries or asymmetries in motion.
The use of a polar plot is appropriate in this context, as it allows for the simultaneous comparison of multiple datasets within an angular space, providing a clear visualization of the kinematic behavior of element BC. In this study, the angular values presented in the polar plot represent the crank angle (angle α). This type of representation is particularly useful in the analysis of rotary or oscillating mechanisms, where the positioning angle directly influences system performance.
From the analysis of the graphical representations in Figure 10 and Figure 11, the following conclusions can be drawn:
  • 1. Regarding the drive system corresponding to Figure 1a, for the five selected values of angle ϕ, the maximum linear velocity values were obtained as follows:
  • For joint C:
    ϕ = 40° → maximum linear velocity at α = 144° and 306°;
    ϕ = 62.5° → maximum linear velocity at α = 157° and 330°;
    ϕ = 80° → maximum linear velocity at α = 177° and 350°;
    ϕ = 107.5° → maximum linear velocity at α = 199° and 16.8°;
    ϕ = 130° → maximum linear velocity at α = 220° and 40.8°.
  • For joint E:
    ϕ = 40° → maximum linear velocity at α = 158.6° and 292°;
    ϕ = 62.5° → maximum linear velocity at α = 165° and 322°;
    ϕ = 80° → maximum linear velocity at α = 184.5° and 347°;
    ϕ = 107.5° → maximum linear velocity at α = 206° and 10.1°;
    ϕ = 130° → maximum linear velocity at α = 228° and 33.7°.
  • 2. Regarding the drive system illustrated in Figure 1b, the analysis conducted for the five selected values of angle ϕ revealed the angular positions α at which the linear velocity reaches its maximum, for both joint C and joint E:
  • For joint C, the following results were obtained:
    ϕ = 40° → maximum linear velocity at α = 134° and 309°;
    ϕ = 62.5° → maximum linear velocity at α = 154° and 332°;
    ϕ = 80° → velocity peaks at α = 176° and 353°;
    ϕ = 107.5° → maximum velocity at α = 196.8° and 20.2°;
    ϕ = 130° → maximum values at α = 207° and 56.2°.
  • For joint E, the angular positions α corresponding to the maximum velocities are as follows:
    ϕ = 40° → maximum velocity at α = 125° and 316°;
    ϕ = 62.5° → maximum values at α = 148.5° and 337°;
    ϕ = 80° → peaks located at α = 169.8° and 2.25°;
    ϕ = 107.5° → maximum velocity at α = 190.1° and 28.1°;
    ϕ = 130° → maximum values recorded at α = 200.2° and 65°.
  • 3. By analyzing all the values corresponding to the linear velocity peaks, the following observations can be made:
  • For the drive system illustrated in Figure 1a, it is observed that angle α shifted by 76° and 94.8° from its initial value (corresponding to ϕ = 40°) for joint C, and by 69.4° and 101.7° for joint E.
  • For the second drive system, presented in Figure 1b, a similar variation in angle α is observed: it changes by 73° and 116.6° for joint C, and by 75.2° and 109° for joint E, relative to the initial value corresponding to ϕ = 40°.
The polar plots in Figure 10 and Figure 11 allow for the identification of the crank angles (α) at which velocity reaches its peak values. This information is critical for synchronizing the feeding cycle with the active crushing phase, thereby optimizing energy efficiency and reducing the risk of blockage.
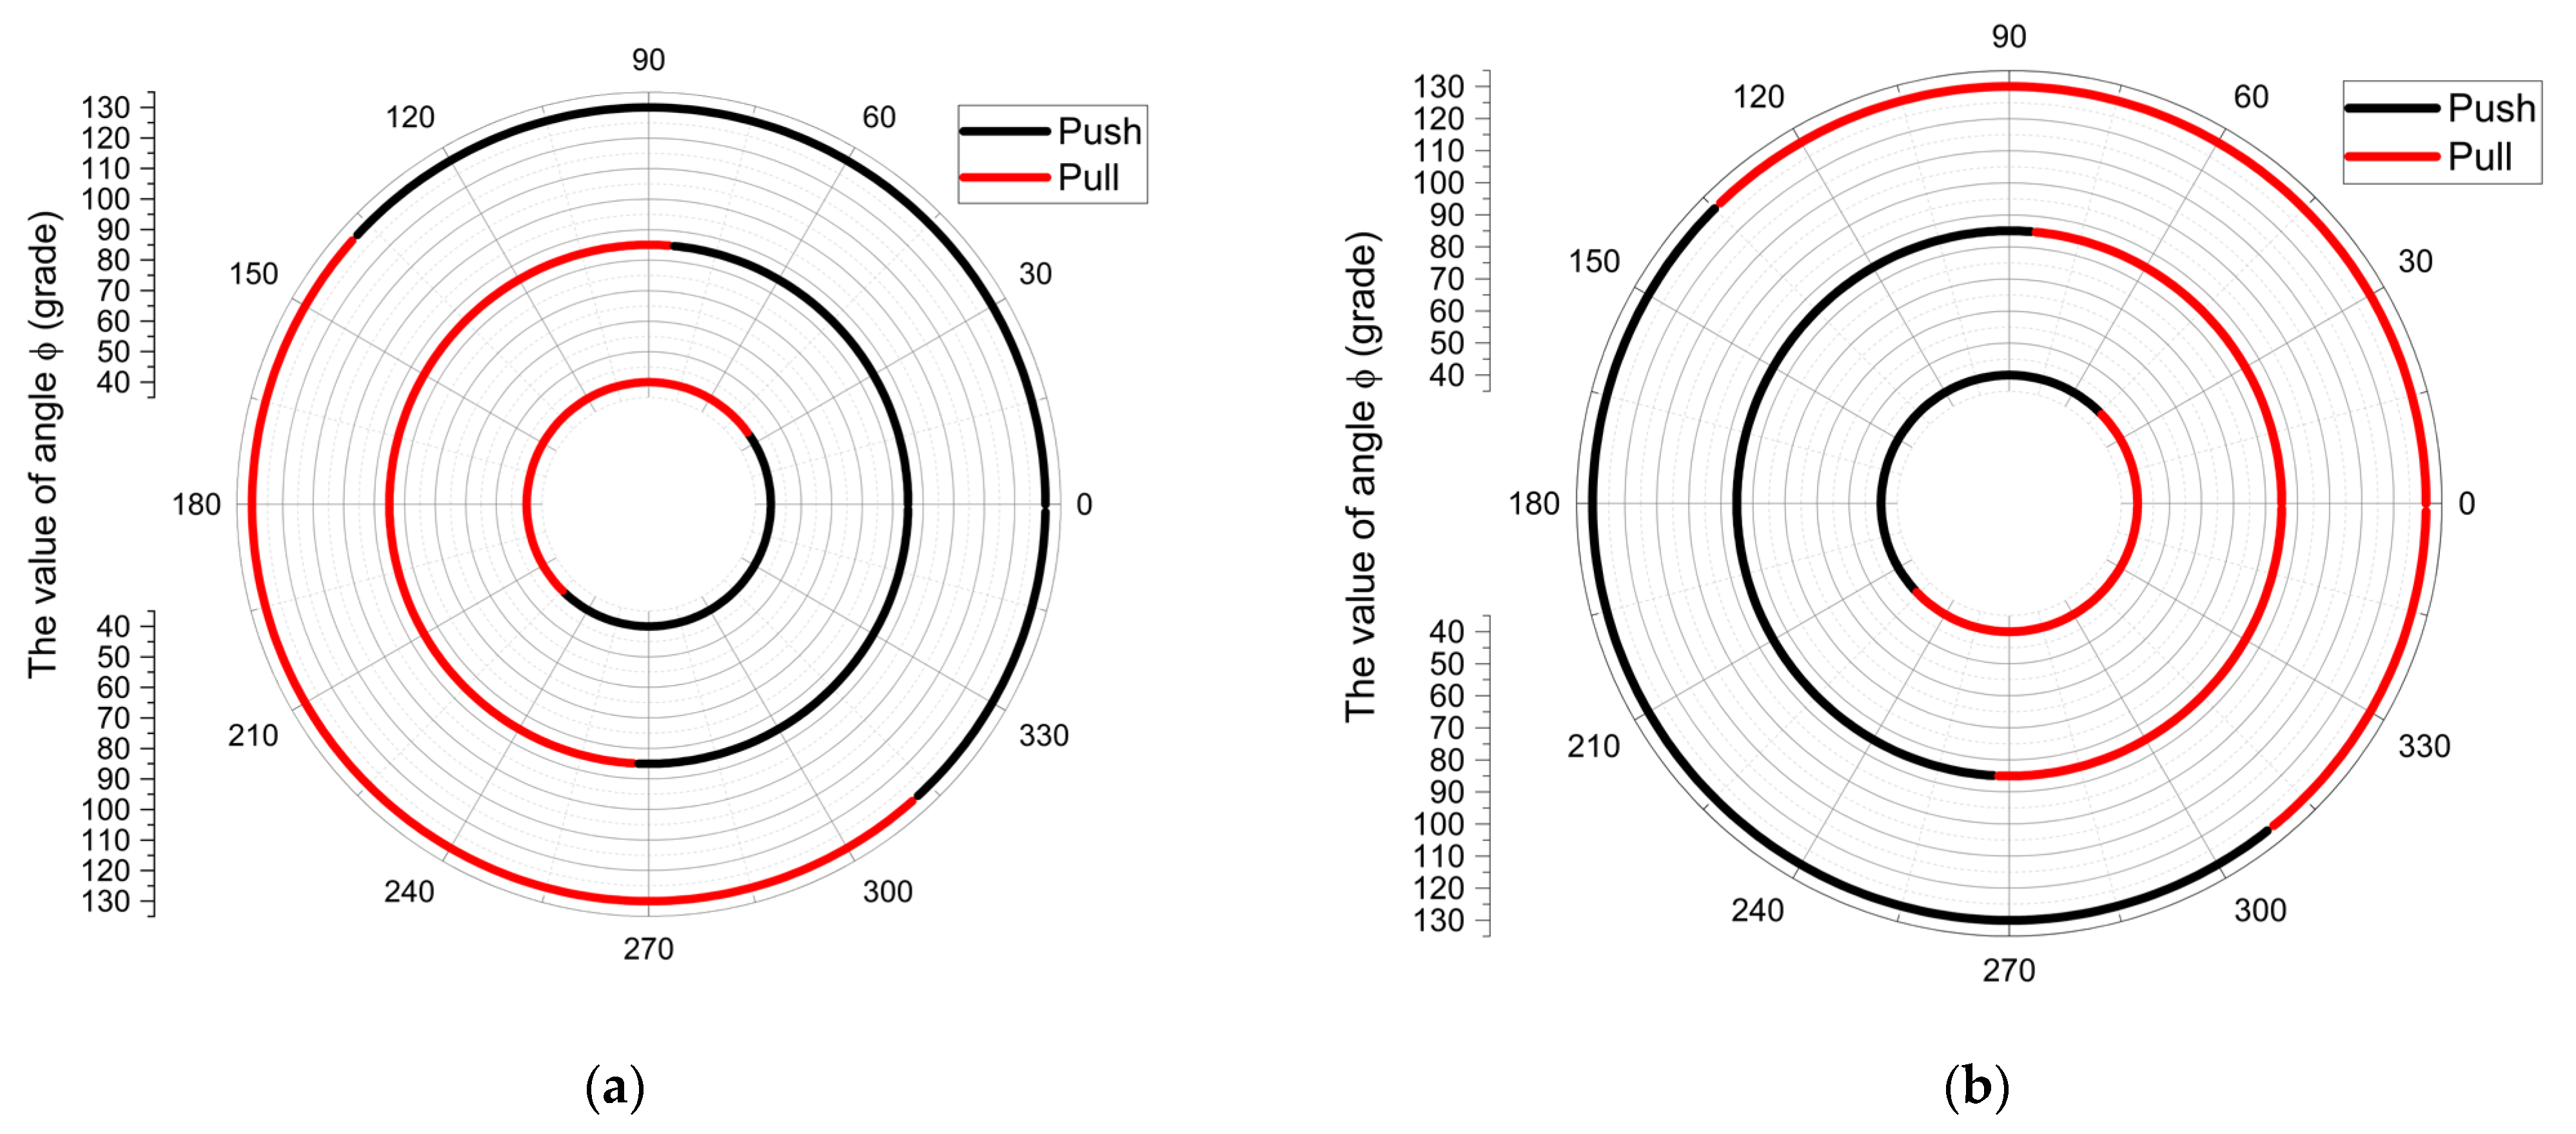
Based on the analysis of both the trajectory of joint E and the motion of the crank, it was possible to identify the angular positions corresponding to the crushing operation (i.e., the active phase of the process, when joint E moves from right to left to reduce the distance between the fixed and movable jaws) and the loading operation of the crusher (i.e., the passive phase, when joint E moves from left to right, increasing the distance between the two jaws and allowing material to descend from the fixed jaw area F toward the movable joint E).
Since there are two drive systems, the motion of the movable jaw (i.e., joint E) is determined by the motion of joint C, as follows:
-
For the drive system shown in Figure 1a, in order for joint E to perform the motion that reduces the distance between the jaws, joint C must move downward.
-
For the drive system shown in Figure 1b, in order for joint E to perform the same motion, joint C must move upward.
Based on this information, the following conclusions can be drawn (Figure 12):
-
Regardless of which graph is analyzed, there are correspondences between the representations in Figure 12 and those in Figure 10b and Figure 11b. Specifically, the transition zones between the pushing and pulling phases coincide with the points where the linear velocity values are zero.
-
Furthermore, from the comparative analysis of the aforementioned graphs, the following is observed:
  • The highest velocity value in Drive System 1 occurs during the pushing phase (i.e., high velocity during the crushing process, the active stroke).
  • The same conclusion applies to Drive System 2, based on the analysis of its linear velocity variation.
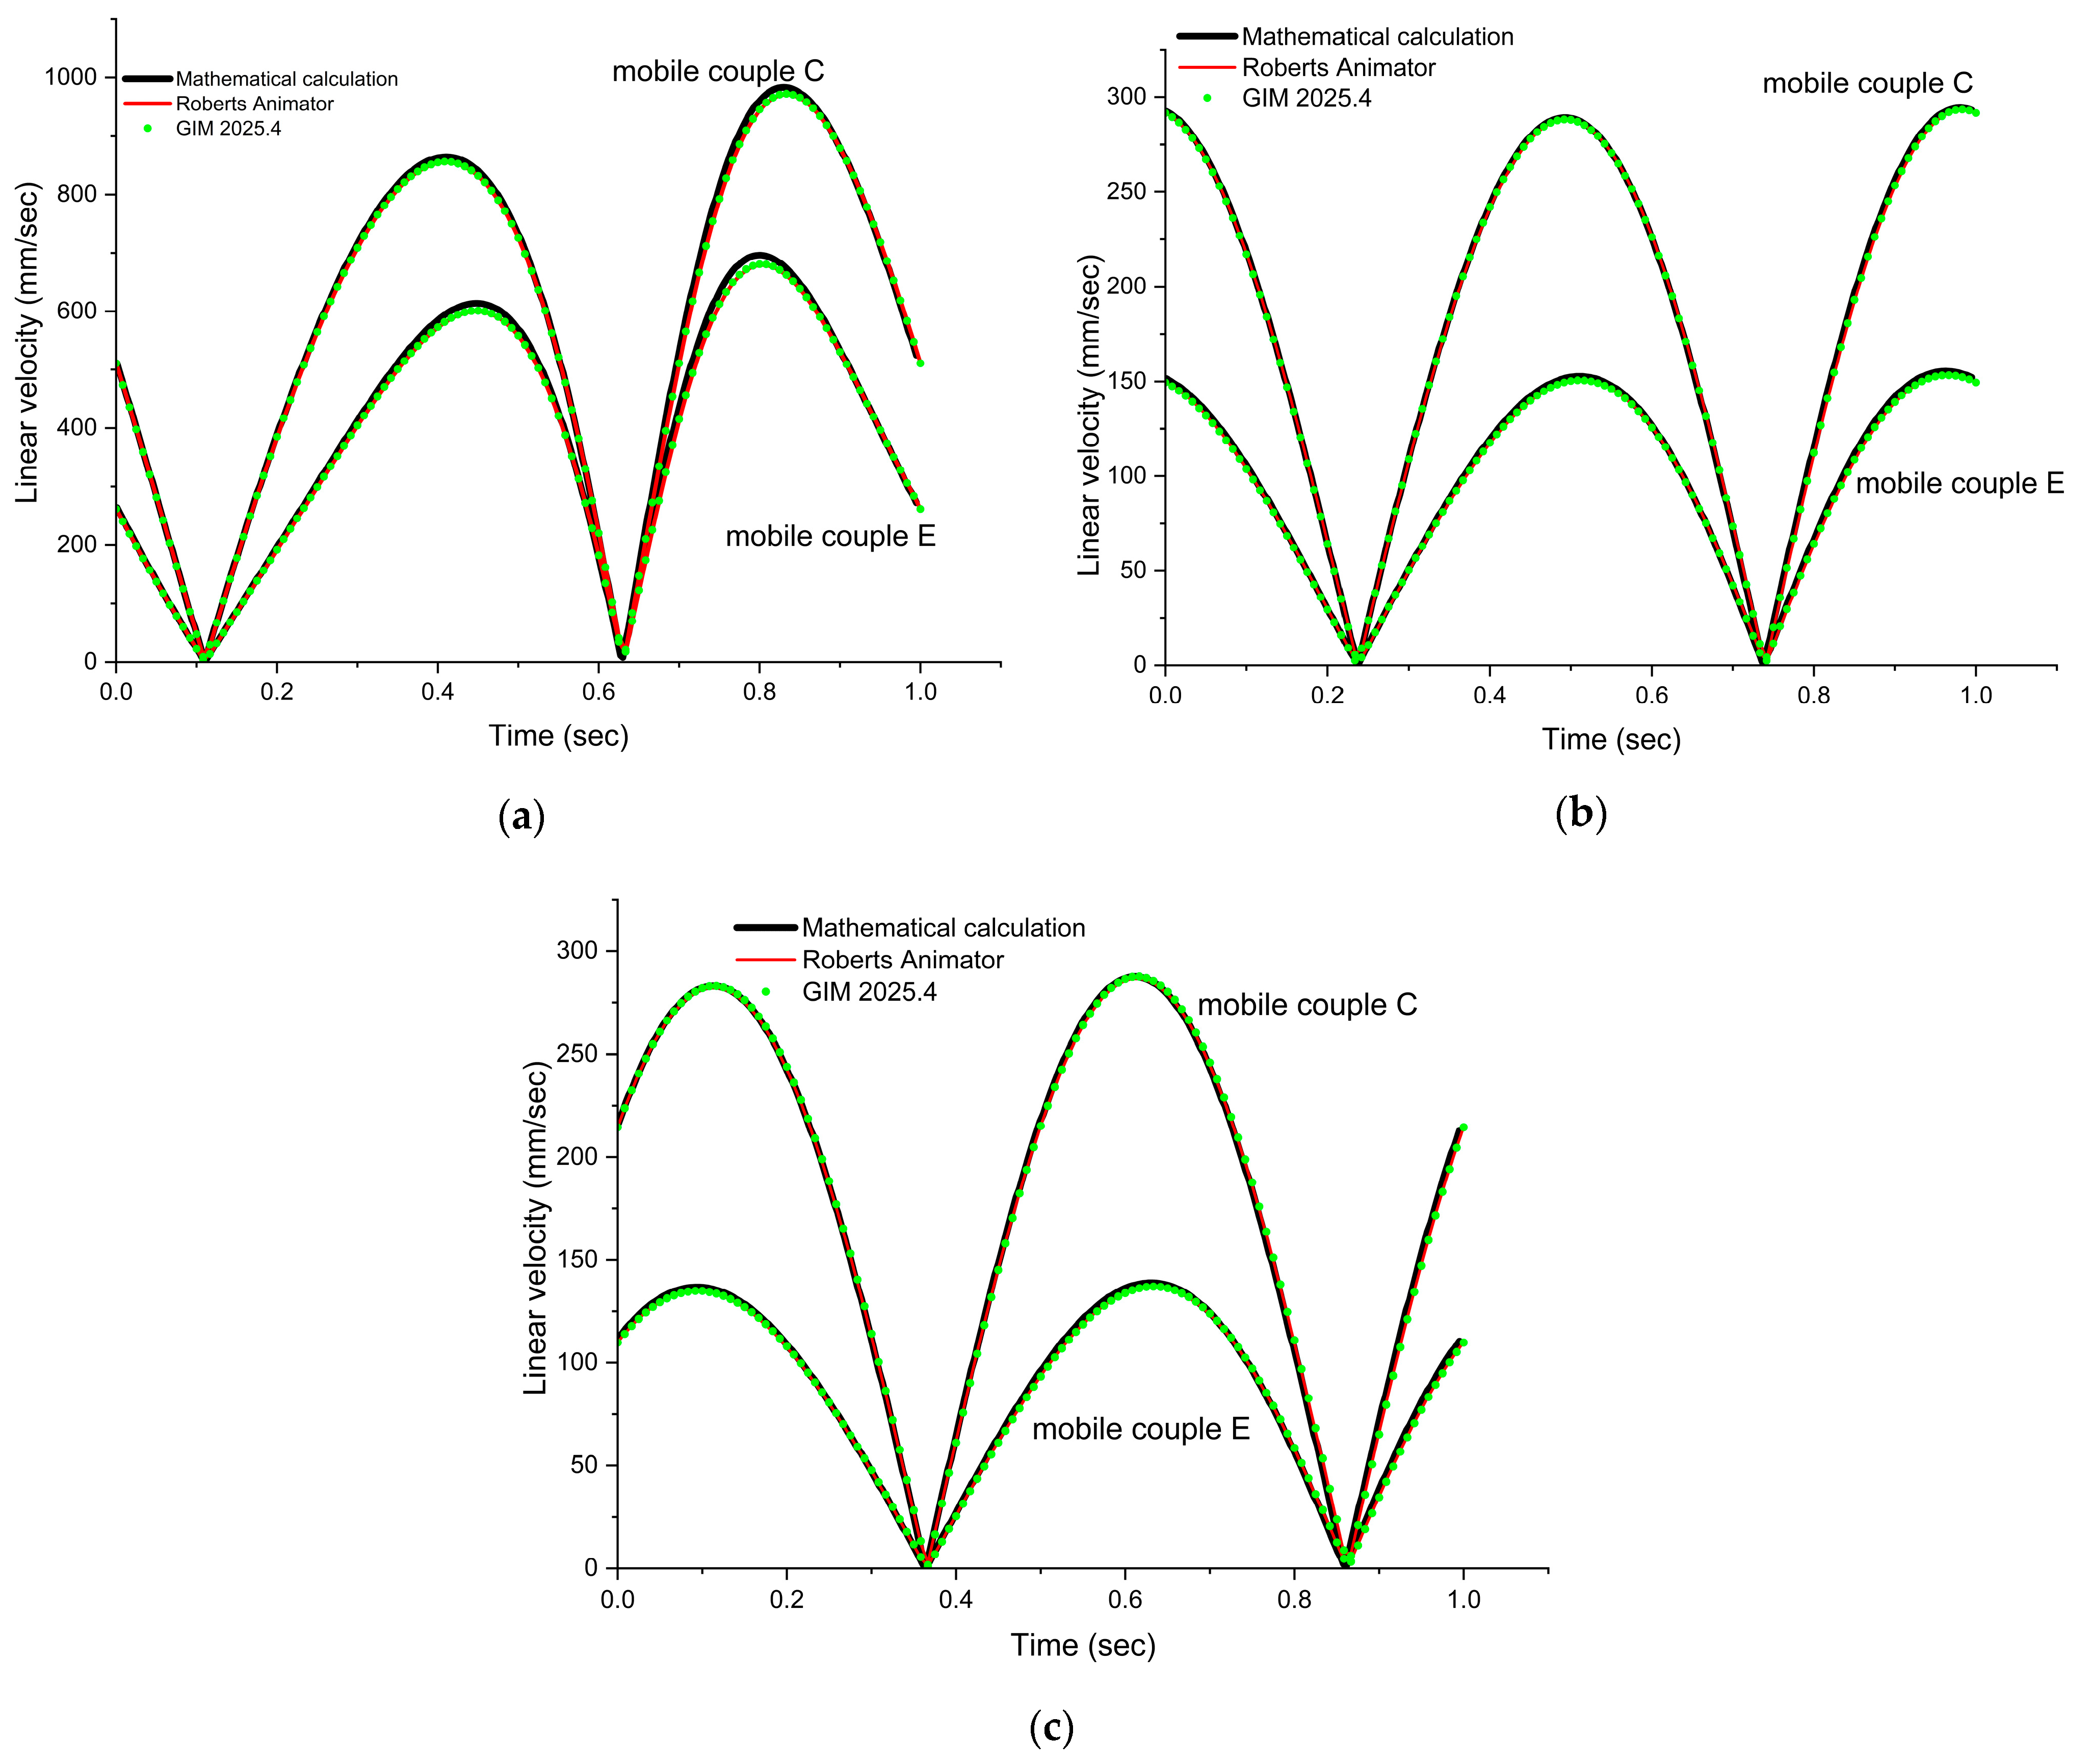
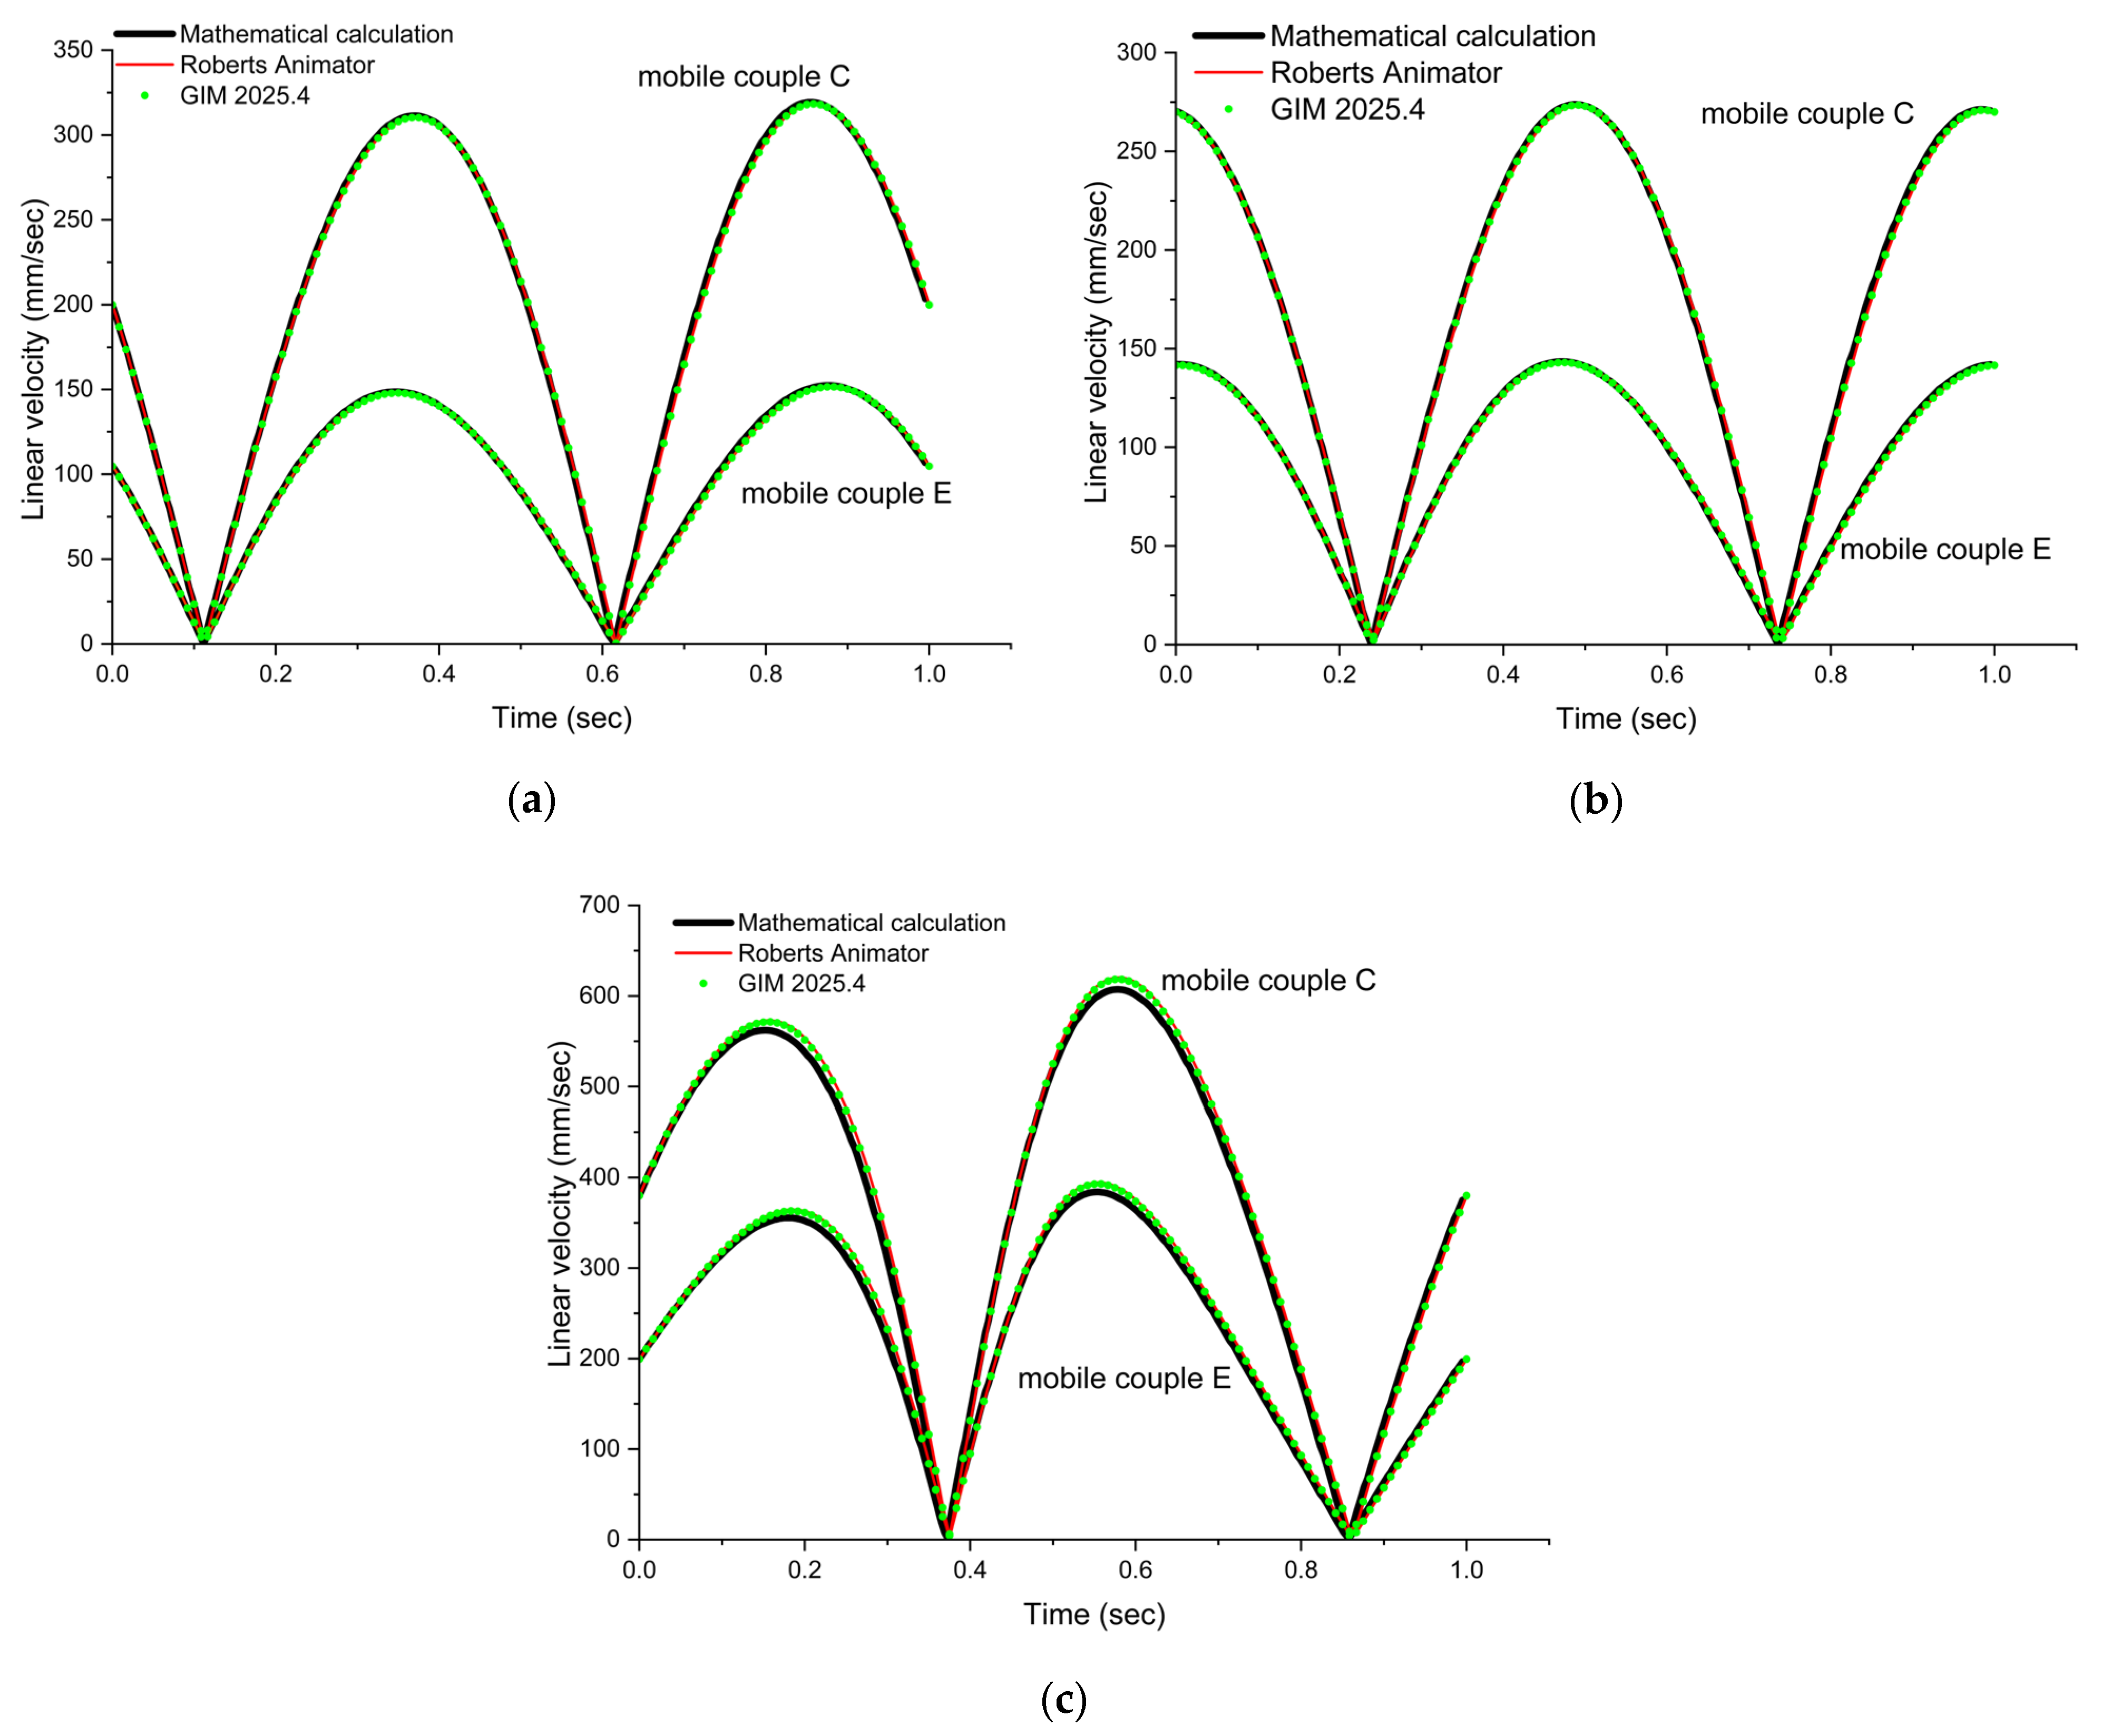
As presented in the Methodology section, in order to verify the accuracy of the previously obtained and presented results, three simulation programs were used (Mathcad 15, Roberts Animator, and GIM 2025.4). Since it was not possible to perform all 181 simulations corresponding to the full set of ϕ angle values in these programs, three representative values were selected: 40°, 85°, and 130°.
Following the simulations, a comparison was made for each analyzed joint and for each drive system, based on the linear velocity values obtained. These variations are illustrated in Figure 13 and Figure 14.
The graphical representations of the linear velocity variations confirm a sinusoidal pattern, indicating that the mechanism under study performs a cyclic motion.
By analyzing the results obtained through the three methods, it was found that there are no significant differences between them. The maximum error observed was 1.79%, occurring in the linear velocity variation corresponding to the second drive system. This discrepancy was identified between the mathematically calculated values and the two sets of values obtained through the simulation programs.

5. Discussion

The kinematic analysis of the double-toggle jaw crusher, conducted through both mathematical methods and two numerical simulations, provides a detailed perspective on the mechanism’s behavior depending on the type of drive system. However, beyond the numerical results and their validation, a critical interpretation of the implications is essential, along with a reflection on methodological limitations and the potential for further research.
A notable aspect of the study is the high sensitivity of the mechanism to variations in the crank rotation angles and the initial position of the connecting rod. This sensitivity is reflected not only in the linear velocity values but also in the trajectories of the moving joints, indicating a strong dependence on precise initial positioning and kinematic control. In industrial applications, this may impose strict requirements for calibration and maintenance of the drive system to avoid significant functional deviations.
Although the mechanism exhibits cyclic motion, the graphical analysis revealed an asymmetry between the active and passive phases of the crushing cycle. This asymmetry significantly affects the distribution of mechanical loads on the components, leading to uneven wear. Moreover, the velocity differences between the two phases can impact the quality of the crushing process, especially for materials with variable mechanical behavior. Therefore, optimizing the work cycle may require an adaptive approach, where kinematic parameters are adjusted based on the type of material being processed.
While the results obtained using different software tools (Mathcad, Roberts Animator, and GIM 2025.4) were consistent, they cannot fully replace experimental validation. The absence of a physical test bench limits the ability to assess the influence of external factors such as friction, mechanical play, or elastic deformations of components. Additionally, the simulations were performed for a limited number of φ angle positions in the animation software, which may reduce the resolution of the analysis in certain critical intervals.
The choice of step size for varying angles α and ϕ was arbitrary, which raises questions regarding the optimization of the analysis. A step size that is too large may overlook significant local behaviors, while a step size that is too small can generate an unmanageable volume of data without proportional benefits.
The results obtained from this study can guide the design of future jaw crushers, particularly in the selection of the drive system.
The current model presented in this study focuses exclusively on kinematic aspects, without integrating force dynamics or the interaction with the processed material.
The identified variations in velocity and trajectory may have a direct impact on the wear of moving components. Therefore, the study’s findings can support the development of predictive maintenance strategies based on the real-time monitoring of kinematic parameters.
The data obtained may also serve as a foundation for developing automated control algorithms for the crusher. For example, the sinusoidal variation in linear velocity could be used to synchronize material feeding with the active phase of the cycle, thereby maximizing process efficiency. Additionally, identifying motion reversal points could enable the implementation of protection mechanisms against overloads or blockages.
Although the results obtained through mathematical methods and numerical simulations have validated each other, it is important to emphasize that they cannot fully substitute experimental validation. In the absence of a physical testing setup, it is not possible to accurately quantify the influence of external factors such as friction, mechanical play, or elastic deformations of components on the operating behavior of the jaw crusher’s drive system. As a result, discrepancies may arise between the theoretical models and the real system, particularly regarding peak linear velocity values and transient behavior.
Moreover, the arbitrary selection of step sizes for the angles α and φ may affect the resolution of the results. For this reason, a sensitivity analysis is planned for future work. This will allow the identification of critical intervals in which small variations in input parameters can lead to significant changes in kinematic behavior, thereby enhancing the robustness and credibility of the conclusions.
The results obtained in this study have direct implications for the design process of jaw crushers. For example, identifying the values of angles α and φ that generate peak linear velocities at the moving joints enables the optimization of component positioning within the drive mechanism to reduce mechanical stress. Additionally, the significant velocity differences between joints C and E suggest the need for materials with different strength properties or constructive solutions aimed at reducing mechanical wear. These aspects can contribute to increased equipment durability and reduced maintenance costs.

6. Future Work

In future work, a sensitivity analysis will be conducted to determine the optimal step size based on the variation in kinematic parameters, aiming to balance precision and computational efficiency. Additionally, the research will be extended through a dynamic analysis comparing the two drive systems, taking into account the mass of the components forming the mechanism, the moment of inertia, and the friction occurring at the mechanical joints.
Looking ahead, the study could be further developed by integrating dynamic models that include contact forces and material resistance. Moreover, the construction of a physical test bench would enable empirical validation of the results and contribute to a deeper understanding of the underlying phenomena.
Further studies may also focus on the degree of fragmentation achieved using the two drive systems, the variation in energy consumption, and the identification of wear levels in components subjected to mechanical loads.

7. Conclusions

This study aimed to conduct a detailed theoretical analysis of the operation of a double-toggle jaw crusher driven by a crank-slider mechanism. The paper compares two types of drive systems (“pull” and “push”—these terms were adopted based on the tensioning mode of the connecting rod during the active phase of the crushing process) from a kinematic perspective. The methodology involved the use of mathematical equations and numerical simulations carried out with the following specialized software: Mathcad 15, Roberts Animator 2.1.0, and GIM 2025.4. The study employed a parametric approach to capture the kinematic behavior of the drive system as a function of the crank angle (α) and the connecting rod angle (φ).
The results revealed sinusoidal variations in the linear velocity at mobile joints C and E, with different amplitudes and phases depending on the configuration of the drive mechanism. The “pull” system generated peak velocity values at the beginning of the φ interval (~40°), while the “push” system reached its maximum around φ ≈ 130°, indicating a different distribution of mechanical loads. Mobile joint C consistently recorded higher velocities than joint E, with a difference of approximately 64%, suggesting increased wear at that point.
Regarding the linear velocity variations, the maximum values were 983.241 mm/s (for joint C) and 695.974 mm/s (for joint E) in the “pull” system, and 622.66 mm/s (for joint C) and 396.52 mm/s (for joint E) in the “push” system. The polar diagram analysis enabled the identification of the α angles corresponding to these maxima, revealing a significant phase shift of up to 116.6° in the case of the “push” system.
The simulations confirmed that the choice of drive system for the jaw crusher influences not only the magnitude but also the variation pattern of the velocities, which has direct implications for the equipment’s energy efficiency and durability. This is particularly evident during the active stroke at joint E in the drive system shown in Figure 1a, where velocity values were over 299 mm/s higher than those in the system shown in Figure 1b.
In conclusion, the “pull” system provides more balanced operation and a more uniform distribution of linear velocity, making it preferable in applications where reducing stress on moving components is desired. The study highlights the importance of detailed kinematic analysis and numerical simulations in the design and optimization of industrial mechanisms, and in the identification of critical wear points for effective maintenance strategies.
The results obtained from this study can guide the design process, particularly with regard to the configuration of the drive system and the selection of materials for the moving components. Depending on the chosen design options, appropriate maintenance strategies can also be defined. Furthermore, the peak values and distribution of linear velocity can be used to anticipate areas where increased mechanical wear is likely to occur. For these critical zones, protective measures or adaptive control solutions should be considered.

Author Contributions

Conceptualization, E.M. and D.M.; methodology, E.M.; software, E.M.; validation, V.C. and M.J.; formal analysis, M.P.-L.; investigation, E.M.; writing—original draft preparation, E.M.; writing—review and editing, D.M. and C.T.; visualization, N.S. and I.C.P.; supervision, C.T., O.I. and V.C. All authors have read and agreed to the published version of the manuscript.

Funding

This research received no external funding.

Data Availability Statement

The original contributions presented in this study are included in the article. Further inquiries can be directed to the corresponding author(s).

Conflicts of Interest

The authors declare no conflicts of interest.

References

  1. Okechukwu, C.; Dahunsi, O.A.; Oke, P.K.; Oladele, I.O.; Dauda, M.; Olaleye, B.M. Design and operations challenges of a single toggle jaw crusher: A review. Niger. J. Technol. 2017, 36, 814–821. [Google Scholar] [CrossRef]
  2. Gurway, S.; Gadge, P. Stone Crushers: A Technical Review on Significant Part of Construction Industry. In Recent Advances in Civil Engineering; Springer: Singapore, 2022; pp. 365–383. [Google Scholar]
  3. Patel, G.; Kumar, D. Study of Kinematic and Dynamic Analysis of Jaw Crusher—A Review. 2016. Available online: https://www.academia.edu/127781687/Study_of_Kinematic_and_Dynamic_Analysis_of_Jaw_Crusher_A_Review (accessed on 30 May 2025).
  4. Mining Equipment Maintenance. In Mining Equipment Reliability, Maintainability, and Safety; Dhillon, B.S., Ed.; Springer: London, UK, 2008; pp. 115–133. [Google Scholar]
  5. Toryanik, E.I.; Gryzlov, A.V.; Zhuravsky, A.A.; Kubrak, S.S. Determining the Strength of Coke under Crushing Forces. Coke Chem. 2017, 60, 102–107. [Google Scholar] [CrossRef]
  6. Wu, J.J.; Wu, S.L.; You, X.X. PHM for complex mining and metallurgy equipment multi-state system based optimal multivariate Bayesian model. In Proceedings of the IEEE International Conference on Industrial Engineering and Engineering Management, Selangor Darul Ehsan, Malaysia, 9–12 December 2014; pp. 1042–1046. [Google Scholar]
  7. Ciężkowski, P.; Lubikowski, K.; Łosiewicz, A.; Bąk, S.; Caban, J.; Dumała, S.; Grabowski, P. Investigation effect of the process parameters in mechanical comminution on ceramic materials. Adv. Sci. Technol. Res. J. 2025, 19, 223–238. [Google Scholar] [CrossRef]
  8. Deb, M.; Sen, D. Parametric study of the behavior of double toggle switching mechanisms. Mech. Mach. Theory 2013, 63, 8–27. [Google Scholar] [CrossRef]
  9. Deb, M.; Sen, D. Design of double toggle switching mechanisms. Mech. Mach. Theory 2014, 71, 163–190. [Google Scholar] [CrossRef]
  10. Hafeez, I.; Juniad, F.; Kamal, M.A.; Hussain, J. Influence of single-and two-stage aggregate manufacturing mechanisms on asphalt mixture performance. J. Mater. Civ. Eng. 2016, 28, 04015180. [Google Scholar] [CrossRef]
  11. Korman, T.; Bedekovic, G.; Kujundzic, T.; Kuhinek, D. Impact of physical and mechanical properties of rocks on energy consumption of Jaw Crusher. Physicochem. Probl. Miner. Process. 2015, 51, 461–475. [Google Scholar] [CrossRef]
  12. Leich, L.; Röttger, A.; Krengel, M.; Theisen, W. Recycling of NdFeB Magnets by Electrodischarge Sintering—Microstructure, Magnetic, and Mechanical Properties. J. Sustain. Met. 2019, 5, 107–117. [Google Scholar] [CrossRef]
  13. Pasaribu, M.A.H.; Adhitya, B.B.; Costa, A.; Nayobi, B. Effect of Curing Time and Variations in Na2SiO3: NaOH Ratio on the Mechanical Properties of Fly Ash-based Geopolymer Artificial Aggregates using the Crushing Method. J. Adv. Res. Appl. Mech. 2024, 117, 107–117. [Google Scholar] [CrossRef]
  14. Arsenault, M.; Tremblay, L.F.; Zeinali, M. Optimization of trajectory durations based on flow rate scaling for a 4-DoF semi-automated hydraulic rockreaker. Mech. Mach. Theory 2020, 143, 103632. [Google Scholar] [CrossRef]
  15. Bello, S.K.; Bajela, G.G.; Lamidi, S.; Oshinlaja, S. Design and Fabrication of Pneumatic Can Crushing Machine. Int. J. Adv. Sci. Res. Eng. 2020, 6, 154–161. [Google Scholar] [CrossRef]
  16. Klinzing, G.E.; Rizk, F.; Marcus, R.; Leung, L.S. Principles of Pneumatic Conveying. In Pneumatic Conveying of Solids: A Theoretical and Practical Approach; Klinzing, G.E., Rizk, F., Marcus, R., Leung, L.S., Eds.; Springer: Dordrecht, The Netherlands, 2010; pp. 193–235. [Google Scholar]
  17. Nikitin, A.G.; Abramov, A.V.; Zhivago, E.Y.; Dvornikov, L.T.; Saruev, L.A. Improvement of jaw crushers reliability using elastic pneumatic elements in the connection of kinematic pairs. IOP Conf. Ser. Mater. Sci. Eng. 2018, 411, 012054. [Google Scholar] [CrossRef]
  18. Han, B.; Chakraborty, A. Ligand extension of aluminum fumarate metal-organic framework in transferring higher water for adsorption desalination. Desalination 2024, 592, 118135. [Google Scholar] [CrossRef]
  19. Han, B.; Chakraborty, A. Synergistic ionic liquid encapsulated MIL-101 (Cr) metal-organic frameworks for an innovative adsorption desalination system. J. Clean. Prod. 2024, 474, 143565. [Google Scholar] [CrossRef]
  20. Altshul, G.M.; Gouskov, A.M.; Panovko, G.Y.; Shokhin, A.E. Interaction model of one jaw of a vibrating jaw crusher with the processed rock, taking into account the properties of the electric motor. IOP Conf. Ser. Mater. Sci. Eng. 2020, 747, 012047. [Google Scholar] [CrossRef]
  21. Bru, K.; Beaulieu, M.; Sousa, R.; Leite, M.M.; de Sousa, A.B.; Kol, E.; Rosenkranz, J.; Parvaz, D.B. Comparative laboratory study of conventional and Electric Pulse Fragmentation (EPF) technologies on the performances of the comminution and concentration steps for the beneficiation of a scheelite skarn ore. Min. Eng. 2020, 150, 106302. [Google Scholar] [CrossRef]
  22. Gavrilov, Y.A.; Zagrivniy, E.A. The Autoresonant Electric Drive of the Swinging Movement Pendular Vibration Exciter Vibration Jaw Crushers. J. Min. Inst. 2010, 186, 116–119. [Google Scholar]
  23. Huang, J.; Zong, Y.; Liu, Y.; Hu, K.; Wang, B.; Zhao, X.; Jiang, T.; Hong, Z.; Wang, Z.L. Feature-Reinforced Strategy for Enhancing the Accuracy of Triboelectric Vibration Sensing Toward Mechanical Equipment Monitoring. Small 2025, 21, 2503997. [Google Scholar] [CrossRef]
  24. Mohammadi, V.S.; Noaparast, M.; Aslani, S. The effect of high voltage electrical pulses on iron ore comminution to improve desulfurization flotation recovery. Physicochem. Probl. Miner. Process. 2022, 58, 150264. [Google Scholar] [CrossRef]
  25. Chen, Y.H.; Zhang, G.S.; Zhang, R.L.; Gupta, T.; Katayama, A. Finite element study on the wear performance of movable jaw plates of jaw crushers after a symmetrical laser cladding path. Symmetry 2020, 12, 1126. [Google Scholar] [CrossRef]
  26. Pedro, D.; de Brito, J.; Evangelista, L. Performance of concrete made with aggregates recycled from precasting industry waste: Influence of the crushing process. Mater. Struct. Mater. Constr. 2015, 48, 3965–3978. [Google Scholar] [CrossRef]
  27. Xu, P.Y.; Li, J.; Hu, C.; Chen, Z.; Ye, H.Q.; Yuan, Z.Q.; Cai, W.J. Surface property variations in flotation performance of calcite particles under different grinding patterns. J. Cent. South Univ. 2018, 25, 1306–1316. [Google Scholar] [CrossRef]
  28. Sastri, S.R.S. Capacities and performance characteristics of jaw crushers. Min. Metall. Explor. 1994, 11, 80–86. [Google Scholar] [CrossRef]
  29. Rajan, B.; Singh, D. Comparison of Shape Parameters and Laboratory Performance of Coarse Aggregates Produced from Different Types of Crushing Operations. J. Mater. Civ. Eng. 2017, 29, 04017044. [Google Scholar] [CrossRef]
  30. Olaleye, B.M. Influence of some rock strength properties on jaw crusher performance in granite quarry. Min. Sci. Technol. 2010, 20, 204–208. [Google Scholar] [CrossRef]
  31. Maleki-Moghaddam, M.; Zare, S. Investigating the chamber filling effect on the jaw crusher, cone crusher and HPGR performance. Can. Met. Q. 2025, 64, 1403–1412. [Google Scholar] [CrossRef]
  32. Abhilash Kumar, K.A.; Kiran, K.S.; Gopal, B.B. Optimization study and material properties of angular artificial aggregates. Emergent Mater. 2025. [Google Scholar] [CrossRef]
  33. Lal Chauhan, B.; Jail Singh, G. Sustainable development of recycled concrete aggregate through optimized acid-mechanical treatment: A simplified approach. Constr. Build. Mater. 2023, 399, 132559. [Google Scholar] [CrossRef]
  34. Chen, L.; Xue, J.; Zhang, X.; Wang, Y. Optimization and reliability analysis of movable jaw structure of jaw crusher based on response surface. Int. J. Perform. Eng. 2019, 15, 1408–1416. [Google Scholar] [CrossRef]
  35. Balasubramanyam, C.; Spandana, K.R.; Ajay, M.S.; Shetty, A.B.; Seetharamu, K.N. Optimization approach for synthesis of 5 point double toggle mechanism. Int. J. Interact. Des. Manuf. 2017, 11, 839–850. [Google Scholar] [CrossRef]
  36. Chen, Z.R.; Wang, G.Q.; Xue, D.M.; Bi, Q.S. Simulation and optimization of gyratory crusher performance based on the discrete element method. Powder Technol. 2020, 376, 93–103. [Google Scholar] [CrossRef]
  37. Datta, S.; Roy, S.; Davim, J.P. Optimization Techniques: An Overview. In Optimization in Industry: Present Practices and Future Scopes; Datta, S., Davim, J.P., Eds.; Springer International Publishing: Cham, Switzerland, 2019; pp. 1–11. [Google Scholar]
  38. Gurway, S.; Gadge, P. Optimizing processing parameters of stone crushers through Taguchi method. Mater. Today Proc. 2022, 65, 3512–3518. [Google Scholar] [CrossRef]
  39. Laciak, M.; Šofranko, M. Optimization of device selection in design of technological lines for the aggregates production. Appl. Mech. Mater. 2014, 611, 387–394. [Google Scholar] [CrossRef]
  40. Luo, Z.; Li, S. Optimization design for crushing mechanism of double toggle jaw crusher. Appl. Mech. Mater. 2012, 201–202, 312–316. [Google Scholar] [CrossRef]
  41. Murithi, M.; Keraita, J.N.; Obiko, J.O.; Mwema, F.M.; Wambua, J.M.; Jen, T.-C. Optimisation of the swinging jaw design for a single toggle jaw crusher using finite element analysis. Int. J. Interact. Des. Manuf. 2024, 18, 6351–6358. [Google Scholar] [CrossRef]
  42. Li, S.J.; Wan, X.H.; Dong, Z.W.; Hou, W.Z. Optimization designing of jaw crusher teeth plate shape based on the FEM method. Adv. Mater. Res. 2013, 614, 333–336. [Google Scholar] [CrossRef]
  43. Zhang, J.C.; Wang, L.C. Optimization design of vibratory jaw crusher with double cavities based on matlab. Adv. Mater. Res. 2014, 945–949, 596–599. [Google Scholar] [CrossRef]
  44. Baruti, B.; Peci, N.; Vitaku, A.; Malollari, I.; Zeqiri, R.; Kelmendi, M. Analysis of the Possibilities of Decreasing the Impact of Crushing Operations on Environment. J. Environ. Prot. Ecol. 2011, 12, 2056–2061. [Google Scholar]
  45. Bo, S.J.; Wang, X.; Ye, Q.H. Dynamic simulation research of jaw crusher with multi-joint clearance. Appl. Mech. Mater. 2014, 644–650, 2678–2681. [Google Scholar] [CrossRef]
  46. Muscalu, M.; Ghica, V.G.; Iacob, G.; Petrescu, M.I.; Buzatu, M. Studies and research on waste mosi2 heating elements. UPB Sci. Bull. Ser. B Chem. Mater. Sci. 2021, 83, 239–248. [Google Scholar]
  47. Zhao, Z.; Li, Y.; Li, W.; Xian, Z.; Zhu, X.; Zhong, J. Research on the biaxial compound pendulum jaw crusher based on seven-bar mechanism. Proc. Inst. Mech. Eng. Part C J. Mech. Eng. Sci. 2016, 230, 1876–1889. [Google Scholar] [CrossRef]
  48. Ciezkowski, P.; Maciejewski, J.; Bak, S. Analysis of Energy Consumption of Crushing Processes—Comparison of One-Stage and Two-Stage Processes. Stud. Geotech. Mech. 2017, 39, 17–24. [Google Scholar] [CrossRef]
  49. Mishchuk, Y.; Mishchuk, D.; Kapusta, O. Mathematical modeling kinematics of double toggle jaw crusher. Girnichi Budivelni Dorozhni Ta Meliorativni Mashini 2023, 102, 5–16. [Google Scholar] [CrossRef]
  50. Sinha, R.S.; Mukhopadhyay, A.K. Failure rate analysis of Jaw Crusher: A case study. Sadhana 2019, 44, 17. [Google Scholar] [CrossRef]
  51. Hroncová, D.; Delyova, I.; Frankovský, P.; Neumann, V.; Čech, D. Kinematic motion analysis of the members of a double jaw crusher. Acta Mechatronica 2022, 7, 1–7. [Google Scholar] [CrossRef]
  52. Sinha, R.S.; Mukhopadhyay, A.K. Failure rate analysis of jaw crusher using Weibull mode. J. Process Mech. Eng. 2016, 231, 760–772. [Google Scholar] [CrossRef]
  53. Erry, S.; Partama, M.; Fahrudinoor. Size distribution of jaw crusher crushing products for rounded material. KURVATEK 2024, 9, 95–100. [Google Scholar] [CrossRef]
  54. Shrivastava, A.K.; Sharma, A.K. A review on study of jaw crusher. Int. J. Mod. Eng. Res. 2012, 2, 885–888. [Google Scholar]
  55. Tufan, B.; Tufan, E. Evaluating the impacts of jaw crusher design parameters by simulation. In Proceedings of the 10th International Conference on Advances in Science, Engineering and Technology (ICASET-18), Paris, France, 20–21 June 2018. [Google Scholar]
  56. PaweŁ, C. Correlation of energy consumption and shape of crushing plates. J. Min. Geoengin. 2012, 2012, 91–100. [Google Scholar]
  57. Gupta, A.; Yan, D. Mineral Processing Design and Operation; Elsevier: Amsterdam, The Netherlands, 2006. [Google Scholar]
  58. Peter, N.M. Optimisation of Energy Efficiency and Comminution Process of a Single Toggle Jaw Crusher Using Discrete Element Method. Ph.D. Thesis, Jomo Kenyatta University of Agriculture And Technology, Juja, Kenya, 2021. [Google Scholar]
  59. Shrivastava, A.K.; Sharma, A.K. Dynamic Analysis of Double Toggle Jaw Crusher Using Pro- Mechanica. Int. J. Eng. Res. Appl. 2012, 2, 1132–1135. [Google Scholar]
  60. Gaesenngwe, G.; Gwiranai, D.; Shephered, B. Assessing Efficiency in a unified size reduction plant when reducing large ore into powder particulate matter. Procedia Manuf. 2019, 35, 808–813. [Google Scholar] [CrossRef]
  61. Cao, J.; Rong, X.; Yang, S.C. Jaw plate kinematical analysis for single toggle jaw crusher design. In Proceedings of the International Technology and Innovation Conference 2006 (ITIC 2006), London, UK, 11–12 October 2006. [Google Scholar]
  62. Guan, Y.; Zhang, Q.; Zhang, Z.; Xiao, Y. Modeling simulation and kinematic analysis based on Pro/Engineer for jaw crusher mechanism. In Proceedings of the 2011 2nd International Conference on Mechanic Automation and Control Engineering, MACE 2011—Proceedings, Hohhot, China, 15–17 July 2011; pp. 1407–1409. [Google Scholar]
  63. Oduori, M.; Mutuli, S.; Munyasi, D. The kinematics and mechanical advantage of the double-toggle jaw crusher. Proc. Inst. Mech. Eng. Part C J. Mech. Eng. Sci. 2017, 232, 095440621773555. [Google Scholar] [CrossRef]
  64. Yong, J. Resrarch on the Kinematics simulation of out-moving jaw crusher based on Nastran. Appl. Mech. Mater. 2013, 433–435, 63–66. [Google Scholar] [CrossRef]
  65. Liang, J.T.; Zhao, S.D.; Zhao, Y.Q.; Zhu, M.Z. Hybrid-loop servo control system of double toggle mechanical press for flexible forming process based on sliding mode control and neural network techniques. Proc. Inst. Mech. Eng. Part I J. Syst. Control. Eng. 2016, 230, 35–45. [Google Scholar] [CrossRef]
  66. Legendre, D.; Zevenhoven, R. Assessing the energy efficiency of a jaw crusher. Energy 2014, 74, 119–130. [Google Scholar] [CrossRef]
  67. Bhatawdekar, R.M.; Singh, T.N.; Tonnizam Mohamad, E.; Armaghani, D.J.; Binti Abang Hasbollah, D.Z. River Sand Mining Vis a Vis Manufactured Sand for Sustainability. In Proceedings of the International Conference on Innovations for Sustainable and Responsible Mining; Lecture Notes in Civil Engineering; Springer: Cham, Switzerland, 2021; pp. 143–169. [Google Scholar]
  68. Eddie, G.-H.; Ahmed, S.; Semaan, A. Design and modeling of a six-bar mechanism for repetitive tasks with symmetrical end effector motion. Eng. Technol. Appl. Sci. Res. 2024, 14, 16302–16310. [Google Scholar] [CrossRef]
  69. Figliolini, G.; Lanni, C.; Tomassi, L. First- and Second-Order Centrodes of Both Coupler Links of Stephenson III Six-Bar Mechanisms. Machines 2025, 13, 93. [Google Scholar] [CrossRef]
  70. Rishmany, J.; Imad, R. Finite Element and Multibody Dynamics Analysis of a Ball Mill Glass Crusher. Model. Simul. Eng. 2023, 2023, 1–17. [Google Scholar] [CrossRef]
  71. Xiong, Y.; Gan, J.; Chen, W.; Ou, T.; Zhao, G.; Wu, D. Application of Multibody Dynamics and Bonded-Particle GPU Discrete Element Method in Modelling of a Gyratory Crusher. Minerals 2024, 14, 774. [Google Scholar] [CrossRef]
  72. Yang, Z.; Zhang, K.; Zhang, Y.; An, J. Discrete Element Method–Multibody Dynamics Coupling Simulation and Experiment of Rotary Tillage and Ridging Process for Chili Pepper Cultivation. Agronomy 2024, 14, 446. [Google Scholar] [CrossRef]
  73. Plamadeala, O. Studiul și analiza procesului tehnologic de concasare pentru determinarea parametrilor optimali de lucru ai concasorului. Ph.D. Thesis, Universitatea Tehnică a Moldovei Republica Moldova, Chişinău, Moldova, 2022. [Google Scholar]
  74. Frank, O.M.; Mwenje, M.S.; Masinde, M.D. Analysis of the single toggle jaw crusher kinematics. J. Eng. Des. Technol. 2015, 13, 213–239. [Google Scholar] [CrossRef]
  75. Golikov, N.S.; Timofeev, I.P. Determination of capacity of single-toggle jaw crusher, taking into account parameters of kinematics of its working mechanism. Int. Conf. Inf. Technol. Bus. Ind. 2018, 2018 Pt 1–4, 1015. [Google Scholar] [CrossRef]
  76. Kemper, D.; Fimbinger, E.; Antretter, T.; Egger, M.; Flachberger, H. Impact crusher kinematics: The dynamics of an impact swing mechanism as an analytical-mathematical model. Results Eng. 2024, 21, 101694. [Google Scholar] [CrossRef]
  77. Technologies, H. Roberts Animator. Available online: http://www.aes.nu/1-5softprod.htm (accessed on 30 May 2025).
  78. Macho, E.; Urízar, M.; Petuya, V.; Hernández, A. Improving Skills in Mechanism and Machine Science Using GIM Software. Appl. Sci. 2021, 11, 7850. [Google Scholar] [CrossRef]
  79. Petuya, V.; Macho, E.; Altuzarra, O.; Pinto, C.; Hernandez, A. Educational software tools for the kinematic analysis of mechanisms. Comput. Appl. Eng. Educ. 2014, 22, 72–86. [Google Scholar] [CrossRef]
  80. Mosnegutu, E.; Barsan, N.; Chitimus, D.; Ciubotariu, V.; Bibire, L.; Mirilă, D.; Jasiński, M.; Sporea, N.; Petre, I.C. Kinematic Analysis of the Jaw Crusher Drive Mechanism: A Different Mathematical Approach. Processes 2025, 13, 2226. [Google Scholar] [CrossRef]
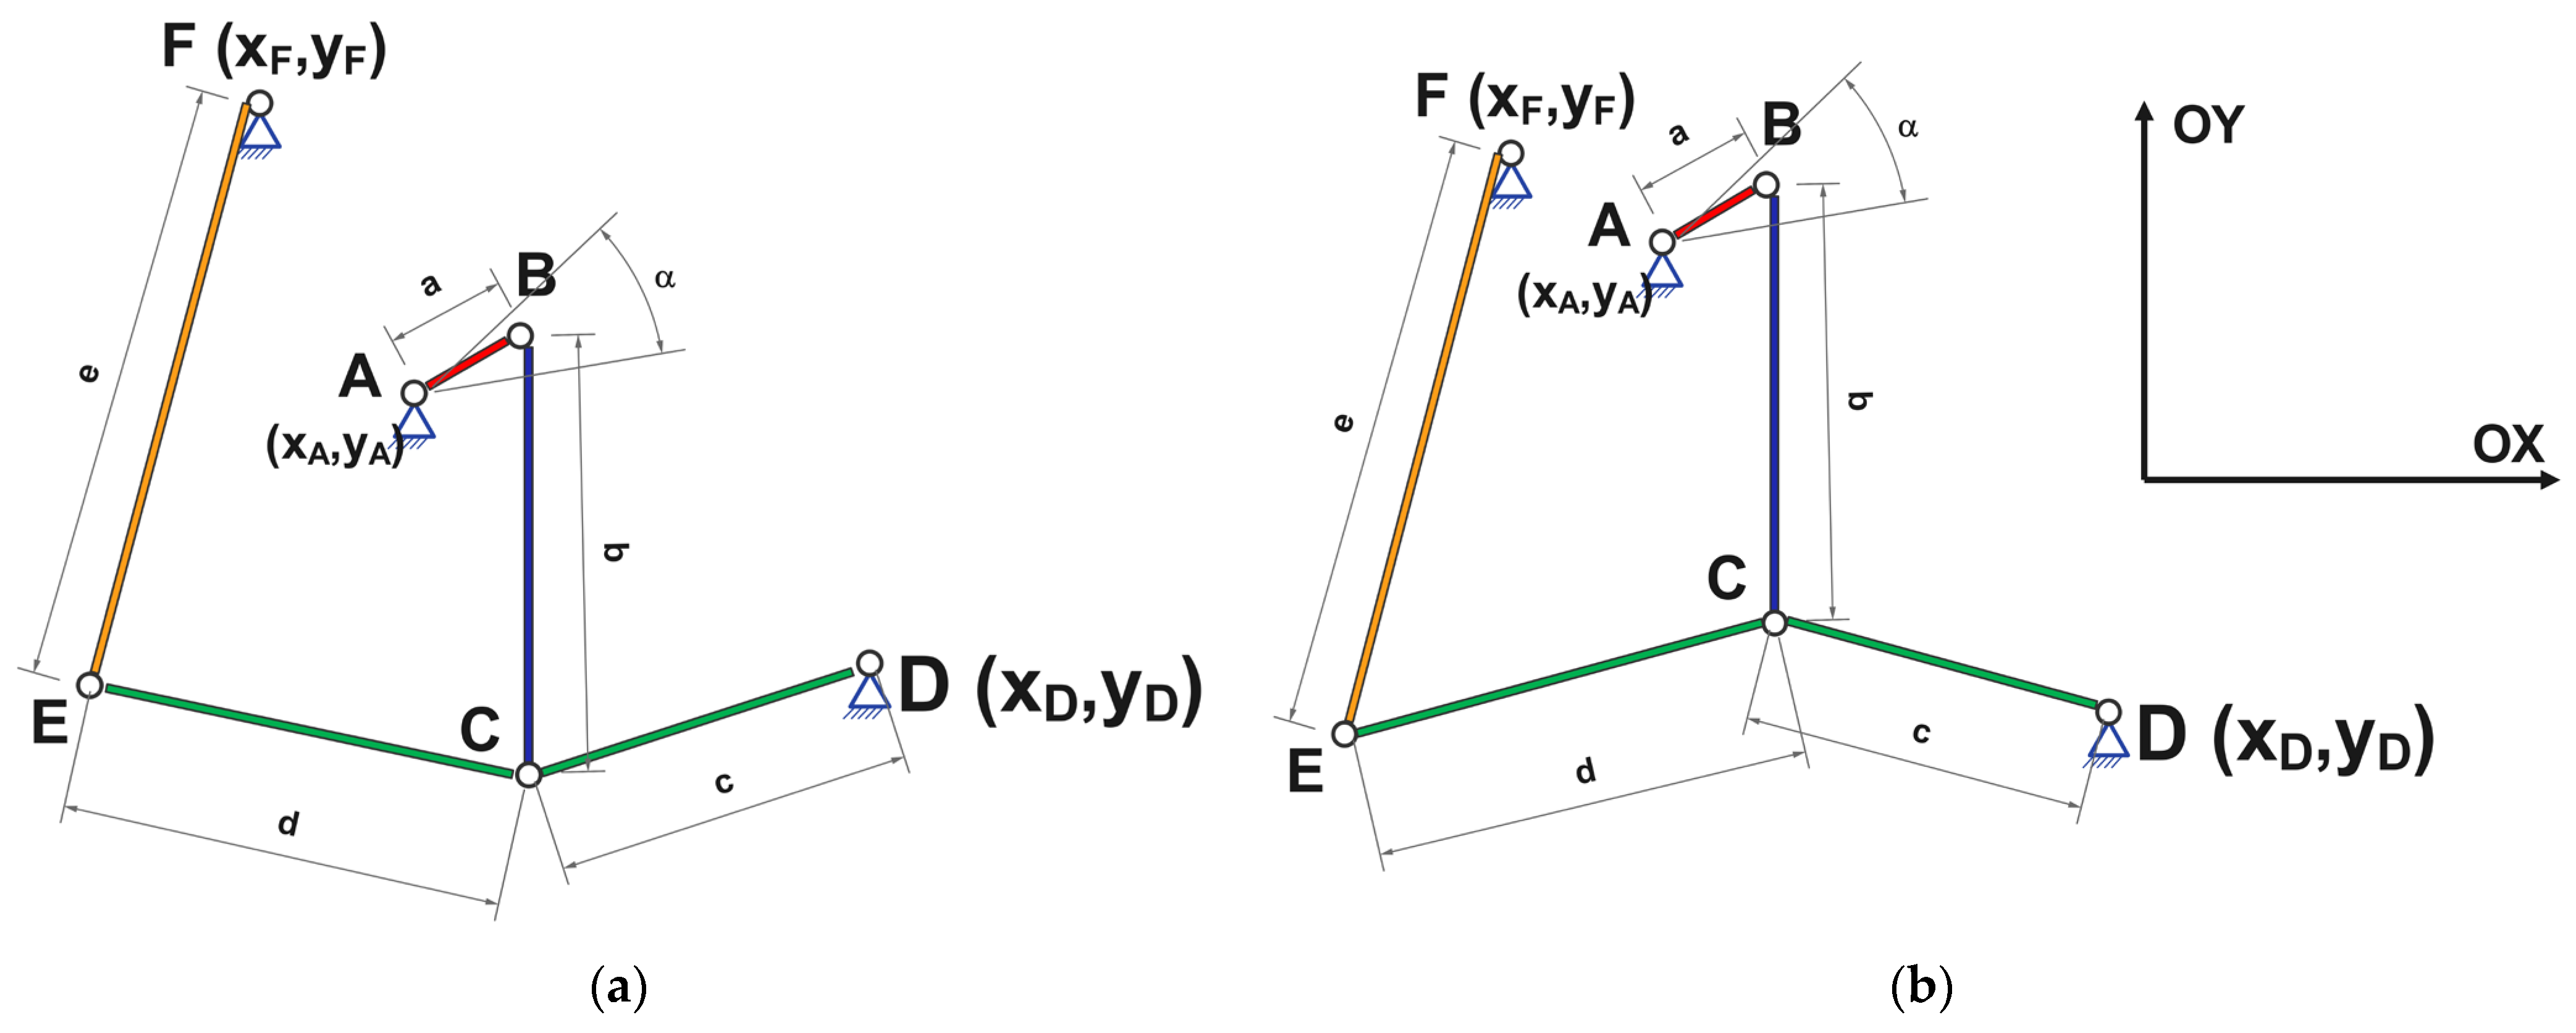
Figure 1. Presentation of the types of drive systems for the motion of the movable jaw: (a) pull-type; (b) push-type.
Processes 13 02498 g001
Figure 2. Presentation of the variation of angle ϕ relative to the horizontal axis, corresponding to the jaw crusher configuration shown in Figure 1a.
Processes 13 02498 g002
Figure 3. Methodological framework.
Processes 13 02498 g003
Figure 4. Variation in the coordinates of mobile joint C: (a) coordinates along the OX axis for the first drive system; (b) coordinates along the OY axis for the first drive system; (c) coordinates along the OX axis for the second drive system; (d) coordinates along the OY axis for the second drive system.
Processes 13 02498 g004
Figure 5. Variation in the linear velocity corresponding to the drive system presented in Figure 1a: (a) for joint C; (b) for joint E.
Processes 13 02498 g005
Figure 6. Variation in the linear velocity corresponding to the drive system presented in Figure 1b: (a) for joint C; (b) for joint E.
Processes 13 02498 g006
Figure 7. Variation in the linear velocity for the extreme positions of angle ϕ in the drive system presented in Figure 1a: (a) for joint C; (b) for joint E.
Processes 13 02498 g007
Figure 8. Variation in the linear velocity for the extreme positions of angle ϕ in the drive system presented in Figure 1b: (a) for joint C; (b) for joint E.
Processes 13 02498 g008
Figure 9. Variation in the average linear velocity for the two drive systems as a function of angle ϕ.
Processes 13 02498 g009
Figure 10. Variation in the linear velocity as a function of the position of element BC, corresponding to the drive system presented in Figure 1a: (a) for joint C; (b) for joint E.
Processes 13 02498 g010
Figure 11. Variation in the linear velocity as a function of the position of element BC, corresponding to the drive system presented in Figure 1b: (a) for joint C; (b) for joint E.
Processes 13 02498 g011
Figure 12. Presentation of the crank angles corresponding to the two working positions of the crusher for (a) the system corresponding to Figure 1a, and (b) the system corresponding to Figure 1b.
Processes 13 02498 g012
Figure 13. Linear velocity variation for the drive system shown in Figure 1a for three different values of angle ϕ: (a) 40°; (b) 85; (c) 130°.
Processes 13 02498 g013
Figure 14. Linear velocity variation for the drive system shown in Figure 1b for three different values of angle ϕ: (a) 40°; (b) 85; (c) 130°.
Processes 13 02498 g014
Disclaimer/Publisher’s Note: The statements, opinions and data contained in all publications are solely those of the individual author(s) and contributor(s) and not of MDPI and/or the editor(s). MDPI and/or the editor(s) disclaim responsibility for any injury to people or property resulting from any ideas, methods, instructions or products referred to in the content.