1. Introduction
With the acceleration of natural gas exploration and development, the Xinjiang Oilfield has made substantial progress in the southern margin of the Junggar Basin. The first 100-billion-cubic-meter natural gas area in the Hutubi structural belt is undergoing rapid appraisal and development [
1]. Among them, three wells in the HT1 Well Area have shown long-term stable production performance, marking a significant breakthrough for the Xinjiang Oilfield in the field of natural gas exploration and development [
2,
3].
The southern margin block of the Xinjiang Oilfield is characterized as a typical ultra-deep, high-temperature, and high-pressure condensate gas reservoir, with wellhead pressures reaching up to 130 MPa. To ensure the safe operation of pipelines, a multi-stage throttling method is used on-site to reduce the wellhead pressure. The post-throttling temperature and pressure at the wellhead are key parameters in the entire gathering and transportation system, critically influencing hydrate prediction, pipeline material selection, and production regime design [
4]. However, due to the presence of heavy components in high-pressure condensate gas, there are large deviations in critical parameters, resulting in complex throttling behavior and an unclear throttling mechanism [
5]. Therefore, there is an urgent need to study the temperature drop characteristics of ultra-high-pressure condensate gas during throttling to reveal the changing laws of key parameters, such as pressure and temperature, in the throttling system during production. This will provide the necessary theoretical basis for the design of high-pressure throttling processes at the wellhead of ultra-high-pressure gas wells.
Many scholars have conducted fruitful research on the throttling mechanism at the wellhead of high-pressure gas wells. Jiang et al. [
6] developed a three-dimensional cage-and-sleeve throttling valve model to predict temperature and pressure fields within the valve, thereby preventing hydrate formation and ensuring safe production. Li et al. [
7] used numerical simulation to investigate the cooling and condensation temperature drop characteristics of natural gas inside the throttling valve. Shoghl et al. [
8] used CFD modeling to study the single-phase flow of hydrocarbons during throttling, predicting the Joule–Thomson behavior and the associated temperature and pressure changes of natural gas and various pure gases. Li et al. [
9] developed a condensation model for the throttling process using CFD, examining the temperature variations and condensation characteristics during throttling, as well as the influence of condensation latent heat on the flow, thereby ensuring the safety of natural gas transmission systems. Tay et al. [
10] used numerical simulation methods to study the potential of the Joule–Thomson cooling effect in natural gas dehydration. Zhang et al. [
11] employed CFD numerical simulation to investigate the throttling characteristics of natural gas in a throttling valve, discussing its throttling performance and the hydrate formation resulting from temperature variations. He et al. [
12] employed numerical simulation to model the gas–liquid two-phase flow in a nozzle, investigating how upstream temperature and pressure, as well as the gas–liquid ratio, affect the flow characteristics. However, due to the complex composition of ultra-high-pressure condensate gas, the aforementioned numerical simulation methods struggle to accurately characterize each component’s concentration, which significantly impairs the accuracy of predicted throttling temperature and pressure.
To improve the precision of natural-gas throttling temperature-drop calculations, some researchers have proposed constructing mathematical models to compute the temperature drop after throttling. Tarom et al. [
13] constructed an analytical model based on correction factors, considering the effects of gas specific gravity, temperature, and pressure, to predict the JT coefficient with high accuracy under unknown component conditions, thereby indirectly solving for the throttling temperature drop. Sokovnin et al. [
14] established a two-stage pressure reduction mathematical model, derived the gas temperature variation at key sections, and proposed an optimal control method to prevent hydrate formation. Li et al. [
15] conducted a numerical study on the Joule–Thomson (JT) coefficient of natural gas under different hydrogen blending ratios, investigating the throttling temperature drop characteristics of natural gas with varying hydrogen content. Luo et al. [
16] proposed a method for predicting the temperature drop of superhigh-pressure sulfur-containing natural gas, combining the enthalpy-conserved throttling model with the mixing rule of the Lee-Kesler Equation of state (EoS). Li et al. [
17] selected the LK equation to calculate the enthalpy of natural gas, which is more accurate compared to the BWRS, PR, and SRK equations. Compared with numerical simulation methods, constructing a mathematical model based on the principle of equal total enthalpy before and after throttling yields a more accurate calculation of the post-throttling temperature. In the cited literature, Luo et al. [
16] and Li et al. [
17] both calculate the throttling temperature drop of wellhead natural gas; however, they do not account for the effects of ultra-high pressure or for the heavy fractions and water content in condensate oil. As a result, their models deviate when predicting the throttling temperature drop of ultra-high-pressure condensate gas. The present study incorporates these heavy-fraction and water-content effects to improve the model’s accuracy.
In summary, this study not only characterizes the throttling-induced temperature drop but also demonstrates how the resulting data can guide field operating practices. First, by fully accounting for the effects of heavy fractions and water content under ultra-high-pressure conditions, we develop and validate a mathematical model that quantitatively describes the evolution of wellhead temperature. Second, we subject the model outputs to systematic statistical and sensitivity analyses, identifying inlet pressure, inlet temperature, and gas-production rate as the primary controlling factors. On this basis, we offer engineering recommendations for choke-step optimisation, hydrate mitigation strategies, and production-parameter tuning, thereby providing a robust scientific basis for the safe and efficient operation of ultra-high-pressure gas wells.
2. Methodology
Key thermophysical properties of ultra-high-pressure condensate gas, such as the compressibility factor and enthalpy, can be calculated using equations of state. However, due to the presence of heavy components in condensate gas, the critical parameters often deviate significantly, leading to limitations in the predictive accuracy of existing equations of state. Therefore, it is necessary to introduce an enthalpy calculation method that accounts for the influence of heavy components and water under ultra-high-pressure conditions. Additionally, an optimal mixing rule should be selected to establish a numerical model for calculating the throttling temperature drop in ultra-high-pressure condensate gas, incorporating the effects of both heavy components and water.
2.1. Selection of Equation of State
The ultra-high-pressure condensate-gas throttling model is founded on the equality of total enthalpy before and after throttling. Studies [
16,
17] show that the gas compressibility factor—by accounting for real gas non-idealities—is essential for accurate enthalpy calculations, and its precise determination refines thermodynamic predictions. Accordingly, this work prioritizes the accuracy of compressibility-factor computation when selecting the equation of state to ensure the model’s predictive precision.
The compressibility factor of natural gas is commonly calculated using four types of equations of state: Redlich–Kwong (RK), Peng–Robinson (PR), Lee–Kesler (LK), and Soave–Redlich–Kwong (SRK) [
18]. When applying the RK, PR, and SRK equations, the cubic equation of state approach is used. In contrast, the application of the LK Equation requires incorporation of the three-parameter corresponding states principle [
19].
The RK, SRK, and PR equations are all cubic equations of state and can be uniformly expressed as follows [
20]:
In Equations (1) and (2),
Z is the compressibility factor, dimensionless; R is the gas constant, 8314 J/(kg·mol);
pc is the critical pressure of the fluid, Pa;
Tc is the critical temperature, K;
w is the acentric factor;
Tr is the reduced temperature,
T/
Tc; and
fω is the correction factor, as referenced in literature [
21,
22]. The coefficients for the three cubic equations of state are shown in
Table 1.
The form of the LK Equation is as follows [
23]:
where
vr represents the specific volume of the reference fluid, and
v represents the molar volume of the reference fluid, in m
3/mol.
where
b1,
b2,
b3,
c1,
c2,
c3,
c4,
d1,
d2,
β, and
γ are parameters obtained from experiments, and their values need to be referenced from the literature [
23].
The condensate gas samples from HT1 and TW1 Wells were calculated using four equations of state, RK, PR, LK, and SRK, with pressures and temperatures of 145.15 MPa, 159.63 °C and 171.78 MPa, 170.1 °C, respectively.
Table 2 and
Table 3 present the natural gas compositions for wells HT1 and TW1, respectively.
The calculated results of the compressibility factor were compared with the measured results, as shown in
Table 4 and
Table 5.
By comprehensively comparing the measured PVT compressibility factor values and the calculation results from the four equations of state for both wells, the LK Equation exhibited the smallest calculation error, with relative errors of only 4.65% and 1.52%. Therefore, the LK Equation was selected to calculate the physical property parameters of ultrahigh-pressure condensate gas.
2.2. Enthalpy Calculation Method for Ultra-High-Pressure Condensate Gas
Many researchers have shown that the LK Equation, proposed by Lee B.I. and Kesler M.G. [
24] based on the corresponding states principle, is the most accurate equation for calculating enthalpy differences. This equation is also recommended by the API Data Handbook [
17] as the standard method for enthalpy difference calculation. Based on the three-parameter corresponding states principle, the enthalpy calculation method represented by the LK Equation is shown in Equation (7) [
25]:
where
h0 represents the enthalpy of the ideal gas, in J/kg;
M is the molar mass of the gas, in g/mol; and
Fh is the effect of pressure on the enthalpy of the actual fluid, dimensionless.
where
represents the effect of pressure on the enthalpy of a simple fluid, dimensionless; and
represents the effect of pressure on the enthalpy of the reference fluid, dimensionless.
where, when Equation (9) is applied to a simple fluid,
i = 0; and when Equation (9) is applied to the reference fluid,
i =
h.
where
h0 represents the enthalpy of the ideal gas in J/kg;
Ah,
Bh,
Ch,
Dh,
Eh, and
Fh are the correlation coefficients.
For the heavy components Cn+ in condensate gas, if their physical property parameters cannot be measured, they need to be characterized by treating them as multiple components and then calculating the required physical property parameters. If the physical property parameters are measured, the following method can be used for calculation.
For the liquid phase composition of the heavy components in condensate gas, the enthalpy calculation method is shown in Equation (12) [
25]:
In Equation (12),
HL represents the liquid phase enthalpy, in J/kg.
where
K is the characteristic coefficient of the component, dimensionless; and
γ is the relative density of the component, in kg/m
3.
For the gas phase composition of the heavy components in condensate gas, the enthalpy calculation method is shown in Equation (14) [
24].
where
H represents the gas phase enthalpy, in J/kg;
H* is the liquid phase enthalpy at
Tr = 0.8, in J/kg; and
FH is the pressure-related enthalpy factor, dimensionless.
For the enthalpy calculation of water in super-high-pressure condensate gas, this paper applies the IAPWS-IF97 equation, which provides methods for calculating parameters such as the specific enthalpy, saturation vapor pressure, and heat capacity of water and steam [
26]. This equation has become the international standard for calculating the thermophysical properties of water. The enthalpy calculation method under high-pressure conditions is shown in Equations (16)–(18) [
27].
where
n,
I,
J,
ni, and
Ji are characteristic values obtained from reference [
27], dimensionless.
2.3. Calculation of Virtual Critical Parameters for Mixtures
The enthalpy is typically calculated based on the LK Equation by first determining the enthalpy of an ideal gas and then using a pseudo-critical method to correct the enthalpy of the mixed gas. When calculating, virtual critical parameters are used to replace the actual critical parameters of the fluid, and mixing rules are applied for the calculation. This paper optimizes four mixing rules: Van der Waals, Wong–Sandler, Plocker–Knapp, and Lee–Kesler, and introduces the Prausnitz–Gunn virtual critical pressure calculation rule to improve calculation accuracy [
28]. Among these, the Wong–Sandler and Prausnitz–Gunn mixing calculation methods are shown in Equations (19)–(21) [
18].
where
yi represents the mole fraction of component
i;
Tcm is the virtual critical temperature of the mixture, in K;
Pcm is the virtual critical pressure of the mixture, in Pa;
vcm is the virtual critical molar volume of the mixture, in m
3/mol; and
vci is the critical molar volume of component
i, in m
3.
where
wi represents the acentric factor of component
i; and
wm is the acentric factor of the mixture.
The Prausnitz–Gunn virtual critical pressure calculation method is shown in Equation (23) [
29].
where
zci represents the critical compressibility factor of component
i, dimensionless; and
Mi is the molar mass of component
i, in g/mol.
Using the four mixing rules and introducing the virtual critical pressure to calculate the temperature after throttling at TW1 Well, the results are shown in
Table 6.
Table 6 lists the pseudocritical temperatures and pseudocritical pressures calculated using various mixing rules. It was found that the pseudocritical temperature T
cm directly affects the compressibility factor and the Joule–Thomson coefficient, and that the Prausnitz–Gunn pseudocritical pressure must be determined based on T
cm. Consequently, the cooling model is highly sensitive to T
cm; a ±5% deviation in T
cm leads to an approximately ±3.2% change in the throttled temperature.
Moreover,
Table 6 shows that the throttled temperature calculated using the Wong–Sandler + Prausnitz–Gunn mixing rule exhibits the smallest relative error compared to experimental values—only 0.27%. Therefore, the Wong–Sandler + Prausnitz–Gunn mixing rule was selected in this study for its superior predictive accuracy.
2.4. Model Solution
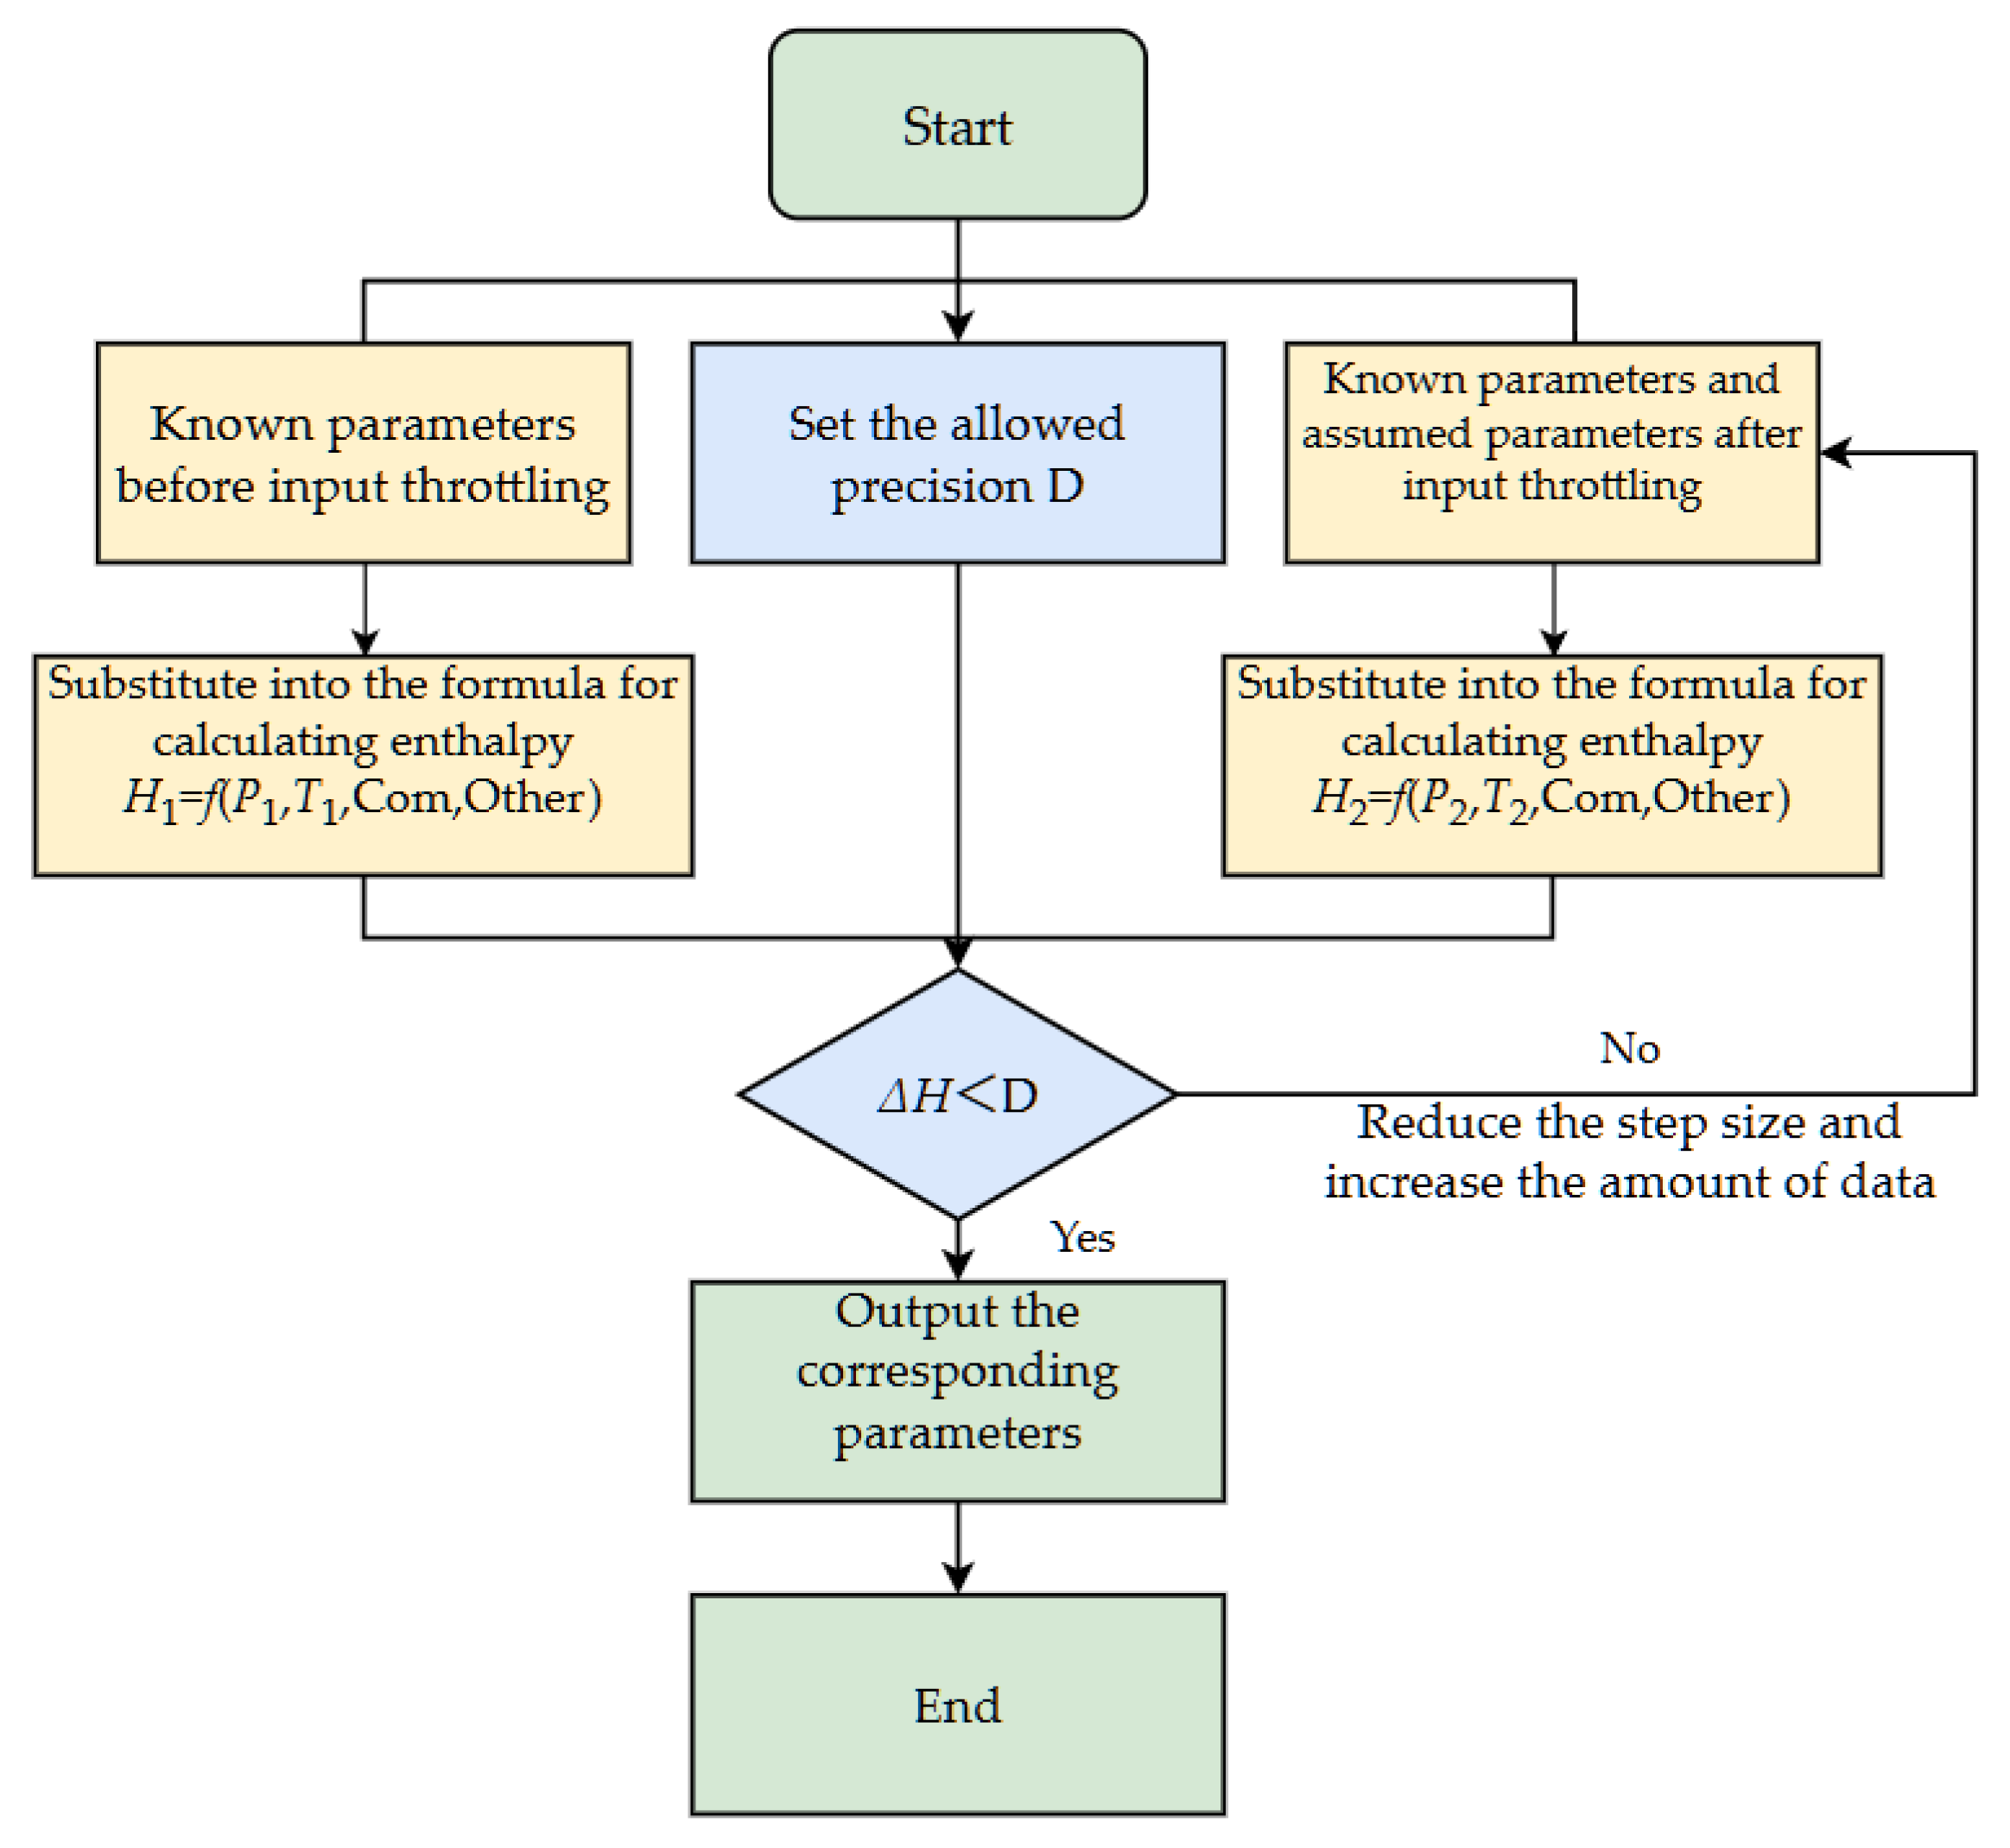
As mentioned above, the mathematical model for solving the temperature drop during throttling of super-high-pressure condensate gas is mainly based on the equation of state for super-high-pressure condensate gas, enthalpy calculation of super-high-pressure condensate gas, enthalpy calculation of condensate gas heavy components and water, and the principle of equal total enthalpy before and after throttling. The solution must follow specific steps. The specific solution steps are as follows:
Step 1: Input the temperature and pressure of the super-high-pressure condensate gas before throttling.
Step 2: Input the gas, oil, and water production rates before throttling. If these parameters are unknown, they can be calculated based on the temperature and pressure before throttling.
Step 3: Calculate the enthalpy values of each component before throttling and compute the total enthalpy H1 using the mixing rule.
Step 4: Input the estimated temperature value and the pressure after throttling.
Step 5: Based on the temperature and pressure after throttling, calculate the mass fractions of the gas and liquid phases.
Step 6: Calculate the enthalpy values of each component after throttling and compute the total enthalpy H2 using the mixing rule.
Step 7: Compare the total enthalpies before and after throttling, H1 and H2. If H1 > H2, increase the estimated temperature after throttling; if H1 < H2, decrease the estimated temperature after throttling.
Step 8: If ΔH = (H1 − H2) < 0.1, output the result, which is the temperature after throttling.
To facilitate understanding of the entire solving process, a calculation flowchart is provided as shown in
Figure 1.
2.5. Verification of Model Calculation Accuracy
HT1 Well is a typical ultra-high-pressure condensate gas well. A two-stage throttling process is employed on site to reduce the gas pressure. The pressure before throttling exceeds 80 MPa, with a temperature above 70 °C. After the first-stage throttling, the pressure is approximately 40 MPa, and after the second-stage throttling, it is around 11 MPa. To characterize the accuracy of the calculation results, the relative error between the calculated value and the field-measured value is defined as shown in Equation (24):
where
ε represents the relative error; and
ηc and
ηe denote the calculated and experimental temperatures after throttling, respectively.
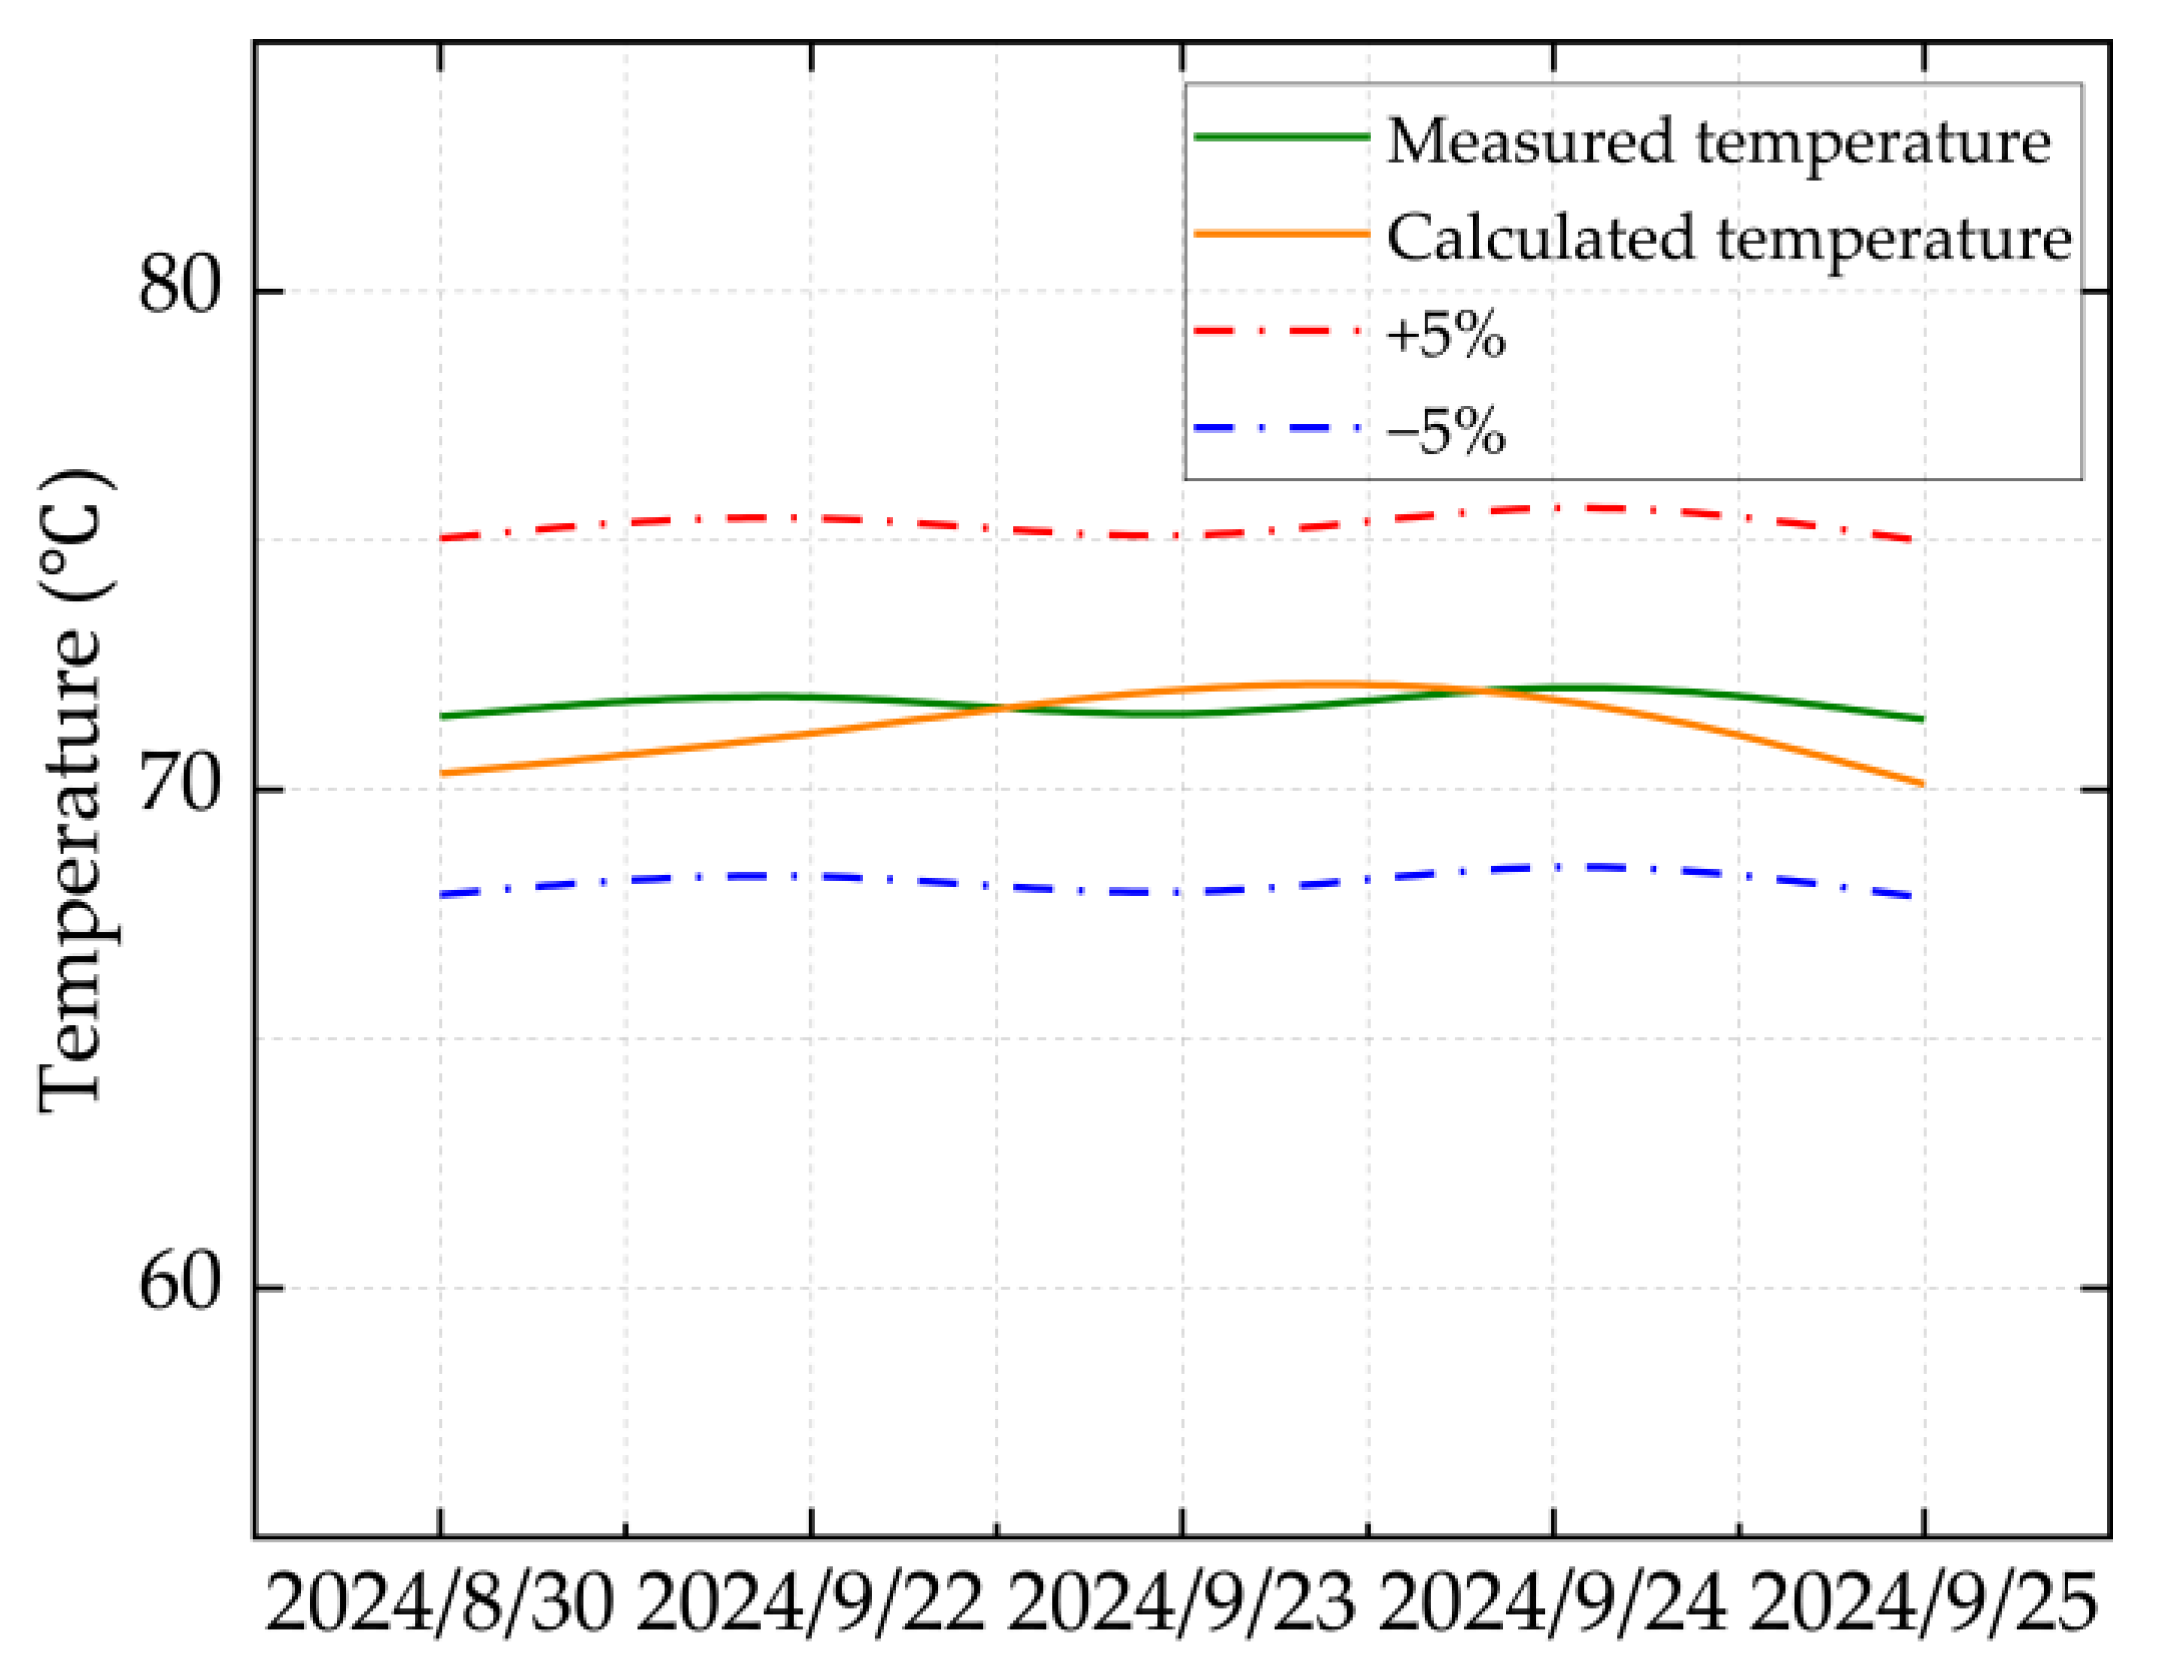
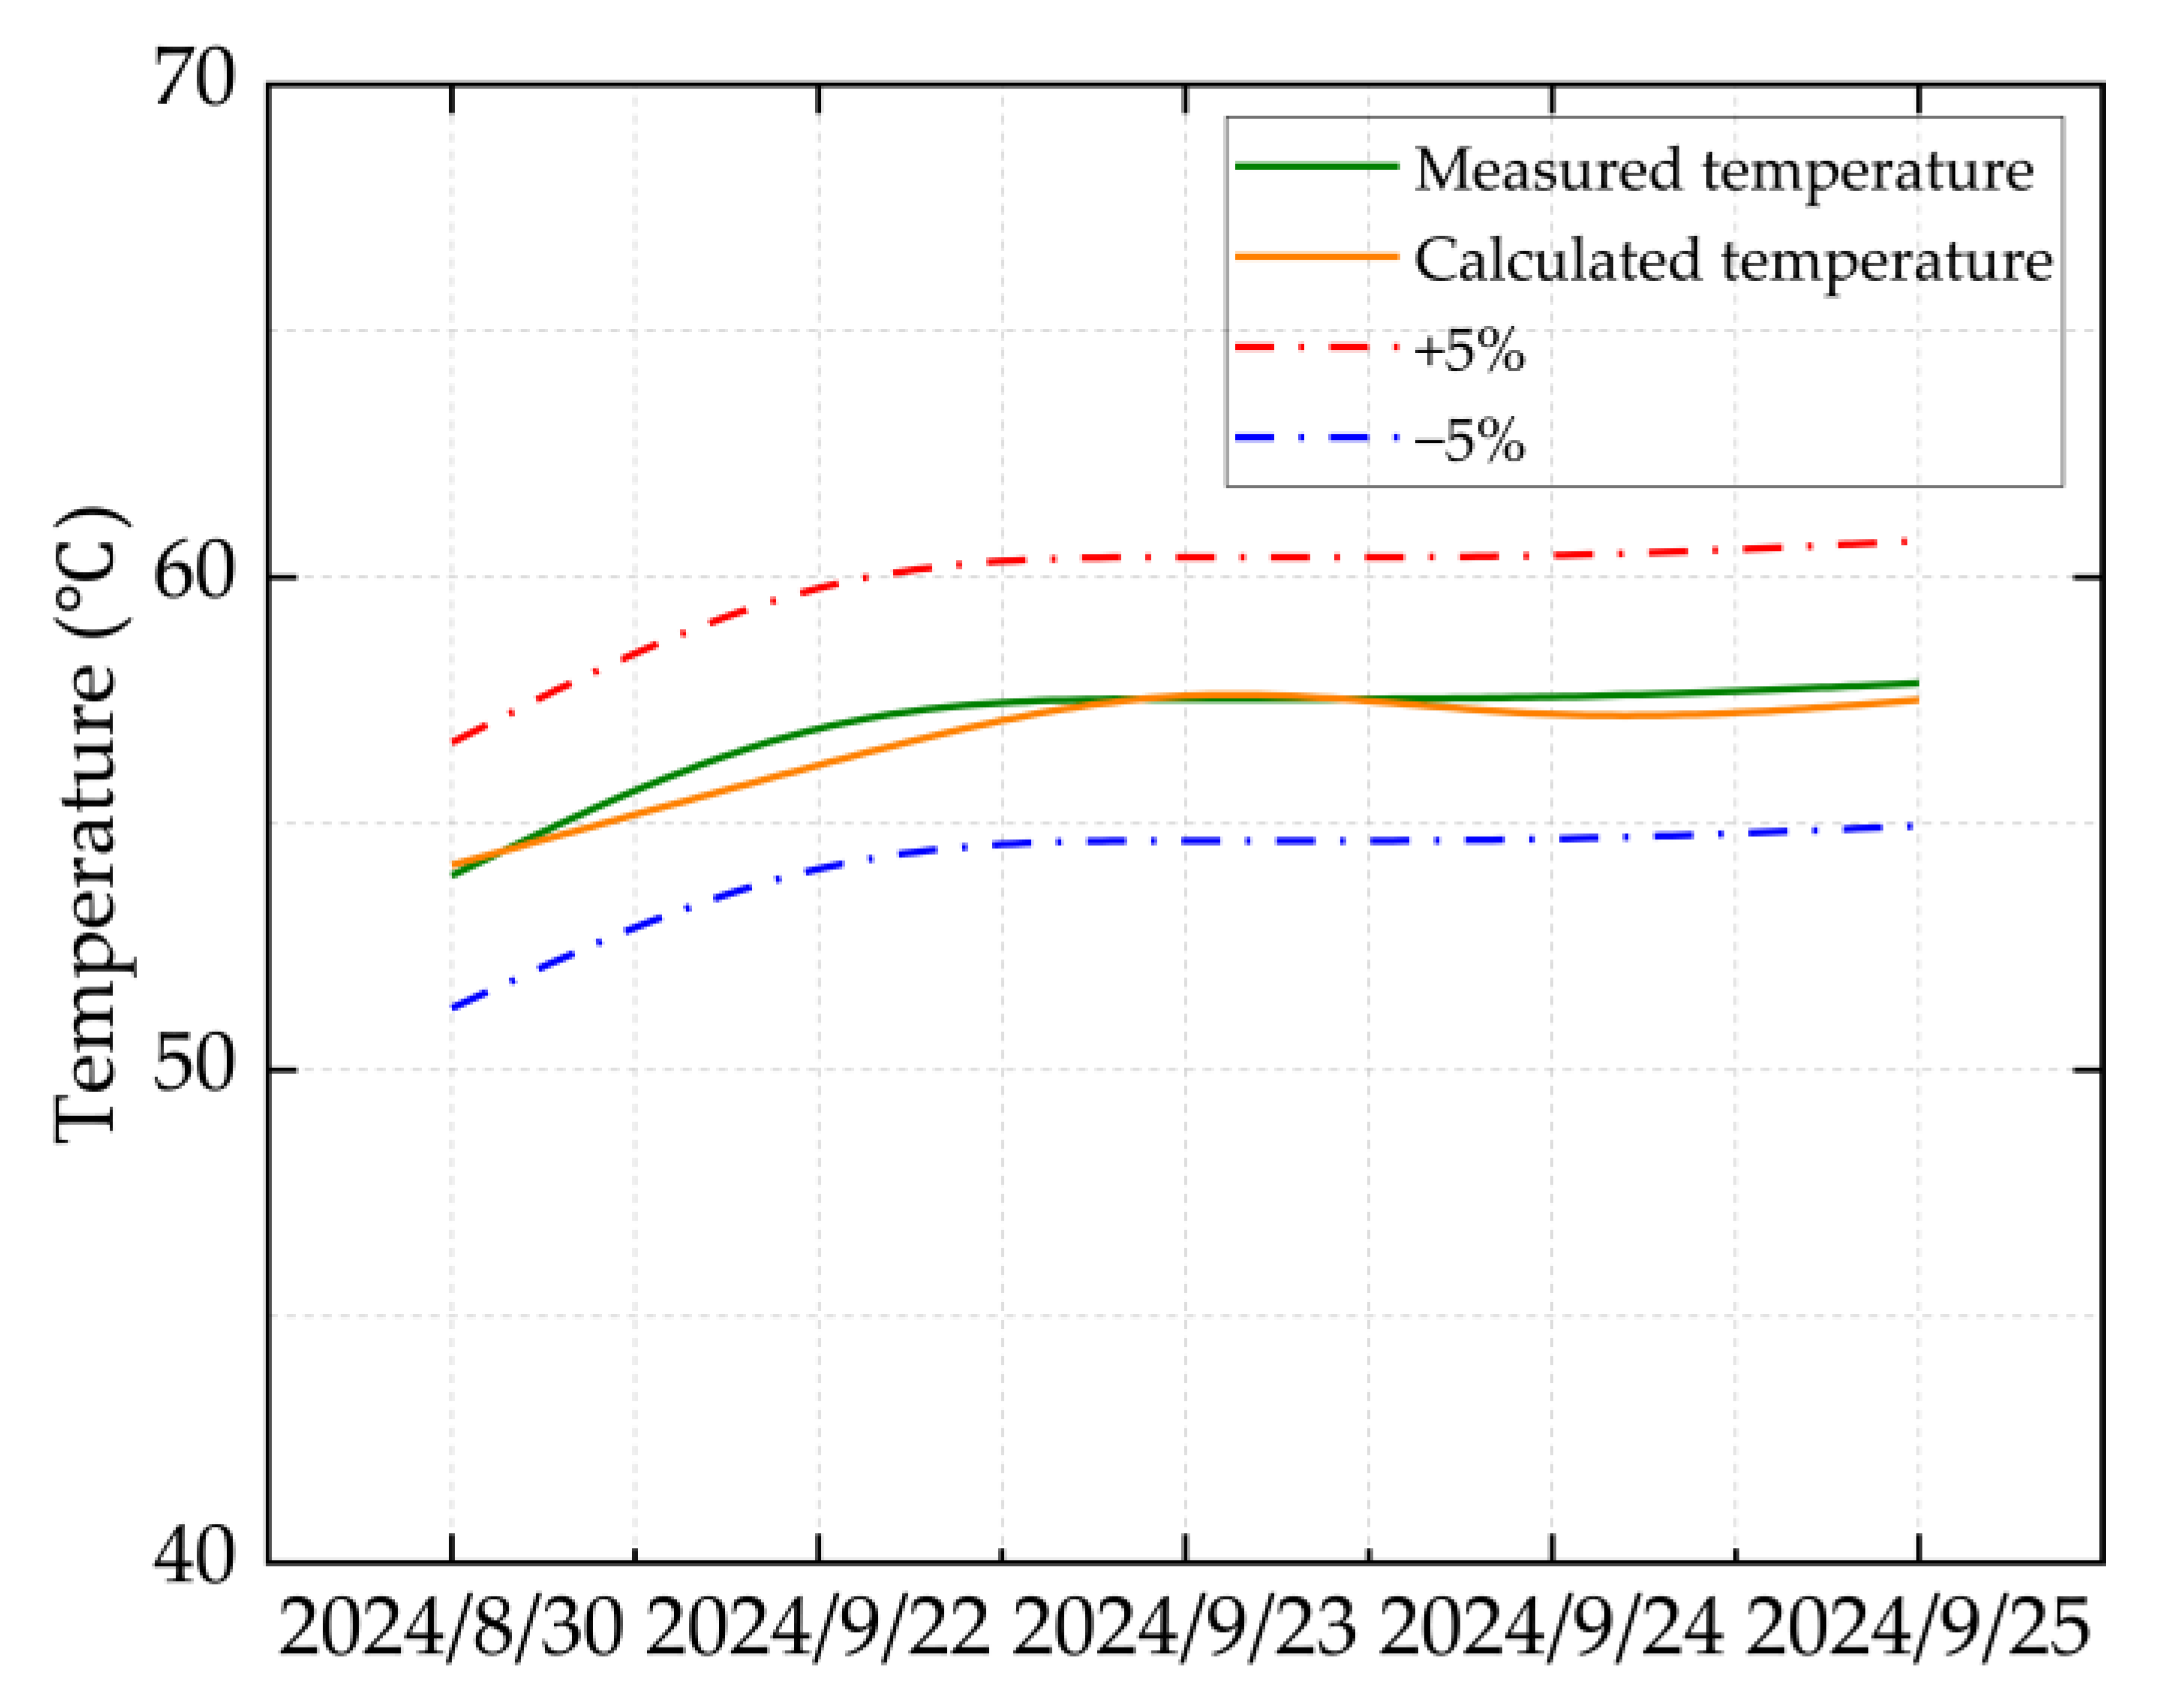
Based on the production reports of HT1 Well from 30 August to 25 September 2024, the field-measured values are compared with the calculated values. The comparison results are illustrated in
Figure 2 and
Figure 3.
Figure 2 and
Figure 3 show that the calculation error under all operating conditions is less than 2%, indicating that the ultra-high-pressure condensate gas throttling temperature-drop model developed in this study is highly accurate. In particular, under ultra-high-pressure conditions (wellhead pressure above 100 MPa), the calculated results are especially precise.
Meanwhile, to demonstrate that the model proposed herein is equally applicable to calculating the temperature drop caused by throttling in other high-pressure condensate gas wells, this study adopts the condensate gas sample from Reference [
17] as the baseline parameters and computes its post-throttling temperature drop. The results are presented in
Table 7.
From
Table 7, using the gas sample from Reference [
17] as the baseline parameters produces a maximum relative error of no more than 3.5% in the calculated post-throttling temperature drop, demonstrating high accuracy. This accuracy results from the fact that the ultra-high-pressure condensate gas throttling temperature-drop model developed in this paper is governed primarily by gas composition. Since most high-pressure and ultra-high-pressure condensate gas wells share similar compositions, consisting mainly of methane and light hydrocarbons with a small amount of heavy components, the model is applicable to the majority of condensate gas wells.
