Article

Thermodynamic Analysis of Biomass Pyrolysis in an Auger Reactor Coupled with a Fluidized-Bed Reactor for Catalytic Deoxygenation

by
Balkydia Campusano
,
Michael Jabbour
,
Lokmane Abdelouahed
and
Bechara Taouk
*
INSA Rouen Normandie, University Rouen Normandie, Normandie University, LSPC UR 4704, Laboratory of Chemical Process Safety, F-76000 Rouen, France
*
Author to whom correspondence should be addressed.
Processes 2025, 13(8), 2496; https://doi.org/10.3390/pr13082496
Submission received: 1 July 2025 / Revised: 25 July 2025 / Accepted: 4 August 2025 / Published: 7 August 2025
(This article belongs to the Section Chemical Processes and Systems)

Abstract

This research contributes to advance the sustainable production of biofuels and provides insights into the energy and exergy assessment of bio-oil, which is essential for developing environmentally friendly energy production solutions. Energy and exergy analyses were performed to evaluate the pyrolysis of beech wood biomass at 500 °C in an Auger reactor. To improve the quality of the obtained bio-oil, its catalytic deoxygenation was performed within an in-line fluidized catalytic bed reactor using a catalyst based on HZSM5 zeolite modified with 5 wt.% Iron (5%FeHZSM-5). A thermodynamic analysis of the catalytic and non-catalytic pyrolysis system was carried out, as well as a comparative study of the calculation methods for the energy and exergy evaluation for bio-oil. The required heat for pyrolysis was found to be 1.2 MJ/kgbiomass in the case of non-catalytic treatment and 3.46 MJ/kgbiomass in the presence of the zeolite-based catalyst. The exergy efficiency in the Auger reactor was 90.3%. Using the catalytic system coupled to the Auger reactor, this efficiency increased to 91.6%, leading to less energy degradation. Calculating the total energy and total exergy of the bio-oil using two different methods showed a difference of 6%. In the first method, only the energy contributions of the model compounds, corresponding to the major compounds of each chemical family of bio-oil, were considered. In contrast, in the second method, all molecules identified in the bio-oil were considered for the calculation. The second method proved to be more suitable for thermodynamic analysis. The novelties of this work concern the thermodynamic analysis of a coupled system of an Auger biomass pyrolysis reactor and a fluidized bed catalytic deoxygenation reactor on the one hand, and the use of all the molecules identified in the oily phase for the evaluation of energy and exergy on the other hand.

1. Introduction

The negative impact of fossil fuels on the environment and their accelerated depletion have stimulated researchers to seek alternative energies or renewable sources of energy. Biomass has been extensively studied for this purpose due to its high abundance, low environmental pollution, and the potential added-value products obtained. Different thermochemical conversion methods can be used to transform biomass, and pyrolysis is one of the most powerful technologies. This technique generates bio-oil and other by-products such as syngas and biochar, even in the absence of air [1,2,3,4,5]. The industrial use of bio-oil derived from biomass pyrolysis depends on its physical and chemical properties, which are influenced by chemical composition, presence of impurities, thermal stability, corrosiveness, and percentage of oxygenated compounds. Indeed, biofuel has a high water content (15–30%), low pH (2–3), and high oxygen content (35–40%) [6]. This high oxygen content will negatively influence its energetic use. In order to replace fossil fuels, deoxygenation through catalytic treatment of bio-oil vapors is needed in order to enhance its characteristics. Artur et al. [7] used a drop-tube reactor for the pyrolysis of agricultural biomasses at 500 °C and obtained bio-oil yields in the range of 49.1–53.2%. The obtained bio-oil had a high acetic acid content, but it can be used in power engineering after hydrodeoxygenation treatment. Fekadu et al. [8] tested other biomasses in the same reactor type at 500 °C and found bio-oil yields in the range 52–67.3%, suggesting that the feedstock composition plays an important role in the obtained yields. Guda et al. [9] tested the effect of different acid catalysts (β-Al2O3, Si-Al catalysts, H-Y, and HZSM-5) on the products of pyrolysis in an Auger reactor at 450 °C. They found that HZSM-5 reduced oxygen content from 46.4% to 30%, classifying this catalyst as one of the most effective for deoxygenation. However, the energy balance of pyrolysis was not provided in their work.
Other researchers have attempted to improve oil quality through multiple successive processes without considering the economic aspect and not performing a thermodynamic study to assess the sustainability of the system. An effective way to carry out a thermodynamic study is through the energy and exergy analysis of the process. Energy analysis is based on the first law of thermodynamics, which is a conservative law. Based on this, the total energy content at the input and output of the system always remains constant, regardless of the forms, so only the quantity is considered. The analysis of exergy, which is based on the second law of thermodynamics, describes the quality of energy, i.e., the useful part of the energy and the degradation of the energy by irreversible conversion. Exergy is defined as the maximum amount of energy capable of generating work when the system is in equilibrium with its environment [10]. This tool allows the determination of energy consumption, energy destruction, and system losses, together with the energy and exergy efficiency, in order to evaluate the sustainability of the overall process [11].
To better understand energy balance, it is important to determine the heat needed to perform the transformation of biomass, known as the heat for pyrolysis. Atsonios et al. [12] showed that 1.12 MJ per kg of dry beech wood was needed in order to perform pyrolysis at 500 °C in a bench-scale pyrolysis reactor. During the pyrolysis of wood sawdust, Elhenawy et al. [1] found that as the temperature increased from 250 to 450 °C in the pyrolysis reactor, the heat required to achieve the target temperature increased from 0.381 to 0.519 MJ per kg of wood dust. Thoharudin et al. [13] showed that the heat of pyrolysis needed during the pyrolysis of beech wood in a fluidized bed reactor at 500 °C is in the range of 1–8 MJ/kgbiomass. This variation depends on the feeding rate and the fluidizing velocity. Peters et al. [14,15] used Aspen Plus to simulate a fast pyrolysis process to produce bio-oil and found that between 30 and 40% of the total exergy entering the pyrolysis process was destroyed. They attributed the inefficiency of the process to the pyrolysis plant, which can be improved by using a biomass with less moisture content, thus increasing the overall performance and lowering exergy destruction. Keedy et al. [16] found that only 7% of the total exergy was destroyed during the pyrolysis of woody biomass between 450 and 500 °C in an Auger feed hopper coupled to a bubbling fluidized bed of quartz sand. In terms of efficiency, Zhou et al. [17] performed microwave-assisted pyrolysis for textile dyeing sludge and furfural residue in an Auger reactor under Nitrogen and Argon flow rates. They found energy and exergy efficiencies of 38.93% and 36.65%, respectively, during textile dyeing sludge pyrolysis, and 82.24% and 81.82%, respectively, during furfural residue pyrolysis at 450 °C. Zhang et al. [18] found that the exergy and energy efficiencies of the plastic mixture pyrolysis in a rotary kiln reactor are in the range of 60.9–67.3% and 59.4–66.0%, respectively. Experiments were performed under inert gas at 500 °C and 6 rpm rotation speed. Hasan et al. [19], during the pyrolysis of waste (branches, trunks, and stumps) in an Auger reactor at a temperature of 550 °C, obtained an overall energy efficiency of 72.89%, and a total exergy efficiency of 68.4%. The rotation speed of the Auger reactor controlled the holding time of the feedstock inside the reactor, working under inert Nitrogen atmosphere. The reasons for the variation in the energy and exergy values are due to uncertainties in mass balance calculations and errors leading to deviations in calculating thermodynamic values [20]. Table 1 summarizes the values recorded in the literature. The experimental factors that provoke energy loss in the system can be uncertainty in the measurement equipment, bio-oil adhering to the condenser walls, unrecoverable gases from the pyrolysis chamber and pipelines, and heat losses [21]. Nevertheless, only a few publications focus on the energetic and exergetic assessment in biomass pyrolysis systems. The bio-oil is a complex mixture of several hundred organic compounds whose composition depends on different operating conditions and feedstock [22]. This makes a detailed thermodynamic analysis of bio-oil concerning each compound difficult. Indeed, some studies reported in the literature consider only a few model molecules to represent the bio-oil or the fraction corresponding to the major molecules present in the bio-oil [14,23].
To make a process competitive and profitable in the market in comparison to other processes, an optimization study is necessary, which may be carried out using thermodynamic analysis. In this work, the results of an energetic and exergetic study of bio-oil production from pyrolysis of beech wood are presented. Two distinct configurations were used for the thermodynamic analysis: a single-stage continuous screw reactor and a two-stage pyrolysis reactor coupled with a fluidized bed catalytic reactor. Since biofuel is a complex mixture of hundreds of organic compounds, a detailed thermodynamic analysis is difficult and requires making the right assumptions and sometimes approximations. In this work, a comparative study of both calculation methods of energetic and exergetic values are also be presented, basing this on (i) only the model compound of each chemical family present in the bio-oil versus (ii) considering all the compounds identified in the bio-oil. To the best of our knowledge, this offers pertinent information in two areas that have not been previously investigated. The first one is the analysis of the energy and exergy efficiency of a pyrolysis system for the production of enhanced bio-oil in a continuous Auger reactor coupled to a catalytic fluidized bed reactor. The second one is the comparison of the two approaches for the bio-oil stream energetic and exergetic assessment. This allows us to assess the applicability and relevance of the energetic and exergetic calculations using the model molecules approach.

2. Experimental Section

2.1. Materials Used

The ETS Lignex Company, Patornay, France supplied the beech wood used in this investigation in powder form, with an average particle size of 400 µm. The particles with sizes ranging from 300 to 500 µm were sieved and separated for use in the pyrolysis experiments. The ultimate and proximate analyses of the raw material are displayed in Table 2. Thermo Fisher’s Flash 2000 element analyzer, Paris, France provided the ultimate analysis according to ASTM D5373 method. The Garcia et al. [24] approach was used to obtain the proximate analysis, which was based on TGA analysis.

2.2. Fe-HZSM-5 Preparation

HZSM-5-based catalysts with different iron loadings were used. The catalysts were prepared using HZSM-5 catalyst, supplied by ACS Materials, with a SiO2/Al2O3 ratio of 38. Modification with iron was performed using the incipient wetness impregnation method. Iron nitrate salt (Fe(NO3)3) was dissolved in deionized water and then added dropwise from a burette to the catalyst support (HZSM-5). The volume of the solution was equal to the pore volume of the catalyst. The metal loadings were around 1.4, 5, and 10 wt.%, respectively. Afterward, the impregnated catalyst was dried overnight at 105 °C and calcined under air for 4 h at 550 °C.

2.3. Pyrolysis Experimental Setup

Pyrolysis runs were performed in a continuous Auger reactor, as presented in Figure 1 and described in our previous work [25]. The dried biomass is injected through the hot zone by rotating the screw, installed inside the reactor and connected to an electric motor. N2 was used to create an inert atmosphere for the pyrolysis reaction and as carrier gas for pyrolysis products. Nitrogen flow rates of 200 mL/min were controlled by two flowmeters. For non-catalytic treatment experiments, pyrolysis vapors at the outlet of the furnace were cooled in a serpentine condenser to a temperature of −5 °C via a thermostatic bath. The condensable part of the pyrolysis vapors was collected at the bottom of the condenser in a recovery flask. The non-condensable part was collected in a sample bag. For catalytic treatment experiments, the vapor leaving the Auger reactor was directed to a fluidized bed catalytic reactor (FBCR), where cracking and deoxygenation reactions in the presence of zeolite-based catalyst (Fe-HZSM-5) takes place.
A char recovery tank was installed at the outlet of the Auger reactor. The tank was maintained at 300 °C in order to avoid the condensation of pyrolysis vapors.
A cyclone, heated to a temperature of 300 °C, was used to prevent the finer catalyst particles from reaching the condensing system by being entrained in the vapor flow.
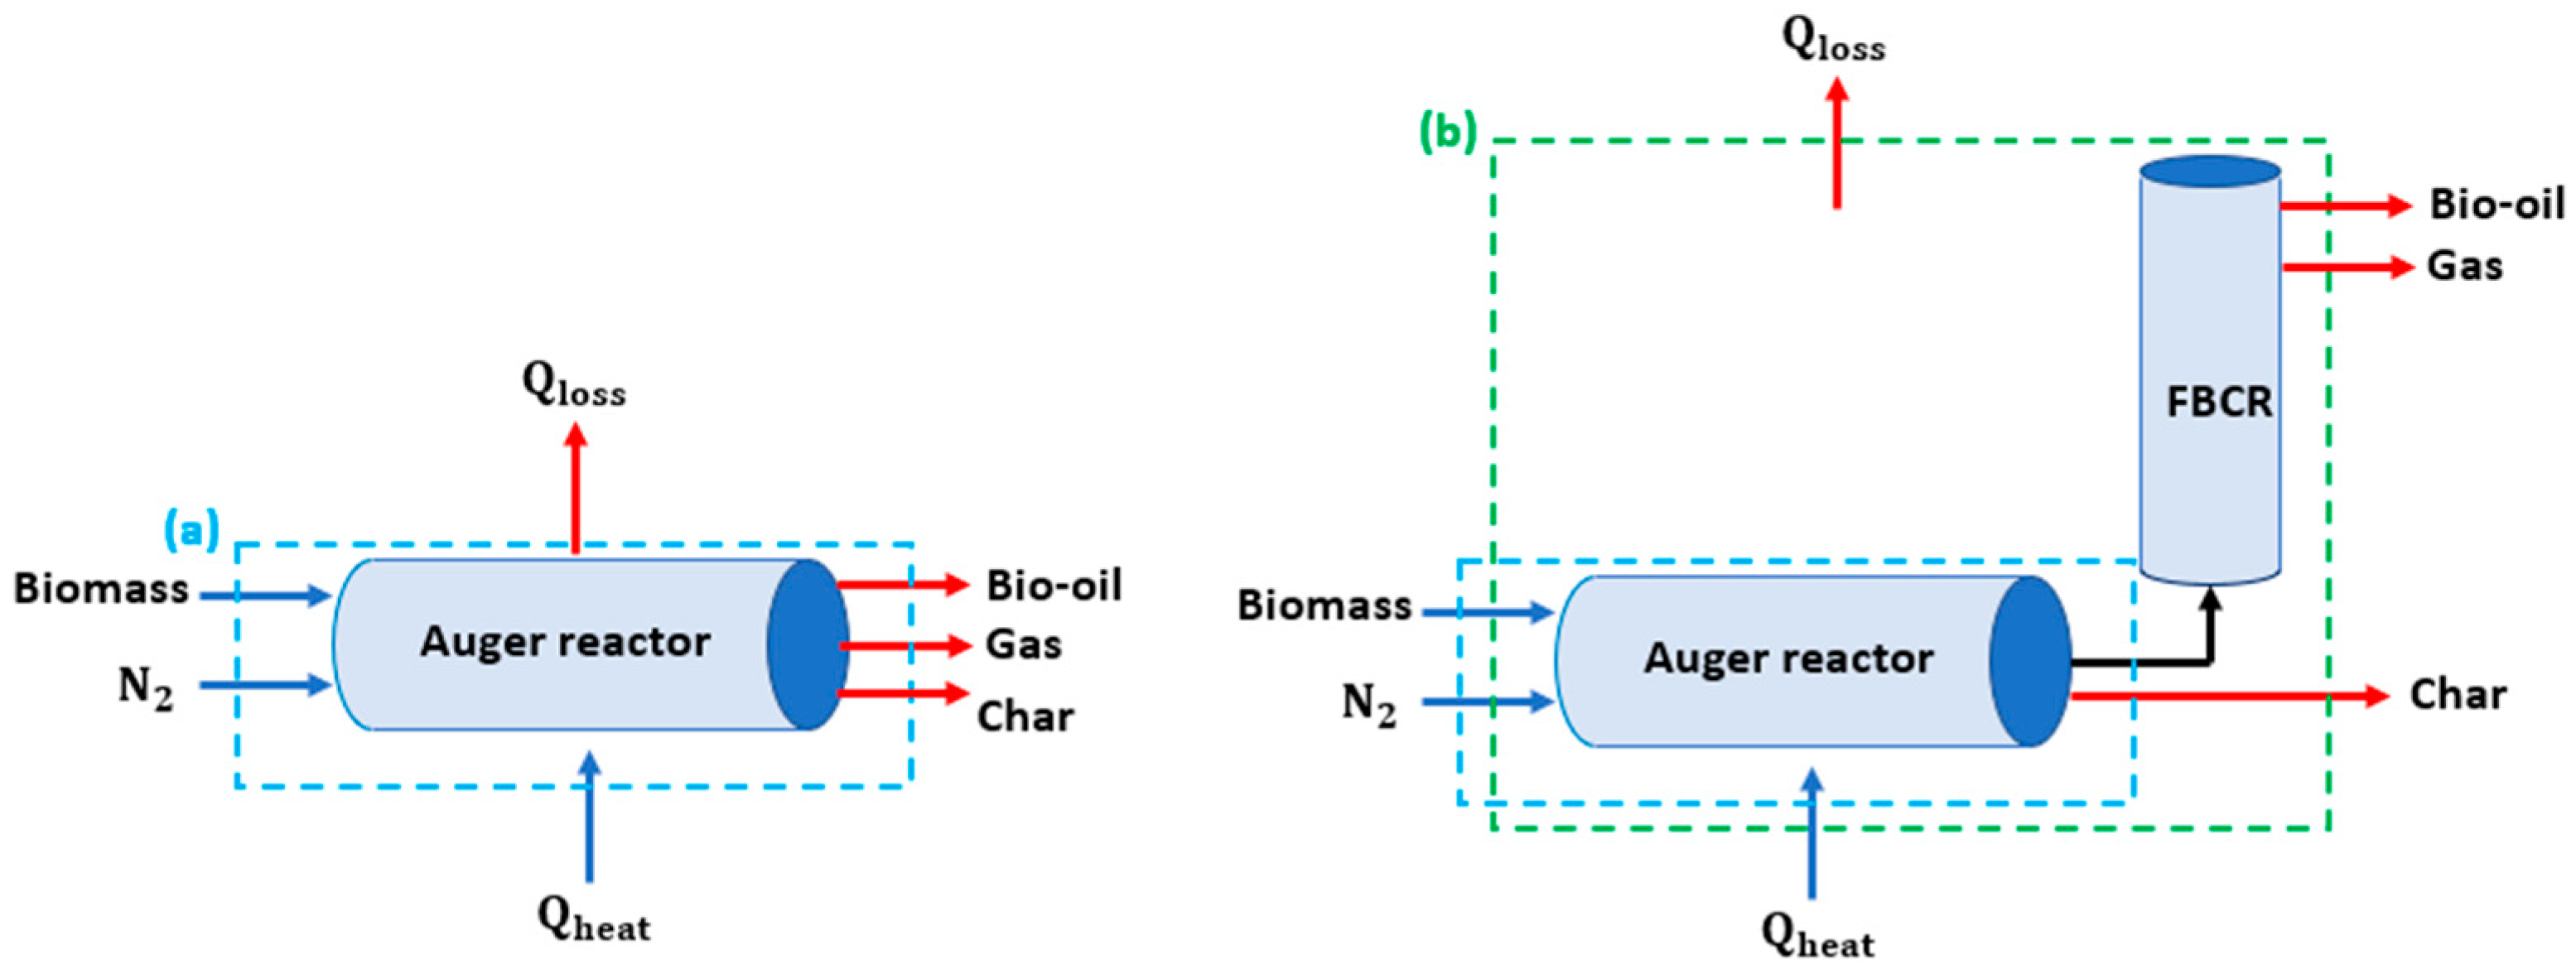
In order to calculate the energy balance and evaluate the exergy efficiency, the input and output flows (mass and energy) of both configurations, with and without catalytic deoxygenation, were established, as illustrated in Figure 2.

2.4. Analytical Analysis for Pyrolytic Products

Gas chromatography–mass spectrometry (GC-MS) was used to identify the chemicals in the liquid products, and gas chromatography with an FID detector was used for quantification. A Clarus SQ 85 GC-MS from Perkin Elmer (Waltham, MA, USA) with a VF-1701 ms (60 m × 0.25 m × 0.25 µm film thickness) column from Agilent (Santa Clara, CA, USA) were utilized. A split ratio of 1:30 was used to inject 1 µL of the bio-oil sample that had been diluted in acetone for each analysis. A temperature of 250 °C was chosen for the injector. Helium was employed as a carrier gas with a flow rate of 1 mL/min. Oven temperature was kept at 45 °C for 4 min, and then raised to 240 °C at a rate of 4 °C per minute and remained there for 20 min. The MS electron ionization energy was 70 eV, and the components were detected in full scan mode. The column and temperature ramp analysis technique were identical to those employed for GC-MS. To determine the quantity of each component in the sample, calibration curves were constructed using known concentrations of pure references.
Gaseous products were analyzed using a Perkin Elmer GC, Clarus 580, equipped with a flame ionization detector (FID), a thermal conductivity detector (TCD), and a methanizer. A Shincarbon St 100/120 (1 m × 1 mm ID × 1/16) OD was used with Argon as a carrier gas.

2.5. Energy and Exergy Evaluation

As shown in Figure 2, the energy balance of the pyrolysis process was calculated by considering all of the streams entering and exiting the pyrolysis setup. Based on the first law of thermodynamics, conservation can be expressed as follows:
En in   =   En out   +   Q loss
En biomass + En N 2 + Q heat = En bio oil + En gas + En char + Q loss
where En biomass , En N 2 , En bio oil , En gas , and En char denote the total energy flow rate (MJ/kgbiomass) of biomass, gas carrier, produced bio-oil, gas, and char, respectively. Q heat (MJ/kgbiomass) is the heat required by the system for the pyrolysis to take place at a specified temperature and Q loss (MJ/kgbiomass) is the heat loss in the system. In this study, heat loss through the reactor walls was neglected, so Q loss   = 0. Since heat loss was not considered, then Q heat = Q pyrolysis .
The exergy of a substance or system is defined as the maximum useful energy available to produce work when it achieves its equilibrium state with the environment. Due to the process irreversibility, which represents the loss of energy caused by dissipation and destruction, the exergy does not obey conservation law. Therefore, the exergy balance can be written as:
Ex in   =   Ex out   + I
Ex biomass + Ex N 2 + Ex heat   = Ex bio oil + Ex gas + Ex char   + I
where Ex biomass , Ex N 2 , Ex bio oil , Ex gas , and Ex char denote the exergy rates (MJ/kgbiomass) of biomass, gas carrier, produced bio-oil, gas, and char, respectively. Ex heat   is the exergy value of the additional heat input to the system and I represents irreversibly, i.e., losses during the pyrolysis process.
Irreversibilities can be external and internal. The external irreversibility represents the exergy destruction through the wall of the pyrolyzer, which was neglected since the heat loss through the walls was not considered. Therefore, the exergy destruction rate was represented by the internal irreversibilities in the pyrolysis system. The internal irreversibly is a term associated with the entropy generation due to heat and mass transfer, chemical reactions, and flow of substances.
The total energy or exergy rate of a stream can be calculated as the sum of kinetic, potential, physical, and chemical energy or exergy. The kinetic and potential energy and exergy of streams are relatively insignificant compared to physical and chemical energy and may be neglected [26]. Hence, total energy and exergy can be calculated as follows:
En total   =   En ph   +   En ch
Ex total = Ex ph + Ex ch
The superscripts ph and ch represent, respectively, the physical and chemical components of energy or exergy.

2.5.1. Gaseous Stream

The physical and chemical energies were calculated as:
En gas ph   =   n i   T 0 T C p i dT
En gas ch = n i   LHV i
where n i   is the mol of compound i per kg of biomass (mol/kgbiomass), C p i   is specific heat capacity (kJ/kmol K), and LHVi is the lower heating value (kJ/kmol). The specific heat capacity of gas components was calculated by:
C p i = a   +   bT   +   cT 2   +   dT 3
where a–d are the coefficients of specific heat capacity at constant pressure and 273–1800 K temperature range [27], which is shown in Table A1 in Appendix A for the obtained gaseous products.
The physical and chemical exergies were calculated as [28]:
Ex gas ph   =   n i   h h 0 T 0 S   S 0   =   n i   T 0 T C p i dT T 0 S   S 0
Ex gas ch = n i   [ ( Ex i ch + R T 0 ln n i n i ]
where the expression h h 0 is the specific enthalpy difference (kJ/kmol), S   S 0 is the specific entropy difference (kJ/kmol K) between working conditions and standard environmental conditions, and Ex i ch is the standard chemical exergy of i component in the pyrolysis gas products. The thermodynamic properties of some gases, enthalpy, entropy, low calorific value, and standard chemical exergy at 25 °C were calculated based on reports in the literature [27,29,30] and are presented in Table A2 in Appendix A.

2.5.2. Solid Stream

The energy content in the solid fuels such as biomass and char were estimated by Equations (12) and (13), respectively:
En biomass Total   =   n biomass   ( T 0 T pb C p biomass dT   + LHV biomass )
En char Total = n char   ( T 0 T pc C p char dT   + LHV char )
where T pb is the pyrolysis temperature of solid biomass, and T pc is the operating temperature for char production.
The LHV of solid fuels (biomass or char) was calculated using the Dulong formula [31]:
LHV solid fuel   =   33.8   x C   +   122.3   x H     x O 8
where x C , x H , and x O were the carbon, hydrogen, and oxygen mass fraction (wt.%), determined by elemental analysis for each solid fuel.
For the constant pressure specific heat capacity of char, the following expression was used [32]:
C p char   = 17.166   +   4.271   T 1000   8.79   ×   10 5 T 2
In the case of biomass (beech wood), the specific heat capacity was taken from the literature [33]. At a temperature of 344 K, the Cp of beech wood is 1.41 kJ/kg.K.
The physical exergy of biomass and solid products is relatively insignificant compared to their chemical exergy and can be neglected [34]. The chemical exergy of solids fuels can be calculated by using empirical correlation proposed by Szargut [30]:
Ex solid   fuel ch   =   β 0   LHV solid fuel
where β 0   is the correlation factor of solid fuels, calculated according to the following expressions:
β 0 = 1.0438   +   0.0158 H C   +   0.0813 O C      for   O C     0.5
β 0 = 1.0414 + 0.0177 H C 0.3328 O C 1 + 0.0537 H C 1 0.4021 O C      for   0.5   <   O C   <   2
where H, C, and O are hydrogen, carbon, and oxygen content of fuel in wt.%, respectively.

2.5.3. Liquid Stream

Two methods were applied to calculate the total energy rate of the bio-oil stream.
  • Method 1: the first method was based on the energetic contribution of only “model compounds” representative of chemical families of the bio-oil, categorized according to their functional group. Each chemical family’s principal compound was selected to serve as the model molecule. This approach is typically used in the literature [14] to simplify the calculation, knowing that bio-oil comprises a large number of different types of molecules (>150).
  • Method 2: In the second method, all compounds identified in the bio-oil were considered for the energy calculation.
For the bio-oil stream, the physical energy and chemical energy were considered. The enthalpy of phase change of compounds was also taken into consideration, so the total bio-oil energy was calculated using the following expression:
En bio oil Total   =   n i   T 0 T C p i dT   +   Δ h phasechange   +   LHV i
The LHV of bio-oil was calculated using the modified Dulong formula [28]. By taking latent heat into account as well, this updated formula is better suited for liquid fuel:
LHV bio oil = 38.2 x C   +   84.9   ( x H     x O 8 )     0.5
The physical exergy of bio-oil was considered negligible in comparison to chemical exergy, and hence the total exergy of bio-oil can be calculated by the following expression:
Ex bio oil Total   =   β 1   LHV bio oil
This approach to calculate bio-oil exergy has been used by many researchers [7,15,29]. β 1 is the correlation factor for liquid products based on elemental analysis and can be expressed as:
β 1 = 1.0401   +   0.1728 H C   +   0.0432 O C

2.5.4. Energy and Exergy Efficiency

The energetic and exergetic efficiencies of the pyrolysis systems proposed in this study were calculated using the following equations:
φ   =   En bio oil +   En gas +   En char En in × 100 %
ω = Ex bio oil +   Ex gas +   Ex char Ex in × 100 %

3. Results and Discussions

3.1. Energy and Exergy Evaluation of Pyrolysis with and Without Catalytic Deoxygenation

In this section, the thermodynamic analysis of a two-stage pyrolysis system consisting of an Auger reactor coupled to a fluidized bed catalytic reactor is discussed. The primary goal of this catalytic treatment was to reduce the amount of oxygen present in the crude bio-oil using an iron-modified zeolite catalyst, Fe-HZSM-5. The effect of iron content on catalyst performance was first examined. A set of experimental data on bio-oil deoxygenation was selected and used to compare the energy and exergy evaluation of the pyrolysis process with and without catalytic deoxygenation of pyrolysis bio-oil, under identical operating conditions. This selection was based on one of our previous works [25] that aimed to study the effect of varying the following parameters: pyrolysis temperature (450 to 600 °C), steam residence time (4.5 to 18 s), and biomass residence time (2 to 8 min). According to these results, the optimal conditions for maximum bio-oil yield and fluidization of the catalytic bed were pyrolysis temperature of 500 °C, a vapor residence time of 18 s, and a solid residence time of 480 s.
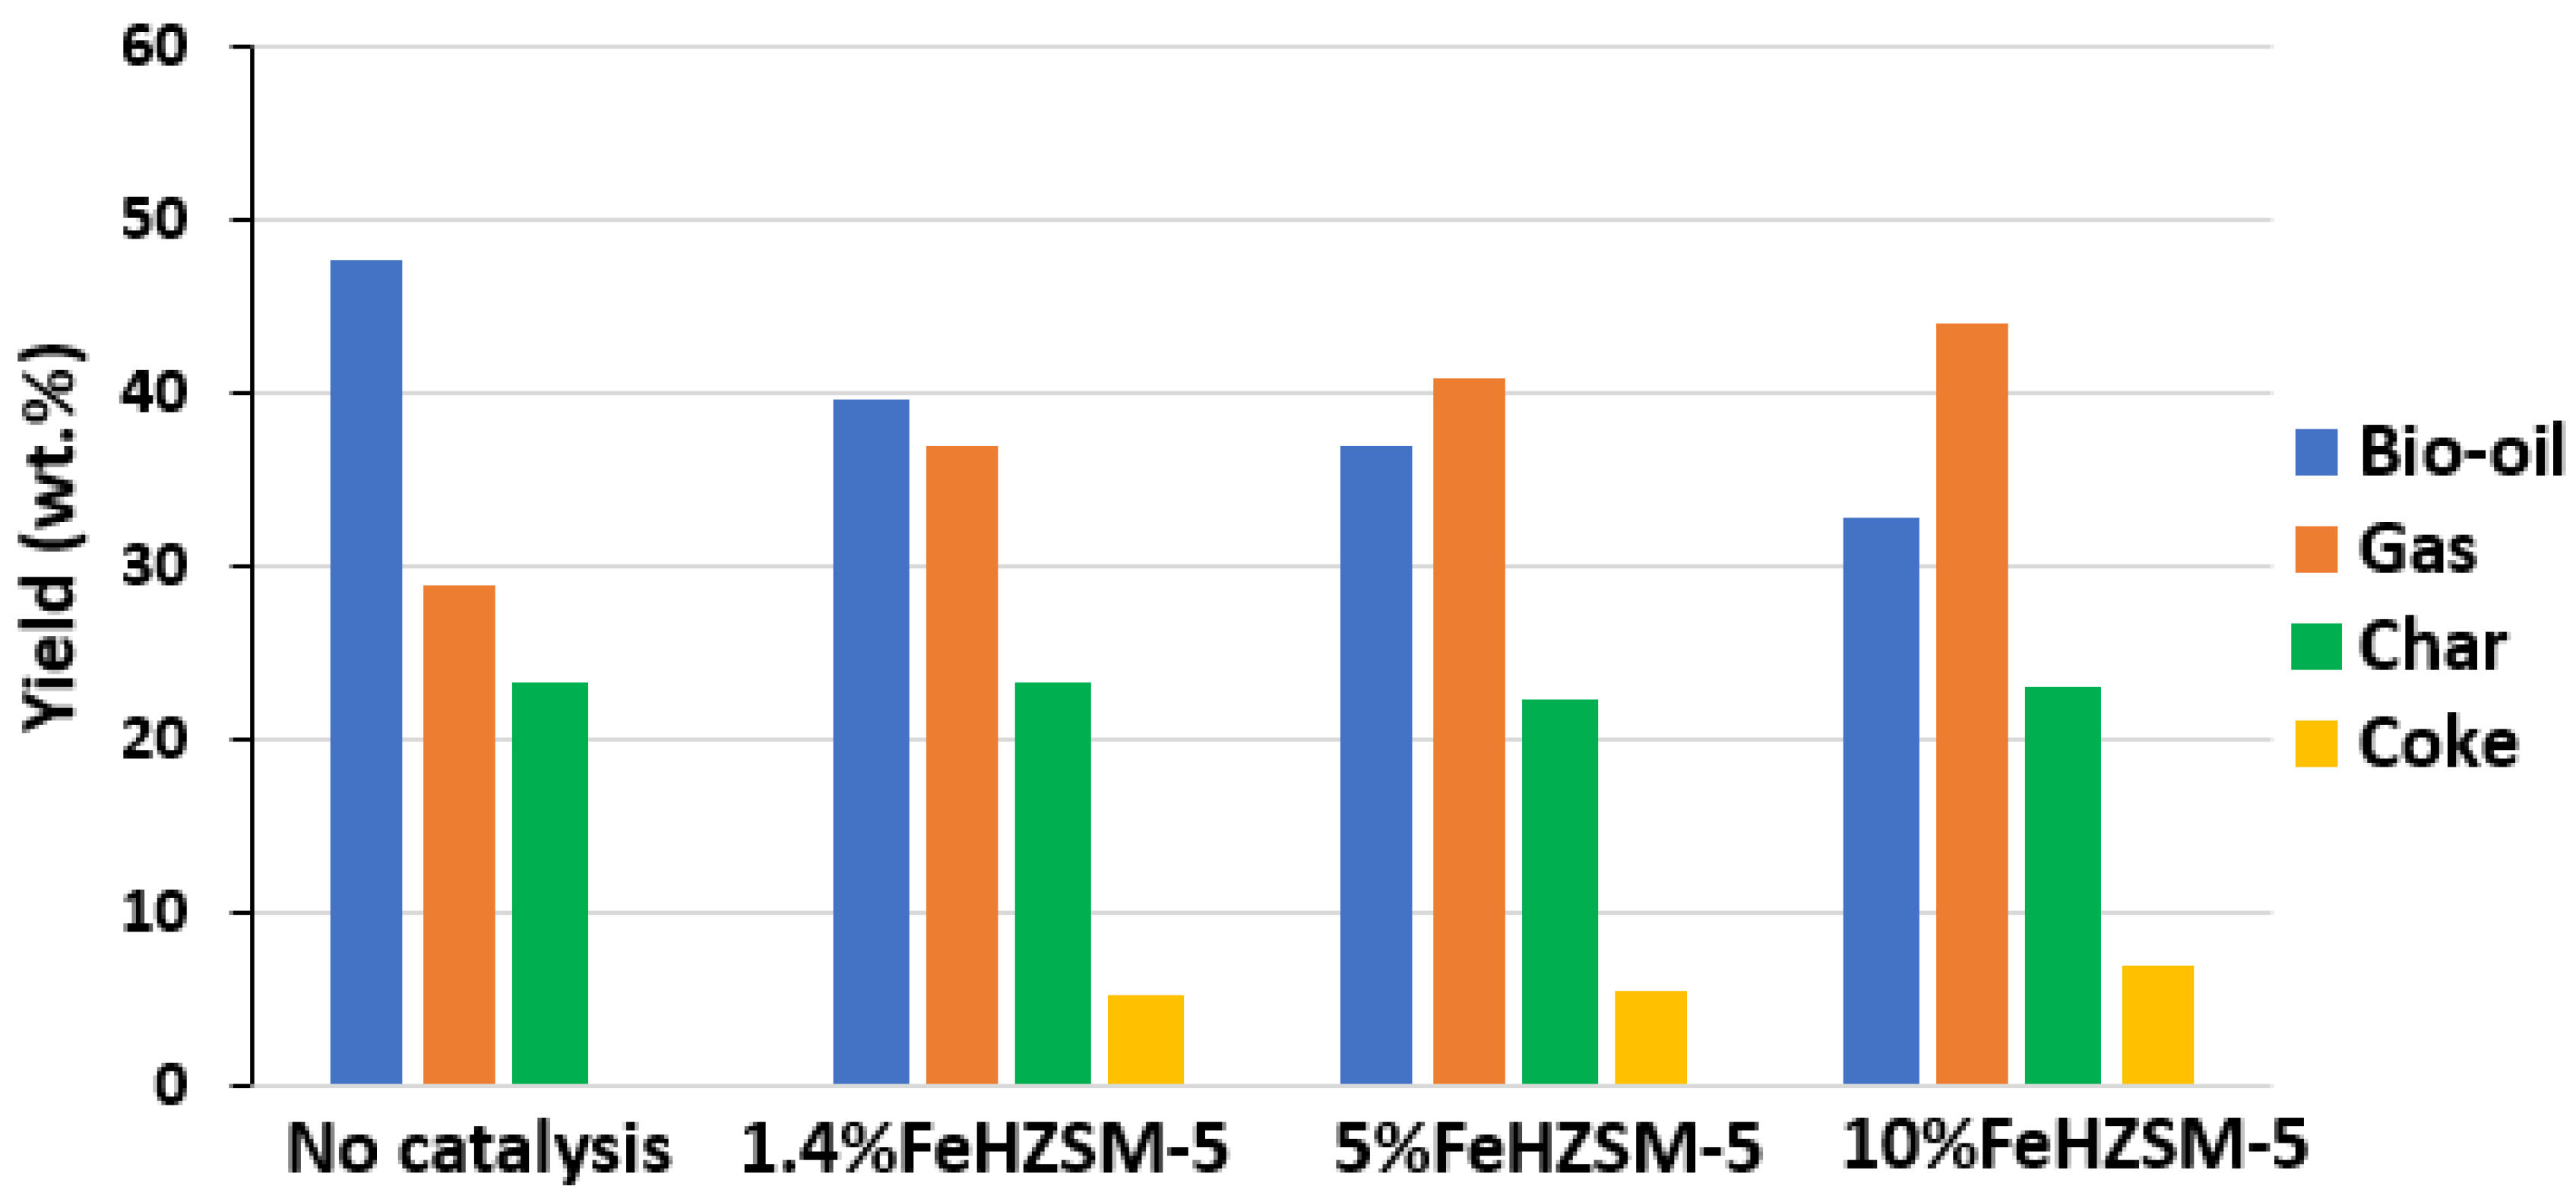
Figure 3 shows the product distribution in terms of bio-oil, gas, char, and coke, obtained with and without catalytic treatment. The bio-oil sample obtained after catalytic treatment showed a visible separation of two phases, consisting of an aqueous phase and an organic phase. This behavior was not observed in the liquid product obtained without catalytic treatment. The coke content of the spent catalyst was determined by thermogravimetric analysis by comparison of the weight loss between fresh and spent catalyst. The theoretical oxygen fraction for a molecule (CxHyOzNt) and the oxygen content in the bio-oil were calculated according to Equations (25) and (26), respectively. The mass concentration of the molecules A i was determined from the GC-FID.
F oxygen ,   i =   z × 16 x × 12 + y × 1 + z × 16 + t × 14  
Oxygen   content   % = ( F oxygen ,   i × A i ) A i
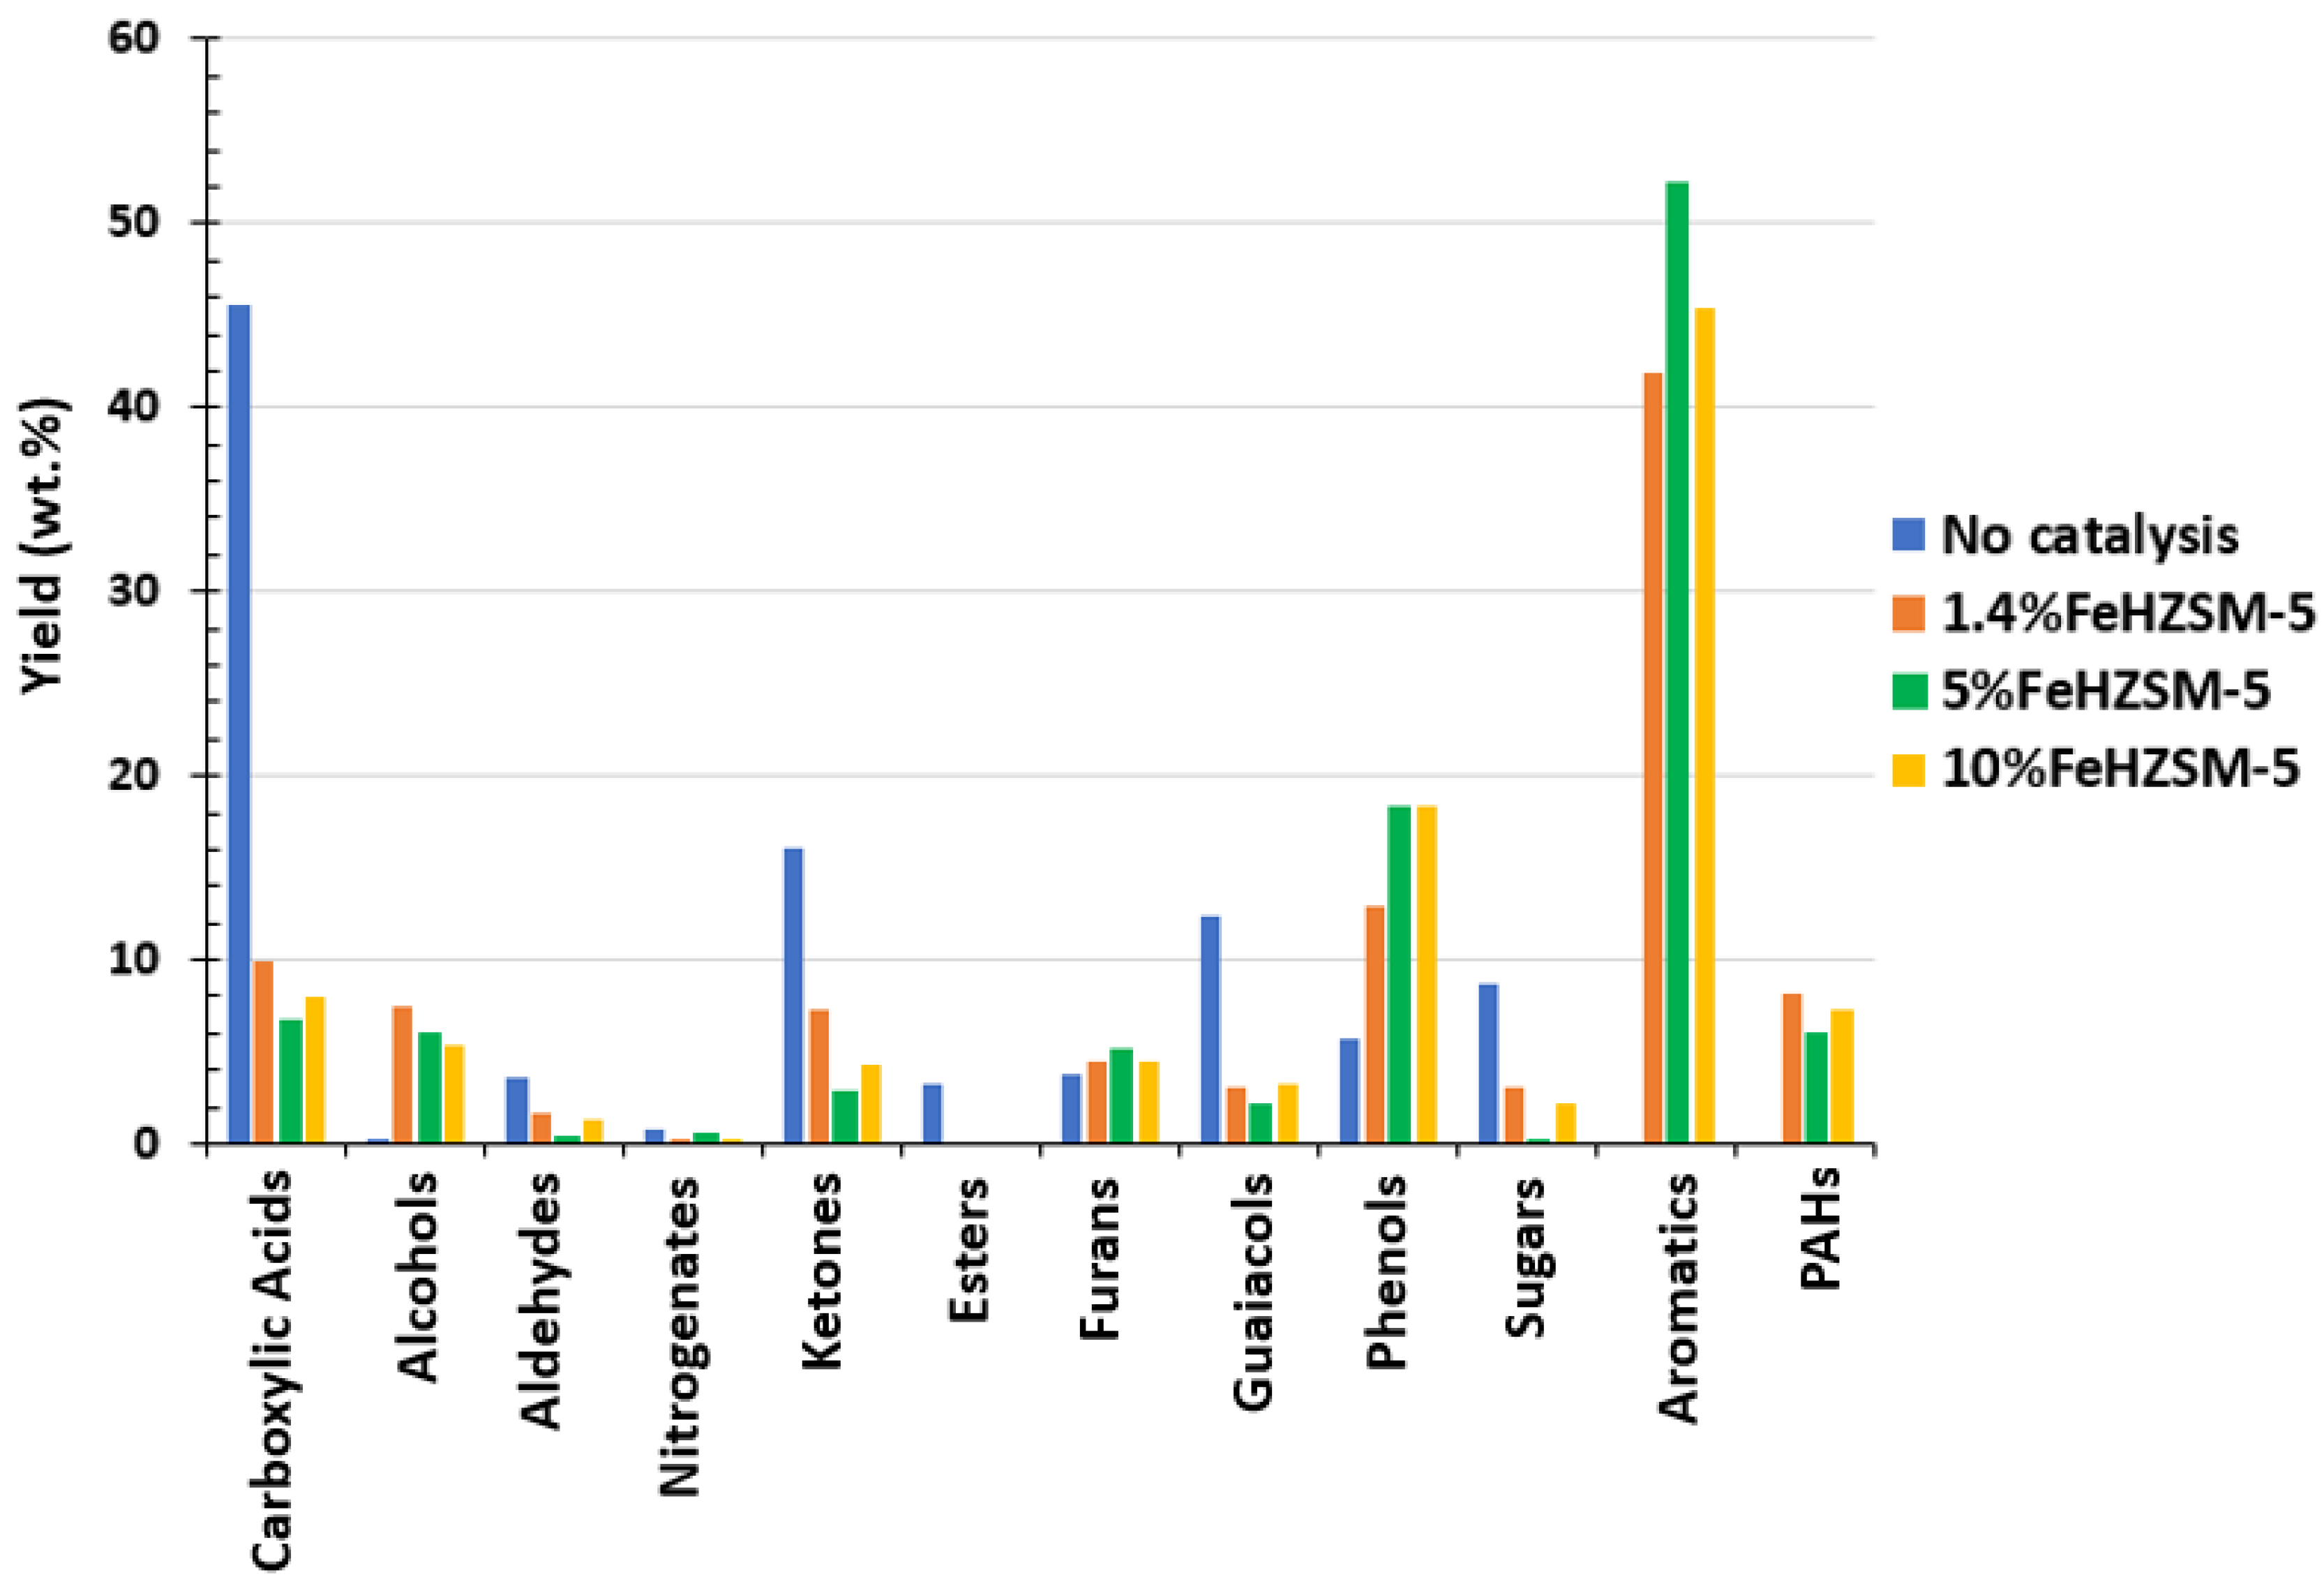
Figure 4 and Table 3 present the impact of the amount of Fe-HZSM-5 on the product distribution in the liquid and gas phase products, respectively. It was found that the best deoxygenation was achieved with an iron loading of 5%. Indeed, 5%FeHZSM-5 catalyst reduced the oxygen content of bio-oil from 41.62 to 12.42 wt.%, and increased its LHV from 20.53 to 33.25 MJ/Kg [25]. Based on this result, 5%FeHZSM-5 catalyst was used for further study.
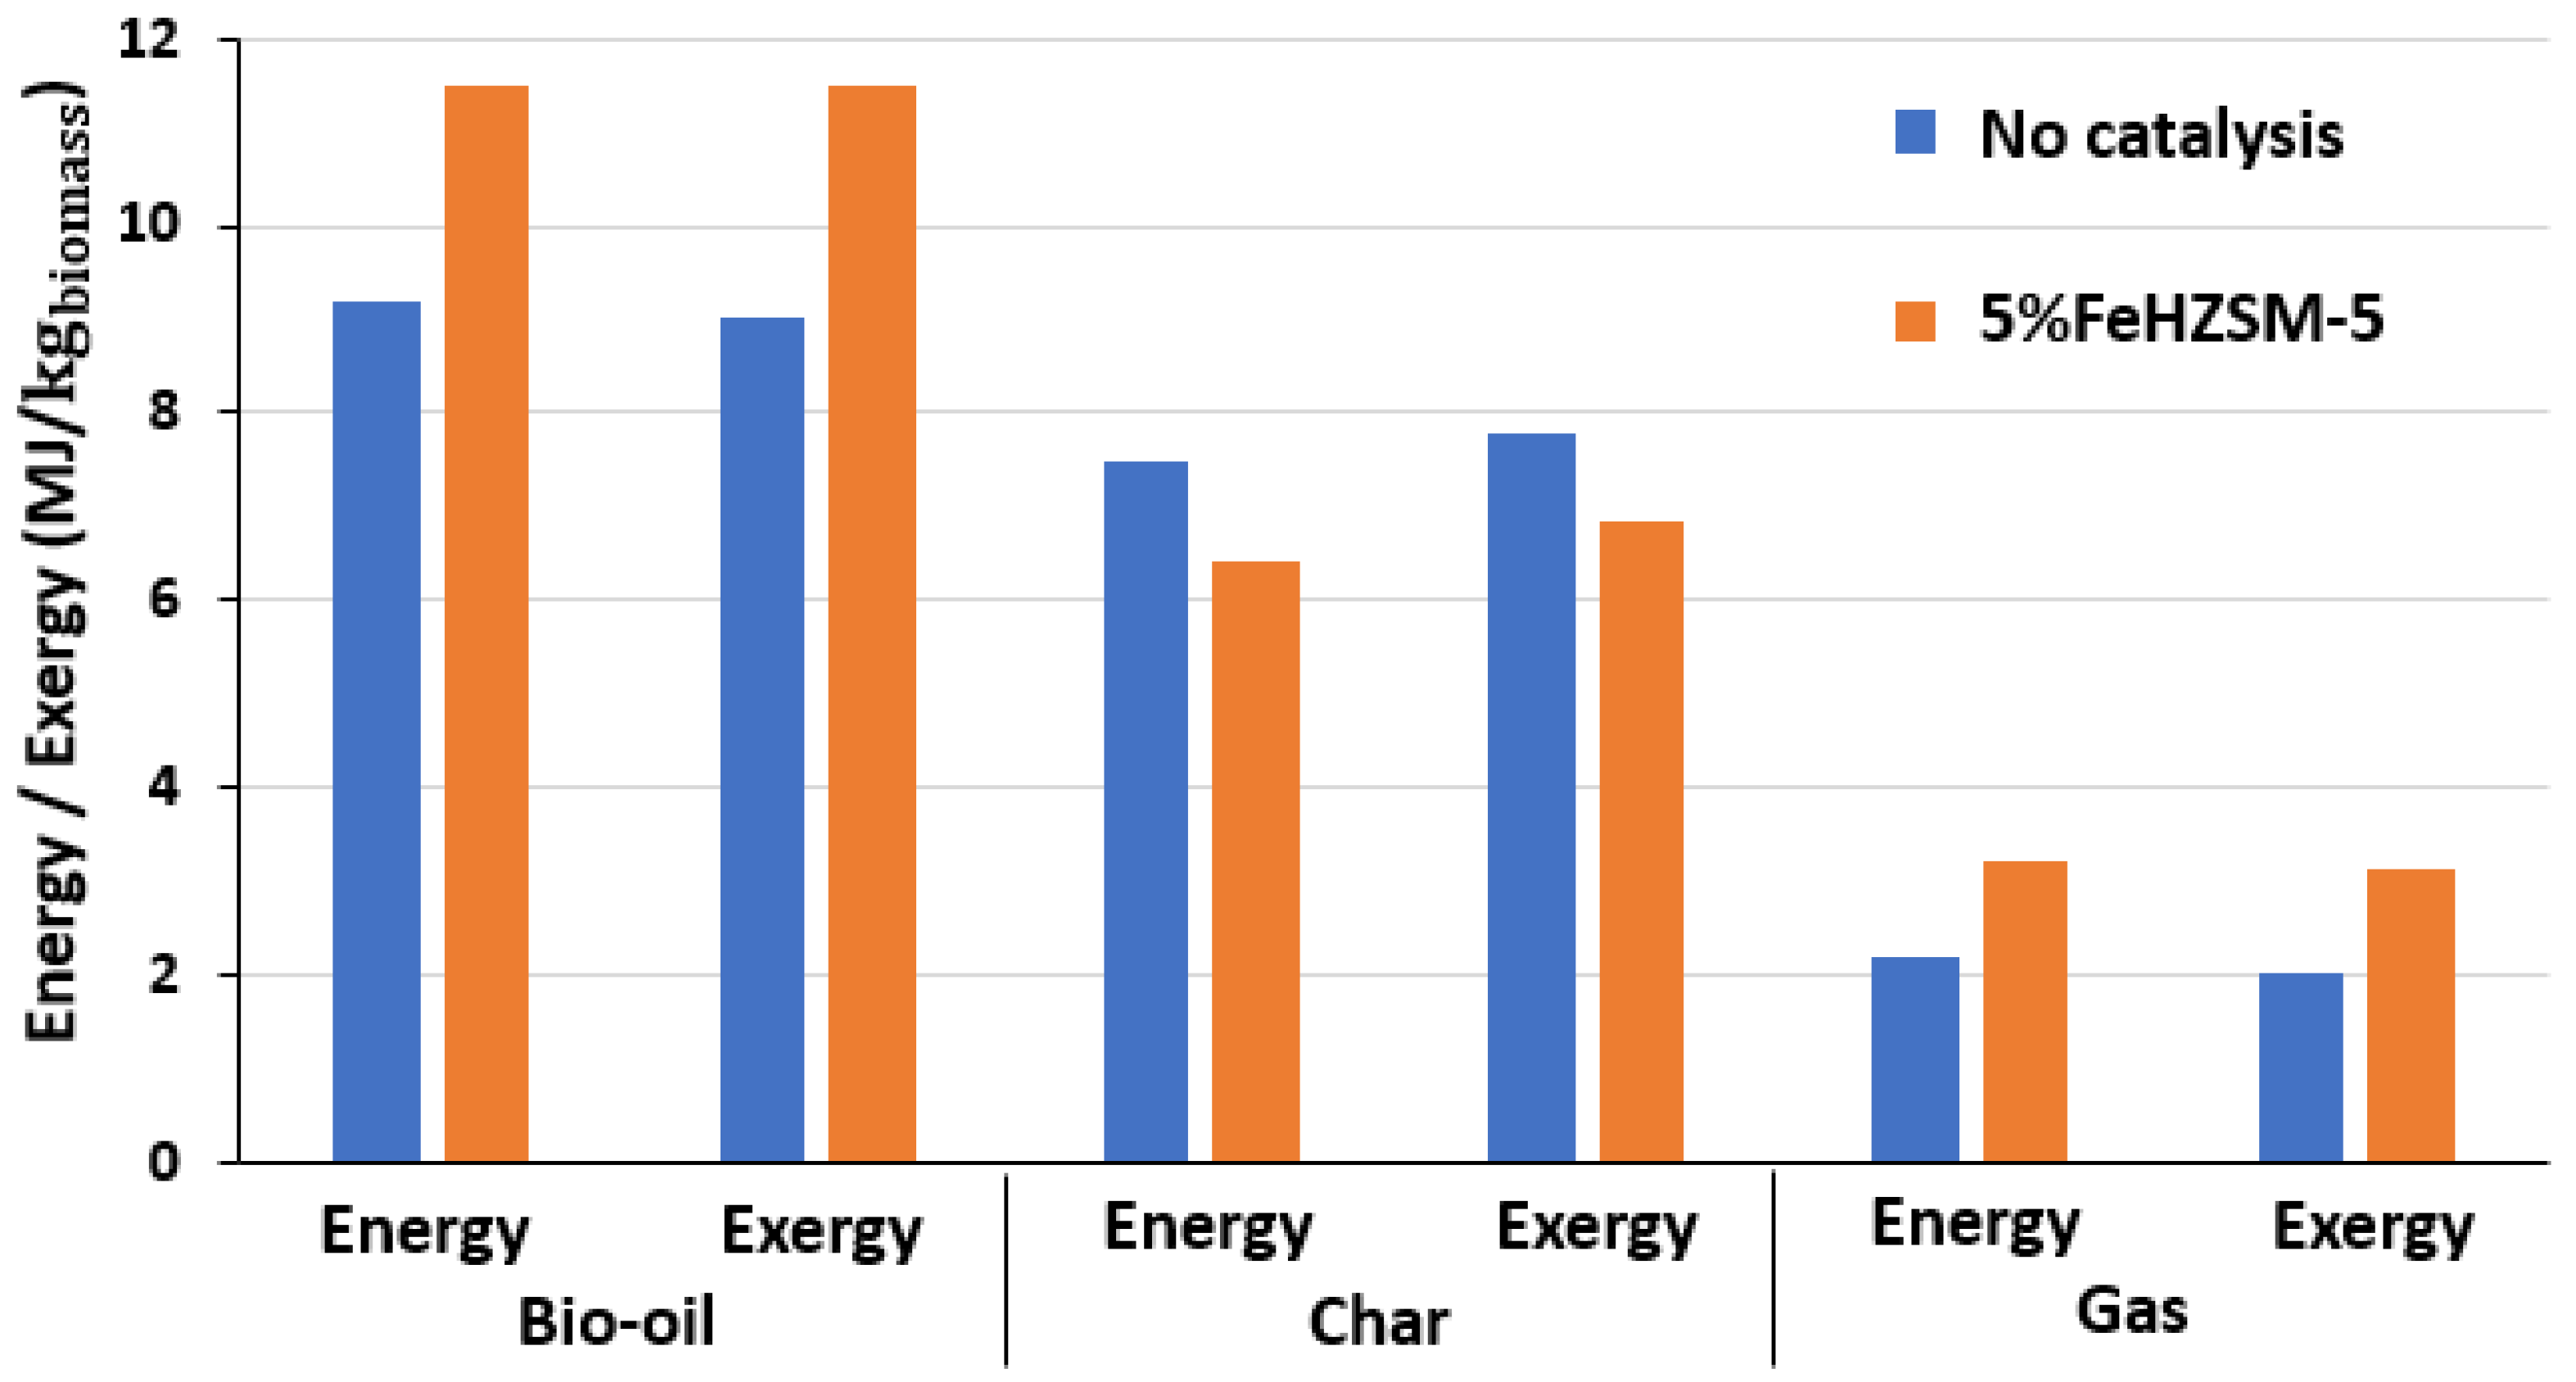
Figure 5 shows the results for energy and exergy evaluation for both non-catalytic and catalytic pyrolysis with 5%FeHZSM-5. Method 1 is used in this study, where the energetic contribution of only model compounds is considered. Table 4 shows the model molecule of each chemical family in the bio-oil sample.
More gas was produced as a result of using FeHZSM-5 catalyst that promotes cracking reactions of large organic molecules into lighter ones. The energy and exergy rate of gas products increased as a result of its increased yield. The energy of the gas produced in the catalytically treated pyrolysis process was 3.2 MJ/kgbiomass, which was 45.5% higher than in the non-catalytic procedure. In the case of char, the energy and exergy rates decreased from 7.2 to 6.5 MJ/kgbiomass and from 7.5 to 6.8 MJ/kgbiomass, respectively, indicating an opposite tendency. After the use of FeHZSM-5, the yield of bio-oil dropped by 22.4%. In spite of this, the energy rate increased significantly from 9.3 to 11.3 MJ/kgbiomass. Consequently, lower energy degradation was represented by the upgraded bio-oil.
Since the difference between exergy and energy should adhere to the principle of energy conservation, we observe that in the case of char, the exergy is slightly greater than the energy provided by the char, which is inconsistent with the concept of exergy. Similar findings have been reported by other authors, including Boateng et al. [20], Baghel et al. [35], and Singh et al. [34], where the total char exergy was marginally greater than the energy. Reyes et al. [23] noticed the same occurrence and ascribed it to the Szargut equation, which is used to compute the exergy of fuels, since this correlation does not account for the potential entropy changes in non-conventional fuels. As exergy cannot be directly estimated due to the absence of thermodynamic parameters, such as conventional entropy values for solid fuels, Eboh et al. [36] believes that it may be possible to achieve greater chemical exergy values than energy values for solid fuels.

3.1.1. Energy and Exergy Rates of Gas Product

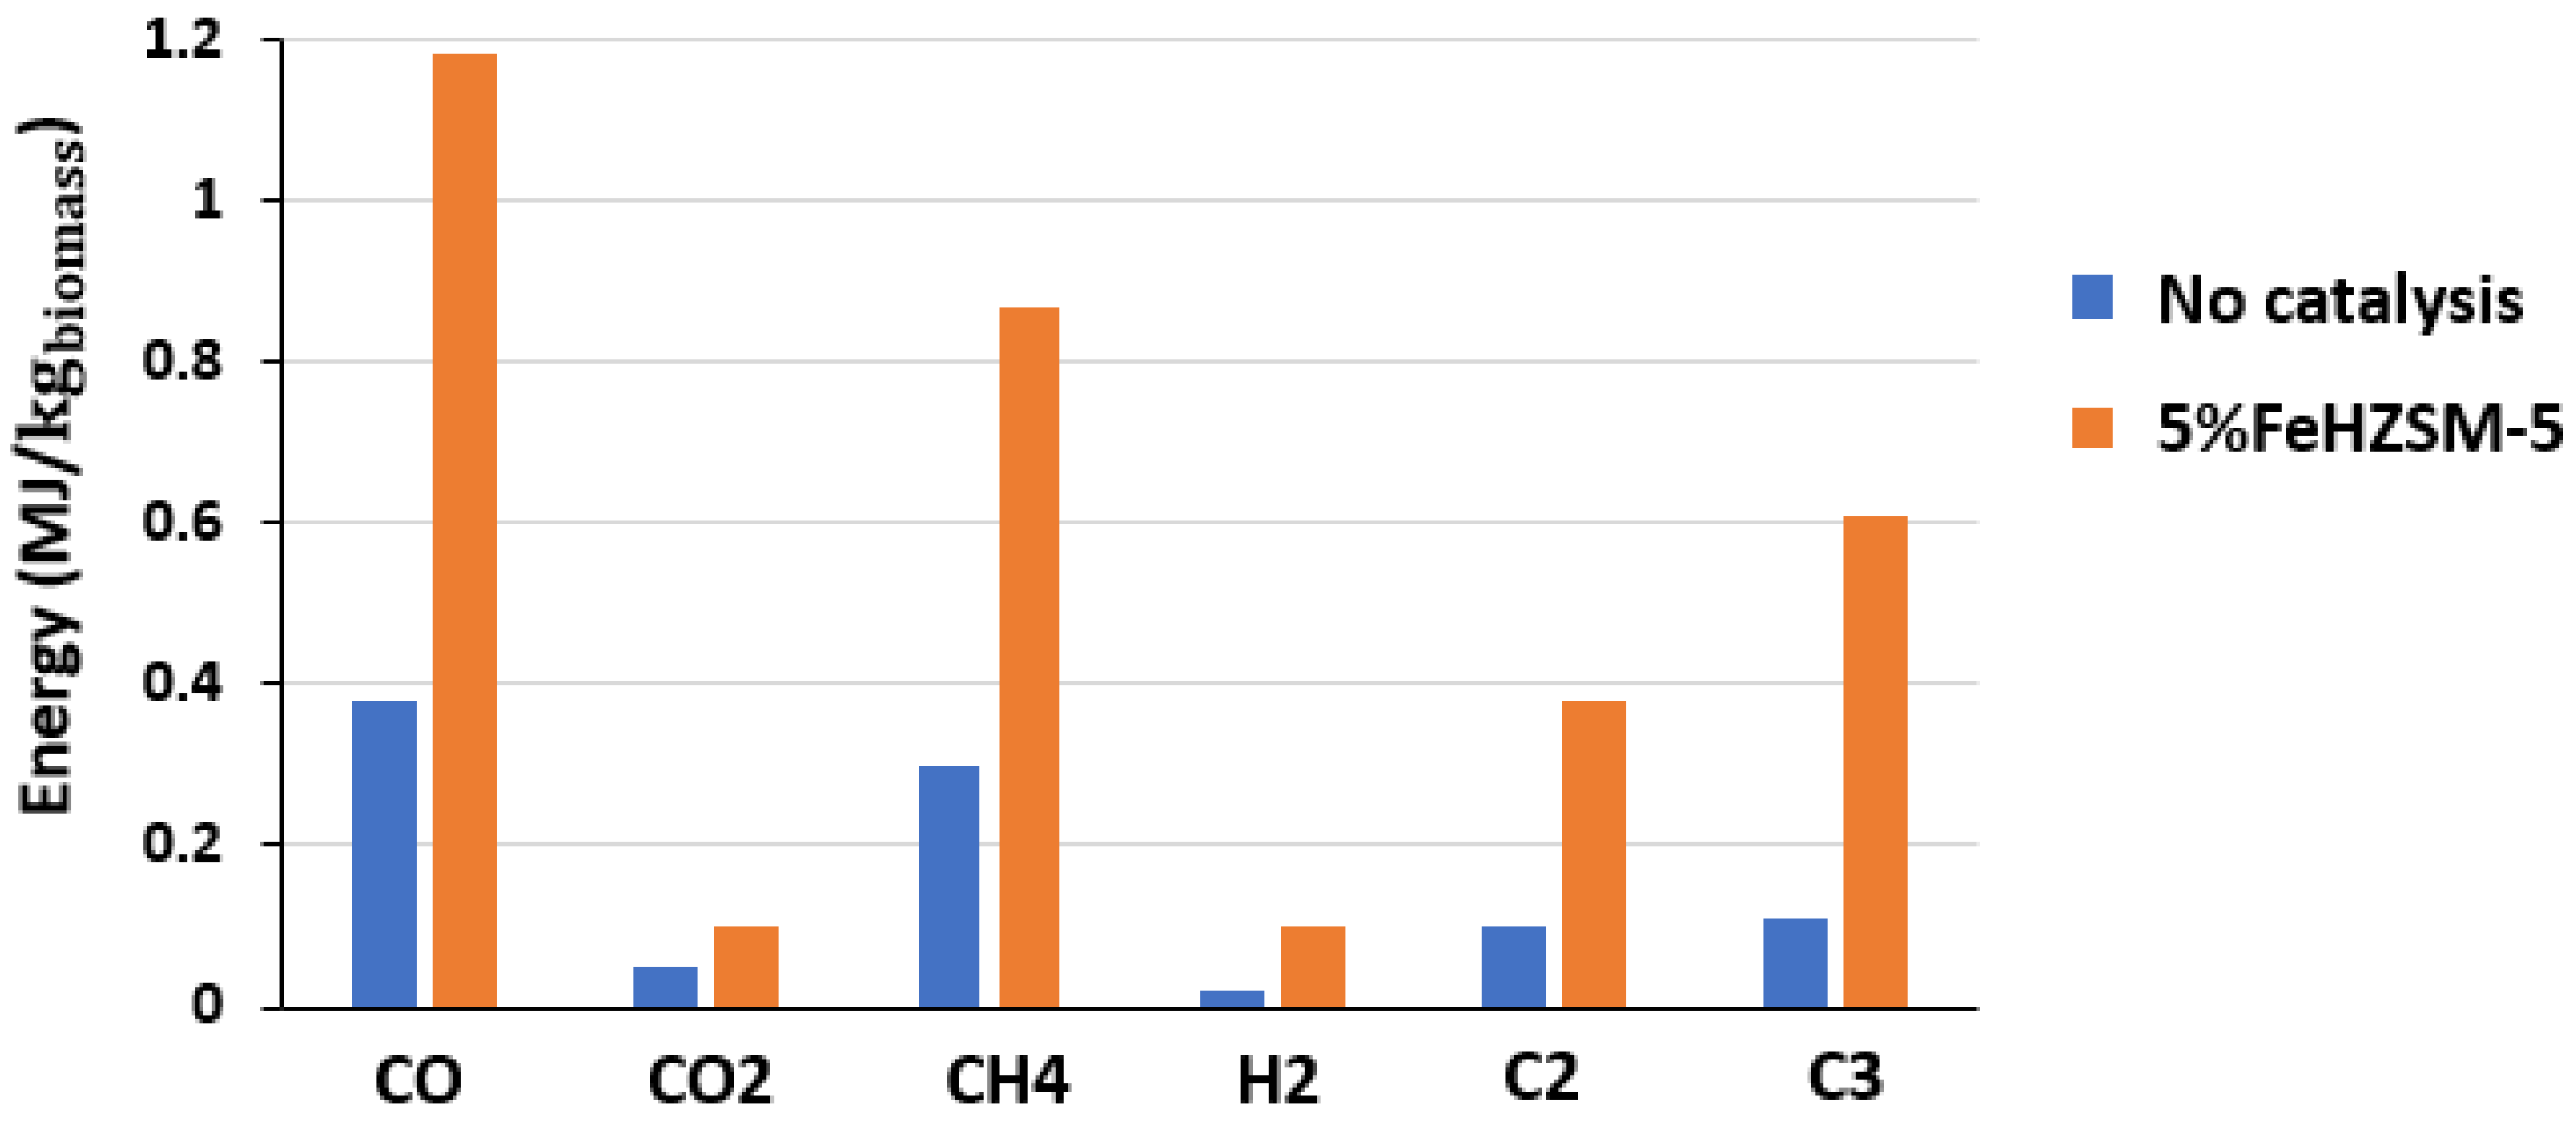
Figure 6 shows the product distribution of gaseous products and Figure 7 and Figure 8 illustrate their energy and exergy distributions, respectively, with and without the use of 5%FeHZSM-5 catalyst and how the energy and exergy contribution of each component of the gas product changes. This is in accordance with the increase in the gas product yield caused by the use of the catalyst, which leads to deeper cracking reactions.
With the 5%FeHZSM-5 catalyst, the difference between energy and exergy was 0.12 MJ/kgbiomass, compared to 0.04 MJ/kgbiomass for the process without catalytic treatment. This difference represents the lost or unused heat as a result of the system’s irreversibilities. Indeed, higher entropy is generated in the gas phase as a result of the catalytic treatment added to the system.
The catalyst step increases the energy and exergy rates of all gas components, and the highest energy and exergy rates are represented by CO, CH4, and C3 (the sum of the light hydrocarbons propene, propylene, and propane). The increased yield of these compounds as a result of using the FeHZSM-5 catalyst and their high energy density in comparison to the other gas compounds are the origin of this energy gain. Despite having the maximum yield in the gas produced, CO2 remains the component with the lowest energy contribution due to its low energy density, much like in the case of non-catalytic pyrolysis. During plastic pyrolysis, Zhang et al. obtained a similar overall order of contribution to exergy: C3 > C2H4 > CH4 > C2H6 > CO > H2 > CO2 [18].

3.1.2. Energy and Exergy Rates of the Bio-Oil

Table 5 presents the energy and exergy contribution of chemical families in the bio-oil with and without catalytic treatment.
With an energy rate of 6.20 MJ/kgbiomass, the aromatics group has the highest energy rate and accounts for 55.1% of the enhanced bio-oil overall energy contribution. This is consistent with the fact that the highest yielding group of the upgraded bio-oil is aromatics. In addition, these compounds have a greater energy density than the other compounds in the bio-oil. With 1.74 MJ/kgbiomass, or 15.8% of the total energy rate, the phenol group contributed the second highest energy rate. In contrast, the primary groups in the uncatalyzed bio-oil, carboxylic acids, guaiacols, and ketones, were shown to have a significantly lower energy rate because the catalyst causes deoxygenation, which lowers the yields of the oxygenated groups in improved bio-oil.

3.1.3. Pyrolysis Heat

The pyrolysis heat was calculated using Equation (27) obtained after rearranging Equation (2).
Q heat = En bio oil + En gas + En char En biomass En N 2
The assessment of the pyrolysis heat is crucial because it provides insight into the sustainability of the process by indicating the amount of heat required to complete the pyrolysis reaction. The pyrolysis heat needed in this study to pyrolyze beech wood at 500 °C in an Auger reactor was determined to be 1.20 MJ/kgbiomass. The heat requirement values for pyrolysis that were determined in this study are comparable to those for other reactor technologies that have been reported in the literature. The additional pyrolysis heat for beech wood in a fluidized bed reactor at 510 °C was 1.12 MJ/kgfeedstock, according Atsonios et al. [12]. According to Reyes et al. [23], the pyrolysis heat input for the same biomass in a semi-continuous reactor at 500 °C was 1.97 MJ/kgbiomass. The heat needed in a screw reactor at 550 °C for five distinct biomasses was determined by Yang et al. [37] and ranged from 1.3 to 1.6 MJ/kgdrybiomass.
The slight difference between the heat needed for the pyrolysis process in this study and those reported in the literature may arise from various factors, including the pyrolysis temperature, biomass type, and operating conditions (reactor type, particle size, vapor residence time, heating rate, etc.). Furthermore, the estimating technique must also be considered. The heat of pyrolysis of wood can be calculated based on heat balance using experimental data from a pyrolysis reactor, as we did in this study, but some other studies have used thermal analysis, such as the TGA and DSC [38]. Since experimental conditions may differ significantly from those of practical applications of a pyrolysis system, such as using small amounts of sample, Abrego et al. [39] state that the pyrolysis heat obtained by the thermogravimetric technique does not realistically represent the thermal behavior of pyrolysis reactors. They suggest that the limitations of the previous method could be overcome by estimating pyrolysis heat by heat balance using actual pyrolysis reactor data.
With a value of 3.46 MJ/kgbiomass, the heat needed in the pyrolysis system with catalytic treatment was greater than that needed for the process without a catalyst. This difference was around three times. This increase might be due to the multiple reactions that take place in the catalytic reactor on the FeHZSM-5 catalyst.

3.1.4. Exergetic Efficiency and Exergy Destruction

In this study, the term exergy destruction (I) was used to describe the difference between the input and output exergy of the conversion system. The variation in exergy efficiency and exergy destruction with and without catalyst is shown in Table 6.
At 500 °C, the pyrolysis process of beech wood had an exergy efficiency of 90.3%. This value is similar to that found by Reyes et al. [23] of 90.4% in a semi-continuous reactor for the same biomass at 500 °C. The energy efficiency of bio-oil produced by pyrolysis in an Auger reactor is noticeably higher than that of other technologies documented in the literature. In a slow pyrolysis process, Torres et al. [40] discovered that the exergy efficiency ranged from 81.16% to 85.53% in the 300–800 °C temperature range.
The calculated value of exergy destruction at 500 °C was 9.7%, which corresponds to 1.76 MJ/kgbiomass. The exergy destruction rate in a semi-continuous reactor for beech wood pyrolysis was assessed by Reyes et al. [23] and was found to be 2.10 MJ/kgbiomass, which is greater than the rate reported in this work. In their fast pyrolysis process in a bubbling fluidized bed reactor, Osgood-Jacobs et al. [41] found an exergy destruction of 20–23% at temperatures between 400 and 550 °C, whereas Torres et al. [40] found about 17% of exergy destruction at 500 °C.
With catalytic treatment, the process overall efficiency was determined to be 91.6%, with less than 8.4% of exergy destruction. The system assessed in this study may be suitable for the energy conversion process, based on its low exergy destruction and high exergy efficiency values.

3.2. Comparative Study of Different Methodologies for Thermodynamic Analysis of Bio-Oil

It is commonly recognized that, concerning pyrolysis-based energy generation, bio-oil is the most desirable product with the highest yield when compared to the other by-products (gas and biochar). The bio-oil produced by pyrolysis has the highest energy/exergy ratio of all the products, as was previously shown. Given that there are a variety of approaches for assessing the energy and exergy values in the literature, and that only a small number of these approaches have been used to analyze bio-oil, we compared two approaches to determine which would be best suited for calculating the energy and exergy rates of bio-oil. These two approaches were applied based on the description in Section 2.5.3. The bio-oil is represented by a few model molecules from each chemical family in the first method, which is noted as “model compounds”. In the second one, noted “all compounds”, all of the identified compounds by GC-MS analysis were considered in the evaluation of energy and exergy.
In this part, only the chemical energy was considered for the energy analysis of the bio-oil stream utilizing the two previously indicated procedures. According to other authors, physical energy of bio-oil is insignificant compared to its chemical energy, thus it can be neglected [42,43]. Additionally, due to the difficulty in determining the thermodynamic characteristics of every bio-oil compound (method 2) required to assess the physical energy, this approximation can also make the calculating process simpler.
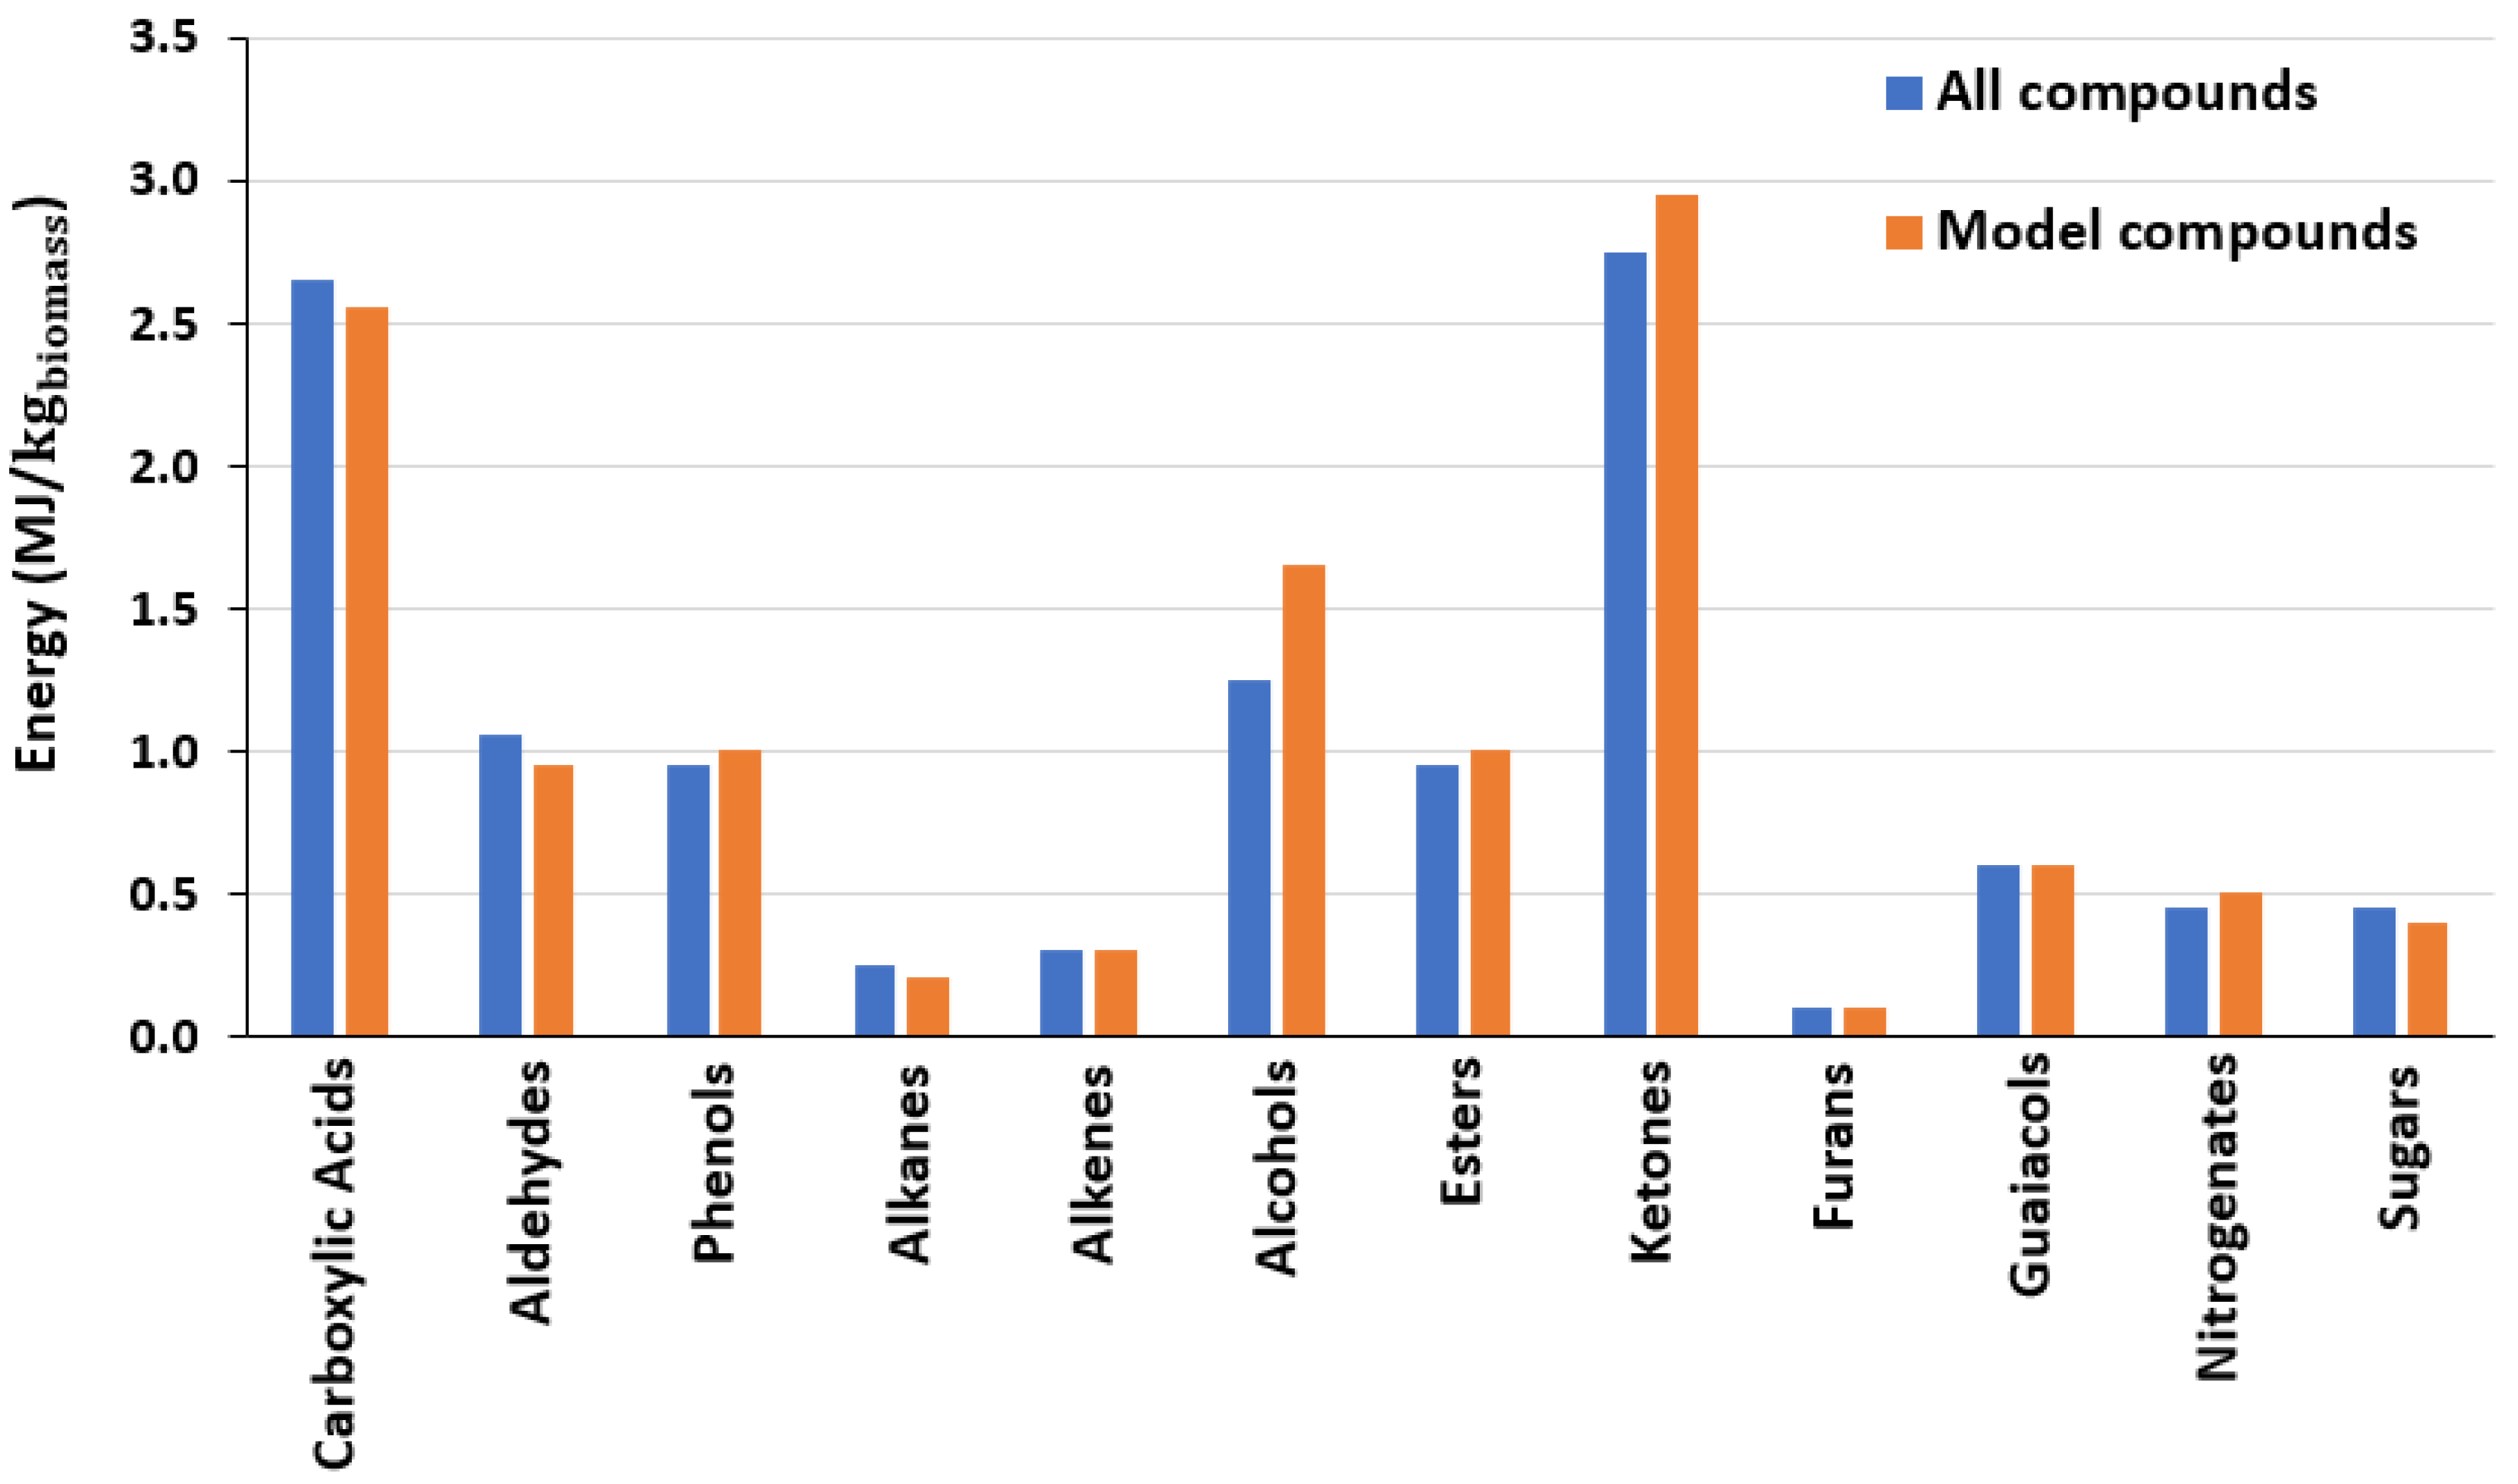
The experimental data used for the thermodynamic analysis in the continuous pyrolysis system were taken from Table 4 for the “model compounds” method and from Table A3 in Appendix A for the “all compounds” method. The energy and exergy distribution of the bio-oil compounds in an Auger reactor are illustrated in Figure 9 and Figure 10, respectively.
As shown in Figure 9 and Figure 10, for the major chemical groups, energetic and exergetic contributions were similar for both methods. The carboxylic acid group has the biggest energy and exergy contribution because of its high yield in the bio-oil, but it also produces the smallest difference between the two methods, at just 1.31%. This can be explained by noting that the chosen model molecule, acetic acid, accounts for 85% of the carboxylic acid group totality; thus, it can be used to illustrate how the entire group behaves. The exergy rate for the ketones group was 1.61 MJ/kgbiomass by chemical family and 1.37 MJ/kgbiomass by the model molecules, resulting in a 14% difference.
Nitrogen compounds, esters, and guaiacols had the largest margin of error between the two approaches, with differences of 20, 16, and 15%, respectively. All of these groups share the characteristic that the majority compound, or model molecule, accounts for a small portion of the group overall yield. As a result, it can be seen that the difference between the two approaches is more closely related to the percentage that the chosen molecule represents in the bio-oil rather than the yield of each functional group, i.e., even if the molecule is the majority component, the results may not be as accurate if it does not represent a higher or sufficient percentage of the group.
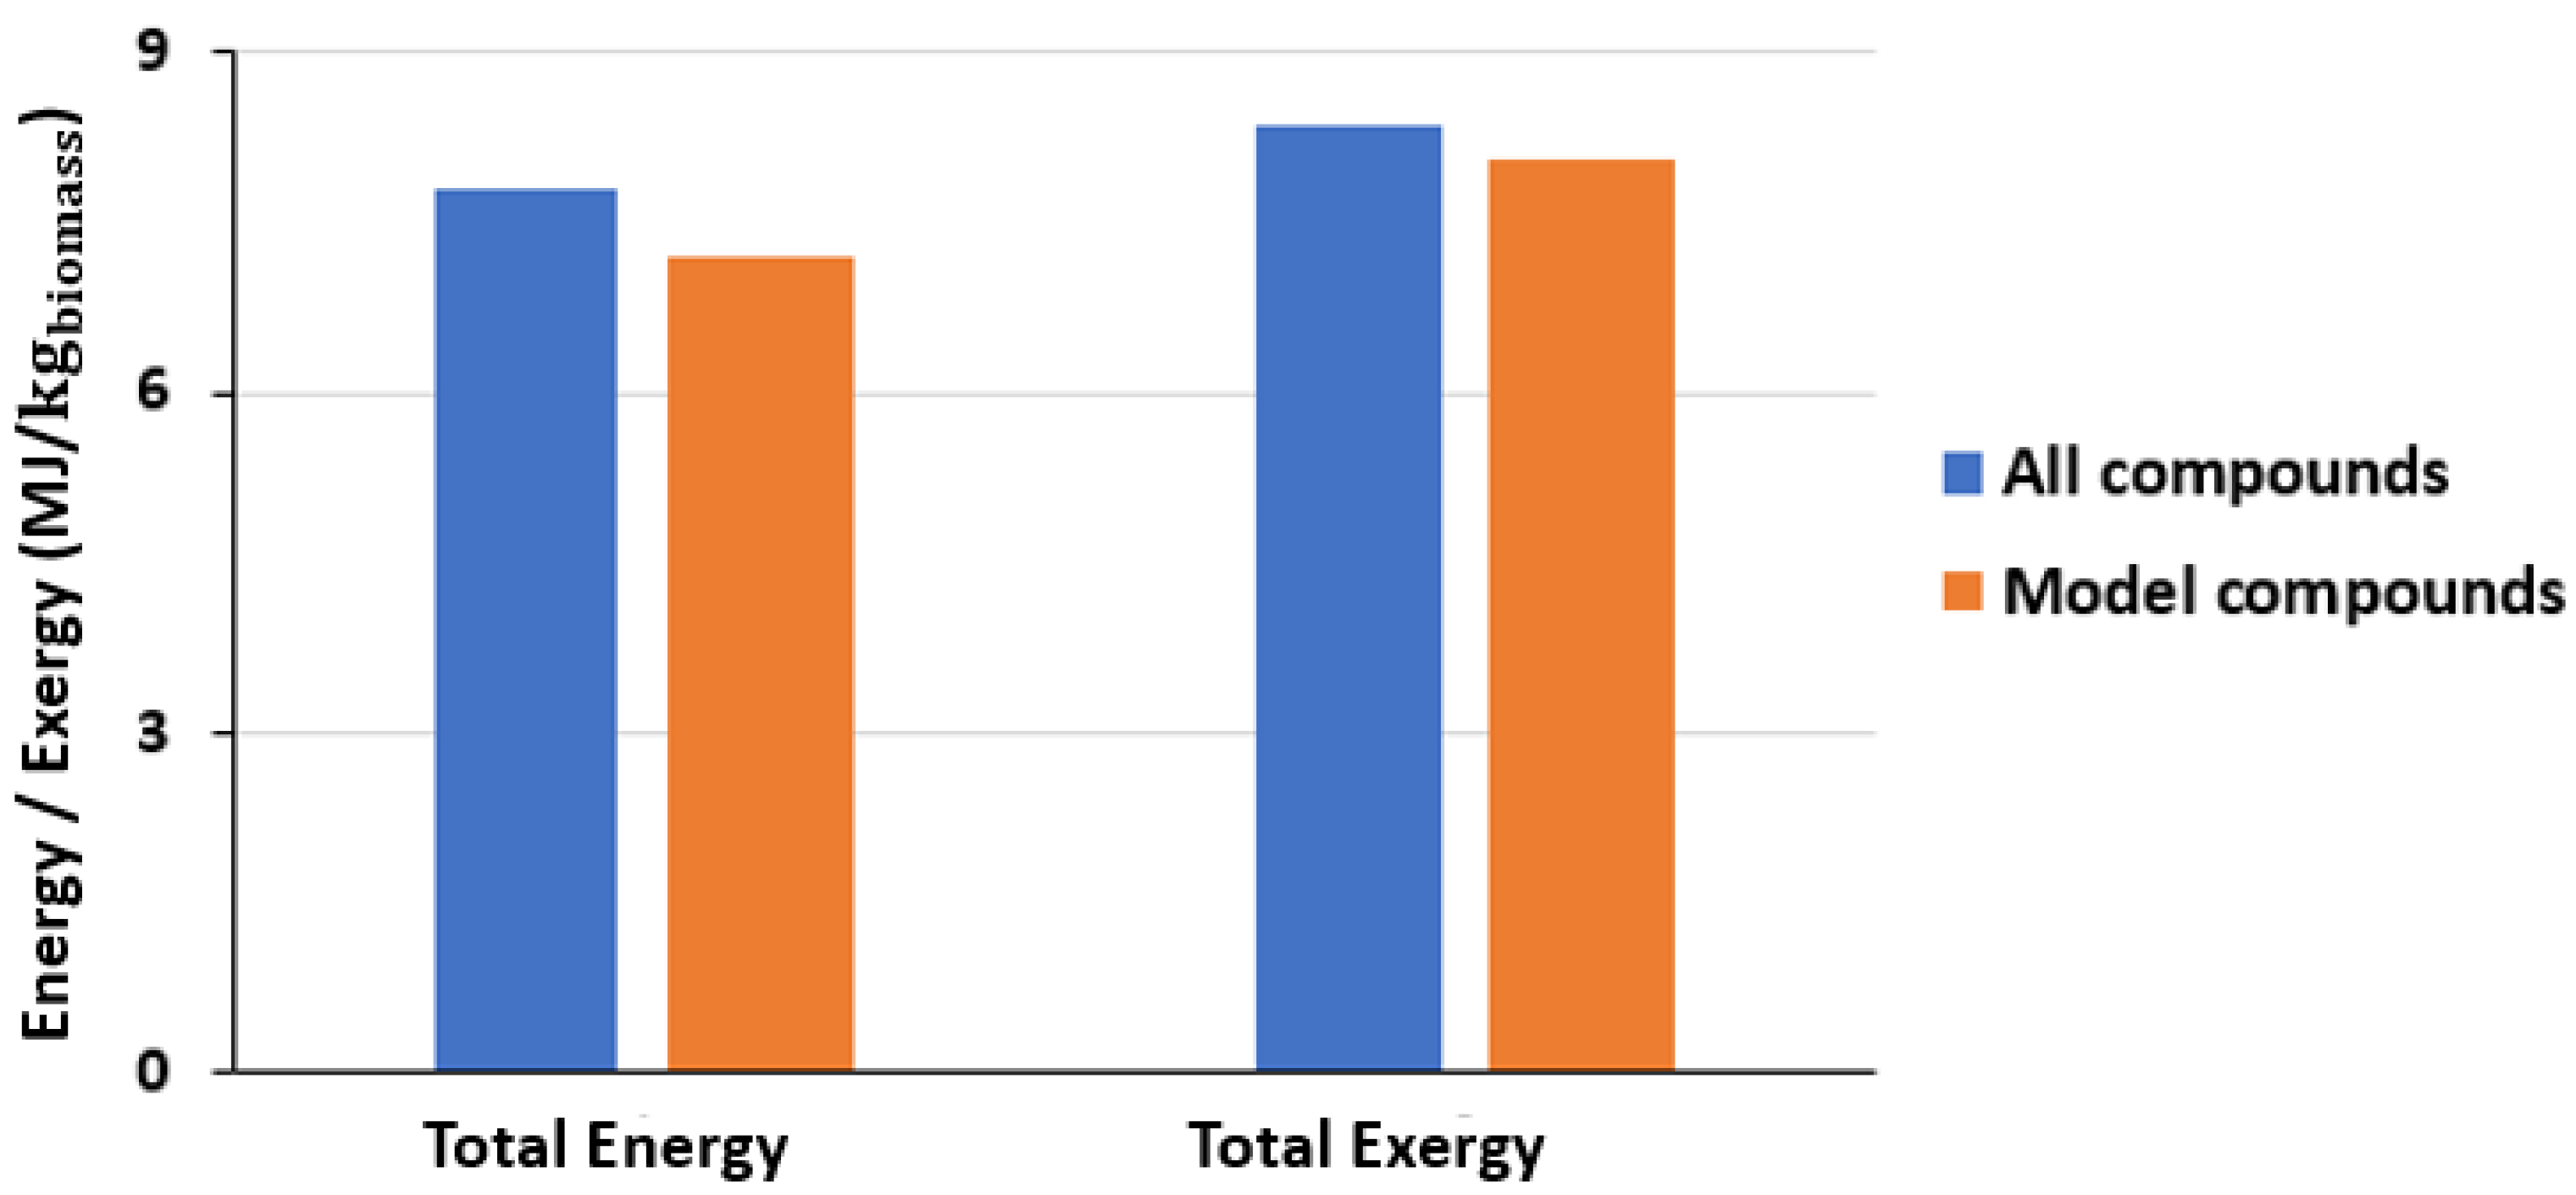
The total energy/exergy rate of the bio-oil is shown in Figure 11. It is evident that the “all compounds” approach yielded a higher total energy and total exergy of the liquid product stream than the “model compounds” approach. In both situations, the percentage difference was almost 6%. Additionally, it was observed that the bio-oil exergy rate exceeded its energy rate. One explanation for this phenomenon could be that the physical energy was neglected, which is why the predicted total energy is smaller.

4. Conclusions

The synthesis of bio-oil from biomass pyrolysis in an Auger reactor was thermodynamically analyzed in this paper. The thermodynamic evaluation of a pyrolysis system for the catalytic deoxygenation of pyrolysis vapors in a fluidized bed reactor connected to the Auger reactor in order to produce an improved bio-oil was also presented. Furthermore, a comparative examination of various approaches for the energetic and exergetic analysis of the bio-oil was conducted. The following conclusions were reached:
  • At a temperature of 500 °C, the heat of pyrolysis and the exergy efficiency in the continuous screw reactor were, respectively, 1.20 MJ/kgbiomass and 90.3%.
  • The energy yield of the bio-oil improved significantly from 9.3 to 11.3 MJ/kgbiomass in the pyrolysis system with catalytic treatment, and the exergy efficiency rose to 91.6%, indicating less energy degradation.
  • The aromatic groups are primarily responsible for the bio-oil increased energy rate. With a value of 6.20 MJ/kgbiomass, they account for 55.1% of the total energy rates, followed by the phenolic group in the second place.
  • The two approaches used in the continuous system to estimate the bio-oil total energy and total exergy differed by 6% when compared with respect to the “all compounds” method. In contrast, the two approaches differed significantly in terms of functional categories. The groups with the biggest energy analysis differences in the bio-oil sample from pyrolysis were the nitrogenates, esters, and guaiacols with 20, 16, and 15%, respectively.

Author Contributions

Conceptualization, B.C., L.A., and B.T.; methodology, L.A., B.T., and B.C.; validation, B.C., M.J., L.A., and B.T.; formal analysis, B.C.; investigation, B.C., L.A., and B.T.; resources, L.A. and B.T.; data curation, B.C., M.J., L.A., and B.T.; writing—original draft preparation, B.C. and M.J.; writing—review and editing, M.J., L.A., and B.T.; visualization, B.C., M.J., L.A., and B.T.; supervision, L.A. and B.T.; project administration, B.T.; funding acquisition, B.T. and L.A. All authors have read and agreed to the published version of the manuscript.

Funding

This work has been funded with the support from the Ministry of Science and Technology of the Dominican Republic (MESCYT) and the Project PROTEM from the Regional Council of Normandie.

Data Availability Statement

The original contributions presented in this study are included in the article. Further inquiries can be directed to the corresponding author.

Conflicts of Interest

The authors declare no conflicts of interest.

Appendix A

Table A1. Coefficients of specific heat capacity of common gases at constant pressure and 273–1800 K temperature range [27].
SubstanceAb ( × 10−2)c ( × 10−5)d ( × 10−9)
H229.11−0.19160.4003−0.8704
CO28.160.16750.5372−2.222
CO222.265.981−3.5017.469
CH419.895.0241.269−11.01
C2H221.89.2143−6.52718.21
C2H43.9515.64−8.34417.67
C2H66.917.27−6.4067.285
C3H63.1523.83−12.1824.62
C3H8−4.0430.48−15.7231.74
N228.9−0.15710.8081−2.873
H2O(g)32.240.19231.055−3.595
Table A2. Enthalpy, entropy, low calorific value, and standard chemical exergy of some gases at 25 °C [27,29,30].
Substance h 0
(kJ/kmol)
S 0
(kJ/kmol K)
LHV
(kJ/kmol)
E x c h
(kJ/kmol)
H28469130.57240,420236,100
CO8669197.54282,800275,100
CO29364213.69-19,870
CH410,018.7186.16801,280831,650
C2H210,012200.851,253,2001,265,000
C2H410,518219.321,321,6001,361,100
C2H610,900229.491,425,0001,495,000
C3H614,000266.941,957,2002,002,700
C3H814,775.8269.912,037,2002,152,800
N28669191.5-720
H2O(g)9904188.84-9.5
Table A3. Main compounds identified by GC-MS analysis of bio-oil from beech wood pyrolysis at 500 °C.
No.CompoundsChemical FormulaMM (g/mol)
12,5-dimethyl-FuranC6H8O96
23-Penten-2-oneC5H8O84
32-ButenalC4H6O70
4Acetic acidC2H4O260
52,3-PentanedioneC5H8O2100
6Propanedioic acidC3H4O4104
71-hydroxy-2-propanoneC3H6O274
8Benzyl methyl ketoneC9H10O134
92-Butanone, 3-hydroxy-C4H8O288
103-Penten-2-one, (E)-C5H8O84
11Isopropyl AlcoholC3H8O60
122-Propanol, 2-methyl-C4H10O74
13Propanoic acidC3H6O274
143-Pentanone, 2,4-dimethyl-C7H14O114
151-Methoxy-2-propyl acetateC6H12O3132
162-Hexanone, 3-methyl-C7H14O114
173-Hexen-2-oneC6H10O98
18CyclopentanoneC5H8O84
191-Hydroxy-2-butanoneC4H8O288
201,2-Ethanediol, monoacetateC4H8O3104
213-FuraldehydeC5H4O296
223-methyl-CyclohexanolC7H14O114
23Succindialdehyde (butanedial)C4H6O286
242-Cyclopenten-1-oneC5H6O82
25FurfuralC5H4O296
261-Propen-2-ol, acetateC5H8O2103
272-FuranmethanolC5H6O298
281-(acetyloxy)-2-PropanoneC5H8O3116
292-methyl-2-Cyclopenten-1-oneC6H8O96
302-ButanoneC4H8O72
311-(2-furanyl)-EthanoneC6H6O2110
321,2-CyclopentanedioneC5H6O298
332-Furanmethanol, 5-methyl-C6H8O2112
345-methyl-2-FurancarboxaldehydeC6H6O2110
35Propanoic acid, ethenyl esterC5H8O2100
361-(acetyloxy)-2-ButanoneC6H10O3130
37Spiro [2,4]heptan-4-oneC7H10O110
383-methyl-2-Cyclopenten-1-oneC6H8O96
39ButyrolactoneC4H6O286
402(5H)-FuranoneC4H4O284
415-methyl-2(5H)-FuranoneC5H6O298
42Cyclohexanone, 2-(hydroxymethyl)-C7H12O2128
43N-hexyl-1-HexanamineC12H27N185
443-methyl-1,2-CyclopentanedioneC6H8O2112
452-methyl-2-PentenalC6H10O98
462-hydroxy-3-methyl-2-Cyclopenten-1-oneC6H8O2112
47PhenolC6H6O94
48o-GuaiacolC7H8O2124
494-methyl-phenolC7H8O108
502-methyl-phenolC7H8O108
51Ethyl CyclopentenolideC7H10O2126
522,5-dimethyl-phenolC8H10O122
53Heptyl caprylateC15H30O2242
54p-CresolC7H8O108
552-methoxy-3-methyl-phenolC8H10O2138
56CreosolC8H10O2138
573-Methyl-2-(2-oxopropyl)furanC8H10O2138
582,6-dimethyl-phenolC8H10O122
593,4-DimethoxytolueneC9H12O2152
602,3,5-trimethyl-1,4-BenzenediolC9H12O2152
614-ethyl-2-methoxy--PhenolC9H12O2152
62NonanalC9H18O142
634-PiperidinemethanamineC6H14N2114
64Piperidine, 4-methyl-1-nitroso-C6H12N2O128
65UndecanalC11H22O170
661,4:3,6-Dianhydro-α-d-glucopyranoseC6H8O4144
67d-Glycero-d-ido-heptoseC7H14O7210
68p-VinylguaiacolC9H10O2150
692-methoxy-4-(1-propenyl)-phenolC10H12O2164
702-methoxy-4-propyl-phenolC10H14O2166
712,6-dimethoxy-phenolC8H10O3154
72GuanosineC10H13N5O5283
73IsoeugenolC10H12O2164
743-methyl-benzenodiolC7H8O2124
75SucroseC12H22O11342
76trans-IsoeugenolC10H12O2164
773.5-Dimethoxy-4-hydroxytolueneC9H12O3168
78Vanillin, acetateC10H10O4194
79DihydrojasmoneC11H18O166
80HydroquinoneC6H6O2110
811,2,3-trimethoxy-5-methyl-BenzeneC10H14O3182
82t-ButylhydroquinoneC10H14O2166
834-ethenyl-2,6-dimethoxy-PhenolC10H12O3180
841-(4-hydroxy-3-methoxyphenyl)-2- PropanoneC10H12O3180
852,6-dimethoxy-4-(2-propenyl)-PhenolC11H14O3194
864-Hydroxy-2-methylbenzaldehydeC8H8O2136
874-(3-hydroxy-1-propenyl)-2-methoxy-PhenolC10H12O3180
882-Propenoic acid, 3-(4-hydroxy-3-methoxyphenyl)-C10H10O4194
89Undecanoic acidC11H22O2186
901,6:3,4-Dianhydro-2-O-acetyl-β-dtalopyranoseC8H10O5186
91LevoglucosanC6H10O5162
92(E)-2,6-Dimethoxy-4-(prop-1-en-1-yl)phenolC11H14O3194
93Benzaldehyde, 4-hydroxy-3,5-dimethoxy-C9H10O4182
94D-MannoheptuloseC7H14O7210
95HomosyringaldehydeC10H12O4196
96Ethanone, 1-(4-hydroxy-3,5-dimethoxyphenyl)-C10H12O4196
97SyringylacetoneC11H14O4210
981-Propanone, 1-(4-hydroxy-3,5-dimethoxyphenyl)-C11H14O4210
99trans-Sinapyl alcoholC11H14O4210

References

  1. Elhenawy, Y.; Fouad, K.; Bassyouni, M.; Al-Qabandif, O.A.; Majozi, T. Yield and energy outputs analysis of sawdust biomass pyrolysis. Energy Convers. Manag. X 2024, 22, 100583. [Google Scholar] [CrossRef]
  2. Sudalaimuthu, P.; Sathyamurthy, R.; Elsheikh, A.H.; Abdul Jameel, A.G. Plastic waste as an alternative sustainable fuel in internal combustion (IC) engines—A comprehensive review. Results Eng. 2025, 26, 104644. [Google Scholar] [CrossRef]
  3. Buelvas, A.; Quintero-Coronel, D.A.; Vanegas, O.; Ortegon, K.; Bula, A.; Mesa, J.; González-Quiroga, A. Gasification of solid biomass or fast pyrolysis bio-oil: Comparative energy and exergy analyses using AspenPlus®. Eng. Rep. 2024, 6, e12825. [Google Scholar] [CrossRef]
  4. Yaqoob, H.; Muhammad Ali, H.; Sajjad, U.; Hamid, K. Investigating the potential of plastic pyrolysis oil-diesel blends in diesel engine: Performance, emissions, thermodynamics and sustainability analysis. Results Eng. 2024, 24, 103336. [Google Scholar] [CrossRef]
  5. Xu, F.; Tian, Y.; Shao, Y.; Wang, J.; Zhang, Y.; Qiao, Y. Parametric investigation of the effects on waste tire pyrolysis oil in a downdraft tube reactor. Energy 2025, 314, 134267. [Google Scholar] [CrossRef]
  6. Chen, W.H.; Ho, K.Y.; Aniza, R.; Sharma, A.K.; Saravanakumar, A.; Hoang, A.T. A review of noncatalytic and catalytic pyrolysis and co-pyrolysis products from lignocellulosic and algal biomass using Py-GC/MS. J. Ind. Eng. Chem. 2024, 134, 51–64. [Google Scholar] [CrossRef]
  7. Bieniek, A.; Sieradzka, M.; Wądrzyk, M.; Jerzak, W.; Magdziarz, A. The application of a drop-tube reactor for fast pyrolysis of agricultural biomass: An effective way to valuable products. Chemosphere 2024, 368, 143698. [Google Scholar] [CrossRef]
  8. Wako, F.M.; Pio, G.; Lofti, A.; Salzano, E.; Farooqui, A.; Mahinpey, N. Performance assessment of drop tube reactor for biomassfast pyrolysis using process simulator. Can. J. Chem. Eng. 2023, 101, 7053–7067. [Google Scholar] [CrossRef]
  9. Guda, V.K.; Toghiani, H. Catalytic upgrading of pinewood fast pyrolysis vapors using an integrated Auger-packed bed reactor system: Effects of acid catalysts on yields and distribution of pyrolysis products. J. Prod. Ind. 2015, 4, 33–43. [Google Scholar]
  10. Tang, Y.; Dong, J.; Chi, Y.; Zhou, Z.; Ni, M. Energy and Exergy Analyses of Fluidized-Bed Municipal Solid Waste Air Gasification. Energy Fuels 2016, 30, 7629–7637. [Google Scholar] [CrossRef]
  11. Hatem, F.A.; Alhumairi, M.K.A.; Al-Obaidi, M.A.; Mohammad, A.T.; Darwish, A.S.K. Upgrading gas turbine efficiency for sustainable power generation: An energy and exergy analyses. Results Eng. 2025, 26, 105489. [Google Scholar] [CrossRef]
  12. Atsonios, K.; Panopoulos, K.D.; Bridgwater, A.V.; Kakaras, E. Biomass fast pyrolysis energy balance of a 1kg/h test rig. Int. J. Thermodyn. 2015, 18, 267–275. [Google Scholar] [CrossRef]
  13. Thoharudin; Hsiau, S.-S.; Chen, Y.S.; Yang, S. Design optimization of fluidized bed pyrolysis for energy and exergy analysis using a simplified comprehensive multistep kinetic model. Energy 2023, 276, 127615. [Google Scholar] [CrossRef]
  14. Peters, J.F.; Petrakopoulou, F.; Dufour, J. Exergetic analysis of a fast pyrolysis process for bio-oil production. Fuel Process. Technol. 2014, 119, 245–255. [Google Scholar] [CrossRef]
  15. Peters, J.F.; Petrakopoulou, F.; Dufour, J. Exergy analysis of synthetic biofuel production via fast pyrolysis and hydro upgrading. Energy 2015, 79, 325–336. [Google Scholar] [CrossRef]
  16. Keedy, J.; Prymak, E.; Macken, N.; Pourhashem, G.; Spatari, S.; Mullen, C.A.; Boateng, A.A. Exergy Based assessment of the production and conversion of switchgrass, equine waste, and forest residue to bio-oil using fast pyrolysis. Ind. Eng. Chem. Res. 2015, 54, 529–539. [Google Scholar] [CrossRef]
  17. Zhou, C.; Zhang, Y.; Siyal, A.A.; Gao, Z.; Deng, Z.; Mao, X.; Liu, Y.; Wang, L.; Xing, X.; Chen, Y.; et al. Energy and exergy analyses, and elemental distribution of microwave-assisted auger pyrolysis of textile dyeing sludge and furfural residue. Appl. Therm. Eng. 2024, 248, 123140. [Google Scholar] [CrossRef]
  18. Zhang, Y.; Ji, G.; Ma, D.; Chen, C.; Wang, Y.; Wang, W.; Li, A. Exergy and energy analysis of pyrolysis of plastic wastes in rotary kiln with heat carrier. Process Saf. Environ. Prot. 2020, 142, 203–211. [Google Scholar] [CrossRef]
  19. Hasan, M.M.; Rasul, M.G.; Jahirul, M.I.; Mofijur, M. Fuelling the future: Unleashing energy and exergy efficiency from municipal green waste pyrolysis. Fuel 2024, 357, 129815. [Google Scholar] [CrossRef]
  20. Boateng, A.A.; Mullen, C.A.; Osgood-Jacobs, L.; Carlson, P.; Macken, N. Mass balance, energy, and exergy analysis of bio-oil production by fast pyrolysis. J. Energy Resour. Technol. 2012, 134, 042001. [Google Scholar] [CrossRef]
  21. Temireyeva, A.; Sarbassov, Y.; Shah, D. Process simulation of flax straw pyrolysis with kinetic reaction Model: Experimental validation and exergy analysis. Fuel 2024, 367, 131494. [Google Scholar] [CrossRef]
  22. Mohabeer, C.; Abdelouahed, L.; Marcotte, S.; Taouk, B. Comparative analysis of pyrolytic liquid products of beech wood, flax shives and woody biomass components. J. Anal. Appl. Pyrolysis 2017, 127, 269–277. [Google Scholar] [CrossRef]
  23. Reyes, L.; Abdelouahed, L.; Mohabeer, C.; Buvat, J.C.; Taouk, B. Energetic and exergetic study of the pyrolysis of lignocellulosic biomasses, cellulose, hemicellulose and lignin. Energy Convers. Manag. 2021, 244, 114459. [Google Scholar] [CrossRef]
  24. García, R.; Pizarro, C.; Lavín, A.G.; Bueno, J.L. Biomass proximate analysis using thermogravimetry. Bioresour. Technol. 2013, 139, 1–4. [Google Scholar] [CrossRef]
  25. Campusano, B.; Jabbour, M.; Abdelouahed, L.; Mignot, M.; Devouge-Boyer, C.; Taouk, B. Improvement of Properties of Bio-Oil from Biomass Pyrolysis in Auger Reactor Coupled to Fluidized Catalytic Bed Reactor. Processes 2024, 12, 2368. [Google Scholar] [CrossRef]
  26. Wang, X.; Lv, W.; Guo, L.; Zhai, M.; Dong, P.; Qi, G. Energy and exergy analysis of rice husk high-temperature pyrolysis. Int. J. Hydrogen Energy 2016, 41, 21121–21130. [Google Scholar] [CrossRef]
  27. Çengel, Y.A.; Boles, M.A. Thermodynamics: An Engineering Approach, 8th ed.; McGraw-Hill Education: New York, NY, USA, 2015. [Google Scholar]
  28. Prestipino, M.; Piccolo, A.; Vilela, C.V.; Galvagno, A. Cogeneration processes based on giant reed gasification combined with ORC and district heating for heat recovery: Comparative energy and exergy analysis. Renew. Energy 2025, 238, 121944. [Google Scholar] [CrossRef]
  29. Linstrom, P.J. NIST Chemistry WebBook, NIST Standard Reference Database 69; National Institute of Standards and Technology: Gaithersburg, MD, USA, 1997. [Google Scholar]
  30. Szargut, J. Exergy Method: Technical and Ecological Applications; Environmental Science, Engineering; WIT Press: Southampton, UK, 2005. [Google Scholar]
  31. Hosokai, S.; Matsuoka, K.; Kuramoto, K.; Suzuki, Y. Modification of Dulong’s formula to estimate the heating value of gas, liquid and solid fuels. Fuel Process. Technol. 2016, 152, 399–405. [Google Scholar] [CrossRef]
  32. Wu, Y.; Yang, W.; Blasiak, W. Energy and Exergy Analysis of High Temperature Agent Gasification of Biomass. Energies 2014, 7, 2107–2122. [Google Scholar] [CrossRef]
  33. Dupont, C.; Chiriac, R.; Gauthier, G.; Toche, F. Heat capacity measurements of various biomass types and pyrolysis residues. Fuel 2014, 115, 644–651. [Google Scholar] [CrossRef]
  34. Singh, R.K.; Jena, K.; Chakraborty, J.P.; Sarkar, A. Energy and exergy analysis for torrefaction of pigeon pea stalk (cajanus cajan) and eucalyptus (eucalyptus tereticornis). Int. J. Hydrogen Energy 2020, 45, 18922–18936. [Google Scholar] [CrossRef]
  35. Baghel, P.; Sakhiya, A.K.; Kaushal, P. Influence of temperature on slow pyrolysis of Prosopis Juliflora: An experimental and thermodynamic approach. Renew. Energy 2022, 185, 538–551. [Google Scholar] [CrossRef]
  36. Eboh, F.C.; Ahlström, P.; Richards, T. Estimating the specific chemical exergy of municipal solid waste. Energy Sci. Eng. 2016, 4, 217–231. [Google Scholar] [CrossRef]
  37. Yang, H.; Kudo, S.; Ku, H.P.; Norinaga, K.; Mori, A.; Mašek, O.; Hayashi, J. Estimation of Enthalpy of Bio-Oil Vapor and Heat Required for Pyrolysis of Biomass. Energy Fuels 2013, 27, 2675–2686. [Google Scholar] [CrossRef]
  38. dos Reis Ferreira, R.A.; da Silva Meireles, C.; Assunção, R.M.N.; Reis Soares, R. Heat required and kinetics of sugarcane straw pyrolysis by TG and DSC analysis in different atmospheres. J. Therm. Anal. Calorim. 2018, 132, 1535–1544. [Google Scholar] [CrossRef]
  39. Ábrego, J.; Atienza-Martínez, M.; Plou, F.; Arauzo, J. Heat requirement for fixed bed pyrolysis of beechwood chips. Energy 2019, 178, 145–157. [Google Scholar] [CrossRef]
  40. Torres, E.; Rodriguez-Ortiz, L.A.; Zalazar, D.; Echegaray, M.; Rodriguez, R.; Zhang, H.; Mazza, G. 4-E (environmental, economic, energetic and exergetic) analysis of slow pyrolysis of lignocellulosic waste. Renew. Energy 2020, 162, 296–307. [Google Scholar] [CrossRef]
  41. Osgood-Jacobs, L.; Boateng, A.A.; Carlson, C.; Mullen, C.A.; Macken, N. Mass Balance and Exergy Analysis of a Fast Pyrolysis System. Energy Syst. Anal. 2011, 4, 21–26. [Google Scholar] [CrossRef]
  42. Parvez, A.M.; Wu, T.; Afzal, M.T.; Mareta, S.; He, T.; Zhai, M. Conventional and microwave-assisted pyrolysis of gumwood: A comparison study using thermodynamic evaluation and hydrogen production. Fuel Process. Technol. 2019, 184, 1–11. [Google Scholar] [CrossRef]
  43. Sakhiya, A.K.; Baghel, P.; Pathak, S.; Vijay, V.K.; Kaushal, P. Effect of Process Parameters on Slow Pyrolysis of Rice Straw: Product Yield and Energy Analysis. In Proceedings of the International Conference and Utility Exhibition on Energy, Environment and Climate Change (ICUE), Pattaya, Thailand, 20–22 October 2020; pp. 1–9. [Google Scholar] [CrossRef]
Figure 1. Schematic diagram of the Auger pyrolysis reactor coupled to a fluidized bed catalytic reactor [25].
Processes 13 02496 g001
Figure 2. Input and output streams without (a) and with catalytic deoxygenation (b).
Processes 13 02496 g002
Figure 3. Effect of modified zeolite catalyst on product distribution.
Processes 13 02496 g003
Figure 4. Influence of the amount of FeZSM-5 on the distribution of the liquid phase (wt.%).
Processes 13 02496 g004
Figure 5. Energy and exergy distribution of pyrolysis products with and without catalytic treatment at 500 °C.
Processes 13 02496 g005
Figure 6. Mass fraction of non-condensable gases with and without catalytic treatment.
Processes 13 02496 g006
Figure 7. Energy distribution of the gas products during the non-catalytic and catalytic experiments at 500 °C.
Processes 13 02496 g007
Figure 8. Exergy distribution of the gas products during the non-catalytic and catalytic experiments at 500 °C.
Processes 13 02496 g008
Figure 9. Energy evaluation of the bio-oil considering “model compounds” and “all compounds” methods in a continuous Auger reactor at 500 °C.
Processes 13 02496 g009
Figure 10. Exergy evaluation of the bio-oil considering “model compounds” and “all compounds” methods in a continuous Auger reactor at 500 °C.
Processes 13 02496 g010
Figure 11. Total energy and exergy contribution of the bio-oil considering the “model compounds” and “all compounds” method in a continuous Auger reactor at 500 °C.
Processes 13 02496 g011
Table 1. Energetic and exergetic efficiencies recorded in the literature.
BiomassEnergy Efficiency (%)Exergy Efficiency (%)References
Textile dyeing sludge38.9336.65[14]
Furfural residue82.2481.82[14]
Plastic mixture60.9–67.359.4–66.0[15]
Waste72.8968.4[16]
Table 2. Elemental and proximate analysis of beech wood.
Elemental analysis (wt.%)Carbon
44.77
Hydrogen
5.72
Nitrogen
0.23
Oxygen a
49.28
Proximate analysis (wt.%)Humidity
6.23
Volatile matter
75.4
Fixed Carbon
17.54
Ash
0.83
a Obtained by the mass difference (100 − (C + H + N)%).
Table 3. Influence of the amount of FeZSM-5 on the distribution of the gas phase (wt.%).
No Catalysis1.4%FeHZSM-55%FeHZSM-510%FeHZSM-5
CO424441.542.5
CO247353532
CH4710.511.510
H212.547.5
C2 (C2H2, C2H4, C2H6)23.7544
C3 (C3H4, C3H6, C3H8)14.2544
Table 4. Chemical families of the obtained bio-oil and associated model molecules.
Chemical FamilyModel MoleculeFormula
AcidsAcetic acidC2H4O2
PhenolsPhenol, 2,6-dimethyl-C8H10O
AldehydesFurfuralC5H4O2
AlcoholsCyclohexanol, 3-methylC7H14O
Amides4-piperidinmethanamineC6H14N2
Ketones2-propanone, 1-hydroxy-C3H6O2
Esters1-propen-2-ol, acetateC5H8O2
FuransFuran, 2,5-dimethyl-C6H8O2
GuaiacolPhenol, 2,6-dimethoxy-C8H10O3
SugarsLevoglucosanC6H10O5
Table 5. Energy and exergy rates of bio-oil chemical groups with and without catalytic treatment.
En (MJ/kgbiomass)Ex (MJ/kgbiomass)
No Catalysis5%FeHZSM-5No Catalysis5%FeHZSM-5
Acids2.880.572.770.55
Phenols0.761.780.751.74
Aldehydes0.350.070.350.07
Alcohols0.040.400.030.39
Nitrogenates0.070.040.060.04
Ketones2.220.762.190.75
Esters0.340.000.340.00
Furans0.470.480.470.48
Guaiacols1.450.321.440.31
Sugar0.670.130.640.12
Aromatics0.006.200.006.23
PAH0.000.500.000.50
Total9.2611.259.0511.19
Table 6. Exergy efficiency and exergy destruction.
Exergy Efficiency (%)
[This Work]
Exergy Efficiency in Literature (%)
[20,37]
Exergy Destruction (%)
No catalysis90.381.16–90.49.7
5%FeHZSM-591.6-8.4
Disclaimer/Publisher’s Note: The statements, opinions and data contained in all publications are solely those of the individual author(s) and contributor(s) and not of MDPI and/or the editor(s). MDPI and/or the editor(s) disclaim responsibility for any injury to people or property resulting from any ideas, methods, instructions or products referred to in the content.