Article

Numerical Simulation Analysis of Cu2+ Concentration for Marine Biological Control Based on Seawater Lifting Pump

1
CNOOC China Ltd. Zhanjiang, Zhanjiang, Guangdong 524000, China
2
College of Petroleum Engineering, Liaoning Petrochemical University, Fushun 113001, China
3
College of Chemical Engineering, Sichuan University of Science and Engineering, Zigong 643000, China
*
Author to whom correspondence should be addressed.
Processes 2025, 13(8), 2440; https://doi.org/10.3390/pr13082440
Submission received: 1 July 2025 / Revised: 29 July 2025 / Accepted: 30 July 2025 / Published: 1 August 2025
(This article belongs to the Section Environmental and Green Processes)

Abstract

To prevent marine biofouling in seawater lift pumps, electrolyzed seawater containing Cu2+ needs to be injected into the pumps. This study employs Computational Fluid Dynamics (CFD) to simulate the variation in Cu2+ injection concentration required to achieve a Cu2+ concentration of 3 ppb within a 10 cm range around the pump under different operating conditions, including the installation of baffles and varying seawater flow rates. The simulation results demonstrate that CFD can accurately predict the distribution of Cu2+ concentration in electrolyzed seawater, with the distribution significantly influenced by seawater flow direction, necessitating reference to upstream data. When the lift pumps are idle, the required Cu2+ injection concentration increases with rising seawater flow rates, reaching 41.9 μg/L at the maximum flow rate of 1.9 m/s. During alternating pump operation, the required Cu2+ injection concentration also increases with the flow rate, significantly affected by the pump’s operational position: lower concentrations are required when the upstream pump is active compared to the downstream pump. Additionally, installing baffles around the pumps effectively mitigates the impact of seawater flow on Cu2+ distribution, significantly reducing the required injection concentration. This study provides theoretical and data-driven insights for optimising marine biofouling prevention in seawater lift pumps.

1. Introduction

Maintaining the production of offshore oil platforms necessitates the utilisation of a substantial volume of production water. Given the considerable distance between the platform and the land, it is not feasible to utilise a substantial quantity of fresh water. Consequently, seawater can only be taken on-site. Seawater is utilised for a variety of applications, including process medium cooling, equipment cooling, air conditioning, well repair and drilling, and deck flushing. Should the necessity arise, it may be employed for the injection of water into the bottom, or for the fulfilment of other objectives [1]. The seawater lift pump is an essential component in the offshore oil industry, particularly in the context of mobile production, storage, and unloading facilities. The process of extracting seawater from the deep sea involves the utilisation of centrifugal force to elevate it to various pieces of equipment situated on the platform, thereby fulfilling the previously outlined requirements [2,3]. It is well-documented that the long-term immersion of seawater lift pumps in the deep sea can result in the adhesion of marine organisms, such as seaweed, shells, and barnacles, to the pipes, valves, and pump body of the seawater lift pump. This phenomenon is known as biofouling. The presence of biofouling has been demonstrated to have a detrimental effect on the efficiency of the pump, and moreover, it has been shown to cause damage to the pump itself, resulting in increased maintenance costs. The phenomenon of biofouling can be defined as the accumulation of organisms such as marine plankton on the inner surfaces of pipes, tanks, and other structures in the marine environment. This accumulation can result in the obstruction of these structures, thereby restricting the normal flow of water and reducing the pumping capacity of the affected equipment. In extreme cases, this accumulation can even cause the malfunction of the affected equipment [4,5]. It is imperative to implement measures to prevent and control the pollution of seawater by marine organisms through the utilisation of lift pumps.
Marine biological control technology, which includes anti-fouling coating technology, involves the application of coatings containing chemical substances that have the capacity to impede the growth of marine organisms. These substances are then sprayed onto the lift pump. However, these coatings are subject to degradation over time, which can result in the release of toxic substances into the marine environment, necessitating regular replacement [6,7]. Ultrasonic anti-marine biological technology employs ultrasonic physical methods to interfere with the attachment process of marine organisms. While its efficacy in rapidly removing marine organisms is well-documented, its long-term effects remain limited [8,9]. Biological control technology is a method for regulating the population of marine organisms that utilises natural enemies or competitive organisms, employing natural or biologically derived anti-fouling agents. These substances have a comparatively low level of pollution but their technological maturity is relatively low [10]. The technology that has been developed and is currently being used most widely for marine biological control using seawater lift pumps is the electrolytic copper and aluminium anti-fouling method [11,12]. The electrolytic process involving copper and aluminium anodes in a seawater environment has been shown to yield the generation of trace amounts of Cu2+, in conjunction with minor quantities of aluminium hydroxide or iron hydroxide flocs. These flocs, containing Cu2+, are known to flow into the vicinity of the seawater lift pump and adhere to the pump body, forming a thin protective layer that prevents the attachment of marine organisms. It has been demonstrated that when the concentration of Cu2+ in seawater reaches 2 ppb or more in the vicinity of the lift pump, Cu2+ can effectively inhibit the growth of marine organisms in the lift pump and seawater pipeline system [13,14]. The specific equation for copper-aluminium electrode electrolysis of seawater is as follows:
C u + 2 H 2 O + 2 N a C l E l e c t r o l y s i s H 2 + 2 N a O H + C u C l 2
4 O H 4 e E l e c t r o l y s i s O 2 + 2 H 2 O
2 C l 2 e E l e c t r o l y s i s C l 2
It is imperative to calculate the amount of OHCu2+ injected from the offshore oil platform to the vicinity of the lift pump in order to ensure the effectiveness of marine biological control by the lift pump and reduce Cu2+ pollution to seawater. This is because the distribution of Cu2+ around the seawater lift pump is influenced by various factors, such as the seawater flow rate, pump operation status, seawater displacement, number of pumps, and pump frame structure. The advent of sophisticated computing hardware and advanced software has precipitated the widespread adoption of Computational Fluid Dynamics (CFD) as a tool for the simulation and analysis of fluid flow phenomena and ion concentration distributions in fluids. This methodology employs computational and numerical techniques to solve the governing equations of fluid flow [15,16]. In the process of electrolytic seawater to prevent microorganisms, Al(OH)3 has a certain degree of synergistic effects on Cu2+, which helps to enhance the control effect on microorganisms. Copper anode electrolysis produces trace Cu2+, and its toxicity can inhibit the attachment and growth of marine organisms’ larvae and spores. Highly viscous Al(OH)3 flocs are formed by the electrolysis of the aluminium anode, which can adsorb Cu2+ and adhere to the inner wall of the pipeline to form a protective film. Cu2+ directly inhibited the growth of microorganisms, and Al(OH)3 prevented the attachment of microorganisms through physical barriers; the synergistic effect of the two was more thorough. This paper mainly studies the change law of the injection concentration required for Cu2+ to inhibit the growth of microorganisms in the range of 10 cm around the pump. In the future, we will continue to carry out research on the impact of total effluent toxicity or long-term environmental impact.
The present work employs the SCDM (SPCACLAIM ANSYS Space Claim Direct Modeler 2024) component of ANSYS for the purposes of model pre-processing and fluid domain modelling. Mesh importation is conducted to facilitate mesh partitioning, and a two-phase flow model is established using the Euler method in Fluent to achieve concentration diffusion simulation analysis. The simulation results are then compared and analysed with the field measurement results in order to verify the accuracy of the model. The simulation of the lifting pump’s operational conditions and the variation of Cu2+ concentration in electrolyzed seawater under diverse environmental conditions can provide substantial data support for on-site production. This optimisation of production parameters can, in turn, reduce detrimental impacts on the environment.

2. Mathematical Calculation Model

The turbulence model employs the k–ε turbulence model, the standard near wall function, and the pressure velocity is resolved using the coupling method. The discretisation of momentum, turbulence kinetic energy, and turbulence dissipation rate utilises the second-order upwind scheme. The wall is characterised by relative slip-free boundary conditions and a stationary wall.
The Euler method is predicated on the assumption that fluids are continuous media, and as such, it employs a series of equations—namely, the conservation equations of mass, momentum, and energy—to describe their movement.
(1)
Continuity equation
Any fluid flow problem must follow the conservation of mass equation, also known as the continuity equation. Its premise is to use a continuous medium model for the fluid, where velocity and density are continuous and differentiable functions of spatial coordinates and time. The continuity equation (Mass Conservation) is applied to ensure the conservation of mass in the flow field, coupled with the momentum equation via pressure correction methods (e.g., SIMPLE algorithm) to eliminate non-physical divergence in velocity fields in CFD.
φ t + · f = s
In the equation, φ is the flow function, m2/s; t is the time of fluid motion, s; ∇ is the vector differential operator; f is the velocity vector field, m/s; and s is the source term, kg/(m3·s).
(2)
Momentum equation
The equation for the conservation of momentum is a fundamental law that must be satisfied for any flow problem. This law is, in fact, Newton’s second law of motion, which stipulates that the rate of change in fluid momentum over time in any controlled element is equivalent to the sum of various forces acting on the element from the outside. The momentum equation describes the relationship between the change in fluid momentum and external forces (such as pressure and viscous forces). The momentum equation and the continuity equation are coupled and solved to balance the velocity and pressure fields. In particular, the viscous term and the pressure gradient need to be handled in CFD.
F = d d t τ ρ V d t + A V ρ V · n d A
In the formula, F is the combined external force vector, N; τ is a control body, and integration is performed on this control body; ρ is the density of the fluid, kg/m3; V is the velocity vector of the fluid, m/s; A is the surface area of the control body, m2; and n is the unit external normal vector of the control body surface used to indicate direction.
(3)
Energy equation
All flow systems that involve heat exchange must follow the law of conservation of energy. It is an equation that reflects the conservation of mechanical energy under uniform density; when considering changes in density, temperature, and internal energy, the equation is used to reflect the law of conservation of energy containing internal energy (see the first law of thermodynamics).
d d t τ ρ e d τ + A ρ e V · n d A = d Q d t + d W d t
In the formula, e is the internal energy per unit mass of fluid, J/kg; Q is heat, J; and W is the work carried out by the internal control system to the outside world per unit time, J.
(4)
Bernoulli equation
Prior to the formulation of the continuum theory equations in fluid mechanics, the fundamental principle employed in hydraulics was fundamentally the conservation of mechanical energy in fluids. It can be demonstrated that the sum of kinetic energy, gravitational potential energy, and pressure potential energy is constant. The most well-known inference derived from this data is that, when flowing at a constant height, the flow velocity is high and the pressure is low.
It should be noted that since the Bernoulli equation is derived from the conservation of mechanical energy, it is only applicable to ideal fluids where viscosity can be ignored and cannot be compressed. The Bernoulli equation is a simplified form of the energy equation in the steady flow of ideal fluid, which is used to analyse the conservation of mechanical energy under inviscid and non-heat exchange conditions. In CFD, it is often used as a boundary condition or verification tool, but the actual simulation still needs to rely on a complete energy equation.
p 1 + 1 2 ρ v 1 2 + ρ g h 1 = p 2 + 1 2 ρ v 2 2 + ρ g h 2
In the formula, p is the pressure at a certain point in the fluid, Pa; and h is the height at which it is located, m.

3. Physical Model

As demonstrated in Figure 1a, fluid domain modelling was completed in the SCDM pre-processing software. The model comprises a large pump, a small pump, and a pipe rack. The pump body comprises a motor, a coupling, an internal flow channel, and a transmission shaft. The structural configuration is illustrated in schematic diagram 1b. The copper ion seawater is injected and subsequently flows out from the pump filter screen through the internal channel of the pump. Following the construction of the fluid domain model, the mesh component must be opened in order to complete the mesh division. Firstly, the fluid domain is divided into grids [17], and the grid sensitivity analysis is carried out to find out the influence of grid size on the concentration error of Cu2+. The results are shown in Table 1. It can be seen from Table 1 that when the global grid is reduced from 120 mm to 30 mm, the concentration error of Cu2+ decreases from 23.7% to 5.8%, indicating that the grid independence is significantly improved. The maximum grid size is selected to be 30 mm to ensure that the numerical solution is not affected by the grid size.
The maximum mesh size is set at 30 mm and the ratio is configured to regulate the overall mesh size. In order to more accurately capture the flow characteristics of the rotation domain and blade region, it is necessary to encrypt them, given the complex fluid flow state in these two parts. This strategy for the partitioning of a grid can ensure both computational accuracy and control of computational complexity to a certain extent. The relevant boundaries of the model must be accurately defined as inlet and outlet. It is imperative to establish clear boundaries when simulating the inflow and outflow states of fluids, as this directly impacts the accuracy of the simulation results. Following the configuration of the pertinent parameters, the grid is to be updated. The updated grid is displayed in Figure 1c. At this juncture, the grid can be better adapted to subsequent numerical simulation calculations, thereby providing a high-quality grid foundation for in-depth analysis of physical phenomena such as flow and heat transfer in the fluid domain.

4. Results and Discussion

In consideration of the prevailing circumstances pertaining to the offshore oil platform, the configuration of two MOPU (Mobile Offshore Production Unit) seawater lift pumps was determined. In order to guarantee a constant water supply for the platform, the two pumps are operated in an alternating manner. The small-displacement seawater lift pump has a displacement of 204 m3/h, while the large-displacement seawater lift pump has a displacement of 500 m3/h. Statistical analysis of sea conditions indicates a range of seawater flow velocities from 0.88 to 1.9 m/s. In order to ensure the effective protection of the seawater system equipment and pipelines by the electrolytic copper aluminium device, it is necessary to inject seawater from the platform through a lifting pump under both intermittent and continuous working conditions, with an injection flow rate of 10 m3/d. The schematic diagram illustrating the electrolytic copper-aluminium seawater injection into the lifting pump is shown in Figure 1b. A concentration field of 3–5 ppb (µg/L) is formed within a 10 cm range of the seawater lift pump, which can meet the usage requirements.

4.1. Influence of Seawater Flow Rate on Concentration of Injected Cu2+

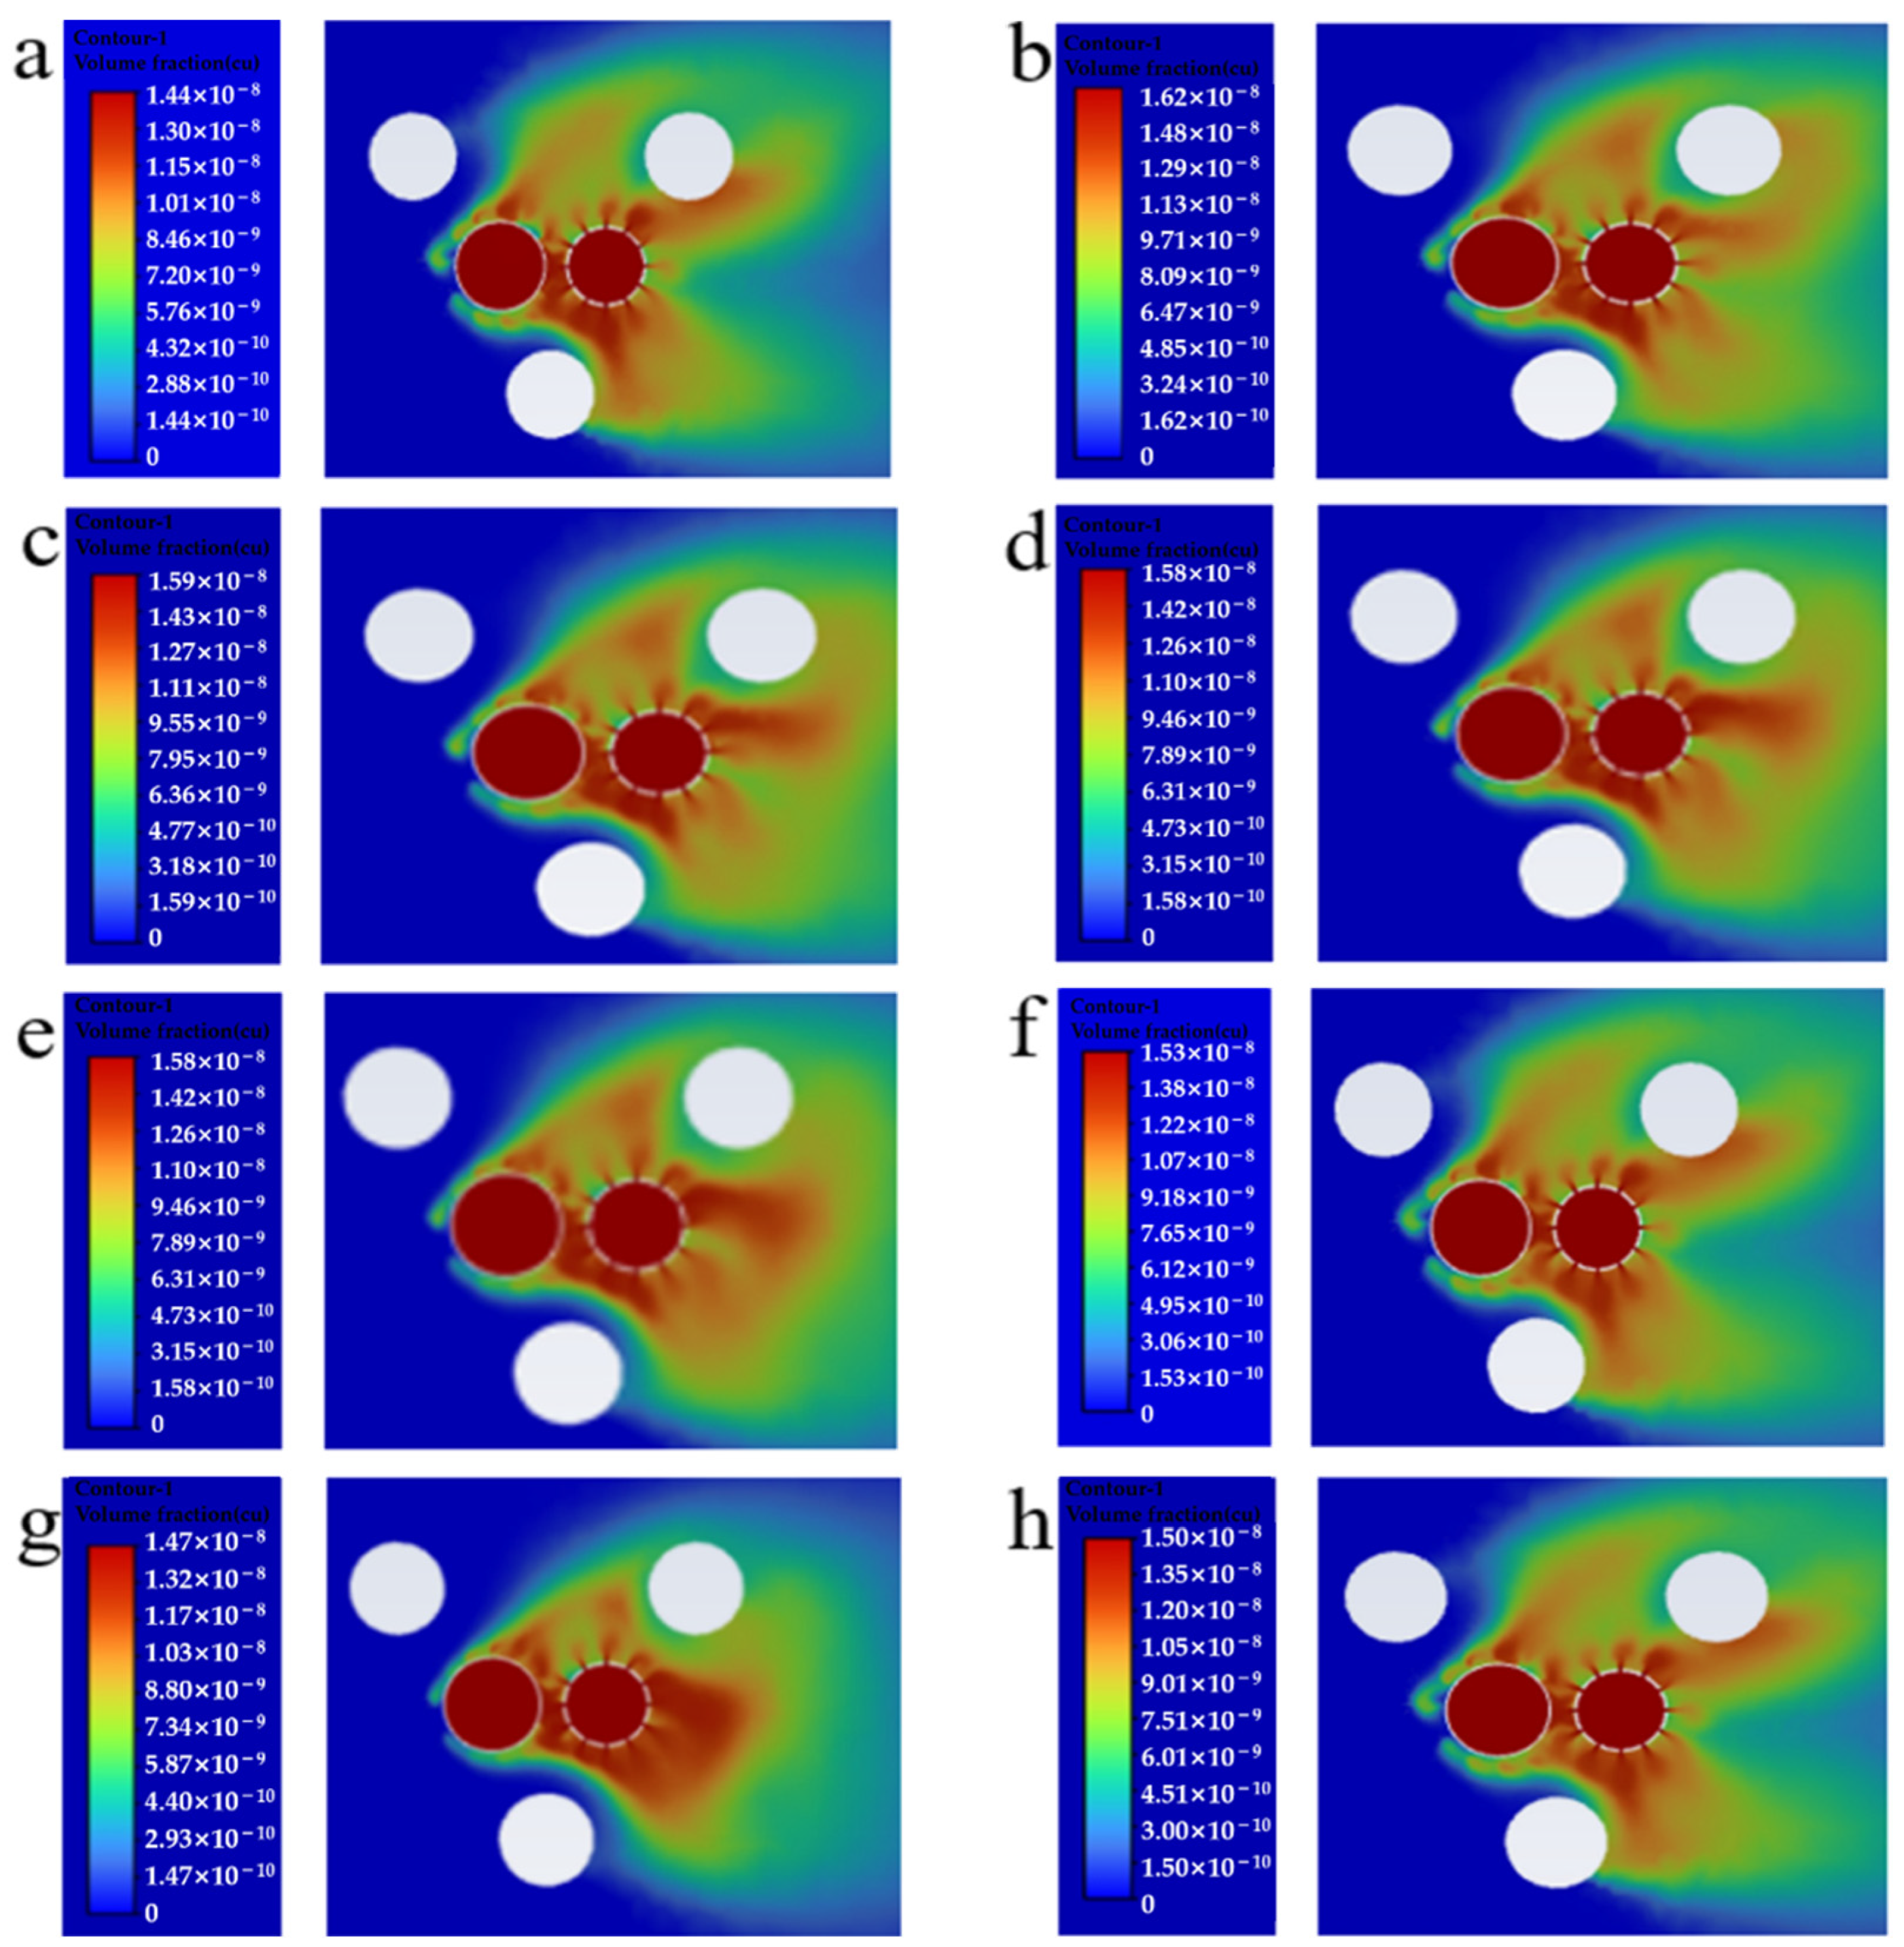
The present study aims to analyse the shutdown working conditions of two pumps, where both pumps are injected with electrolytic copper aluminium seawater. The diffusion of Cu2+ must be simulated and analysed in the absence of a baffle surrounding the lifting pump. An analysis must be conducted of the distribution of Cu2+ under conditions of seawater flow velocities of 0.88 m/s, 1.1 m/s, 1.2 m/s, 1.3 m/s, 1.5 m/s, 1.7 m/s, and 1.9 m/s. This analysis should determine the Cu2+ concentration that needs to be injected when the Cu2+ concentration is higher than 3 ppb within a 10 cm range of the seawater lift pump.
As illustrated in Figure 2, the cloud map of Cu2+ concentration distribution around the pump without baffles is shown when the dual pumps are shut down at different seawater flow rates. As demonstrated in the accompanying figure, in the event of both seawater lift pumps being deactivated, it is necessary to inject Cu2+. It has been demonstrated that the direction of seawater flow exerts an influence on the Cu2+ flows out from the pump filter screen. The outflow of Cu2+ diffuses downstream along the coast, forming a concentration distribution in the surrounding area. The faster the seawater flow rate, the easier it is to achieve a concentration of 3 ppb in the 10 cm area downstream of the lift pump, while it is more difficult to achieve the required concentration of 3 ppb in the 10 cm area upstream. As illustrated in Figure 3a, the simulation results demonstrate that the Cu2+ concentration at the downstream boundary of 10 cm achieves a value of 3 ppb. Additionally, the velocity of the seawater flow varies from 0.88 m/s to 1.9 m/s, with specific velocities of 1.1 m/s, 1.2 m/s, 1.3 m/s, 1.4 m/s, 1.5 m/s, 1.7 m/s, and 1.9 m/s, respectively. The required concentrations of Cu2+ to be injected are 18.9 ug/L, 16.4 ug/L, 16.1 ug/L, 15.8 ug/L, 15.6 ug/L, 15.3 ug/L, 14.5 ug/L, and 14.3 ug/L. As the seawater flow rate increases, the required concentration of injected Cu2+ gradually decreases. It has been demonstrated that an increase in the seawater flow rate results in a greater volume of Cu2+ being expelled from the pump filter, thereby facilitating the influx of additional Cu2+ downstream and simplifying the achievement of boundary conditions. As shown in Figure 3b, the Cu2+ concentration in the upstream area of 10 cm reaches 3 ppb. As the seawater flow rate increases, the required Cu2+ injection concentration gradually increases. The seawater flow rates are 0.88 m/s, 1.1 m/s, 1.2 m/s, 1.3 m/s, 1.4 m/s, 1.5 m/s, 1.7 m/s, and 1.9 m/s. The required Cu2+ injection concentrations are 35.7 ug/L, 37 ug/L, 37.8 ug/L, 38.6 ug/L, 39.4 ug/L, 40.1 ug/L, 40.9 ug/L, and 41.9 ug/L. This indicates an increase in seawater velocity, and to ensure the formation of a 3 ppb concentration field at the upstream boundary, it is necessary to increase the injection of Cu2+ concentration. In order to guarantee that the Cu2+ concentration within a 10 cm range around the lifting pump reaches 3 ppb, it is necessary to analyse the upstream range data.

4.2. Effect of Large Pump Operation on Injecting Cu2+ Concentration

The purpose of this study is to analyse the standard operation of the seawater lift pump, which has a displacement capacity of 500 cubic metres per hour. The large pump is set upstream of the small pump, which is injected with electrolytic copper aluminium seawater. The diffusion of Cu2+ around the lift pump without a baffle must be simulated and analysed. Analyse the concentration distribution of Cu2+ under the conditions of seawater flow velocity of 0.88 m/s, 1.1 m/s, 1.2 m/s, 1.3 m/s, 1.5 m/s, 1.7 m/s, and 1.9 m/s, and determine the Cu2+ concentration that needs to be injected when the Cu2+ concentration is higher than 3 ppb within a 10 cm range of the seawater lift pump.
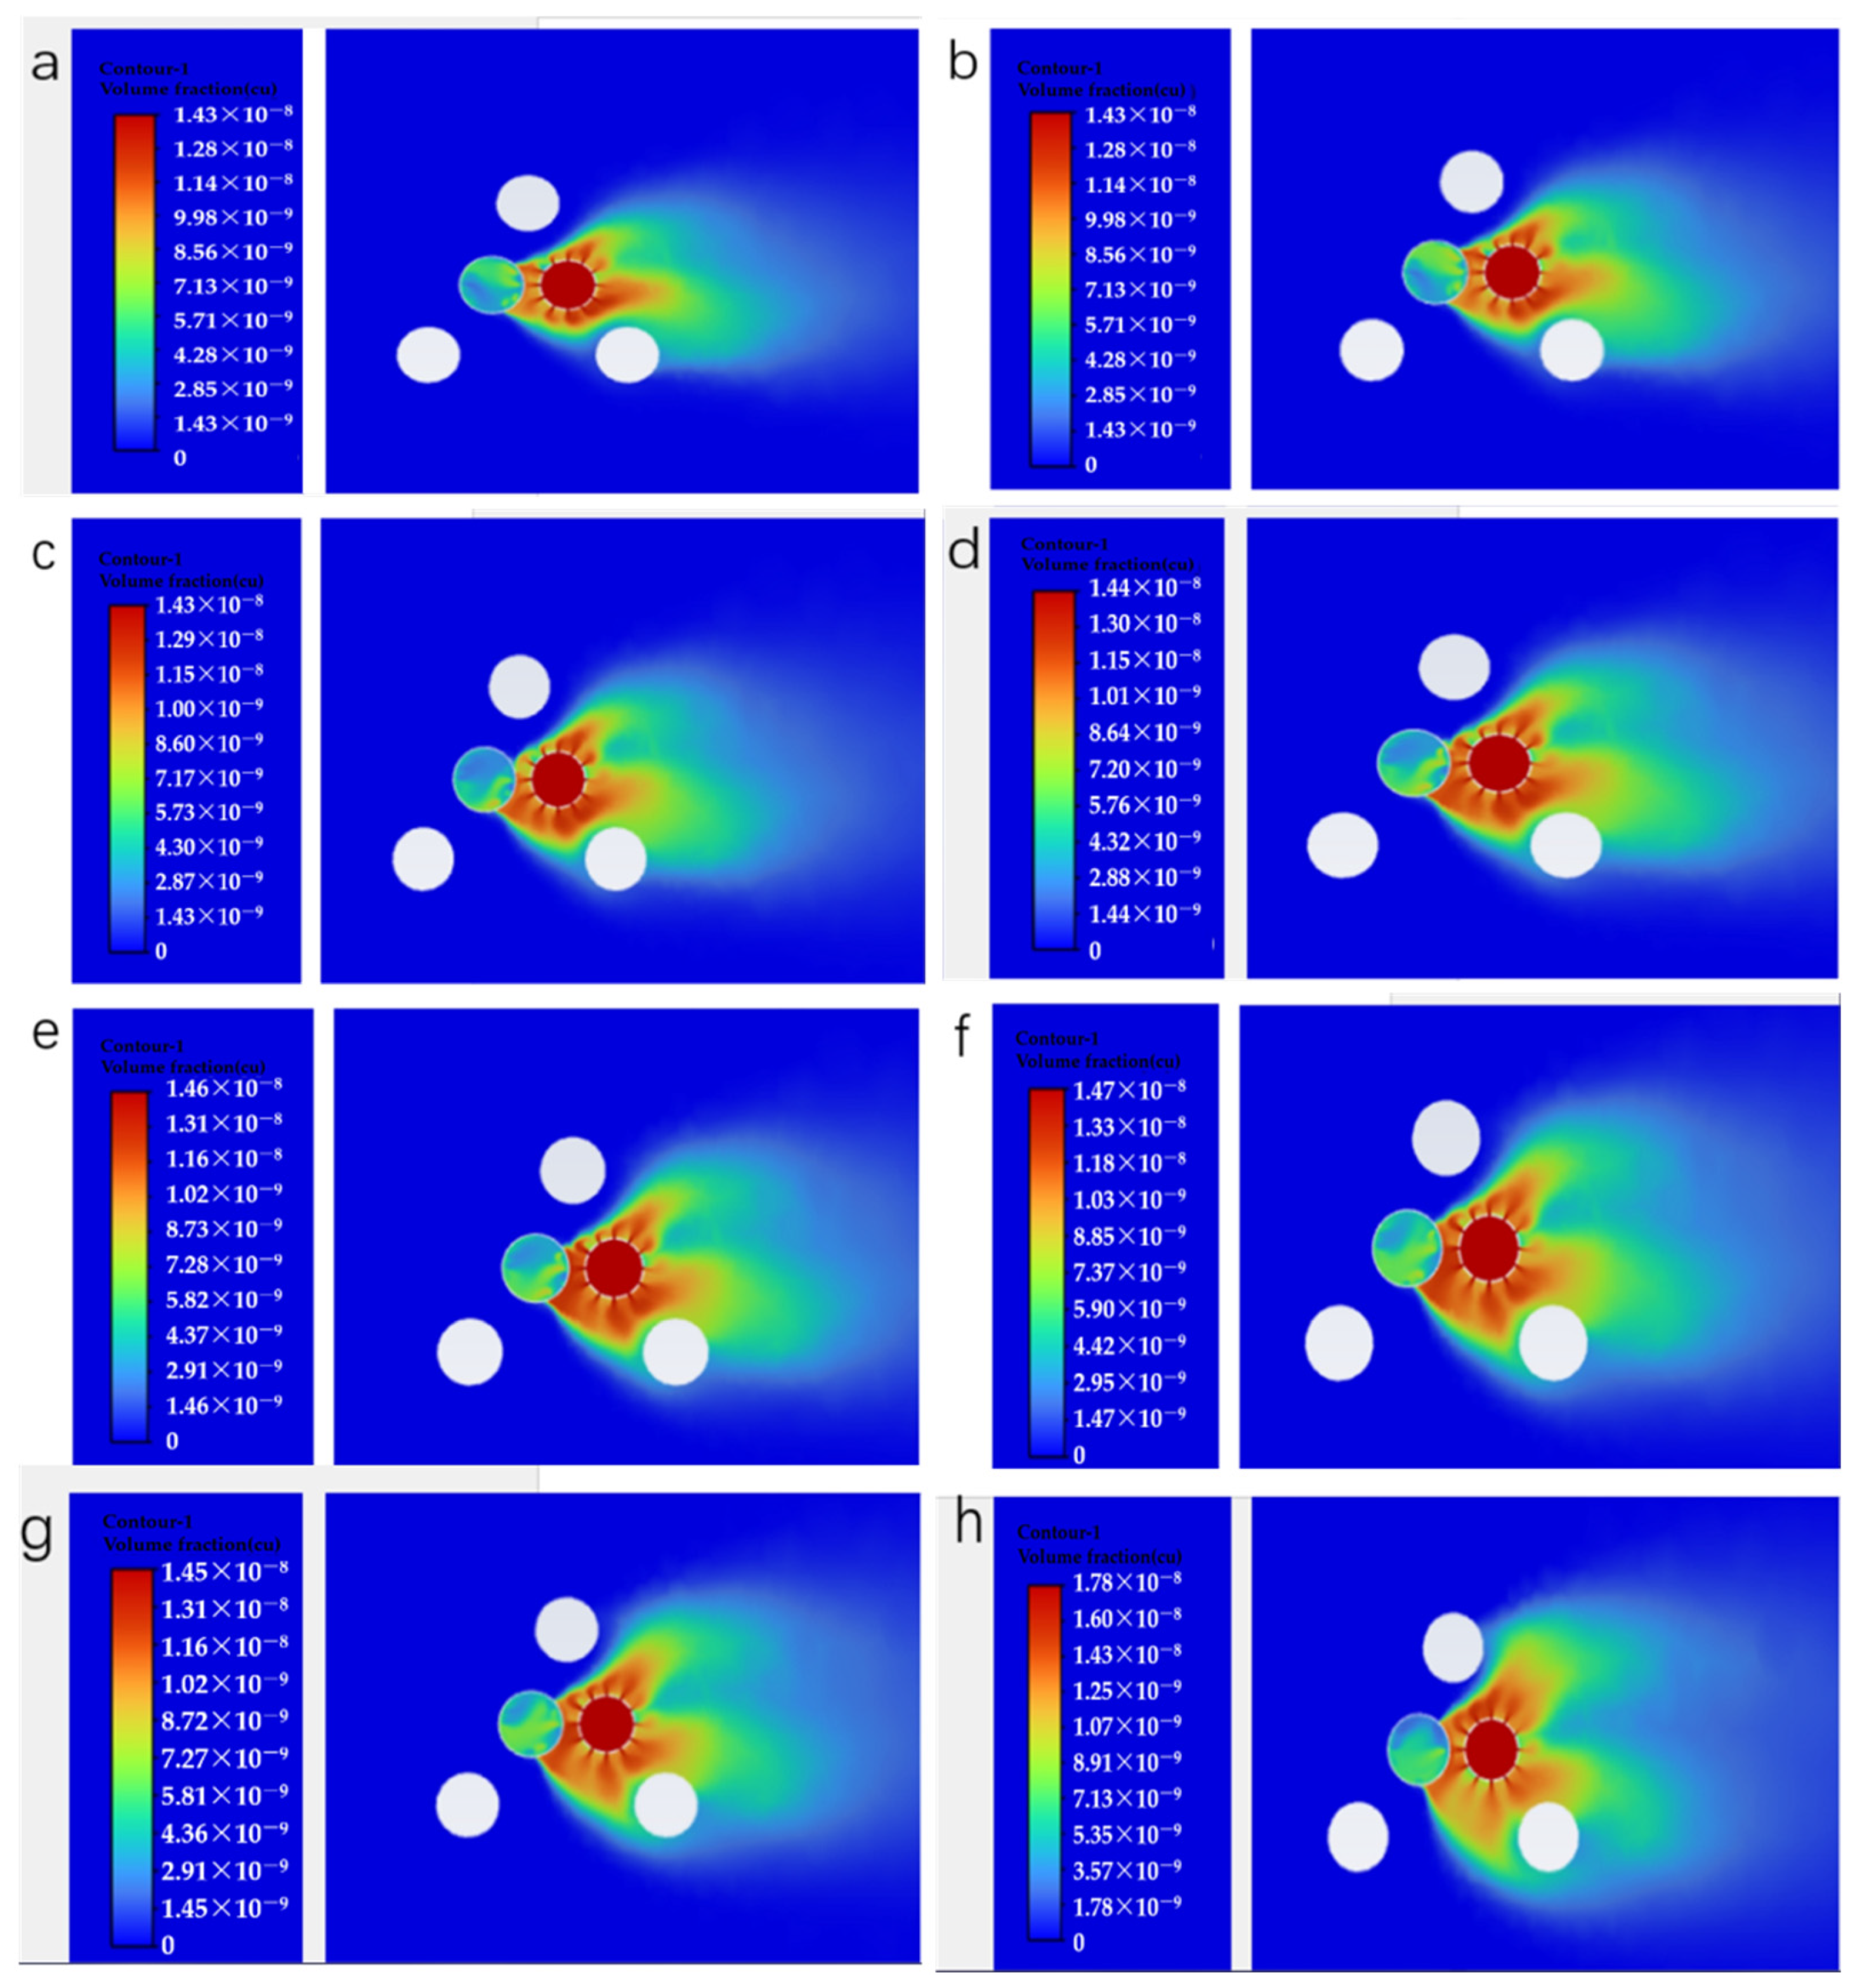
As illustrated in Figure 4, the cloud map of Cu2+ concentration distribution around the pump without baffles is shown, with the large pump operating normally and the small pump injected with electrolytic copper aluminium seawater at different seawater flow rates. As demonstrated in Figure 4, the large pump is operating within normal parameters, and seawater is being pumped into the platform by the large pump. The pump is in a state of shutdown, and Cu2+ seawater is injected into the pump. The substance in question is emitted from the filtration apparatus of the diminutive pump, and its movement is influenced by the direction of seawater flow and the flow of seawater during the operation of the large pump. Consequently, Cu2+ diffuses downstream along the direction of seawater flow, forming a concentration distribution in the surrounding area. The faster the seawater flow rate, the higher the concentration of Cu2+ that needs to be injected to reach the required concentration of 3 ppb within a 10 cm range around the pump. Figure 5 shows that through simulation, the Cu2+ concentration at the 10 cm boundary reaches 3 ppb, and the seawater flow rates are 0.88 m/s, 1.1 m/s, 1.2 m/s, 1.3 m/s, 1.4 m/s, 1.5 m/s, 1.7 m/s, and 1.9 m/s. The required Cu2+ concentrations to be injected are 13.5 ug/L, 13.8 ug/L, 14.1 ug/L, 14.3 ug/L, 14.5 ug/L, 14.7 ug/L, 14.9 ug/L, and 17.4 ug/L. It is evident that as the seawater flow rate is increased, the required concentration of injected Cu2+ also increases gradually. The opening of the large pump in the upstream area has a significant impact on the movement of seawater, with Cu2+ ions being directed towards the upstream area. The Cu2+ concentration within a 10 cm radius around the small pump is susceptible to attaining the requisite 3 ppb concentration. In contradistinction to the cessation of two pumps and the concomitant injection of electrolytic copper and aluminium seawater, a reduced concentration of Cu2+ must be injected. The primary rationale for this phenomenon pertains to the function of the large pump, which, upon its operation, draws in a proportion of the electrolytic copper aluminium seawater that has been previously injected by the small pump. This process effectively propels a greater quantity of Cu2+ towards the upstream direction.

4.3. Effect of Small Pump Operation on Injecting Cu2+ Concentration

The purpose of this study is to analyse the normal operation of the small pump in the seawater lift pump (with a displacement of 204 m3/h). The large pump is set upstream of the small pump and the seawater used is electrolytic copper-aluminium. The diffusion of Cu2+ around the lift pump without a baffle must be simulated and analysed. The distribution of Cu2+ concentration around the pump at varying seawater flow rates must be analysed, and the Cu2+ concentration that must be injected when the Cu2+ concentration is higher than 3 ppb within a 10 cm range of the seawater lift pump must be determined.
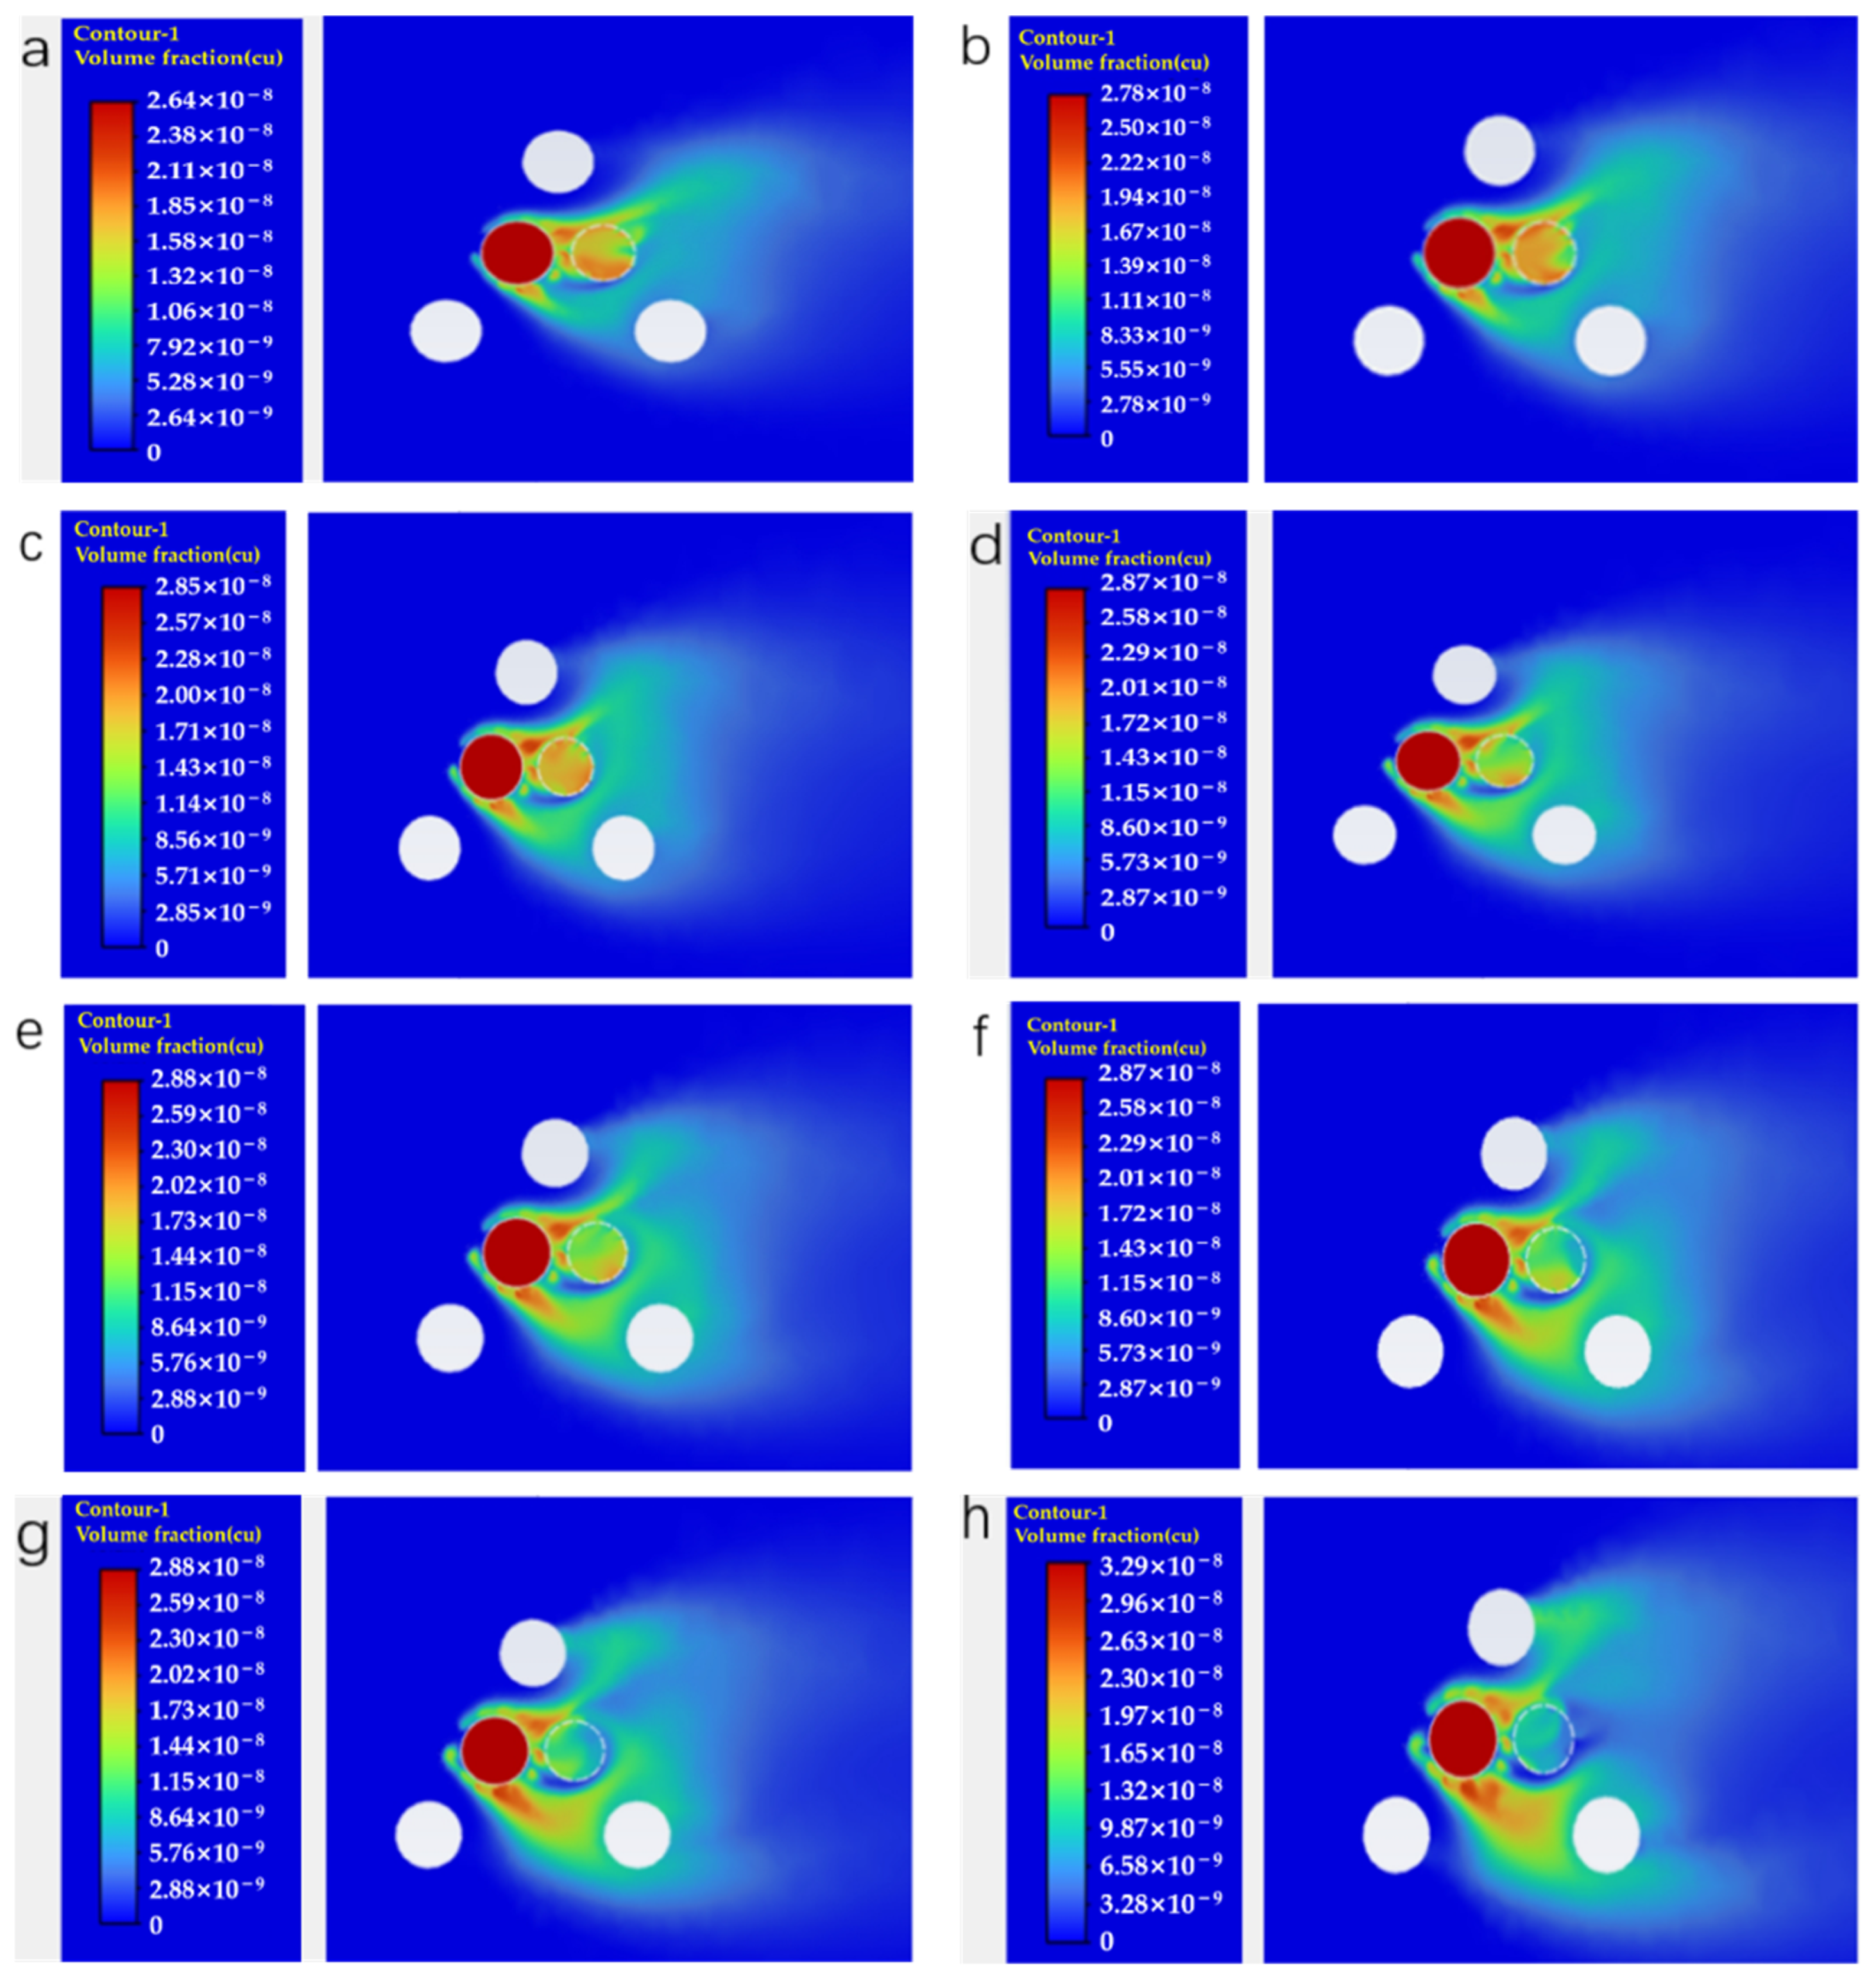
As illustrated in Figure 6, the cloud map of Cu2+ concentration distribution around the large pump injected with electrolytic copper aluminium seawater at different seawater flow rates is shown, while the small pump operates normally. As demonstrated in the accompanying figure, the pump, which is of a reduced size, is functioning correctly and seawater is being pumped into the platform by the pump. The large pump is in a state of shutdown, and Cu2+ seawater is injected into the large pump. The seawater is pumped from the large pump to the small pump, and the small pump is operational, drawing in electrolytic copper and aluminium seawater. The Cu2+ seawater flows out and spreads downstream along the coast, forming a concentration distribution in the surrounding area. It is evident that an increase in the seawater flow rate results in a corresponding rise in the concentration of Cu2+ that must be injected to achieve the desired concentration of 3 ppb within the 10 cm range surrounding the pump.
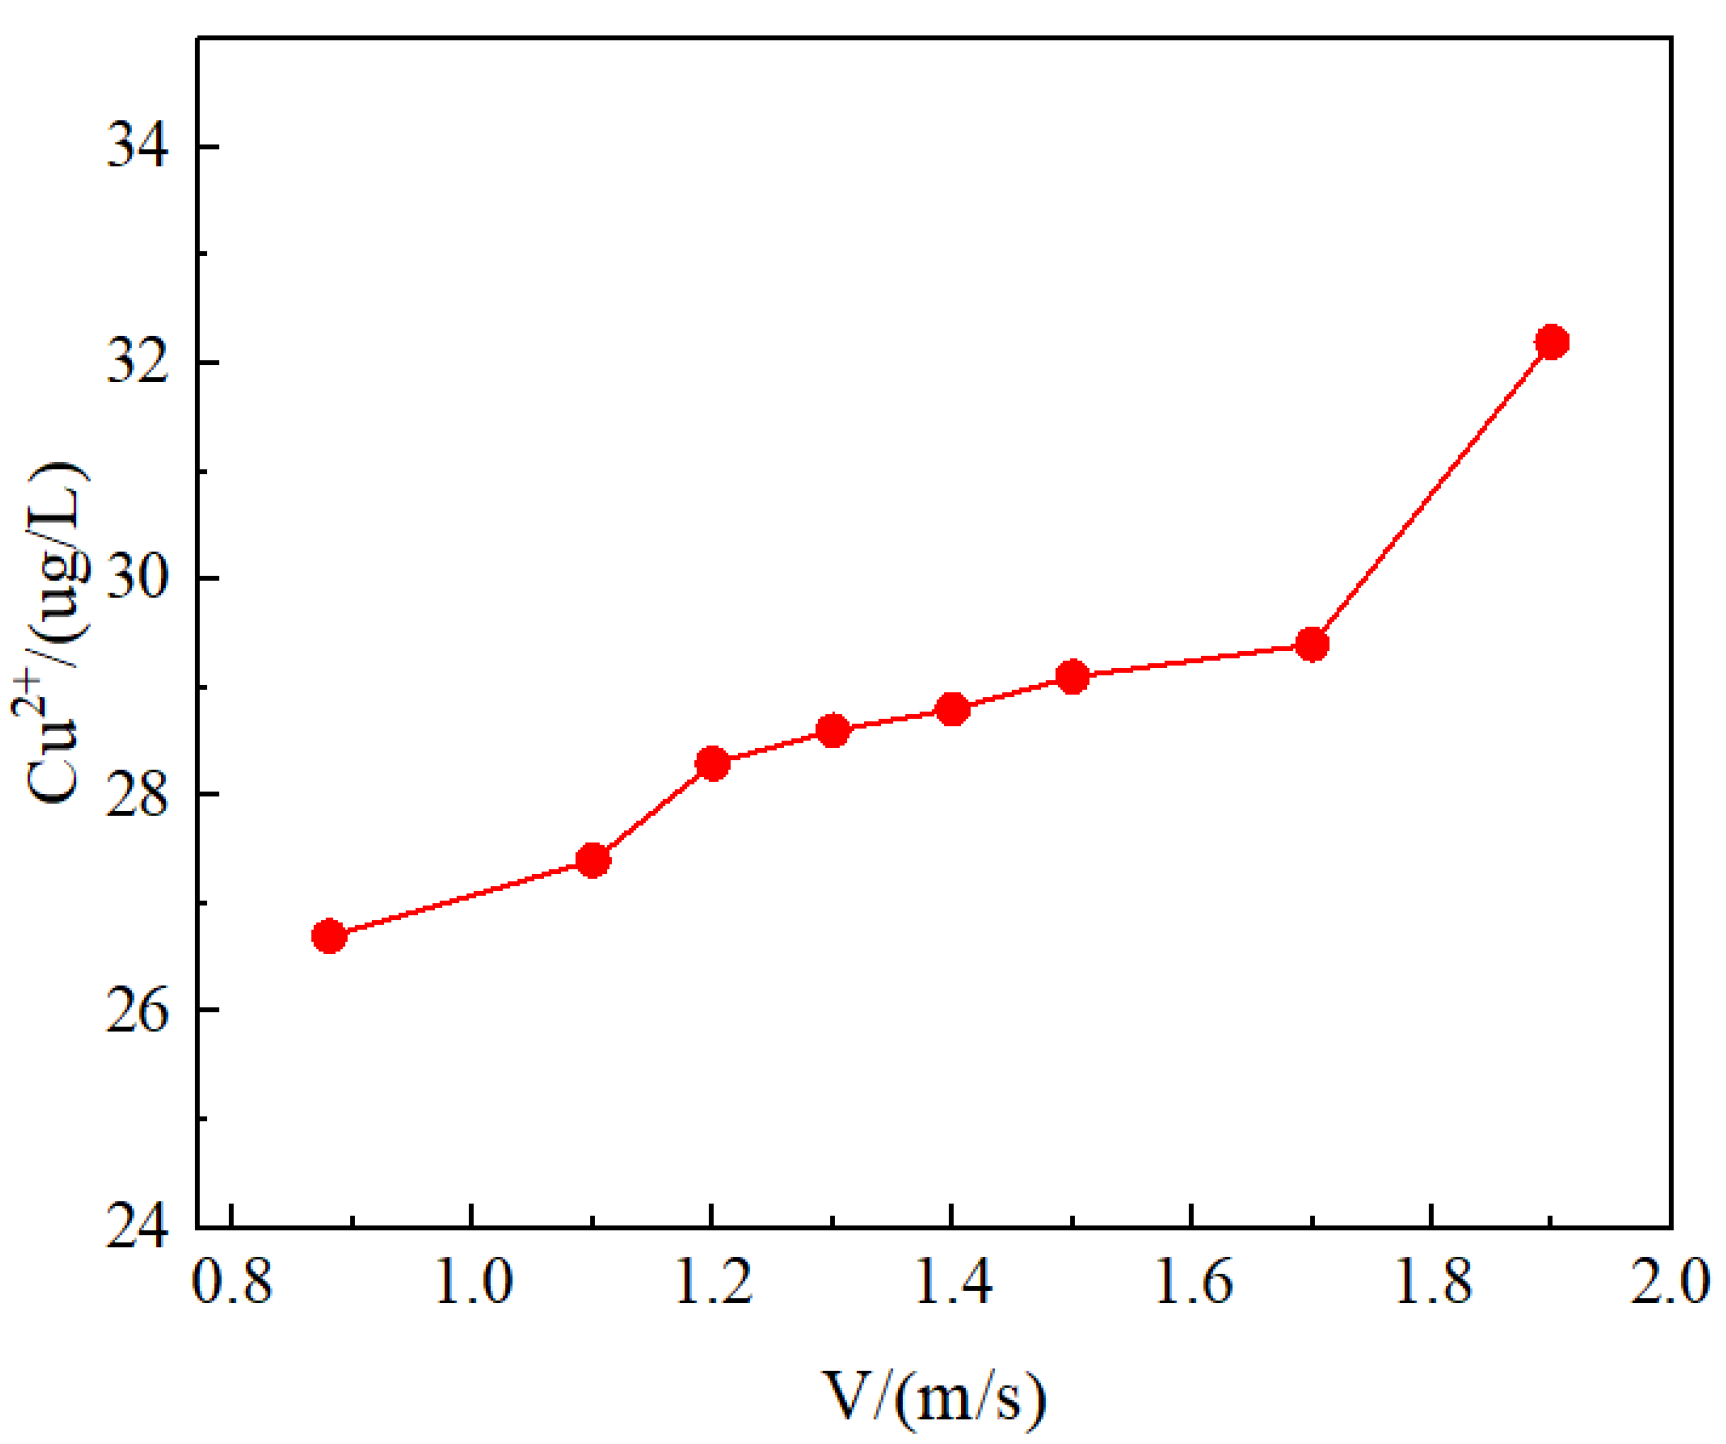
Figure 7 shows that when the seawater flow velocity is 0.88 m/s, 1.1 m/s, 1.2 m/s, 1.3 m/s, 1.4 m/s, 1.5 m/s, 1.7 m/s, and 1.9 m/s, and the Cu2+ concentration at the 10 cm boundary reaches 3 ppb, the required Cu2+ concentrations to be injected are 26.7 ug/L, 27.4 ug/L, 28.3 ug/L, 28.6 ug/L, 28.8 ug/L, 29.1 ug/L, 29.4 ug/L, and 32.2 ug/L. Due to the small pump being located in the downstream area of the large pump, Cu2+ flowing out of the large pump diffuses downstream along the coast. Concurrently, the small pump is operational, and its function is to pump Cu2+ injected from the large pump into the small pump. In comparison to the operational parameters of a large pump, when a small pump is in operation and the Cu2+ concentration exceeds 3 ppb within a 10 cm radius of the seawater lift pump, it is recommended that higher Cu2+ concentration electrolytic copper aluminium seawater be injected.

4.4. Effect of Installing Baffles on Injecting Cu2+ Concentration

In circumstances where the seawater flow rate is elevated, the rate of diffusion of Cu2+ is known to increase. This has the potential to impede the formation of a protective field around the seawater pump by Cu2+. Drawing upon the experience of deploying seawater lift pumps on offshore oil platforms, it is proposed that baffles be installed around the seawater lift pump to create a relatively enclosed space and thereby reduce the diffusion rate of copper ions. Analyse the shutdown conditions of two pumps, install baffles around them, inject electrolytic copper aluminium seawater into both pumps, and simulate the diffusion of Cu2+ around the lifting pumps. Analyse the distribution of Cu2+ concentration under different seawater flow rates and determine the Cu2+ concentration that needs to be injected when the Cu2+ concentration is higher than 3 ppb within a 10 cm range of the seawater lift pump.
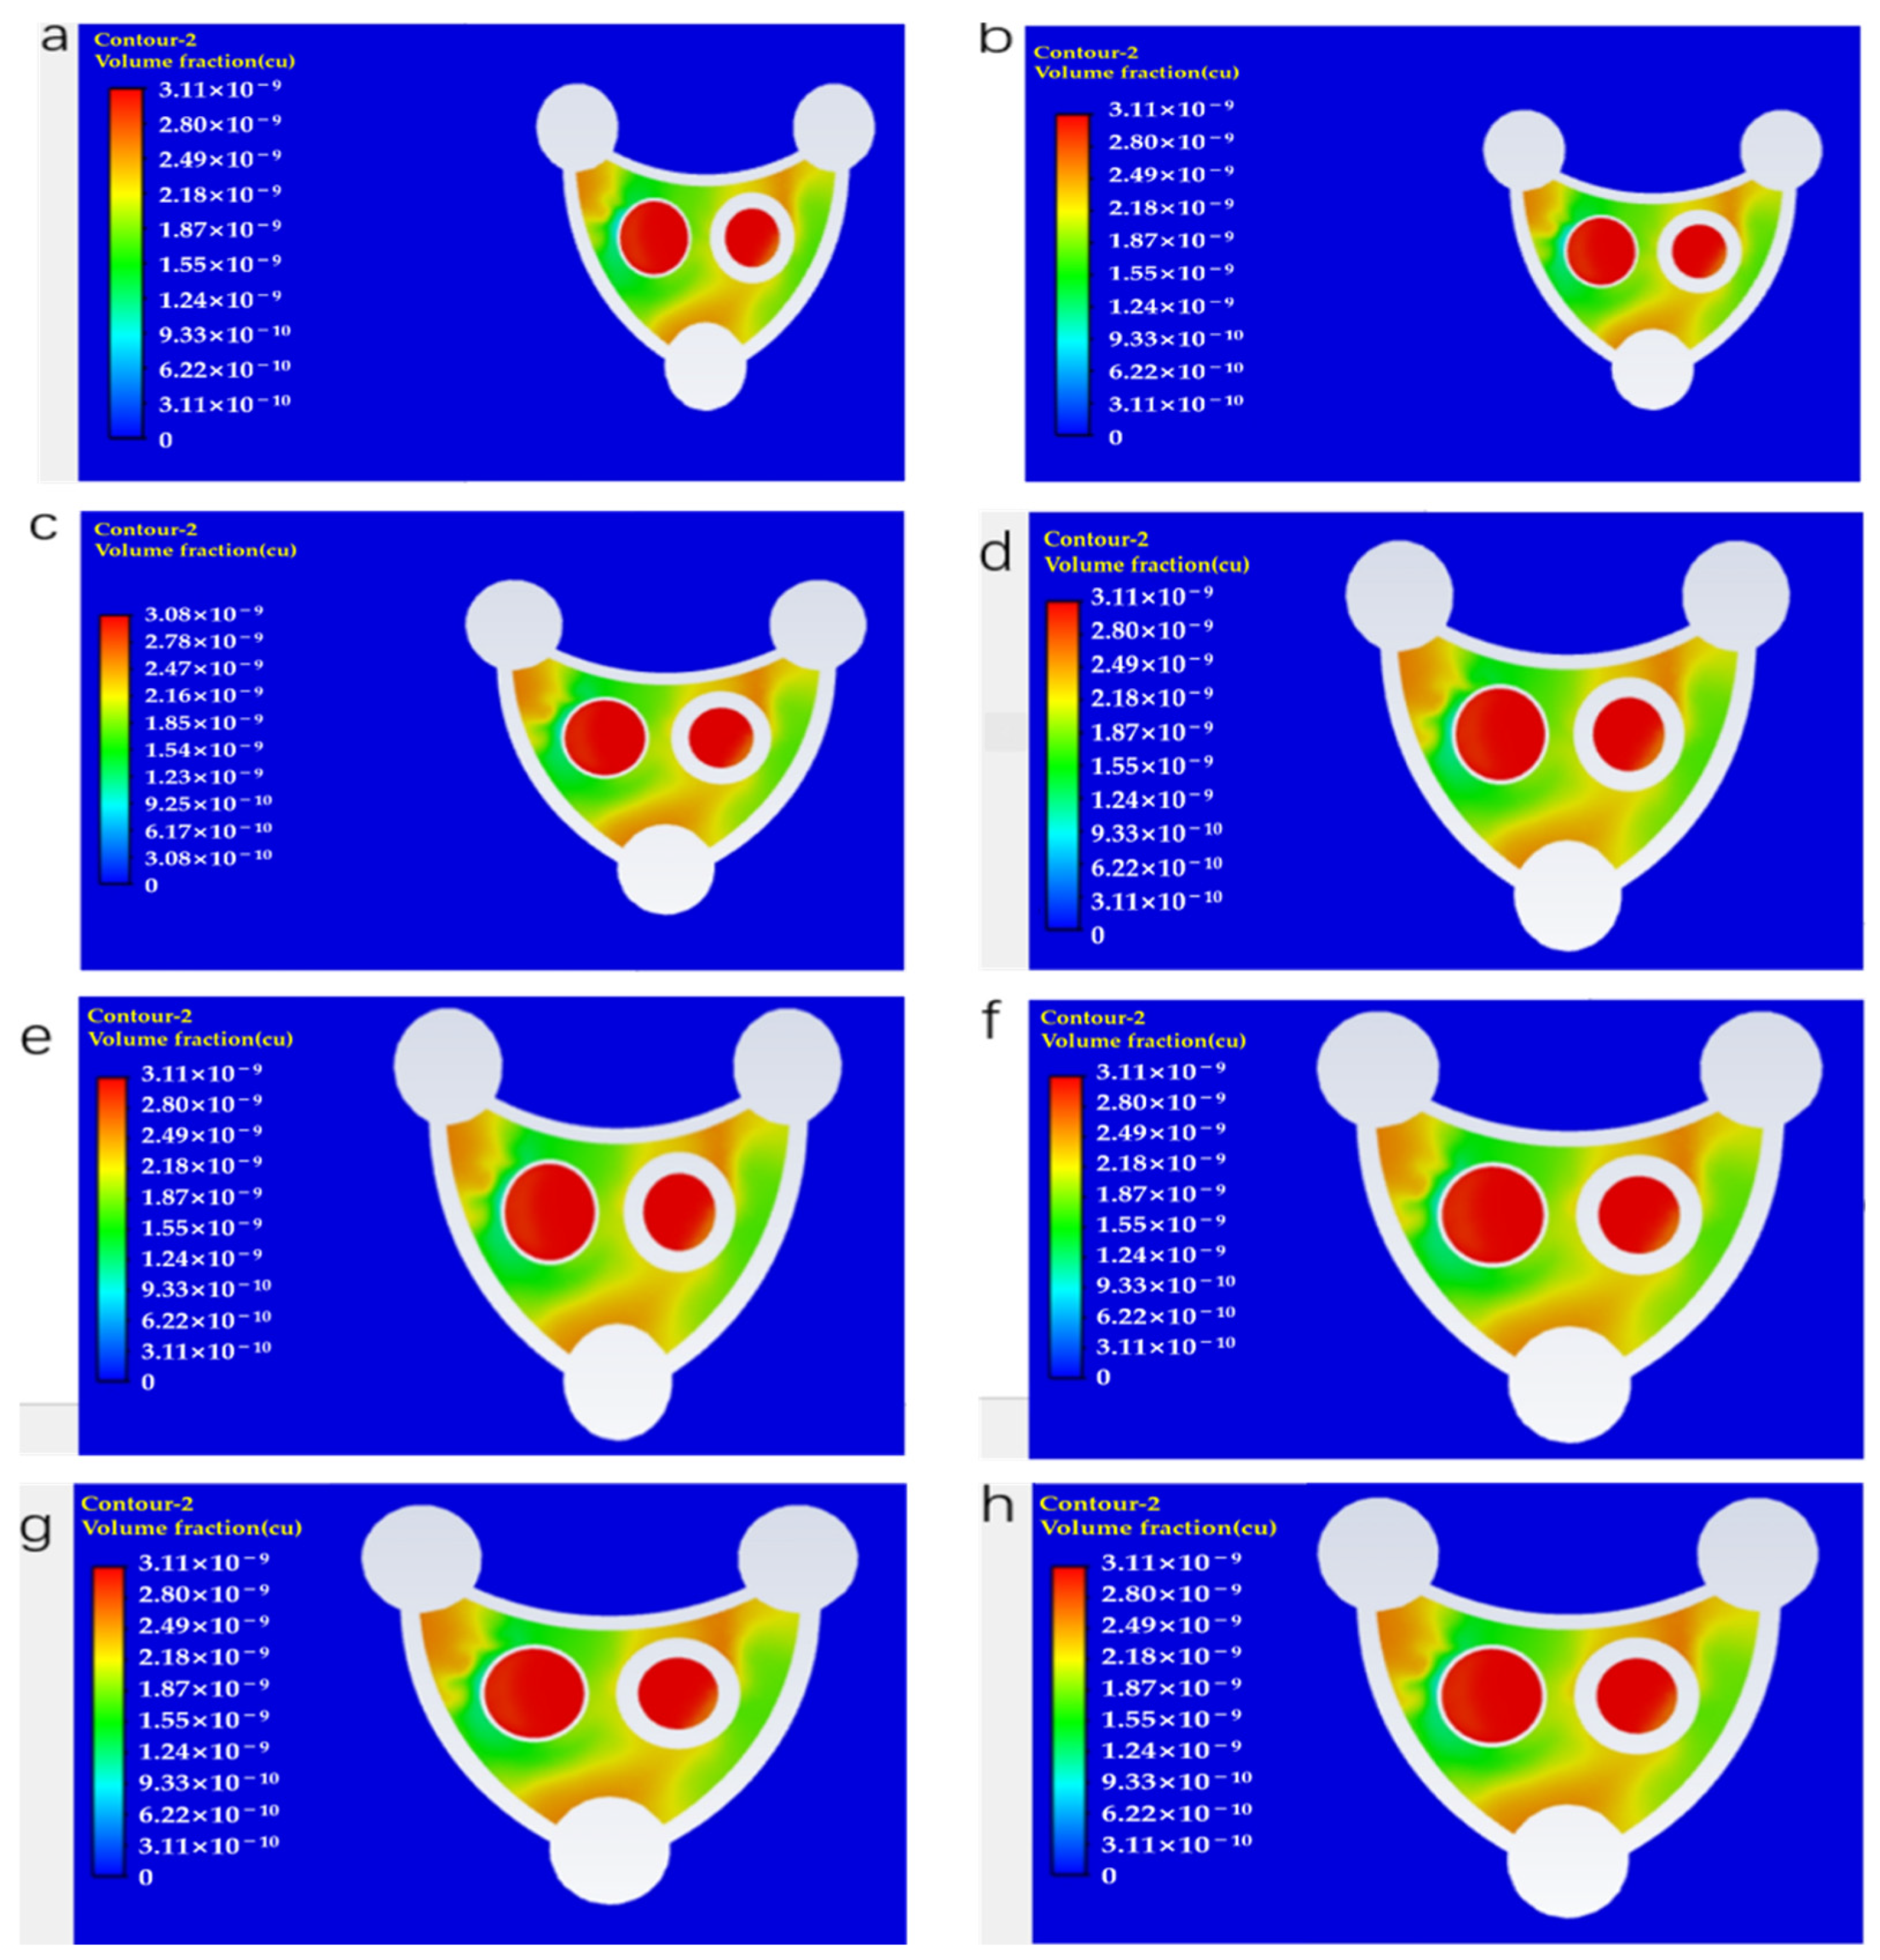
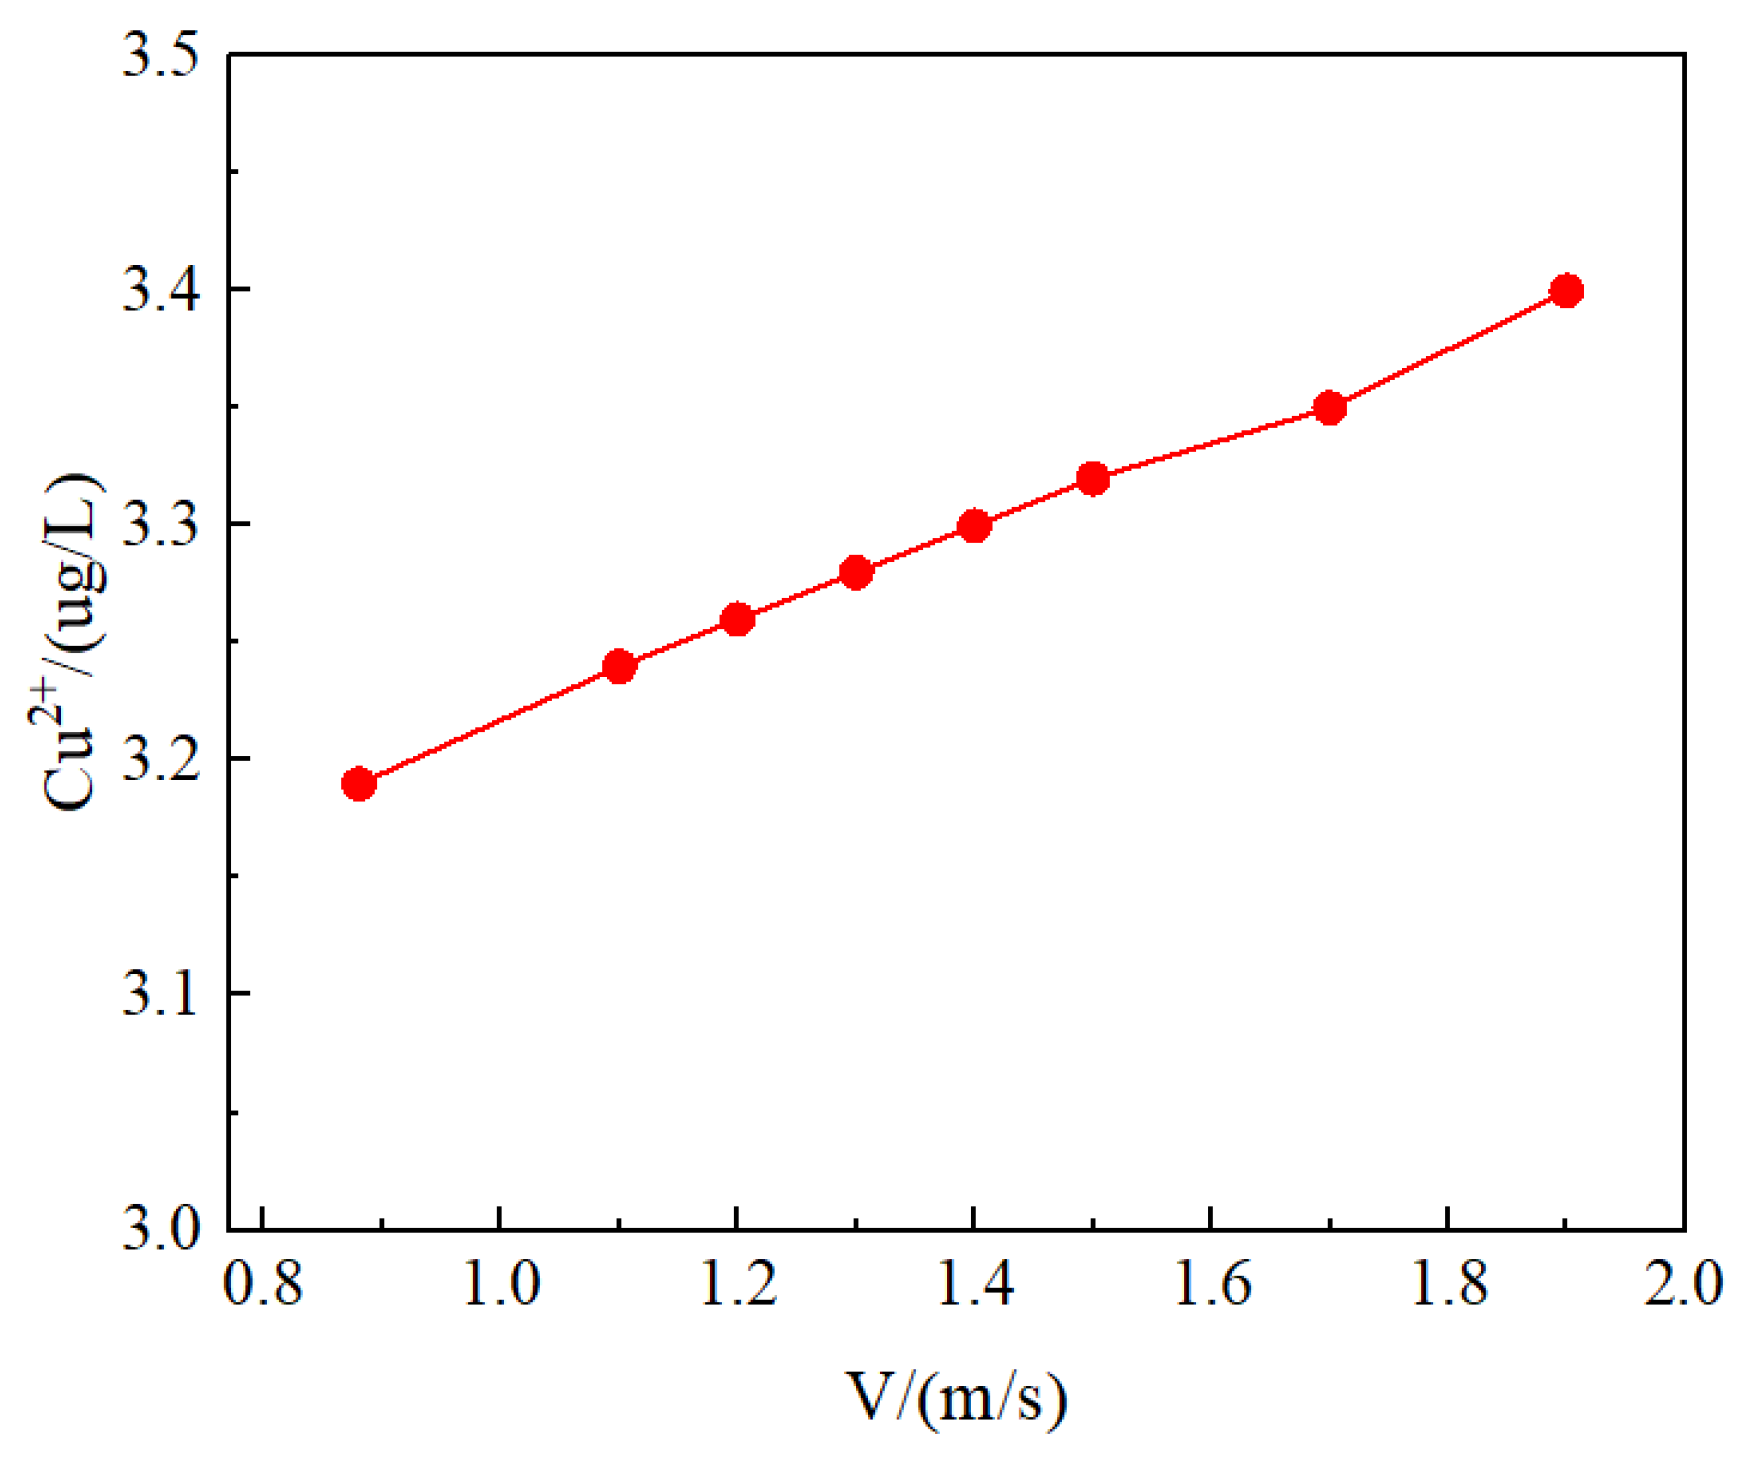
As illustrated in Figure 8, the cloud map of Cu2+ concentration distribution surrounding the two shut-down pumps that were injected with electrolytic copper aluminium seawater at varying seawater flow rates is depicted. The impact of seawater flow is significantly mitigated by the presence of baffles surrounding the pump, thereby enabling the majority of the injected Cu2+ to diffuse circumferentially around the pump body. From Figure 9, it can be seen that the seawater flow rates are 0.88 m/s, 1.1 m/s, 1.2 m/s, 1.3 m/s, 1.4 m/s, 1.5 m/s, 1.7 m/s, and 1.9 m/s. When the Cu2+ concentration at the 10 cm boundary reaches 3 ppb, the required Cu2+ concentrations to be injected are 3.19 ug/L, 3.24 ug/L, 3.26 ug/L, 3.28 ug/L, 3.30 ug/L, 3.32 ug/L, 3.35 ug/L, and 3.40 ug/L. In the absence of baffles, when the dual pumps are deactivated, the concentration of Cu2+ injected experiences a significant decrease. It has been demonstrated that the concentration of Cu2+ that must be injected increases in proportion to the rate of seawater flow. However, this increase is not of a particularly significant nature.

4.5. Comparative Analysis with On-Site Data

A comparison of the simulated calculation data with and without baffles around the two pumps under shutdown conditions with the on-site production data of the offshore oil platform is required, The specific data are shown in Table 2. In the absence of baffles and dual pump shutdown, in order to ensure a high seawater flow rate and improve the marine biological control effect of the pump, based on the experience of on-site pump use and maintenance, 45 ug/L Cu2+ concentration electrolytic copper aluminium seawater is generally injected. The simulation analysis results demonstrate that, under conditions of the highest seawater flow rate of 1.9 m/s and the simultaneous shutdown of two pumps without installed baffles, the injected Cu2+ concentration is 41.9 ug/L, with a relative error of 6.9%. In the context of the shutdown condition of two pumps with baffles, the on-site injection of Cu2+ concentration was determined to be 3.6 ug/L, while the simulated calculation data yielded a result of 3.4 ug/L, exhibiting a relative error of 5.6%. It is evident that both relative errors are within the allowable error range of 10%, thereby indicating that the model has the capacity to accurately simulate the concentration of Cu2+ injected into electrolytic seawater.

5. Conclusions

(1)
Based on CFD, it is possible to accurately simulate the concentration of Cu2+ injected into electrolytic seawater. To ensure that the Cu2+ concentration within a 10 cm range around the lifting pump can reach 3 ppb, it is necessary to analyse the upstream range data due to the influence of the seawater flow direction.
(2)
Upon cessation of the lift pump, the Cu2+ concentration in the 10 cm area surrounding the pump is observed to reach the requisite level of 3 ppb. As the seawater flow rate increases, the required Cu2+ concentration for injection gradually increases. The maximum permissible seawater flow rate is 1.9 m/s, and the requisite Cu2+ concentration for injection is 41.9 ug/L.
(3)
In circumstances where the lifting pump is operated in an alternating manner, the concentration of Cu2+ within a 10 cm radius of the pump is elevated to the requisite level of 3 ppb. As the seawater flow rate increases, the required Cu2+ concentration for injection gradually increases. The seawater’s upward flow, driven by the pump’s position, results in a lower required Cu2+ concentration for injection when compared to the downstream pumps.
(4)
The installation of baffles in the vicinity of the lifting pump was demonstrated to be an effective measure for mitigating the impact of seawater flow on the concentration of Cu2+ injected into electrolytic seawater. This approach was shown to result in a substantial reduction in the required Cu2+ concentration.

Author Contributions

Writing—original draft preparation, writing—review and editing, conceptualization, Z.Z. and J.L.; methodology, L.M.; software, J.L.; data curation, Q.Y.; writing—review and editing, L.L.; writing—review and editing, Z.L.; supervision, funding acquisition, J.L. All authors have read and agreed to the published version of the manuscript.

Funding

This research was funded by the Basic research project of Liaoning Provincial Department of Education, grant number LJKMZ20220740.

Data Availability Statement

The raw data supporting the conclusions of this article will be made available by the authors on request.

Conflicts of Interest

Author Zhishu Zhang was employed by the company CNOOC China Ltd. The remaining authors declare that the research was conducted in the absence of any commercial or financial relationships that could be construed as a potential conflict of interest.

References

  1. Liu, Y.; Li, Y.; Lu, H.; Pan, Z.; Dai, P.; Sun, G.; Yang, Q. A Full-Scale Process for Produced Water Treatment on Offshore Oilfield: Reduction of Organic Pollutants Dominated by Hydrocarbons. J. Clean. Prod. 2021, 296, 126511. [Google Scholar] [CrossRef]
  2. Onishi, S.; Itagaki, Y.; Nakatani, N.; Ohara, K.; Katayama, H.; Yamazaki, T. An Experimental Study of Pulp-Lift Characteristics Using a High-Viscous Fluid Simulating Deep Muddy Seawater. J. Mar. Sci. Eng. 2024, 12, 1448. [Google Scholar] [CrossRef]
  3. Zuo, J.; Li, F.; Zhang, N.; He, D.; Wang, W.; Zhang, J. Experimental Study on Hydraulic Characteristics of Pneumatic Lifting Pump. Water 2020, 12, 388. [Google Scholar] [CrossRef]
  4. Zhang, Z.; Tan, M.; Wu, X.; Liu, H.; Shao, C.; Qu, B. The Effect of Particle Size on the Reflux Performance of the Lifting Pumps. Comput. Part. Mech. 2024, 11, 1837–1847. [Google Scholar] [CrossRef]
  5. Li, B.; Guo, Z.; Zheng, L.; Du, M.; Han, J.; Yang, C. Effect of modified eva-gmx bionic nanocomposite pour point depressants on the rheological properties of waxy crude oil. Fuel 2026, 403, 136025. [Google Scholar] [CrossRef]
  6. Zhou, X.; Zheng, B. Surface Modification for Improving Immunoassay Sensitivity. Lab Chip 2023, 23, 1151–1168. [Google Scholar] [CrossRef] [PubMed]
  7. Tian, S.; Li, Y.; Zhang, H.; Lu, G.; Li, R.; Yu, J.; Zhao, C.; Yang, J.; Zhang, L. Amphiphilic Marine Antifouling Coatings Based on Zwitterion-Modified Silicone Polymers. Langmuir 2025, 41, 1037–1046. [Google Scholar] [CrossRef] [PubMed]
  8. Salta, M.; Goodes, L.R.; Maas, B.J.; Dennington, S.P.; Secker, T.J.; Leighton, T.G. Bubbles versus Biofilms: A Novel Method for the Removal of Marine Biofilms Attached on Antifouling Coatings Using an Ultrasonically Activated Water Stream. Surf. Topogr. Metrol. Prop. 2016, 4, 034009. [Google Scholar] [CrossRef]
  9. Schultz, M.P.; Walker, J.M.; Steppe, C.N.; Flack, K.A. Impact of Diatomaceous Biofilms on the Frictional Drag of Fouling-Release Coatings. Biofouling 2015, 31, 759–773. [Google Scholar] [CrossRef] [PubMed]
  10. Chen, L.; Duan, Y.; Cui, M.; Huang, R.; Su, R.; Qi, W.; He, Z. Biomimetic Surface Coatings for Marine Antifouling: Natural Antifoulants, Synthetic Polymers and Surface Microtopography. Sci. Total Environ. 2021, 766, 144469. [Google Scholar] [CrossRef] [PubMed]
  11. Şimşek, Ü.; Çoğun, C.; Esen, Z. Effects of Electrolytic Copper and Copper Alloy Electrodes on Machining Performance in Electrical Discharge Machining (EDM). Mach. Sci. Technol. 2022, 26, 229–244. [Google Scholar] [CrossRef]
  12. Chen, X.; Li, T.; Li, B.; Wang, M.; Guo, L.; Tian, P.; Meng, L.; Yang, M. Supramolecular Hydrogels Based on Boroxine and Application in Self-Healing Superhydrophobic Coating. Prog. Org. Coat. 2025, 204, 109248. [Google Scholar] [CrossRef]
  13. Yarmolenko, M.; Mogilei, S. Iron, Copper, and Aluminium Electrochemical Corrosion in Motionless and Moving Electrolytes Investigation during Electrolysis. Results Mater. 2023, 20, 100479. [Google Scholar] [CrossRef]
  14. Aoki, S.; Shimabukuro, M.; Kishida, R.; Kyuno, K.; Noda, K.; Yokoi, T.; Kawashita, M. Electrochemical Deposition of Copper on Bioactive Porous Titanium Dioxide Layer: Antibacterial and Pro-Osteogenic Activities. ACS Appl. Bio Mater. 2023, 6, 5759–5767. [Google Scholar] [CrossRef] [PubMed]
  15. Szewczuk-Karpisz, K.; Kukowska, S.; Grygorczuk-Płaneta, K.; Kondracki, B.; Jerin, K.; Kovačević, D. Scavenging of Copper(II) Ions, Phosphate(V) Ions, and Diuron from Aqueous Media by Goethite Modified with Chitosan or Poly(Acrylic Acid). Environ. Sci. Pollut. Res. 2023, 30, 79980–80000. [Google Scholar] [CrossRef] [PubMed]
  16. Zhou, Y.; Shakibi, A.; Grandhi, M.; Liu, Z.; Ning, F. Wire-Influenced Particle Dynamics and Fluid Flow Behaviors of Melt Pool in Coaxial Wire-Powder Fed Directed Energy Deposition of Metal Matrix Composites. J. Mater. Res. Technol. 2025, 36, 2909–2924. [Google Scholar] [CrossRef]
  17. Chen, H.; Li, W.; Cui, W.; Yang, P.; Chen, L. Multi-objective multidisciplinary design optimization of a robotic fish system. J. Mar. Sci. Eng. 2021, 9, 478. [Google Scholar] [CrossRef]
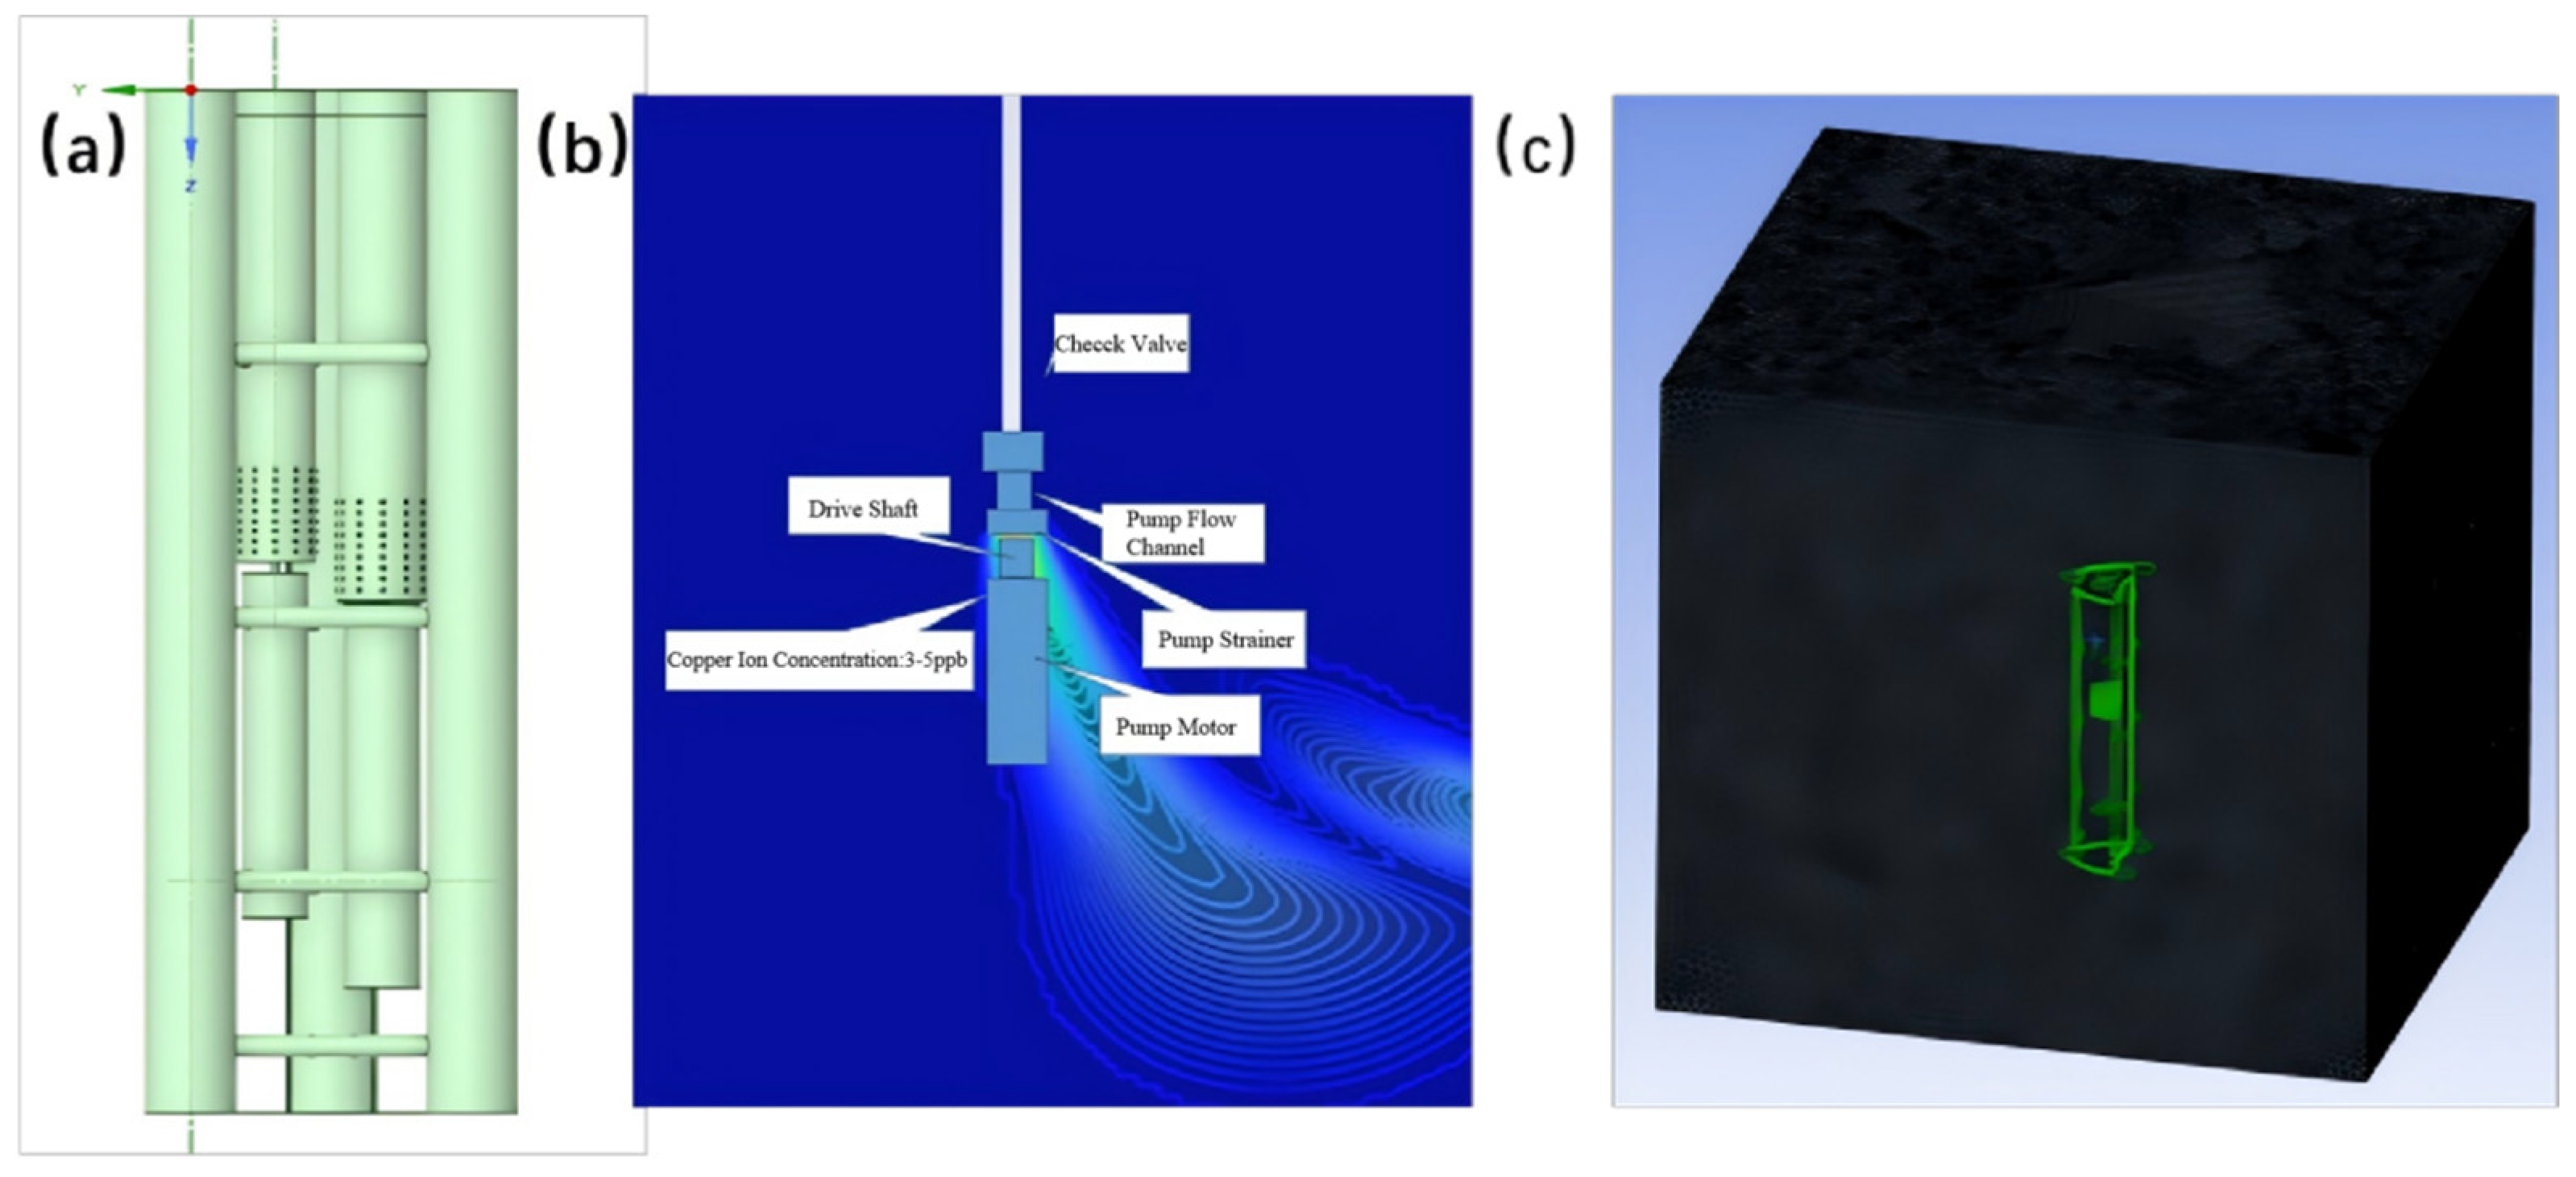
Figure 1. Physical modelling (a), pump structure (b), and fluid domain meshing (c).
Processes 13 02440 g001
Figure 2. Cloud map of Cu2+ concentration distribution without baffles around pumps for different seawater flow rates with double pumps out of operation: (a) 0.88 m/s; (b) 1.1 m/s; (c) 1.2 m/s; (d) 1.3 m/s; (e) 1.4 m/s; (f) 1.5 m/s; (g) 1.7 m/s; (h) 1.9 m/s.
Processes 13 02440 g002
Figure 3. Distribution curves of Cu2+ concentration to be injected at different seawater flow rates with double pumps out of operation and no baffle around pumps: (a) 10 cm downstream boundary region, (b) 10 cm upstream boundary region.
Processes 13 02440 g003
Figure 4. Cloud map of distribution of Cu2+ concentration around pump without baffle for different seawater flow rates with large pump operation: (a) 0.88 m/s; (b) 1.1 m/s; (c) 1.2 m/s; (d) 1.3 m/s; (e) 1.4 m/s; (f) 1.5 m/s; (g) 1.7 m/s; (h) 1.9 m/s.
Processes 13 02440 g004
Figure 5. Distribution curve of Cu2+ concentration to be injected under different seawater flow rates with large pump operation and no baffle around pump.
Processes 13 02440 g005
Figure 6. Cloud map of Cu2+ concentration distribution around pump without baffle for different seawater flow rates with small pump operation: (a) 0.88 m/s; (b) 1.1 m/s; (c) 1.2 m/s; (d) 1.3 m/s; (e) 1.4 m/s; (f) 1.5 m/s; (g) 1.7 m/s; (h) 1.9 m/s.
Processes 13 02440 g006
Figure 7. Distribution curve of Cu2+ concentration to be injected under different seawater flow rates with small pump operation and no baffle around pump.
Processes 13 02440 g007
Figure 8. Cloud map of Cu2+ concentration distribution around pumps with baffles at different seawater flow rates with double pumps out of operation: (a) 0.88 m/s; (b) 1.1 m/s; (c) 1.2 m/s; (d) 1.3 m/s; (e) 1.4 m/s; (f) 1.5 m/s; (g)1.7 m/s; (h) 1.9 m/s.
Processes 13 02440 g008
Figure 9. Distribution curve of Cu2+ concentration to be injected under different seawater flow rates with small pump operation and no baffle around pump.
Processes 13 02440 g009
Table 1. Mesh size vs. Cu2+ concentration error.
Maximum Grid
Size
(mm)
Minimum Local Grid Size
(mm)
Total Number of UnitsCu2+ Concentration
(mg/L)
Relative Error/
%
12012050,00028.323.7
6020300,00025.111.2
3081,200,00023.45.8
1524,500,00022.5-
Table 2. CFD numerical simulation results against actual production data.
Operating ConditionsCFD Simulation Data/(ug·L−1)Actual Production Data/(ug·L−1)Relative Error/%
When Two Pumps are Shut Down with Baffles Around the Pumps41.9456.9
When Two Pumps are Shut Down without Baffles Around the Pumps3.63.45.6
Disclaimer/Publisher’s Note: The statements, opinions and data contained in all publications are solely those of the individual author(s) and contributor(s) and not of MDPI and/or the editor(s). MDPI and/or the editor(s) disclaim responsibility for any injury to people or property resulting from any ideas, methods, instructions or products referred to in the content.