Article

Production Capacity and Temperature–Pressure Variation Laws in Depressurization Exploitation of Unconsolidated Hydrate Reservoir in Shenhu Sea Area

1
School of Petroleum Engineering, China University of Petroleum (East China), Qingdao 266580, China
2
College of Petroleum Engineering, Shandong Institute of Petroleum and Chemical Technology, Dongying 257061, China
3
Shandong Key Laboratory of Shale Oil Exploration and Development in Continental Faulted Basin, Dongying 257015, China
*
Author to whom correspondence should be addressed.
Processes 2025, 13(8), 2418; https://doi.org/10.3390/pr13082418
Submission received: 19 June 2025 / Revised: 15 July 2025 / Accepted: 23 July 2025 / Published: 30 July 2025

Abstract

The Shenhu sea area is rich in unconsolidated hydrate reserves, but the formation mineral particles are small, the rock cementation is weak, and the coupling mechanism of hydrate phase change, fluid seepage, and formation deformation is complex, resulting in unclear productivity change law under depressurization exploitation. Therefore, a thermal–fluid–solid–chemical coupling model for natural gas hydrate depressurization exploitation in the Shenhu sea area was constructed to analyze the variation law of reservoir parameters and productivity. The results show that within 0–30 days, rapid near-well pressure drop (13.83→9.8 MPa, 36.37%) drives peak gas production (25,000 m3/d) via hydrate dissociation, with porosity (0.41→0.52) and permeability (75→100 mD) increasing. Within 30–60 days, slower pressure decline (9.8→8.6 MPa, 12.24%) and fines migration cause permeability fluctuations (120→90 mD), reducing gas production to 20,000 m3/d. Within 60–120 days, pressure stabilizes (~7.6 MPa) with residual hydrate saturation < 0.1, leading to stable low permeability (60 mD) and gas production (15,000 m3/d), with cumulative production reaching 2.2 × 10⁶ m3. This study clarifies that productivity is governed by coupled “pressure-driven dissociation–heat limitation–fines migration” mechanisms, providing key insights for optimizing depressurization strategies (e.g., timed heat supplementation, anti-clogging measures) to enhance commercial viability of unconsolidated hydrate reservoirs.

1. Introduction

The Shenhu sea area, with a unique geological structure and suitable temperature–pressure conditions, has become a key region for the exploration and development of natural gas hydrates (NGHs). NGH exploitation is of great strategic significance for alleviating the energy crisis [1,2,3]. In the past decade, two vertical well depressurization test production operations have been completed in the Shenhu sea area, achieving stable gas production from argillaceous silty hydrates for the first time. Here, argillaceous silty hydrates refer to natural gas hydrates occurring in argillaceous silty sandstone reservoirs. The reservoir rocks are mainly composed of silt (with a particle size of 0.0039–0.0625 mm) and clay (with a particle size of <0.0039 mm), and the combined proportion of the two usually exceeds 70%. However, the low permeability and poor pore water fluidity lead to rapid productivity decline and short stable production periods, seriously restricting the commercial exploitation process [4,5,6]. Moreover, the interaction of the coupling mechanisms of hydrate phase change, fluid seepage, and formation deformation is complex, resulting in an unclear productivity change rate under depressurization exploitation [7,8,9,10]. Therefore, systematically analyzing the reservoir pressure, reservoir temperature, physical property parameters, and productivity change law in the numerical simulation of vertical well depressurization exploitation, and analyzing the internal mechanism of productivity change, is of crucial significance for optimizing the exploitation process and improving the resource utilization rate in the hydrate exploitation in the Shenhu Area.
During the NGH depressurization decomposition process, heat transfer is a key controlling factor. Song pointed out that depressurization exploitation requires boundary energy input [11]. An increase in boundary temperature can significantly accelerate hydrate decomposition, while the total gas production is limited by the complete decomposition amount when the boundary is adiabatic [12,13,14]. Oyama believed that under high-temperature and wide pressure range conditions, heat transfer is the dominant variable in the gas production process at the laboratory scale [15]. Shahbazi found that insufficient heat transfer performance during depressurization decomposition in porous media can lead to a significant decrease in gas production rate and total gas production [16]. Zhao further confirmed through numerical simulation that changes in reservoir specific heat and thermal conductivity significantly affect decomposition characteristics, and the decomposition laws under different sensible heat values and thermal conductivity conditions are significantly different [17]. A reservoir with high specific heat capacity can store more sensible heat to promote decomposition, but high water content will inhibit gas production [18]. Cheng found that the heat transfer coefficient during the rapid decomposition period of hydrates increases synchronously with the gas production process [19]. Li emphasized that depressurization decomposition is restricted by both heat transfer and mass transfer, and free gas saturation is the core indicator for measuring the feasibility of exploitation [20].
The impact of reservoir physical property parameters on gas production efficiency has attracted much attention. Liu pointed out that gas production in the Shenhu sea area is mainly controlled by absolute permeability, the reduction index of solid-phase permeability, fluid critical saturation, and permeability attenuation parameters [21]. Sun found that during the initial exploitation period in this area, decomposition was concentrated in the upper layer with high permeability, and later shifted to the lower layer with low permeability [22]. Cui corrected the permeability parameters through a two-dimensional model and explained the deviation between simulation and actual test production data [23]. Yang found, while simulating multi-layer combined exploitation, that gas–liquid phases gather towards the well during the depressurization process, and the temperature and pressure around the well drop rapidly [24]. Han believed that reservoir permeability is significantly affected by the distribution of rock matrix particles, particle size, hydrate saturation, and heterogeneity [25]. Zhang further proposed that the change in reservoir parameters essentially affects decomposition by changing the specific surface area of the hydrate reaction [26]. The higher the initial saturation, the longer the production cycle and cumulative gas production. The reservoir mechanical problems caused by depressurization exploitation are key challenges in engineering applications. The higher the reservoir permeability in the Shenhu Area, the greater the pressure reduction amplitude at the wellbore, and the settlement amount and settlement speed also increase accordingly [27]. Cui found that reservoir creep during vertical well depressurization exploitation will lead to a decrease in effective porosity and permeability, thereby affecting the productivity of gas wells [28]. Xue confirmed that the gas production efficiency of reservoirs with permeability heterogeneity is better than that of homogeneous reservoirs [29]. The higher the clay content in the reservoir, the smaller the sand production, and the sand retention rate of the sand control layer and the permeability attenuation amplitude also decrease accordingly [30,31,32]. In addition, the interaction of reservoir mechanical deformation, heat transfer, and fluid seepage was systematically analyzed through a multi–field coupling model, providing a mechanical explanation for the productivity change law [33,34,35].
Based on the above research status and problems, this study, on the basis of the geological characteristics of the unconsolidated hydrate reservoirs in the Shenhu Area, uses COMSOL 5.2 to build a natural gas hydrate depressurization exploitation model with heat–flow–solid–chemical coupling, explores the reservoir pressure, reservoir temperature, physical property parameters, and productivity change law in the numerical simulation of vertical well depressurization exploitation, systematically analyzes the internal mechanism of productivity change, and provides a theoretical basis and technical support for hydrate exploitation in the Shenhu Area.

2. Mathematical Model of NGH Exploitation

For this two-phase three-component hydrate exploitation model, the mass conservation equations of each component are shown in Equation (1):
( ϕ ρ a S a ) t = ( ρ a V a ) + m a + q a        ( a = g , w , h )
where ρw, ρg, and ρh are the densities of water, methane, and hydrate, respectively, kg/m3; φ is the porosity of the medium, dimensionless; Sw, Sg, and Sh are the saturations of water, methane, and hydrate, respectively, dimensionless; Vw, Vg, respectively, represent the volume flow rates of water and methane, m/s; mw, mg, mh are the masses of water and methane generated by hydrate decomposition and the mass of hydrate consumed per unit time and unit volume, kg/(m3·s); qw and qg are the masses of water and gas injected or produced per unit time and unit volume, kg/(m3·s).
The energy conservation equation in the porous medium per unit volume is shown in Equation (2):
( C eff T ) t = ( λ eff T ) + ( V w ρ w C w + V g ρ g C g ) T n h H h + q w C w T + q g C g T
where T is the fluid temperature, K; ρR is the rock density, kg/m3; CR, Cw, Cg, Ch are the specific heat capacities of rock, water, methane, and hydrate, respectively, J/(kg·°C); λR, λw, λg, λh are the thermal conductivities of rock, water, methane, and hydrate, respectively, W/(m·°C); nh is the amount of substance consumed by hydrate decomposition per unit time and unit volume, mol/(m3·s).
The kinetic equation of hydrate decomposition is shown in Equation (3):
k h = k 0 e E a R T P e q P g
where kh is the decomposition or generation rate of hydrate, kg/(m3·s); R is the gas constant, J/(mol·K); k0 is the pre-exponential factor, and the unit is s−1 when it is a first-order reaction; Ea is the chemical energy, representing the energy required to overcome the reaction, J/mol; Peq is the equilibrium pressure of hydrate decomposition, which is a function of temperature, Pa; and Pg is the actual gas phase pressure, Pa.
The phase equilibrium equation is shown in Equation (4):
P e = 8 × 10 13 e 0.1052 T e
where Pe is the phase equilibrium pressure, MPa; Te is the phase equilibrium temperature, K.
The gas phase seepage equation is shown in Equation (5):
v a = K k μ a P a ρ a g z        ( a = g , w )
where v a is the fluid seepage velocity vector, m/s; Kk is the absolute permeability, used to characterize the ability of the porous medium to allow gas to pass through, mD; μa is the fluid dynamic viscosity, mPa·s; P a is the fluid pressure gradient, Pa/m; and g is the gravitational acceleration, m/s2.
The relationships between Lame constants λ and μ and common elastic moduli such as Young’s modulus E and Poisson’s ratio v are shown in Equations (6) and (7).
λ = E v 1 + v 1 2 v
μ = E 2 1 + v
The equation of effective stress principle is shown in Equation (8):
σ = σ e f f + δ
where σ is the total stress, Pa; σeff is the effective stress, Pa; δ is the pore fluid pressure, Pa.
Assuming that the gas and water produced by hydrate decomposition completely occupy the pore space, and the compression and expansion of rock particles are not considered, the change rate of porosity is shown in Equation (9):
d φ d t = 1 V d V h d t
where V is the total volume of the rock, m3; and Vh is the volume of gas and water generated by hydrate decomposition, m3.
In the NGH reservoir in the Shenhu sea area, the relationship between permeability and porosity adopts the modified form of the Carman–Kozeny equation, as shown in Equation (10):
K = C φ 3 1 φ 2
where K is the permeability, mD; and C is a constant related to the shape and arrangement of rock particles, m2.

3. Establishment of Numerical Model for Hydrate in Shenhu Sea Area

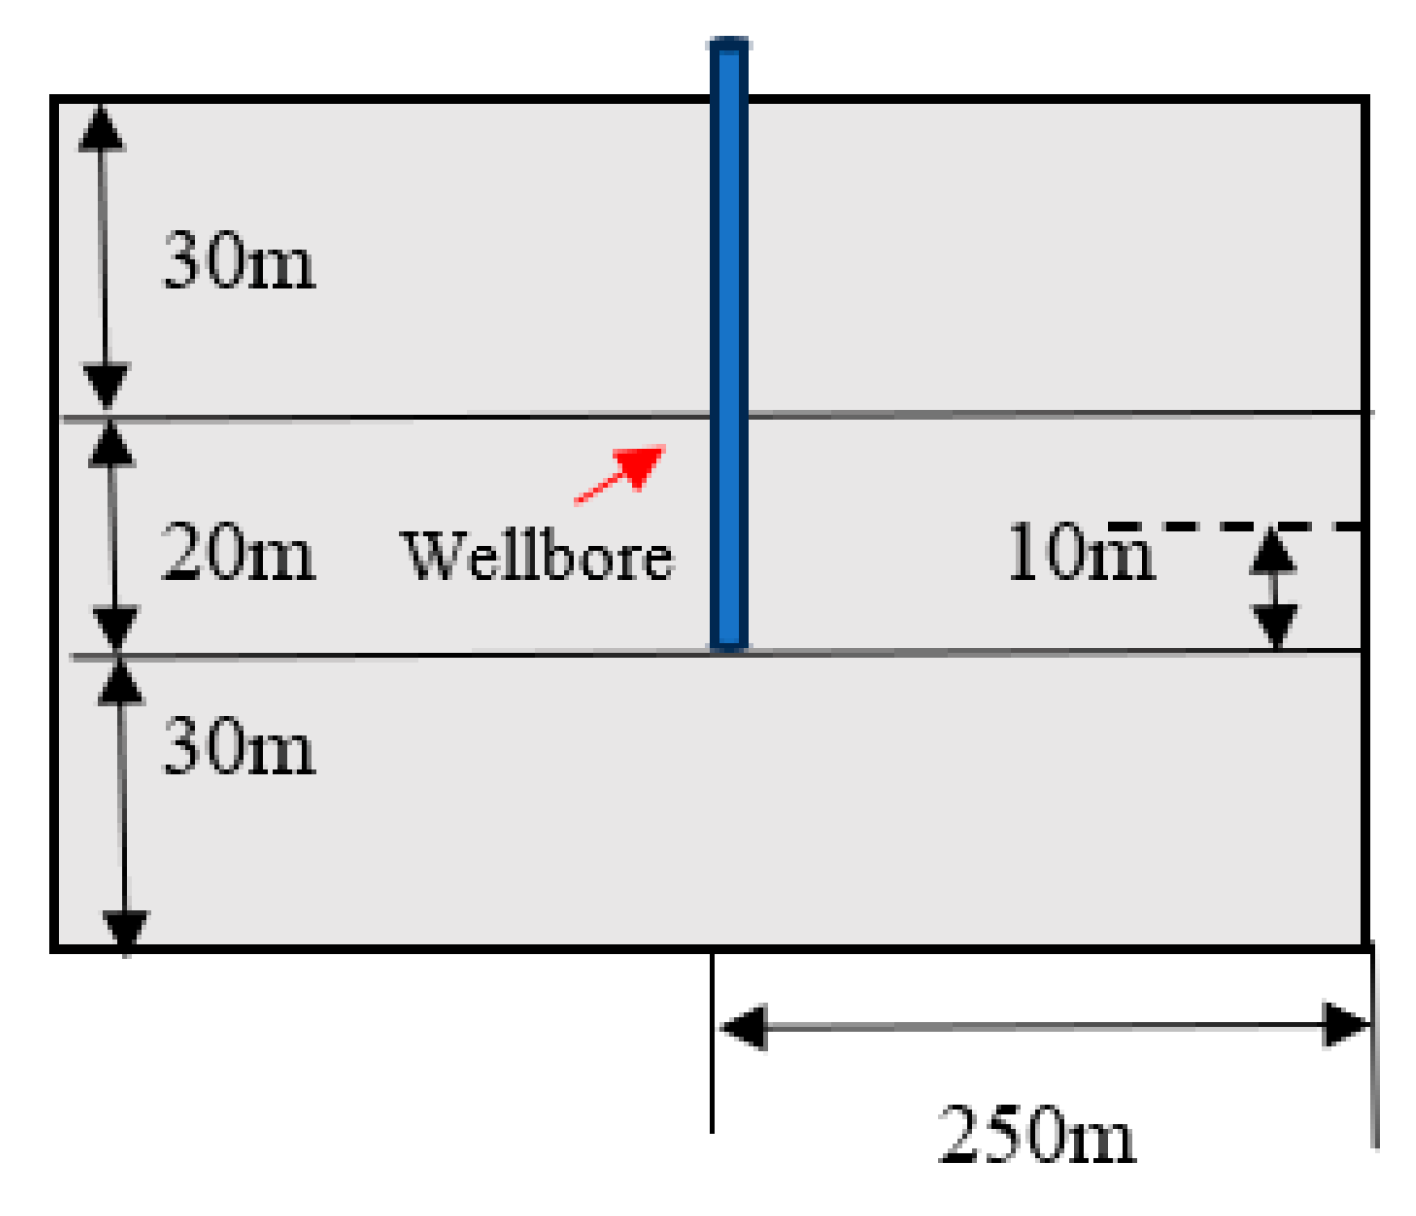
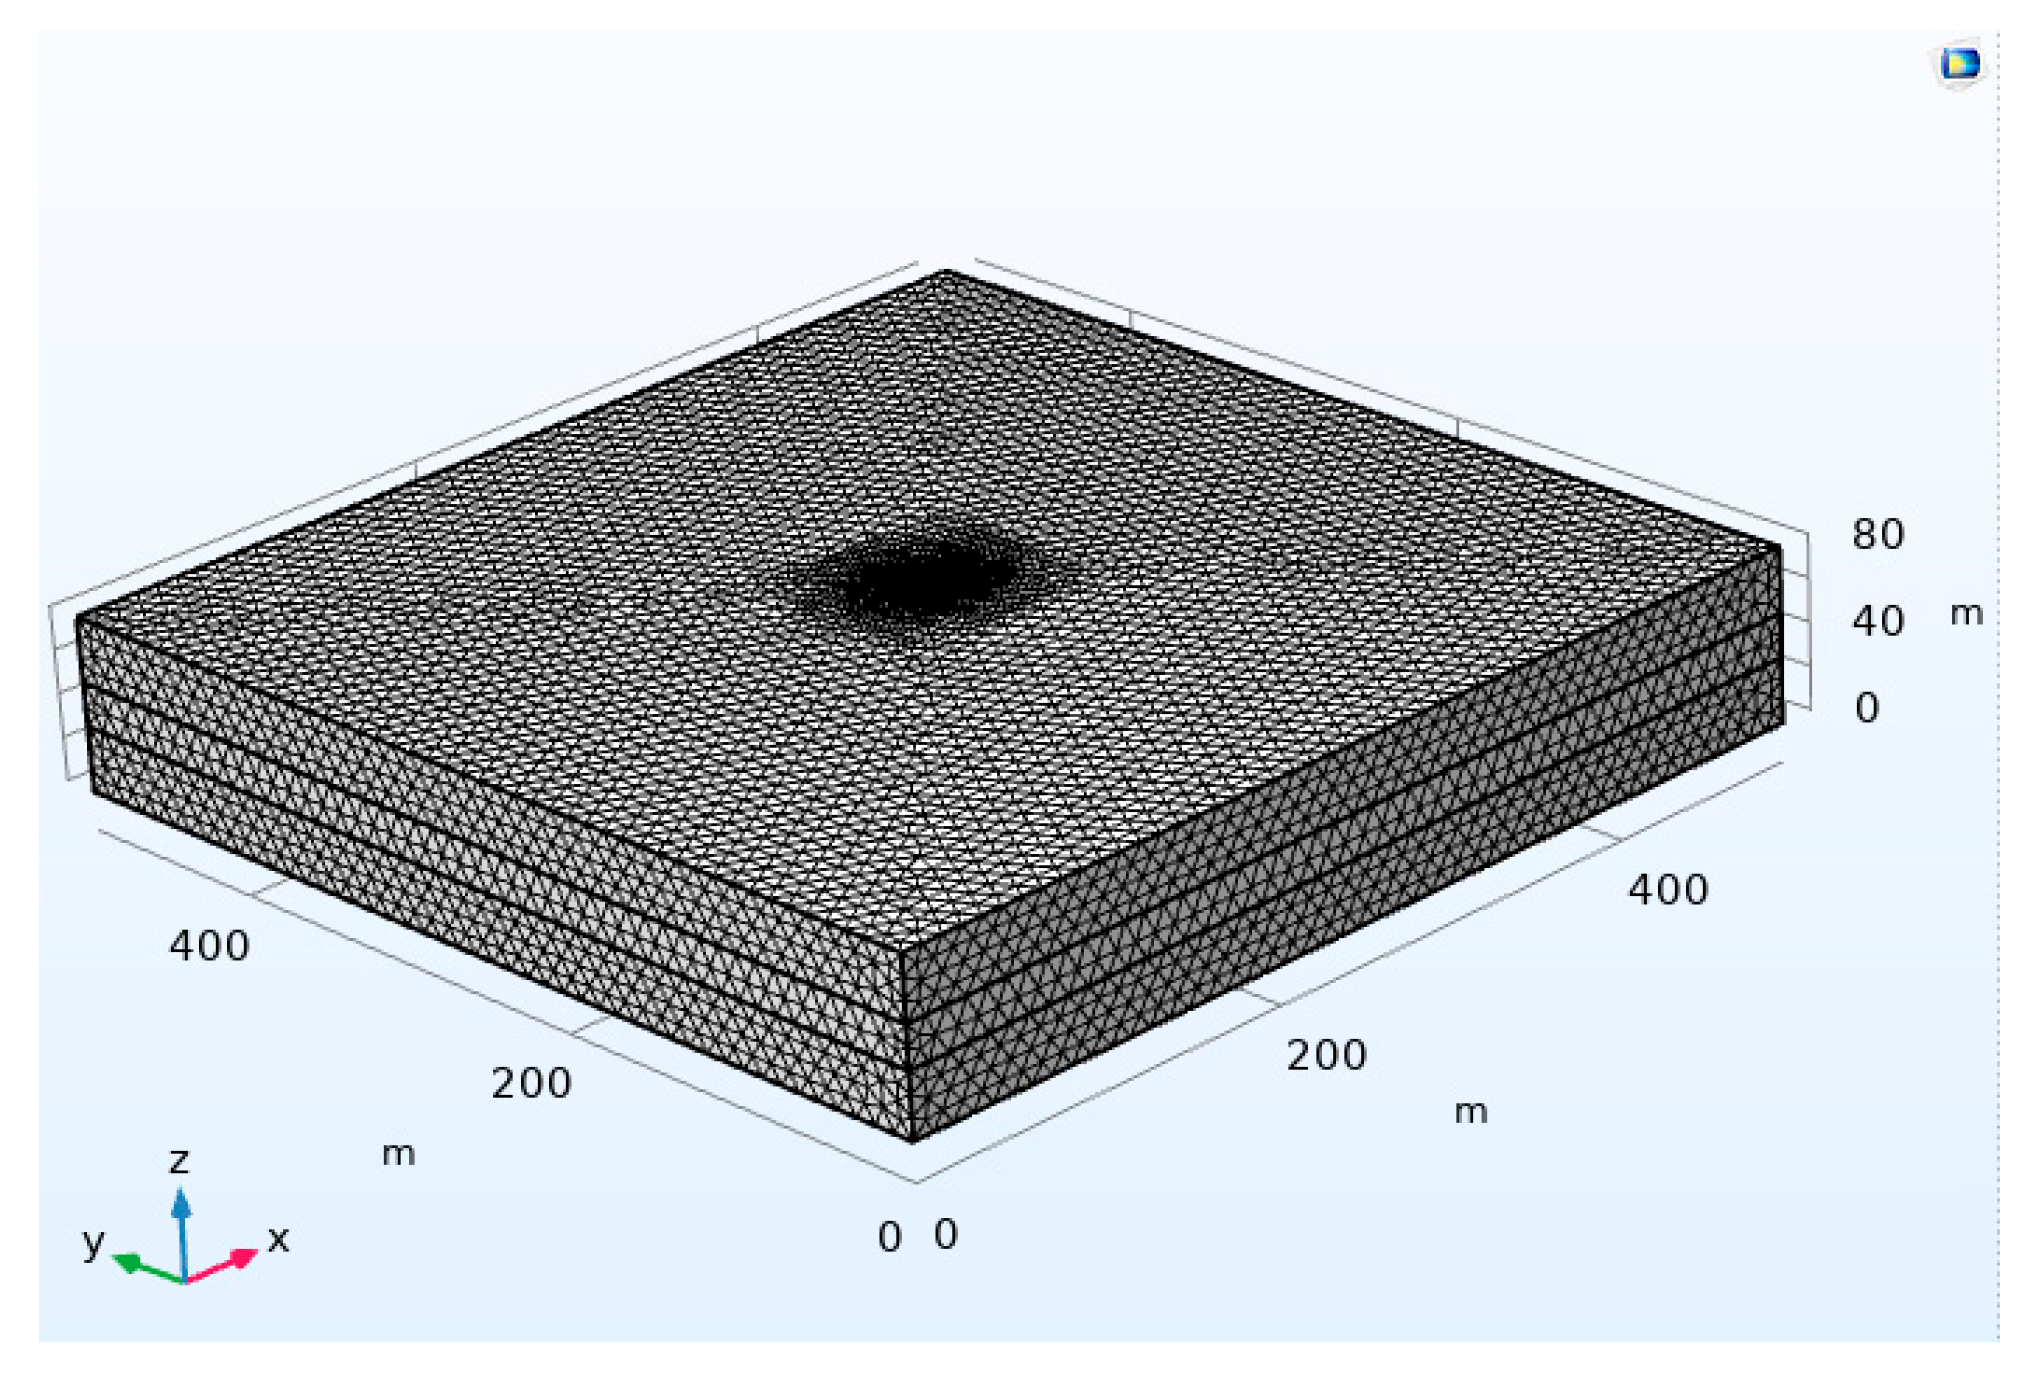
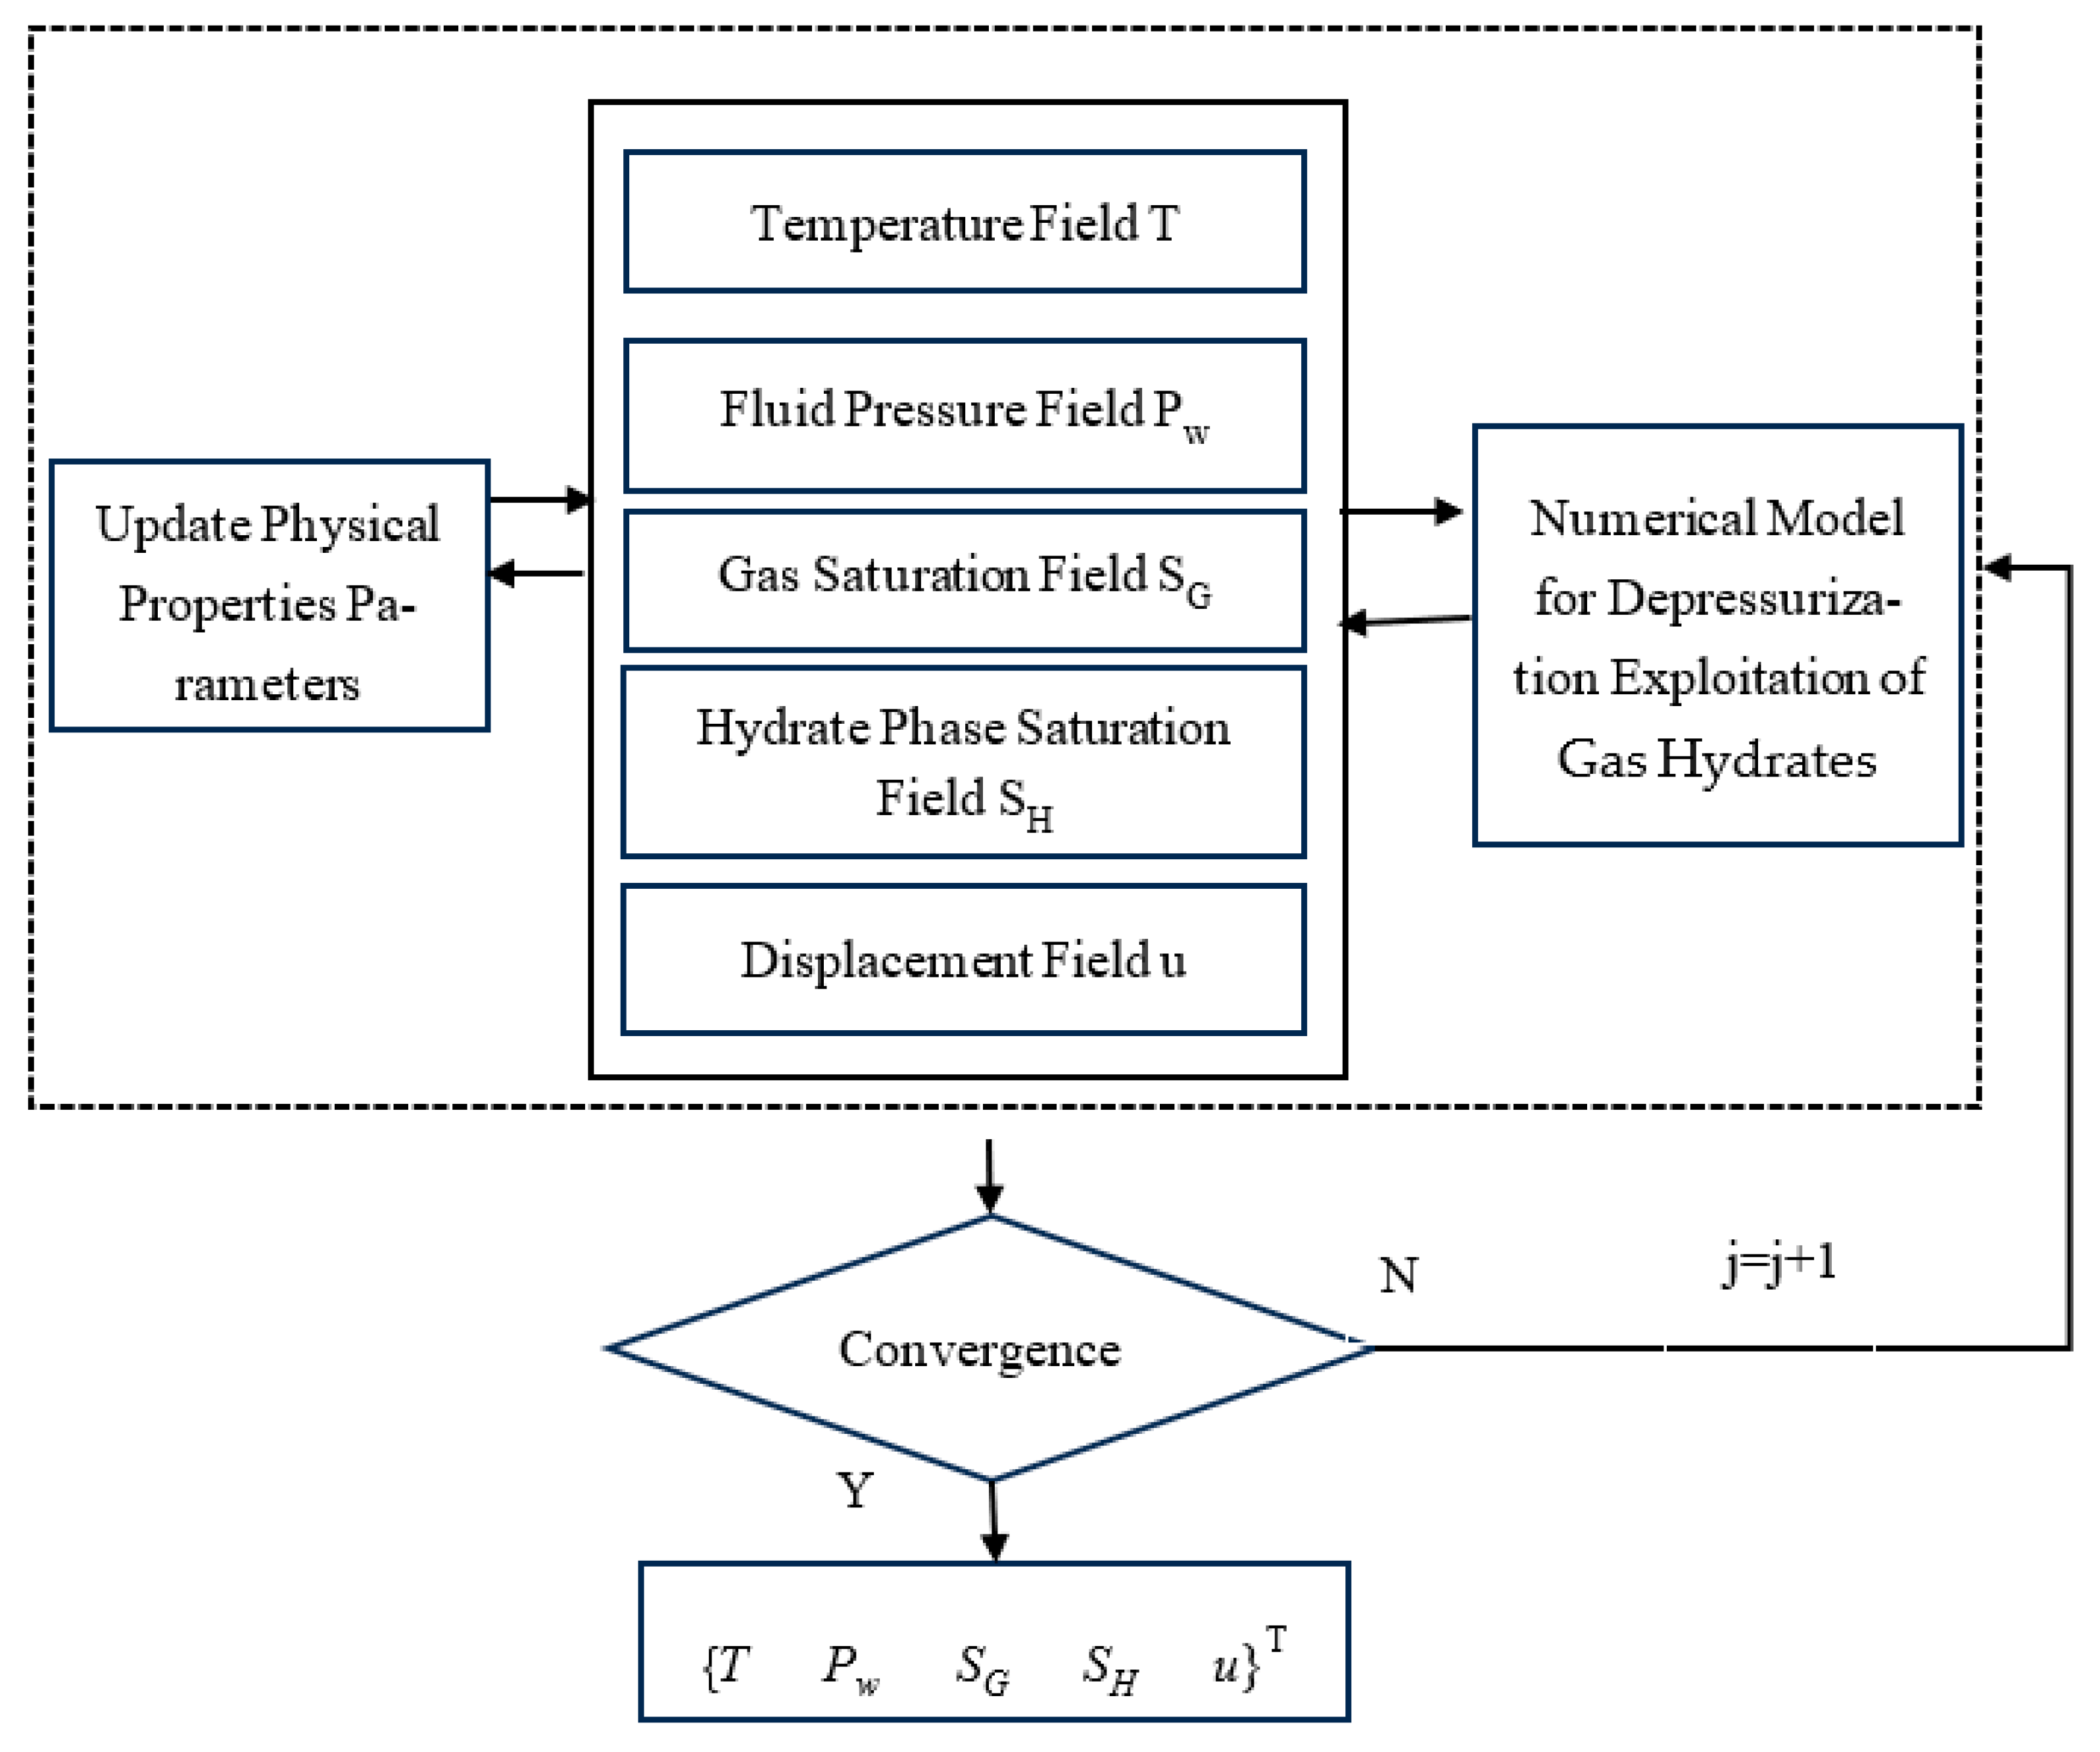
3.1. Model Development for Hydrate Depressurization Production

According to the geological data and logging results in this area, the hydrate layer is located in seawater with a depth of 1000–1700 m, at a burial depth of 150–300 m, and with a thickness of 10–43 m. The model in this paper is established based on the public geological data of the SH7 site in the Shenhu sea area of the South China Sea. In this area, the seawater depth of the stratum is 1108 m, and the hydrate reservoir is located 155 m to 177 m below the seabed, i.e., the thickness of the overlying stratum is 155 m, and the thickness of the hydrate reservoir is 22 m. The model size is 500 m × 500 m × 80 m, the thickness of the upper cover layer is 30 m, and the thickness of the hydrate layer is 20 m; the thickness of the lower cover layer is 30 m; the diameter of the production well is 0.1 m, as shown in Figure 1. The basic parameters of geological model are shown in Table 1.
To simplify the model solution, the following assumptions are made:
(1)
The heat exchange behaviors between fluid and solid, as well as between different fluid phases in the model, only include thermal convection and thermal conduction, while thermal radiation is not considered.
(2)
There is an aqueous phase, gas phase, and hydrate phase in the formation pore space. It is assumed that the hydrate phase and gas phase are methane hydrate and methane gas, respectively, and the formation pores are completely filled by the three phases of water, methane hydrate, and methane gas.
(3)
The hydrate phase in the model has no seepage behavior in the reservoir, meaning there is no relative displacement between the hydrate phase and solid particles.
(4)
Only the aqueous phase and gas phase exist as seepage phases in the formation pore space, and their seepage behaviors follow the generalized Darcy’s law, with the gas slippage effect ignored.
(5)
The formation deformation during the depressurization exploitation of natural gas hydrates conforms to the small deformation theory of solid mechanics.
(6)
The physical parameters such as density, thermal conductivity, and specific heat of hydrates and rocks are set as constant values during the hydrate exploitation process.
In terms of calculation accuracy, during depressurization exploitation, the pressure, porosity, and hydrate saturation in the wellbore surrounding area (within 10 m of the wellbore) change drastically. Using a fine mesh (0.1 m) here can accurately capture the steep gradients of physical parameters, ensuring precise simulation of fluid seepage and hydrate dissociation dynamics. In terms of computational efficiency, if a uniformly fine mesh (0.1 m) was adopted, the number of elements would exceed 108, resulting in an excessively long iterative solution time that exceeds the actual computational capacity. After using a gradient mesh (from 0.1 m near the wellbore to 10 m far from the wellbore), the total number of elements reduced to approximately 5 × 10⁶, which significantly improved efficiency while ensuring calculation accuracy in key areas. “Size adjustment” was applied to the hydrate layer and wellbore area, with a minimum element size of 0.1 m and a maximum element size of 10 m. The near-wellbore area was encrypted to improve the simulation accuracy, as shown in Figure 2.
The flow chart of the related solution algorithm is shown in Figure 3.

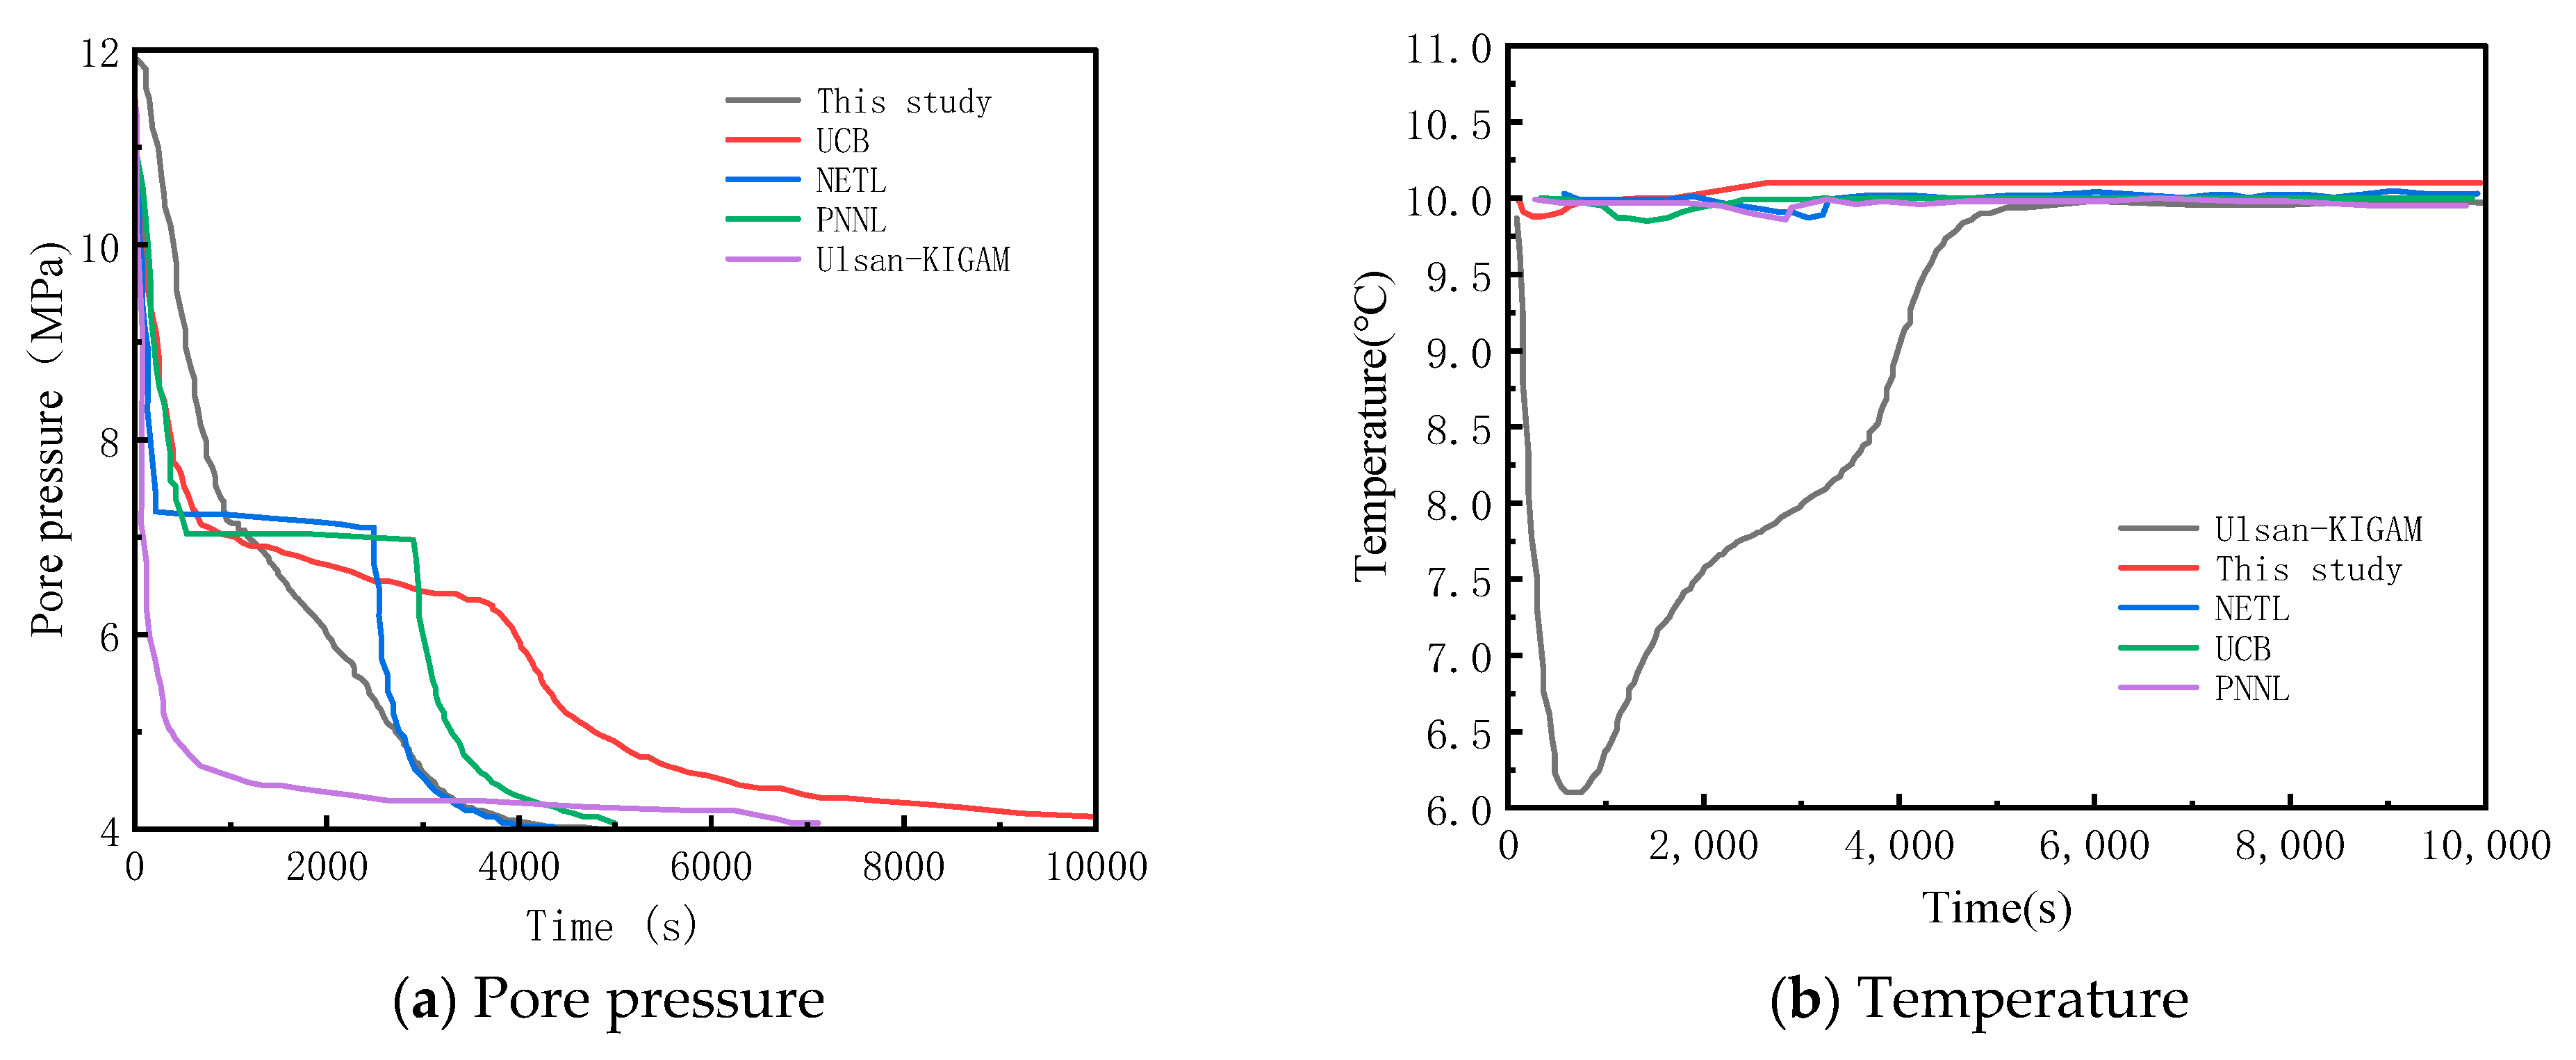
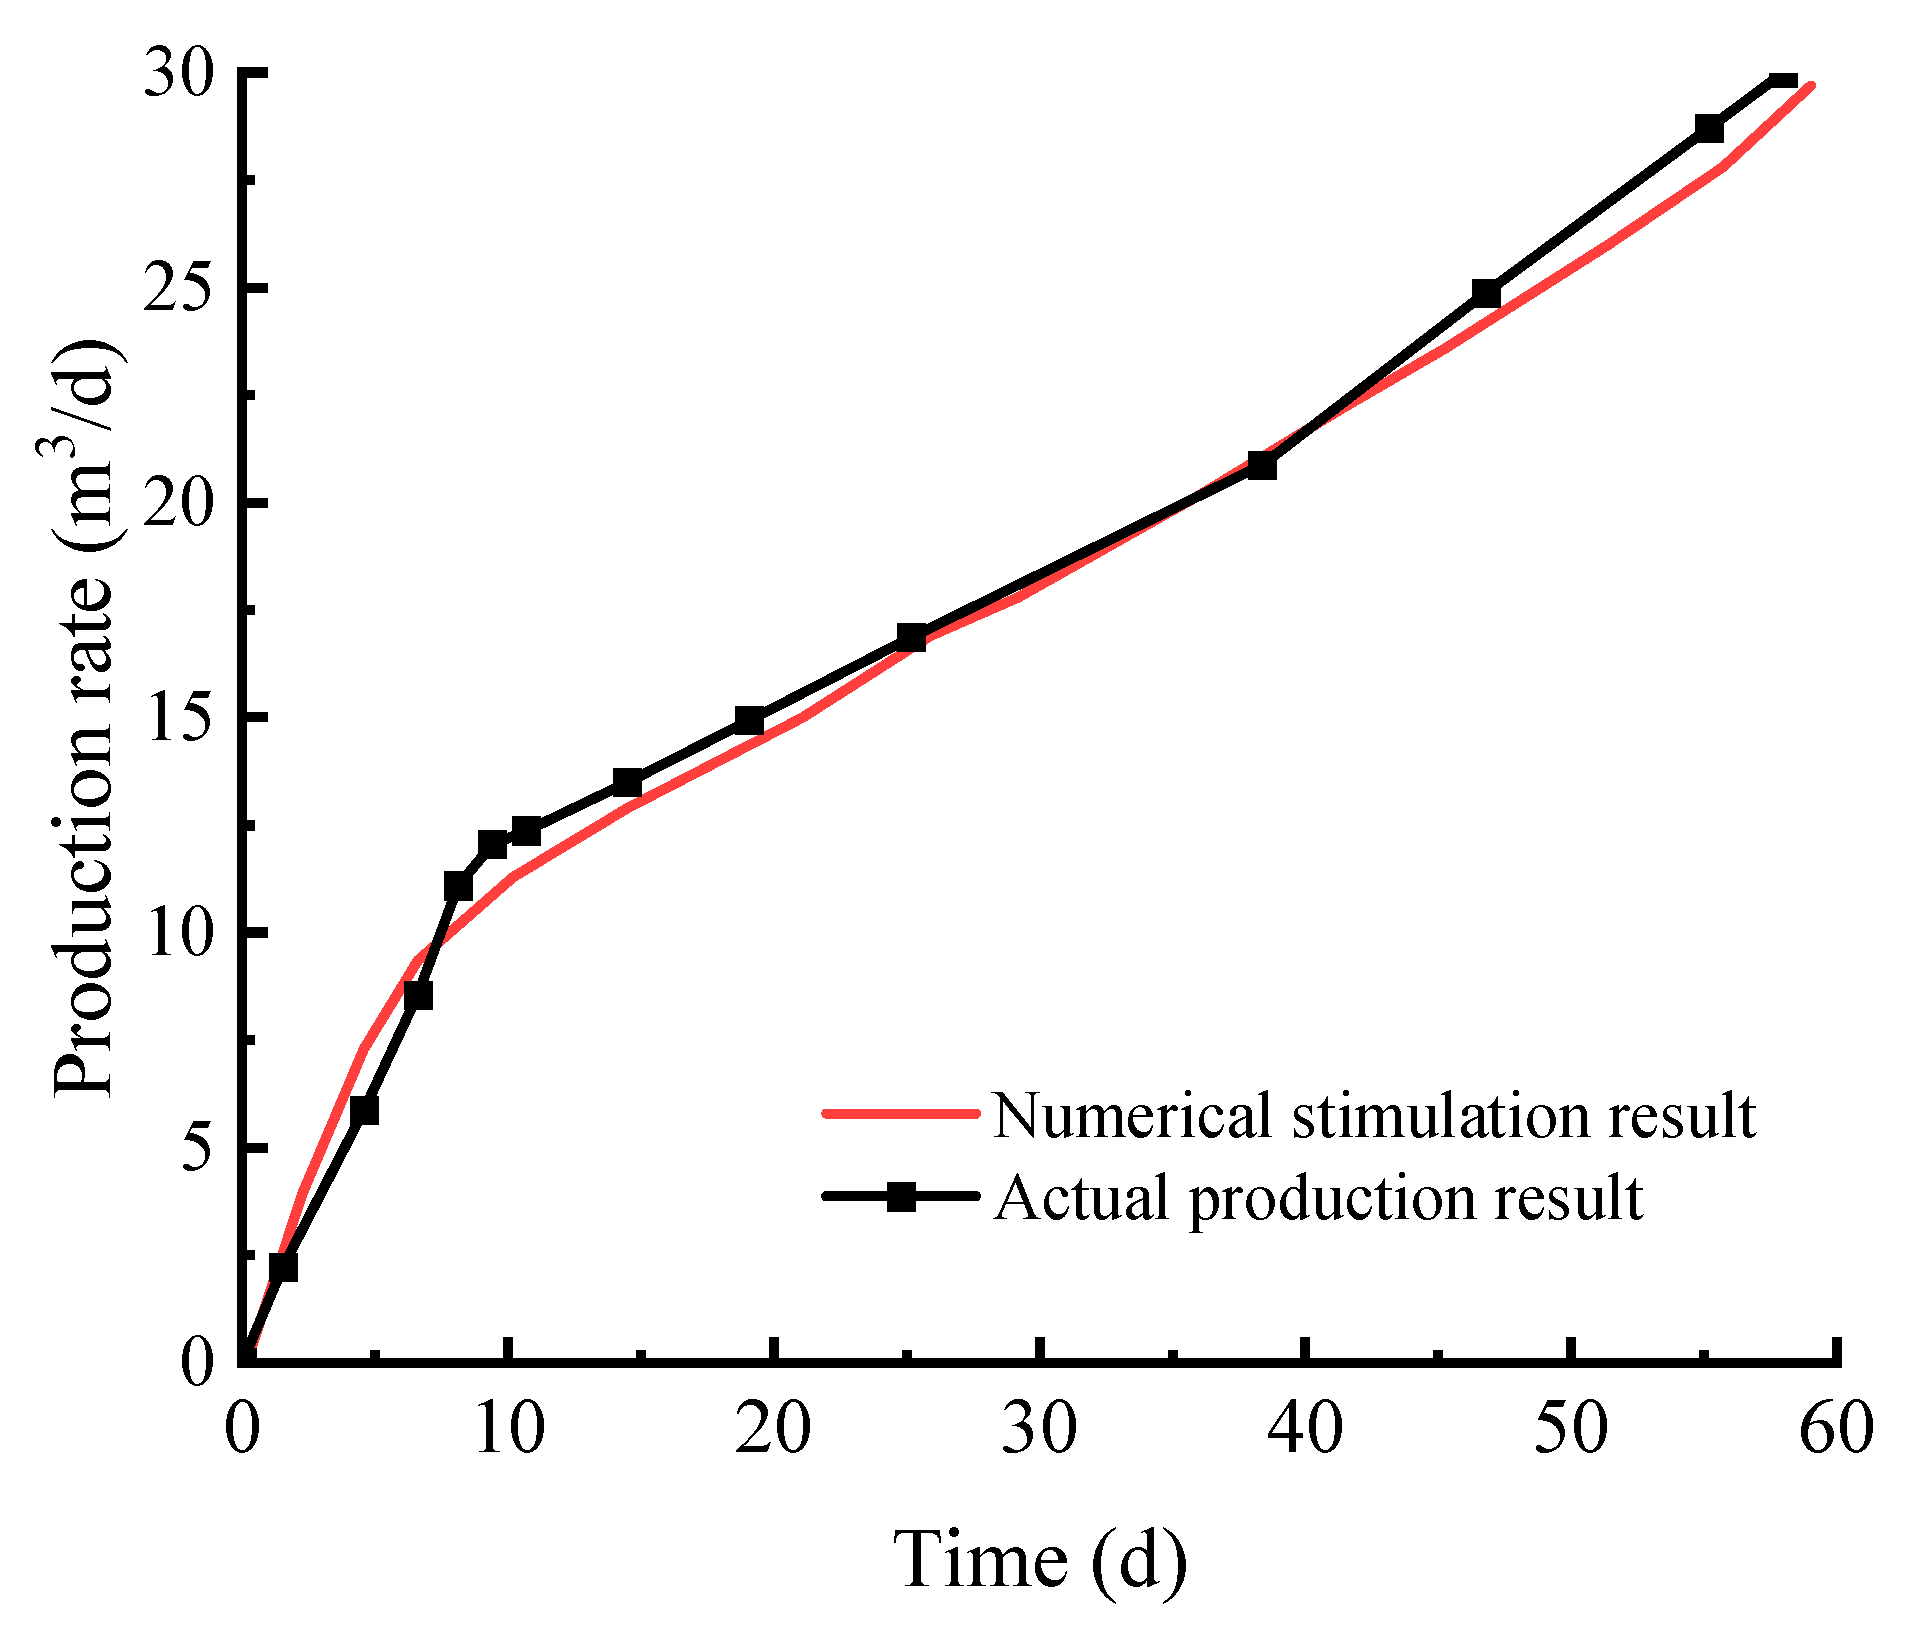
3.2. Model Verification for Hydrate Depressurization Production

The hydrate phase change model was verified by comparing it with the results of Case 3 in Benchmark Problem 1 of IGHCCS2. Figure 4 shows the initial and boundary conditions of the 2D axisymmetric model in Case 3. The model has a radius of 5 mm and a height of 30 mm. The axis of symmetry is set with roller support, impermeable, and adiabatic conditions, meaning that only vertical deformation can occur on this axis, with no fluid flow or heat transfer. Both the top boundary and the cylindrical boundary of the model have constant stress and temperature conditions and are impermeable boundaries. The bottom boundary of the model can only move vertically and has a constant temperature boundary condition. The pressure at the bottom boundary decreases linearly from 12 MPa to 4 MPa within 10 s and remains constant thereafter, with a simulation time of 10,000 s. The initial pore pressure and initial external stress of the model are 12 MPa and 13 MPa, respectively. Both the initial water saturation and initial hydrate saturation are 0.5. The initial temperature and constant temperature boundary condition are 10 °C, the model porosity is 0.4, and the permeability is 10−16 m2.
Figure 5 shows a comparison between the numerical calculation results of this study and those from other models, revealing that all results are generally consistent and exhibit the same trend of change. Figure 5a presents the curve of pore pressure versus time. It can be observed that the differences in the rate of pore pressure decline are relatively complex, which is attributed to the variations in hydrate phase change models and permeability models adopted by different solvers. Figure 5b displays the numerical simulation results of temperature changes over time, indicating that the results of this model are basically consistent with those from other simulators. Before the onset of hydrate dissociation, the temperature remains constant; then, it decreases slightly due to hydrate dissociation, and finally recovers through heat conduction from the constant-temperature boundary.
The accuracy of the solver’s calculation results is verified by comparing with the actual mining data. The verification work is carried out by using the relevant data of the 2017 hydrate production test in the South China Sea, and the comparative analysis leads to Figure 6 and Figure 7.
Through comparison, it is found that the production regime in actual production gradually decreases, with the daily gas production decreasing stepwise from 16,500 m3/d to 5000 m3/d, which is consistent with the trend in the daily gas production results from numerical simulation. The cumulative gas production results from numerical simulation can be well fitted with the actual cumulative gas production results. The numerical simulation results show good consistency with the actual mining data, which not only verifies that the numerical model constructed in this study and the parameter settings of its solver can accurately characterize the dynamic process of natural gas hydrate depressurization production in the Shenhu sea area but also confirms the reliability and validity of the model.

4. Analysis of Numerical Simulation Results for Depressurization Production

For the reservoir pressure, reservoir temperature, and hydrate saturation during the mining process, as the parameters around the production well show significant changes, as well as for the convenience of observation, the image presents a locally enlarged view of approximately 90 m near the production well.

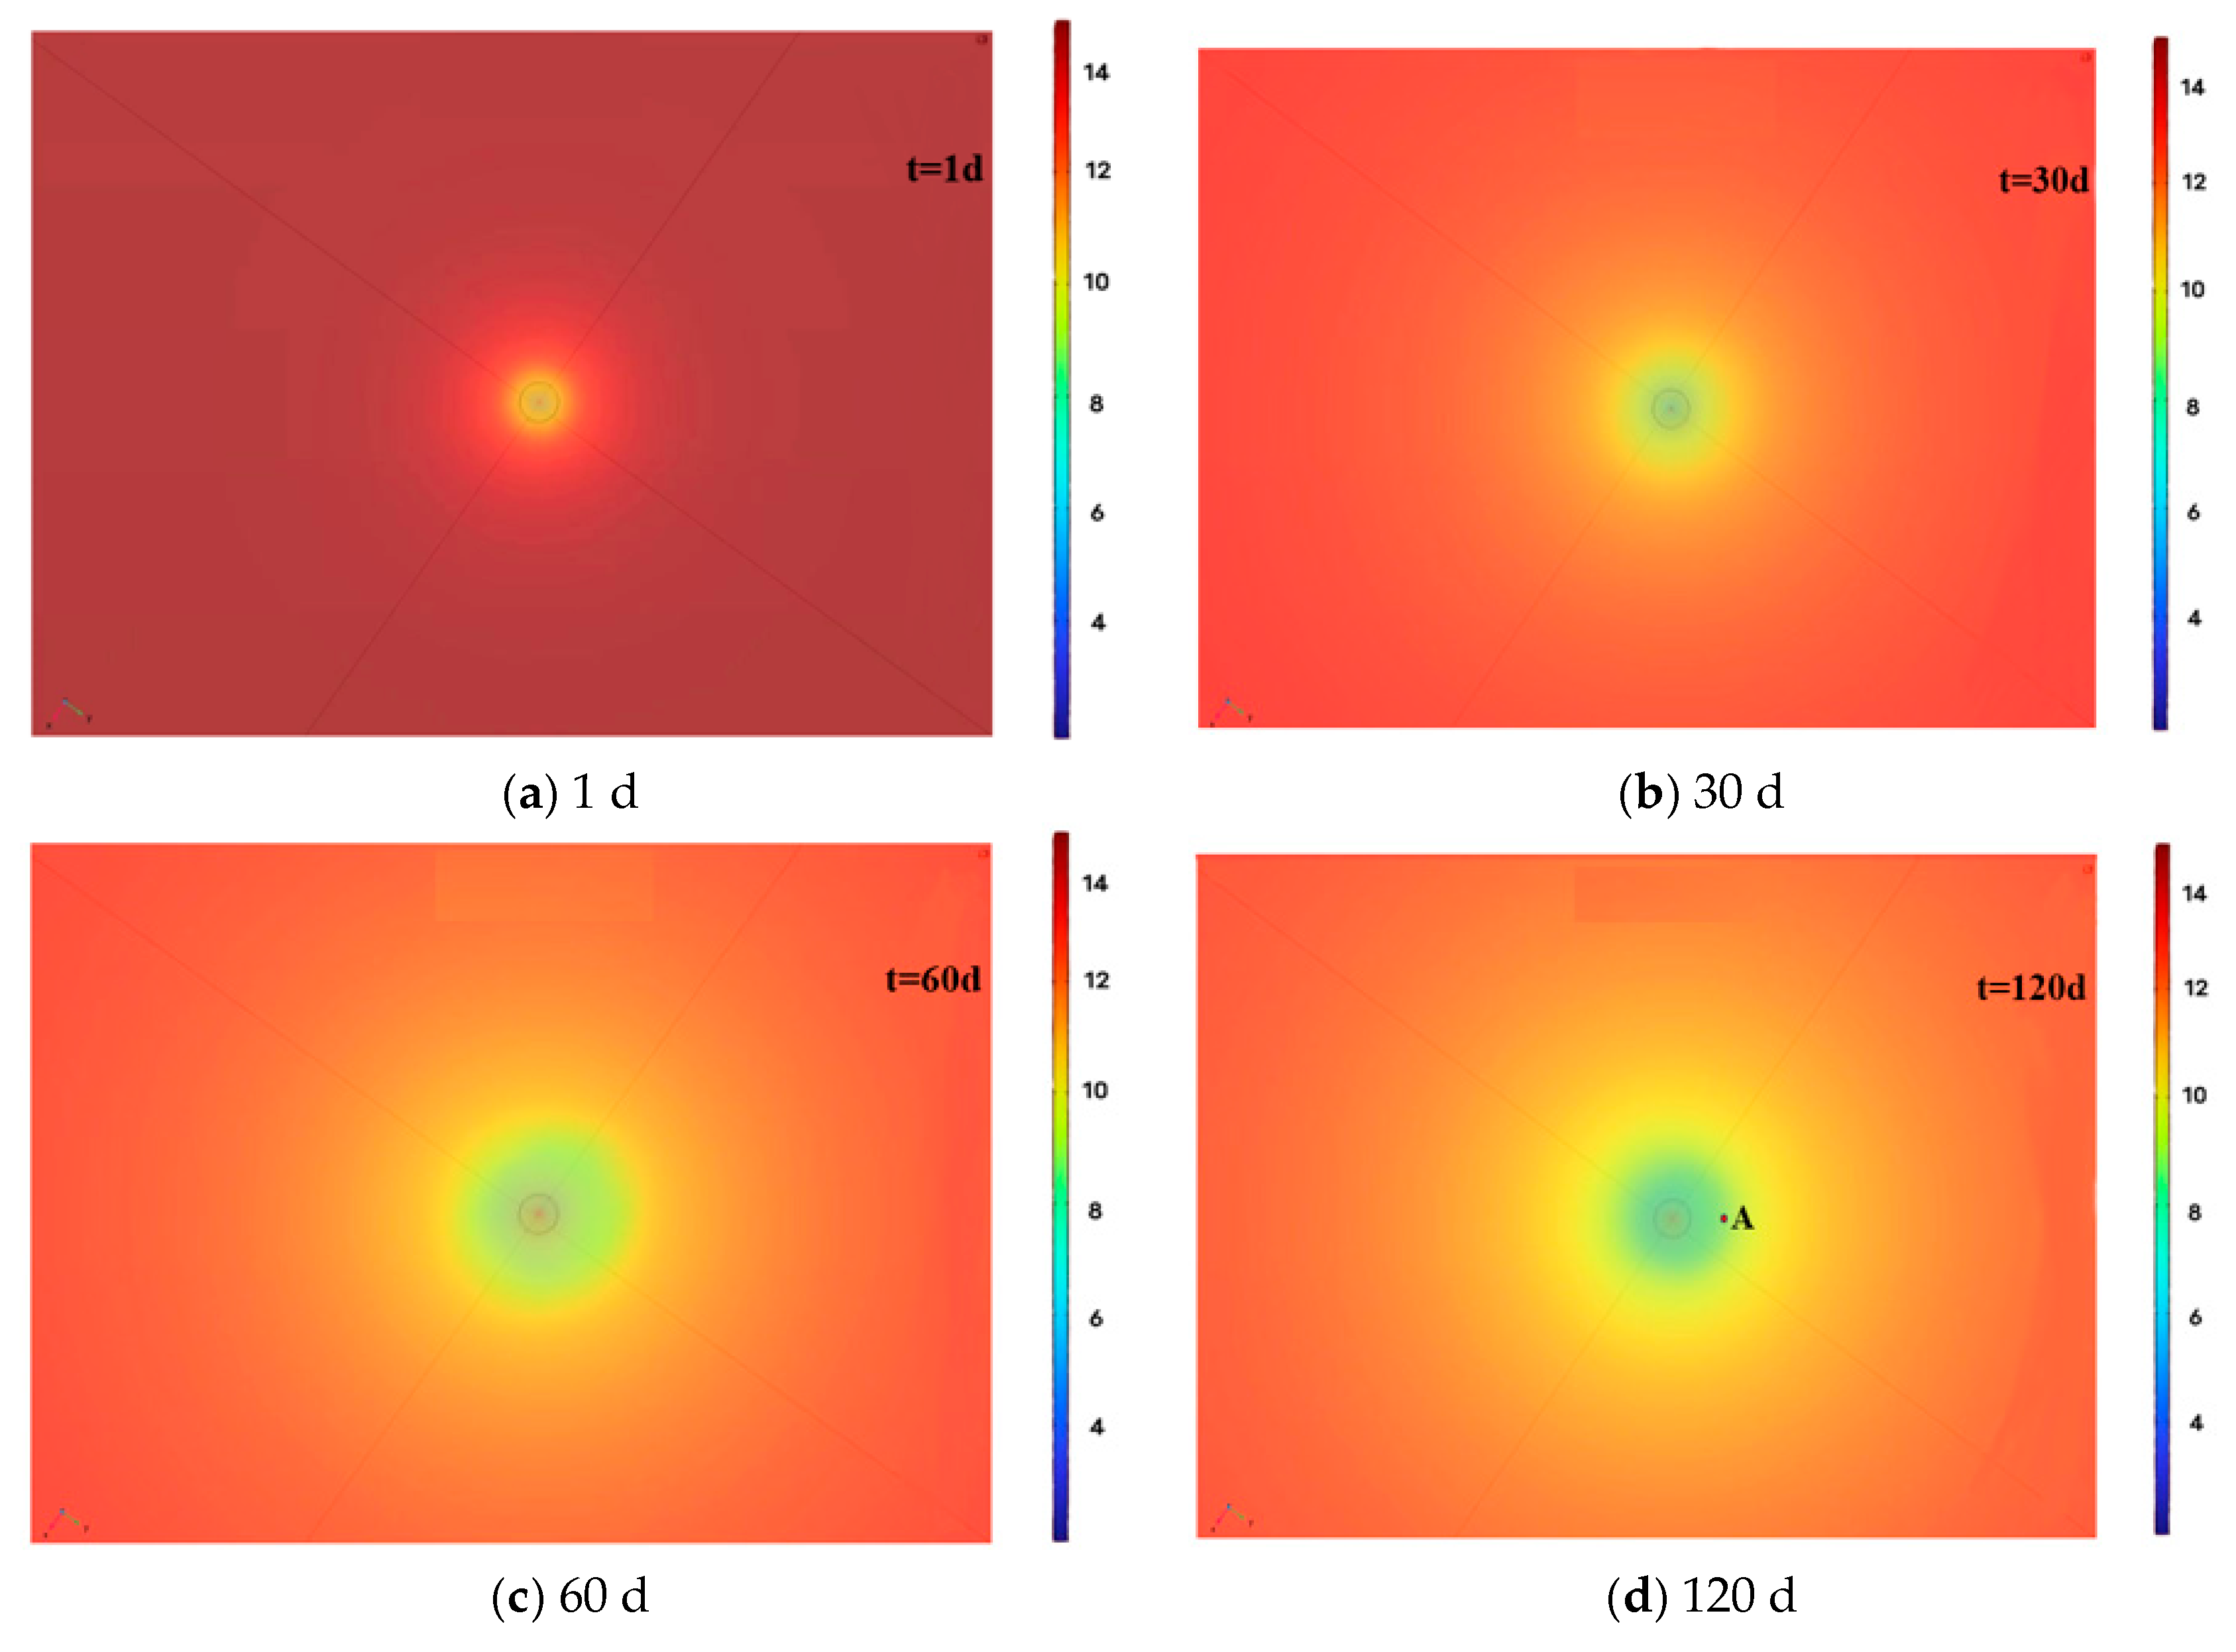
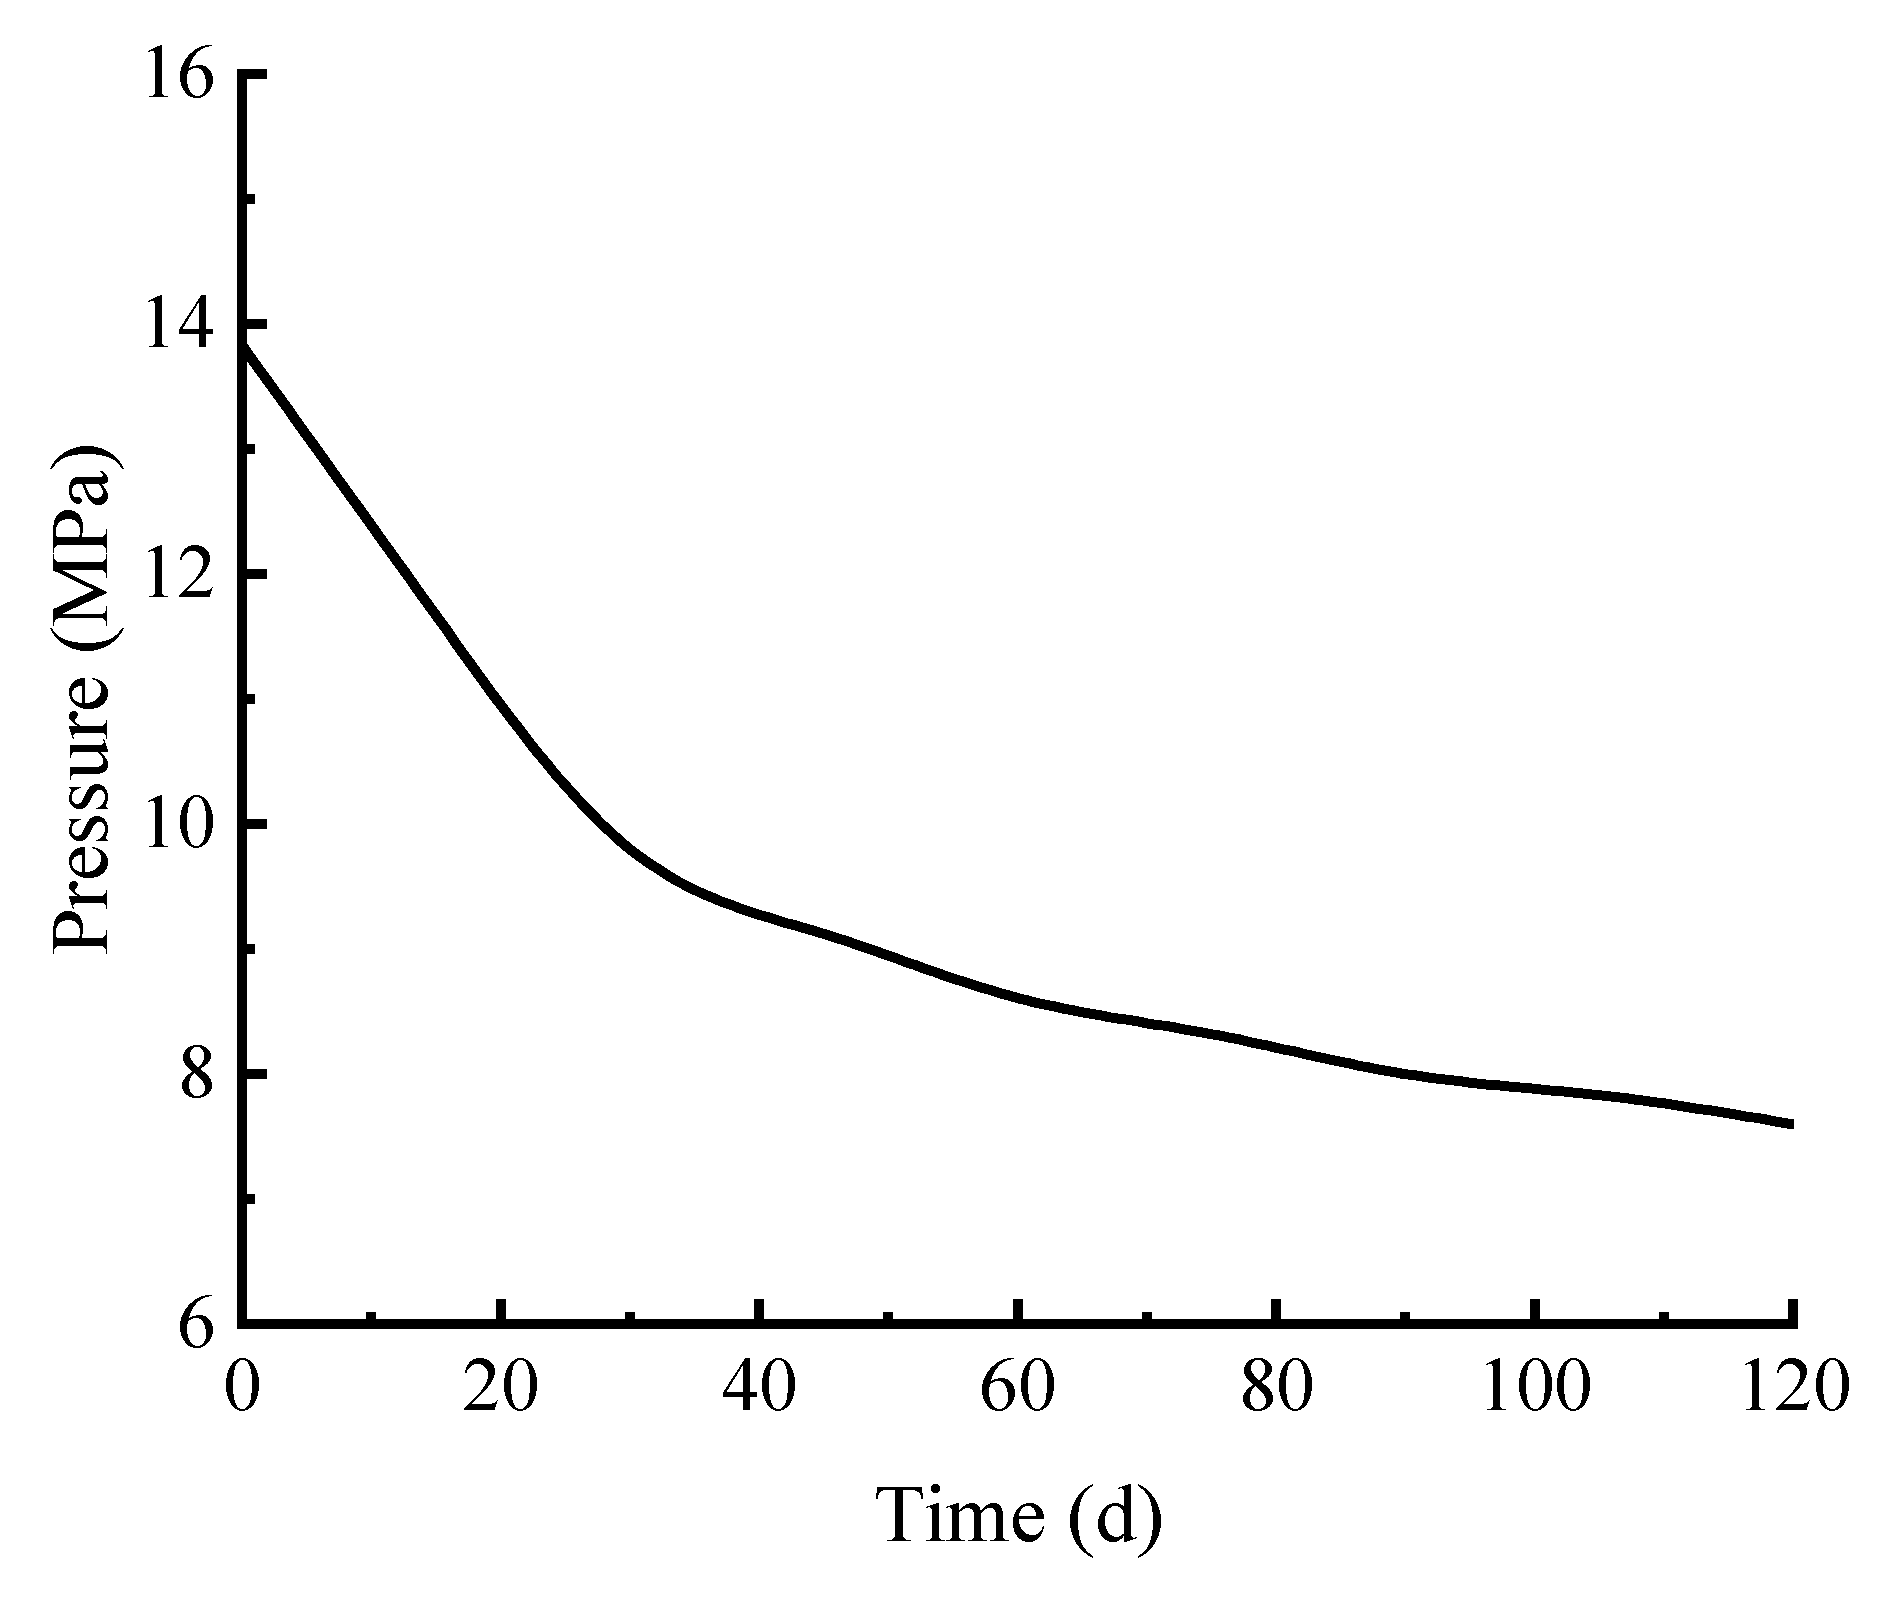
4.1. Analysis of Reservoir Pressure Change

The change in reservoir pressure during the depressurization production of hydrate reservoirs in vertical wells in Shenhu sea area is shown in Figure 8.
As shown in Figure 8, during the depressurization production of vertical wells, the area of pressure reduction expands gradually in a circular pattern with the progression of mining time. At 0–30 days, the pressure at Point A (10 m from the wellbore) drops rapidly, with the initial formation pressure decreasing from 13.83 MPa to approximately 9.8 MPa. This is due to the rapid dissociation of hydrates, leading to a quick pressure drop. At 30–60 days, the pressure decline rate slows down significantly, with the pressure at Point A decreasing from 9.8 MPa to around 8.6 MPa. At 60–120 days, the pressure continues to decline gradually, dropping to approximately 7.6 MPa.
Figure 9 is the curve of pressure at Point A, 10 m away from the vertical wellbore, changing with time.
As shown in Figure 9, the pressure at Point A decreases rapidly within 0–30 days, dropping from 13.83 MPa to 9.8 MPa, a reduction of 4.03 MPa (36.37%). This occurs because depressurization production disrupts the phase equilibrium conditions for natural gas hydrate stability, causing rapid hydrate dissociation and subsequent pressure decline. From 30 to 60 days, the pressure continues to decrease from 9.8 MPa to 8.6 MPa (12.24% reduction), with a slower decline rate compared to the 0–30 day period. This is due to the water and gas generated by hydrate dissociation partially replenishing the fluid extracted during depressurization. Between 60 and 120 days, the pressure at Point A gradually decreases to 7.6 MPa (11.63% reduction). As production progresses, hydrate dissociation consumes energy, and heat transfer from the surrounding medium is limited. The reservoir pressure approaches a new dynamic equilibrium state, where the dissociation rate gradually balances with heat replenishment, leading to a gentle pressure change.

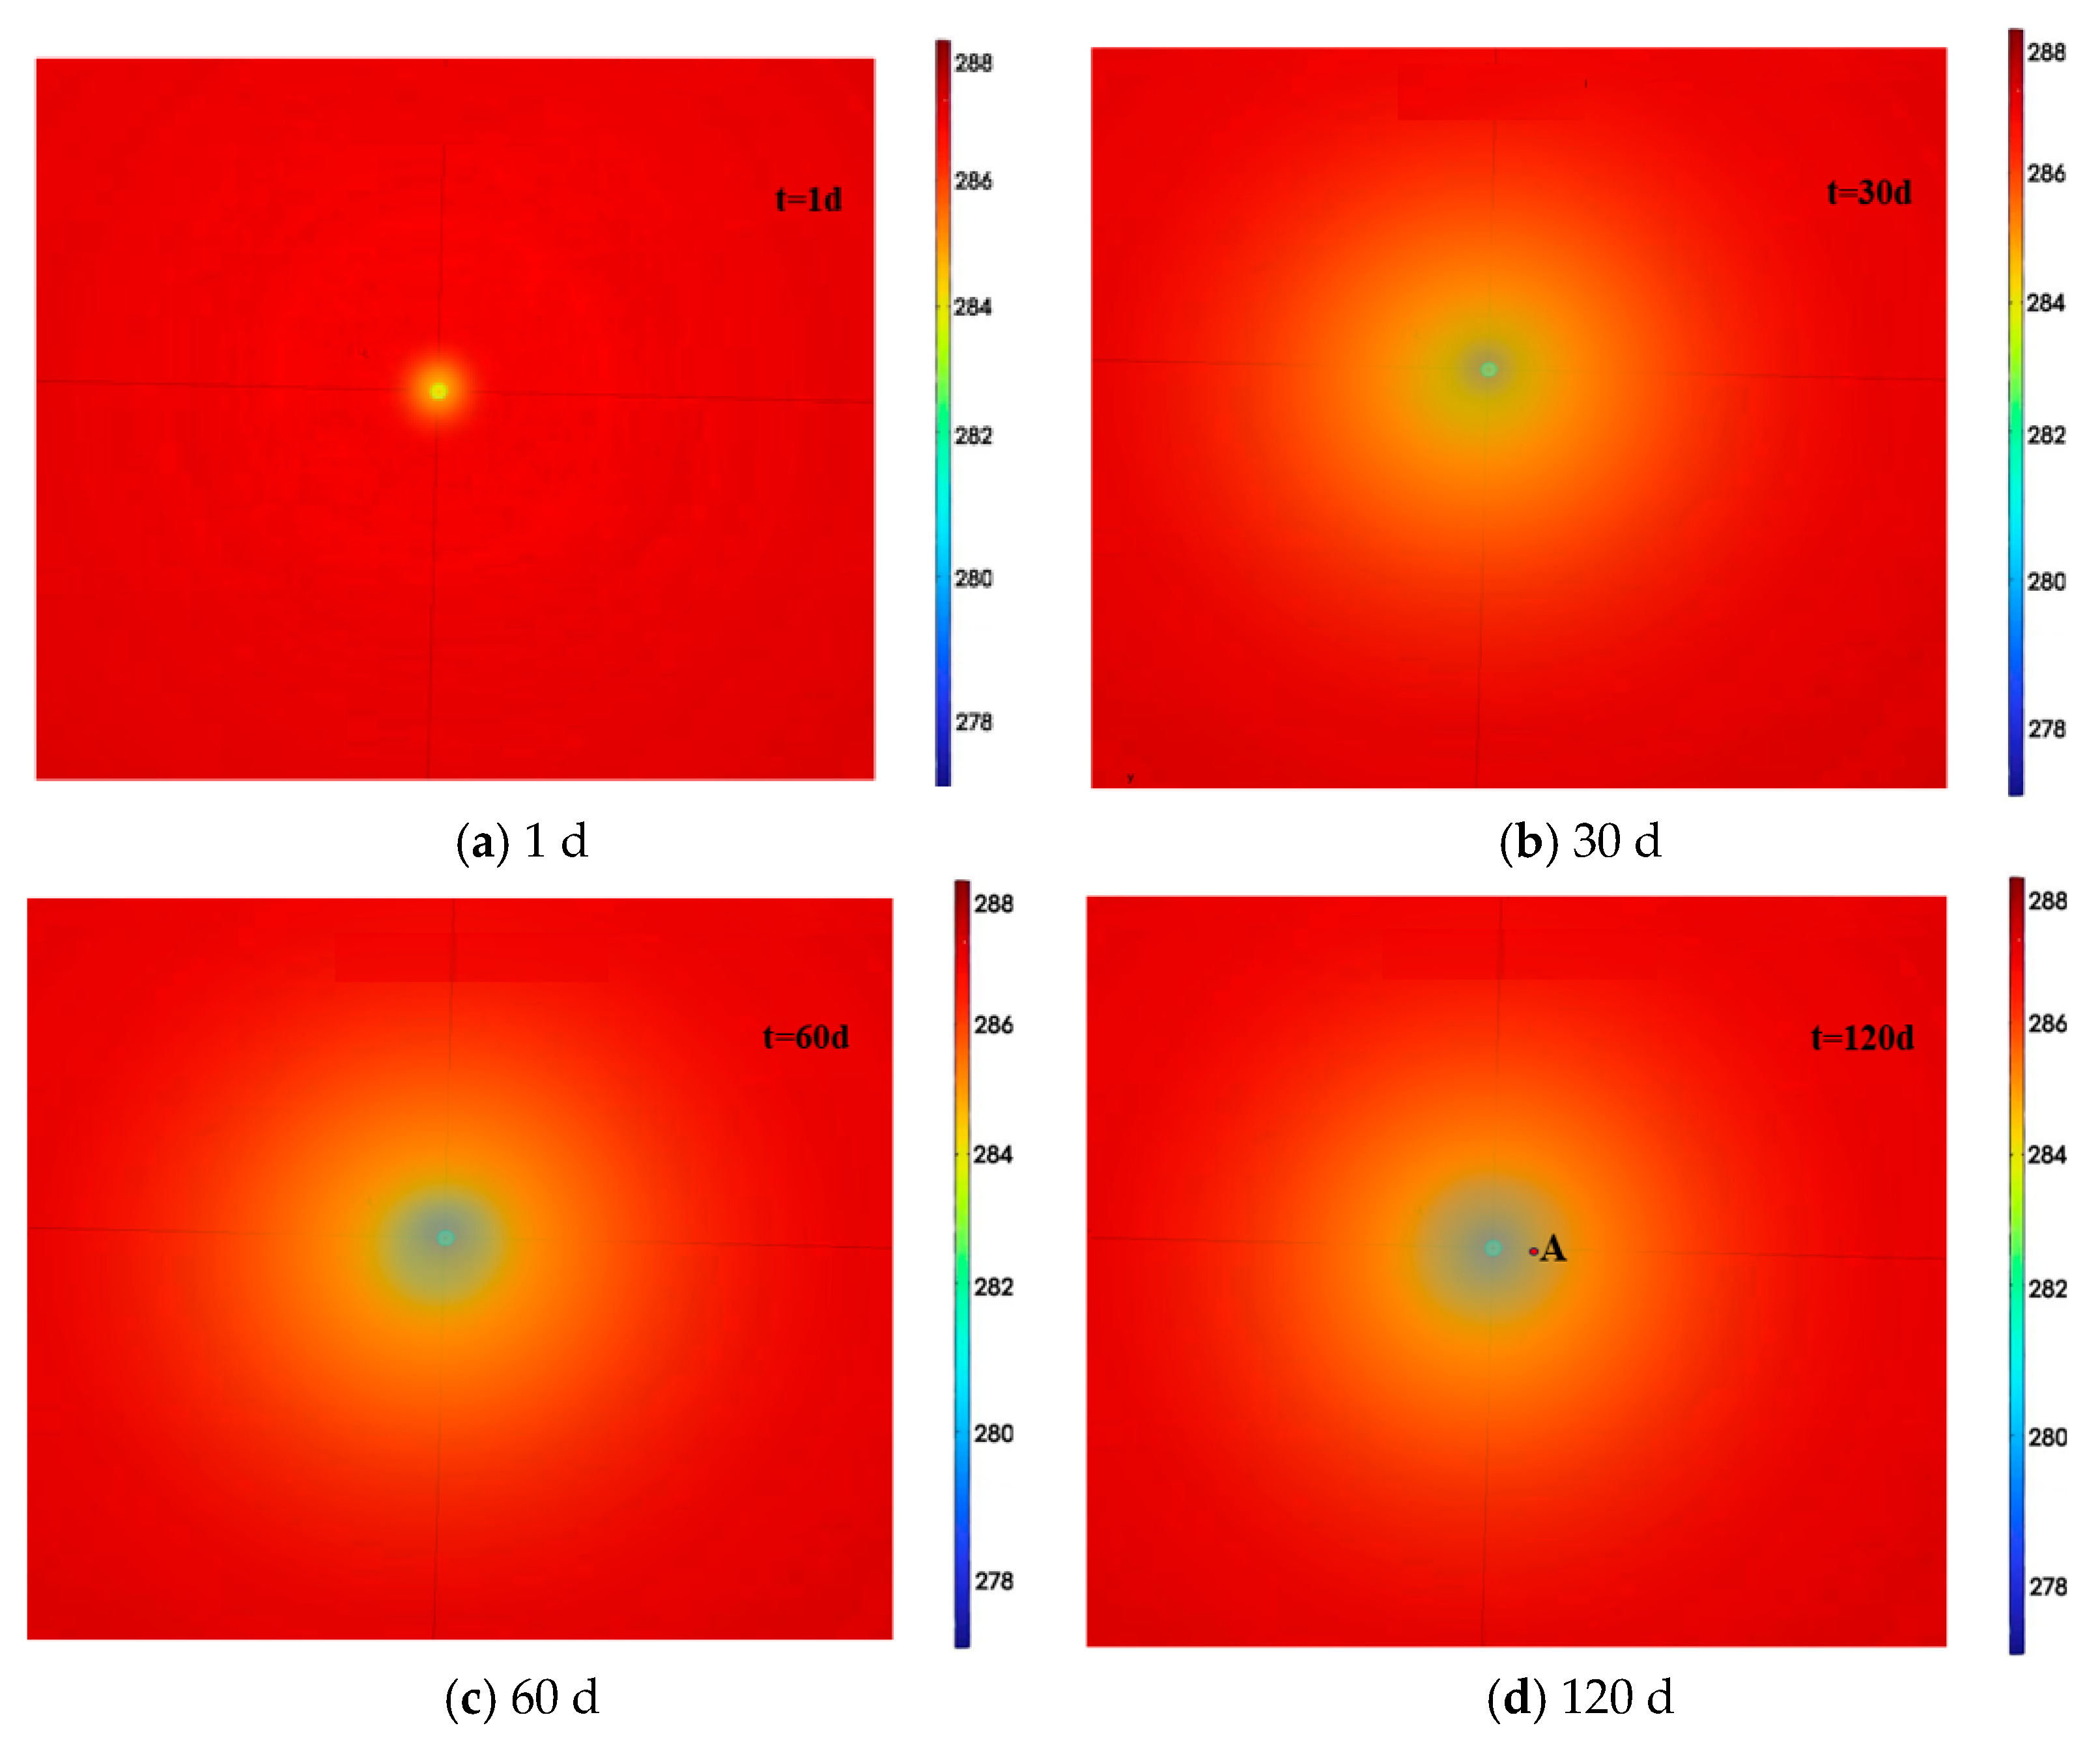
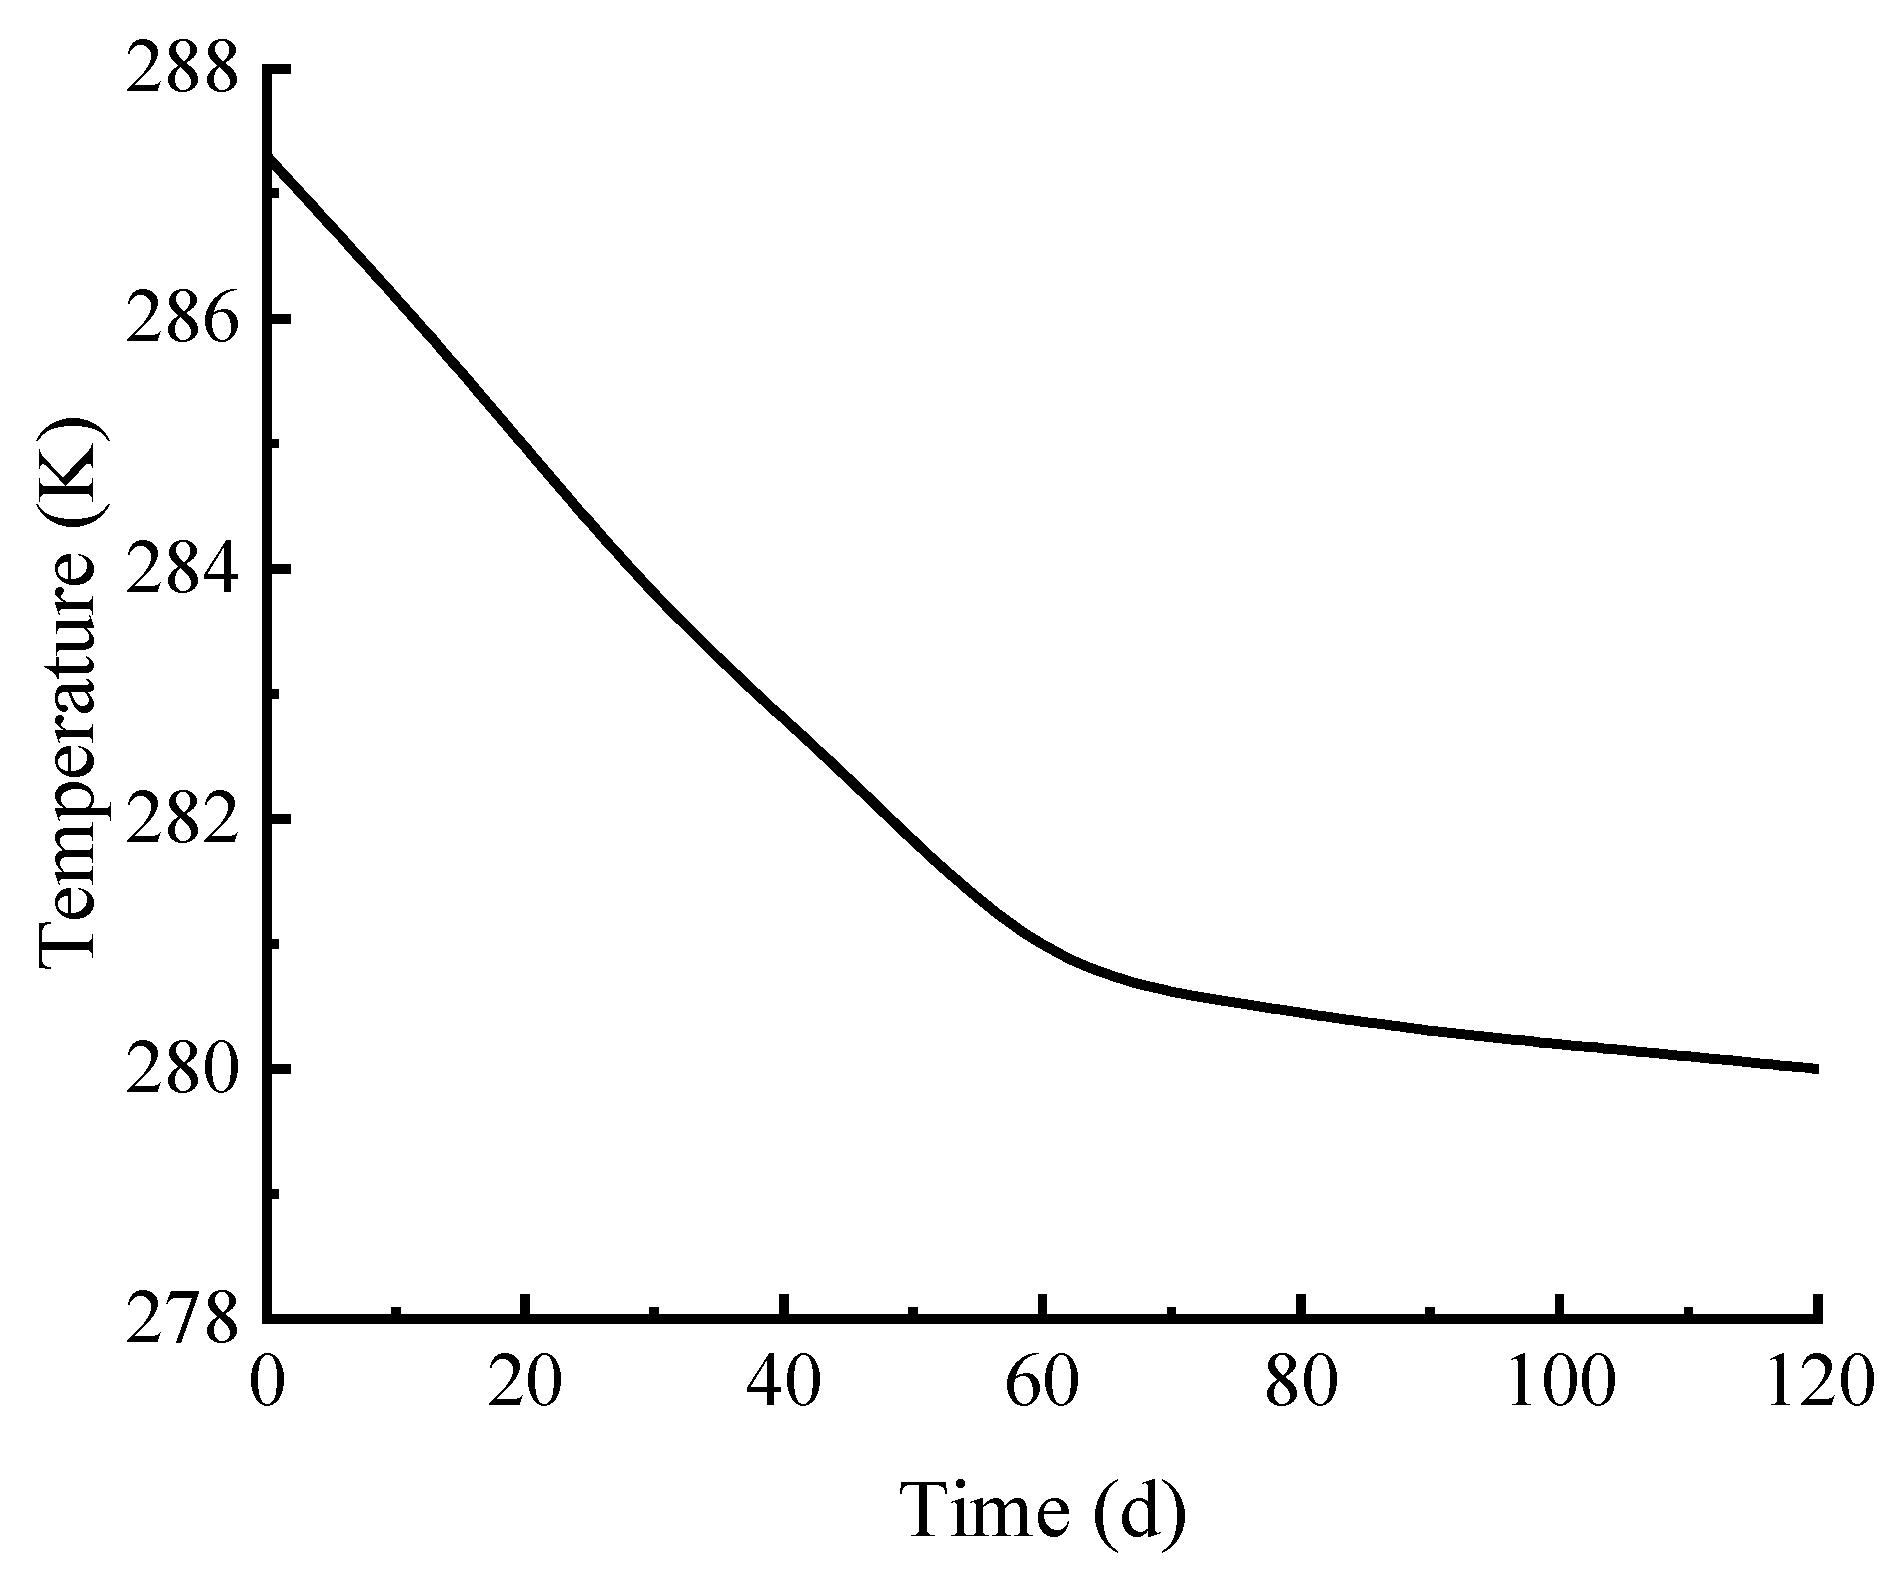
4.2. Analysis of Reservoir Temperature Change

As shown in Figure 10, the variation in reservoir temperature during the depressurization production is evident. During the depressurization exploitation process, temperature changes are not limited to the local area around the wellbore, but propagate in the reservoir in the form of a radially expanding cold front. Hydrate dissociation is a strong endothermic process (each cubic meter of dissociated hydrate absorbs approximately 5.8 × 10⁵ J of heat), which absorbs heat from the surrounding formations and fluids, forming a low-temperature zone centered on the production well. According to the model parameters (reservoir thermal conductivity of 1.5 W·m−1·K−1), this low-temperature zone gradually expands over time. Within 0–30 days, the temperature at 10 m around the well drops sharply from 287.3 K to 283.8 K (a decrease of 3.5 K). At this time, the cold front has expanded to the range of 50–80 m around the well. However, due to the low thermal conductivity of the reservoir, heat supply is insufficient, leading to a rapid temperature drop in the near-well area. Within 30–60 days, the rate of temperature drop slows down (dropping to 281 K at 10 m). The cold front further expands to 100–150 m, but the expansion speed slows down because the hydrate dissociation rate decreases, resulting in reduced heat absorption demand. Within 60–120 days, the temperature stabilizes at around 280 K, and the cold front expands beyond 200 m. At this point, the reservoir temperature field tends to be gentle, reflecting a dynamic balance between the endothermic effect of dissociation and the heat conduction from the surrounding formations. The overlying and underlying caprocks (each 30 m thick) supply heat to the hydrate layer through heat conduction. However, due to the extremely low permeability of the caprocks (5 mD), fluid convective heat transfer is negligible, resulting in vertical heat supply efficiency that is only 15–20% of that in the radial direction, which further exacerbates the horizontal temperature gradient.
Figure 11 displays the temperature–time curve at Point A, 10 m from the vertical wellbore. As shown in Figure 11, the temperature at Point A within 0–30 days decreases significantly from the initial 287.3 K to 283.8 K, a drop of 3.5 K (1.22% reduction). This is attributed to the rapid pressure decrease triggering fast hydrate dissociation, with intense endothermic heat absorption causing the sharp temperature decline. From 30 to 60 days, the temperature continues to drop but at a slower rate, reaching 281 K (a 1 K reduction). This occurs because the hydrate dissociation rate slows down, leading to less dissociation and limited heat absorption. Between 60 and 120 days, the temperature stabilizes at approximately 280 K (a 1 K reduction), indicating that the reservoir’s thermal equilibrium has adapted to the production activities, and the temperature tends to remain constant.

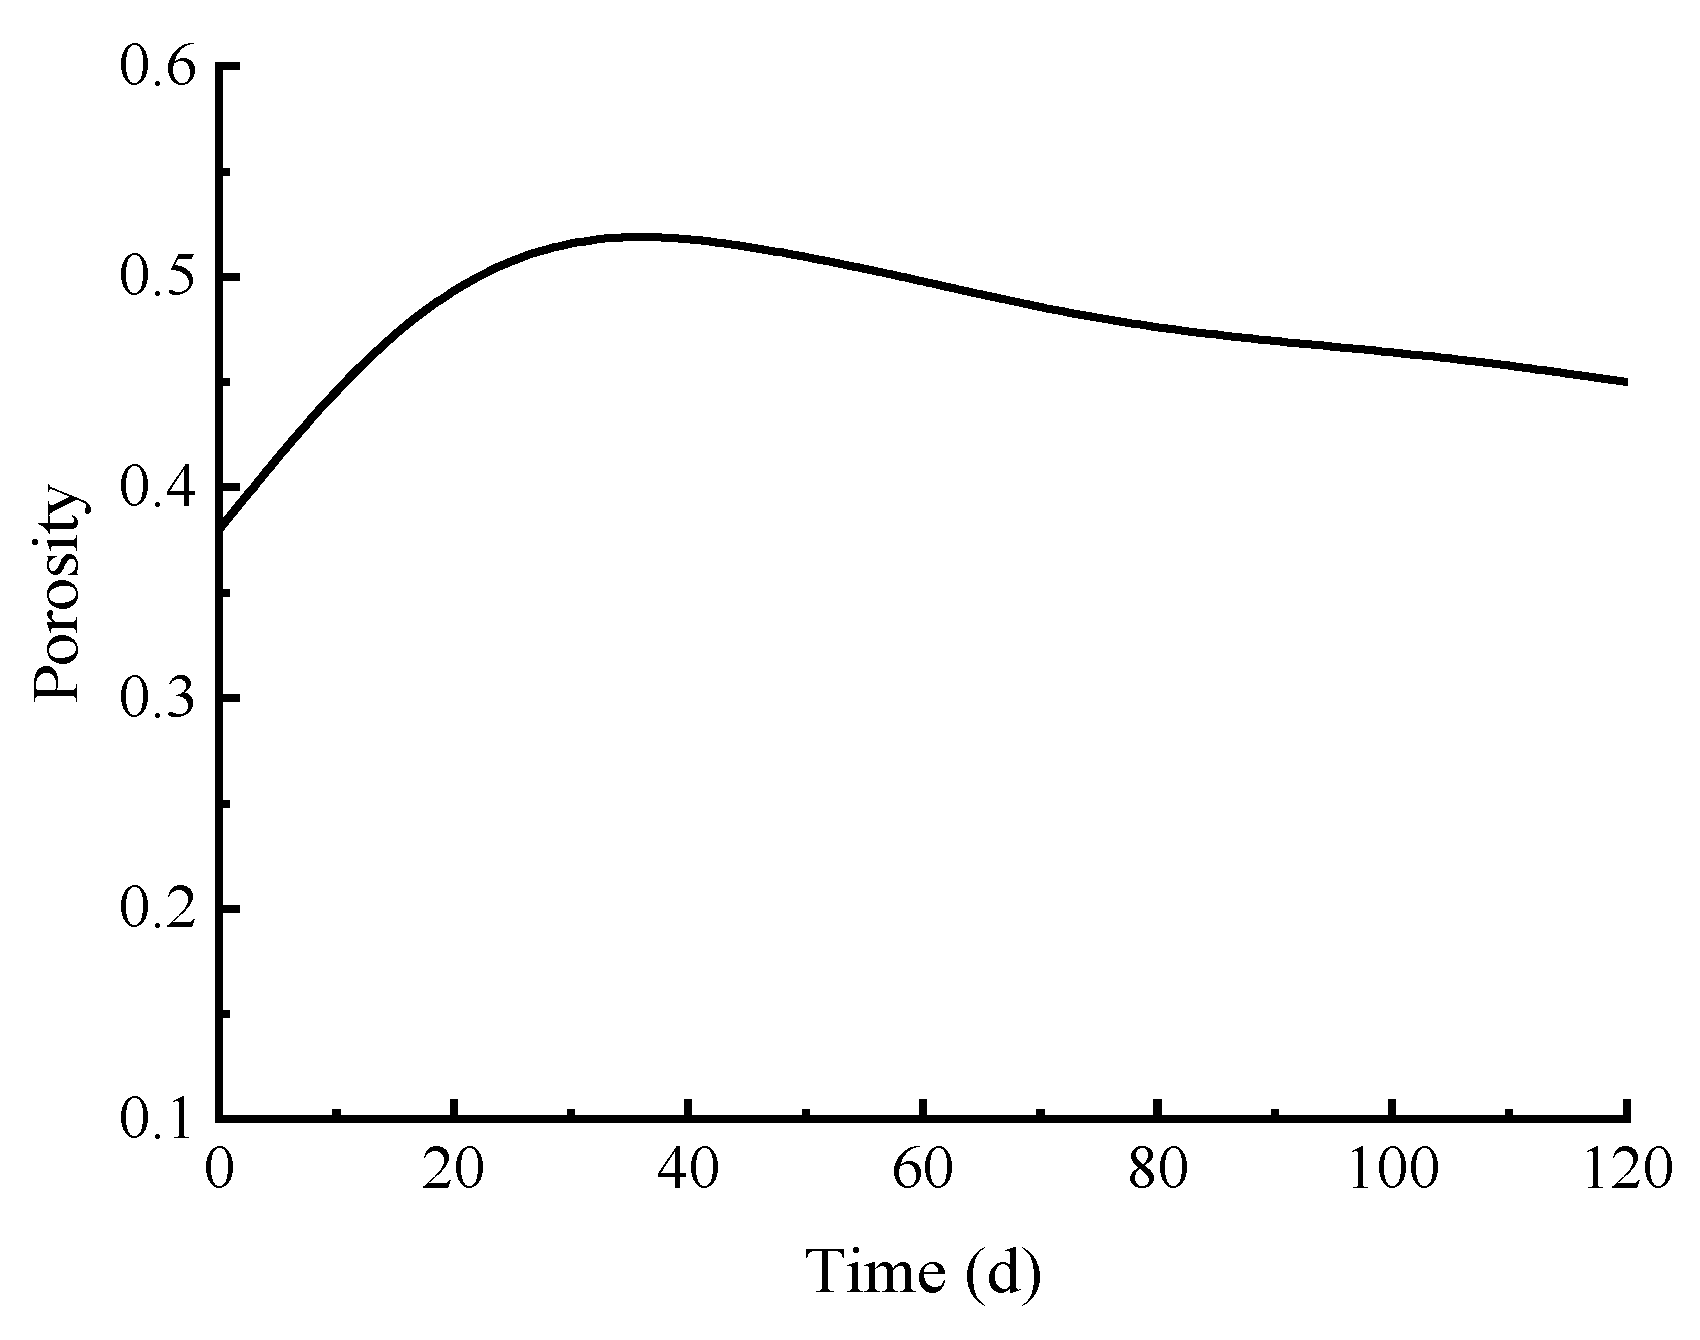
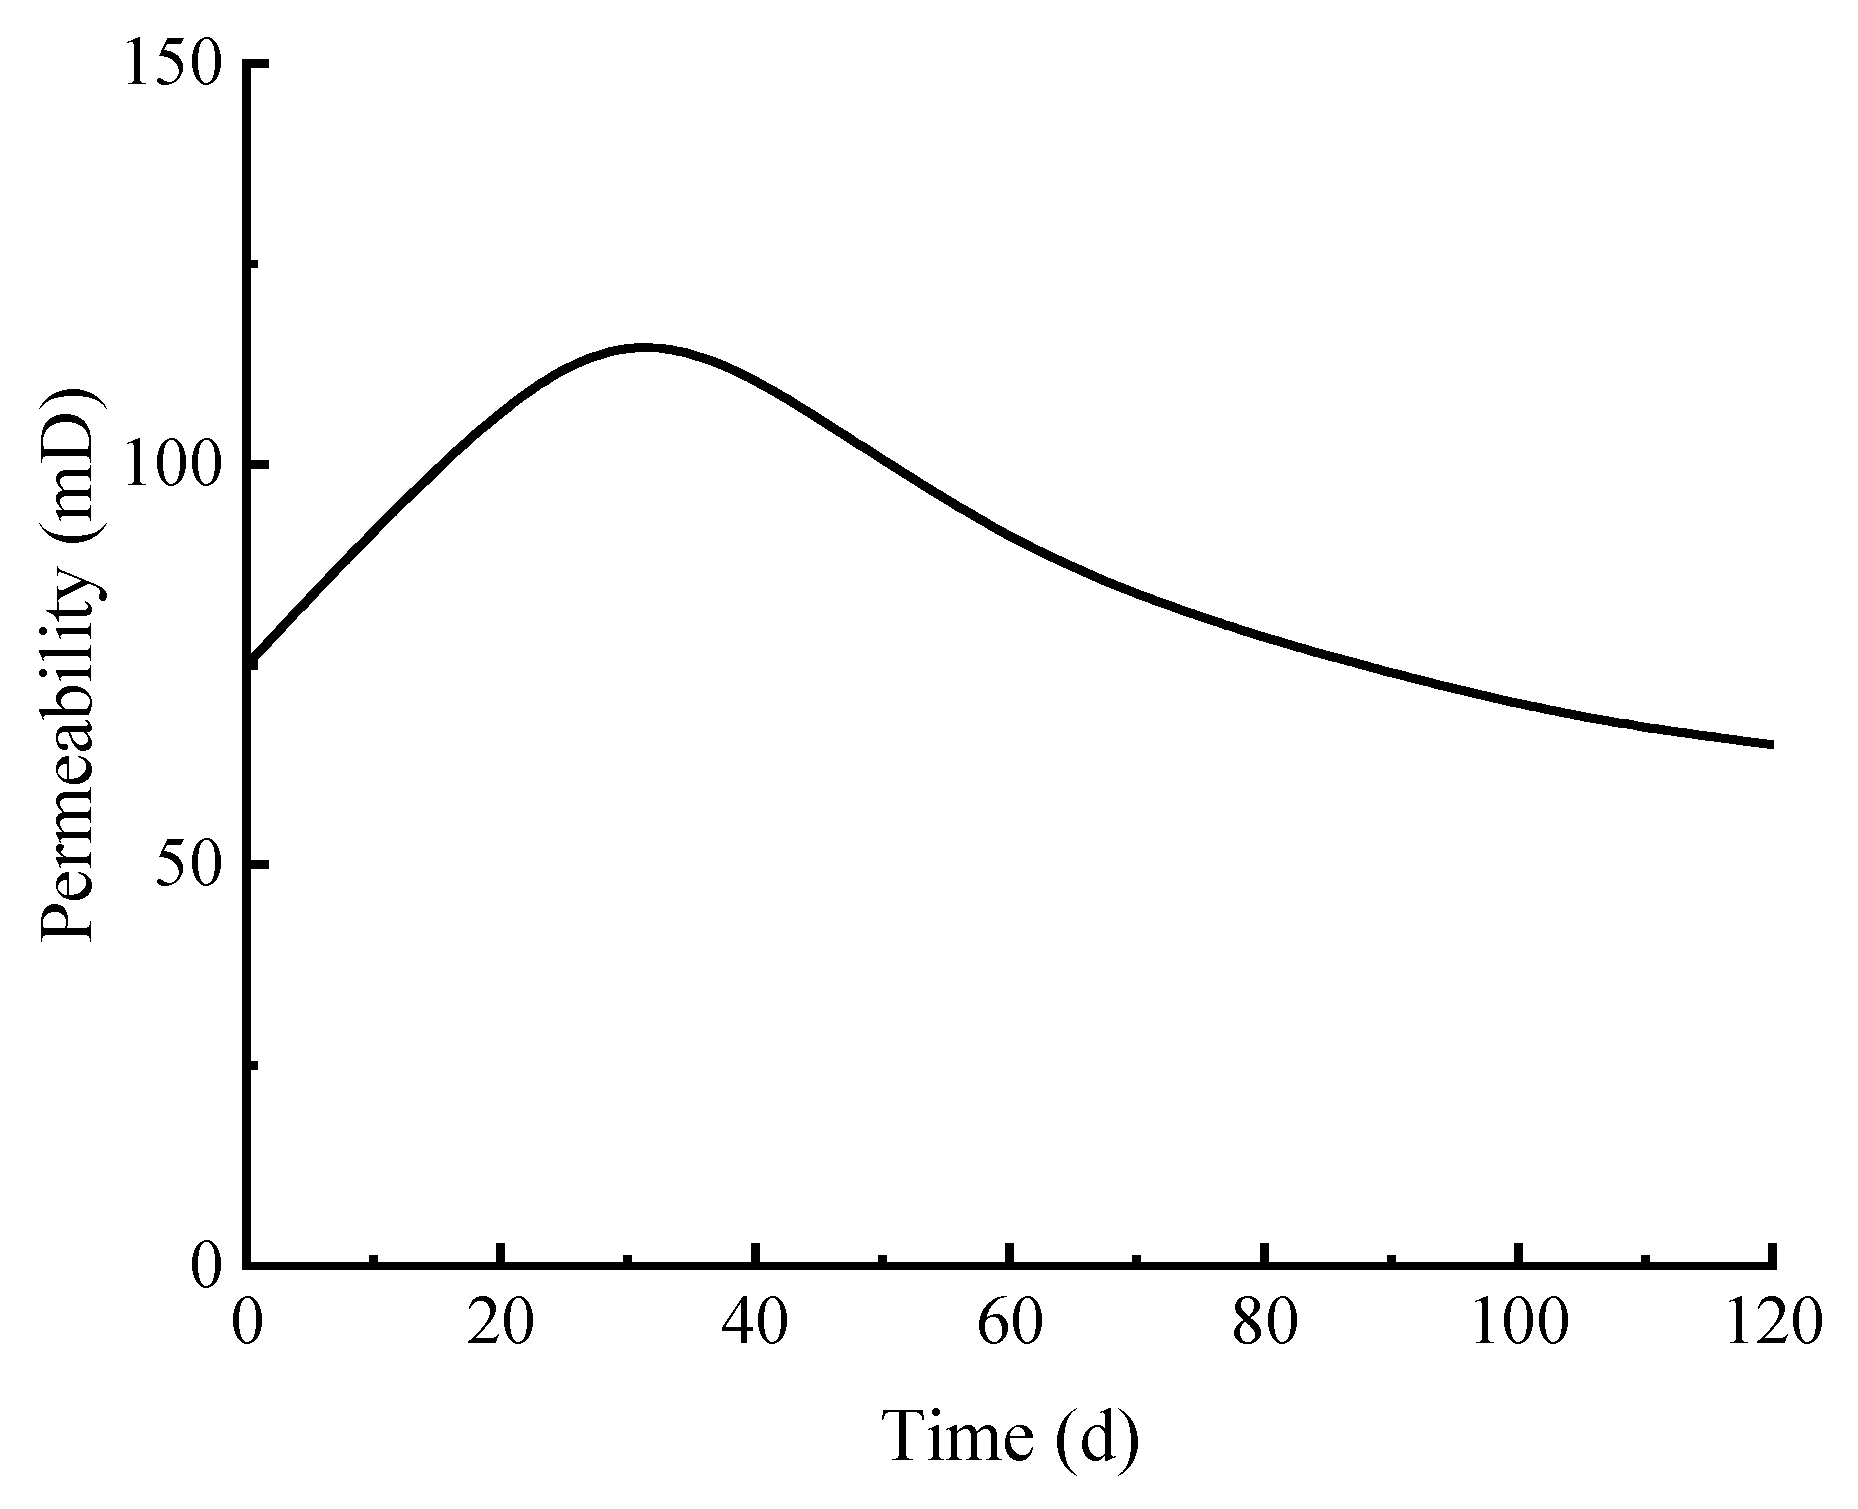
4.3. Analysis of Physical Property Parameters Change

Figure 12 illustrates the curve of porosity at Point A, 10 m away from the vertical wellbore, changing with time. As shown in Figure 12, during the depressurization production of vertical wells, the porosity at Point A within 0–30 days increases from 0.38 to 0.52, with an increase rate of 36.84%. This is because after depressurization production, hydrates dissociate rapidly, and the hydrates originally occupying the pore space are converted into two phases: gas and liquid. The release of pores leads to the increase in porosity. From 30 to 60 days, the porosity starts to slowly decrease to 0.48, with a decrease rate of 7.69%. This is due to the fact that the dissociation rate of hydrates slows down, and fine-grained materials in the reservoir migrate and redistribute with fluid flow, blocking part of the pores and causing the porosity to decrease. From 60 to 120 days, the porosity slowly decreases to 0.45, with a decrease rate of 6.25%. At this time, the reservoir structure tended to be stable, the dissociation of hydrates was basically completed, and the porosity decreased under the influence of fluid migration and slight compaction.
Figure 13 shows the curve of permeability at Point A, 10 m from the vertical wellbore, versus time. As shown in Figure 13, the permeability variation at 10 m around the wellbore exhibits a three-stage characteristic of “first increasing, then decreasing, and finally stabilizing”, which is the result of the dynamic interaction of multiple mechanisms. Within 0–30 days, the permeability rapidly increases from 75 mD to 100 mD, mainly due to the rapid dissociation of hydrates (with saturation decreasing from 0.4 to 0.2) that releases pore space. Additionally, the sudden drop in reservoir pressure (from 13.83 MPa to 9.8 MPa) causes slight expansion, widening the seepage channels. Within 30–60 days, the permeability first rises to a peak of 120 mD and then drops back to 90 mD. In the early stage, the continuous dissociation of residual hydrates and the slow pressure drop still supplement pores; in the later stage, however, fine particles migrate with water flow and block pore throats, and the slowed dissociation rate leads to insufficient new pores, resulting in the decline in permeability. Within 60–120 days, the permeability stabilizes at 60 × 10−3 μm2. Since hydrate dissociation basically stops, the migration of fine particles weakens, but the low-permeability zones formed by previous blockages remain fixed. Coupled with slight compaction of the reservoir, a stable low-permeability state is finally formed. This process reflects the dynamic competition between mechanisms such as “hydrate dissociation enhancing permeability”, “pressure-driven pore expansion”, “fine particle migration blocking permeability”, and “reservoir compaction reducing permeability” in unconsolidated argillaceous silt reservoirs during depressurization exploitation.
Figure 14 shows the curve of hydrate saturation at Point A, 10 m from the vertical wellbore, versus time. As indicated in Figure 14, the hydrate saturation at Point A continuously decreases within 0–30 days, rapidly dropping from an initial value of approximately 0.4 to 0.2, representing a 50% decrease. This is because during the initial stage of depressurization production in vertical wells, the pressure near the wellbore decreases rapidly, disrupting the phase equilibrium conditions of hydrates and causing the hydrates around the wellbore to dissociate rapidly. From 30 to 60 days, the hydrate saturation decreases from 0.2 to 0.15 (a 25% decrease), with a significantly smaller decline compared to the initial production stage. Although the hydrate dissociation zone continues to expand, the slowing down of formation pressure decline and the inhibitory effect of temperature decrease caused by the endothermic dissociation process on reaction kinetics lead to a significant reduction in the saturation decline rate. Between 60 and 120 days, the hydrate saturation continues to drop below 0.1. As the production process continues, when the formation pressure gradually approaches the equilibrium pressure, the driving force for hydrate dissociation continuously decays, causing the saturation decline rate to further slow down and finally reach a dynamic equilibrium state.

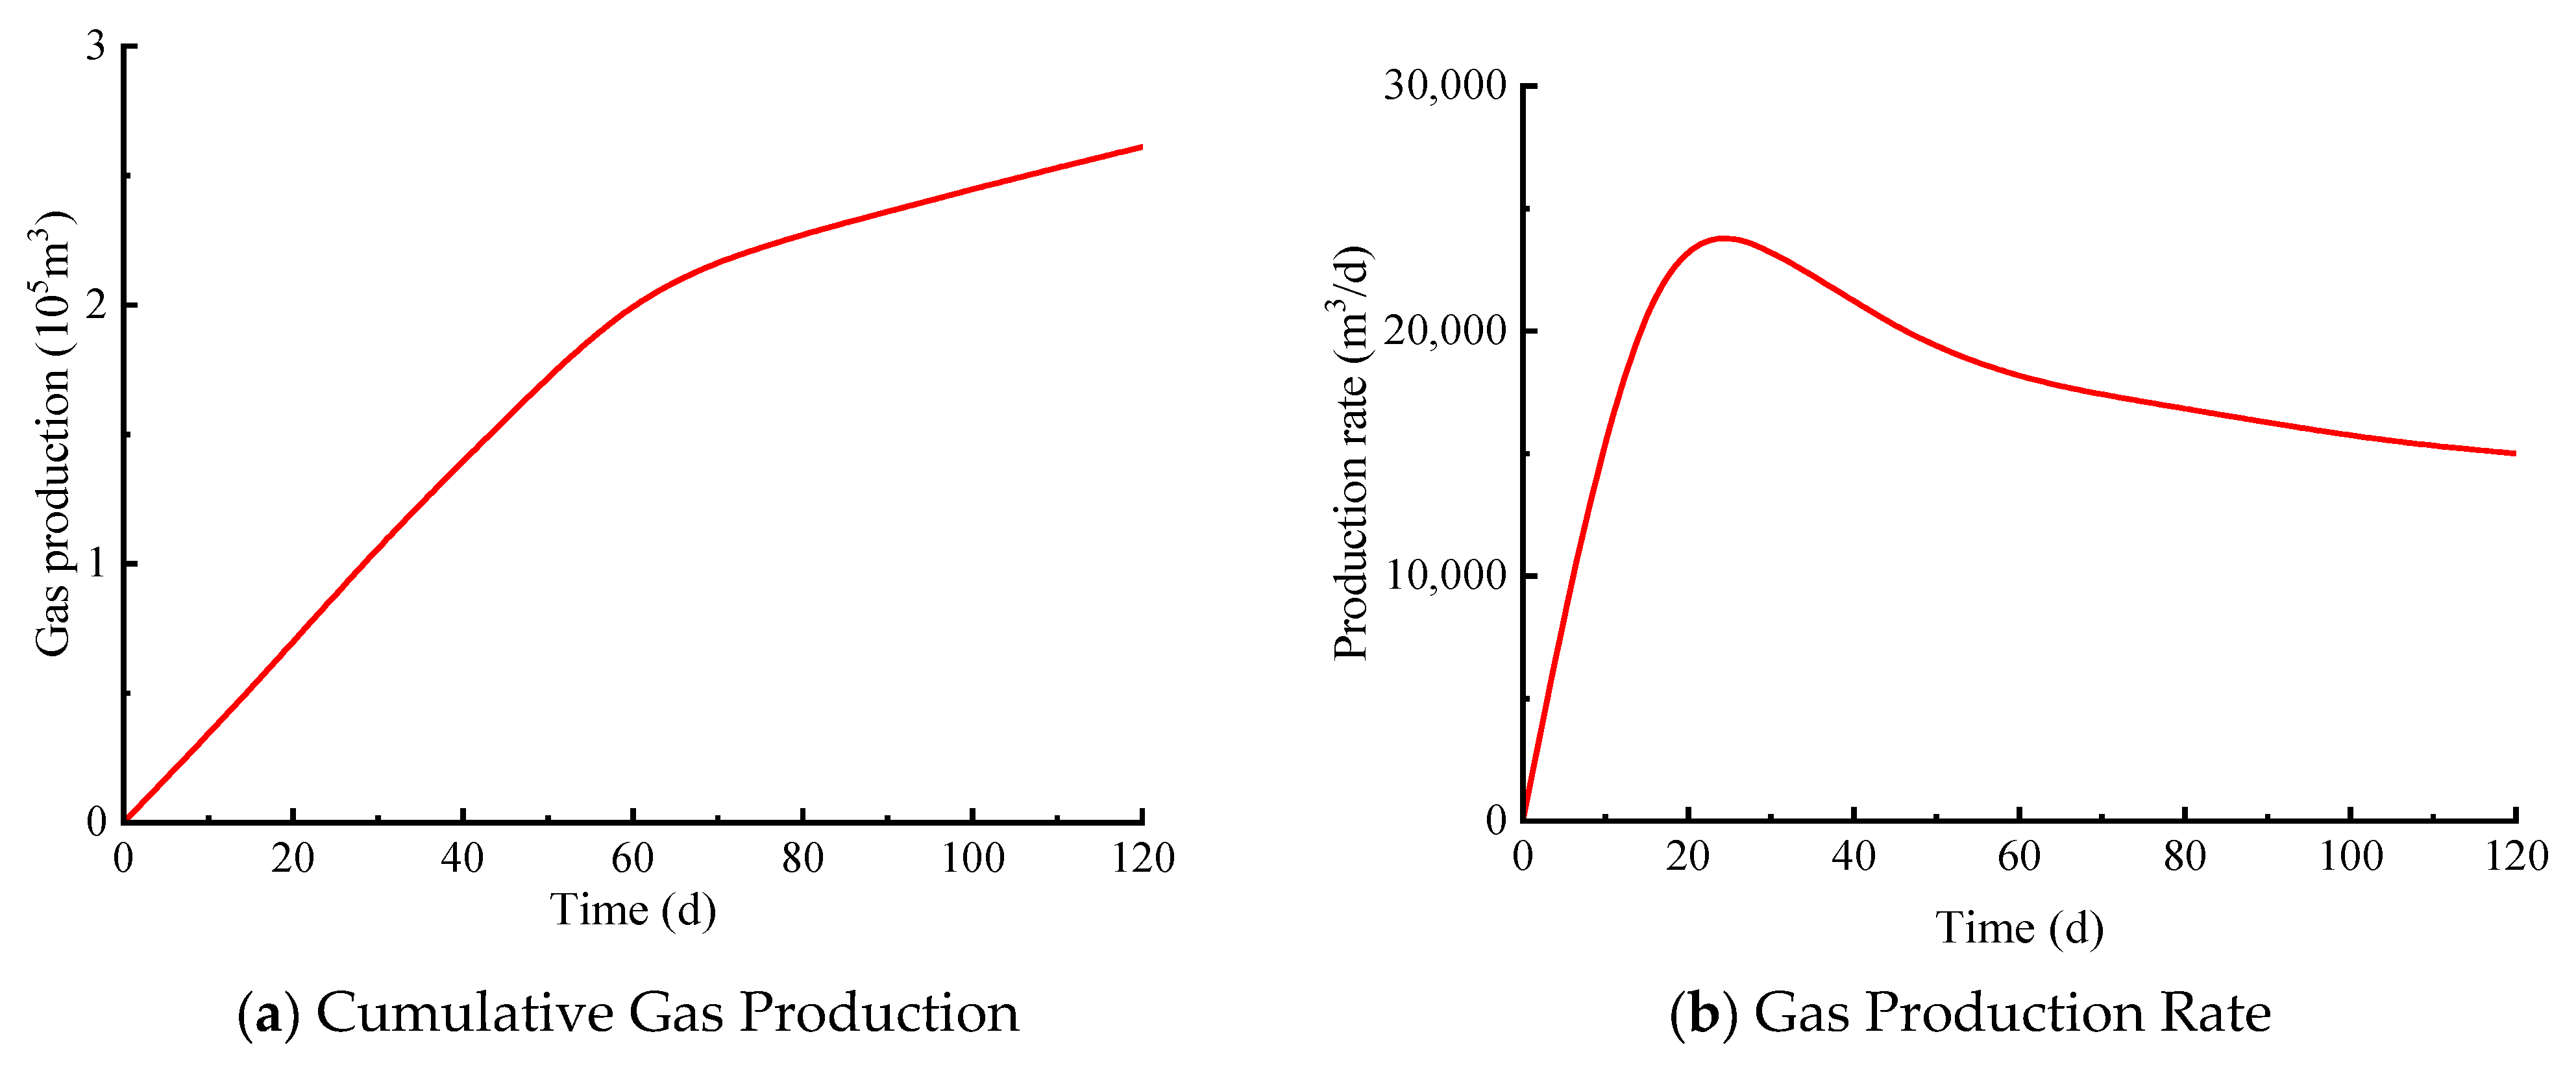
4.4. Analysis of Production Capacity Change

Figure 15 shows that during the depressurization exploitation with a vertical well, the gas production rate presents a trend of “first increasing and then decreasing”, while the cumulative gas production increases continuously. This dynamic change is closely related to the multi-field coupling effect of the reservoir. At 0–30 days (gas production rate peak stage), the gas production rate rapidly rises from the initial value to 25,000 m3/d, mainly benefiting from the rapid dissociation of hydrates in the near-well region. In this stage, the sudden drop in pressure around the wellbore (from 13.83 MPa to 9.8 MPa) breaks the phase equilibrium; meanwhile, the porosity (from 0.41 to 0.52) and permeability (from 75 × 10−3 μm2 to 100 × 10−3 μm2) increase significantly, providing efficient channels for gas migration. However, the peak duration is short (about 10–15 days), limited by two factors: first, the rapid temperature drop in the near-well region (from 287.3 K to 283.8 K) caused by hydrate dissociation (endothermic) inhibits the dissociation kinetics; second, the produced water gradually occupies the pore space, reducing the gas phase relative permeability. At 30–60 days (decline stage), the gas production rate drops to 20,000 m 3/d, and the cumulative gas production increases to 2 × 10⁶ m3. At this stage, the pressure drop rate slows down (from 9.8 MPa to 8.6 MPa), and the permeability falls back to 90 × 10−3 μm2 after reaching the peak (120 × 10−3 μm2) due to fine particle migration. These two factors lead to a synchronous decrease in the dissociation and gas production rates. It is worth noting that the cumulative gas production still keeps growing, indicating that the hydrate dissociation zone in the far-well region continues to expand. At 60–120 days (stable decline stage), the gas production rate drops to 15,000 m3/d, and the cumulative gas production reaches 2.2 × 10⁶ m3. At this time, the reservoir enters a “low-energy state”: the hydrate saturation is below 0.1, the permeability stabilizes at 60 × 10−3 μm2, the pressure and temperature fields tend to balance (7.6 MPa, 280 K), and the dissociation driving forces (pressure difference and temperature difference) are weak, so the gas production rate enters a gentle decline period.
Figure 16 shows the curves of water production rate and cumulative water production over time during hydrate depressurization exploitation, indicating that the water production dynamics are related to the gas production trend but exhibit unique characteristics due to differences in fluid migration. At 0–30 days (surge stage), the water production rate rises from the initial value to 78 m3/d, with the cumulative water production reaching 2002.4 m3. This is directly related to the rapid dissociation of hydrates—approximately 0.8 m3 of water is generated per 1 m3 of dissociated hydrates, and the high permeability (100 × 10−3 μm2) in the near-well region facilitates water migration. The peak of the water production rate at this stage lags slightly behind that of the gas production rate (by about 5–7 days) because the viscosity of the aqueous phase (1.14 mPa s) is higher than that of the gas phase (0.01 mPa s), resulting in a slower migration response. At 30–60 days (decline stage), the water production rate drops to 50 m3/d, and the cumulative water production increases to 2241.6 m3. The reasons for this include the reduction in the amount of dissociated hydrates (saturation decreases from 0.2 to 0.15), and the migration of fine particles blocking some pores (porosity decreases from 0.52 to 0.48), which reduces the aqueous phase permeability. At 60–120 days (stable stage), the water production rate drops to 30 m3/d, and the cumulative water production reaches 2483.6 m3. At this point, water production mainly comes from the displacement of native pore water in the reservoir rather than hydrate dissociation, so the rate remains stable with a slight decline, in contrast to the “energy-depletion-type decline” of the gas production rate.

5. Conclusions

This study focused on the depressurization exploitation of hydrate reservoirs in the Shenhu sea area and carried out in-depth numerical simulation analysis on vertical well depressurization exploitation. We obtained a series of results in terms of reservoir pressure, temperature, productivity, and physical parameter change.
(1)
During the vertical well depressurization exploitation, within 0–30 days, rapid near-well pressure drop (13.83→9.8 MPa, 36.37%) drives peak gas production (25,000 m3/d) via hydrate dissociation, with porosity (0.41→0.52) and permeability (75→100 mD) increasing. Within 30–60 days, slower pressure decline (9.8→8.6 MPa, 12.24%) and fines migration cause permeability fluctuations (120→90 mD), reducing gas production to 20,000 m3/d. Within 60–120 days, pressure stabilizes (~7.6 MPa) with residual hydrate saturation < 0.1, leading to stable low permeability (60 mD) and gas production (15,000 m3/d), with cumulative production reaching 2.2 × 10⁶ m3.
(2)
Key Mechanisms: Productivity changes are governed by coupled processes: rapid initial dissociation driven by pressure drops and heat absorption; subsequent productivity decline due to reduced heat supply, fines migration, and porosity compression; and eventual stabilization as hydrate saturation and fluid flow reach dynamic equilibrium.
This study has several limitations that should be noted: The model idealizes fluid phases as pure methane and freshwater, ignoring salinity effects on hydrate equilibrium, which may slightly overestimate short-term dissociation rates. Clay mineral swelling and plastic deformation of unconsolidated sediments are not incorporated, potentially underestimating long-term permeability attenuation. Permeability–porosity relationships (Carman–Kozeny equation) rely on empirical constants (e.g., particle shape factor C) not directly calibrated with Shenhu core data, introducing uncertainties in permeability predictions. During the exploitation process, hydrate dissociation causes dynamic changes in reservoir porosity and permeability. The rapid production of fluids in the near-wellbore area may lead to local formation stress imbalance, posing risks of inducing micro-fractures or formation subsidence. Especially in the unconsolidated reservoirs of the Shenhu sea area, the migration of sand particles with fluids may exacerbate wellbore sand plugging, affecting mining safety. The model assumes homogeneous reservoir properties, whereas natural heterogeneity (e.g., thin interlayers) may affect actual productivity distribution. Simulations are limited to 120 days, preventing the analysis of long-term effects (e.g., caprock integrity or sustained compaction).
These limitations highlight directions for future work, including refining coupled mechanics to include clay behavior, incorporating heterogeneity, and extending simulations to longer time scales. Such improvements will enhance the model’s utility for optimizing exploitation strategies in unconsolidated hydrate reservoirs.

Author Contributions

Conceptualization, Y.C.; Formal analysis, X.S.; Investigation, X.D. and F.S.; Resources, J.Z.; Data curation, Y.W.; Writing—original draft, Y.S. All authors have read and agreed to the published version of the manuscript.

Funding

This work was financially supported by the Dongying Science Development Fund (DJ2023001), the National Natural Science Foundation Project of China (52204022), the Natural Science Foundation of Shandong Province (ZR2022ME068, ZR2022ME152), Youth Innovation and Technology Support Program for Shandong Provincial Universities (2022KJ066), the Major Special Project for Scientific and Technological Innovation of Dongying City (2023ZDJH110), and the Natural Science Foundation of Shandong Province (ZR2024QE090).

Data Availability Statement

The original contributions presented in the study are included in the article; further inquiries can be directed to the corresponding author.

Conflicts of Interest

The authors declare no conflict of interest.

References

  1. Sun, Y.; Cheng, Y.; Li, C. Mechanical properties research of unconsolidated hydrate-bearing sediments under the effect of clay minerals. PLoS ONE 2025, 20, e0319772. [Google Scholar] [CrossRef]
  2. Li, Q.C.; Wu, J.J.; Li, Q.; Wang, F.L.; Cheng, Y. Sediment Instability Caused by Gas Production from Hydrate-bearing Sediment in Northern South China Sea by Horizontal Wellbore: Sensitivity Analysis. Nat. Resour. Res. 2025, 34, 1667–1699. [Google Scholar] [CrossRef]
  3. Li, Q.; Li, Q.C.; Wang, F.L.; Ning, X.; Wang, Y.L.; Bai, B.J. Settling behavior and mechanism analysis of kaolinite as a fracture proppant of hydrocarbon reservoirs in CO2 fracturing fluid. Colloids Surf. A Physicochem. Eng. Asp. 2025, 724, 137463. [Google Scholar] [CrossRef]
  4. Hui, C.Y.; Zhang, Y.Q.; Zhang, P.P. Numerical simulation of natural gas hydrate exploitation productivity based on radial well fracturing combined with depressurization method. Nat. Gas Ind. 2022, 42, 12–16. [Google Scholar] [CrossRef]
  5. Wan, Y.Z.; Wu, N.Y.; Hu, G.W. Reservoir stability during depressurization exploitation of natural gas hydrates in Shenhu Sea Area, South China Sea. Nat. Gas Ind. 2018, 38, 17–20. [Google Scholar]
  6. Mao, P.X. Numerical Simulation Study on Multi-Branch Well Exploitation of Argillaceous Silt Hydrate Reservoir in Shenhu Sea Area, South China Sea; China University of Geosciences: Wuhan, China, 2023; pp. 14–18. [Google Scholar]
  7. Wei, N.; Li, C.; Zhao, X. Numerical simulation of depressurization exploitation in class 1 hydrate reservoirs under different development factors in Shenhu area, South China sea. Front. Earth Sci. 2024, 12, 20–24. [Google Scholar] [CrossRef]
  8. Wang, T.H.; Liu, Z.Z.; Yang, Y.J. Depressurization-induced gas production from hydrate reservoirs in the Shenhu sea area using horizontal well: Numerical simulation on horizontal well section deployment for gas production enhancement. Front. Earth Sci. 2023, 15, 49–57. [Google Scholar] [CrossRef]
  9. Wan, C.Y.; Zhang, H.; Li, L. Current status and technical discussion of depressurization exploitation equipment for marine natural gas hydrates. Pet. Mach. 2024, 52, 23–27. [Google Scholar]
  10. Jin, G.R.; Xu, T.F.; Liu, X. Optimization study on simulation exploitation scheme of natural gas hydrate depressurization thermal stimulation method. J. Cent. South Univ. (Nat. Sci. Ed.) 2015, 46, 34–43. [Google Scholar]
  11. Li, G.; Li, X.S. Numerical Simulation of Single-Well Thermal Huff and Puff Exploitation for Natural Gas Hydrates in Shenhu Sea Area, South China Sea. Chem. Ind. Eng. Prog. 2011, 30, 45–48. [Google Scholar]
  12. Su, Z.; He, Y.; Wu, N. Evaluation on gas production potential from laminar hydrate deposits in Shenhu Area of South China Sea through depressurization using vertical wells. J. Pet. Sci. Eng. 2012, 86, 87–98. [Google Scholar] [CrossRef]
  13. Almenningen, S.; Flatlandsmo, J.; Fernø, M. Production of Sedimentary Methane Hydrates by Depressurization. In Proceedings of the SPE Bergen One Day Seminar, Bergen, Norway, 20 April 2016; SPE-180015-MS. Volume 87, pp. 59–67. [Google Scholar]
  14. Song, Y.C.; Liang, H.F.; Wang, Z. Analysis of heat transfer characteristics of natural gas hydrate depressurization decomposition. J. Petrochem. Coll. 2008, 21, 45–49. [Google Scholar]
  15. Oyama, H.; Konno, Y.; Masuda, Y. Dependence of Depressurization-Induced Dissociation of Methane Hydrate Bearing Laboratory Cores on Heat Transfer. Energy Fuels 2009, 23, 46–50. [Google Scholar] [CrossRef]
  16. Shahbazi, A.; Poladi-Darvish, M. Behavior of depressurization in type III hydrate reservoirs. SPE J. 2014, 19, 19–25. [Google Scholar] [CrossRef]
  17. Zhao, J.; Liu, D.; Yang, M. Analysis of heat transfer effects on gas production from methane hydrate by depressurization. Int. J. Heat Mass Transf. 2014, 77, 29–31. [Google Scholar] [CrossRef]
  18. Liu, D. Heat Transfer Analysis of Natural Gas Hydrate Decomposition Process in Porous Media. Master’s Thesis, Dalian University of Technology, Dalian, China, 2014; pp. 12–19. [Google Scholar]
  19. Li, B.; Li, X.S.; Li, G. Depressurization induced gas production from hydrate deposits with low gas saturation in a pilot-scale hydrate simulator. Appl. Energy 2014, 129, 24–28. [Google Scholar] [CrossRef]
  20. Cheng, C.X. Study on Heat Transfer Characteristics of Natural Gas Hydrate Sediments and Its Influence on Exploitation. Ph.D. Thesis, Dalian University of Technology, Dalian, China, 2015; pp. 11–17. [Google Scholar]
  21. Liu, L.Q.; Xu, J.; Li, Y. Parameter sensitivity analysis of TOUGH+HYDRATE hydrate model. Mar. Sci. 2014, 38, 22–29. [Google Scholar]
  22. Sun, J.; Ning, F.; Li, S. Numerical simulation of gas production from hydrate-bearing sediments in the Shenhu area by depressurizing: The effect of burden permeability. J. Unconv. Oil Gas Resour. 2015, 12, 23–33. [Google Scholar] [CrossRef]
  23. Cui, W.; Xiao, J.Q. Application of numerical simulation to study the first test production data of hydrates in Shenhu Sea Area. Earth Sci. 2022, 47, 18–20. [Google Scholar]
  24. Yang, Z.Y.; Wu, X.M. Numerical simulation study on combined exploitation of multiple layers in natural gas hydrate reservoirs. Reserv. Eval. Dev. 2023, 13, 39–40. [Google Scholar]
  25. Han, H. Study on Pore Seepage Characteristics of Natural Gas Hydrate Reservoirs in Shenhu Sea Area, South China Sea. Master’s Thesis, China University of Petroleum, Beijing, China, 2023; pp. 16–21. [Google Scholar]
  26. Zhang, Y.F.; Xu, S.Y.; Lu, Y.C. Study on the influence of reservoir physical property changes on natural gas hydrate decomposition. Pet. Ind. Technol. Superv. 2024, 40, 40–46. [Google Scholar]
  27. Liu, J.L. Numerical Simulation Study on Optimized Test Production Scheme of Hydrate Reservoir in Shenhu Sea Area. Master’s Thesis, China University of Petroleum (East China), Qingdao, China, 2018; pp. 21–28. [Google Scholar]
  28. Cui, Y.D.; Lu, C.; Guan, Z.Y. Influence of reservoir creep on gas well productivity during depressurization exploitation of natural gas hydrates in South China Sea. Reserv. Eval. Dev. 2023, 13, 19–28. [Google Scholar]
  29. Jia, R.; Hao, D.H.; Xu, J.M. Experimental study on influencing factors of sand production in hydrate exploitation reservoirs. J. Undergr. Space Eng. 2024, 20, 28–31. [Google Scholar]
  30. Wang, R.; Wang, T.J. Production dynamic analysis and parameter optimization of depressurization-injection thermal exploitation of hydrates in Shenhu Sea Area. Petrochem. Technol. 2020, 27, 46–49. [Google Scholar]
  31. Kun, X.; Yu, L.; Tao, Y. Numerical simulation of gas hydrate production in Shenhu area using depressurization: The effect of reservoir permeability heterogeneity. Energy 2023, 29, 27–30. [Google Scholar]
  32. Adisasmito, S.; Frank, R.; Sloan, J. Hydrates of carbon dioxide and methane mixtures. J. Chem. Eng. Data 1991, 36, 48–51. [Google Scholar] [CrossRef]
  33. Liu, J.J.; Shao, Z.L.; Zheng, Y.X. Numerical simulation of natural gas hydrate depressurization decomposition process. J. Southwest Pet. Univ. (Nat. Sci. Ed.) 2017, 39, 38–49. [Google Scholar]
  34. Sun, Y.; Meng, M.; Dai, X. Large-scale experiments of the borehole instability on shale formation influenced by drill pipe rotation. Energy Sci. Eng. 2019, 7, 2895–2920. [Google Scholar] [CrossRef]
  35. Sun, Y.W.; Cheng, Y.F. Research on Strengthening Technology of Horizontal Well with Ridge Fractures in Shenhu Unconsolidated Hydrate Reservoir. In Proceedings of the 11th Academic Conference of Geology Resource Management and Sustainable Development, Beijing, China, 16–17 December 2023; Elsevier: Engineering Village: Amsterdam, The Netherlands, 2023; pp. 7–15. [Google Scholar]
Figure 1. Structural model of hydrate depressurization exploitation in Shenhu sea area.
Processes 13 02418 g001
Figure 2. Schematic diagram of mesh division.
Processes 13 02418 g002
Figure 3. Flow chart of solution algorithm.
Processes 13 02418 g003
Figure 4. Diagram of validation model (Question1–Case 3).
Processes 13 02418 g004
Figure 5. Diagram of calculation results comparison (Question1–Case 3).
Processes 13 02418 g005
Figure 6. Curve of daily gas production vs. time.
Processes 13 02418 g006
Figure 7. Curve of cumulative gas production vs. time.
Processes 13 02418 g007
Figure 8. Graph of pressure versus time.
Processes 13 02418 g008
Figure 9. Curve of pressure versus time at Point A.
Processes 13 02418 g009
Figure 10. Graph of temperature versus time.
Processes 13 02418 g010
Figure 11. Curve of temperature versus time at Point A.
Processes 13 02418 g011
Figure 12. Curve of porosity versus time at Point A.
Processes 13 02418 g012
Figure 13. Curve of permeability versus time.
Processes 13 02418 g013
Figure 14. Curve of hydrate saturation versus time.
Processes 13 02418 g014
Figure 15. Curves of gas production rate and cumulative gas production during depressurization production.
Processes 13 02418 g015
Figure 16. Curves of water production rate and cumulative water production with time during depressurization production.
Processes 13 02418 g016
Table 1. Geological model parameters of hydrate reservoir in Shenhu sea area.
ParameterValueUnitParameterValueUnit
Depth from Top of Hydrate Layer to Mud Line165mSeawater Depth1225m
Pore Pressure (Bottom of Hydrate Layer)13.83MPaTemperature (Bottom of Hydrate Layer)287.3K
Geothermal Gradient0.0433K·m−1Porosity0.41-
Intrinsic Permeability (Hydrate Layer)75mDIntrinsic Permeability (Overlying and Underlying Strata)5mD
Initial Hydrate Saturation (Hydrate Layer)0.438-Initial Water Saturation (Hydrate Layer)0.512-
Irreducible Gas Saturation (Hydrate Layer)0.05-Irreducible Water Saturation (Hydrate Layer)0.30-
Thermal Conductivity (Water)0.6W·m−1·K−1Density(water)1000kg·m−3
Viscosity (Water)1.14mPa·sThermal Conductivity (CH4)0.044W·m−1·K−1
Viscosity (CH4)0.01mPa·sThermal Conductivity (Hydrate)0.393W·m−1·K−1
Specific Heat Capacity (Water)4200J·kg−1·K−1Density (Seawater)1030kg·m−3
Specific Heat Capacity (Hydrate)2200J·kg−1·K−1Density (Gas Hydrate)910kg·m−3
Thermal Conductivity 1.5W·m−1·K−1Specific Heat Capacity (Formation)1000J·kg−1·K−1
Density of Formation2600kg·m−3Poisson’s Ratio0.3-
Reference Pressure (Gas Inflow)0.1MPaFitting Parameter0.45-
Borehole Radius0.1mRock Shear Modulus200MPa
Drainage Radius100mRock Internal Friction Angle30°
Vertical In situ Stress20.25MPaMaximum Horizontal Principal Stress24.7MPa
Minimum Horizontal Principal Stress19.5MPa
Disclaimer/Publisher’s Note: The statements, opinions and data contained in all publications are solely those of the individual author(s) and contributor(s) and not of MDPI and/or the editor(s). MDPI and/or the editor(s) disclaim responsibility for any injury to people or property resulting from any ideas, methods, instructions or products referred to in the content.

