Article

Analysis of the Characteristics of a Multi-Generation System Based on Geothermal, Solar Energy, and LNG Cold Energy

1
Sinopec Xinxing Petroleum Co., Ltd., Beijing 100083, China
2
Sinopec Key Laboratory of Geothermal Resources Exploitation and Utilization, Beijing 100083, China
3
Department of Power Engineering, North China Electric Power University, Baoding 071000, China
*
Author to whom correspondence should be addressed.
Processes 2025, 13(8), 2377; https://doi.org/10.3390/pr13082377 (registering DOI)
Submission received: 2 July 2025 / Revised: 22 July 2025 / Accepted: 25 July 2025 / Published: 26 July 2025
(This article belongs to the Special Issue Innovations in Waste Heat Recovery in Industrial Processes)

Abstract

In order to reduce gas consumption and increase the renewable energy proportion, this paper proposes a poly-generation system that couples geothermal, solar, and liquid natural gas (LNG) cold energy to produce steam, gaseous natural gas, and low-temperature nitrogen. The high-temperature flue gas is used to heat LNG; low-temperature flue gas, mainly nitrogen, can be used for cold storage cooling, enabling the staged utilization of the energy. Solar shortwave is used for power generation, and longwave is used to heat the working medium, which realizes the full spectrum utilization of solar energy. The influence of different equipment and operating parameters on the performance of a steam generation system is studied, and the multi-objective model of the multi-generation system is established and optimized. The results show that for every 100 W/m2 increase in solar radiation, the renewable energy ratio of the system increases by 1.5%. For every 10% increase in partial load rate of gas boiler, the proportion of renewable energy decreases by 1.27%. The system’s energy efficiency, cooling output, and the LNG vaporization flow rate are negatively correlated with the scale of solar energy utilization equipment. The decision variables determined by the TOPSIS (technique for order of preference by similarity to ideal solution) method have better economic performance. Its investment cost is 18.14 × 10 CNY, which is 7.83% lower than that of the LINMAP (linear programming technique for multidimensional analysis of preference). Meanwhile, the proportion of renewable energy is only 0.29% lower than that of LINMAP.

1. Introduction

Global environmental changes and the rising prices of fossil fuels have accelerated the clean energy substitution process in traditional industries [1], especially in the development and utilization of renewable energy [2,3]. Currently, most industrial production still relies on fossil fuels to meet energy demands [4]. For example, the steam generation method in industrial parks mainly depends on combined heat and power (CHP), and under the heat-to-electricity ratio model, coal consumption is high, leading to substantial carbon reduction pressures. To advance the “dual-carbon” goals and build an industrial structure primarily based on new energy sources, a green, low-carbon energy system must urgently be realized. Against this backdrop, integrating renewable energy sources for steam production processes, improving energy efficiency, and reducing carbon emissions provide a new approach for the sustainable green development of industrial parks [5].
Taking Tianjin as an example, it has rich solar and geothermal resources, with annual solar radiation between 1500 and 1600 kWh/m2 [6,7]. Although hydrogen is the ultimate fuel for deep decarbonization, natural gas (NG) serves as a transitional fuel to achieve net-zero emissions [8]. For ease of storage and transportation, natural gas is typically liquefied. Liquefied natural gas (LNG) must be regasified before it can be distributed to customers. In winter, using submerged combustion vaporizers to regasify LNG increases vaporization costs [9]. Meanwhile, the temperature of geothermal water in Tianjin is below 100 °C, which is rich in reserves and is not affected by season and diurnal change [10].
At present, technologies utilizing clean energy such as geothermal energy, solar energy, and LNG cold energy have already been applied [11]. Agberegha et al. [12] carried a hybridized cascade trigeneration cycle to increase energy efficiency of the combined system. Fares et al. [13] conducted a comprehensive evaluation of the application of photovoltaic, solar thermal, and photovoltaic/thermal (PV/T) panels in building integration. They pointed out that coupling solar energy with energy systems such as heat pumps/boilers yields better performance. Wang et al. [14] integrated concentrated PV/T collectors into a combined heat, cold, and power system, adjusting the photovoltaic coverage ratio to alter the system’s thermoelectric ratio. The research showed that optimizing PV/T integration can reduce the production cost of system products by 6.4%. Duong et al. [15] designed a waste-heat-recovery system fueled by LNG, using LNG cold energy for carbon dioxide capture, with an energy efficiency of 68.76%. Yilmaz et al. [16] designed a geothermal-assisted hybrid LNG system and the temperature of geothermal water was 130 °C. The geothermal water was used to generate power and for cooling. Toker [17] carried out a solar–geothermal-driven multi-generation system for power, freshwater, hydrogen, and heat energy. The geothermal water was used in a drive flash cycle for power generation, and its temperature was 180 °C. It can be seen that the research on geothermal utilization is mostly concentrated in the field of high temperature, and few studies on medium–low-temperature utilization. Meanwhile, there is a temperature cross between solar photothermal utilization and medium–low-temperature geothermal utilization, which needs to be reasonably arranged to avoid energy waste. Therefore, it is necessary to study the multi-generation systems coupling medium–low-temperature geothermal, solar, and LNG cold energy to improve the energy utilization.
To improve system performance, many researchers have used optimization algorithms for system configuration. Cheng et al. [18] employed a particle swarm optimization algorithm with a three-black-hole capture strategy, aiming to minimize costs and carbon emissions to find the optimal operation scheme. Wang et al. [19] used an improved white whale optimization algorithm to optimize the configuration of a combined heat and power system integrating solar energy and biomass. Mehrabadi and Boyaghchi [20] used the non-dominated sorting genetic algorithm (NSGA-II) for scenario analysis of the thermodynamic, economic, and environmental performance of multi-generation systems. Zhang et al. [21] applied particle swarm optimization to perform bi-objective and tri-objective optimization of CHP systems to determine the system’s optimal operating conditions. Li et al. [22] combined NSGA-II and entropy weight method to conduct multi-objective optimization of an organic Rankine cycle utilizing LNG cold energy and geothermal energy.
This paper designs a multi-generation system that integrates medium–low-temperature geothermal, solar, and LNG cold energy to produce steam, gaseous natural gas, and low-temperature nitrogen. The impact of operating parameters and equipment capacity on the thermodynamic performance is studied. An optimization model for the configuration of the coupled system with cost, renewable energy share, and LNG vaporization as optimization objectives is constructed, which is solved by the NSGA-II algorithm. The main innovations are as follows:
(1) In the proposed coupled system, high-temperature flue gas for the outlet of the gas boiler is used to heat liquefied natural gas, reducing energy waste and liquefying CO2 in the flue gas. Then, low-temperature flue gas, mainly nitrogen, can be used for cold storage cooling, enabling the staged utilization of the energy.
(2) Solar shortwave is used for power generation, and longwave is used to heat the working medium, which realizes the full spectrum utilization of solar energy. At the same time, the photovoltaic and thermal output are decoupled to achieve a more flexible energy supply.

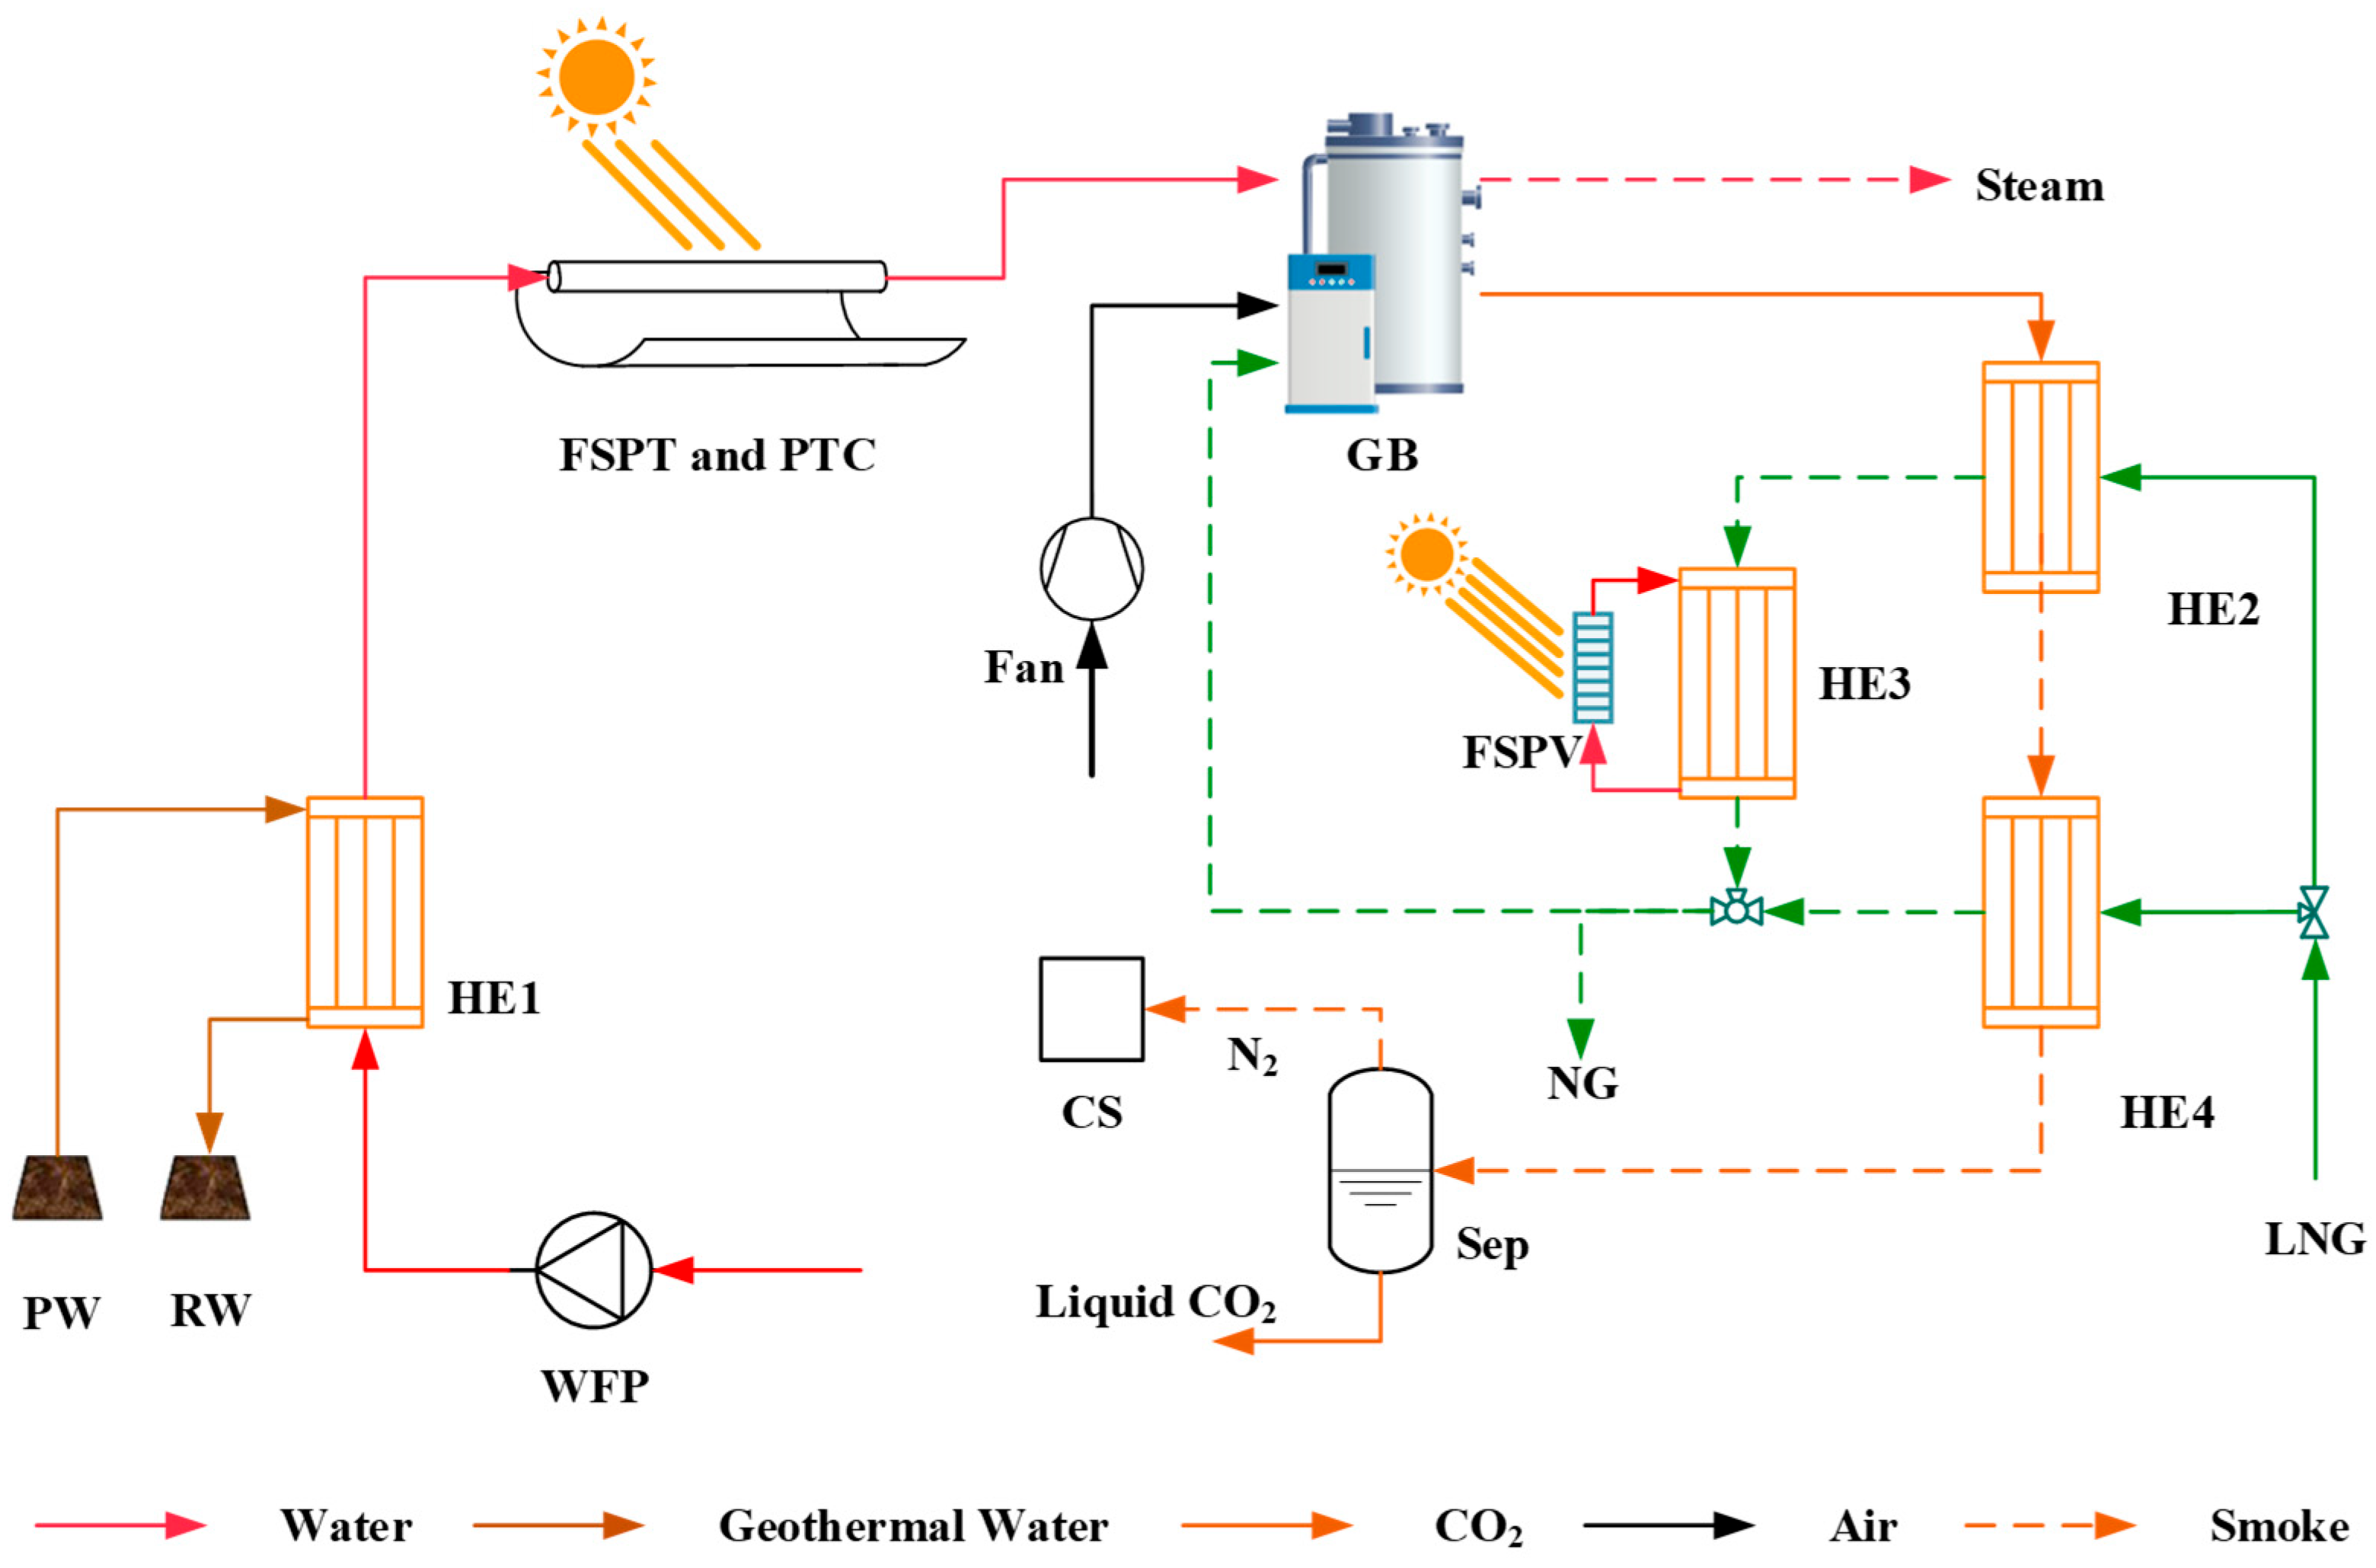
2. System Model and Validation

The multi-generation system coupled with medium–low-temperature geothermal, solar energy and LNG cold energy is shown in Figure 1. The water should be pressurized by the working fluid pump (WFP) before entering heat exchanger 1 (HE1), where it exchanges heat with geothermal water from the production well (PW). Then, the geothermal water returns to the reinjection well (RW). The working fluid then passes through a full-spectrum photo-thermal (FSPT) and parabolic trough collector (PTC), absorbing solar thermal energy. Finally, the working fluid enters the gas boiler (GB), where it is heated to high-temperature, high-pressure steam. The high-temperature flue gas produced by the boiler passes through Heat Exchanger 2 to heat the first stream of LNG, converting it to gas. This natural gas is then heat-exchanged with the cooling water from the full-spectrum photovoltaic (FSPV) backplane in Heat Exchanger 3. The second stream of liquefied natural gas is heated at Heat Exchanger 4 by the flue gas. Part of the heated natural gas, together with air pressurized by the fan, enters the boiler for combustion. The CO2 in the flue gas is liquefied in Heat Exchanger 4, and low-temperature N2 from the separator (Sep) enters the cold storage (CS), thus utilizing the cold energy.
In the full-spectrum photovoltaic–thermal system, the frequency-dividing film projects short-wave radiation onto the photovoltaic cells, providing additional power to the system while reducing the temperature of the FSPV panels. The infrared wavelengths reflected by the frequency divider are absorbed by the collector, and the water temperature in the tube is further increased. Meanwhile, the low-temperature cooling water (about 50 °C) from the PV backplane is used to heat the natural gas, enabling staged utilization of solar energy. The parabolic trough collector is primarily used to increase the working fluid temperature.

2.1. Thermodynamic Model

When sunlight shines on the reflector, it is subsequently projected onto the frequency-cutoff membrane. The heat of the light loss (Qlight,loss) is calculated as follows:
Q l i g h t , l o s s = D N I · A · ( 1 η C r e f )
where D N I —direct normal irradiance of sunlight; W/m2; A—reflector area, m2; η C r e f —reflector’s full-spectrum reflectivity. This is calculated as follows [23]:
η C r e f = 280   n m 2500   n m R λ I λ d λ / 280   n m 2500   n m I λ d λ
where R λ —spectral reflectivity of the reflector; I λ —solar irradiance of the AM1.5 spectrum, which is shown in Figure 2.
The solar radiation incident on the photovoltaic ( Q P V ) surface consists of four components: PV light losses ( E l i g h t , l o s s ); photovoltaic power generation ( E e l e ); PV thermal losses ( Q h e a t , l o s s ); and heat recovery form the PV backplane ( Q f l u i d ). Their calculations are as follows [23]:
Q P V = E l i g h t , l o s s + E P V + Q h e a t , l o s s + Q f l u i d
Q P V = D N I A η C r e f η O T
η O T = 280   n m 2500   n m τ λ I λ d λ 280   n m 2500   n m I λ d λ
τ λ = 1 ,   λ n m 1240 / E g ( e V ) 0 ,   λ n m < 1240 / E g ( e V )
E l i g h t , l o s s = E P V ( 1 τ g l a s s α P V γ P V )
where ηOT —overall transmittance of the spectral splitting film; Eg—forbidden band width of the spectral splitting film, eV. The film can transmit wavelengths shorter than 1240/Eg(ev) nm to the photovoltaic cell for power generation, and the remaining wavelengths are reflected to the collector tube for heating the fluid; τ g l a s s —Glass transmittance, taken as 0.96; α P V —PV absorption rate; and γ P V —PV incidence factor.
Q h e a t , l o s s = H P V ( T P V T 0 ) A P V + ε P V σ ( T 4 P V T 4 s k y ) A P V
where H P V —convective heat transfer coefficient of the PV, unit: W·m−2·K−1. S P V —photovoltaic cell area, unit: m2. T P V —photovoltaic cell temperature, unit: K. T 0 —ambient temperature, unit: K. T s k y —sky temperature, unit: K. ε P V —emissivity of the photovoltaic cell. σ —Stefan–Boltzmann constant.
The photovoltaic power E e l e is calculated as
E P V = J S C V O C F F
where J S C —short-circuit current, unit: A. V O C —open-circuit voltage, unit: V. F F —fill factor, which could be calculated as
J S C = 280   n m λ g E λ n λ E Q E λ q ( 1 E l i g h t , l o s s E P V ) d λ E P V 900 + η T C ( T P V 298.15 )
where n λ —photon flux density relative to the spectrum; E Q E λ —spectral external quantum efficiency of the PV; and η T C —temperature coefficient of the photovoltaic cell current.
V O C = β k B T P V q ln ( J S C J 0 + 1 )
J 0 = 1.5 × 10 5 e E g n k B T P V
where q —elementary charge; β —ideal factor, 1.07; k B —Boltzmann constant, J·K−1; E g —bandgap energy of the photovoltaic cell, 1.1108eV.
F F = V O C q n k B T P V ln ( V O C q n k B T P V + 0.72 ) / V O C q n k B T P V + 1
The solar energy of the photothermal Q P T is calculated as
Q P T = D N I A η C r e f ( 1 η S B S ) η c
where η c —collector thermal efficiency, taken as 0.95.
The energy Q i n c incident on the parabolic trough collector is calculated as
Q i n c = D N I A a
where Aa—aperture area of the receiver, m2.
The solar energy Q i n p u t received by the parabolic trough is calculated as
Q r e c = Q i n c η o p t = Q a b s + Q l o s s
where η o p t represents optical efficiency, taken as 0.8.
The heat energy Q a b s absorbed by the working fluid in the absorber is calculated as [24]
Q a b s = H A r i ( T s u r T w f )
where T s u r —surface temperature of the absorber, K; Twf—temperature of the working fluid, K; A r i —inner surface area of the absorber, m2; and H —convective heat transfer coefficient between the absorber and the working fluid, W/(m2·K).
The heat loss of the absorber is calculated as follows:
Q l o s s = A r o σ ( T s u r 4 T G C 4 ) 1 ε a b s + 1 ε G C ε G C A c o A c i
Q l o s s = A c o H ( T G C T 0 ) + A c o σ ε G C ( T G C 4 T 0 4 )
where A r o —outer surface area of the absorber, m2; σ—Stefan–Boltzmann constant, 5.67 × 10⁻⁸ W·m−2·K−1; A c o —outer surface area of the glass cover, m2; A c i —inner surface area of the glass cover, m2; T G C —glass cover temperature, m2; T 0 —ambient temperature, K; ε a b s —emissivity of the absorber surface, ε G C —emissivity of the glass cover surface.
The work W W F P performed by the working fluid pump is calculated as
W W F P = m ( h s 2 h 1 ) / η W F P
where h 1 —specific enthalpy of the water at the pump inlet, kJ/kg; h s 2 —specific enthalpy of the water at the pump outlet after isentropic compression, kJ/kg; η W F P —isentropic efficiency of the pump; m —mass flow rate of the working fluid, kg/s.
The energy balance equation for the heat exchanger is given as
Q = ( h h f , i n h h f , o u t ) m h f η E X = ( h c f , o u t h c f , i n ) m c f
where m h —mass flow rate of the hot fluid, J; m c —mass flow rate of the cold fluid, J; h h , i n —specific enthalpy of the inlet of the hot fluid, kg/s; h h , o u t —specific enthalpy of the outlet of the hot fluid, kg/s; h c , i n —specific enthalpy of the cold fluid at the inlet, J; h c , o u t —specific enthalpy of the cold fluid at the outlet, J; η E X —heat exchanged by the heat exchanger, 0.9.
The formula for boiler thermal efficiency η G B is as follows [25]:
η G B = 0.9 ( 0.6249 f 2 + 1.525 f + 0.0951 )
where f —partial load rate of the gas boiler. This could be calculated as follows:
f = Q r e a l / Q r a t e d
where Qreal and Qrated are the real and rated capacity of the gas boiler, kW.
The boiler energy balance equation is as follows:
Q G B = m C H 4 Q η G B
where Q G B —heat released by the gas boiler, kW; Q —heating value of natural gas, kJ/kg; m C H 4 —mass flow rate of natural gas consumption, kg/s.
The energy consumption of the fan is calculated as follows:
W f a n = m a i r ( h a i r , o u t h a i r , i n ) / η f a n
where η f a n —isentropic efficiency of the fan; m a i r —airflow rate, kg/s.
The cooling of n nitrogen could be calculated as follows:
Q N 2 = m N 2 ( h 0 h )
where h0—enthalpy of nitrogen at ambient temperature, kJ/kg.

2.2. Performance Evaluation

This paper evaluates system performance using energy efficiency and the proportion of renewable energy as indicators. The formula for calculating the energy efficiency of the total system is as follows:
P s y s = Q L N G + Q w a t e r + Q N 2 + E e l e Q C H 4 + Q s o l a r + Q g t + W p u m p , f a n
Q L N G —heat absorbed from liquefied natural gas, kW; Q w a t e r —heat absorbed by the working fluid (water), kW; Q N 2 —cold energy entering the cold storage, kW; Q C H 4 —heat produced by methane combustion, kW; Q s o l a r —total solar energy received by the system, kW; Q g t —geothermal energy input to the system, kW; W p u m p , f a n —work performed by the pump and fan, kW.
The formula for calculating the renewable energy proportion of the multi-generation is as follows:
P r e n = Q g t + E P V + Q P T + Q f l u i d + Q a b s Q C H 4 + Q s o l a r + Q g t + W p u m p , f a n

2.3. Model Validation

The main parameter of the multi-generation system is shown in Table 1 [23,24]. The physical parameters of the working fluid are provided by the software REFPROP. In order to simplify the system model, the following assumptions are made [25]:
(1)
The system is in stable operation state;
(2)
The ambient temperature is 298.15 K and the pressure is 101.3 kPa.
Due to the different installation area, only the energy efficiency of the photovoltaic photothermal system is verified. As shown in Table 2, the frequency-divided photovoltaic–thermal system was compared with the results from [23]. The solar irradiance is set to 800 W/m2, and other parameters are consistent with the literature. It can be seen that the relative error of the fluid absorption of solar energy is smallest (0.134%). The relative error of the photothermal proportion is 1.677%. Therefore, the model has high accuracy in computational thermodynamics. In addition, the error of the photoelectric efficiency is 2.612%, which indicates that the established model has a high level of accuracy.
As shown in Table 3, the parabolic trough collector was compared and validated with reference [24]. The parameter setting is shown in Table 1 and Table 3. It can be seen that the thermal efficiency of the collector decreases with the increase in inlet water temperature. This is mainly due to the increase in the radiation and convective heat transfer loss of the working fluid as the temperature of the working fluid in the tube increases. When the inlet water temperature is below 600 K, the error remains within 5%, demonstrating that the thermodynamic model of the collector has a high degree of accuracy. In addition, other modules have been verified in previous studies [26].

3. Performance Analysis

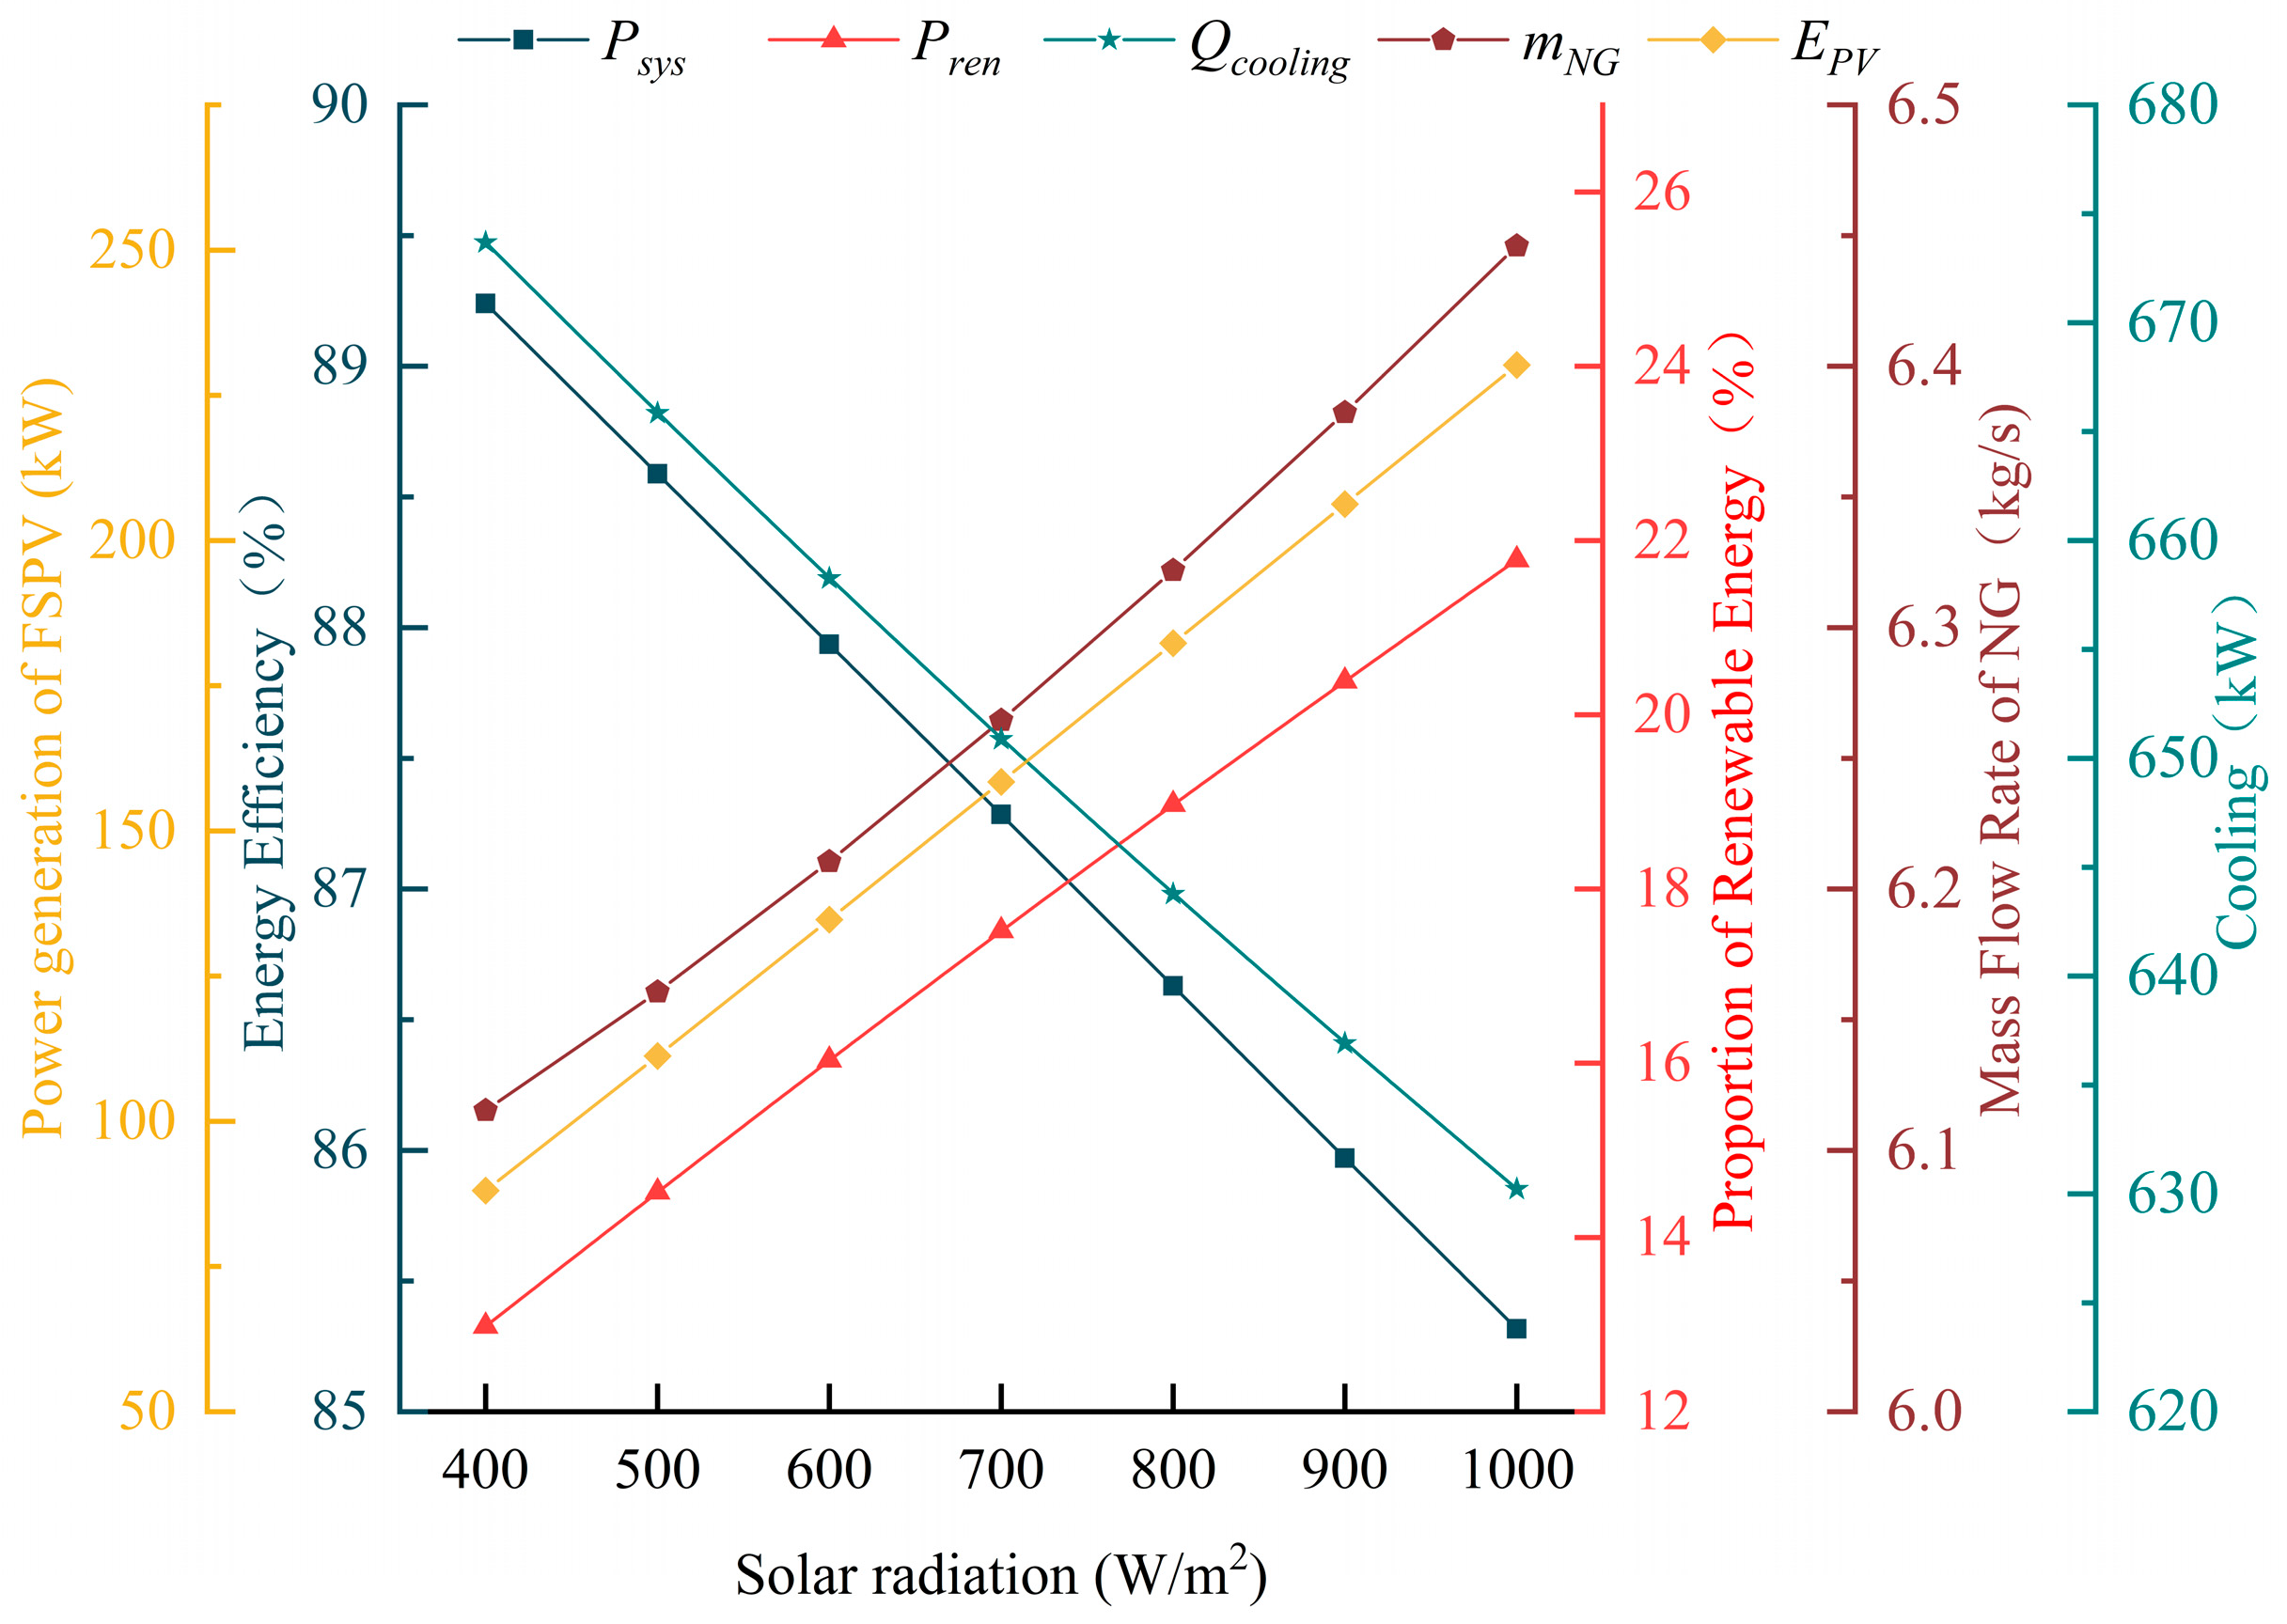
3.1. Impact of Solar Radiation

The effect of radiation intensity on the multi-generation system is shown in Figure 3. For every 100 W/m2 increase in solar radiation, the proportion of renewable energy increases by 1.5%. The system’s energy efficiency decreases from 89.24% to 85.32% with the increase in solar radiation. This phenomenon is mainly caused by two reasons. On the one hand, the thermal efficiency of the PTC is about 72%, and the photothermal efficiency of the FSPT is below 20%, which is lower than the energy efficiency of the gas boiler. On the other hand, the increase in solar energy input into the system leads to a decrease in the actual power of the boiler. According to Equations (23) and (24), the boiler’s thermal efficiency is also reduced. As the boiler’s thermal efficiency decreases, the flue gas outlet temperature increases. Consequently, the mass flow rate of NG increases from 6.12 kg/s to 6.44 kg/s. The cooling capacity decreases from 674 kW to 630 kW, primarily due to the reduced flow rate of flue gas at the outlet of gas boiler. In addition, for every 100 W/m2 increase in solar radiation, the photovoltaic power generation increases by about 23.7 kW.

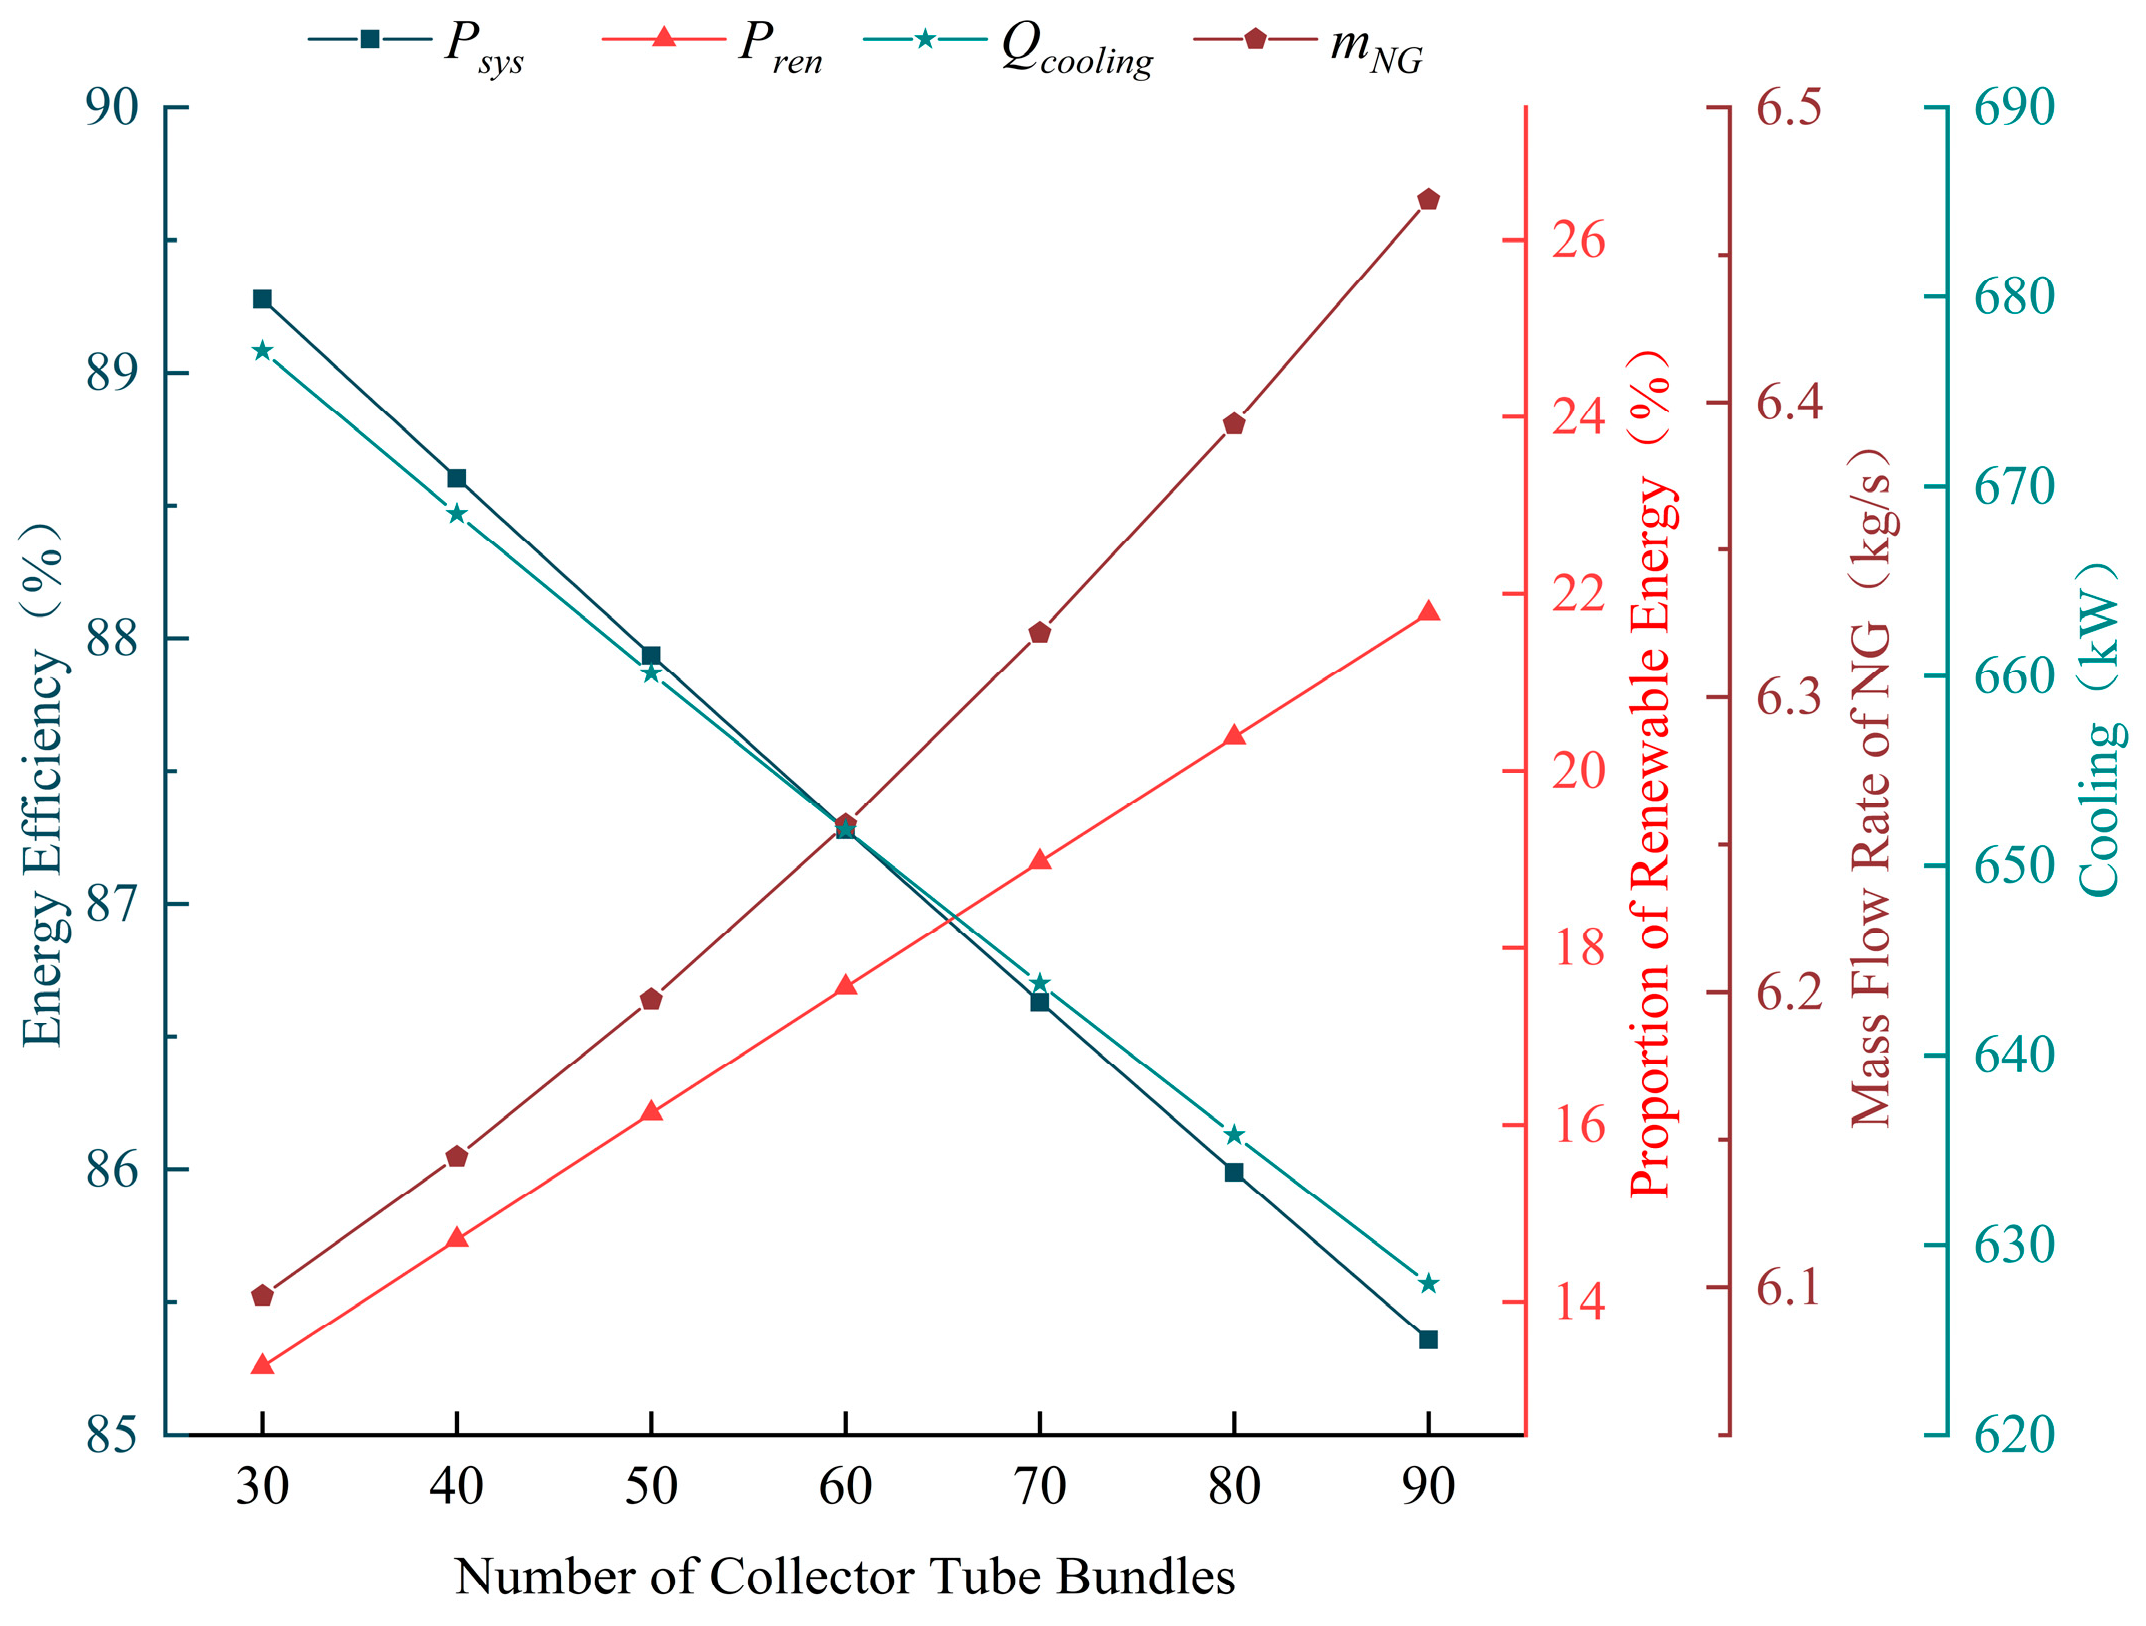
3.2. Impact of Collector Tube Bundles

The effect of collector tube bundles on the performance of the multi-generation system is shown in Figure 4. The influence of the number of collector tubes on the system energy efficiency is similar to that of solar radiation. As the number of collector tube bundles increases from 30 to 90, the energy efficiency of the coupled steam system decreases from 89.28% to 85.36%, while the proportion of renewable energy increases from 13.27% to 21.78%. This is primarily because the solar energy utilization efficiency is lower than the thermal efficiency of the gas boiler. Increasing the number of collector tube bundles results in a reduction in the consumption of the natural gas. Thus, the NG mass flow rate increases to 0.38 kg/s. At the same time, the reduced flue gas output leads to a 49 kW decrease in system cooling capacity.

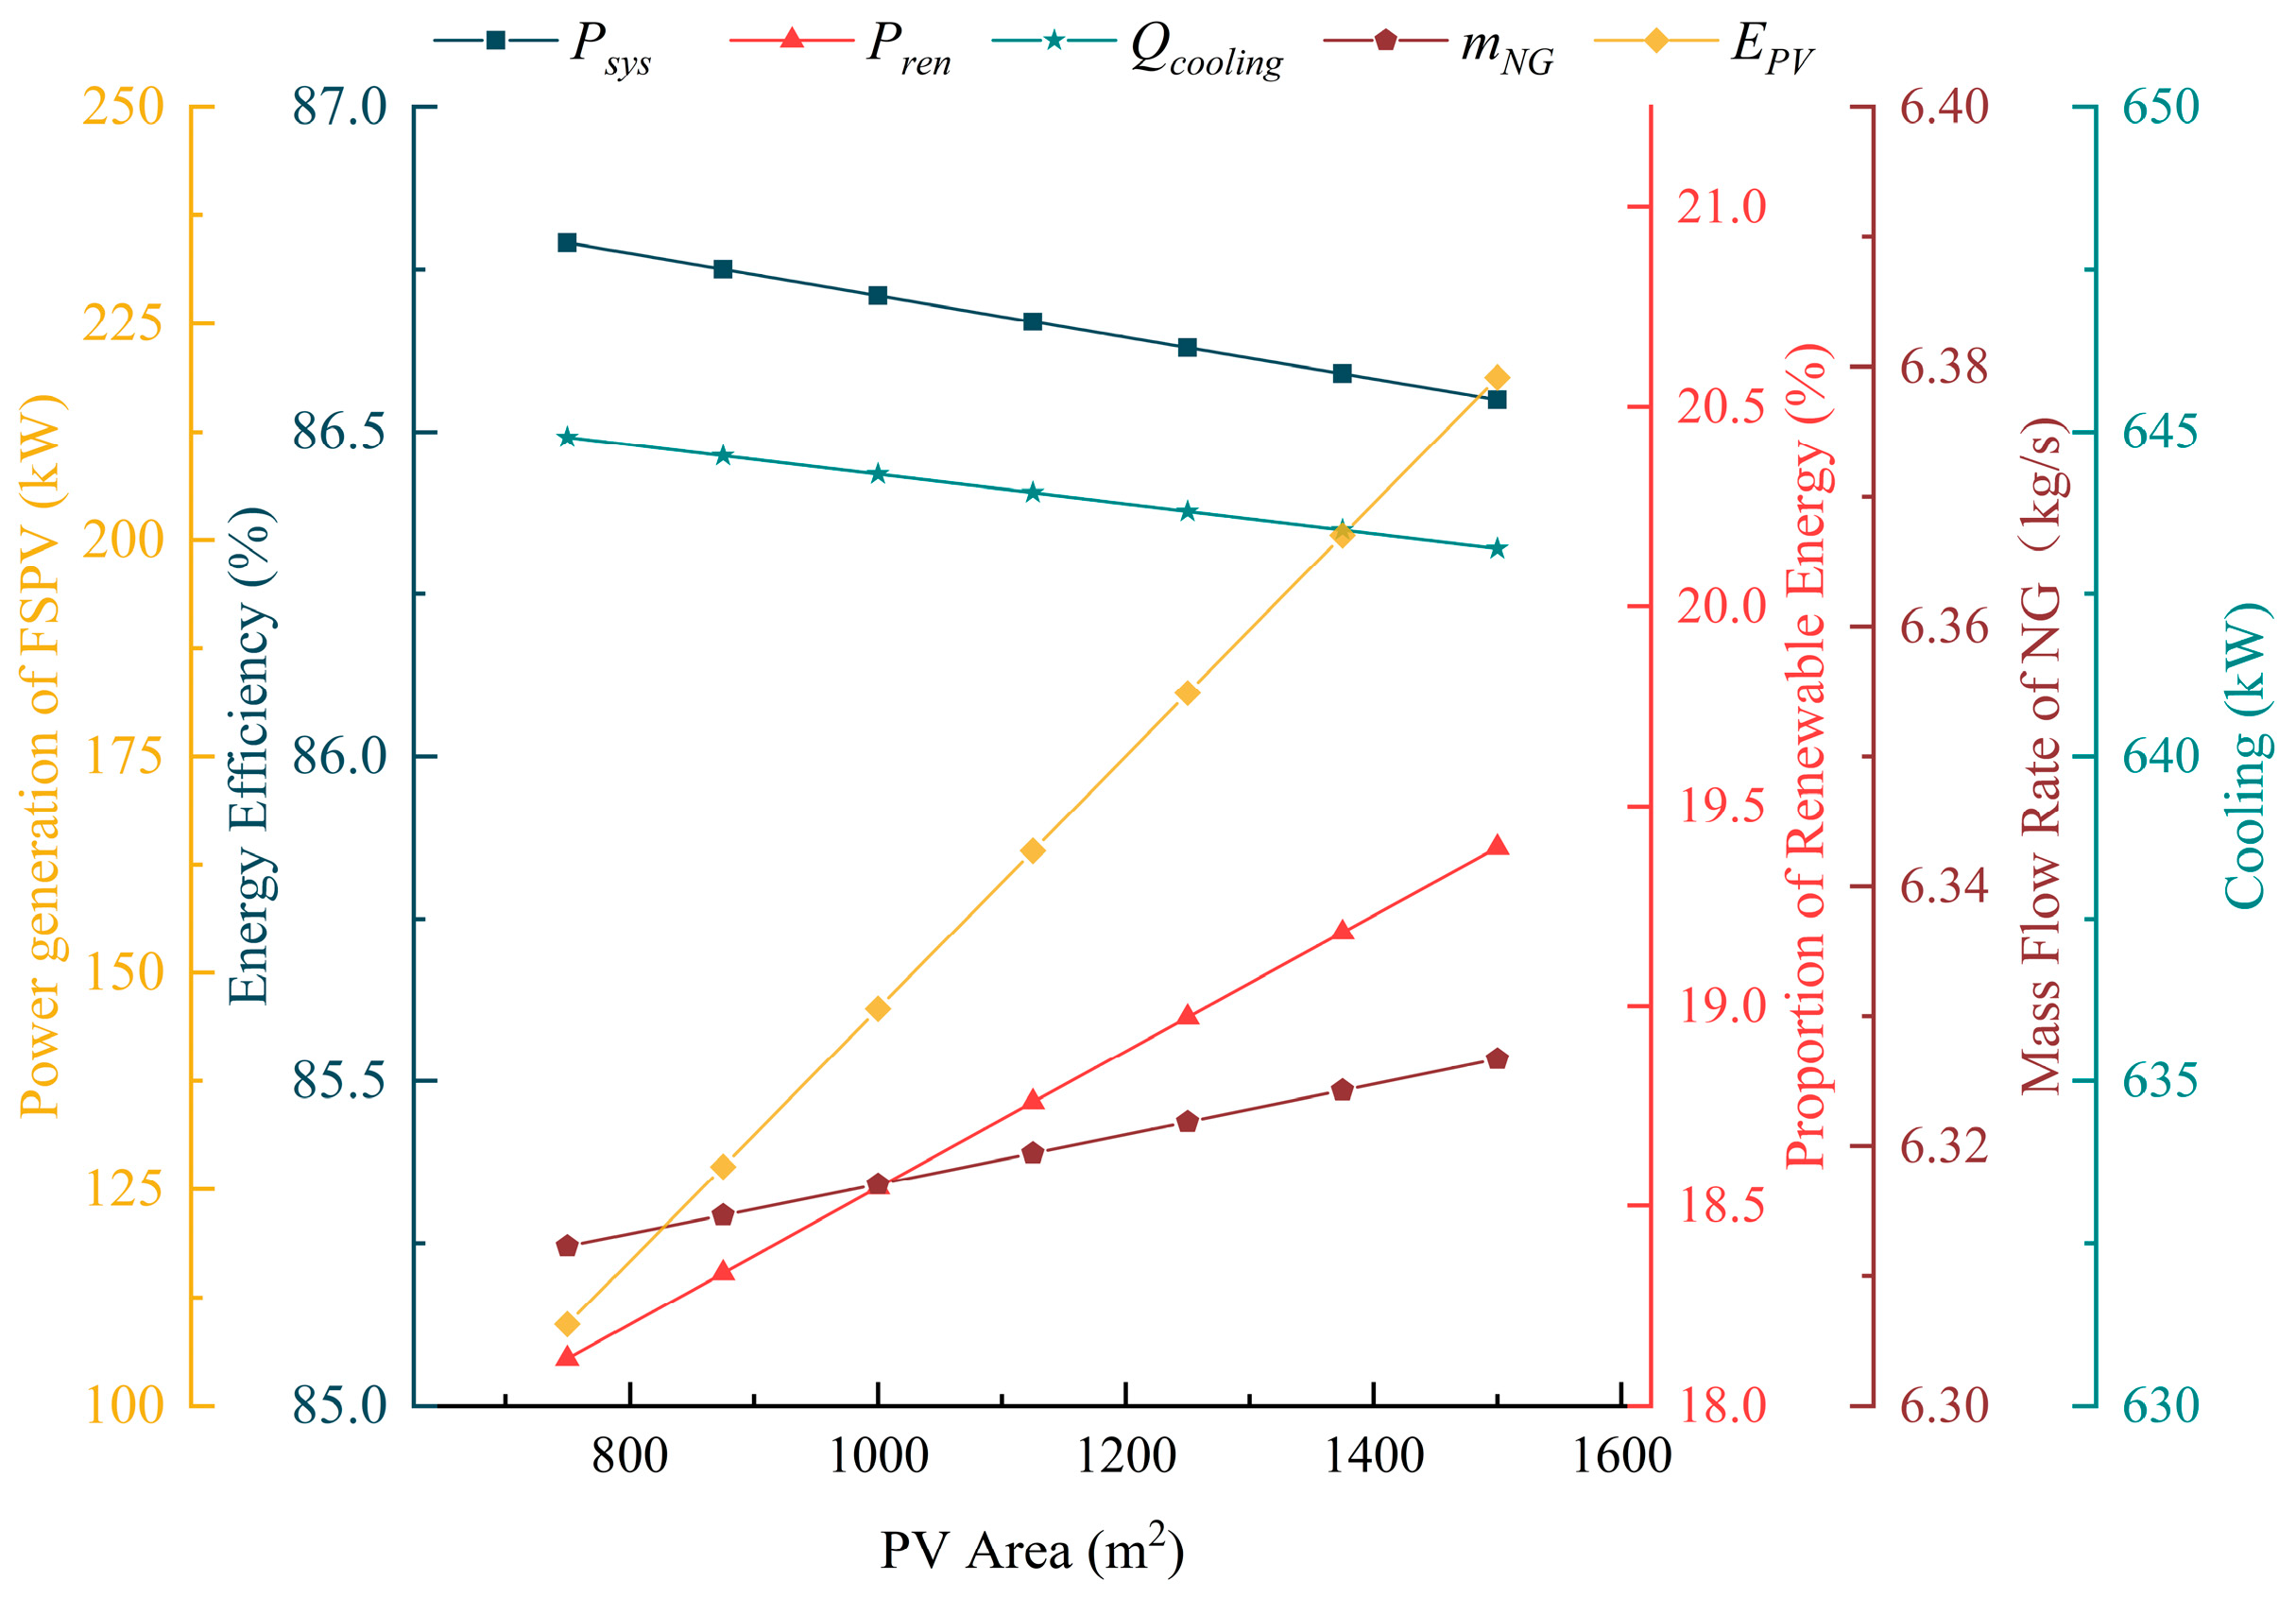
3.3. Impact of Photovoltaic Area

The effect of photovoltaic (PV) area on the multi-generation system is shown in Figure 5. As the PV area increases from 750 m2 to 1500 m2, the renewable energy proportion in the system increases from 18.12% to 19.40%. It is observed that the PV area has little effect on the system’s energy efficiency and cooling capacity output, likely due to the relatively small size of the PV area. However, as the PV area increases, the LNG vaporization flow rate increases slightly. In addition, for every 125 m2 increase in PV area, the photovoltaic power generation increases by about 18.2 kW.

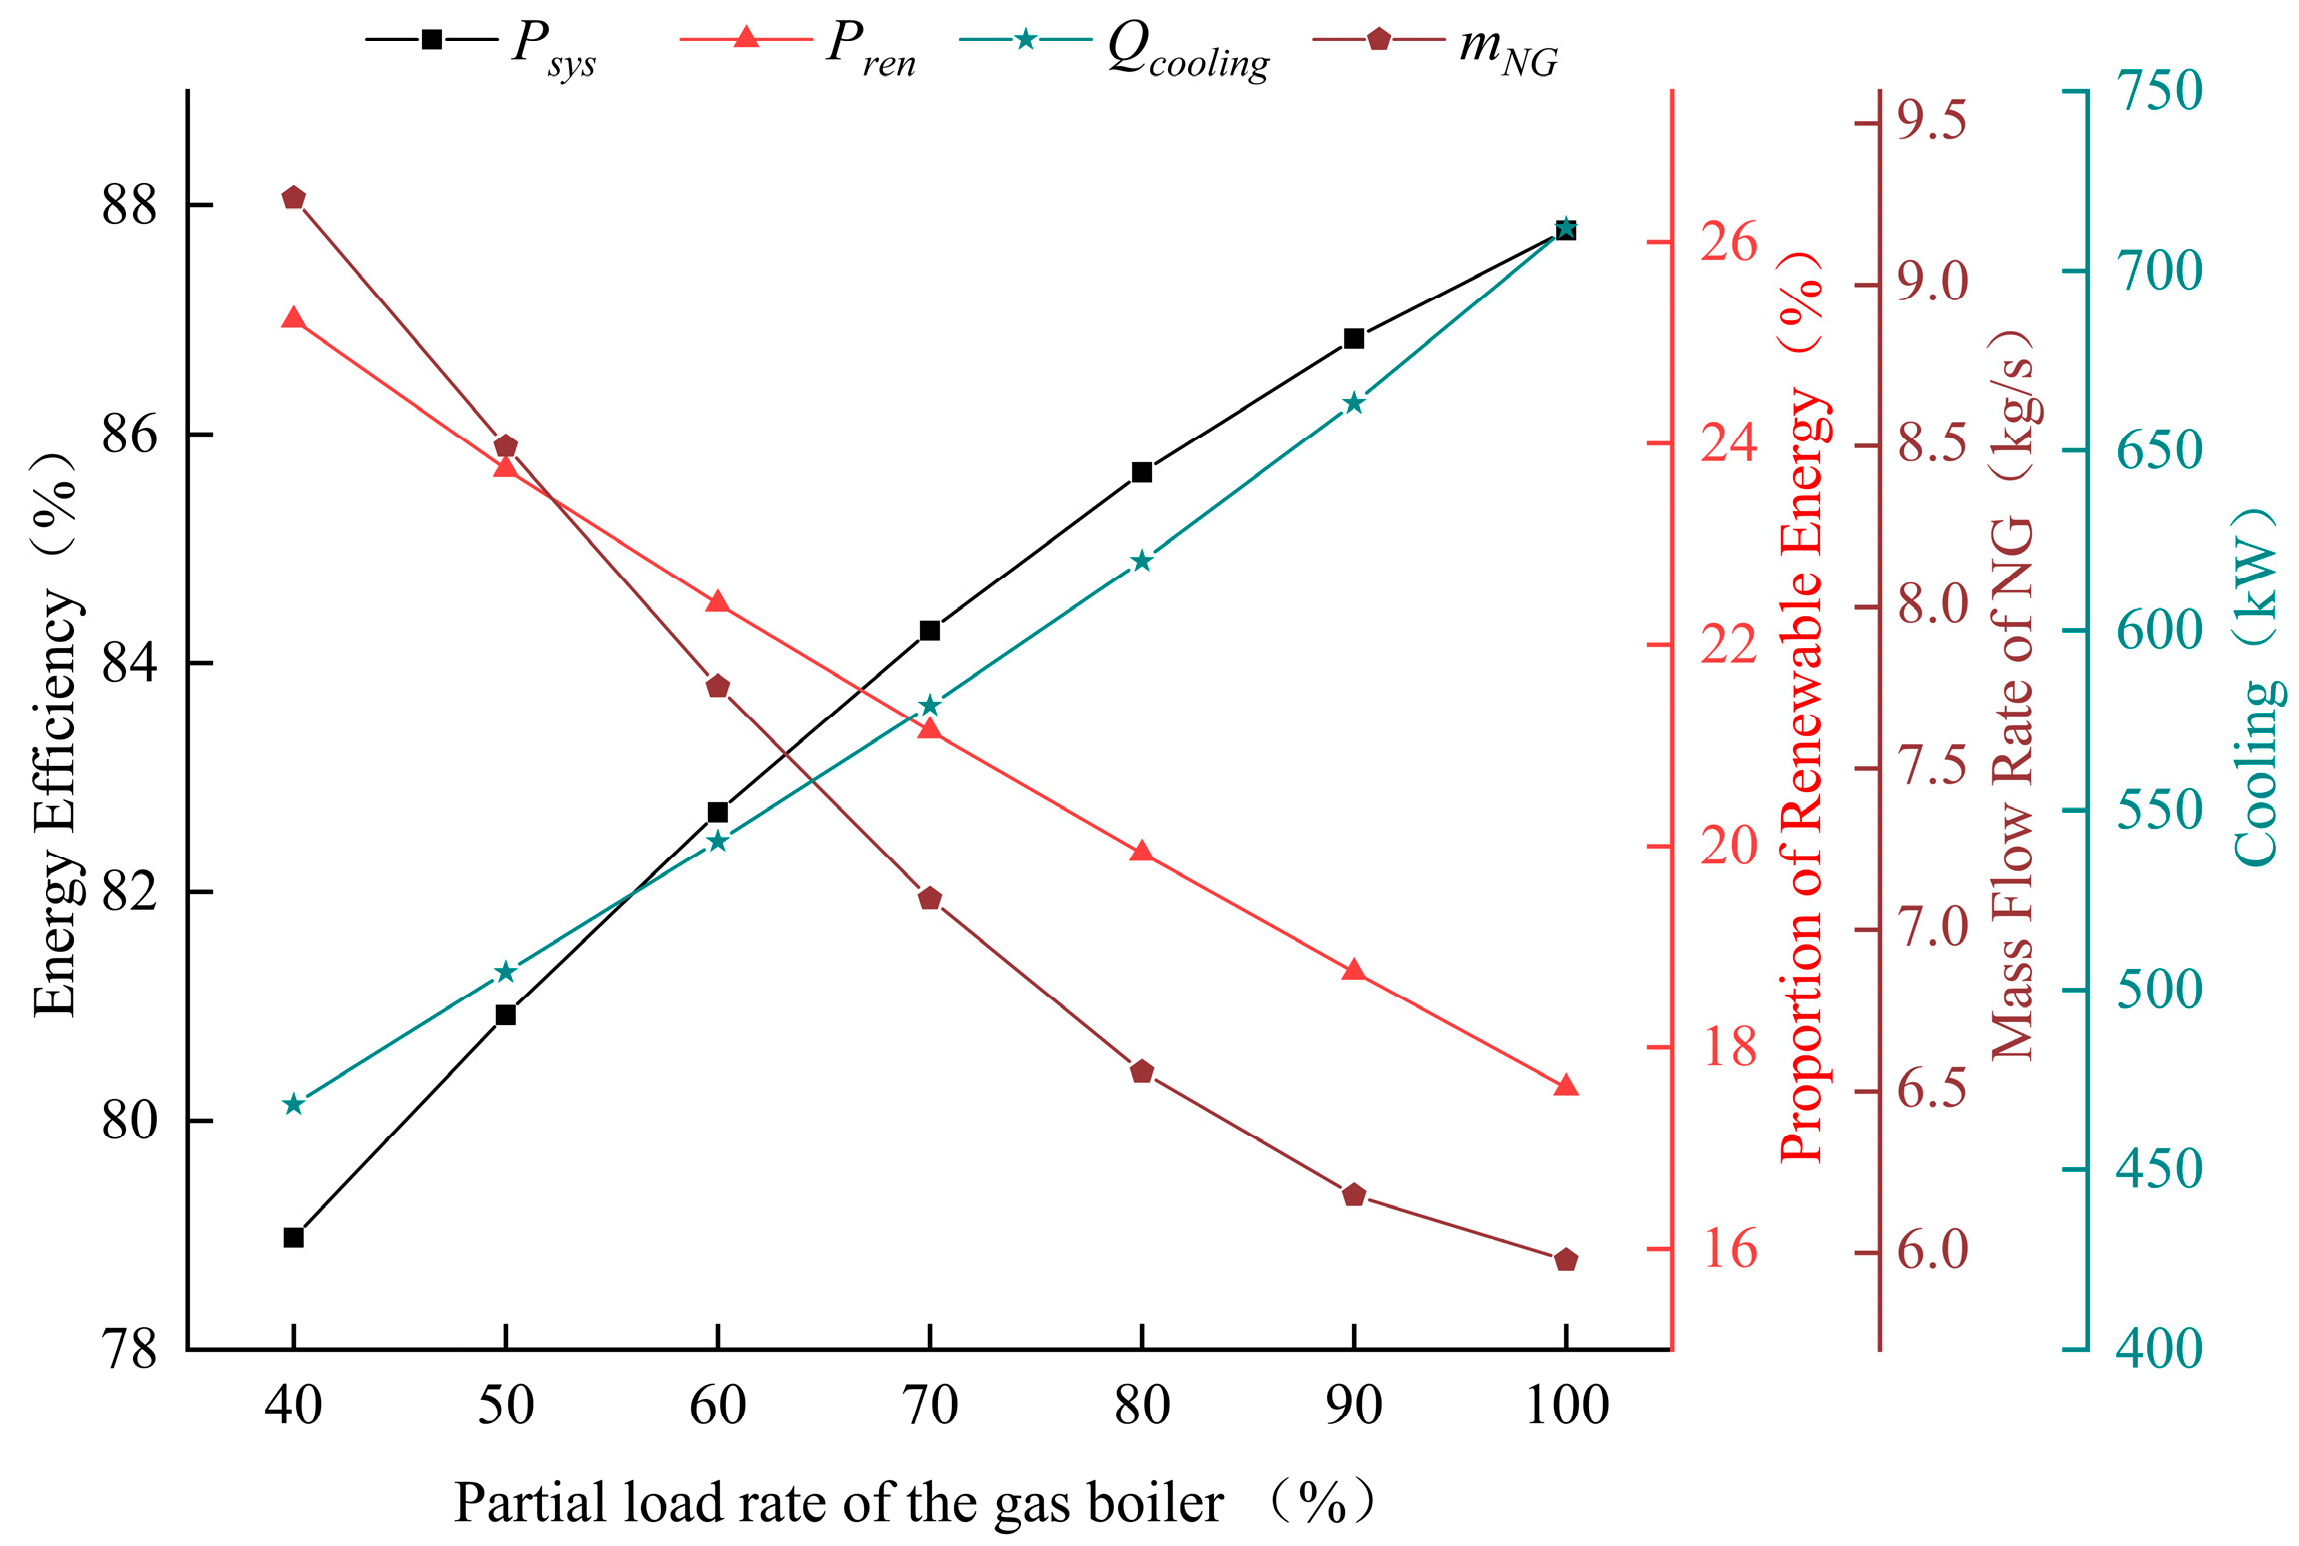
3.4. Impact of Partial Load Rate of the Gas Boiler

The effect of partial load rate of the gas boiler on the multi-generation system is shown in Figure 6. As the partial load rate of the gas boiler increases from 40% to 100%, the energy efficiency of the coupled system increases from 78.98% to 87.78%. For every 10% increase in partial load rate, the proportion of renewable energy in the system decreases by 1.27%. With the increase in partial load rate, the consumption of natural gas increases, and the mass flow rate of the NG decreases from 9.26 kg/s to 5.98 kg/s. With the increase in natural gas consumption, the flue gas flow generated by the boiler increases, resulting in the increase in the cooling capacity of the system from 468 kW to 712 kW.

4. Multi-Objective Optimization of the Coupled Steam Generation System

4.1. NSGA-II Algorithm

The NSGA-II (Non-dominated Sorting Genetic Algorithm-II) is a genetic algorithm based on the concept of Pareto optimality. Its basic process is as follows. First, an initial population of size N is generated. Through non-dominated sorting and genetic mutation, the first-generation offspring is obtained. From the second generation onward, the offspring population and parent population are merged. Based on Pareto ranking, the individuals, which have the appropriate crowding distance, are selected to form a new parent population. Finally, a new progeny species is screened out through inheritance, variation, and screening in the parent population. The program terminates when the specified number of generations for population evolution is reached.
The LINMAP and TOPSIS decision-making processes are used to determine the optimal solution. The Euclidean distance (ED) is used for normalizing the optimal solution, represented as follows [21]:
E D i + = i = 1 n O b j F i N O b j F i , i d e a l N 2
The normalized objective function is calculated as
O b j F i N = O b j F i i = 1 n ( O b j F i ) 2
In the linear programming technique for multidimensional analysis of preference (LINMAP) decision-making process, the point with the minimum E D i + is considered the optimal state point.
In the technique for order preference by similarity to ideal solution (TOPSIS) decision-making process, the non-ideal point is calculated as
E D i = i = 1 n O b j F i N O b j F i , n o n i d e a l N 2
The relative closeness R C is expressed as
R C i = E D i E D i + E D i +
In the TOPSIS decision-making process, the point corresponding to the highest R C is considered the optimal state point.

4.2. System Optimization Model

4.2.1. Objective Functions

The system is optimized based on three objectives: investment cost, renewable energy proportion, and mass flow rate of vaporized LNG. The cost calculation formula for the frequency-divided photovoltaic–thermal system is as follows [27,28]:
C P V = 1720 E P V 1000 Γ
C D I V = 0.5 C P V
C P T = 332 Q P T 1000
C F S P V / T = C P V + C D I V + C S H C
where C P V , C D I V , C P T , and C P V T refer to the costs of the full-spectrum photovoltaic panels, frequency-divided equipment, and photothermal photovoltaic–thermal systems, respectively, in CNY; Γ —exchange rate.
The cost of the working fluid pump is calculated as follows [29]:
C W F P = 1120 W W F P 1000 0.89 Γ
The cost of the heat exchanger is calculated as follows [30]:
C H E = 130 A H E 0.93 0.78 Γ
where A H E —heat exchanger area, m2.
The cost of parabolic trough collectors is calculated as follows [31]:
C P T C = 150 n A a Γ
where n —number of collector tubes; A a —area of a single collector, m2.
The investment cost of the gas boiler is calculated as follows:
C G B = 500 Q r a t e d 1000
The cost of the fan is calculated as follows [32]:
C f a n = 91562 W f a n 455 1000 0.67 Γ

4.2.2. Decision Variables

As the photovoltaic area increases, the proportion of renewable energy and investment costs also increase. Similarly, as the number of parabolic trough collector tubes increases, the proportion of renewable energy, the mass flow rate of vaporized LNG, and investment costs also rise. Additionally, an increase in the boiler’s rated power leads to higher system costs. Therefore, the boiler’s rated power, PV area, and number of collector tubes are selected as decision variables.

4.2.3. Constraints

The system’s output needs to satisfy the energy demand, represented by the following balance equations:
Q g t + Q P T + Q a b s + Q N G , d a y t i m e = Q n e e d
Q g t + Q N G , n i g h t = Q n e e d
where Q N G , d a y t i m e and Q N G , n i g h t —heat released by the natural gas combustion in the boiler during the day and night, respectively, kW; Q n e e d —heat required by the steam system, kW.
Due to construction and maintenance considerations, the total installation area of parabolic trough collectors and frequency-divided photovoltaic–thermal systems must be restricted, represented as
( A P V T + A P T C ) ω 10000
where A P V T and A P T C —represent the installation areas of the frequency-splitting photovoltaic and trough concentrators, respectively; ω —is the construction coefficient, taken as 1.5.
The parameters for the NSGA-II genetic algorithm are set as shown in Table 4. The population size is 500, and the evolution proceeds for 20 generations. The decision variables and their ranges are as follows. PV area: 500–2000 m2; number of parabolic trough collector tubes: 20–80; boiler rated power: 24–26 MW.

4.3. Optimization Results Analysis

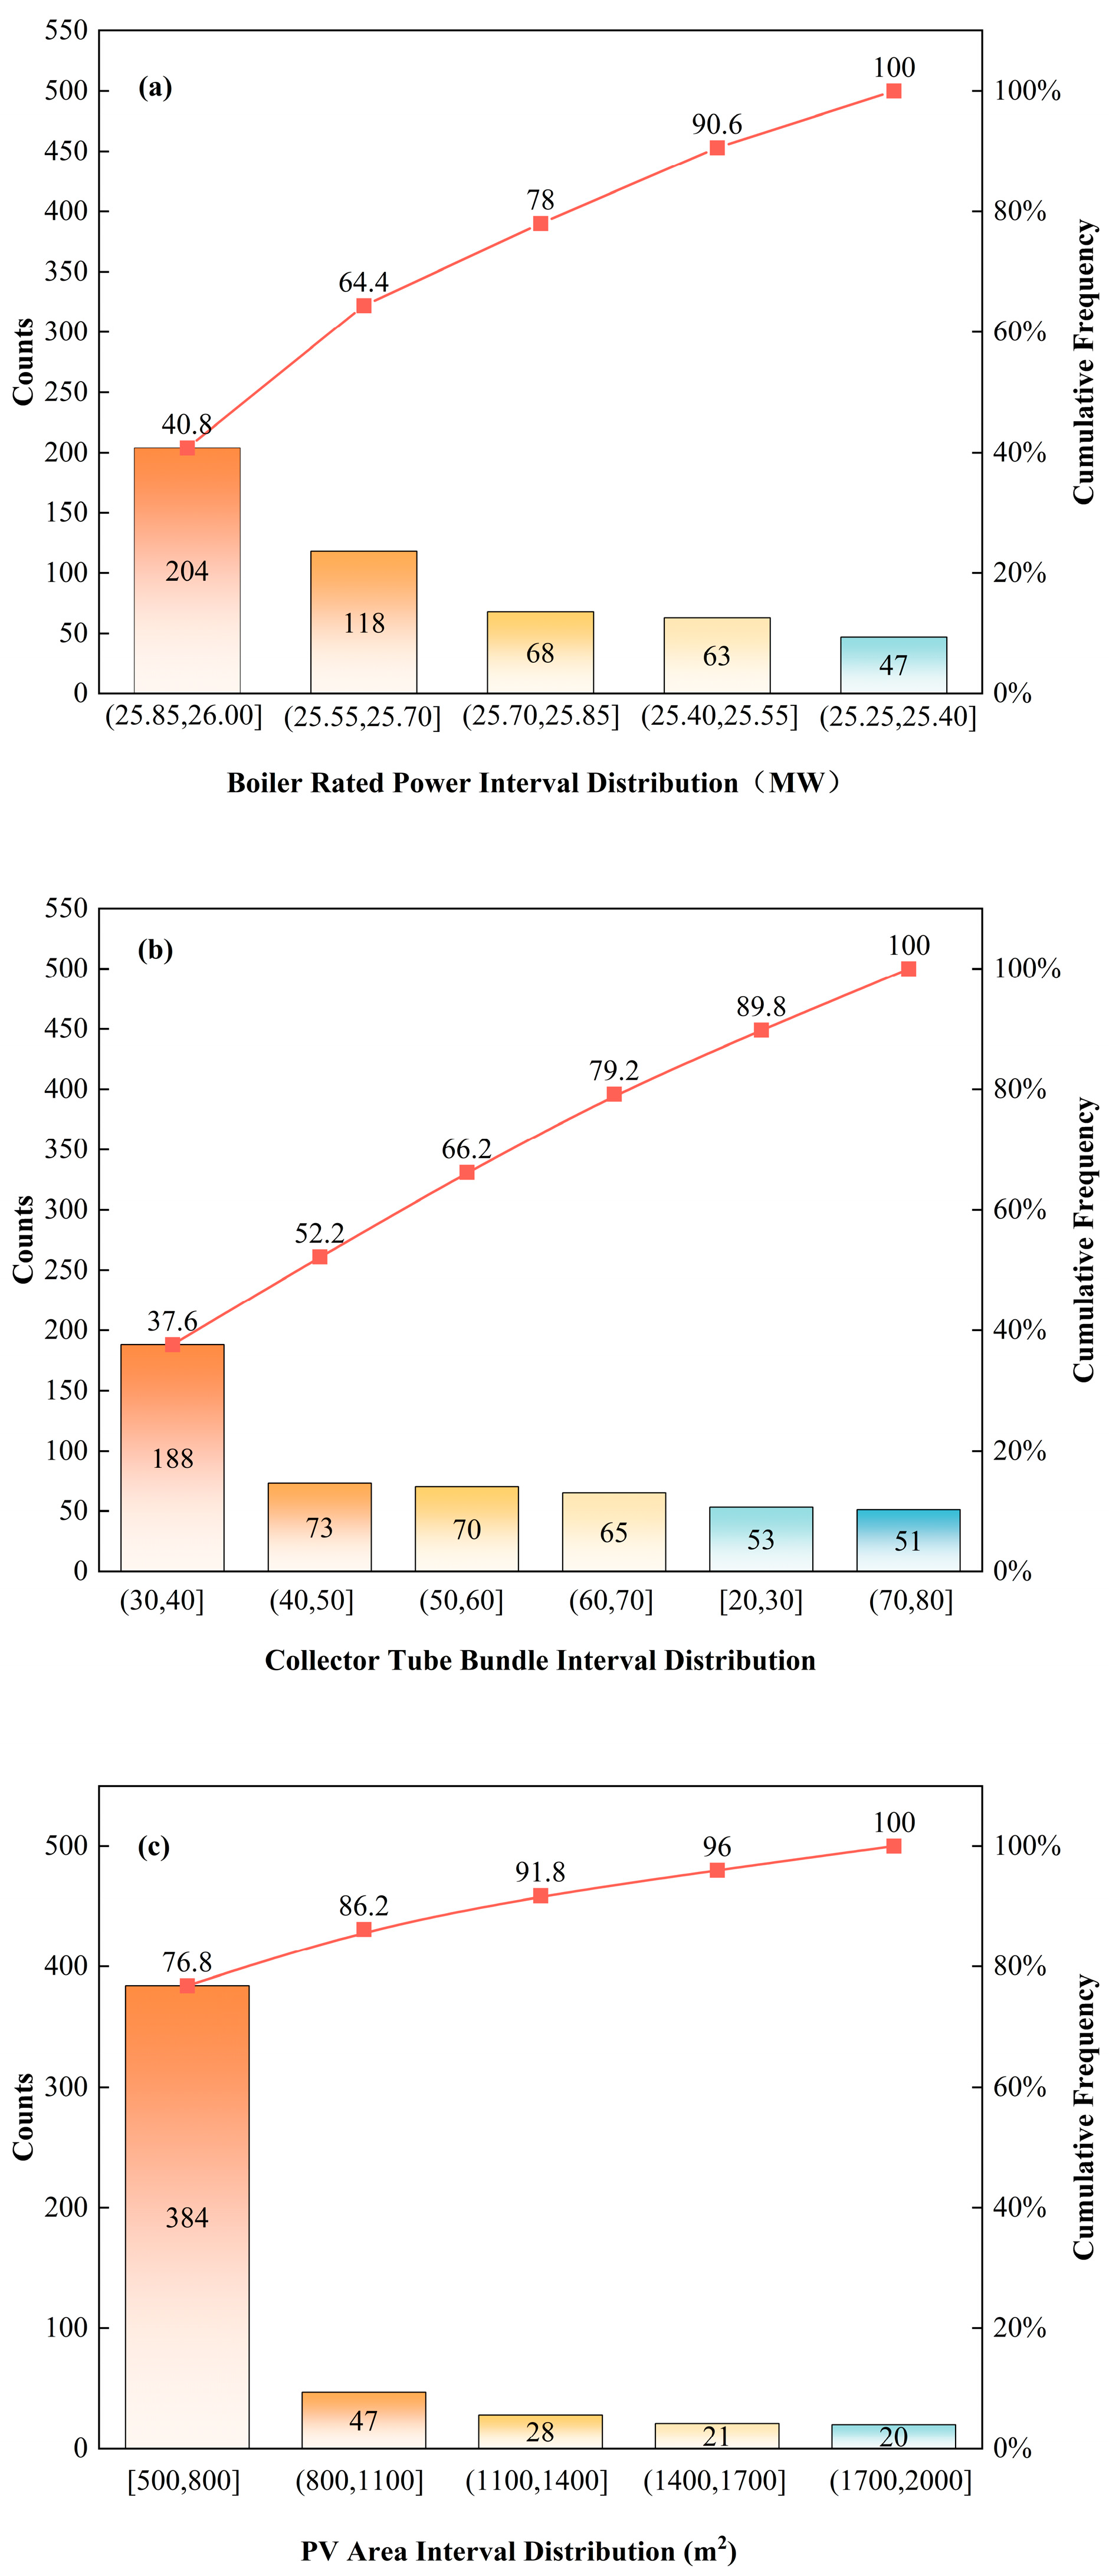
4.3.1. Distribution of Decision Variable Intervals

As shown in Figure 7, the distribution of decision variables for the optimized population was analyzed. The number of the boiler rated power in the interval [25.85, 26] MW is the largest, accounting for 40.8% of the total population. The number of collector tubes is the most widely distributed in the interval [30, 40], accounting for 37.6% of the total population. Meanwhile, the number of collector tubes is evenly distributed in other regions. However, most of the population’s photovoltaic (PV) area is concentrated in the [500, 800] m2 interval, with other intervals accounting for only 23.2%. The clustering of PV areas in the lower range may be related to the high cost of frequency-divided photovoltaic systems.

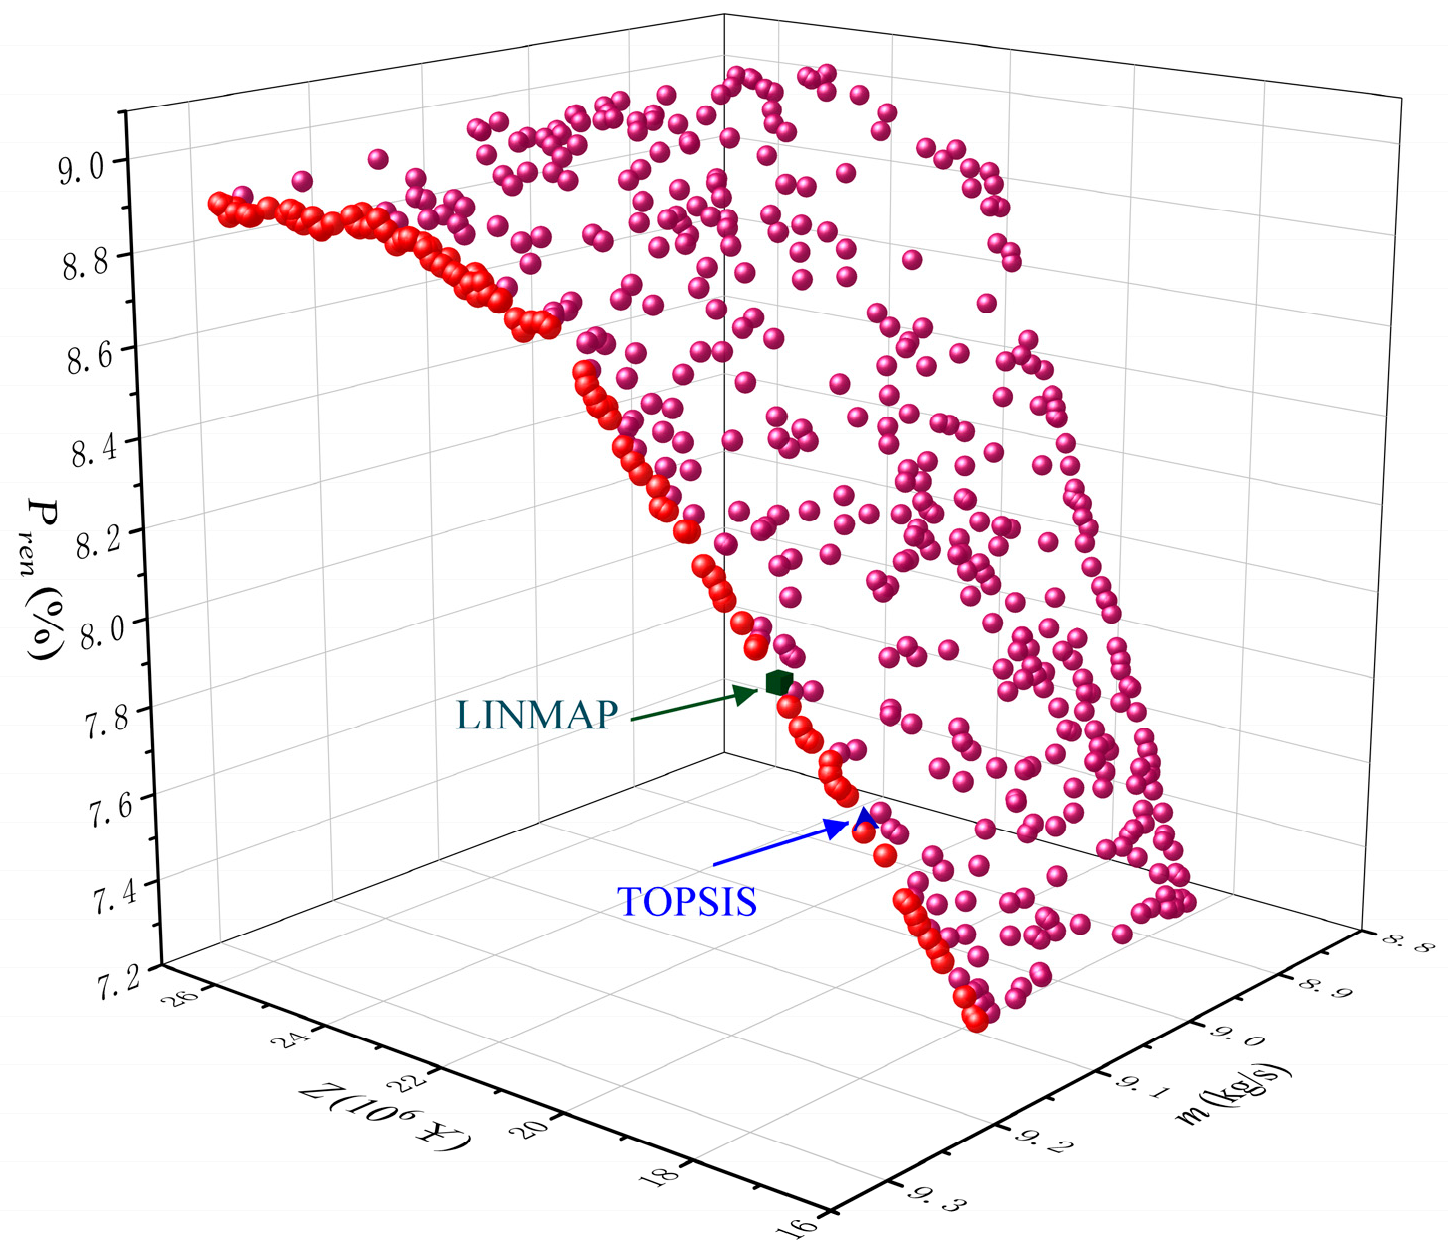
4.3.2. Optimal State Points

The Pareto front obtained from the NSGA-II genetic algorithm are shown in Figure 8, and the optimal state points determined by LINMAP and TOPSIS decision-making methods are also marked. The LINMAP optimal point corresponds to a renewable energy proportion of 7.98%, while that of the TOPSIS is 7.69%. Additionally, its vaporized LNG mass flow rate is 9.18 kg/s, slightly higher than the value determined by TOPSIS. On the other hand, the investment cost for the TOPSIS-determined optimal state point is 18.14 × 10⁶ CNY, which is 7.83% lower than that of LINMAP. Therefore, the equipment capacity determined by TOP has more economic advantages. The decision variables corresponding to the optimal state points are listed in Table 5. The PV area and the number of collectors determined by the LINMAP method are 1963 m2 and 67, respectively, which are higher than those determined by TOPSIS. Therefore, the renewable energy proportion of the LINMAP is 0.29% higher than that of the TOPSIS.

5. Conclusions

This study proposes a multi-generation system coupling medium–low-temperature geothermal energy, solar energy, and LNG cold energy. The high-temperature flue gas is used to heat LNG; low-temperature flue gas, mainly nitrogen, can be used for cold storage cooling, enabling the staged utilization of the energy. Solar shortwave is used for power generation, and longwave is used to heat the working medium, which realizes the full spectrum utilization of solar energy. A thermodynamic analysis and multi-objective optimization were conducted on the system, leading to the following main conclusions:
(1) For every 100 W/m2 increase in radiation intensity, the system’s renewable energy proportion increases by 1.5% and the power generation of PV increases 23.7 kW. For every 10% increase in partial load rate of gas boiler, the proportion of renewable energy decreases by 1.27%.
(2) The system’s energy efficiency, cooling output, and the LNG vaporization flow rate are negatively correlated with the scale of solar energy utilization equipment.
(3) In the evolved population, the boiler rated power and collector tube bundles are evenly distributed within their respective decision intervals, while the PV area is concentrated in the lower interval.
(4) The decision variables determined by TOPSIS method have better economic performance. Its investment cost is 18.14 × 10 CNY, which is 7.83% lower than LINMAP. Meanwhile, the proportion of renewable energy is only 0.29% lower than that of LINMAP.
The proposed multi-generation system provides a new approach for the deep coupling of geothermal energy, solar energy, and LNG cold energy. This has a high reference value for the clean energy transformation of steam production and LNG gasification process. In the future, the system can be combined with thermal storage and electric storage to address the impact of extreme weather on system performance. However, the cost and efficiency of solar energy utilization equipment are the key to restrict the economy and energy efficiency of the system. In addition, other aspects, such as technical and social benefits, for multi-angle evaluation of system indicators, can be further studied.

Author Contributions

Conceptualization, X.G.; writing—draft preparation, H.L.; methodology, T.W.; writing—review and editing, Z.W.; investigation, T.A. and Z.Q.; resources, H.H. and H.C.; validation, Y.S. All authors have read and agreed to the published version of the manuscript.

Funding

This research received no external funding.

Informed Consent Statement

The authors declare they have not used Artificial Intelligence (Al) tools in the creation of this article.

Data Availability Statement

The original contributions presented in this study are included in the article. Further inquiries can be directed to the corresponding author.

Conflicts of Interest

Authors Xinfeng Guo, Hao Li, Tianren Wang, Zizhang Wang were employed by the company Sinopec Xinxing Petroleum Co., Ltd. The remaining authors declare that the research was conducted in the absence of any commercial or financial relationships that could be construed as a potential conflict of interest.

Nomenclature

CHPCombined heat and power
CSCold storage
FSPTFull-spectrum photo-thermal
FSPVFull-spectrum photovoltaic
GBGas boiler
HEHeat exchanger
LINMAPThe linear programming technique for multidimensional analysis of preference
LNGLiquefied natural gas
NGNatural gas
NSGA-IINon-dominated sorting genetic algorithm
PTCParabolic trough collector
PV/TPhotovoltaic/thermal
PWProduction well
RWReinjection well
SepSeparator
TOPSISThe technique for order of preference by similarity to ideal solution
WFPWorking fluid pump
Symbols
AArea (m2)
CCost (CNY)
DNIDirect normal irradiance (W/m2)
EPower generation (kW)
EDEuclidean distance
EQESpectral external quantum efficiency
fPartial load rate
FFFill factor
hSpecific enthalpy (kJ/kg)
HConvective heat transfer coefficient
ISolar irradiance of the AM1.5 spectrum
JCurrent (A)
kConstant
nIdeal factor
nNumber
ObjFObjective function
PSystem efficiency
QHeat energy (kW)
qElementary charge
RSpectral reflectivity
RCRelative closeness
TTemperature (K)
VVoltage (V)
αAbsorption rate
βIdeal factor
γIncidence factor
ΓExchange rate
εEmissivity
ηEfficiency
λWave length
σStefan–Boltzmann constant
τTransmittance
ωConstruction coefficient
Subscripts
0Ambient state
1,2,…State point
aAperture
absAbsorber
BBoltzmann
cCollector
cfCold fluid
ciInner surface of glass cover
coOuter surface area of glass cover
CrefReflector’s full-spectrum reflectivity
fWorking fluid
gBandgap
GCGlass cover
gtGeothermal
hfHot fluid
incIncident energy
OCOpen-circuit
optOptical
OTOverall transmittance
PTPhotothermal
recReceived
renRenewable energy
riInner surface of absorber
roOuter surface of the absorber
sIsentropic state
SCShort-circuit
surSurface
sysTotal system
TCTemperature coefficient

References

  1. Dogan, B.; Nketiah, E.; Ghosh, S.; Nassani, A.A. The impact of the green technology on the renewable energy innovation: Fresh pieces of evidence under the role of research & development and digital economy. Renew. Sustain. Energy Rev. 2025, 210, 115193. [Google Scholar] [CrossRef]
  2. Abed, A.M.; Alhuyi, M.; Hossein, M. Power generation by utilization of different renewable energy sources in five Middle Eastern countries: Present status, opportunities and challenges. Sustain. Energy Technol. Assess. 2025, 73, 104101. [Google Scholar] [CrossRef]
  3. Habibzadeh, S.; Astaraei, F.R.; Jahangir, M.H. Sustainability assessment of a petrochemical plant electricity supply based on 4E optimization of various hybrid renewable energy systems scenarios. Energy Convers. Manag. 2025, 325, 119357. [Google Scholar] [CrossRef]
  4. Jouni, W.; Beucher, Y.; Zoughaib, A. Thermodynamic architecture for steam generation using heat pumps system valorizing industrial waste heat. Int. J. Refrig. 2025, 172, 295–308. [Google Scholar] [CrossRef]
  5. Savaş, A.; Şener, R.; Uslu, S.; Der, O. Experimental study on performance and emission optimization of MgO nanoparticle-enriched 2nd generation biodiesel: A method for employing nanoparticles to improve cleaner diesel combustion. J. Energy Inst. 2025, 120, 102024. [Google Scholar] [CrossRef]
  6. Gadhamshetty, V.; Arudchelvam, Y.; Nirmalakhandan, N.; Johnson, D.C. Modeling dark fermentation for biohydrogen production: ADM1-based model vs. Gompertz model. Int. J. Hydrogen Energy 2010, 35, 479–490. [Google Scholar] [CrossRef]
  7. Angelidaki, I.; Ellegaard, L.; Ahring, B.K. A mathematical model for dynamic simulation of anaerobic digestion of complex substrates: Focusing on ammonia inhibition. Biotechnol. Bioeng. 1993, 42, 159–166. [Google Scholar] [CrossRef]
  8. Tsang, F.; Karimi, I.A.; Farooq, S. Low-emissions hydrogen from MCH dehydrogenation: Integration with LNG regasification. Energy Convers. Manag. 2024, 321, 119012. [Google Scholar] [CrossRef]
  9. Nath, K.; Das, D. Improvement of fermentative hydrogen production: Various approaches. Appl. Microbiol. Biotechnol. 2004, 65, 520–529. [Google Scholar] [CrossRef]
  10. Mao, X.; Liu, J.; Luo, L.; Sun, S.; Wu, C.; Gao, N.; Liu, H.; Liu, R. Migration characteristics of geothermal fluids in karst geothermal reservoirs in the Beijing-Tianjin-Hebei Plain. Geosci. Front. 2025, 102104. [Google Scholar] [CrossRef]
  11. Dumlao, S.M.G.; Ogata, S. Japan’s local consumption of solar energy: The role of energy demand in residential and small-scale solar projects. Sol. Energy 2025, 287, 113175. [Google Scholar] [CrossRef]
  12. Agberegha, L.O.; Aigba, P.A.; Nwigbo, S.C.; Onoroh, F.; Samuel, O.D.; Bako, T.; Der, O.; Ercetin, A.; Sener, R. Investigation of a Hybridized Cascade Trigeneration Cycle Combined with a District Heating and Air Conditioning System Using Vapour Absorption Refrigeration Cooling: Energy and Exergy Assessments. Energies 2024, 17, 1295. [Google Scholar] [CrossRef]
  13. Fares, H.; Le Pierrès, N.; Chèze, D.; Wurtz, E. Assessing the energy performance of solar photovoltaic, thermal and hybrid PVT panels in a building context: A systematic study of the criteria’ definitions and studies parameters. Sol. Energy 2025, 286, 113126. [Google Scholar] [CrossRef]
  14. Wang, J.; Chen, Y.; Lior, N. Exergo-economic analysis method and optimization of a novel photovoltaic/thermal solar-assisted hybrid combined cooling, heating and power system. Energy Convers. Manag. 2019, 199, 111945. [Google Scholar] [CrossRef]
  15. Duong, P.A.; Ryu, B.R.; Song, M.K.; Nam, D.; Kang, H. Thermodynamics analysis of a novel designation of LNG solid oxide fuel cells combined system with CO2 capture using LNG cold energy. J. Eng. Res. 2024, 12, 226–238. [Google Scholar] [CrossRef]
  16. Yilmaz, C.; Arslan, M.; Tokgoz, N.; Ozdemir, S.N. Thermoeconomic optimization of a geothermal-assisted hybrid LNG and power generation system: Simulation, performance assessment, and sustainability insights. Case Stud. Therm. Eng. 2025, 73, 106426. [Google Scholar] [CrossRef]
  17. Toker, S.C. A comprehensive thermodynamic assessment of an innovative solar-geothermal driven multigeneration system for sustainable production of energy, hydrogen, freshwater, heating and cooling. Renew. Energy 2025, 252, 123571. [Google Scholar] [CrossRef]
  18. Hawkes, F.R.; Hussy, I.; Kyazze, G.; Dinsdale, R.; Hawkes, D.L. Continuous dark fermentative hydrogen production by mesophilic microflora: Principles and progress. Int. J. Hydrogen Energy 2007, 32, 172–184. [Google Scholar] [CrossRef]
  19. Lopez-Hidalgo, A.M.; Smoliński, A.; Sanchez, A. A meta-analysis of research trends on hydrogen production via dark fermentation. Int. J. Hydrogen Energy 2022, 47, 13300–13339. [Google Scholar] [CrossRef]
  20. Mehrabadi, Z.K.; Boyaghchi, F.A. Thermodynamic, economic and environmental impact studies on various distillation units integrated with gasification-based multi-generation system: Comparative study and optimization. J. Clean. Prod. 2019, 241, 118333. [Google Scholar] [CrossRef]
  21. Zhang, W.; Chen, F.; Shen, H.; Cai, J.; Liu, Y.; Zhang, J.L.; Wang, X.M.; Heydarian, D. Design and analysis of an innovative biomass-powered cogeneration system based on organic flash and supercritical carbon dioxide cycles. Alex. Eng. J. 2023, 80, 623–647. [Google Scholar] [CrossRef]
  22. Li, B.; Xie, H.; Sun, L.; Gao, T.; Xia, E.; Liu, B.; Wang, J.; Long, X. Advanced exergy analysis and multi-objective optimization of dual-loop ORC utilizing LNG cold energy and geothermal energy. Renew. Energy 2025, 239, 122164. [Google Scholar] [CrossRef]
  23. Fang, J.; Yang, M.; Fan, Y.; Luo, T.; Li, H.; Liu, T.; Tang, S.; Zhao, K. Thermodynamic evaluation of a combined cooling, heating, hydrogen, and power multi-generation system for full-spectrum solar energy utilization. Energy Convers. Manag. 2024, 300, 118019. [Google Scholar] [CrossRef]
  24. Zhang, Y.; Ma, S.; Yue, W.; Tian, Z.; Yang, C.; Gao, W. Energy, exergy, economic and environmental (4E) evaluation of a solar-integrated energy system at medium–high temperature using CO2 as the parabolic trough collector (PTC) working medium. Energy Convers. Manag. 2023, 296, 117683. [Google Scholar] [CrossRef]
  25. Ai, T.; Chen, H.; Zhong, F.; Jia, J.; Song, Y. Multi-objective optimization of a novel CCHP system with organic flash cycle based on different operating strategies. Energy 2023, 276, 127577. [Google Scholar] [CrossRef]
  26. Ai, T.; Chen, H.; Jia, J.; Song, Y.; Zhong, F.; Yang, S.; Xue, G. Thermodynamic analysis of a CCHP system integrated with a regenerative organic flash cycle. Appl. Therm. Eng. 2022, 202, 117833. [Google Scholar] [CrossRef]
  27. Shen, Q.; Fu, C.; Wang, J.; Yao, W.; Wu, T.; Ding, S.; Xu, P. Exergy-cost-carbon nexus of power-to-X system from carbon dioxide/water co-electrolysis driven by solar full-spectrum energy. Energy Convers. Manag. 2024, 308, 118382. [Google Scholar] [CrossRef]
  28. Levin, D.B.; Pitt, L.; Love, M. Biohydrogen production: Prospects and limitations to practical application. Int. J. Hydrogen Energy 2004, 29, 173–185. [Google Scholar] [CrossRef]
  29. Mosaffa, A.H.; Farshi, L.G. Thermodynamic and economic assessments of a novel CCHP cycle utilizing low-temperature heat sources for domestic applications. Renew. Energy 2018, 120, 134–150. [Google Scholar] [CrossRef]
  30. Ai, T.; Chen, H.; Wu, D.; Zhong, F.; Song, Y. Thermodynamic and exergo-economic evaluation of biomass-to-X system combined the chemical looping gasification and proton exchange membrane fuel cell. Energy Convers. Manag. 2024, 322, 119132. [Google Scholar] [CrossRef]
  31. Rostamnejad Takleh, H.; Zare, V.; Mohammadkhani, F.; Sadeghiazad, M.M. Proposal and thermoeconomic assessment of an efficient booster-assisted CCHP system based on solar-geothermal energy. Energy 2022, 246, 123360. [Google Scholar] [CrossRef]
  32. Zhang, C.; Zhu, L.; Hao, Q.; Huang, Y.; Zeng, X.; Wang, Y.; Fan, J.; He, Y. Thermodynamic and exergoeconomic evaluation of coal and biomass co-gasification as solid oxide fuel cell feed coupled with supercritical carbon dioxide and organic Rankine cycle. Energy Convers. Manag. 2024, 300, 117951. [Google Scholar] [CrossRef]
Figure 1. Schematic diagram of the multi-generation system coupled geothermal, solar, and LNG cold energy.
Processes 13 02377 g001
Figure 2. Solar irradiance of the AM1.5 spectrum (280–2500 nm) and spectral reflectivity of the reflector.
Processes 13 02377 g002
Figure 3. Effect of solar radiant irradiance on system performance.
Processes 13 02377 g003
Figure 4. Effect of collector tube bundles on system performance.
Processes 13 02377 g004
Figure 5. Effect of PV area on system performance.
Processes 13 02377 g005
Figure 6. Effect of partial load rate of the gas boiler on system performance.
Processes 13 02377 g006
Figure 7. Optimized interval distribution of decision variables.
Processes 13 02377 g007
Figure 8. Pareto front and optimal state point distribution.
Processes 13 02377 g008
Table 1. Parameter settings of the multi-generation system.
ParameterValue
PV absorption rate0.98
PV incidence factor0.98
Convective heat transfer coefficient of the PV (W·m−2·K−1)0.105
Photovoltaic cell temperature (K)333.15
Ambient temperature (K)298.15
Elementary charge (C)1.62 × 10⁻¹⁹
Aperture area of the receiver of PTC (m2)69.6
Inner diameter of the absorber of PTC (m)0.066
Outer diameter of the absorber of PTC (m)0.07
Inner diameter of the cover of PTC (m)0.12
Outer diameter of the cover of PTC (m)0.125
Emissivity of the absorber surface0.88
Emissivity of the glass cover surface0.095
Convective heat transfer coefficient of PTC (W·m−2·K−1)10
Isentropic efficiency of the fan and pump0.75
Temperature of steam (K)473.15
Area of the PV (m2)1250
Number of collector tubes70
Rated capacity of gas boiler (MW)25
Geothermal water temperature (K)343.15
Geothermal water reinjection temperature (K)308.15
Mass flow rate of geothermal water (kg/s)10
Table 2. Model verification of full-spectrum photovoltaic and photothermal system.
ParameterReference [23]Simulation ResultError (%)
Photothermal Proportion (%)18.8718.551.677
PV Component Light Loss Proportion (%)5.795.731.004
Thermal Loss Proportion (%)0.380.393.049
Photoelectric Proportion (%)23.422.792.612
Fluid Absorption Proportion (%)44.5844.520.134
Table 3. Validation of parabolic trough collector model.
Radiation Intensity (W/m2)Inlet Water Temperature (K)Thermal EfficiencyReference [24]Simulation Result
8004500.70050.72803.93
8005000.70340.72463.01
8005500.70050.72062.86
8006000.68200.71544.90
Table 4. Genetic algorithm parameter settings.
ParameterValue
Population Size500
Number of Generations20
PV Area (m2)[500, 2000]
Number of Collector Tubes[20, 80]
Boiler Rated Power (MW)[24, 26]
Table 5. Decision variables corresponding to the optimal state point.
Decision MethodPV Area (m2)Collector Tube BundlesBoiler Capacity (kW)
LINMAP19636725,990
TOPSIS50324258,715
Disclaimer/Publisher’s Note: The statements, opinions and data contained in all publications are solely those of the individual author(s) and contributor(s) and not of MDPI and/or the editor(s). MDPI and/or the editor(s) disclaim responsibility for any injury to people or property resulting from any ideas, methods, instructions or products referred to in the content.

