Article

Grid Stability and Wind Energy Integration Analysis on the Transmission Grid Expansion Planned in La Palma (Canary Islands)

by
Raúl Peña
1,*,
Antonio Colmenar-Santos
1 and
Enrique Rosales-Asensio
2,*
1
Department of Electrical, Electronic, Control, Telematics and Applied Chemical Engineering, UNED, Juan del Rosal, 12-Ciudad Universitaria, 28040 Madrid, Spain
2
Department of Electrical Engineering, University of Las Palmas de Gran Canaria, Campus de Tafira S/n, 35017 Las Palmas de Gran Canaria, Spain
*
Authors to whom correspondence should be addressed.
Processes 2025, 13(8), 2374; https://doi.org/10.3390/pr13082374 (registering DOI)
Submission received: 10 June 2025 / Revised: 17 July 2025 / Accepted: 23 July 2025 / Published: 26 July 2025

Abstract

Island electrical networks often face stability and resilience issues due to their weakly meshed structure, which lowers system inertia and compromises supply continuity. This challenge is further intensified by the increasing integration of renewable energy sources, promoted by decarbonization goals, whose intermittent and variable nature complicates grid stability management. To address this, Red Eléctrica de España—the transmission system operator of Spain—has planned several improvements in the Canary Islands, including the installation of new wind farms and a second transmission circuit on the island of La Palma. This new infrastructure will complement the existing one and ensure system stability in the event of N-1 contingencies. This article evaluates the stability of the island’s electrical network through dynamic simulations conducted in PSS®E, analyzing four distinct fault scenarios across three different grid configurations (current, short-term upgrade and long-term upgrade with wind integration). Generator models are based on standard dynamic parameters (WECC) and calibrated load factors using real data from the day of peak demand in 2021. Results confirm that the planned developments ensure stable system operation under severe contingencies, while the integration of wind power leads to a 33% reduction in diesel generation, contributing to improved environmental and operational performance.

1. Introduction

The penetration of renewable energies continues to rise in many of the world’s electrical systems. In fact, at COP28, the most recent Global Climate Action Summit held in Dubai, 118 participating countries agreed to triple the installed capacity of renewable energy, with a focus on reaching 11 TW by 2030 and gradually abandoning fossil fuels [1].
Renewable generation is highly dependent on the availability of the natural resource. Managing their intermittency is one of the greatest challenges that electrical networks will have to face, as there are periods when excess generation or demand can lead to network instability [2], caused by variations in frequency and voltage levels. These problems will be more noticeable in island electrical systems where the size of the network and the absence of synchronous generators result in low inertia and reduced stability margins. Moreover, islanded grids operate in electrical isolation, without interconnection to larger systems that could provide ancillary support. This amplifies their vulnerability to disturbances such as generator trips or line faults and limits the flexibility for load balancing and reserve management. In addition, the increasing penetration of non-synchronous renewable sources, such as wind and solar, further reduces inertial response and frequency stability. Due to these characteristics, islands provide a valuable testbed for evaluating strategies and technologies for the energy transition, which can later be scaled to larger continental systems [3].
Renewable generation is also advantageous in island electrical systems because of the high costs associated with transporting fossil fuels, which are currently necessary for generating a large percentage of the energy consumed by the islands. Other drawbacks derived from this transportation are the risks of accidental spills that may occur on ships transporting the fuel, as well as the greenhouse gas emissions produced [4].
There are several studies focused on analyzing 100% renewable energy supply scenarios in the Canary Islands [3,5], Ireland [6], on the island of Dia, Greece [7], or on the island of Mljet, Croatia [8]. In [9], different intelligent energy management strategies are analyzed in different energy sectors of the island of Gran Canaria, considering high renewable penetration. Other studies such as [10] analyze the behavior and sustainability of island systems in the context of renewable energy and electric vehicle penetration, including the use of hydraulic pumped storage [11], or studies estimating the feasibility of offshore wind energy [12].
The islands also face the problem that in many cases interconnection with other islands or continental systems is not possible due to technical and economic challenges. The depth of the ocean floor and the distances between territories are usually the main impediments to interconnecting isolated systems. Many studies have focused on corroborating that interconnected island electrical systems enhance system stability, reduce electricity costs [13,14] and increase the penetration of renewable energy resources [15]. However, although the conclusions drawn from these studies are useful and interesting for researchers, the proposed hypotheses for interconnecting certain islands are often unrealistic. In Table 1, the main results from the cited studies are shown.
The problems described above reveal the need to make isolated electrical systems progressively more resilient and less dependent on external energy resources. For this purpose, transmission network planning in countries like Spain includes various projects aimed at improving island infrastructure.
One of the actions that the transmission system operator of Spain—Red Eléctrica de España (REE)—plans to undertake in the country’s island territories consists of strengthening the transmission network of the island of La Palma, located in the Canary Islands archipelago. These extension works will enhance the quality and security of supply while enabling the connection of future renewable generation in the southern area of the island.
The motivation for this action arises from the fact that the transmission network currently consists of a single line, and its failure or maintenance can cause supply interruptions for a large part of the population, as has already occurred on several occasions recently [16]. Additionally, the volcanic eruption that took place in 2021 further underscored the need to reinforce the island’s network, which was severely damaged. The eruption lasted for 85 days, destroying 136.5 km of distribution lines, 1668 medium/low voltage supports and 25 distribution centers [17]. The transfer of portable thermal units from destinations such as Italy, Germany or Belgium was vital for restoring electricity supply in the areas most affected by the natural disaster [18]. While the damage to the transmission network was not as extensive, it is evident that the circumstances would have been very different with a network reinforcement such as that proposed by REE for the coming years.
In the scientific literature, multiple studies have focused on analyzing and improving the dynamic stability of the electrical grids. In [19], a virtual synchronous machine (VSM) control for renewable energy sources is proposed, which can enhance voltage stability in the transmission network during fault situations and increase system inertia in isolated networks. Another investigation conducted on the island of Gran Canaria [20] develops a neural network-based predictive under-frequency load shedding strategy to reduce involuntary disconnections. Additionally, in [21], a static and dynamic analysis in PSS®E is performed for a section of southern Morocco’s grid, demonstrating that the integration of renewable energy does not negatively impact the stability of the system.
In the case of the electrical system of the island of La Palma, there have been relatively few studies conducted to date. In [22], a method is proposed to integrate the restriction of the nadir frequency into the generation dispatch problem, tested in the electrical system of the island using machine learning. In [23], a dynamic model of the ultracapacitor installed a few years ago in La Palma is developed, contrasting the simulation results with real data. Among the studies carried out to date, three conducted for the European Commission (EC) stand out under the Clean Energy for EU Islands initiative. In [24], the aim is to determine the large-scale energy storage capacity using pumped-storage systems, not only to store energy and supply it when there is a deficit of renewable generation but also to provide adjustment and regulation services to the system. Another study for the EC [25] establishes a methodology for assessing the feasibility of an energy storage system and the cost–benefit evaluation of a virtual transmission line project on the island. Finally, a particularly notable study [26] addresses the technical benefits, disadvantages, considerations and future studies required regarding the proposed construction of the new 66 kV overhead power line, which is closely related to this article. This study includes simulations of power flow, short circuits and a theoretical analysis of dynamic stability, among others.
The conclusions drawn from [26] are positive regarding the installation of the new line. The simulations indicate a more stable voltage profile, and as the system impedances decrease, the electrical distance between generation units is reduced, establishing a stronger link between generation and demand. However, the research does not explicitly address a dynamic analysis of events such as the loss of a generation unit or different types of short circuits at specific points in the electrical system. Furthermore, it does not include a dynamic model for the generation units, nor does it consider a scenario with higher renewable energy penetration, which would have been relevant given the expected expansion of wind capacity on the island. Therefore, it is important to conduct a more comprehensive study that examines in detail the technical feasibility of the future island electricity system.
The purpose of this article is to study the stability and resilience of the transmission system that REE plans to expand on the island of La Palma. Using the electrical systems simulation tool known as PSS®E, a series of incidents and scenarios will be simulated in the transmission network, and the stability of the network will be evaluated in each case. In this research, dynamic models have been implemented for each type of generation (diesel, fixed-speed wind generation and variable-speed wind generation). These scenarios will be simulated in three different electrical systems that converge in La Palma at different temporal stages: (1) the current transmission network; (2) the planned transmission network for 2025 [27]; and (3) the planned transmission network, including future wind generation approved by the regional government.
This article is structured as follows: Section 2 provides an overview of the current electrical system on the island of La Palma, as well as the network reinforcement plan that will be implemented in the coming years. Section 3 describes the simulation tool used in the research, along with the proposed simulation scenarios and data from the island’s electrical network model. The static and dynamic stability results of the simulations are presented and discussed in Section 4. In Section 5, the main conclusions drawn from the results and the potential benefits of the planned electrical reinforcement plan are outlined.

2. Theoretical Background

Island power systems are characterized by a high dependence on fossil resources for energy generation due to the technical, economic and political difficulties in establishing interconnections with continental territories. For this reason, island networks are often considered electrically unstable. Government authorities continue to establish sustainable policies to implement renewable generation on the islands [10] in order to reduce greenhouse gas emissions from current generation plants. However, it must also be considered that the massive integration of intermittent energy sources complicates the operation of electrical systems.
The Transmission Network Development Plan for 2021–2026, presented by REE and approved in 2022 by the Council of Ministers of Spain [28], includes reinforcement measures in the transmission network of the island of La Palma to improve the security of the electricity supply and promote the integration of renewable energies. This section will analyze the main characteristics of the current network, the associated operational problems and the generation mix present on the island. Subsequently, the actions that REE will undertake in the electrical system and their objectives will be explained.

2.1. Current Electrical Grid

La Palma is one of the seven main islands of the Canary Islands archipelago, an autonomous community of Spain located in the Atlantic Ocean. It is situated in the northwestern part of the Canary archipelago, with its capital in Santa Cruz de La Palma. With a total area of approximately 708.32 km2, it is the fifth-largest island in the autonomous community. According to recent data [29], La Palma has a population of about 85,000 inhabitants.
The island’s economy is primarily driven by agriculture and tourism [30]. Since the onset of COVID-19 and the volcanic eruption of 2021, tourist arrivals declined from a peak of 400,000 in 2017 to 125,000 in 2020. However, in recent years, the influx of tourists has been rising [31].
The electrical networks of the Canary Islands are isolated systems that are typically not interconnected. The great depth of the seabed around La Palma and El Hierro makes electrical interconnections with other islands technically and economically challenging. Notable exceptions include the existing submarine cable between Lanzarote and Fuerteventura, and the interconnection under construction between Tenerife and La Gomera, which is scheduled to be commissioned in 2025 [32].
In the case of La Palma, the transmission network consists of a single 66 kV circuit connecting the eastern and western halves of the island. REE is responsible for operating and maintaining the electrical transmission system in Spain, including the circuit on the island that connects Los Llanos de Aridane and Los Guinchos. Electricity demand is evenly distributed between the two substations, with the main population centers (Santa Cruz de La Palma and Los Llanos de Aridane) having similar demographic densities and proximity to the substations.
This transmission line is a critical point in the energy system, as any incident can lead to power outages for half of the population, or in the worst case, a total blackout across the island, as occurred in 2009 and 2010. In the 2009 event, the power supply was interrupted for six hours due to the unintentional closure of a grounded disconnector, which triggered a three-phase short circuit in the substation and the disconnection of the connected generation [33].
The island’s distribution network is owned by Endesa Distribución and consists of a mesh network of lines with voltage levels of 30 kV and lower, with a total length of 395 km. These lines run through urban areas and municipalities, forming electrical rings to help ensure supply in the event of a breakdown at any point in the network. However, the distribution lines were unable to cope with incidents that occurred in previous years.
The island’s generation mix is predominantly thermal [34]. In total, 89.7% of the installed power on the island comes from the Los Guinchos thermal power plant, located on the outskirts of the capital and a few meters from the substation to which it is connected, which shares the same name. Currently, the plant consists of ten diesel units and a mobile gas turbine, which comes into service only in peak demand situations or to solve serious contingencies in the network.
Installed wind power constitutes only 5.9% of the island’s total generation and is represented by four wind farms connected to the medium voltage distribution network, in areas where the potential for wind exploitation is high but located far from the central transmission axis. These wind farms were installed to supply energy to the most sparsely populated areas, so their contribution to the transmission network is limited.
The remaining 4.4% of generation is produced by photovoltaic energy, including isolated and self-consumption installations connected to the grid [35]. Notably, this capacity has doubled in recent years in homes and public buildings on the island.
Table 2 lists the thermal groups and wind farms currently installed in the electrical system, including the net nominal power of each and the minimum values for entry into operation.

2.2. REE Horizon Energy Plan (2026) Reinforcement of La Palma Grid

The planning of energy transmission infrastructure involves the evaluation, design and execution of policies and strategies to guarantee electricity supply during periods of high demand, at the lowest possible cost, while minimizing environmental impact [37]. It is the regulatory mechanism that adapts the development needs of the transmission network. Energy planning in Spain is based on forecasts about future demand behavior, required energy resources and environmental protection criteria.
The latest Development Plan for 2021–2026 establishes the need for reinforcing existing infrastructure and creating new facilities to advance the ecological transition, ensuring supply while considering environmental protection and economic efficiency [37].
Within the new actions of the plan, REE highlights an initiative to improve the quality and security of supply on the island of La Palma (SdS_ICA_2), currently consisting of a single circuit whose resilience was tested during the volcanic eruption of 2021. The current network does not meet the basic security criteria of the transmission network [38], which require the system to withstand simple N-1 failures without affecting the quality and security of the electricity supply. The approved action for creating a ring on the island includes the following developments: (1) New substation (ST Breñas) of 66 kV with a breaker-and-a-half arrangement, and new positions for connecting renewable generation in the southern area of the island, which has great wind potential. The new substation will support the distribution network due to high demand from large consumers. (2) Entry/exit of the current line (ST Llanos–ST Guinchos 66 kV) at ST Las Breñas. (3) A new line from ST Guinchos to ST Breñas (66 kV). (4) A new line from ST Llanos to ST Breñas (66 kV).
Furthermore, these actions will be essential for the construction of an additional substation (ST Fuencaliente) after 2026 at the entry/exit of the ST Llanos–ST Breñas 66 kV line, with additional positions for connecting more renewable generation in the southern area [39].
Figure 1 shows the route of the current transmission grid and the planned routes for future lines, scheduled for construction and commissioning in 2025 [27]. The second circuit will be installed along the southern part of the island, connecting the Breñas and Llanos substations. Two independent lines will also be connected between Breñas and Guinchos. The image also shows the wind farms currently in operation, categorized by their generation control technology: Type I for fixed-speed turbines and Type IV for variable-speed turbines. Additionally, REE has planned the installation of several wind farms that will be connected to the positions at the new Breñas substation. The request for administrative authorization, environmental impact assessment and declaration of public utility for these projects (Llano del Tanque [40], El Jaral [41] and Garafía II [42] wind farms) was published in the Official Gazette of the Canary Island Autonomous Community several years ago and has already undergone public consultation. These wind farms are shown in white in Figure 1.

3. Materials and Methods

This section describes the simulation software tool used in the study, the dynamic models of the generators under investigation, the characteristics and considerations of the model developed for the La Palma transmission network and an overview of the simulated scenarios. These scenarios aim to replicate a series of incidents in the network and evaluate the electrical system’s response to these disturbances. The objective of the last section is to present the sequence of phenomena and maneuvers that occur during the simulation for each of the scenarios presented.

3.1. Simulation Tool Used—PSS®E (v34)

PSS®E is an electrical system simulation software tool developed by Siemens Power Technologies International and widely used in the electrical industry for a broad range of analyses, studies of analyses and studies related to power system operation, stability and optimization [43]. The tool’s main functionalities include load flow analysis, optimal power flow (OPF), transient stability studies, contingency analysis and economic dispatch.
To model the transient behavior of electrical systems and assess their dynamic stability, PSS®E (v34) provides a library of models representing various network components, particularly power generation systems. The tool enables users to configure model parameters to accurately reflect the real characteristics of the equipment being simulated.
Load flow analysis is essential for electrical network planning and for designing system expansions aimed at operational conditions. In this study, power flows were solved using the Newton–Raphson method implemented in PSS®E (v34), which linearizes nonlinear equations to reduce the number of iterations needed to reach a solution. The simulation results include the magnitude and angle of voltage at all system buses, as well as the active and reactive power flows in all transmission lines [44].
The tool’s dynamic behavior module enables the simulation of the electrical system’s transient response to various events, which is critical for anticipating potential anomalies in the network. Each generation unit in PSS®E requires a model that accurately represents its behavior during the simulation.
The use of PSS®E (v34) for this study is particularly appropriate given its widespread application in transmission system analysis and its proven reliability in evaluating transient stability, fault responses and dynamic behavior of power systems. Despite its limitations in EMT-level modeling, PSS®E allows for accurate representation of the key dynamic phenomena affecting the stability of weakly meshed island grids like La Palma’s.
Table 3 presents the dynamic models selected based on the types of generation in the island´s grid. The parameters for diesel models (Woodward model) were configured according to [45,46], and the model for representing the synchronous generation corresponds to a salient pole synchronous machine with quadratic saturation, defined by the Institute of Electrical and Electronics Engineers (IEEE) [47], which has been implemented in several high-profile projects. Wind simulation models vary according to wind turbine technology. Per the IEC 61400-27-1 standard, wind generators are classified into four types based on speed and power control. La Palma’s energy system includes two types: fixed speed (Type I), equipped with induction generators (now obsolete); and fully variable speed (Type IV), which typically uses permanent magnet synchronous generators connected to full-bridge back-to-back converters, enabling full control over active and reactive power.
The dynamic parameters for Type I and Type IV wind turbines in this study were configured based on guidelines and research developed by the Western Electricity Coordinating Council Modeling and Validation Work Group (WECC). This research responds to the growing need for reliable wind models for transmission grid planning studies, in response to the limited industry experience with dynamic modeling until recent years [48,49]. The specific model parameters applied to each generation unit in the simulations are detailed in Appendix A.
Table 3. Dynamic models selected from the PSS®E (v34) library. Source: own elaboration.
SystemModelDescription
Diesel generation units
GeneratorGENSALThe model represents a salient pole synchronous generator with quadratic saturation in d-axis.
Turbine governorDEGOVDEGOV model is used to represent diesel engine governors, for transient modeling studies of diesel electric generators [50].
Excitation systemEXBASThe EXBAS model represents an AC excitation standard system with rotating diodes and non-controlled rectifiers [4].
Wind turbines—Type I
GeneratorWT1G1This model is used to represent induction generators of fixed-speed wind turbines [51] directly connected to the grid. It considers rotor flux dynamics and can be used for single and double cage machines.
Mechanical modelWT12T1The WT12T1 model computes the speed deviations produced on the rotor and on blade sides of the wind turbine [51].
Wind turbines—Type IV
GeneratorREGCA1The REGCA1 model was developed to simulate a wind generator connected to the grid via power converter (full-variable speed) [49]. This module incorporates a current regulator that injects real and reactive current based on current commands.
Electrical controlREECA1REECA1 emulates active and reactive power controls implemented in the wind turbine converter. It provides alternatives for active power control (constant power factor) and reactive power reference [49].

3.2. Grid Model Development

Modeling an electrical grid is a complex task that involves adjusting multiple physical, technical and operational aspects to accurately replicate the real behavior of the electrical system. Therefore, it is important that the input data for the simulation be as close to reality as possible, although this can sometimes be challenging due to factors such as the confidentiality of certain manufacturer data or the difficulty in modeling all the variables that influence real conditions. This subsection discusses the main considerations when representing certain aspects of the island’s transmission system.
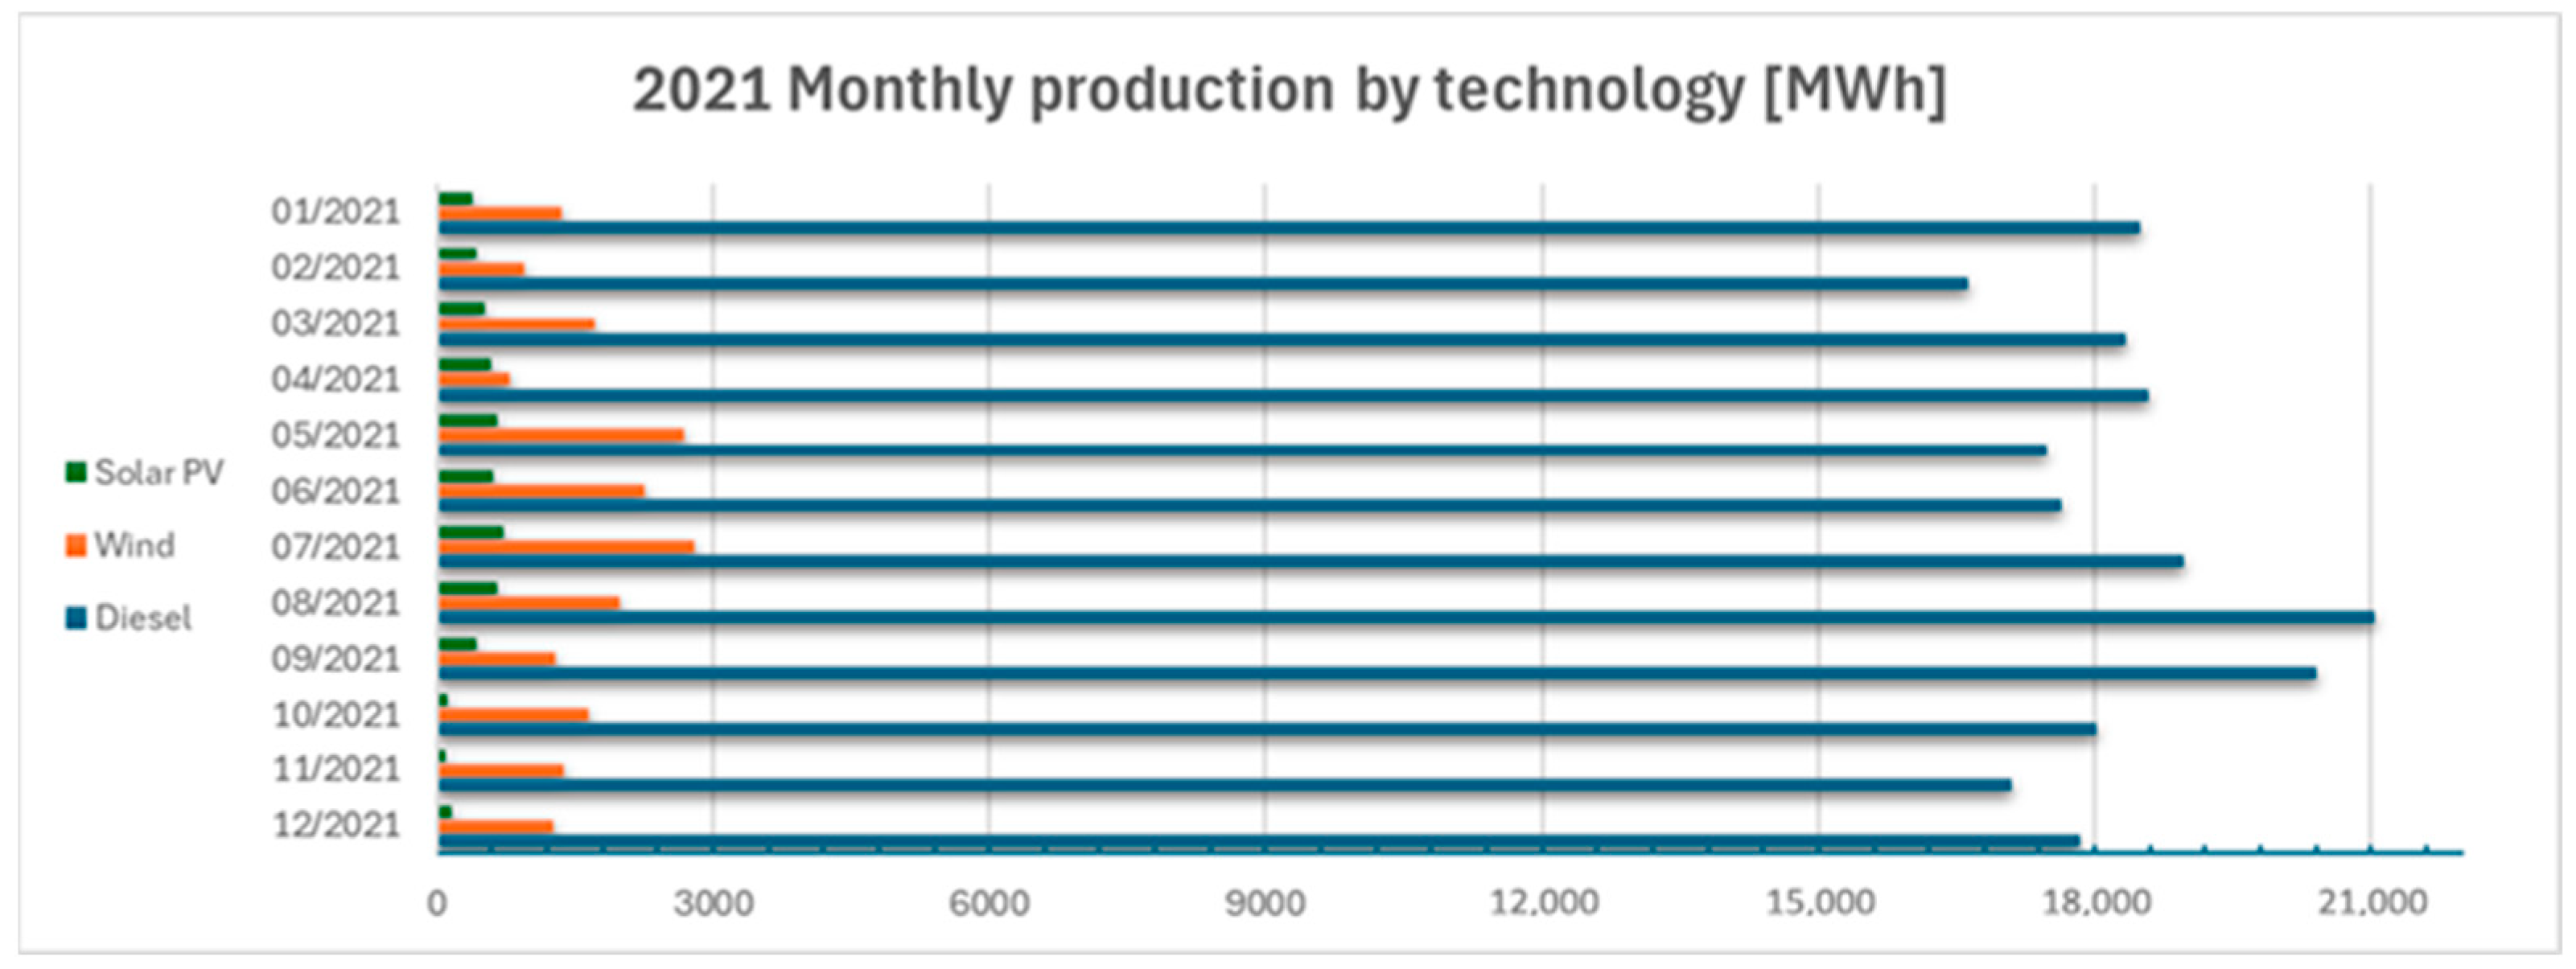
The bar graph in Figure 2 shows energy production by technology throughout the year 2021. The annual production peak was 44.5 MW, occurring on August 17 at 10:15 p.m., coinciding with the month of highest energy demand due to the high influx of tourists and increased cooling system usage during the high temperatures recorded. This scenario has been chosen for the simulations, as it represents the worst case in the event of transmission network failures.
Diesel generation on that day accounted for 91.16% of the total [52], meaning that demand could be covered by the 11.5 MW and 11.2 MW units (see Table 2). However, as specified in REE’s operating procedures, the generators in operation must be capable of supplying the power output of the largest capacity generator, in case of its disconnection from the grid due to an emergency. For this reason, the start-up of certain lower power units has been included in the simulations. An identical load factor has also been considered for all generators in operation.
Additionally, the planned location and main characteristics (connection point, rated power, voltage level, generator speed control method, etc.) of both the currently operational and planned wind farms have been incorporated into the simulation model. The location of these farms is shown on the map in Figure 1. The participation of these plants in the generation mix will depend on the network modeled in the simulation, and this information is provided in Section 3.3. Solar generation has not been included in this model since most of it is for self-consumption and its contribution to the generation mix is minimal.
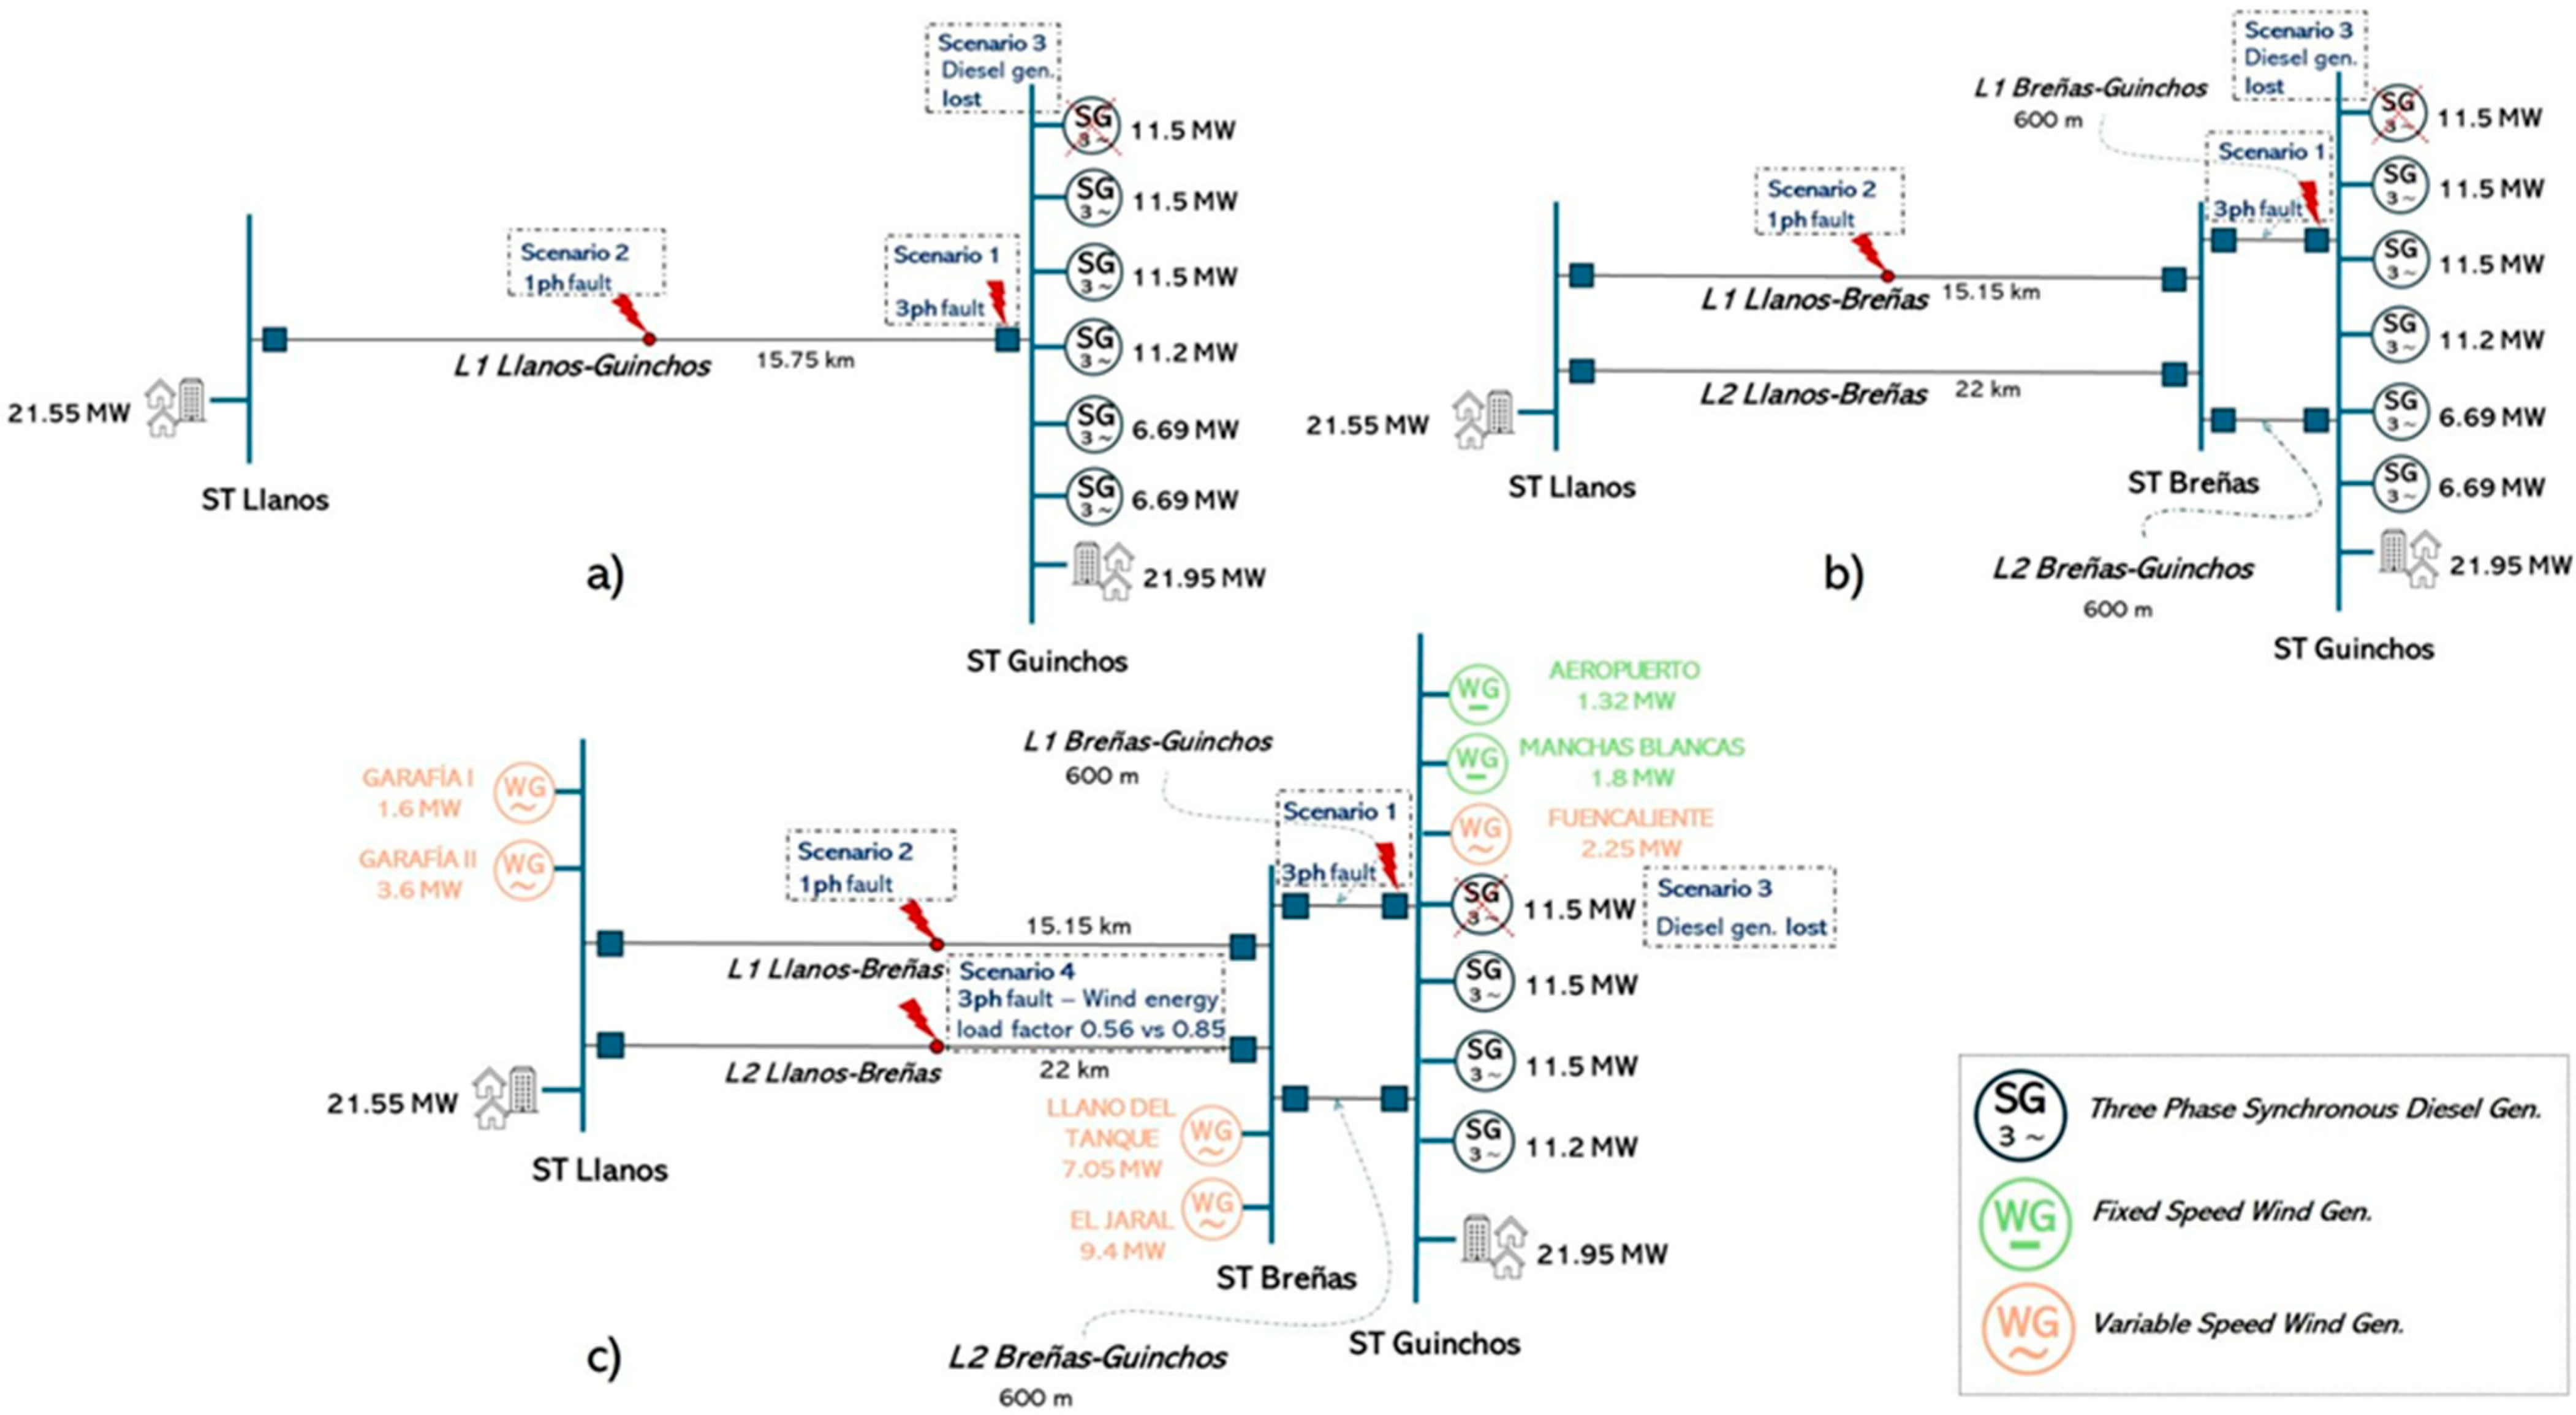
The current 66 kV transmission line, which runs between the Los Guinchos thermal power plant and the Llanos de Aridane substation, is 15.75 km long and is supported by 60 pylons distributed along steep terrain, especially in the central area of the island [53]. The conductor model is LARL-280-HAWK, whose direct and zero sequence electrical parameters are detailed in [54]. The new lines to be built, whose lengths are shown in Figure 3, will have the same characteristics as the current line, according to the environmental document prepared by REE [38].
To distribute the island demand between the two transmission substations (Llanos and Guinchos), the population distribution of the municipalities [29] served by each substation has been taken into account. The municipalities of the western half of the island will be fed by the Llanos substation (21.55 MW), while the easternmost municipalities (21.95 MW) will be connected to the Guinchos substation. A power factor of 0.98 has been set for the system loads.
Figure 2. Energy production in the La Palma power system in 2021: generation sources include diesel, wind and solar PV [55].
Processes 13 02374 g002

3.3. Simulation Scenarios

In this article, three different electrical networks are modeled with the aim of assessing the energy resilience of the new grid infrastructure that REE plans to upgrade in the coming years. Figure 3 presents a diagram of each of the networks modeled in the PSS®E (v34) software. Regarding the simulation scenarios, the diagram also identifies the location of each disturbance: Scenario 1 involves a three-phase fault at a substation; Scenario 2, a single-phase fault on a transmission line; Scenario 3, the disconnection of a diesel generator; and Scenario 4, a three-phase fault on a line under two different wind load factor conditions (0.56 and 0.85).
Figure 3. Network schemes modeled in PSS®E (v34): (a) actual (2024); (b) future proposal (2025); (c) future proposal + wind generation. Additionally, the location of the disturbances from the simulation scenarios are represented. The diesel generation units connected to the ST Guinchos busbar (“SG 3∼” in the figure) are represented, as well as the demand (primarily residential) associated with each substation, depicted using house-shaped symbols. The segments between busbars represent the electrical lines of each grid (with indications of line names and lengths), and its corresponding line switchgears represented as squares. Source: own elaboration.
Processes 13 02374 g003
Using actual diesel generation data from the peak demand day in 2021, it was assumed that all diesel generators were operating with a load factor of 0.754. This assumption applies to both networks “a” and “b”, where no contribution from renewable energy sources is considered.
In contrast, for network “c”, the recorded wind power output at the same moment was 3.9 MW. In this simulation, all wind turbines—both existing and planned—are assumed to operate under uniform loading conditions. With a total real installed wind capacity of 6.97 MW, this results in an average wind load factor of 0.56 during the peak demand day. This factor is applied across all wind generation units considered in the model.
The contribution of wind energy in network “c” allows for the partial displacement of diesel generation. Specifically, the two 6.69 MW diesel units are taken offline, and only four diesel generators (three units of 11.5 MW and one unit of 11.2 MW) remain in service. This reduced diesel fleet operates with a lower load factor of 0.65, due to the support provided by wind generation.
For clarity, Table 4 summarizes the distribution of generation across the three network configurations, highlighting how the total island demand is met in each case. Notably, the inclusion of wind generation in network “c” provides an instantaneous output of 15.13 MW, enabling a 33% reduction in diesel-based generation compared to scenarios without renewable integration.

3.3.1. Steady State

The calculation of power flows and short circuits in transmission lines is crucial for decision-making in the planning and integration of distributed generation into the electrical grid [56]. In this research, power flow is calculated for each of the three grids under study, with a focus on evaluating voltage stability at the electrical nodes. The short-circuit level (both three-phase and single-phase) is also assessed for each of the island’s current and planned substations.

3.3.2. Scenario 1—Three-Phase Fault on Substation Busbar

In this first scenario, a three-phase short circuit resulting from a failure in one of the line switchgears at the Guinchos substation is simulated. The fault occurs at t = 1 s and lasts until instant t = 1.2 s, at which point the switchgear protections detect the fault and disconnect the corresponding line. The simulation continues until t = 10 s to evaluate frequency and voltage stability in the substations of each grid.

3.3.3. Scenario 2—Single-Phase Fault in the Middle of the Line

Figure 4 shows a section of the actual transmission line in the central area of the island. The terrain in this part of the network is rugged, and under adverse weather conditions, trees can fall, triggering single-phase or three-phase faults and interrupting service for several hours, especially due to the difficulty of accessing and repairing the breakdown.
In this simulation, a single-phase fault is induced at the midpoint of the existing “ST Llanos-ST Guinchos 66 kV” circuit. For networks “b” and “c”, shown in Figure 3, note that almost the entire “ST Llanos-ST Breñas 66 kV” line will share the existing infrastructure to connect to the new substation, so the fault in both grids is simulated at the same midpoint.
The occurrence and clearance of the single-phase fault follow the same timing as in Scenario 1. The voltage and frequency recorded at both substations are the variables compared across the three projected networks.

3.3.4. Scenario 3—Loss of a Diesel Unit

Electrical transmission systems must be prepared to react instantly to a potential generator outage. This is especially critical in weak networks like La Palma, where the impact of such failures has been observed on several occasions. In this scenario, the loss of one of the highest-capacitydiesel generators (11.5 MW) is simulated, and the response of the remaining diesel units and wind generators in the network to this event is evaluated.

3.3.5. Scenario 4—Loss of a Wind Unit

The penetration of wind energy in this study is low compared to its nominal capacity. As shown in Figure 2, August was not one of the most productive months in terms of wind potential. In this final scenario, a three-phase fault is simulated at the midpoint of the new “ST Llanos-ST Breñas 66 kV” circuit, and the stability of the network is compared between a situation with a wind load factor of 0.56 and another with a factor of 0.85. The objective is to evaluate the grid’s resilience when renewable generation increases.

4. Results

4.1. Steady State

The results of the power flow and short-circuit analyses of each of the networks are shown in Table 5. In a peak demand scenario like this, from the perspective of voltage profile, the installation of the new circuit between Guinchos and Llanos de Aridane has a positive impact. The voltage at the Llanos substation, as determined by the power flow analysis, is already quite stable in the current network, but after the expansion, it increases by 0.38 kV. Moreover, even with the connection of wind power, the voltage value comes even closer to the nominal level.
On the one hand, beyond providing voltage stability, the new line reduces active power losses, alleviates line congestion and supports the integration of additional renewable generation. However, the greatest benefit is the one also highlighted by the EC in its study [26]. Before the expansion, the grid could not comply with the N-1 security criterion, and the entire island’s electricity supply could be lost in the event of a failure. After the expansion, a failure in the circuit would not result in a loss of supply for the loads connected to the Llanos substation.
On the other hand, the addition of the new line decreases the network’s equivalent impedance. This leads to a higher short-circuit ratio at the point of interconnection with the Llanos substation node, and, consequently, greater system strength. In general, as the impedance between two substations increases, less severe disturbances are required to shift them out of phase. As seen in Table 5, the maximum three-phase short-circuit current at Llanos increases from 2.37 kA to 2.57 kA.
However, with the integration of wind generation, the maximum three-phase short-circuit current is reduced at all three nodes of the network. This occurs because the power electronics in wind inverters are not designed to provide the same level of fault current as synchronous generators, such as those in a diesel plant. Typically, synchronous generators can supply fault currents between 5 and 6 times their nominal value for a short duration, whereas wind or photovoltaic inverters generally do not exceed 1.5 times nominal capacity [57]. Inverters self-limit their output current to protect their electronic switching components. Operating above this limit would require hardware modifications, which incur significant costs.
In this case, the contribution of renewable generation reduces the need for diesel units to meet demand, so the unnecessary units are taken out of service to maximize profitability. As a result, lower three-phase short-circuit values are observed on the busbars.

4.2. Scenario 1

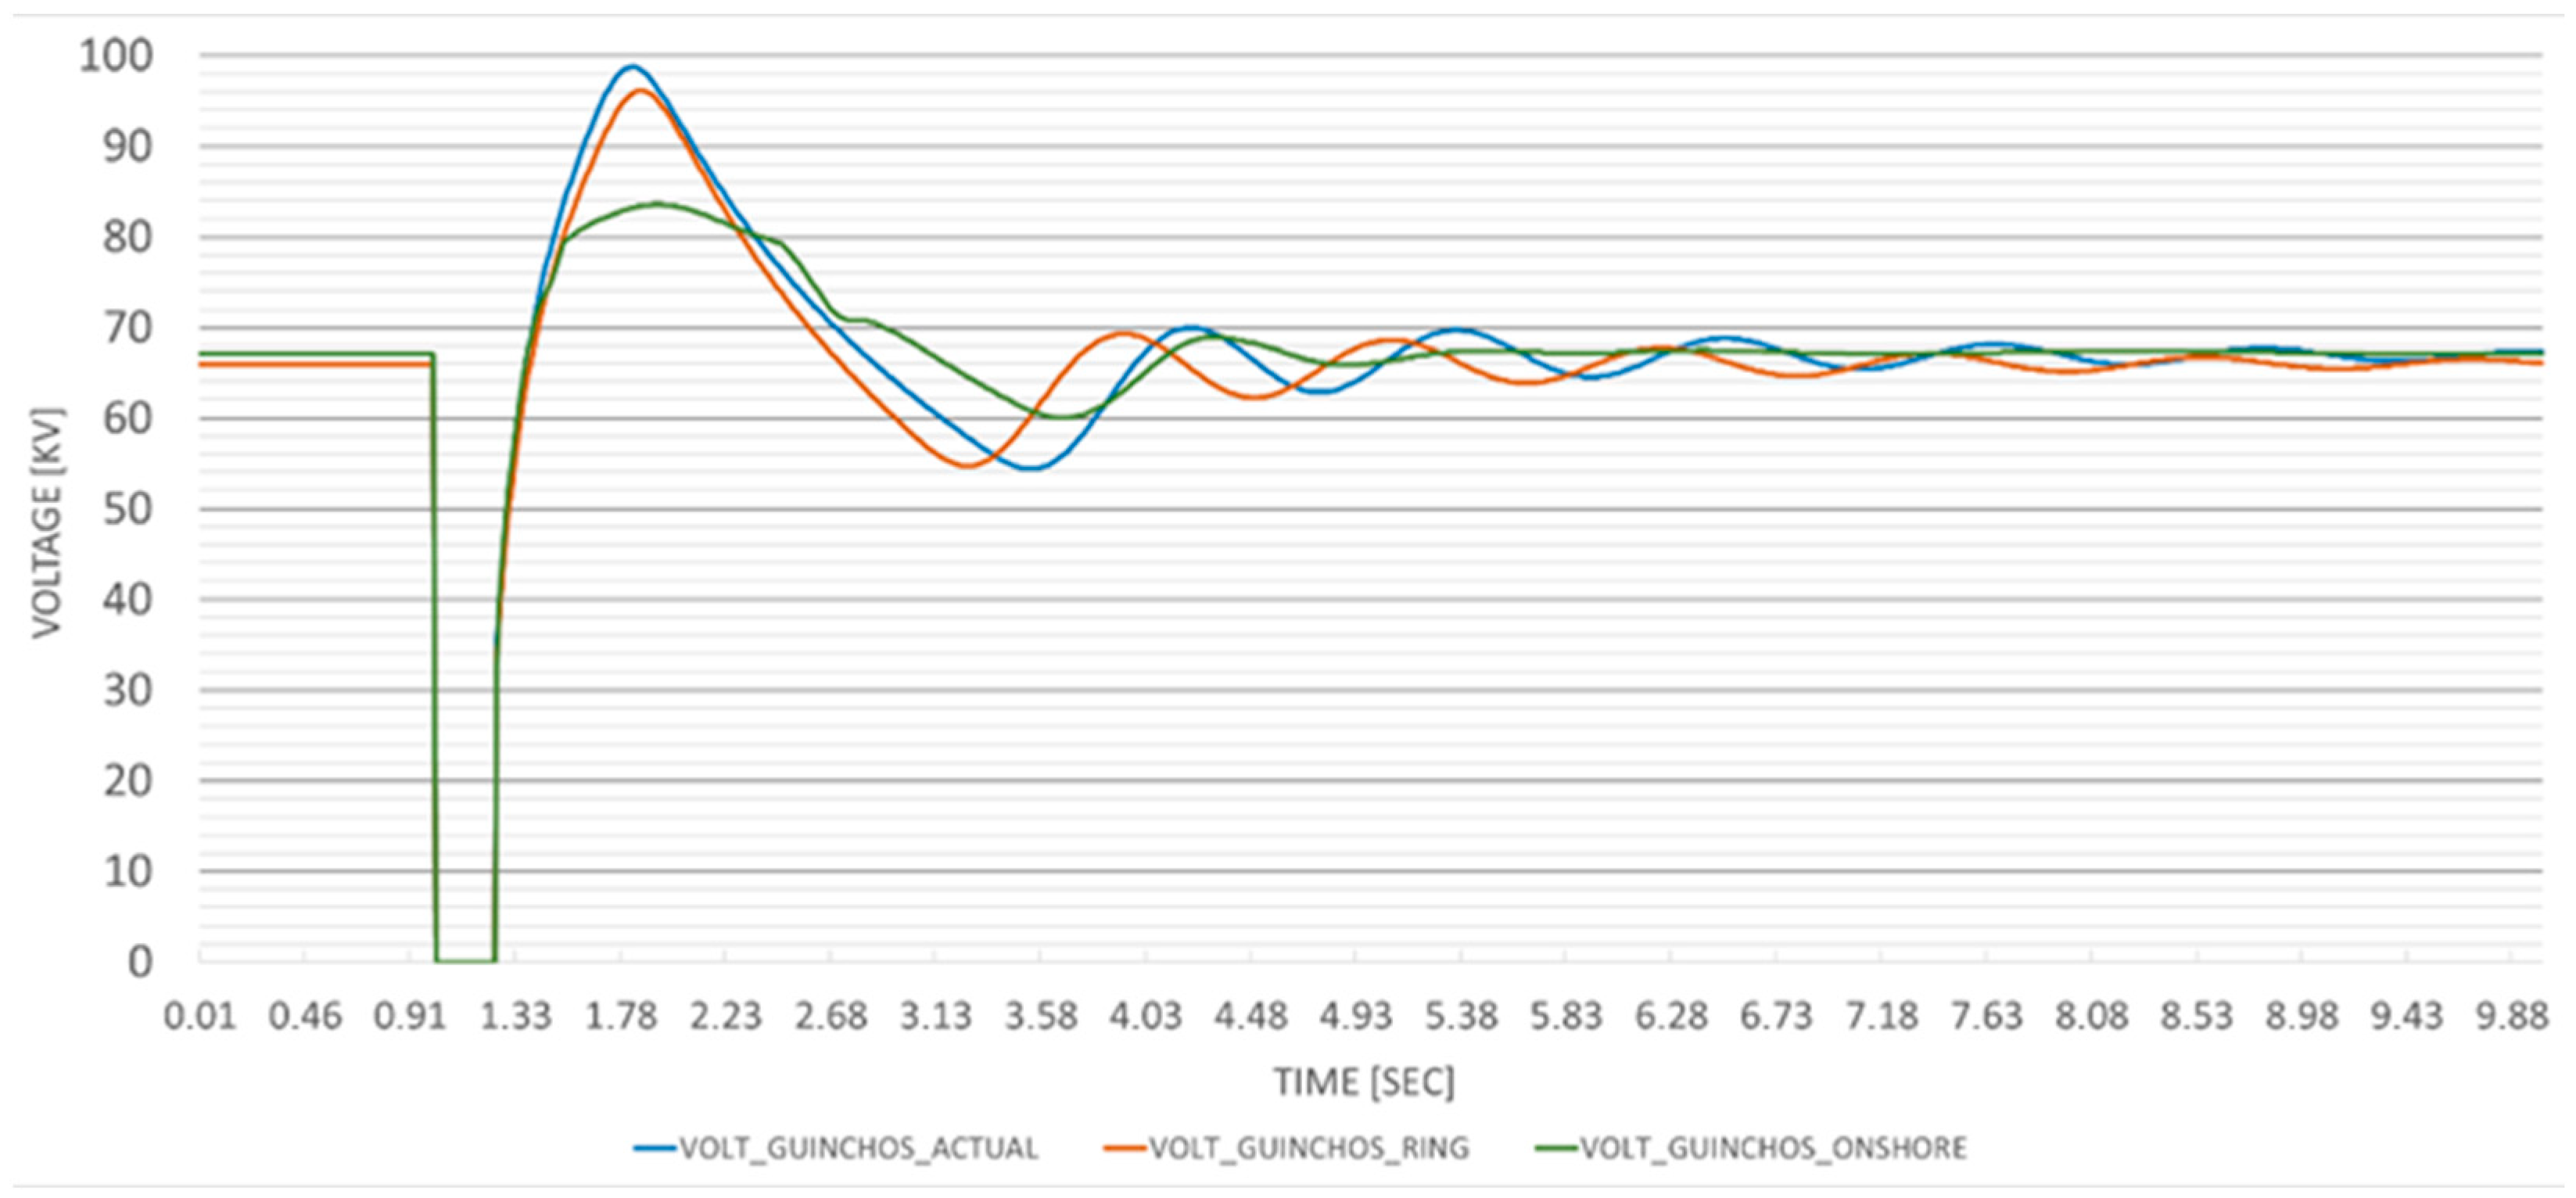
In the current transmission grid, a fault in the line switchgear at one of the substations causes a loss of service at the opposite end of the network. In this simulation, the failure at the Guinchos substation results in the consumption connected to the Llanos substation going out of service.
The frequency record at the Llanos substation of the ringed network (orange curve in Figure 5) shows a minimum value of 34 Hz, which would trigger the low-frequency protection. However, since this phenomenon lasts less than 100 ms, it could be mitigated by adjusting the timing of the protection to prevent an unnecessary trip. This event occurs due to an instantaneous imbalance between generation and consumption at Llanos substation during the fault, which is quickly corrected by the action of the diesel turbine speed regulator.
In the network with renewable generation (green curves), the frequency oscillation during the fault is more pronounced compared to the other two networks. This is due to the reduced inertial response, as the synchronous generation from some diesel units is replaced by wind generators.
As shown in Figure 6 (blue curve), the voltage at the Guinchos busbar reaches a transient value near 100 kV, which gradually stabilizes at the nominal value. Meanwhile, the frequency at the Guinchos substation remains at 51 Hz due to excess generation after losing half of the island’s consumption.
This scenario highlights how replacing synchronous generation with wind generation reduces system inertia, intensifying both the depth and rate of frequency decline during faults. Additionally, lower short-circuit currents from wind turbines, compared to synchronous machines, could degrade fault detection performance, delaying the clearing of faults and complicating protection scheme design.

4.3. Scenario 2

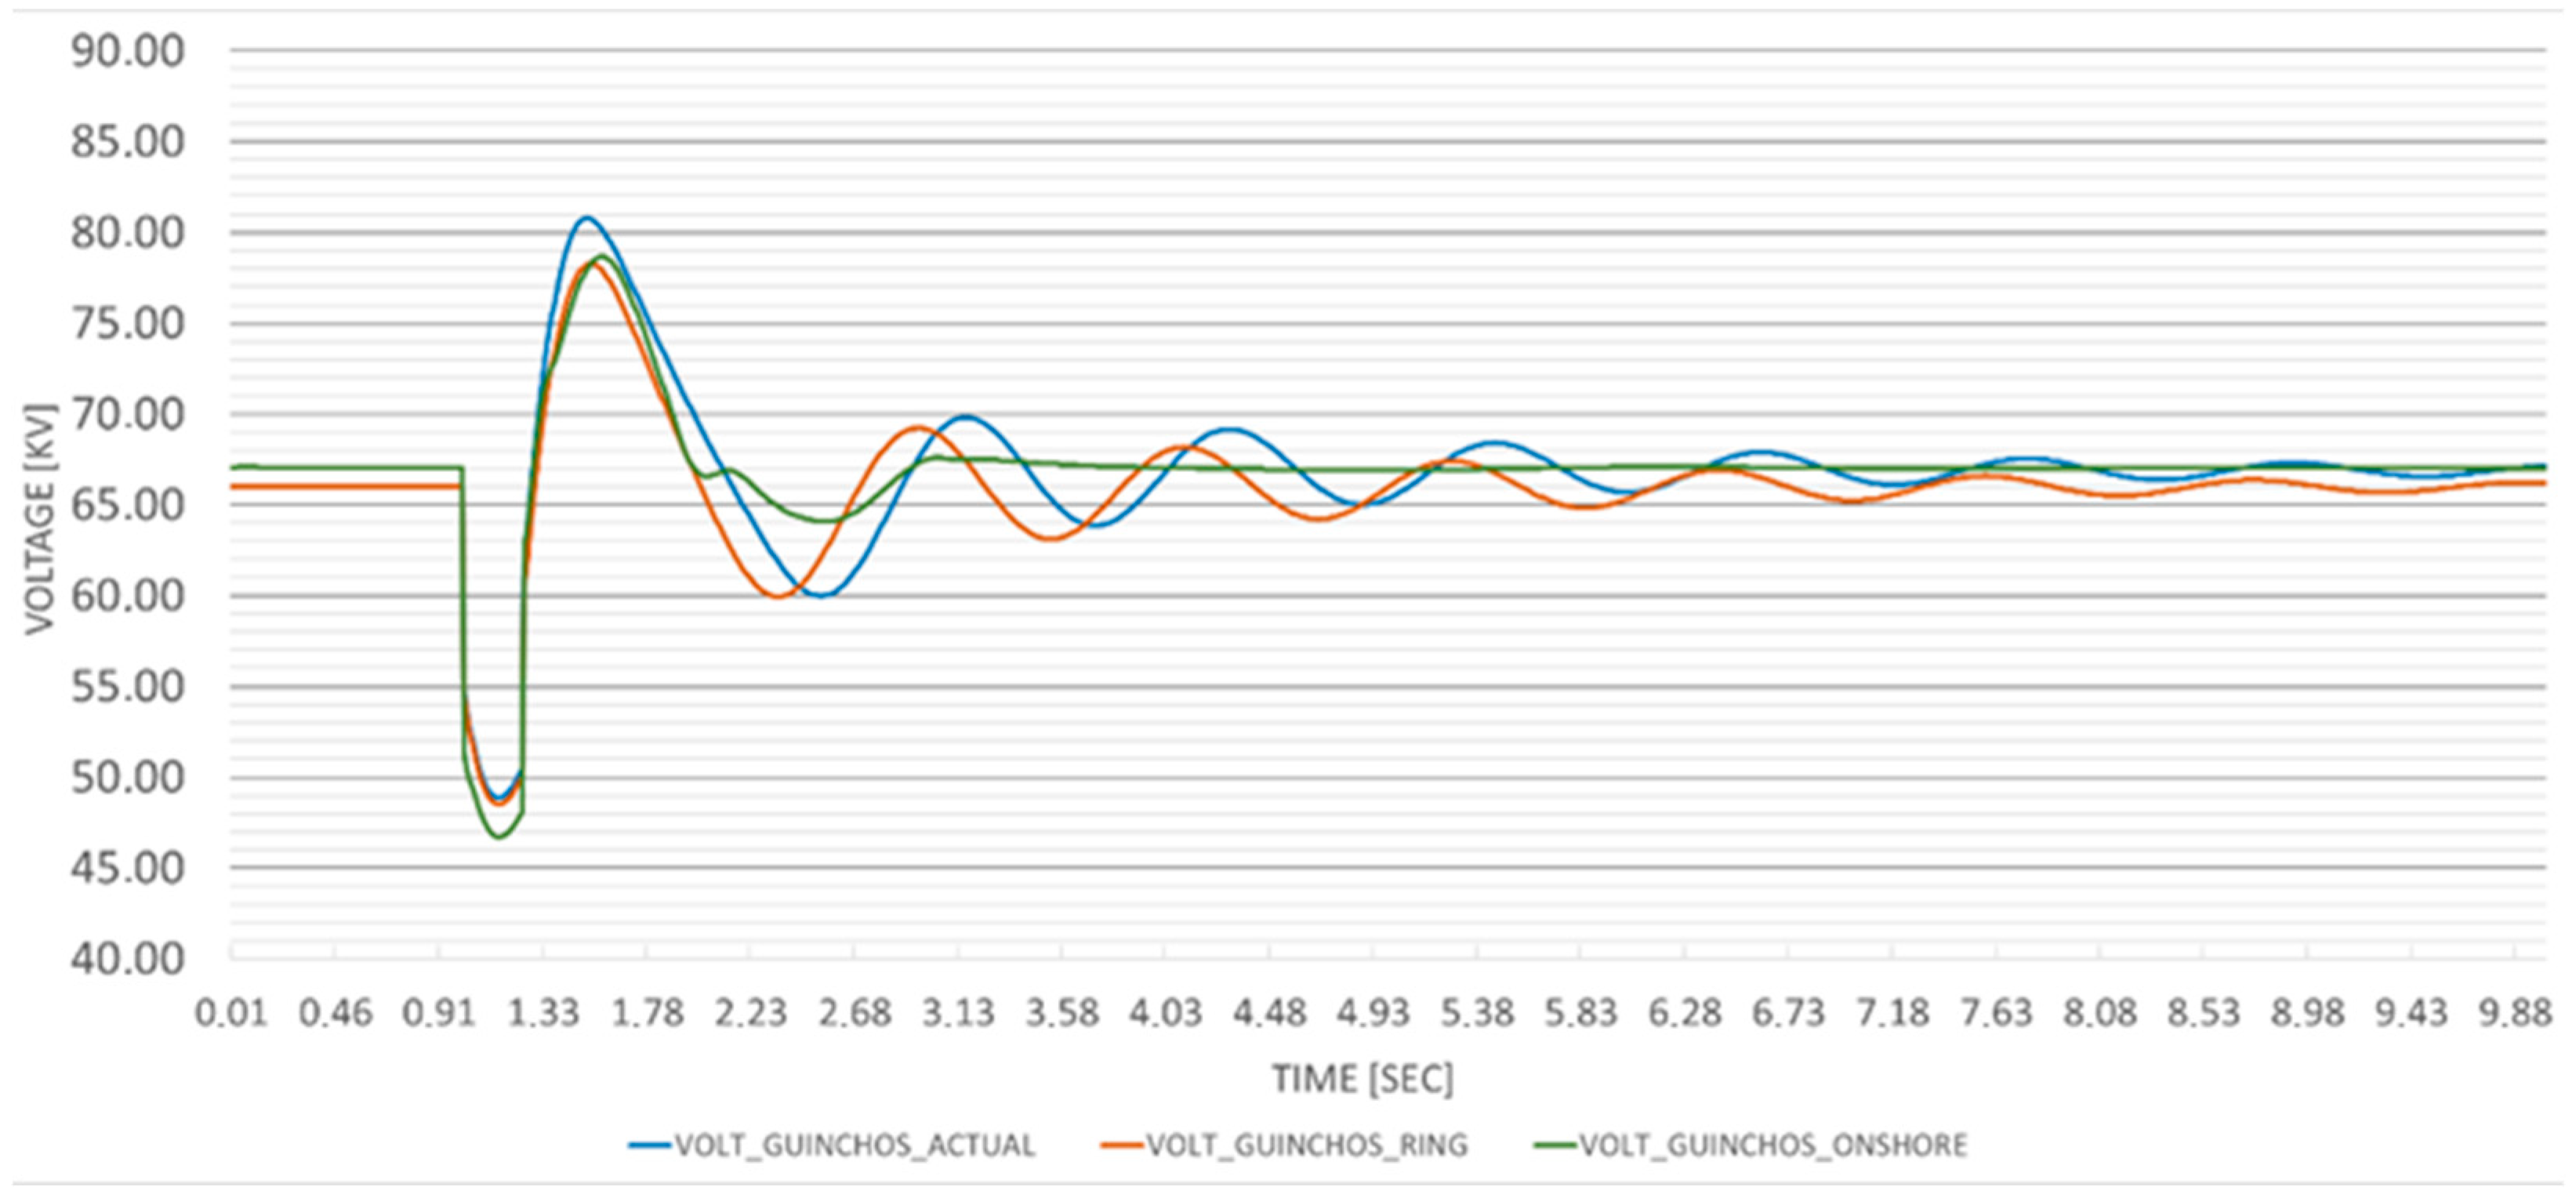
As expected, the single-phase fault causes milder disturbances than in the previous scenario, in both the ring and wind-powered networks. The frequency oscillations in both networks follow a very similar pattern, with transient values that do not drop below 49.5 Hz after the faulty circuit is opened (Figure 7). Regarding the voltage measured at the Guinchos substation (Figure 8), stabilization in the wind-powered grid occurs in less than 3 s, whereas in the ring and current grids, the voltage curves continue to oscillate slightly at the end of the simulation.
Even in this less severe fault scenario, the high-wind system responds faster—but with reduced damping—due to lower inertia. Moreover, the lower fault current contribution from wind turbines may hinder detection and clearing of faults. While voltage recovery is quicker in the wind-rich system, frequency stability is more vulnerable to disturbances due to the lack of rotational mass.

4.4. Scenario 3

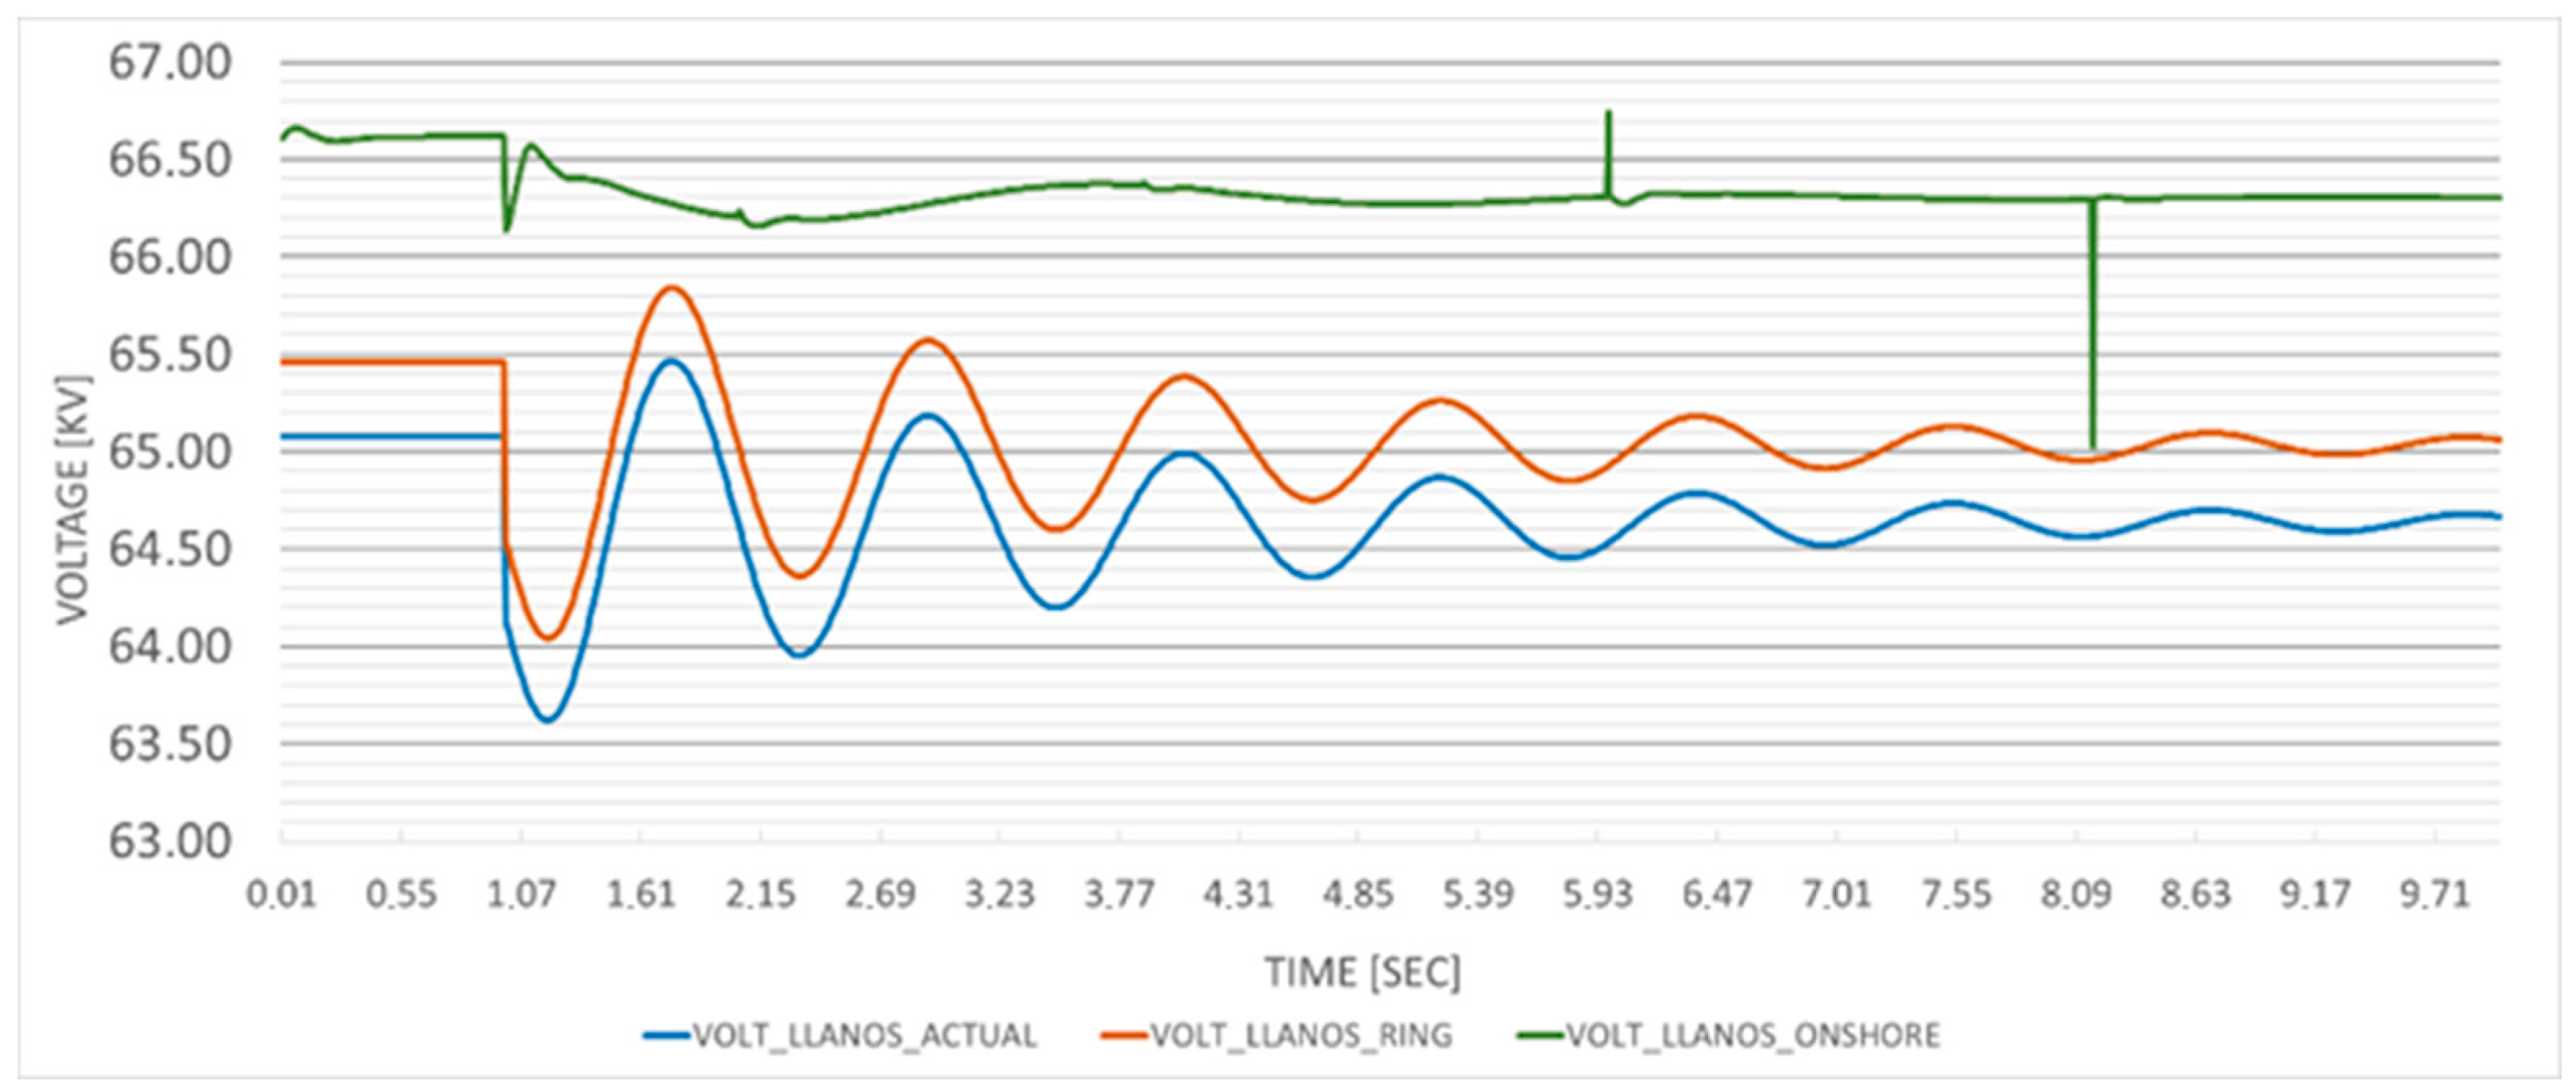
Figure 9 shows the voltage recorded at the Llanos substation following the loss of one of the 11.5 MW diesel units, for all three networks under study. The voltage evolution is very similar in the actual and ring networks. In both cases, it decreases to no less than 0.96 p.u, before stabilizing around the nominal voltage of 66 kV.
In the wind-powered grid, the voltage remains stable throughout the fault, with only minor transient fluctuations. This behavior is due to the electronic converters in the wind turbines, which respond rapidly to sudden changes in generated energy, keeping voltage within a narrower range. Voltage regulation is achieved by controlling both active and reactive power output.
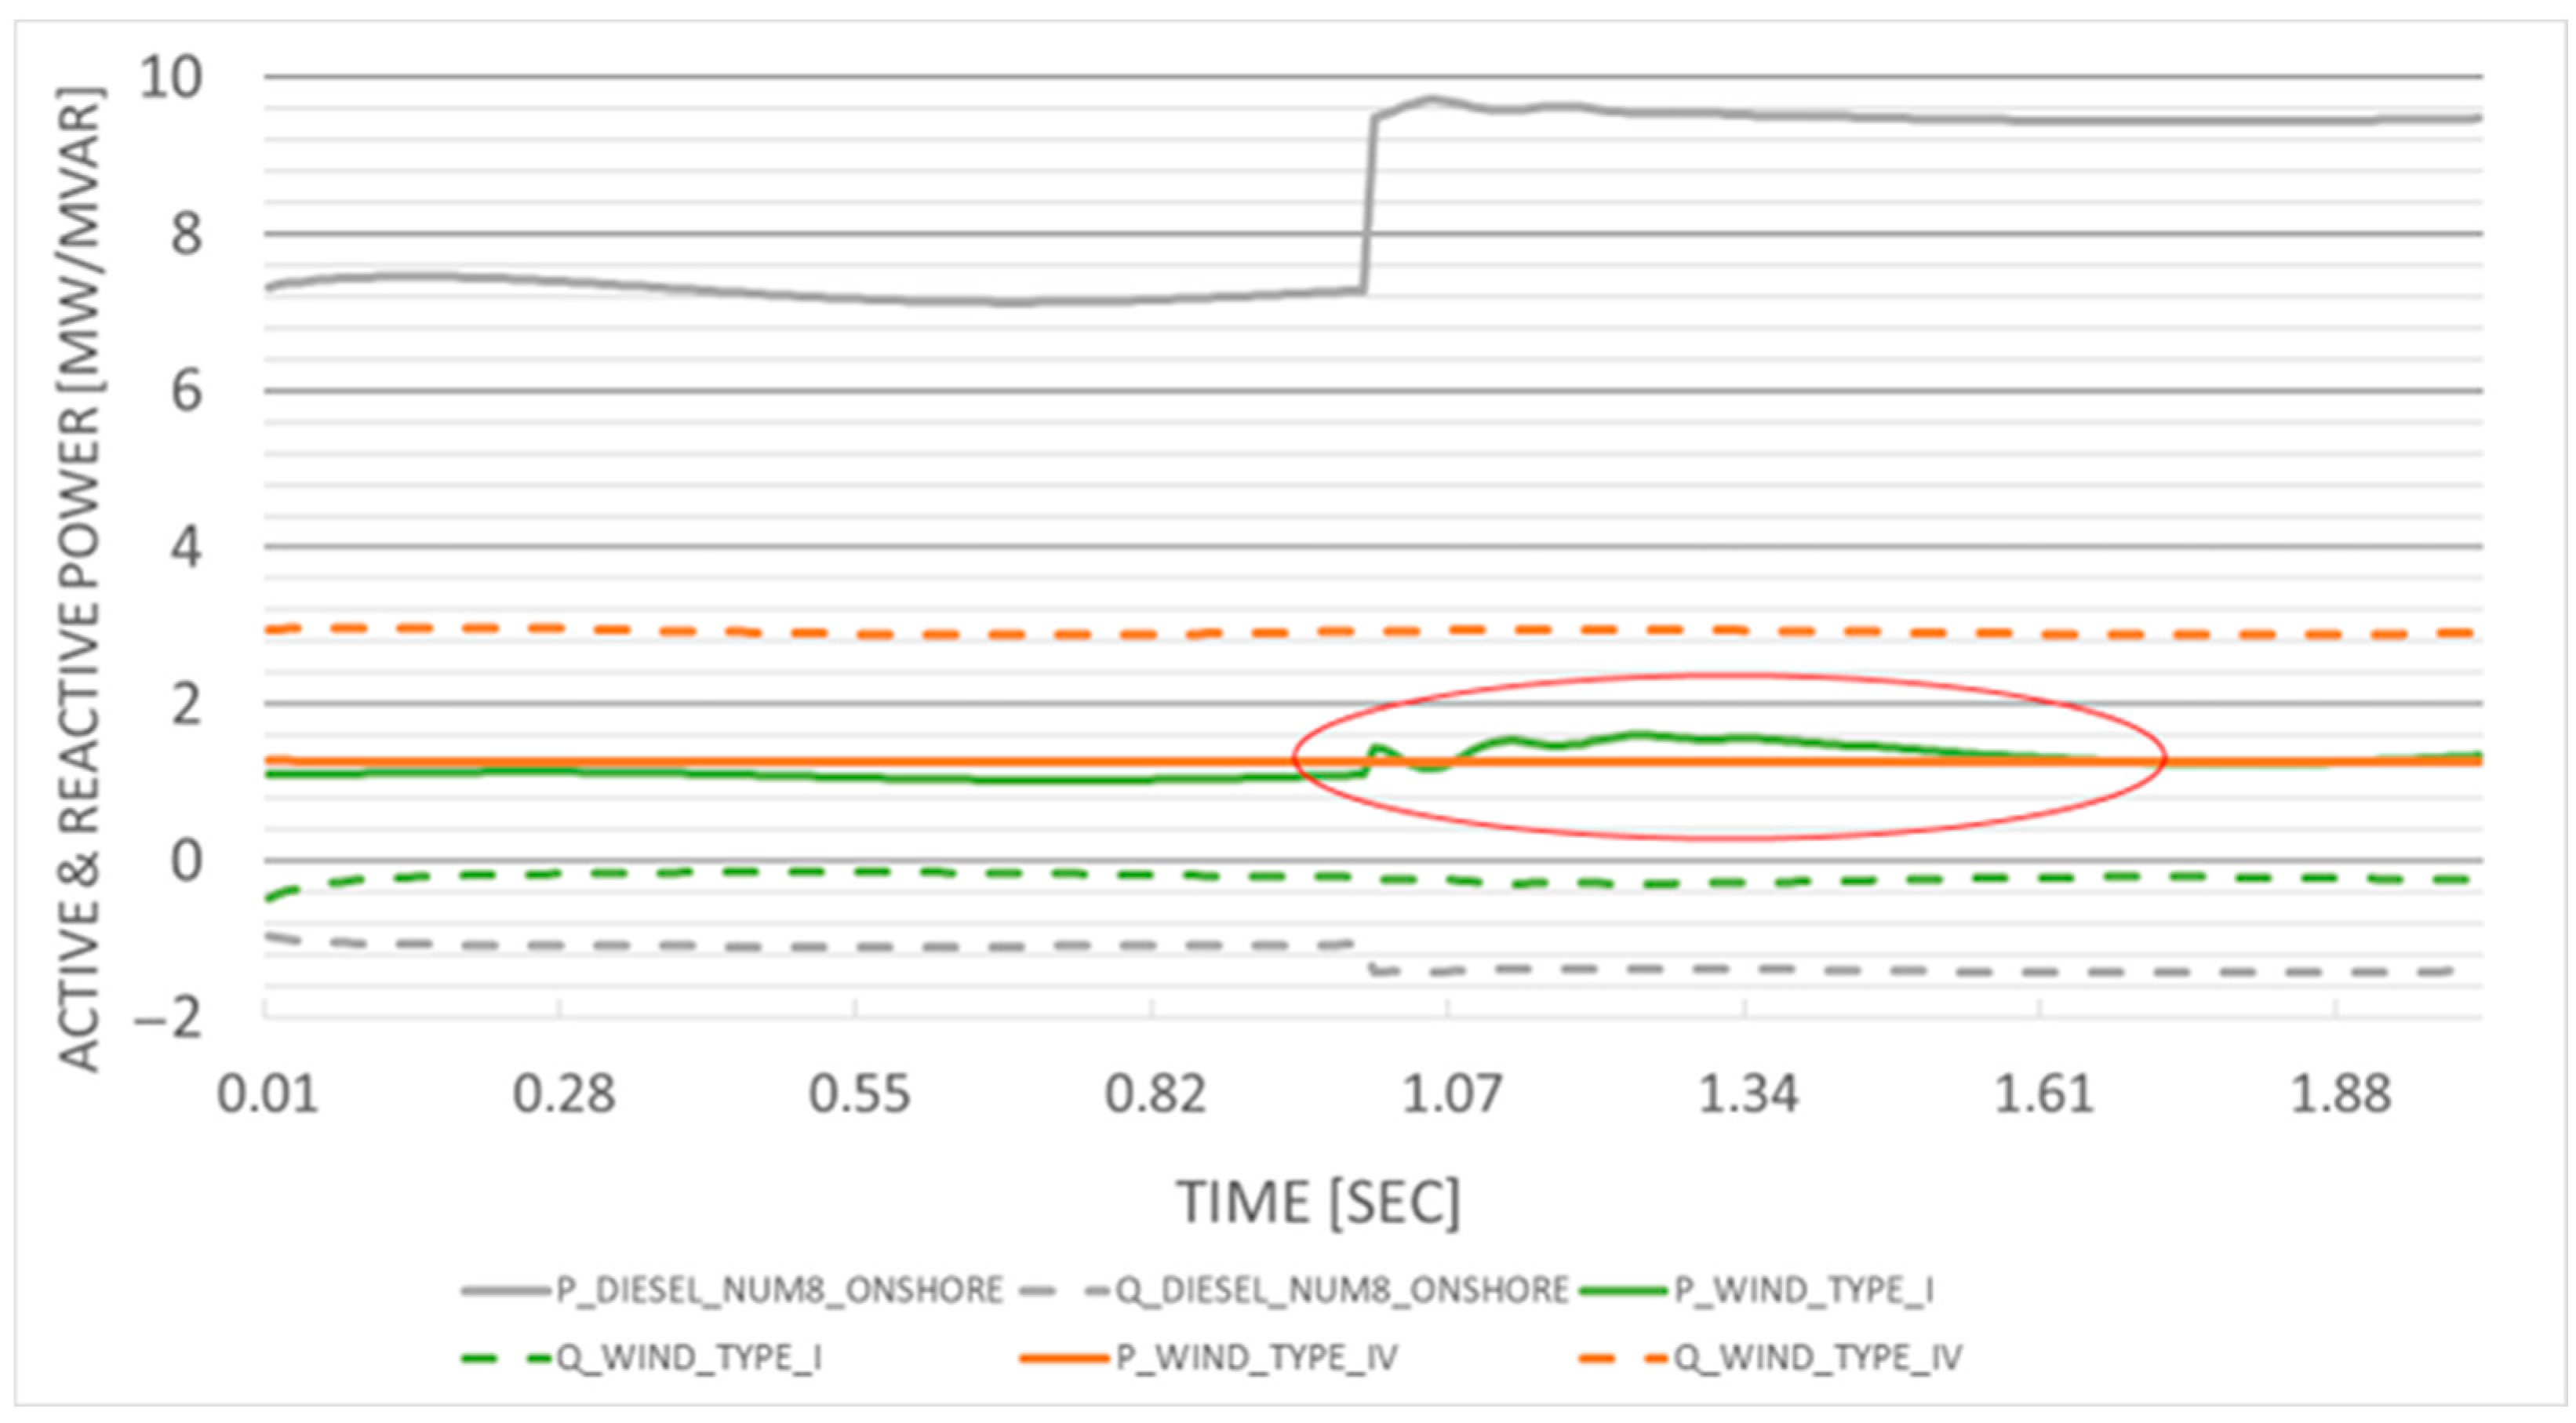
Figure 10 illustrates the curves of these variables for one of the remaining diesel generators connected to the grid, as well as for a farm of fixed-speed wind turbines (Type I) and another of variable-speed wind turbines (Type IV). The diesel generator (gray curves) increases its excitation current during the fault to inject additional reactive power into the grid, helping to regulate the voltage. Simultaneously, the active power output increases to compensate for the lost generation, thanks to the action of the diesel turbine’s speed regulator.
Notably, the response of one of the fixed-speed wind farms (green curve) shows that the rotor speed of these wind turbines is determined by the grid frequency and the number of generator poles, independent of wind speed. Therefore, when grid frequency drops, as in this case, the control system adjusts the turbine’s aerodynamic torque to increase active power output until the frequency stabilizes (highlighted in red). Conversely, in the case of variable-speed wind turbines (orange curve), the electronic converters decouple the grid frequency from the rotor speed, allowing the turbine to maintain stable power output under current wind conditions without the need for immediate increases in production.
While the fast converter response enhances voltage stability post-fault, the displacement of synchronous generation reduces overall system inertia. Thus, although voltage remains well-controlled in this scenario, the system’s dynamic robustness and ability to arrest frequency deviations are compromised when facing multiple or concurrent disturbances.

4.5. Scenario 4

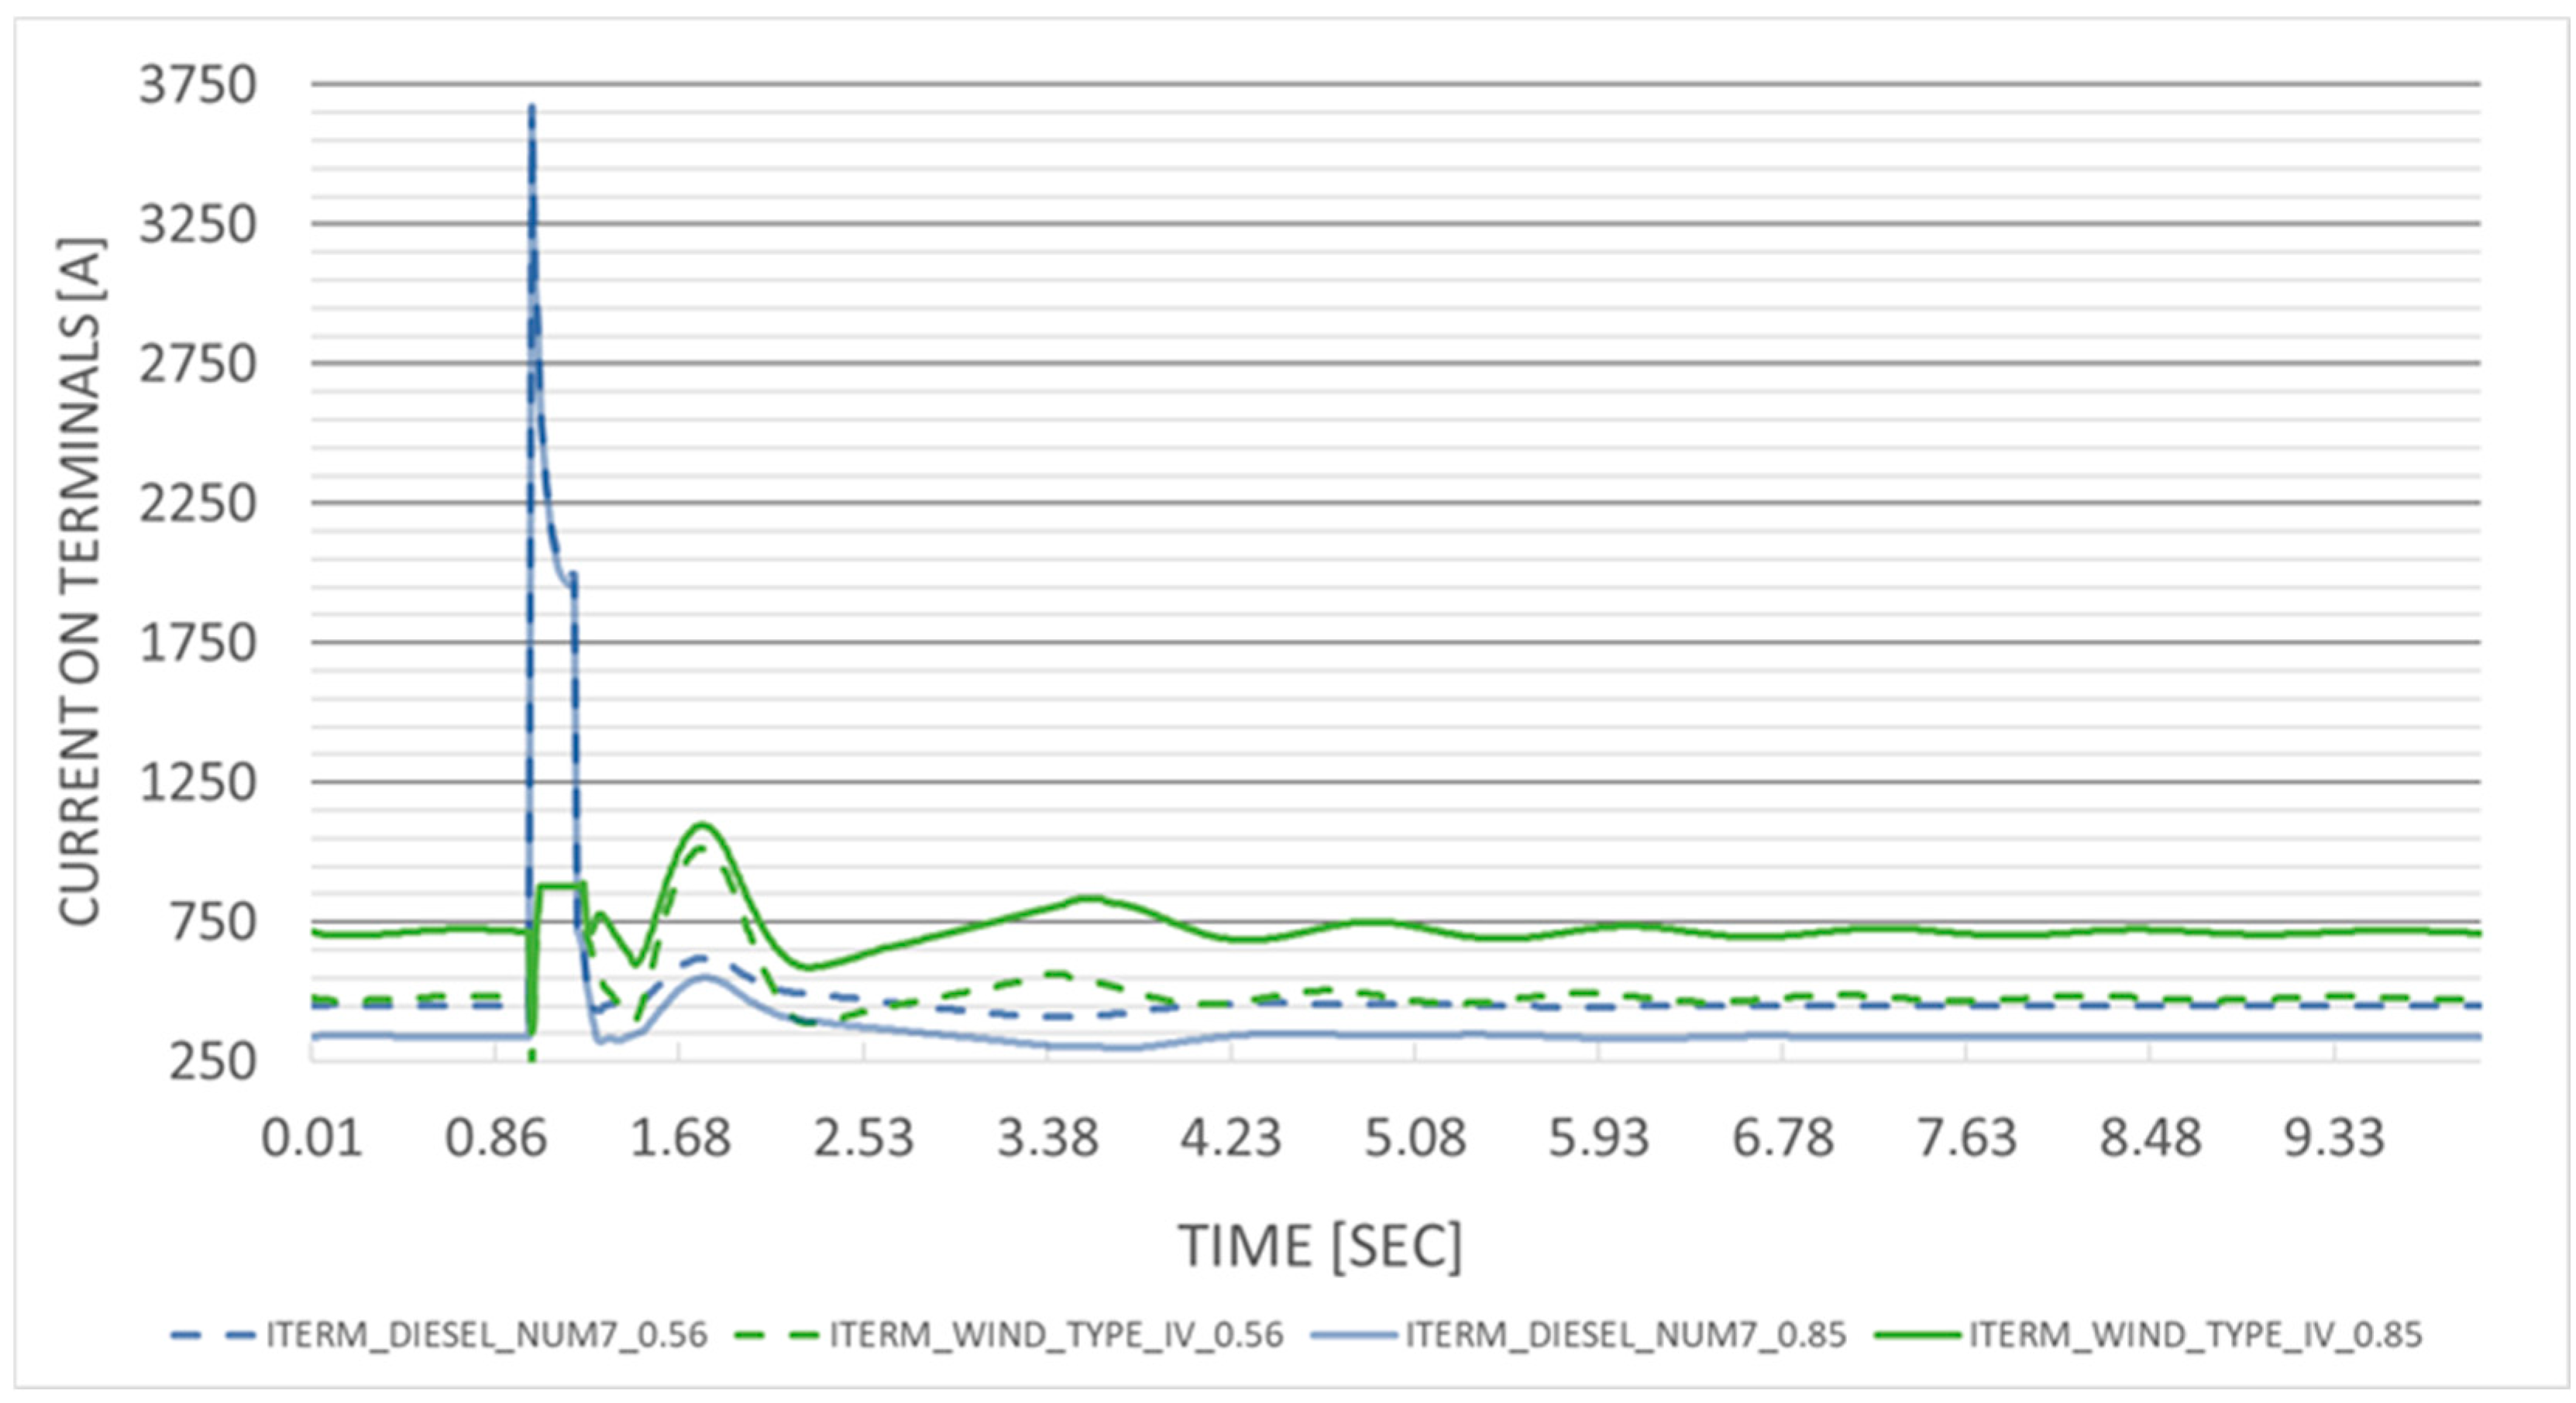
The difference in current contribution during a fault between a synchronous generator and a wind generator is evident in cases like the one illustrated in Figure 11. This graph displays the current curves at the generator terminals for the wind grid under two different load factors (LF): (1) wind LF = 0.56 (dashed curves) and (2) wind LF = 0.85 (solid curves). The current for one of the connected diesel generators is represented in blue, while the curves for one of the variable-speed wind farms are shown in green. At the time of the fault, the diesel generator (with a nominal power of 11.5 MW) provides a peak current close to 3.75 kA, whereas the wind farm (with a nominal power of 9.4 MW) barely exceeds 1 kA. In steady state, the behavior of both generators is evident: in a network with greater energy share of renewables, the current at the terminals of the wind generator is higher, while the diesel generator operates at a lower current.
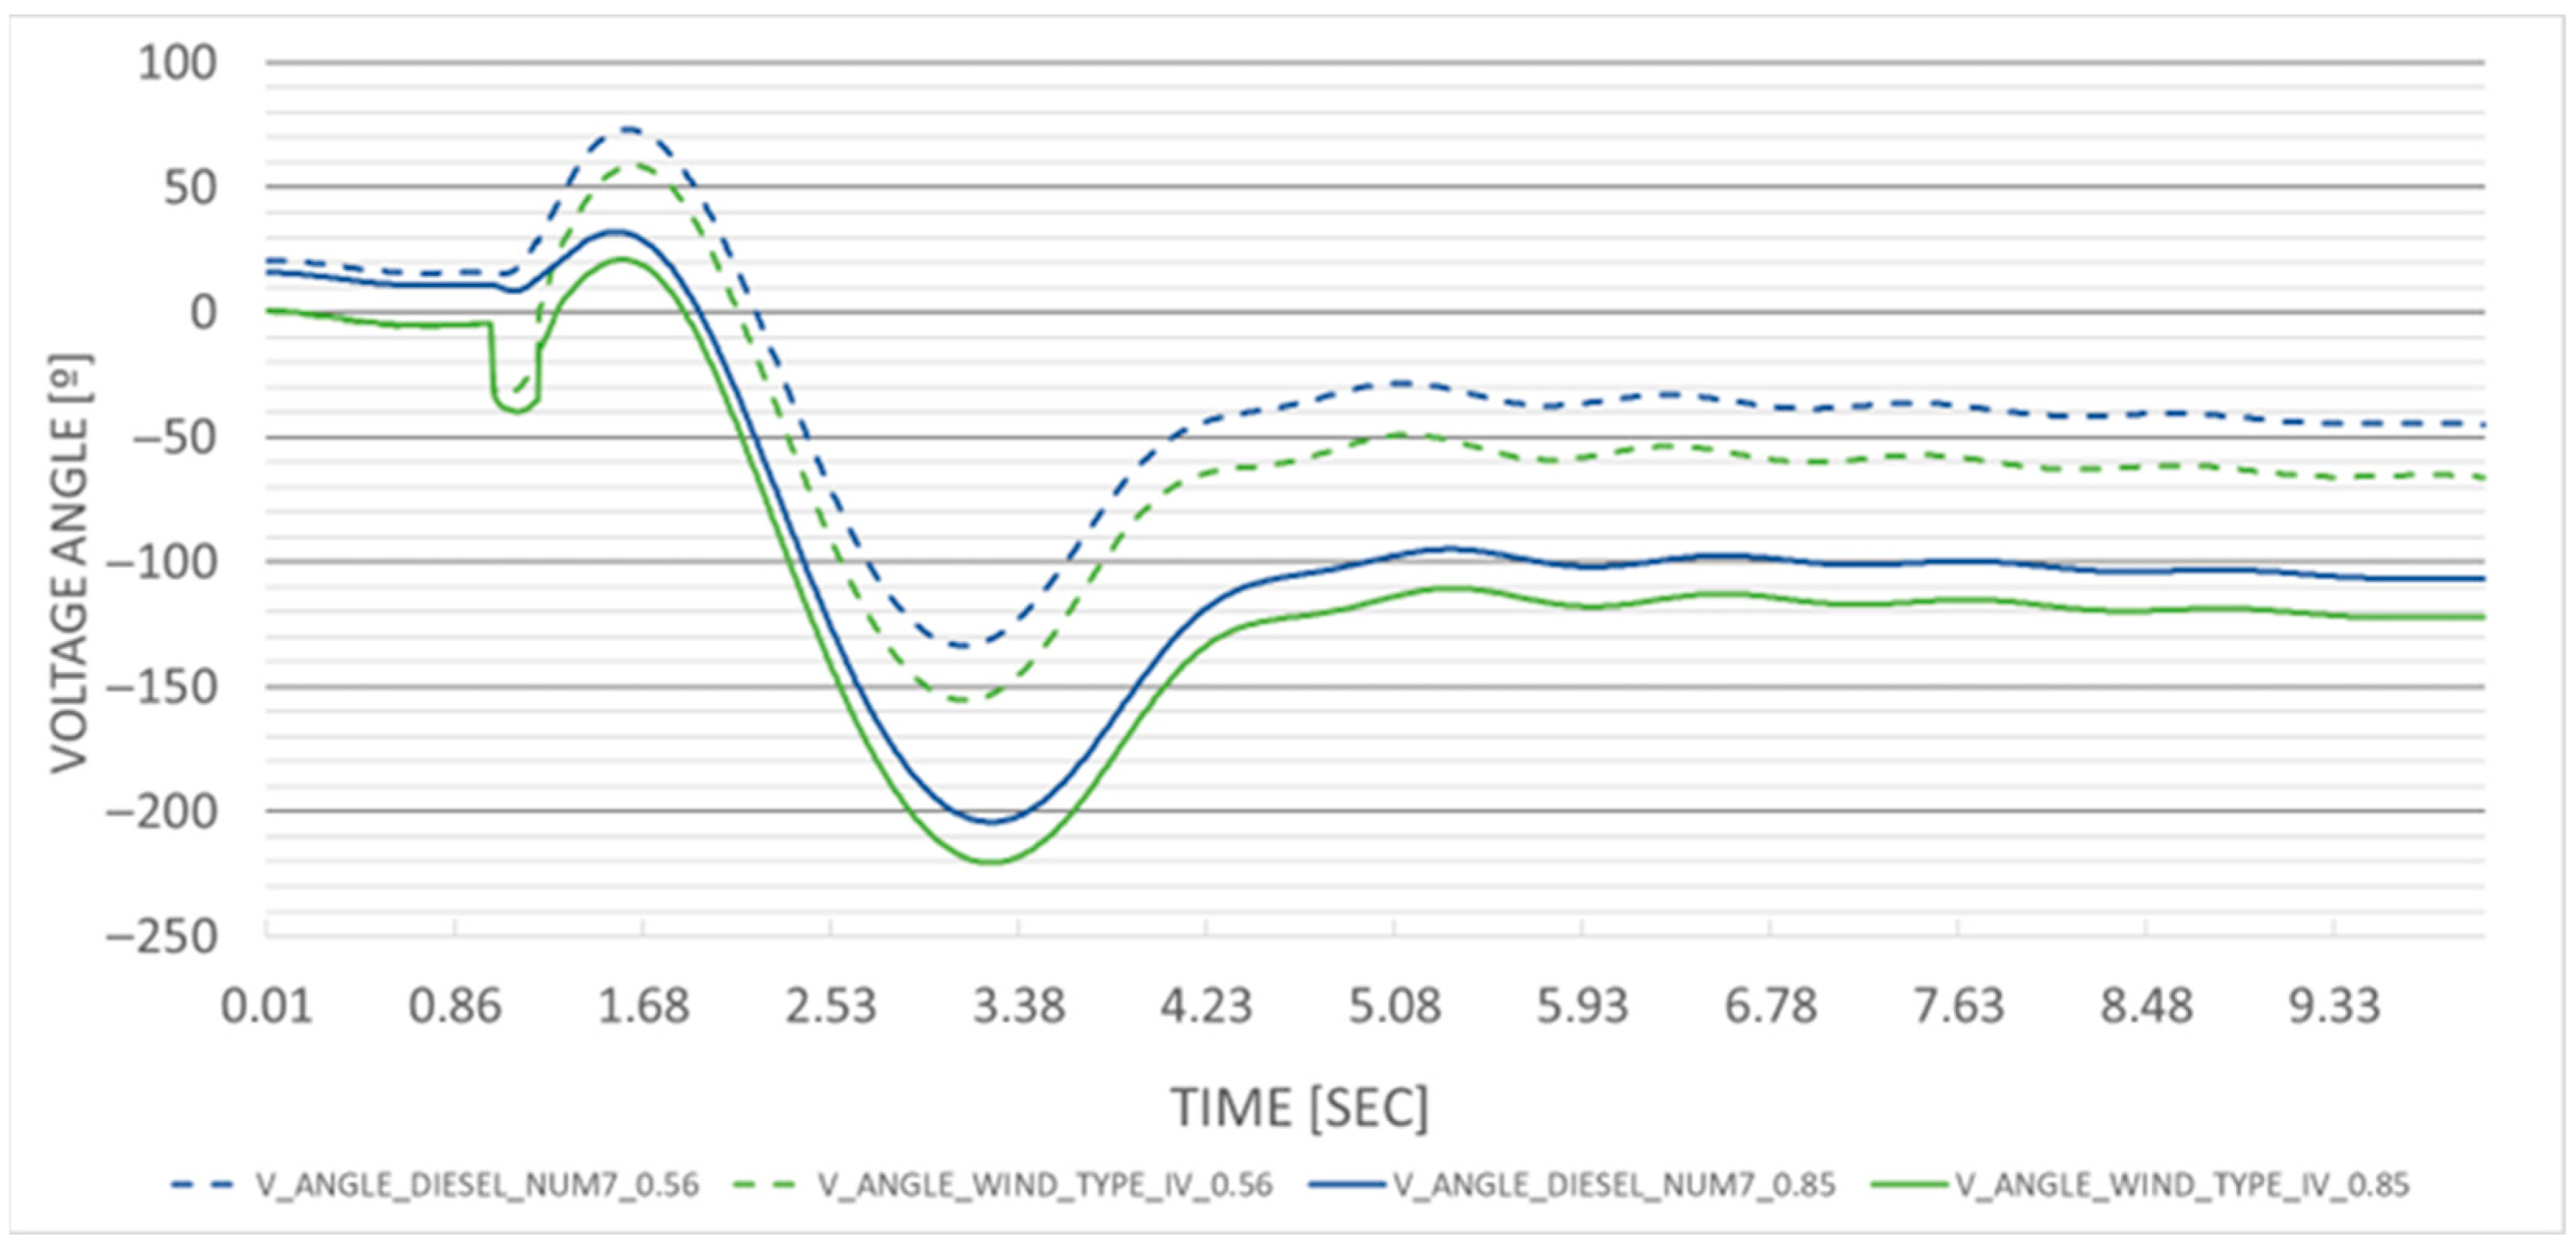
Additionally, Figure 12 illustrates the phase shift between the internal voltage generated by the generator rotor and the voltage at the generator terminals. This angular difference is directly related to the active power delivered by the generator to the grid, where a small angle indicates stable operation. At the moment of the fault, the angular difference drops below −100° for both the diesel generator and the wind generator (dashed blue and green curves) in a network with moderate renewable penetration. This issue worsens with increased renewable generation (solid blue and green curves), occasionally exceeding −200°.
This scenario starkly shows one of the limitations of inverter-based wind generators: their inability to supply high short-circuit currents, which are essential for reliable relay operation and maintaining system strength. Furthermore, without physical inertia, any disturbance causes faster and deeper frequency excursions. The significant voltage angle shifts also pose risks to active power transfer stability. Unless mitigated by synthetic inertia, virtual synchronous generator controls, or converter-based fast frequency response, these effects may impair both protection performance and transient stability.

5. Conclusions

This article evaluates the resilience of the new electricity network planned by Red Eléctrica de España (REE) on the island of La Palma. Through dynamic simulations of various scenarios—including the current grid, the proposed future network and the expected integration of new wind farms—the study provides a comparative analysis of system stability under contingency events.
The results confirm that the proposed network reinforcement, which introduces a more meshed transmission layout, significantly improves system resilience and reduces vulnerability to faults. However, some scenarios reveal the need for further reinforcement or complementary control strategies to guarantee secure and reliable operation under all conditions, particularly in the absence of conventional synchronous generation.
The findings also demonstrate the environmental benefits of increasing renewable energy penetration. With the integration of the planned wind farms operating at a typical load factor of 0.56, the island’s reliance on fossil-fueled diesel plants could be reduced by approximately 33%. Nevertheless, the transition to inverter-based resources introduces new stability challenges—especially in terms of reduced system inertia—which must be addressed in parallel through adequate system planning and operational strategies.
Notably, Scenarios 3 and 4 highlight key operational trade-offs. The wind-powered grid shows superior voltage regulation following the loss of a diesel unit (Scenario 3), with much tighter voltage margins due to fast reactive and active power control by the turbines. However, this advantage comes at the expense of lower system inertia, reducing the grid’s ability to damp frequency deviations and resist rapid disturbances—especially if multiple faults occur in quick succession. Furthermore, the sharp contrast between fault currents from diesel vs. wind units (Scenario 4) is evident: diesel machines produce high short-circuit currents necessary for reliable protection operation (~3.75 kA), while wind farms rarely exceed 1 kA. This lower short-circuit current undermines protection sensitivity and overall grid strength.
Despite its contributions, this study presents some limitations. Solar photovoltaic generation was not explicitly included in the dynamic simulations due to its currently limited installed capacity and predominant use for self-consumption. Additionally, diesel generator models were configured using representative parameters from the standard Woodward governor system, and wind turbine dynamics were modeled following the WECC guidelines for Type I and Type IV turbines, due to the unavailability of manufacturer-specific data. Simulations were conducted under peak demand conditions, which offer a conservative basis for system assessment. The generation was proportionally distributed across all technologies using a common load factor scaled to the nominal capacity of each unit, providing a realistic and balanced representation of system operation.
For future work, it is proposed to conduct dynamic simulations that incorporate additional renewable technologies, such as hydraulic pumping, as already explored in parallel studies by the European Commission. These solutions could support the replacement of diesel-based synchronous generation and further improve system flexibility. In addition, strategies such as inertia emulation, deployment of fast energy reserves, advanced droop control, or tailored load shedding schemes should be explored to mitigate the impact of high renewable penetration. The inclusion of solar PV generation, analysis of off-peak load conditions and refinement of generator model parameters through real operational data would also enhance the robustness of future studies.
From a practical perspective, this work provides useful guidance for grid planners and policymakers involved in the design and operation of isolated power systems. The methodology and findings offer a replicable framework to assess the stability implications of network upgrades and renewable integration, highlighting the critical importance of dynamic security in the context of energy transition on small island grids.

Author Contributions

R.P.: Conceptualization, Methodology, Investigation, Writing—original draft preparation, Writing—review and editing. E.R.-A.: Conceptualization, Investigation, Supervision, Writing—review and editing. A.C.-S.: Supervision, Investigation, Writing—review and editing. All authors have read and agreed to the published version of the manuscript.

Funding

This research received no external funding.

Data Availability Statement

The original contributions presented in this study are included in the article. Further inquiries can be directed to the corresponding authors.

Conflicts of Interest

The authors declare no conflicts of interest.

Abbreviations

The following abbreviations are used in this manuscript:
ECEuropean Commission
LFLoad Factor
OPFOptimal Power Flow
REERed Eléctrica de España
WECCWestern Electricity Coordinating Council Modeling and Validation Work Group

Appendix A

Table A1. Diesel generators models and parameters.
ModelParameterValue
GENSALH4.7436
GENSALD0.01326
GENSALXd0.01371
GENSALXq2
GENSALX’d0
GENSALX’q2.597
GENSALT’do1.1949
GENSALT’qo0.1761
GENSALS(1.0)0.1284
GENSALS(1.2)0.1
GENSALRa0.07
GENSALXl0.33
EXBASTR0.011
EXBASKA0.576
EXBASTA2.88
EXBASVRmax424
EXBASVRmin0.036
EXBASKE0.01
EXBASTE0.01
EXBASKF11.1
EXBASTF−11.1
EXBASAEC0.0125
EXBASTE_B0.075
EXBASVBmax0.01
EXBASRC0.5
EXBASXC1
EXBASKLR0.3
EXBASTLR0.01
EXBASILR0.2
EXBASRex3.5
EXBASRfd0.15
DEGOV1R1
DEGOV1T10.019
DEGOV1T20.0053
DEGOV1T31.6
DEGOV1FHP15
DEGOV1FLP0.3
DEGOV1K0.011
DEGOV1T40.185
DEGOV1Pmax0.1
DEGOV1Pmin0.8
DEGOV1T50
DEGOV1DT0.06067
DEGOV1GV10.5
Table A2. Wind generators models and parameters.
ModelParameterValue
WT1G1J0.846
WT1G1J’’0
WT1G1X3.927
WT1G1X’0.1773
WT1G1X’’0
WT1G1Xl0.1
WT1G1E11
WT1G1S(E1)0.03
WT1G1E21.2
WT1G1S(E2)0.179
WT12T1H5.3
WT12T1DAMP0
WT12T1Htfrac0.918
WT12T1Freq15
WT12T1Dshaft1
REGCA1Tfltr0.01–0.02 s
REGCA1Lvpl11.1–1.3
REGCA1Zerox0.4
REGCA1Brkpt0.9
REGCA1Lvplsw0
REGCA1rrpwr10.0 pu/s
REGCA1Tg0.02 s
REGCA1Volim1.2 pu
REGCA1Iolim−1.0 to −1.5 pu
REGCA1Khv0.7
REGCA1lvpnt00.4
REGCA1lvpnt10.8
REGCA1Iqrmax999.9 pu/s
REGCA1Iqrmin−999.9 pu/s
REECA1Vdip0.85–0.9 pu
REECA1Vup1.2
REECA1Trv0.01–0.02 s
REECA1dbd1−0.1–0 pu
REECA1dbd20–0.10 pu
REECA1Kqv0–10 pu/pu
REECA1Iqh11.0–1.1 pu
REECA1Iql1−1.1–1.0 pu
REECA1Vref00.95–1.05 pu
REECA1Iqfrz−0.1–0.1 pu
REECA1Thld−1–1 s
REECA1Thld20 s
REECA1Tp0.01–0.1 s
REECA1Qmax0.4–1.0 pu
REECA1Qmin−1.0 to −0.4 pu
REECA1Vmax1.05–1.1 pu
REECA1Vmin0.9–0.95 pu

References

  1. European Commission. EU Leads Global Initiative at COP28 to Triple Renewable Energy Capacity and Double Energy Efficiency Measures by 2030. Available online: https://ec.europa.eu/commission/presscorner/detail/en/ip_23_6053 (accessed on 12 April 2024).
  2. Kaya, O.; van der Roest, E.; Vries, D.; Keviczky, T. Hierarchical Model Predictive Control for Energy Management of Power-to-X Systems. In Proceedings of the 2020 IEEE PES Innovative Smart Grid Technologies Europe (ISGT-Europe), The Hague, The Netherlands, 26–28 October 2020; pp. 1094–1098. [Google Scholar] [CrossRef]
  3. Gils, H.C.; Simon, S. Carbon neutral archipelago—100% renewable energy supply for the Canary Islands. Appl. Energy 2017, 188, 342–355. [Google Scholar] [CrossRef]
  4. Merino, J.; Veganzones, C.; Sanchez, J.A.; Martinez, S.; Platero, C.A. Power System Stability of a Small Sized Isolated Network Supplied by a Combined Wind-Pumped Storage Generation System: A Case Study in the Canary Islands. Energies 2012, 5, 2351–2369. [Google Scholar] [CrossRef]
  5. Lemus, R.G. Back in the Race: Achieving 100% Renewable Energy in the Canary Islands. IEEE Power Energy Mag. 2020, 18, 64–74. [Google Scholar] [CrossRef]
  6. Connolly, D.; Mathiesen, B.V. A technical and economic analysis of one potential pathway to a 100% renewable energy system. Int. J. Sust. Energy Plan. Manag. 2014, 1, 7–28. [Google Scholar] [CrossRef]
  7. Katsaprakakis, D.A.; Papadakis, N.; Kozirakis, G.; Minadakis, Y.; Christakis, D.; Kondaxakis, K. Electricity supply on the island of Dia based on renewable energy sources (R.E.S.). Appl. Energy 2009, 86, 516–527. [Google Scholar] [CrossRef]
  8. Krajačić, G.; Duić, N.; Carvalho, M.d.G. H2RES, Energy planning tool for island energy systems—The case of the Island of Mljet. Int. J. Hydrogen Energy 2009, 34, 7015–7026. [Google Scholar] [CrossRef]
  9. Cabrera, P.; Lund, H.; Carta, J.A. Smart renewable energy penetration strategies on islands: The case of Gran Canaria. Energy 2018, 162, 421–443. [Google Scholar] [CrossRef]
  10. Ramirez-Diaz, A.; Ramos-Real, F.J.; Marrero, G.A. Complementarity of electric vehicles and pumped-hydro as energy storage in small isolated energy systems: Case of La Palma, Canary Islands. J. Mod. Power Syst. Clean Energy 2016, 4, 604–614. [Google Scholar] [CrossRef]
  11. Padrón, S.; Medina, J.F.; Rodríguez, A. Analysis of a pumped storage system to increase the penetration level of renewable energy in isolated power systems. Gran Canaria: A case study. Energy 2011, 36, 6753–6762. [Google Scholar] [CrossRef]
  12. Schallenberg-Rodríguez, J.; García Montesdeoca, N. Spatial planning to estimate the offshore wind energy potential in coastal regions and islands. Practical case: The Canary Islands. Energy 2018, 143, 91–103. [Google Scholar] [CrossRef]
  13. Qiblawey, Y.; Alassi, A.; Zain ul Abideen, M.; Bañales, S. Techno-economic assessment of increasing the renewable energy supply in the Canary Islands: The case of Tenerife and Gran Canaria. Energy Policy 2022, 162, 112791. [Google Scholar] [CrossRef]
  14. Magallones, T.G.; Singh, J.G. Impact of interconnections and renewable energy integration on the Philippine–Sabah Power Grid systems. Glob. Energy Interconnect. 2023, 6, 253–272. [Google Scholar] [CrossRef]
  15. Alves, M.; Segurado, R.; Costa, M. Increasing the penetration of renewable energy sources in isolated islands through the interconnection of their power systems. The case of Pico and Faial islands, Azores. Energy 2019, 182, 502–510. [Google Scholar] [CrossRef]
  16. Europa Press. La Isla de la Palma Sufre un Apagón General Tras una Avería. Available online: https://www.elcorreo.com/vizcaya/rc/20130903/sociedad/isla-palma-apagon-201309031836.html (accessed on 15 March 2024).
  17. La Palma Ahora. Endesa ha Ejecutado ya el 70% de las Actuaciones para Reconstruir el Doble Anillo Eléctrico de La Palma Destruido por el Volcán. Available online: https://www.eldiario.es/canariasahora/lapalmaahora/economia/endesa-ejecutado-70-actuaciones-reconstruir-doble-anillo-electrico-palma-destruido-volcan_1_10604438.html (accessed on 3 April 2024).
  18. E-Distribución. E-Distribución Comienza el Plan de Reconstrucción Eléctrica de La Palma con dos Centrales Térmicas Portátiles. Available online: https://www.endesa.com/es/prensa/sala-de-prensa/noticias/clientes/endesa-comienza-plan-de-reconstruccion-electrica-de-la-palma-con-dos-centrales-termicas-portatiles (accessed on 25 July 2025).
  19. Miyara, R.; Prabaharan, N.; Rangarajan, S.S.; Collins, E.R.; Takahashi, H.; Omine, E.; Senjyu, T. A virtual synchronous generator control method for remote island power system considering dynamic voltage stability. Energy Rep. 2023, 9, 1041–1049. [Google Scholar] [CrossRef]
  20. Padrón, S.; Hernández, M.; Falcón, A. Reducing Under-Frequency Load Shedding in Isolated Power Systems Using Neural Networks. Gran Canar. A Case Study. IEEE Trans. Power Syst. 2016, 31, 63–71. [Google Scholar] [CrossRef]
  21. Ameur, A.; Loudiyi, K.; Aggour, M. Steady State and Dynamic Analysis of Renewable Energy Integration into the Grid using PSS/E Software. Energy Procedia 2017, 141, 119–125. [Google Scholar] [CrossRef]
  22. Rajabdorri, M.; Kazemtabrizi, B.; Troffaes, M.; Sigrist, L.; Lobato, E. Inclusion of frequency nadir constraint in the unit commitment problem of small power systems using machine learning. Sustain. Energy Grids Netw. 2023, 36, 101161. [Google Scholar] [CrossRef]
  23. Egido, I.; Sigrist, L.; Lobato, E.; Rouco, L.; Barrado, A. An ultra-capacitor for frequency stability enhancement in small-isolated power systems: Models, simulation and field tests. Appl. Energy 2015, 137, 670–676. [Google Scholar] [CrossRef]
  24. Instituto Tecnológico de Canarias. Clean Energy for EU Islands: Estudio Técnico y Económico de Centrales de Bombeo Reversible. La Palma, Spain; Instituto Tecnológico de Canarias: Gran Canaria, Spain, 2023. [Google Scholar]
  25. Eliassi, M. Virtual Transmission Line for N-1 Security Compliance with Storage: Case of La Palma, Spain; 3E: Brussels, Belgium, 2022. [Google Scholar]
  26. Clean Energy for EU Islands Secretaria. The Benefits of New 66kV Overhead Line in La Palma: Identifying and Analysing Technical Values of Investments; Clean Energy for EU Islands Secretaria: Brussels, Belgium, 2020. [Google Scholar]
  27. Red Eléctrica de España (REE). Plan de Desarrollo de la Red de Transporte de Energía Eléctrica: Período 2021–2026; REE: Madrid, Spain, 2022. [Google Scholar]
  28. Red Eléctrica de España (REE). Planificación Vigente 2021–2026. Available online: https://www.planificacionelectrica.es/planificacion-vigente (accessed on 20 April 2024).
  29. Instituto Nacional de Estadística. Censo Anual de Población 2021–2024. Available online: https://www.ine.es/dynt3/inebase/index.htm?padre=10607&capsel=11555 (accessed on 25 July 2025).
  30. Mantenimiento de Contacto. Economía e Infraestructura: La Agricultura y el Turismo son los Sectores que Dominan la Economía en La Palma. Available online: https://www.la-palma.de/es/turismo/la-palma/economia-e-infraestructura (accessed on 2 May 2024).
  31. Hernández, R.; Viera, J.M.; Cabrera, C.T. Informe de Coyuntura Turística. La Palma 2022. Situación tras la Pandemia y la Erupción; Universidad de La Laguna: Tenerife, Spain, 2023. [Google Scholar]
  32. Gobierno de Canarias. Transición Ecológica Comprueba el Avance de las Obras del Enlace Eléctrico Tenerife-La Gomera. Available online: https://www3.gobiernodecanarias.org/noticias/transicion-ecologica-comprueba-el-avance-de-las-obras-del-enlace-electrico-tenerife-la-gomera/ (accessed on 24 April 2024).
  33. El Día—La Opinión de Tenerife. Endesa ha Sido Multada al Menos en Dos Ocasiones por Apagones en La Palma. Available online: https://www.eldia.es/palma/2013-09-03/11-Endesa-ha-sido-multada-menos-dos-ocasiones-apagones-Palma.htm (accessed on 28 April 2024).
  34. Gobierno de Canarias. Anuario Energético de Canarias 2021; Gobierno de Canarias: Canary Islands, Spain, 2023. [Google Scholar]
  35. Clean Energy for EU Islands Secretaria. Agenda para la Transición a la Energía Limpia. La Palma—Anexo I; Clean Energy for EU Islands Secretaria: Brussels, Belgium, 2021. [Google Scholar]
  36. Ministerio de Industria, Turismo y Comercio. Real Decreto 738/2015, de 31 de julio, por el que se regula la actividad de producción de energía eléctrica y el procedimiento de despacho en los sistemas eléctricos de los territorios no peninsulares. Boletín Oficial Estado 2015, 183, 54–55. [Google Scholar]
  37. Ministerio para la Transición Ecológica y el Reto Demográfico. Planificación Energética. Available online: https://www.miteco.gob.es/es/energia/estrategia-normativa/planificacion.html (accessed on 4 May 2024).
  38. García, R.; Ramos, J. Nueva Subestación Las Breñas 66 kV y Líneas L+C/66 kV Las Breñas–Valle de Aridane, L+C/66 kV Guinchos–Las Breñas y L+C/66 kV Las Breñas–L/Guinchos–Valle de Aridane; Documento Inicial; Red Eléctrica de España (REE) and Biosfera XXI Estudios Ambientales: Madrid, Spain, 2016. [Google Scholar]
  39. Red Eléctrica de España (REE). Un Impulso Estratégico para Canarias: Se Aprueba la Planificación de la Red de Transporte de Electricidad con Horizonte 2026 para Impulsar un Futuro Verde para España. Nota de prensa. Available online: https://www.planificacionelectrica.es/ (accessed on 3 April 2024).
  40. Dirección General de Energía. Anuncio de 11 de mayo de 2020, por el que se somete a información pública la solicitud de autorización administrativa, declaración de impacto ambiental y declaración, en concreto, de utilidad pública, de la instalación eléctrica de generación denominada Parque Eólico Llano del Tanque, en el término municipal de Fuencaliente, La Palma. Boletín Of. Canar. 2020, 116, 14029–14033. [Google Scholar]
  41. Dirección General de Energía. Anuncio de 11 de mayo de 2020, por el que se somete a información pública la solicitud de autorización administrativa, declaración de impacto ambiental y declaración, en concreto, de utilidad pública, de la instalación eléctrica de generación denominada Parque Eólico El Jaral, en el término municipal de Fuencaliente, La Palma. Boletín Of. Canar. 2020, 116, 14025–14028. [Google Scholar]
  42. Viceconsejería de Industria y Energía. Anuncio de la Viceconsejería de Industria y Energía por el que se somete a información pública la solicitud de Autorización Administrativa, Aprobación de Proyecto, Declaración de Impacto Ambiental y Declaración, en concreto, de Utilidad Pública de la instalación eléctrica denominada “Parque Eólico Garafía II de 3.6 MW”-Expte. ER 09/0078. Boletín Of. Canar. 2008, 269, 51908–51912. [Google Scholar]
  43. Siemens Power Technologies International. PSS®E 34.2 User Manual; Siemens: Munich, Germany, 2017. [Google Scholar]
  44. Pérez, O.R.S.J.A.; Núñez, O.; Corchado, N.A.; Ortiz, R.; Quezada, A.E.; Rascón, L.H. Interfaz Gráfica para el Cálculo de Flujos de Potencia en Redes Eléctricas. Rev. Iberoam. Automática Informática Ind. 2015, 56, 8. [Google Scholar]
  45. Sommerville, S.; Taylor, G.A.; Abbod, M. Frequency Stability Considerations of Reciprocating Gas Engine Generators in Microgrids. In Proceedings of the 56th International Universities Power Engineering Conference (UPEC 2021), Newcastle upon Tyne, UK, 31 August–3 September 2021; IEEE: Piscataway, NJ, USA, 2021; pp. 1–6. [Google Scholar] [CrossRef]
  46. Conte, F.; Massucco, S.; Silvestro, F.; Baccino, F.; Serra, P. Equivalent Modelling of Reciprocating Engines Generators for Microgrid Frequency Response Analysis. In Proceedings of the IEEE Manchester PowerTech, Manchester, UK, 18–22 June 2017; IEEE: Manchester, UK, 2017; pp. 1–6. [Google Scholar] [CrossRef]
  47. IEEE Power Engineering Society. IEEE Guide for Synchronous Generator Modeling Practices and Applications in Power System Stability Analysis; IEEE Std C62.92.2-2003; IEEE: New York, NY, USA, 2003. [Google Scholar]
  48. WECC Renewable Energy Modeling Task Force. WECC Wind Power Plant Dynamic Modeling Guide; Western Electricity Coordinating Council Modeling and Validation Work Group: Salt Lake City, UT, USA, 2010. [Google Scholar]
  49. WECC REMTF and EPRI. Type 4—Generic Wind Turbine Generator Model (Phase II). Available online: https://www.esig.energy/wiki-main-page/type-4-generic-wind-turbine-generator-model-phase-ii/#Generator.2FConverter_model_.28regc_a.29 (accessed on 17 June 2024).
  50. Typhoon HIL. DEGOV Woodward Diesel Governor. Available online: https://www.typhoon-hil.com/documentation/typhoon-hil-software-manual/References/degov_woodward.html (accessed on 3 May 2024).
  51. WECC REMTF and EPRI. WT1—Generic Wind Model. Available online: https://www.esig.energy/wiki-main-page/wt1-generic-wind-model/#Induction_Generator_Model_.28WT1G.29 (accessed on 17 June 2024).
  52. Red Eléctrica de España (REE). La Palma—Seguimiento de la Demanda de Energía Eléctrica. Available online: https://demanda.ree.es/visiona/canarias/la_palma5m/total/2021-08-17 (accessed on 9 May 2024).
  53. García, R.; Cristóbal, P.; Aranda, Y.; Mohedas, R.; Sánchez, A.; Ramos, J. Documento Ambiental de Proyecto. Realización o Mejora de los Accesos a los Apoyos de la L/66 kV Guinchos–Valle de Aridane; Red Eléctrica de España (REE) and Biosfera XXI Estudios Ambientales: Madrid, Spain, 2016. [Google Scholar]
  54. Ministerio de Industria, Turismo y Comercio. Resolución de 28 de abril de 2006, de la Secretaría General de la Energía, por la que se aprueba un conjunto de procedimientos de carácter técnico e instrumental necesarios para realizar la adecuada gestión técnica de los sistemas eléctricos insulares y extrapeninsulares. Boletín Of. Estado 2006, 129, 20573–20574. [Google Scholar]
  55. Instituto Canario de Estadística. Producción Neta de Electricidad Según Fuente de Energía. Islas de Canarias por Períodos. Available online: https://www3.gobiernodecanarias.org/istac/statistical-visualizer/visualizer/data.html?resourceType=dataset&agencyId=ISTAC&resourceId=C00022A_000007&version=~latest&multidatasetId=ISTAC:C00022A_000001#visualization/table (accessed on 9 May 2024).
  56. Hemdan, N.; Kurrat, M. Influence of Distributed Generation on Different Loadability Aspects of Electric Distribution Systems. In CIRED 2009—20th International Conference and Exhibition on Electricity Distribution—Part 1; IET: Prague, Czech Republic, 2009; pp. 1–4. [Google Scholar] [CrossRef]
  57. Denholm, P.; Kroposki, B. Understanding Power Systems Protection in the Clean Energy Future; National Renewable Energy Laboratory: Golden, CO, USA, 2022. [Google Scholar]
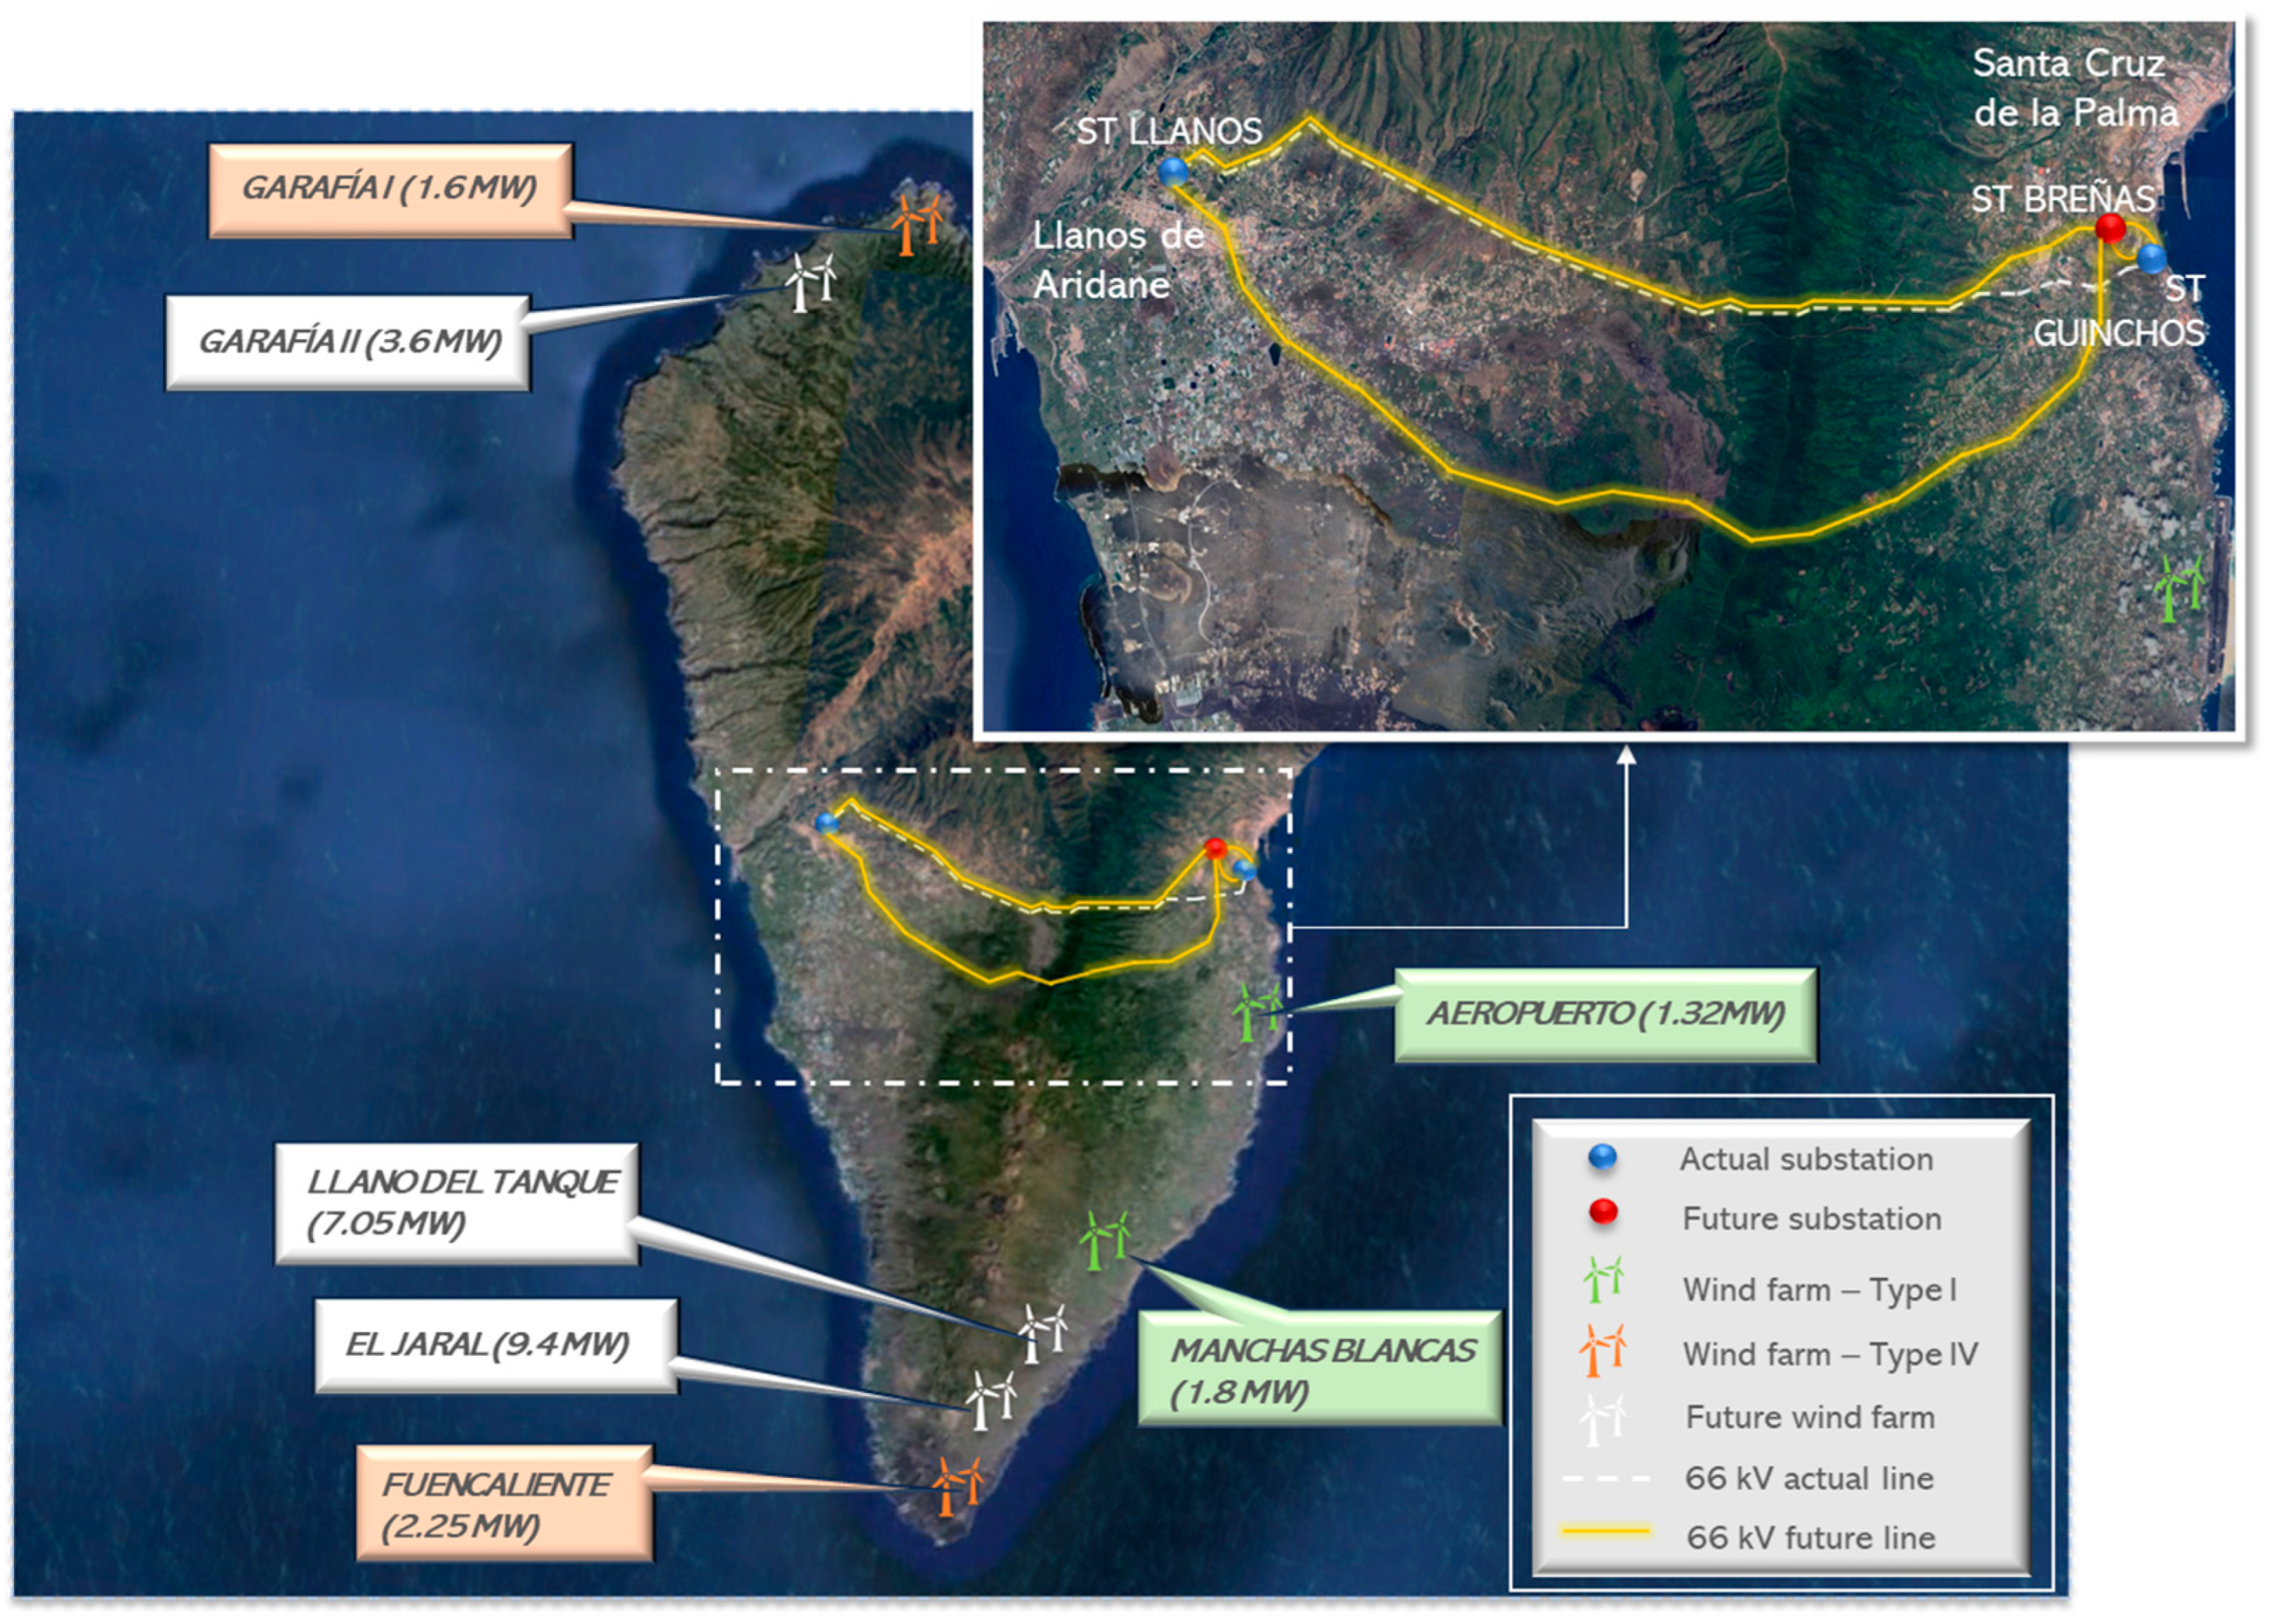
Figure 1. Main data from the La Palma energy transmission system: substations, line routes and wind farms. Comparison between the current configuration and planned developments. The existing transmission line is shown as a white dashed line, while solid yellow lines represent the proposed future layout, including modifications to the existing line and its rerouting near the planned Breñas substation. Source: own elaboration.
Processes 13 02374 g001
Figure 4. Power line route. In the background of the pictures, the pruning of the line corridor along the mountain can be seen [52].
Processes 13 02374 g004
Figure 5. Frequency recorded at ST Guinchos (left) and ST Llanos (right) in Hz: a 3-phase fault at ST Guinchos is simulated in each projected grid.
Processes 13 02374 g005
Figure 6. Voltage recorded at ST Guinchos in kV for the projected grids: 3-phase fault.
Processes 13 02374 g006
Figure 7. Frequency recorded at ST Guinchos (left) and ST Llanos (right) in Hz for the projected grids: line-to-ground fault.
Processes 13 02374 g007
Figure 8. Voltage recorded at ST Guinchos in kV for the projected grids: line-to-ground fault.
Processes 13 02374 g008
Figure 9. Voltage recorded at ST Llanos in kV for the projected grids: loss of 11.5 MW diesel unit.
Processes 13 02374 g009
Figure 10. Active and reactive power measurements from generators: response to the loss of a diesel unit.
Processes 13 02374 g010
Figure 11. Current at the terminals of diesel and wind generators.
Processes 13 02374 g011
Figure 12. Voltage angle at the terminals of diesel and wind generators.
Processes 13 02374 g012
Table 1. Summary of main findings from island renewable energy studies.
ReferenceLocationMethodologyKey Findings
Gils & Simon (2017) [3]Canary
Islands
Bottom-up modeling using Mesap-PlaNet and REMix tools, with backcasting from a 2050 100% RE targetLocal RE potentials suffice to fully meet power, heat and transport demand; sector coupling (EVs, electric heating, synthetic H2) crucial; undersea grid links reduce system costs by ~15%
Lemus (2020) [5]Canary
Islands
Technical–strategic analysisIdentifies acceleration of renewables, flexibility, storage and policy alignment as critical enablers for 100% RE in archipelago
Connolly & Mathiesen (2014) [6]IrelandTechno-economic modeling of 100% RE pathwayShows achieving 100% renewable share is technically possible and economically viable with integrated planning
Katsaprakakis et al. (2009) [7]Dia, GreeceSimulation based on RES mixRenewable mix can achieve autonomous electricity supply; storage and intelligent control needed
Krajačić et al. (2009) [8]Mljet,
Croatia
H2RES energy planning toolTool demonstrates feasibility of high-RE system, including hydrogen storage as firming resource
Cabrera et al. (2018) [9]Gran Canaria, Canary IslandsSmart Energy Systems via EnergyPLANAchieved ~75.9% RE supply with current tech; near-100% technically attainable with advanced sector coupling
Ramirez-Diaz et al. (2016) [10]La Palma, Canary IslandsAnalysis of EVs + pumped hydro complementarityEVs and pumped-hydro improve system balance and reduce reliance on thermal backup
Padrón et al. (2011) [11]Gran Canaria, Canary IslandsPumped storage system case studyPHES increased wind integration and strengthened grid stability
Schallenberg-Rodríguez & García (2018) [12]Canary IslandsSpatial GIS planning for offshore wind potentialMapped offshore wind zones, estimating their suitability for future development
Qiblawey et al. (2022) [13]Tenerife and Gran CanariaTechno-economic assessmentIsland interconnection decreases CO2 emissions by ~46%, cuts costs and boosts renewable share
Magallones & Singh (2023) [14]Philippines–SabahInterconnection impact analysisGrid links enhance reliability, reduce electricity cost and support higher renewable integration
Alves et al. (2019) [15]Pico and Faial, AzoresCase study of island interconnectionInterconnection allows stabilizing output and increasing renewable penetration
Table 2. Current power generation units in La Palma. Source: own elaboration.
Generation Unit NameNet Capacity [MW]Minimum Dispatchable Power [MW] [36]
Thermal Units96.44
Los Guinchos 6, Diésel 63.822.35
Los Guinchos 7, Diésel 73.822.35
Los Guinchos 8, Diésel 83.822.35
Los Guinchos 9, Diésel 94.32.82
Los Guinchos 10, Diésel 106.694.2
Los Guinchos 12, Diésel 116.695.2
Los Guinchos 13, Diésel 1211.56.63
Los Guinchos 14, Diésel 1311.26.63
Los Guinchos 15, Gas Móvil 221.64.85
Los Guinchos 16, Diésel 1411.56.63
Los Guinchos 17, Diésel 1511.56.63
Wind Farms6.97
Garafía-Juan Adalid (2 turbines)1.6-
Fuencaliente (3 turbines)2.25-
Aeropuerto La Palma (2 turbines)1.32-
Manchas Blancas (3 turbines)1.8-
Table 4. Generation mix and operating conditions for each network scenario.
NetworkGeneration TypeInstalled Capacity [MW]Load FactorInstantaneous Power [MW]
Actual (“a”) and Planned (“b”)Diesel59.08 (3 × 11.5/1 × 11.2/2 × 6.69)0.75444.55
Wind---
Planned + Wind Gen. (“c”)Diesel45.7 (3 × 11.5/1 × 11.2)0.6529.71
Wind27.02 (existing + planned)0.5615.13
Table 5. Load flow and short-circuit currents at the main busbars.
NetworkBus U [kV] I c c 3 p h   [ A ] I c c L G   [ A ]
Actual (“a”)Guinchos662909.921422.12
Llanos65.082372.401217.91
Planned (“b”)Guinchos662909.921422.12
Breñas65.982897.751417.49
Llanos65.462570.471292.23
Planned + Wind Gen. (“c”)Guinchos662251.031588.14
Breñas65.992243.771585.21
Llanos65.572043.141481.92
Disclaimer/Publisher’s Note: The statements, opinions and data contained in all publications are solely those of the individual author(s) and contributor(s) and not of MDPI and/or the editor(s). MDPI and/or the editor(s) disclaim responsibility for any injury to people or property resulting from any ideas, methods, instructions or products referred to in the content.