Review

Current State of Development of Demand-Driven Biogas Plants in Poland

1
Department of Biosystems Engineering, Poznan University of Life Sciences, St. Wojska Polskiego 50, 60-627 Poznan, Poland
2
Dynamic Biogas Energy Company, Ul. Szkolna 15A/5, 61-832 Poznan, Poland
*
Authors to whom correspondence should be addressed.
Processes 2025, 13(8), 2369; https://doi.org/10.3390/pr13082369
Submission received: 22 June 2025 / Revised: 22 July 2025 / Accepted: 23 July 2025 / Published: 25 July 2025

Abstract

Renewable energy sources (RES) are the foundation of the ongoing energy transition in Poland and worldwide. However, increased use of RES has brought several challenges, as most of these sources are dependent on weather conditions. The instability and lack of control over electricity production lead to both overloads and power shortages in transmission and distribution networks. A significant advantage of biogas plants over sources such as photovoltaics or wind turbines is their ability to control electricity generation and align it with actual demand. Biogas produced during fermentation can be temporarily stored in a biogas tank above the digester and later used in an enlarged CHP unit to generate electricity and heat during peak demand periods. While demand-driven biogas plants operate similarly to traditional installations, their development requires navigating regulatory and administrative procedures, particularly those related to the grid connection of the generated electricity. In Poland, it has only recently become possible to obtain grid connection conditions for such installations, following the adoption of the Act of 28 July 2023, which amended the Energy Law and certain other acts. However, the biogas sector still faces challenges, particularly the need for effective incentive mechanisms and the removal of regulatory and economic barriers, especially given its estimated potential of up to 7.4 GW.

1. Introduction

Mitigating climate change and protecting the environment have long been key priorities of the European Union (EU). The European Green Deal, building on the objectives of the Paris Agreement, established an ambitious and legally binding target in 2019: achieving climate neutrality by 2050. The transition to a carbon-neutral economy is intended to be sustainable, fair, and competitive. A crucial component of this transformation is the cooperation among EU Member States and the implementation of political initiatives such as Fit for 55 and Farm to Fork, which comprise a set of specific directives and legislative acts aimed at aligning different economic sectors with the overarching climate goals. Among the many areas affected, the energy sector plays a pivotal role, as it accounts for 27% of total greenhouse gas emissions in the EU [1]. However, energy transition poses numerous challenges, as all European countries must implement it in a way that ensures both energy security and economic stability. Striking a balance between decarbonization and energy affordability is essential to maintain supply continuity and to prevent adverse social consequences, such as rising energy poverty or job losses in conventional industries [2,3].
Renewable energy sources (RES) not only help reduce greenhouse gas emissions, but also contribute to the more efficient use of natural resources and raw materials. The transition to RES enhances the energy self-sufficiency of EU Member States and facilitates the shift of energy dependencies from the global to the regional level. This transformation reduces countries’ vulnerability to geopolitical disruptions, thereby increasing their stability and resilience to crises [4]. The financial benefits of RES are also noteworthy, as decreasing fossil fuel imports reduces the influence of geopolitical dynamics on energy prices and lowers the risk of market manipulation in fuel trading. However, the intermittency of RES, particularly those dependent on wind and solar energy, remains one of the significant challenges to achieving a sustainable energy transition [5]. These sources are weather-dependent and thus inherently variable, resulting in fluctuations in voltage and frequency within the power grid. From the perspective of grid operators, this variability increases the risk of grid disturbances and threatens the continuity of the electricity supply.
Another significant problem is that production from such sources often fails to meet actual demand. For example, on warm and windy days, especially on weekends or public holidays, electricity production exceeds demand, which can lead to grid overload and potential damage to the transmission infrastructure. To mitigate damage to the Polish Power System (PPS), grid operators introduce partial or total restrictions on RES production, resulting in irreversible power losses [6]. At the same time, the risk of a blackout, which is a total loss of power in a given area, increases, forcing the import of energy from neighboring countries [7,8]. The use of this solution has been widespread to date, despite tariffs for imported power equivalents not always favoring its profitability. However, recent sentiments in Europe indicate serious doubts about its effectiveness and stability in the short term. In November and December 2024, adverse atmospheric conditions, including limited sunlight access and high winds, led to electricity shortages in Western Europe. Germany, whose electricity production is primarily based on these sources, was forced to import energy from Norway. This destabilized the Norwegian energy market, causing prices to skyrocket and leading to public discontent. As a result of this crisis, the current Prime Minister, Jonas Gahr Støre, announced the decision to halt further work on integrating the Norwegian energy market with the EU system, emphasizing the potential risks associated with import dependency [9].
Poland, as a country with a high share of coal in its energy mix, is obligated to increase its share of RES in line with the climate targets outlined in the European Green Deal. To date, the most dynamic growth, consistent with trends observed in many other European countries, has been seen in the PV sector. By the end of December 2024, Poland’s installed PV capacity had reached 21,157 MW, representing a 26.3% increase compared to the previous year, when the capacity stood at 16,746 MW [10]. To avoid problems similar to those experienced in Germany, it is essential to rapidly increase the share of controllable and simultaneously low- or zero-emission energy sources [11].
Examples of such solutions include pumped-storage power plants and lithium-ion batteries. However, their use is associated with significant technical barriers, such as periodic water shortages in the case of pumped-storage plants, and economic barriers related to the high costs of battery energy storage technologies. A more suitable alternative, tailored to the capabilities and characteristics of the Polish economy, is biogas plants, which are the only RES installations not dependent on weather conditions.
The process of methane fermentation, which involves the decomposition of organic matter and the production of biogas, occurs independently of sunlight, wind speed, or rainfall. Electricity in biogas plants is generated by burning biogas in generating units, usually cogeneration engines. In most cases, these engines operate continuously, producing electricity 24 h per day. However, it is possible to adjust the operation of the generating units to the actual energy demand. During periods of reduced demand, the engine is switched off, and the produced biogas is stored under flexible domes that form the roofs of the fermentation and post-fermentation tanks. Although the introduction of peak operation in biogas plants enables their use as both energy storage facilities and PPS stabilizers, this solution is still not widely implemented in Poland [12].
This paper aimed to analyze the Polish biogas market in the context of implementing demand-driven biogas plants, with particular emphasis on the factors that promote and hinder the development of this sector. The paper reviewed recent legislative changes concerning the connection of such installations to the power grid and formulated recommendations to support the further growth of the industry.

2. Current Situation in the Polish Energy Sector

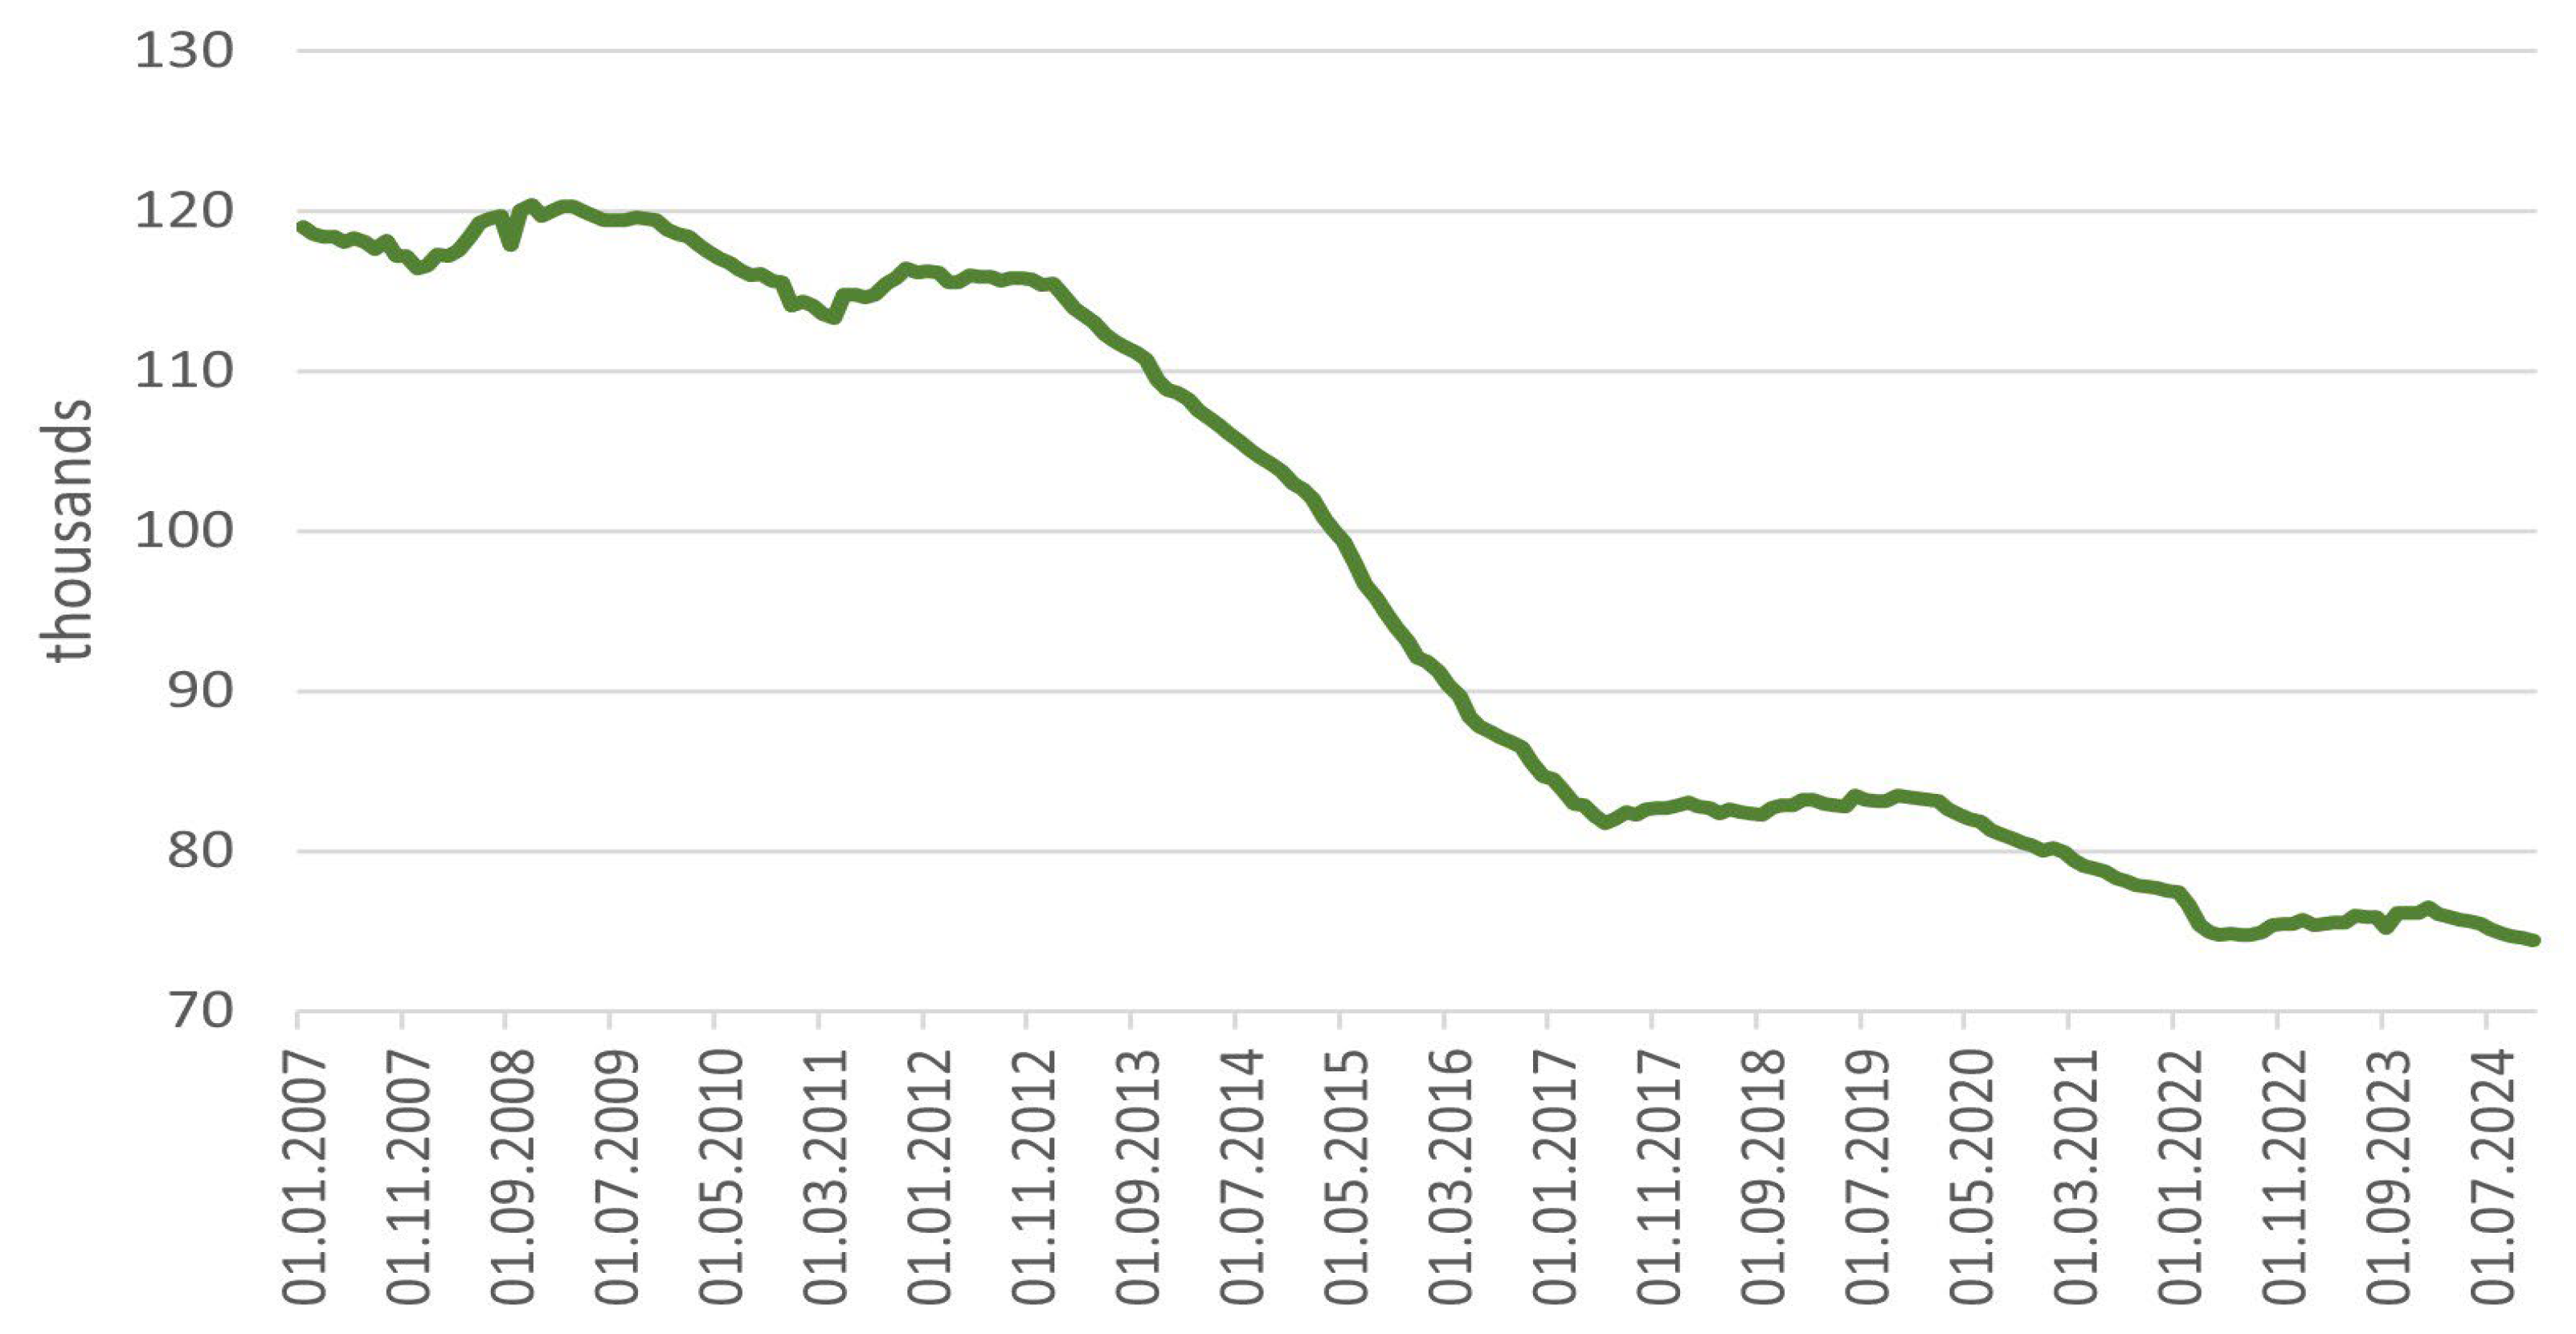
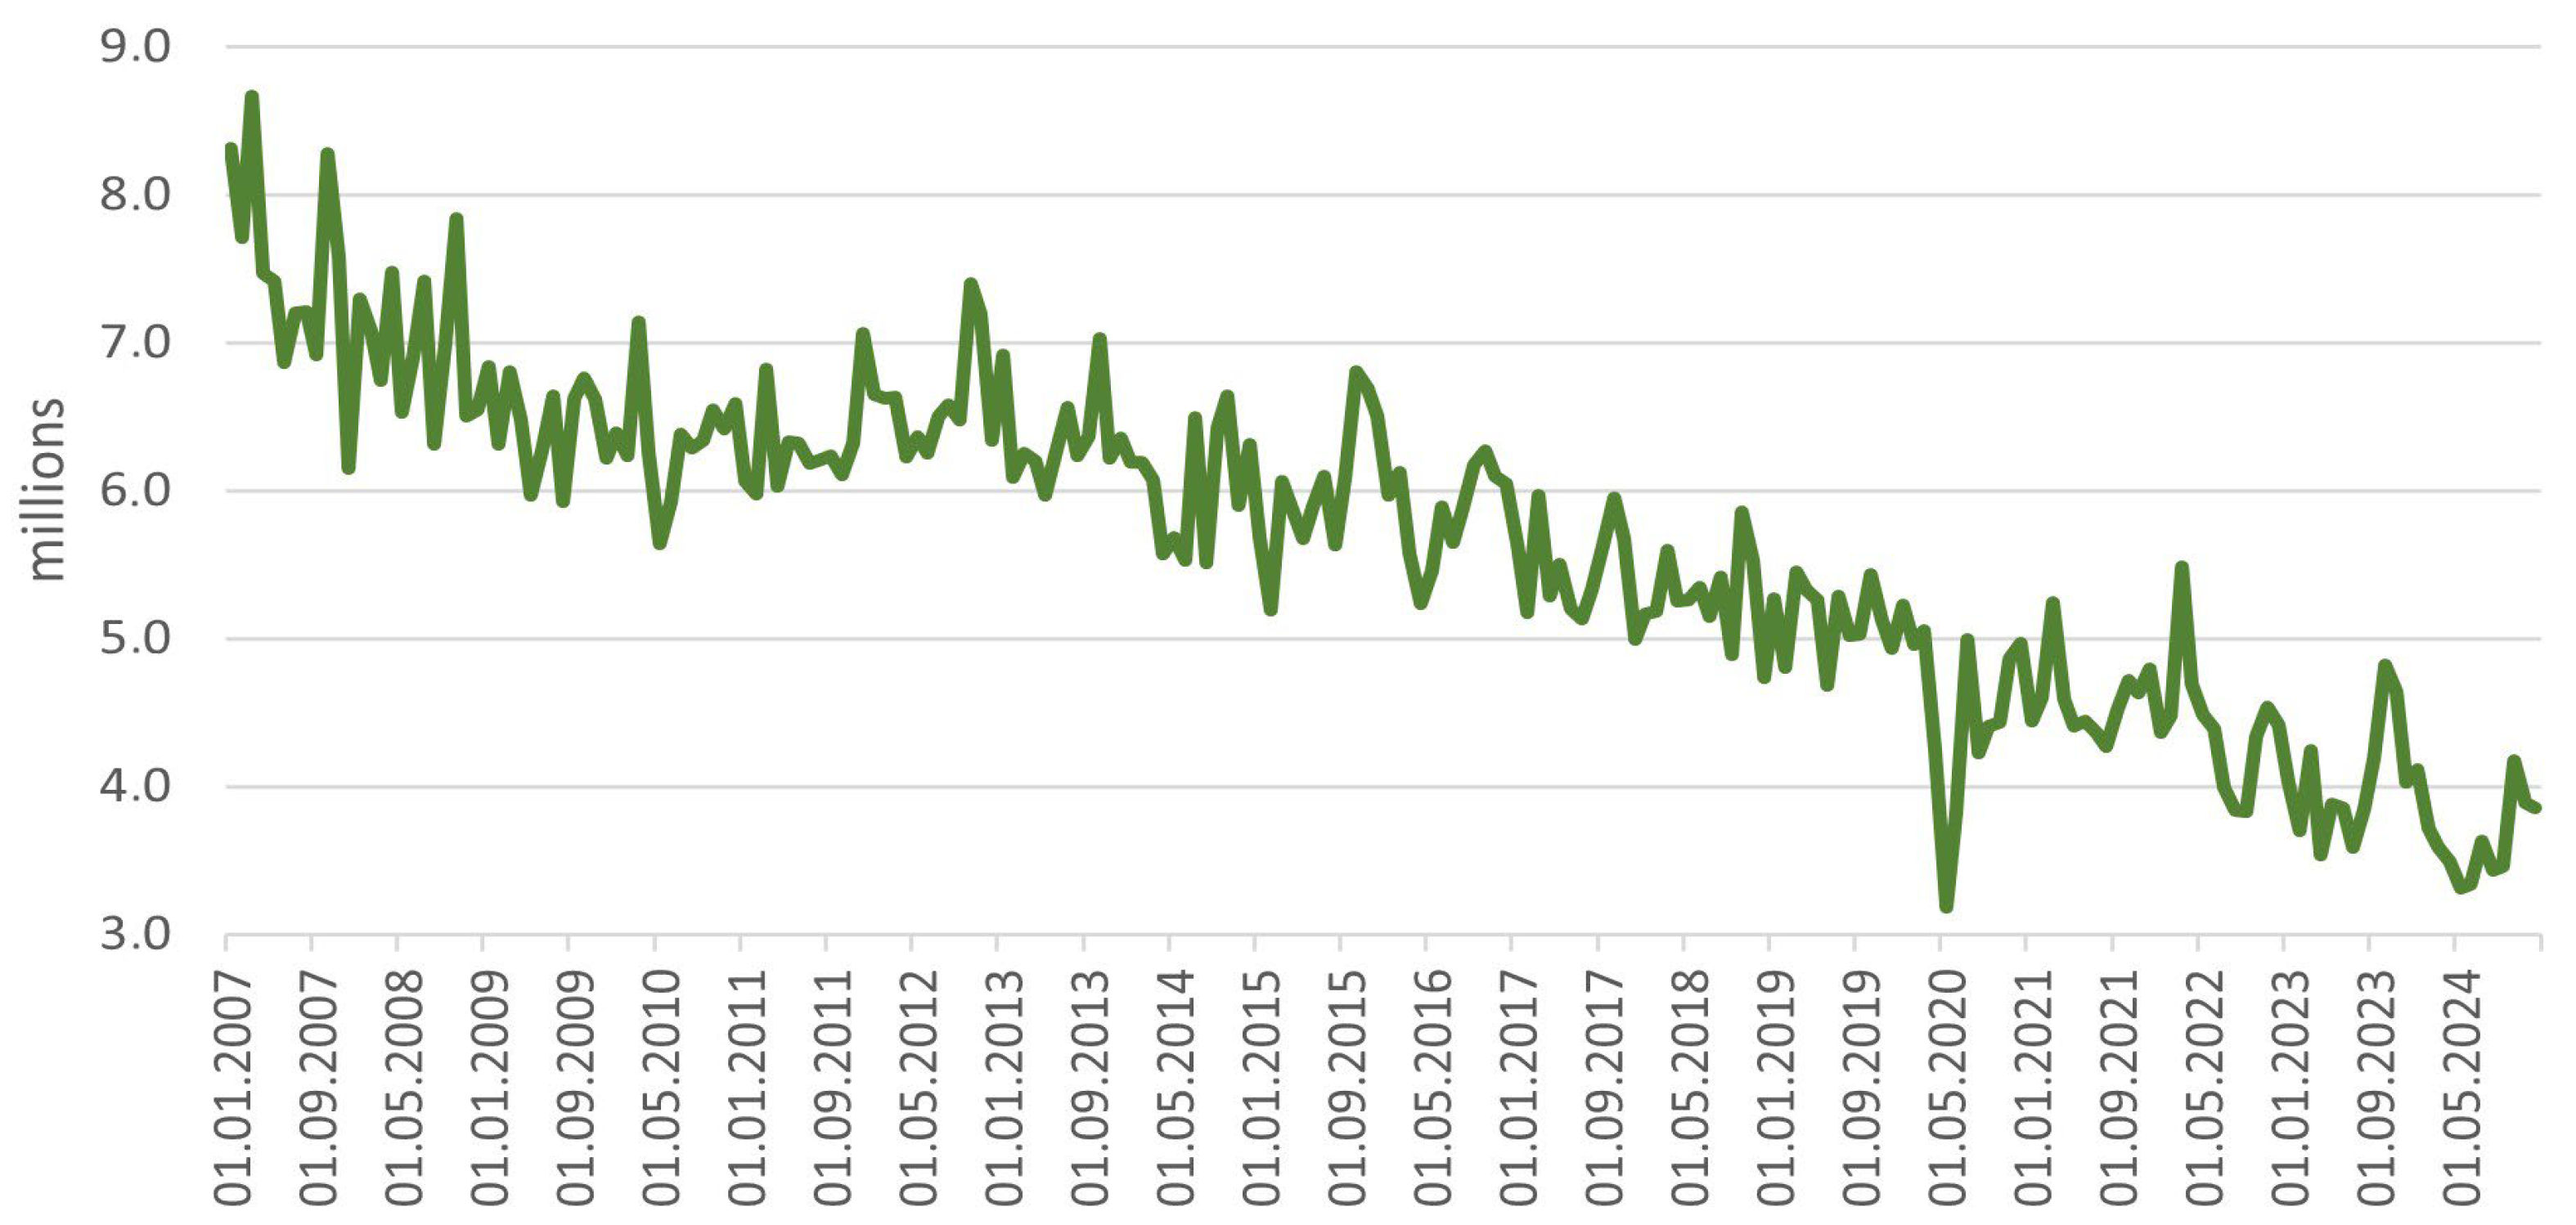
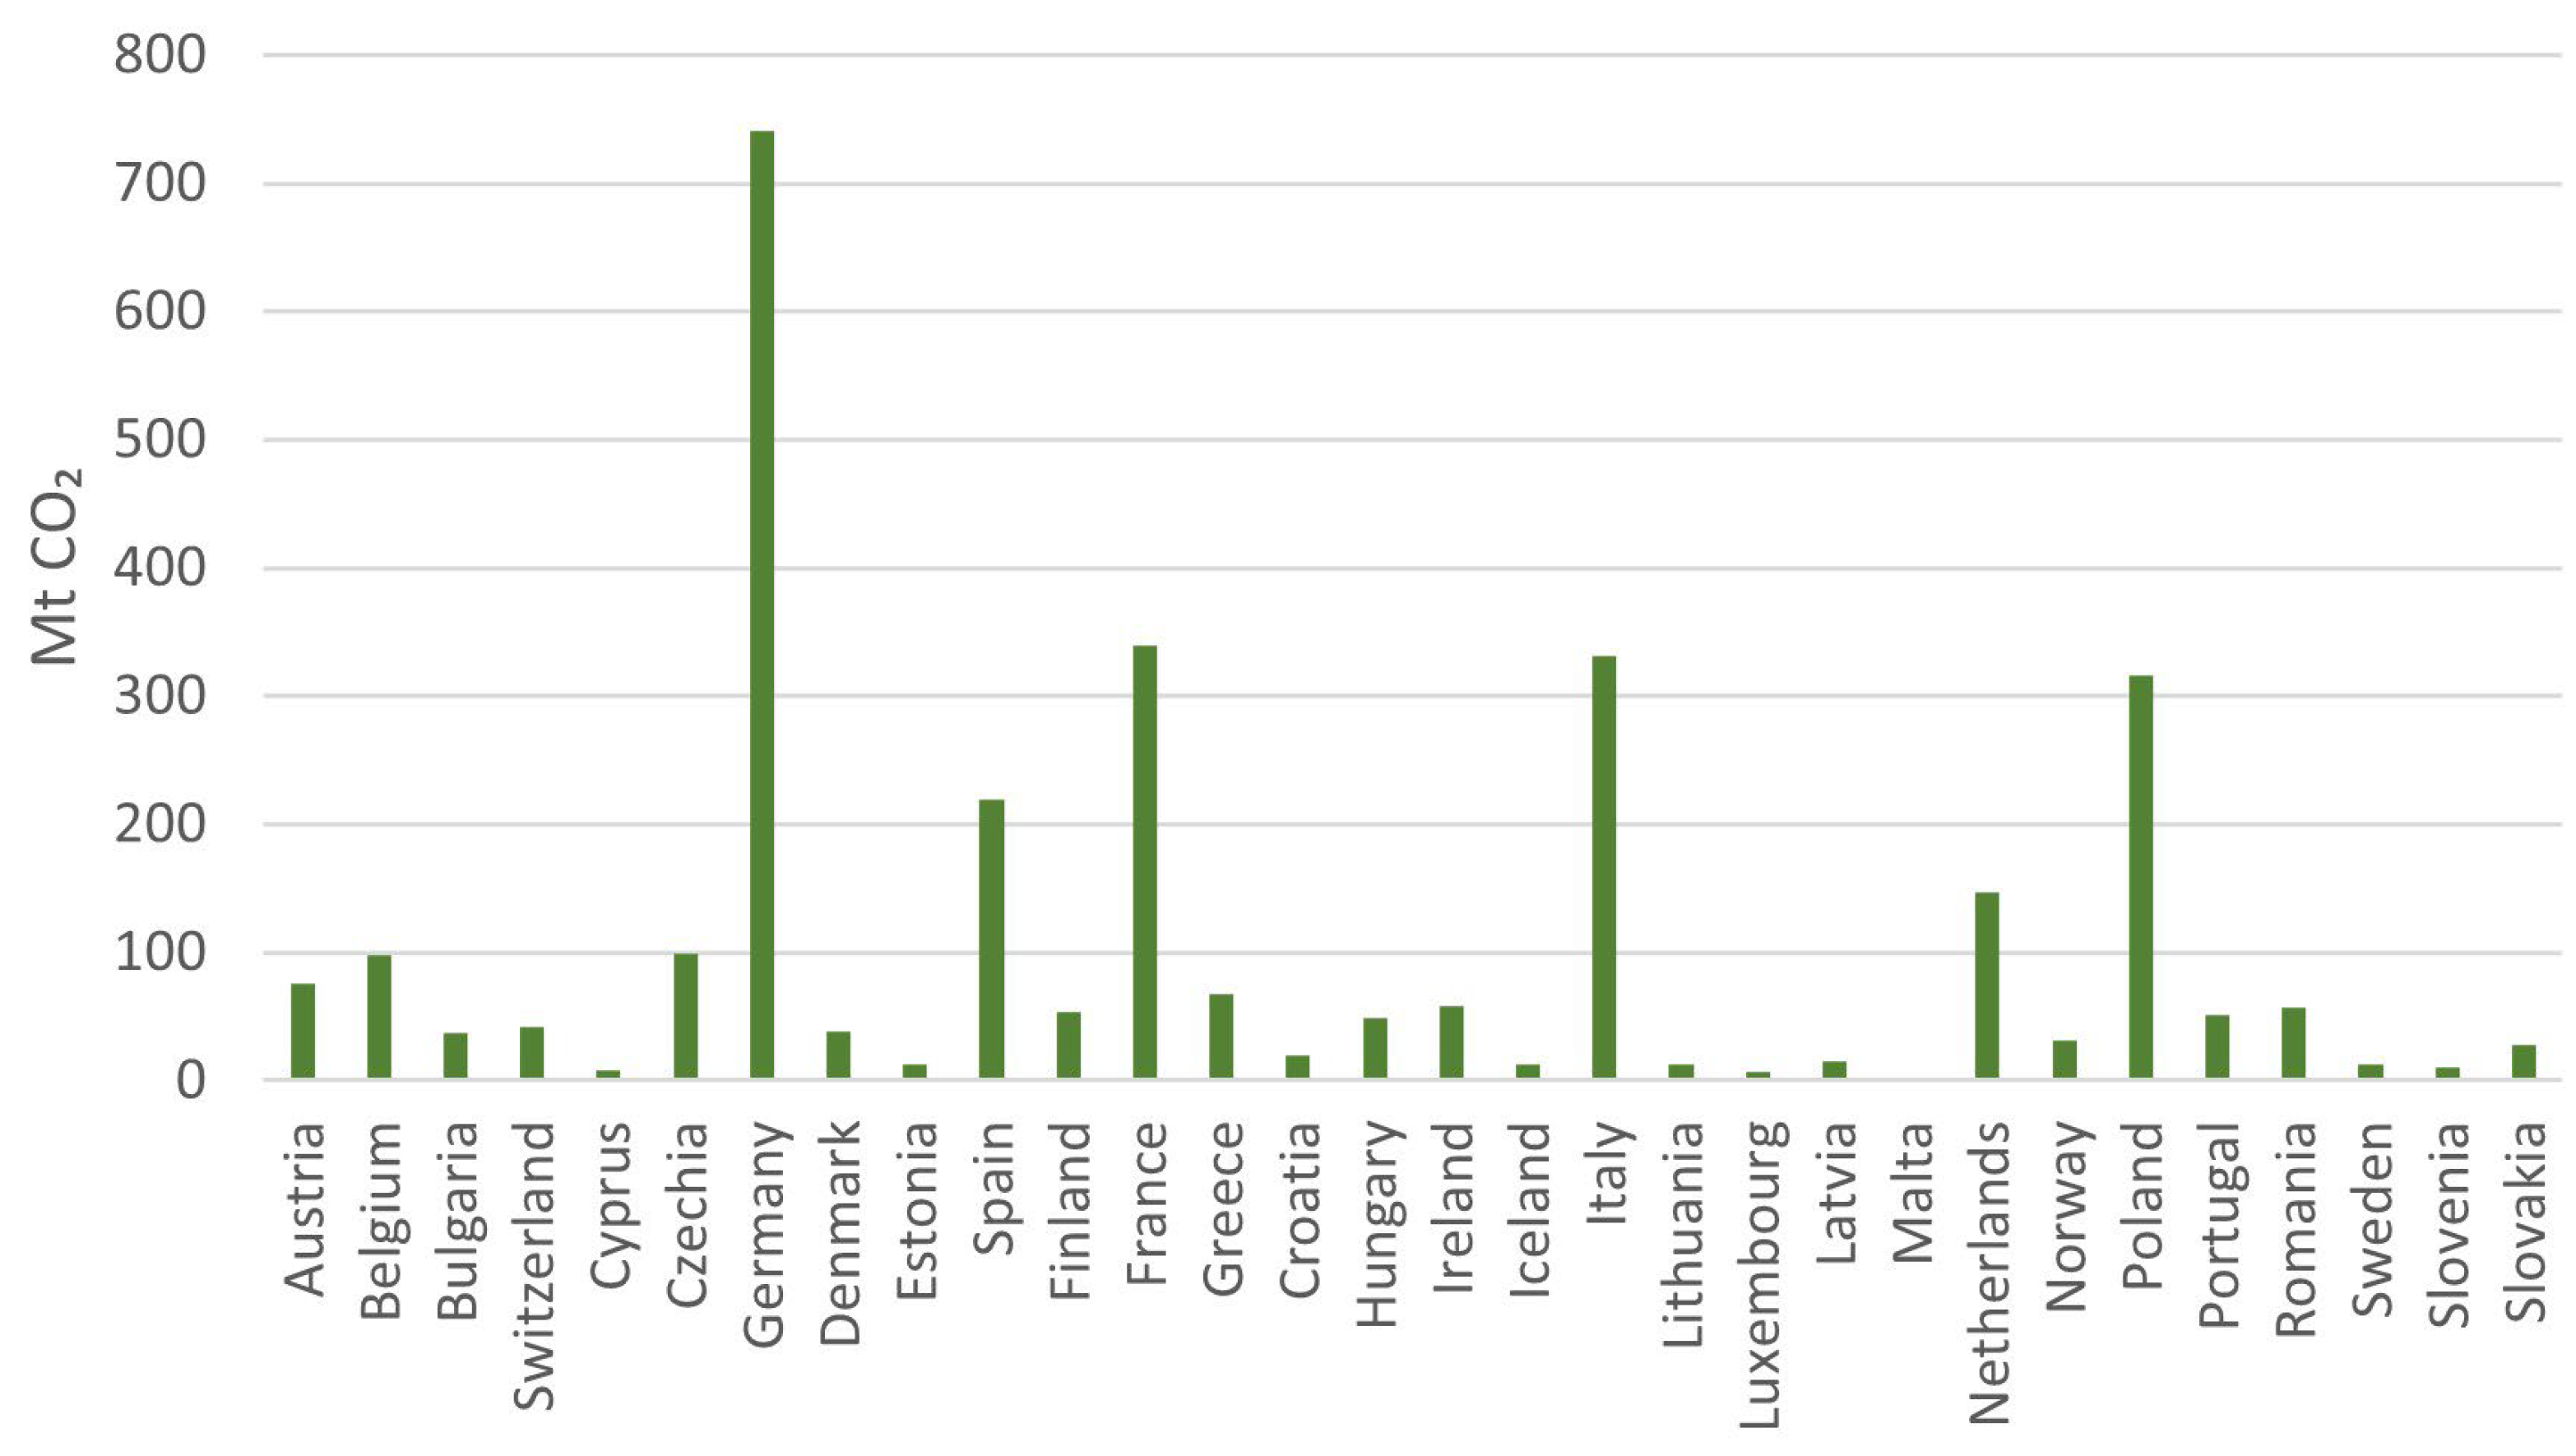
2.1. Historical Background and Coal Dependency

For years, hard and brown coal have formed the basis of the Polish energy sector, on which the country’s economic development has been based. In the 1970s and 1980s, Poland was one of the world’s leading coal producers [13]. However, in the following decades, due to inefficient restructuring programs, the mining sector gradually lost its competitiveness. Key problems, included low efficiency of deposit exploitation, excessive employment and a suboptimal wage system, which contributed to a high share of fixed costs in the industry’s expenditure structure [14]. Currently, there is an annual decline in both the number of people employed in the mining sector, shown in Figure 1, and the volume of extraction, shown in Figure 2.
Despite declines in coal extraction and jobs, the Polish energy sector remains heavily dependent on coal, which accounted for 57.1% of electricity generation as of late December 2024 [10]. This reliance results in higher greenhouse gas emissions compared to other EU countries, presenting a significant challenge within the context of the energy transition and climate commitments, as illustrated in Figure 3.

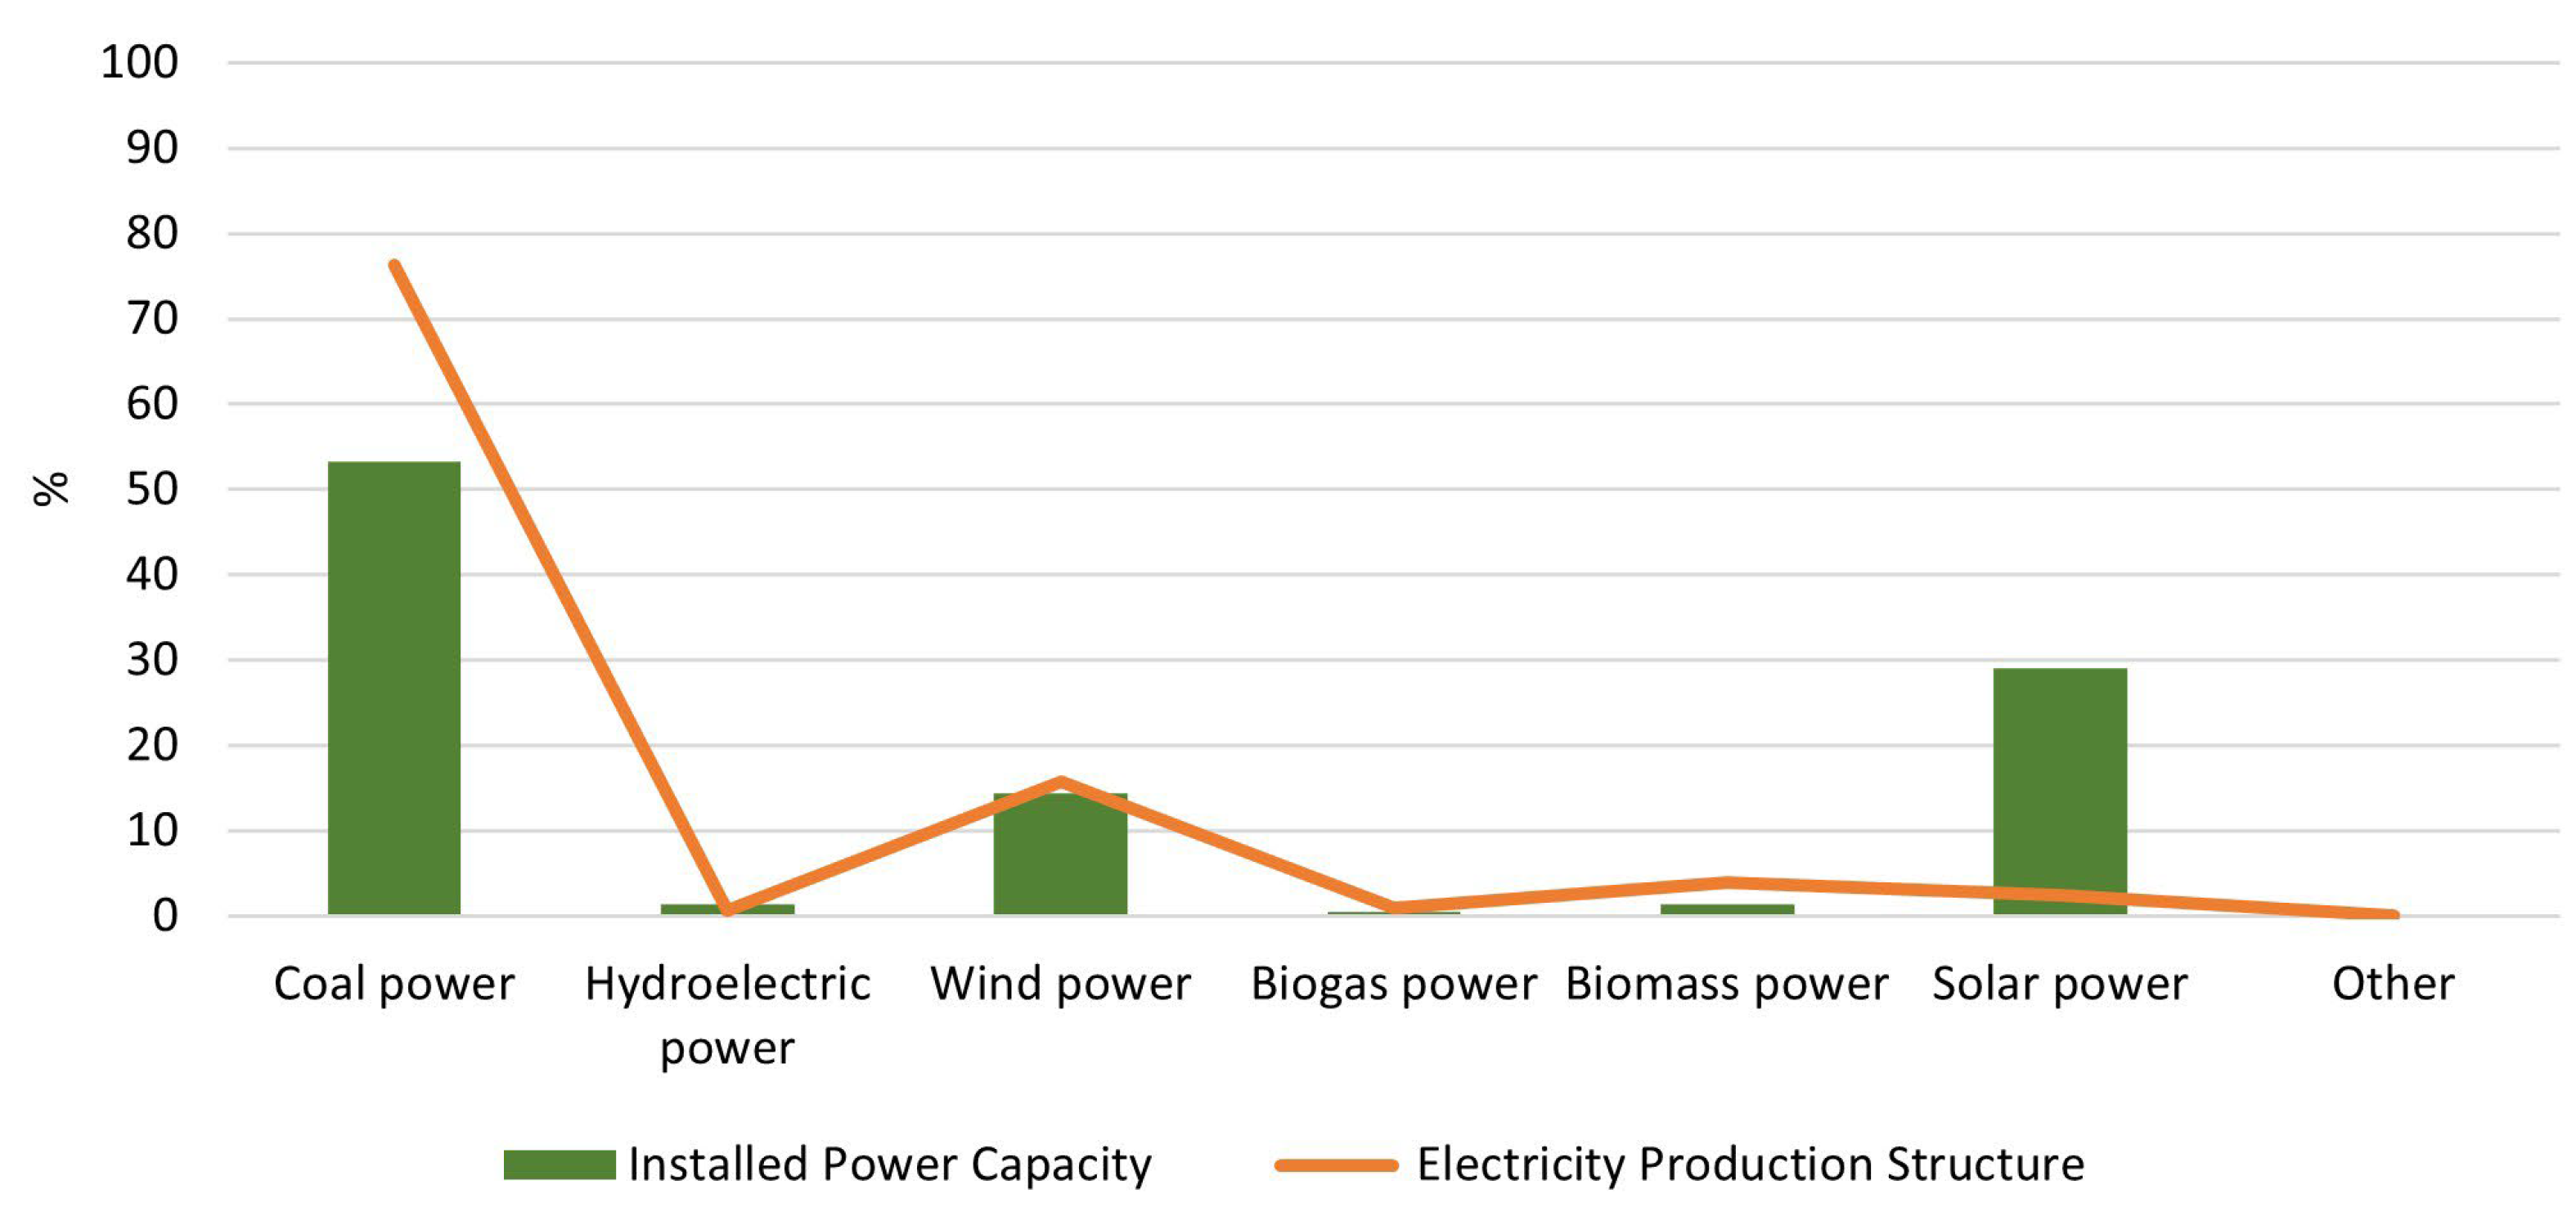
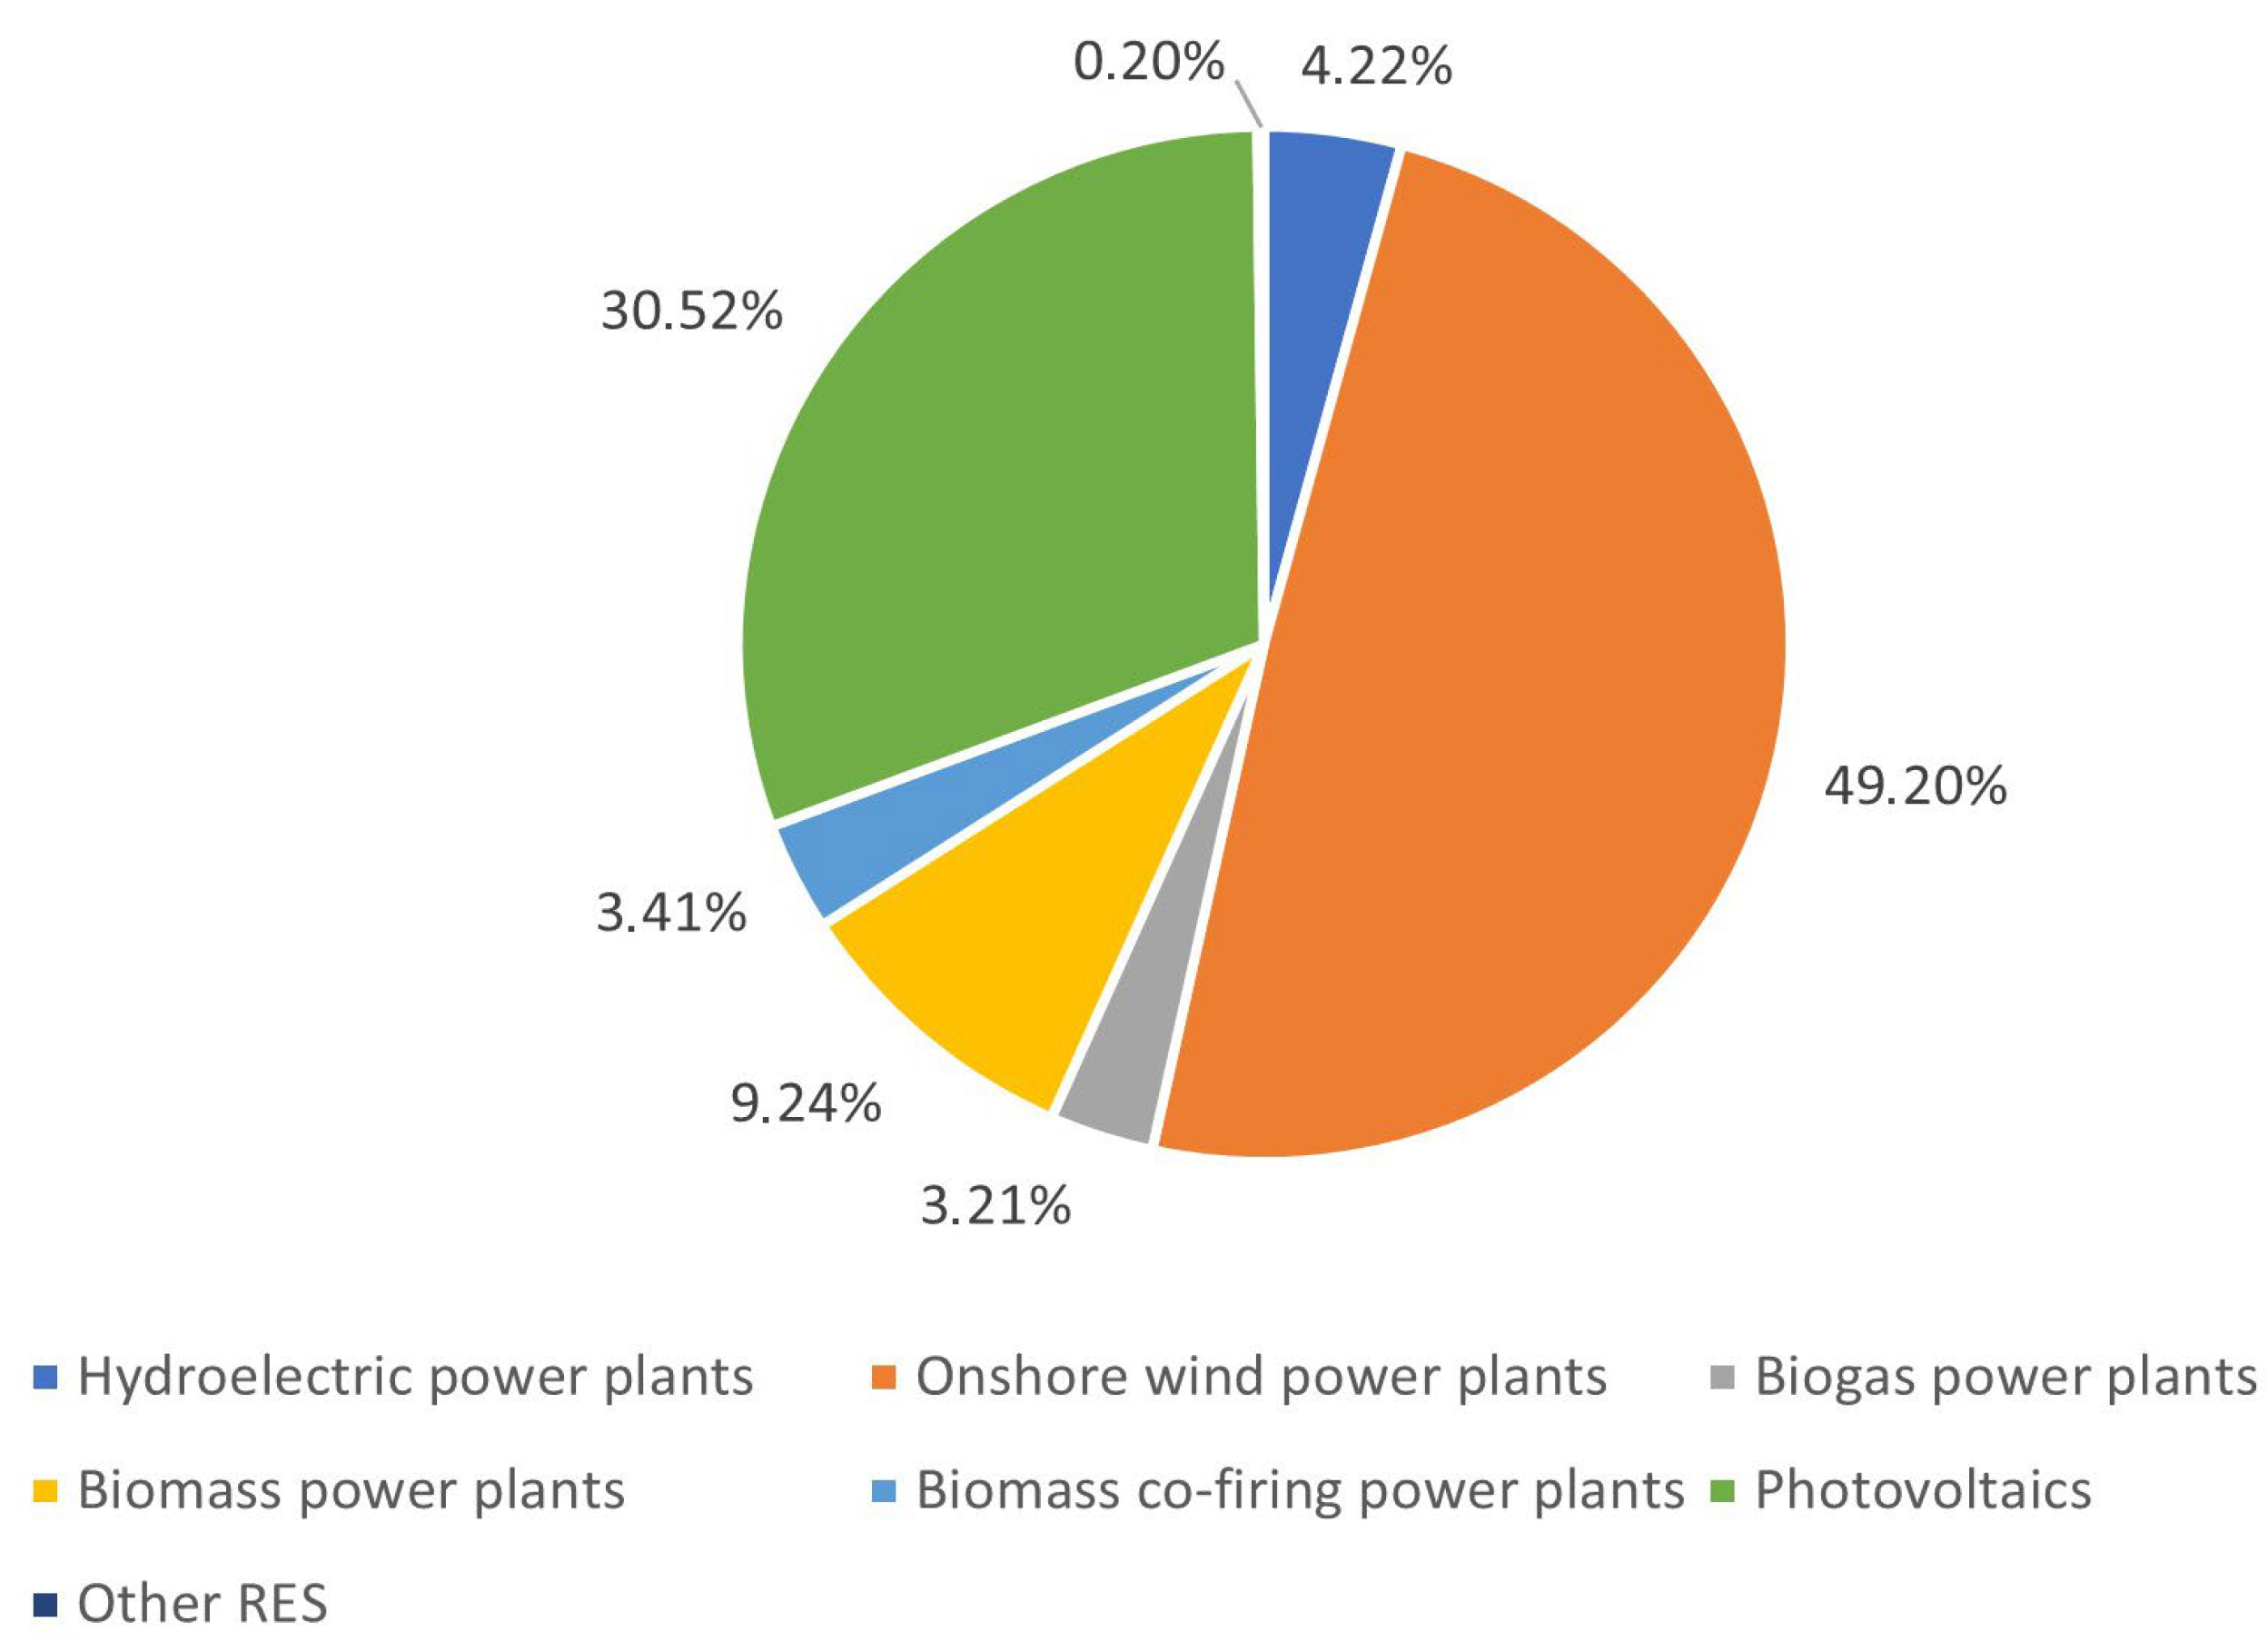
2.2. Current Energy Mix

High emissions from the energy sector lead to elevated energy prices and a decline in competitiveness, primarily due to the high carbon footprint of goods produced in Poland. An analysis of the national energy transition reveals a lack of a single coherent plan and a holistic approach, particularly regarding energy security issues [17]. Similar to Germany, Poland is experiencing a significant increase in electricity production from intermittent RES such as wind and solar. At the end of December 2024, the installed PV capacity in Poland amounted to 21,157 MW, while the capacity of wind power plants reached 10,139 MW [10]. Considering that the average electricity consumption of Polish industry is around 70 TWh per year, challenges in maintaining the stability of the PPS are expected shortly [10]. The inability to control the operation of weather-dependent RES results in electricity production that does not match actual demand, leading to suboptimal use of installed capacity, as shown in Figure 4.
The continuity of energy supply in Poland is currently ensured primarily by coal-fired power plants, which, in addition to producing high emissions, are in poor technical condition, resulting in frequent failures [18]. Another challenge is the limited flexibility of these units and the requirement to maintain their technical minimum, i.e., the minimum generation level below which they should not fall if they are to be efficiently brought back online later [19]. The average load of generating units is usually around 40–50%, which means that the only way to reduce capacity below this level is to shut them down completely [20]. However, restarting such units is a time-consuming process, taking at least 6–8 h in the case of coal-fired power plants, making it impossible to respond quickly to fluctuations in RES generation. Furthermore, the start–stop process is costly, as it leads to increased turbine wear and the consumption of expensive start-up fuels [18].

2.3. Flexibility Gaps in the Polish Power Sector

The limited flexibility of coal-fired power plants and their planned phase-out increases the demand for stable and controllable power sources. One of the oldest and most established methods of energy storage is the use of pumped-storage power plants (PSPs) [21]. In recent years, PSPs have accounted for approximately 3% of global installed electricity generation capacity and 99% of total grid-scale energy storage capacity, making them the most widely used form of mechanical energy storage. However, these systems pose several significant challenges. One of the primary concerns is the need for suitable geological conditions to construct upper and lower reservoirs that can withstand considerable fluctuations in water levels [22]. Another limitation is the periodic water shortages caused by droughts, which are becoming more frequent due to climate change. These challenges are also evident in Poland, where the total installed capacity of PSPs is only 1.5 GW [23]. An alternative to PSPs is battery energy storage systems (BESS), which enable the management and dispatch of previously generated electricity [24]. The most commonly used BESS technology utilizes lithium-ion batteries, which are renowned for their high energy efficiency, energy density, and long charge–discharge cycle life [25]. However, their large-scale deployment is currently constrained by high investment costs. Despite ongoing price reductions, driven by technological advances, economies of scale, and process optimization, the limited availability of key raw materials, such as lithium and cobalt, may become a bottleneck for further development. In the worst-case scenario, this scarcity could increase the risk of geopolitical tensions in resource-rich regions [26]. Furthermore, batteries naturally degrade over time due to repeated charging and discharging cycles, which reduces their lifespan and overall performance [27]. While BESSs hold considerable potential, their limitations, especially regarding the need for large-scale capacity, indicate that they cannot be the sole solution. Ensuring the stability of the PPS, which is fundamental to national energy security, necessitates the exploration and implementation of additional flexible electricity generation options.

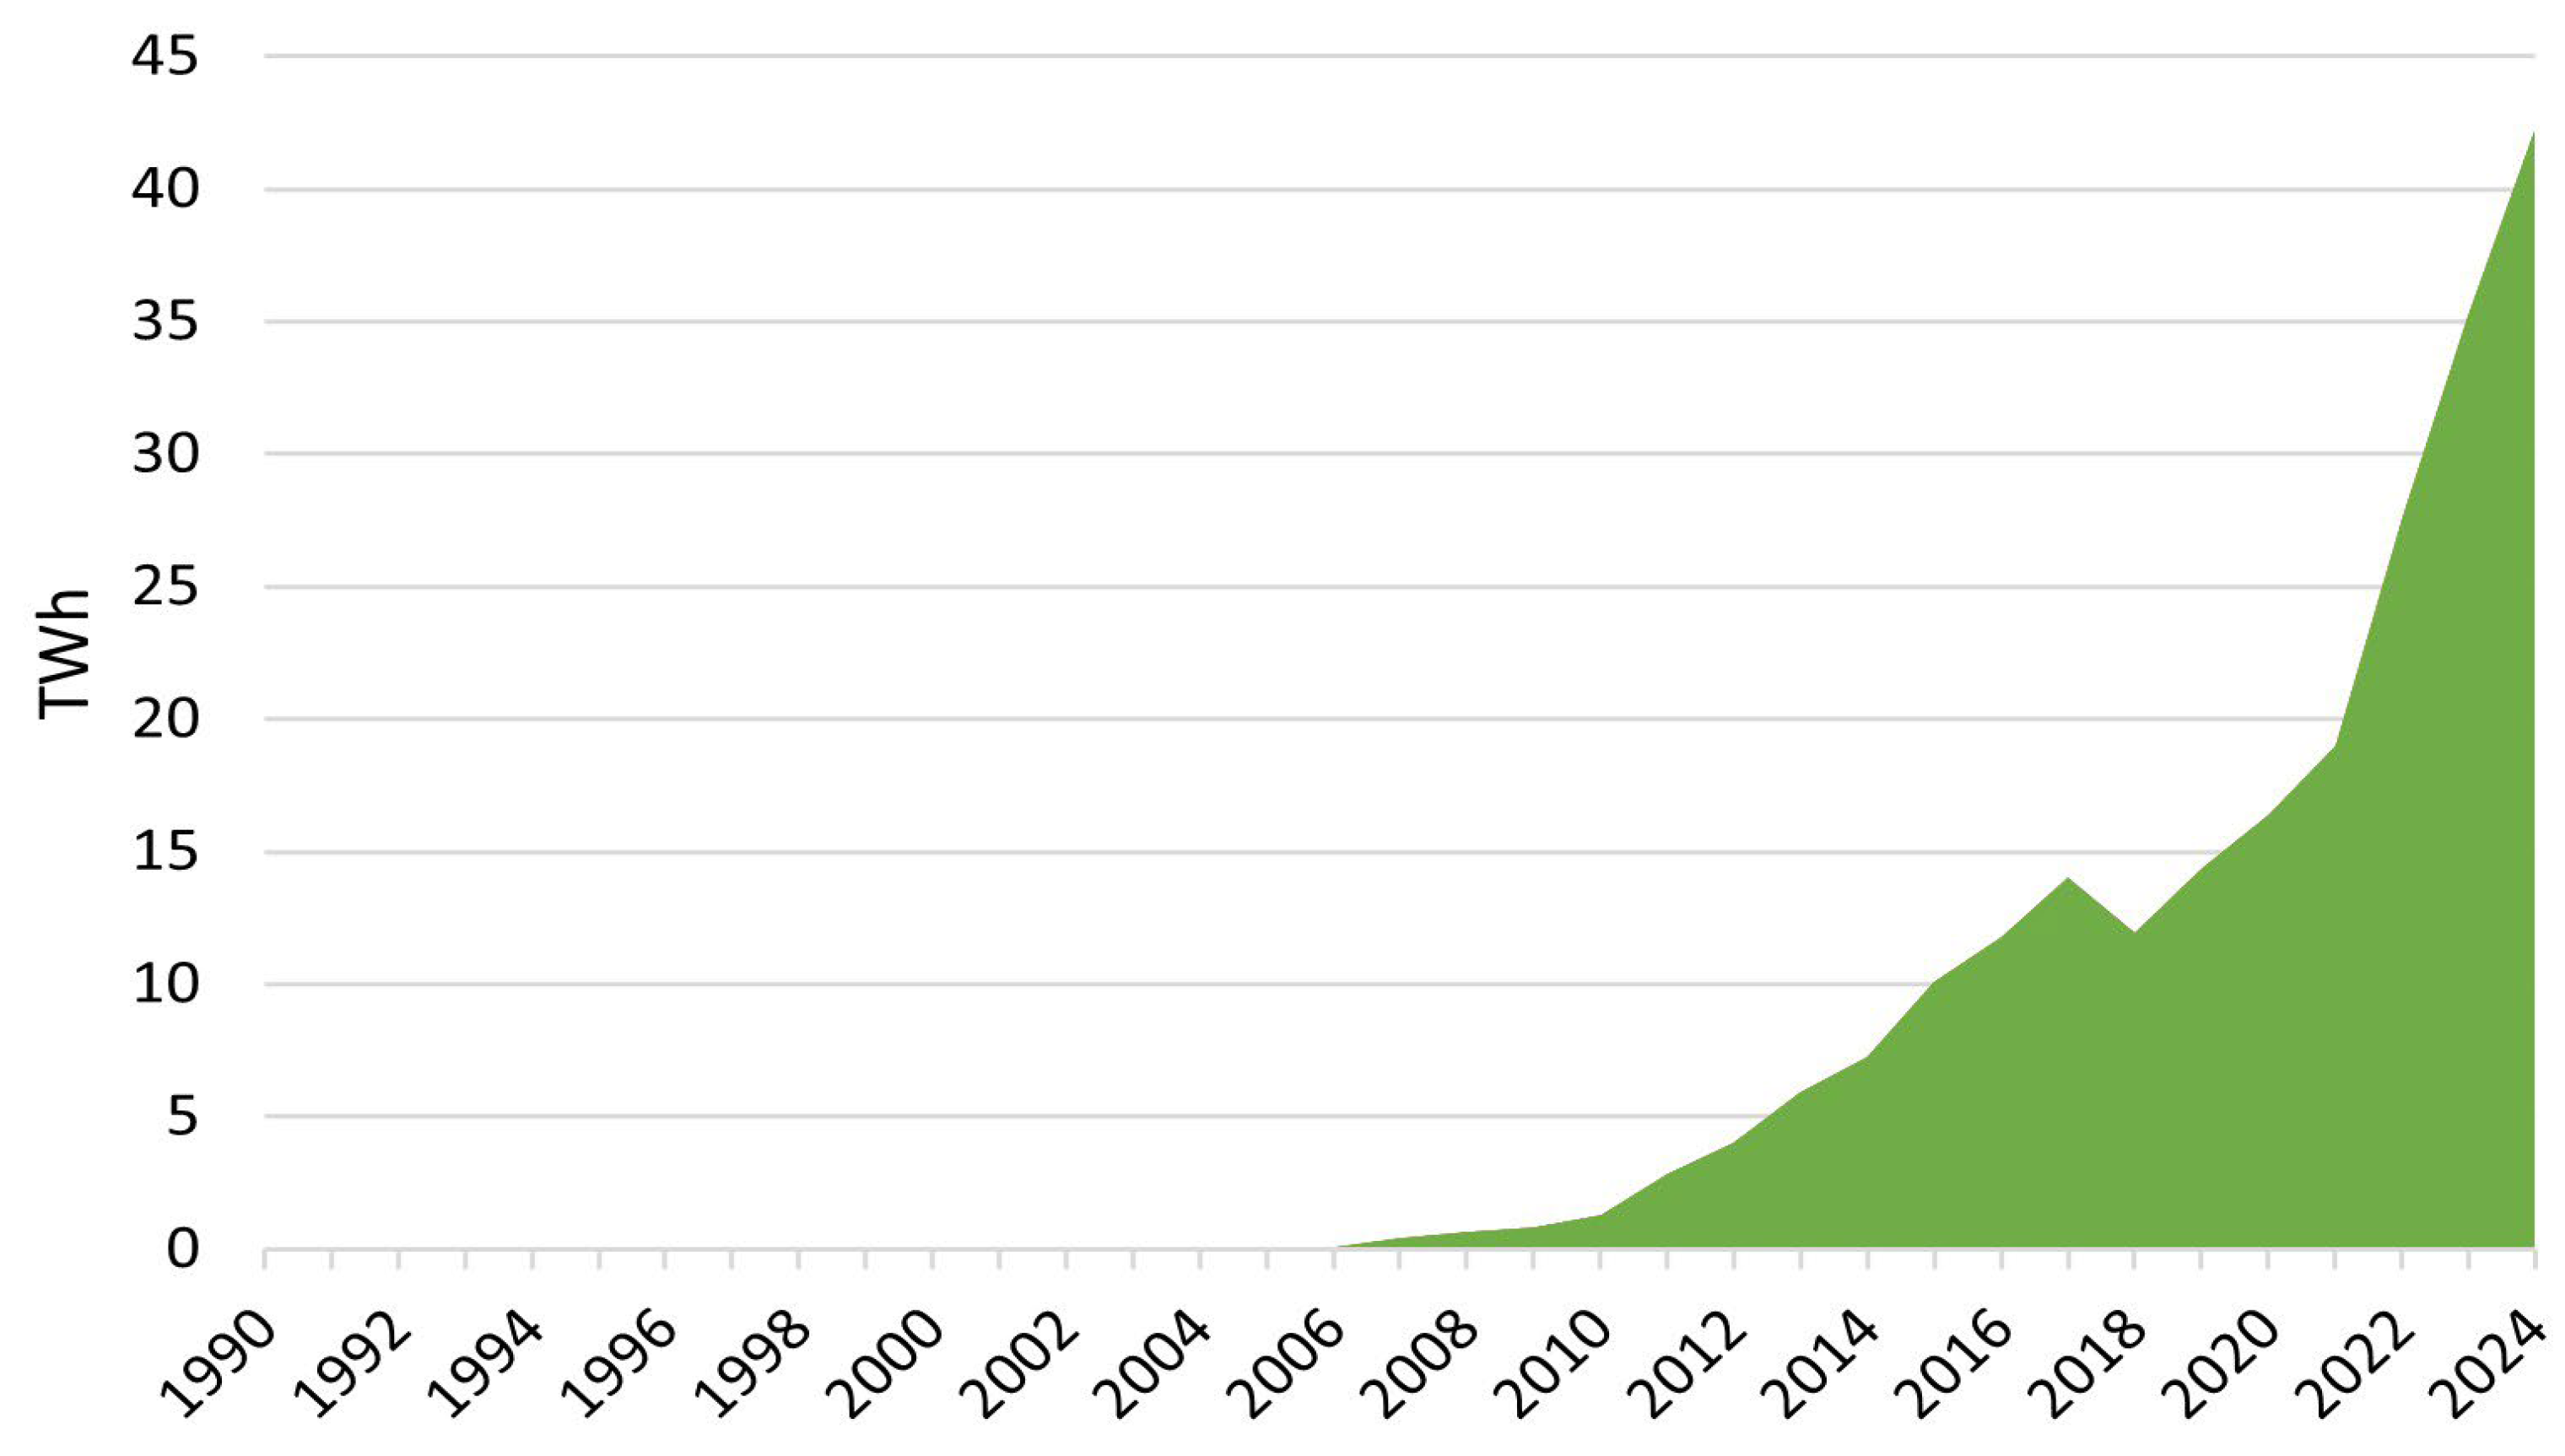
3. Development of Renewable Energy in Poland

The transformation of the Polish energy sector toward zero-emission sources represents one of the most significant challenges of recent years. In this context, the increasing role of RES plays a crucial part in reducing the carbon intensity of the power generation system and in diversifying the national energy mix. Although Poland still relies heavily on coal, the steady increase in the share of energy derived from RES, observed over the past decade and a half, indicates a lasting shift in the direction of national energy policy development. According to the data presented in Figure 5, between 2006 and 2024, electricity generation from renewable sources increased from 69 GWh to 42,208 GWh. As a result, in 2024, RES accounted for approximately 25% of total domestic electricity production.
The increasing significance of RES results from a combination of several internal and external factors. Among the most important are energy policy instruments implemented at the national level and requirements stemming from Poland’s membership in the EU, including the implementation of climate targets [29].
As demonstrated in Section 2.2, PV installations play a dominant role in the installed capacity structure of RES. The dynamic development of this technology in recent years has primarily been driven by the implementation of comprehensive investment support mechanisms, mainly targeted at households. Programs such as “Mój Prąd” and “Czyste Powietrze” combined with tax incentives, have significantly lowered the entry barriers for prosumers and contributed to the widespread adoption of PV [30]. Additionally, the increasing availability of technology, decreasing component costs, and growing environmental awareness among the public have further reinforced this trend [31]. Legislative conditions have also had a significant impact on the development of PV. Until 2022, Poland operated a net-metering system that allowed prosumers to feed surplus electricity into the grid and subsequently withdraw it without additional costs. This energy-balancing model encouraged investments by substantially increasing the profitability of micro-installations. Following the introduction of the net-billing system in 2022, which ties settlements to current market prices, the growth rate of new installations did not experience a significant slowdown and continues to be widely regarded as an attractive and profitable investment option [32].
Despite the dynamic growth in the number of PV installations in Poland, the installed capacity of these systems significantly diverges from their actual power output due to the inherent characteristics of this energy source. Owing to the variability of solar irradiance and the inability to operate flexibly, the contribution of PV to renewable electricity generation remains limited. Consequently, onshore wind farms play a crucial role in the national renewable energy mix, as illustrated in Figure 6.
In 2024, onshore wind farms accounted for nearly half of Poland’s total electricity production from RES. However, this sector does not have the same favorable legislative conditions that support the growth of PV. In 2016, a regulation was introduced requiring a minimum distance between wind turbines and residential buildings, set at ten times the total height of the turbine, known as the 10H rule. The implementation of this regulation effectively halted the development of a significant number of new onshore wind projects [33]. As a consequence, interest has shifted toward offshore wind energy, as evidenced by the ongoing construction of Poland’s first offshore wind farm [34].
Simultaneously, discussions are ongoing regarding the construction of Poland’s first nuclear power plant, which is intended to serve as an alternative to weather-dependent RES. Although the development of nuclear energy is considered a rational strategy within the context of the essential energy transition toward a low-emission economy, implementing this project involves numerous significant challenges. The primary barriers include high capital expenditures, a prolonged construction process, and issues related to the acquisition, storage, and final disposal of radioactive materials [35,36].

4. Biogas as the Key Component of a Stable Renewable Energy System

4.1. Biogas Plants as Part of a Circular Economy

In the context of the dynamic development of RES in Poland and Europe, technologies that are not dependent on weather conditions, the time of day, or the year are becoming increasingly important. Biogas, which is produced by the methane fermentation of organic materials, is a unique example of a stable and flexible RES. Biogas plants are an excellent example of a circular economy (CE), which aims to keep resources in circulation for as long as possible through reuse, reprocessing, and recycling, thereby reducing environmental pressure and minimizing the amount of waste sent to landfills [37]. This model replaces the linear “take–make–use–discard” approach with closed value chains, where the by-products of one process become valuable raw materials for another. Anaerobic digestion produces biogas, which can be used to generate electricity or heat, thereby reducing dependence on fossil fuels.
Additionally, the digestate that forms during this process is a rich source of nutrients, and its further processing (e.g., composting) makes it possible to obtain high-quality organic fertilizer. In this way, biogas recovery aligns with CE principles by minimizing resource losses and cutting greenhouse gas emissions [38]. A key aspect of integrating waste-processing facilities into a CE framework lies in harnessing diverse streams of organic waste, such as sewage sludge, animal manure, or food residues [39]. By carefully selecting substrates, one can increase biogas yields while simultaneously recovering mineral nutrients in the form of fertilizers. Moreover, such solutions help lower the risk of contaminating water and soil with waste stored under aerobic conditions [40].
Nonetheless, embedding waste treatment practices within a CE paradigm requires both appropriate legal regulations and investment support. Stable financial and organizational frameworks are needed to facilitate the expansion of local agricultural biogas plants or composting facilities [41]. Equally important are educational initiatives that encourage waste segregation and the selective collection of organic materials, thereby improving the effectiveness of downstream utilization. In summary, waste processing within a CE model allows for the following:
  • Energy recovery in the form of biogas, alongside reduced methane emissions into the atmosphere;
  • Soil enrichment through the use of stable organic fractions (digestate, compost);
  • Reduced environmental pressure by cutting down on landfilled waste volumes;
  • Promotion of the local economy, wherein waste becomes a valuable resource in subsequent stages of the production chain [42].
Hence, implementing solutions that encourage anaerobic digestion constitutes a key element in advancing sustainable waste management and effectively realizing the objectives of a circular economy.

4.2. Technical and Technological Challenges

The storage and processing of animal manure in biogas plants significantly reduce methane (CH4) and other greenhouse gas (GHG) emissions, which would otherwise arise from the conventional storage of slurry, manure, or food waste. This is particularly relevant in countries with a high share of livestock production, such as Poland, one of the EU’s largest producers of manure. Utilizing these feedstocks in anaerobic digestion (AD) installations primarily mitigates methane emissions generated by standard storage methods, while also reducing nitrous oxide (N2O) and fossil-based carbon dioxide (CO2) emissions [38,43]. In anaerobic digestion, methane is produced through the decomposition of organic matter under anaerobic conditions, which are characterized by the absence of oxygen. When manure and other animal waste are treated in a controlled environment (e.g., sealed tanks), the resulting biogas can be used as a fuel for electricity and heat generation. In this way, methane emissions are significantly reduced, as the gas is combusted rather than released directly into the atmosphere [38]. Additionally, digestate (the residual fraction left after fermentation) can be used as a fertilizer, reducing the need for mineral fertilizers and thereby lowering emissions in the production chain [39]. However, methane leaks and venting from biogas plants may still constitute a significant emission source if facilities are not adequately secured and continuously monitored [43]. Therefore, the following are crucial:
  • Maintaining the technical condition of installations by sealing fermenter tanks and gas storage covers, as well as controlling system pressure.
  • Conducting leak surveys that enable swift detection and mitigation of localized CH4 emissions.
  • Optimizing storage conditions and duration for digestate (e.g., storing it in sealed containers) to further reduce methane and nitrous oxide (N2O) formation during storage [38].
From the perspective of the agri-food sector’s emission balance, biogas plants contribute to closing the carbon loop [44]. Methane produced from the breakdown of organic matter can be utilized as a fuel for electricity and heat generation, thereby replacing fossil energy sources and reducing fossil-derived CO2 emissions. Notably, in large biogas plants integrated with district heating or gas supply networks, emissions can be further reduced by feeding biomethane into the national grid [45].
The following are examples of GHG emission reduction benefits from biogas plants:
  • Lowering methane emissions from the conventional storage of slurry by several tens of percent annually [43].
  • Reducing N2O emissions—this gas primarily originates from storing and applying manure and digestate, but with proper digestate management, emissions can be significantly curtailed [46].
  • Replacing fossil fuels: biogas can be used to generate energy for on-farm needs; any surplus can be sold or supplied as heat in local grids [45].
  • Recycling nutrients: the digestate serves as an organic fertilizer, supplying readily available nitrogen and phosphorus to soil, reducing the demand for mineral fertilizers and thus lowering the carbon footprint of agricultural production [39].

4.3. Benefits from Biogas Production

The expansion of biogas plants results in a substantial decrease in greenhouse gas emissions in the agricultural and food sector. However, fully harnessing this potential requires not only implementing suitable technologies but also ensuring proper operational oversight and tailored legislative solutions. Generating energy in Combined Heat and Power (CHP) systems enables the simultaneous production of electricity and heat from biogas, thereby maximizing energy conversion efficiency [27]. In practice, this translates into lower energy production costs and reduced dependence on fossil fuels. In many biogas plants, surplus heat is utilized to warm local households, production facilities, or other public utility buildings [47], thus significantly reducing residents’ operating costs, particularly in municipalities and counties with dispersed housing. Cogeneration installations provide a stable source of thermal energy year-round, thereby reducing the need for the power grid or additional coal-fired boilers, as well as lowering monthly heating bills [48]. In agricultural areas, organic waste (e.g., manure, food leftovers) can serve as an excellent substrate for biogas production [49]. The heat from CHP units can be used in grain-drying processes, improving their quality and reducing post-harvest losses [47]. Industries such as food processing, brewing, or dairying require large amounts of heat for pasteurization, cooking, and washing processes. A local biogas plant can provide a stable and more affordable source of heat, supporting the growth of small and medium-sized enterprises [50]. The construction and operation of biogas plants and their accompanying CHP systems require skilled personnel for both technical services and substrate supply logistics [51]. In this way, new jobs are created in the renewable energy sector. Delivering feedstock to biogas plants (e.g., agricultural residues) generates income for local farmers and encourages the emergence of energy–agricultural clusters [52]. Establishing energy cooperatives (involving local governments, farmers, entrepreneurs, and residents) can speed up local development and strengthen social ties [27]. The local production and consumption of energy (both electricity and heat) make a region less vulnerable to sudden interruptions in supply from the central power grid [53]. Having an in-house energy source from biogas stabilizes costs and shields communities against rising oil or natural gas prices [47]. In regions with dispersed infrastructure, smaller, decentralized generation units help distribute the load more evenly and create more investment opportunities for energy management at the local level [48].
In summary, introducing biogas plants with CHP systems on a local scale plays a pivotal role in enhancing residents’ quality of life, boosting economic development in municipalities, and building resilience against external market factors in the energy sector. Through the comprehensive use of both heat and electricity, communities become more self-sufficient, more economical, and better prepared to respond to shifting market and climate conditions.

5. The Potential of Demand-Driven Biogas Plants

5.1. Advantages of Flexible Electricity Production

A key advantage of a biogas plant is its ability to store biogas, thereby stabilizing the electrical power system. Flexible membrane domes or separate tanks for storing are typically installed between the fermenter tank and the cogeneration engine to accumulate any surplus gas [54]. From the perspective of grid operators, a biogas plant offers a form of built-in “energy storage” that provides several operational advantages.
(1)
Flexible Power Output Control
The cogeneration engine can be switched to higher output during hours of peak demand or network deficit, when market prices are most profitable [55].
(2)
Reducing the Need to Curtail Other Renewables
In cases of surplus wind or solar power, the biogas engine can be turned down or paused entirely, and the gas itself can be stored in tanks until it is needed [56].
(3)
Minimizing System Losses
Adjusting a biogas plant’s operations flexibly can lessen the need for quick-start, conventional backup units, which are typically less efficient under variable loads. It also prevents grid overload, a concern that becomes increasingly significant with the growing presence of weather-dependent resources, such as photovoltaics and wind power [57]. It is crucial to manage the fermentation process and feedstock supply in order to harness the full potential of demand-driven biogas plant operation. Generating higher power at specific times demands careful planning of substrate doses and meticulous reactor performance monitoring to swiftly raise the biogas production rate [54]. Moreover, coordination with the grid operator is essential to accommodate signals regarding current energy demand or projected shortfalls in wind or solar generation [55].
Demand-driven biogas plants:
  • Can ramp up power generation within just a few hours, as demonstrated by full-scale industrial experiences in Germany [58].
  • Improve resource efficiency by minimizing the need to expand conventional backup capacity.
  • Enhance the balancing of electricity markets by allowing biogas facilities to secure higher revenues for production during peak-price periods.
Consequently, with internal storage solutions in the form of surplus biogas, biogas facilities can adapt quickly to fluctuations in energy demand, making them a vital component in the renewable energy mix and supporting the energy transition toward more stable and sustainable power generation.
The potential of demand-driven biogas plants, considering the quantities of available substrates from agricultural and food sectors in Poland, has been estimated based on research conducted by the Ecotechnologies Laboratory (EL), which is part of the Poznan University of Life Sciences, shown in Table 1 and Table 2. The amount of available substrates from agriculture (biomass and animal manures) and from the agri-food industry was taken from statistical data published by the Central Statistical Office in the Statistical Yearbook of the Republic of Poland [59] and the Statistical Yearbook of Agriculture [60]. These quantities were subsequently adjusted based on analyses of the availability of individual substrates for biogas plants, taking into account the profitability of transport (which, for example, eliminated animal manure from small farms, especially in southern and eastern Poland) and competition from other sectors of the economy (e.g., straw, which is needed to produce substrate for mushrooms or biofuels, or beet pulp (high demand in cattle feeding in some regions of the country). The EL team has already employed this analytical approach to estimate the partial substrate potential in Poland [61].
The biogas and methane production efficiency of individual substrates is based on the EL’s research. It should be emphasized that EL is the largest Polish biogas laboratory and has in its database the results of over 3500 substrates tested for biogas efficiency. EL uses the German standards DIN 38414-8 and VDI 4630 in its biogas efficiency tests [62,63]. The E L was the first Polish biogas research facility to successfully complete the quality proficiency test organized by the following German organizations: Verband deutscher landwirtschaftlicher Untersuchungs und Forschungsanstalten (VDLUFA) and Kuratorium für Technik und Bauwesen in der Landwirtschaft e.V. (KTBL) [64].
The calculation methodology shown in Table 1 and Table 2 was as follows: first, the mass of individual substrates was determined using Polish Central Statistical Office (GUS) sources and other available data (including consultations with specialists from specific industries). Then, based on EL research data, the average biogas yield (m3/Mg of fresh mass) and methane content (in %) for each substrate were calculated. The biogas production potential of individual substrates (expressed in million m3) was calculated by multiplying the available mass and biogas yield of the substrates. The methane production potential was calculated by multiplying the obtained biogas potential by the percentage of methane. Finally, the cumulative biogas and methane production potential was calculated by summing the partial results for individual substrates.
The energy potential calculations in Table 3 did not include municipal waste (shown in Table 2) or energy crops, which could be grown on approximately 5% of Poland’s agricultural land. However, these substrates could support the generation of approximately 3 GW of continuous electrical power.
Poland’s annual substrate potential for biogas production is estimated at around 117 milllion tons of organic biomass per year. Due to the dominant role of animal production in the structure of national agriculture, nearly 60% of the available substrates are waste and products of animal origin, which are characterized by a high content of nutrients and organic matter that promote efficient methane fermentation. Additionally, due to the relatively stable nature of animal production throughout the year, the availability of animal-based substrates exhibits high continuity and predictability. The most important livestock species are pigs, cattle, and poultry, while sheep, goats, horses, and fur-bearing animals play a relatively minor role in the overall production structure [65]. Data from the Agency for Restructuring and Modernization of Agriculture from 2024 indicate that the dominant crops in Poland include winter wheat, maize, winter triticale, winter rapeseed, and winter rye. The structure of national agricultural production is a crucial factor in the context of biogas potential, as waste from plant and animal production is the key substrate used in the methane fermentation process. Assuming demand-driven biogas plants operate for an average of 12 h per day, the estimated contribution to the national electricity grid would amount to approximately 7.4 GW of fully dispatchable power, as shown in Table 3.

5.2. Determining the Capacity of the Biogas Plant

When estimating the potential of demand-driven biogas plants, it is essential to consider not only the total volume of available substrates but also their spatial distribution. The country’s agrarian structure is characterized by the predominance of small-scale agricultural holdings, which directly affect the scale and power of demand-driven biogas plants [66].
The economic viability of biogas plant construction is most commonly assessed using standard financial indicators such as Net Present Value (NPV), Internal Rate of Return (IRR), and Payback Period (PBP). Due to the larger scale of energy production and consequently higher revenue installations with greater installed capacity and higher production efficiency generally exhibit superior economic performance [67,68]. For instance, in the case of a 52 kW biogas plant utilizing cattle manure as a feedstock, the IRR amounts to 11%, while the PBP is approximately 8.16 years. In contrast, for a 355 kW installation based on the same type of substrate, these indicators are significantly more favorable: the IRR reaches 16%, and the PBP is reduced to 5.74 years [69]. This correlation is further supported by the data presented in Table 4, which demonstrates an improvement in investment profitability as installed capacity increases.
However, the selection of biogas plant capacity should primarily be guided by the availability of feedstock at the specific location. A thorough analysis of the feedstock potential is a crucial stage in planning an investment, as it determines both the economic viability and long-term operational stability of the project. In addition, an essential factor influencing the size of a planned installation in Poland is legal regulations, in particular the provisions of the Act of 3 October 2008 on the dissemination of environmental information and its protection, public participation in environmental protection, environmental impact assessments, and the Regulation of the Council of Ministers of 10 September 2019 on projects that may significantly affect the environment. According to these regulations, agricultural biogas plants with a capacity of up to 0.5 MW are exempt from the obligation to obtain an Environmental Impact Assessment Decision. Given these provisions, demand-driven biogas plants should be designed with capacities ranging from 250 to 300 kW, with the potential for operation at peak capacity of up to 500 kW.

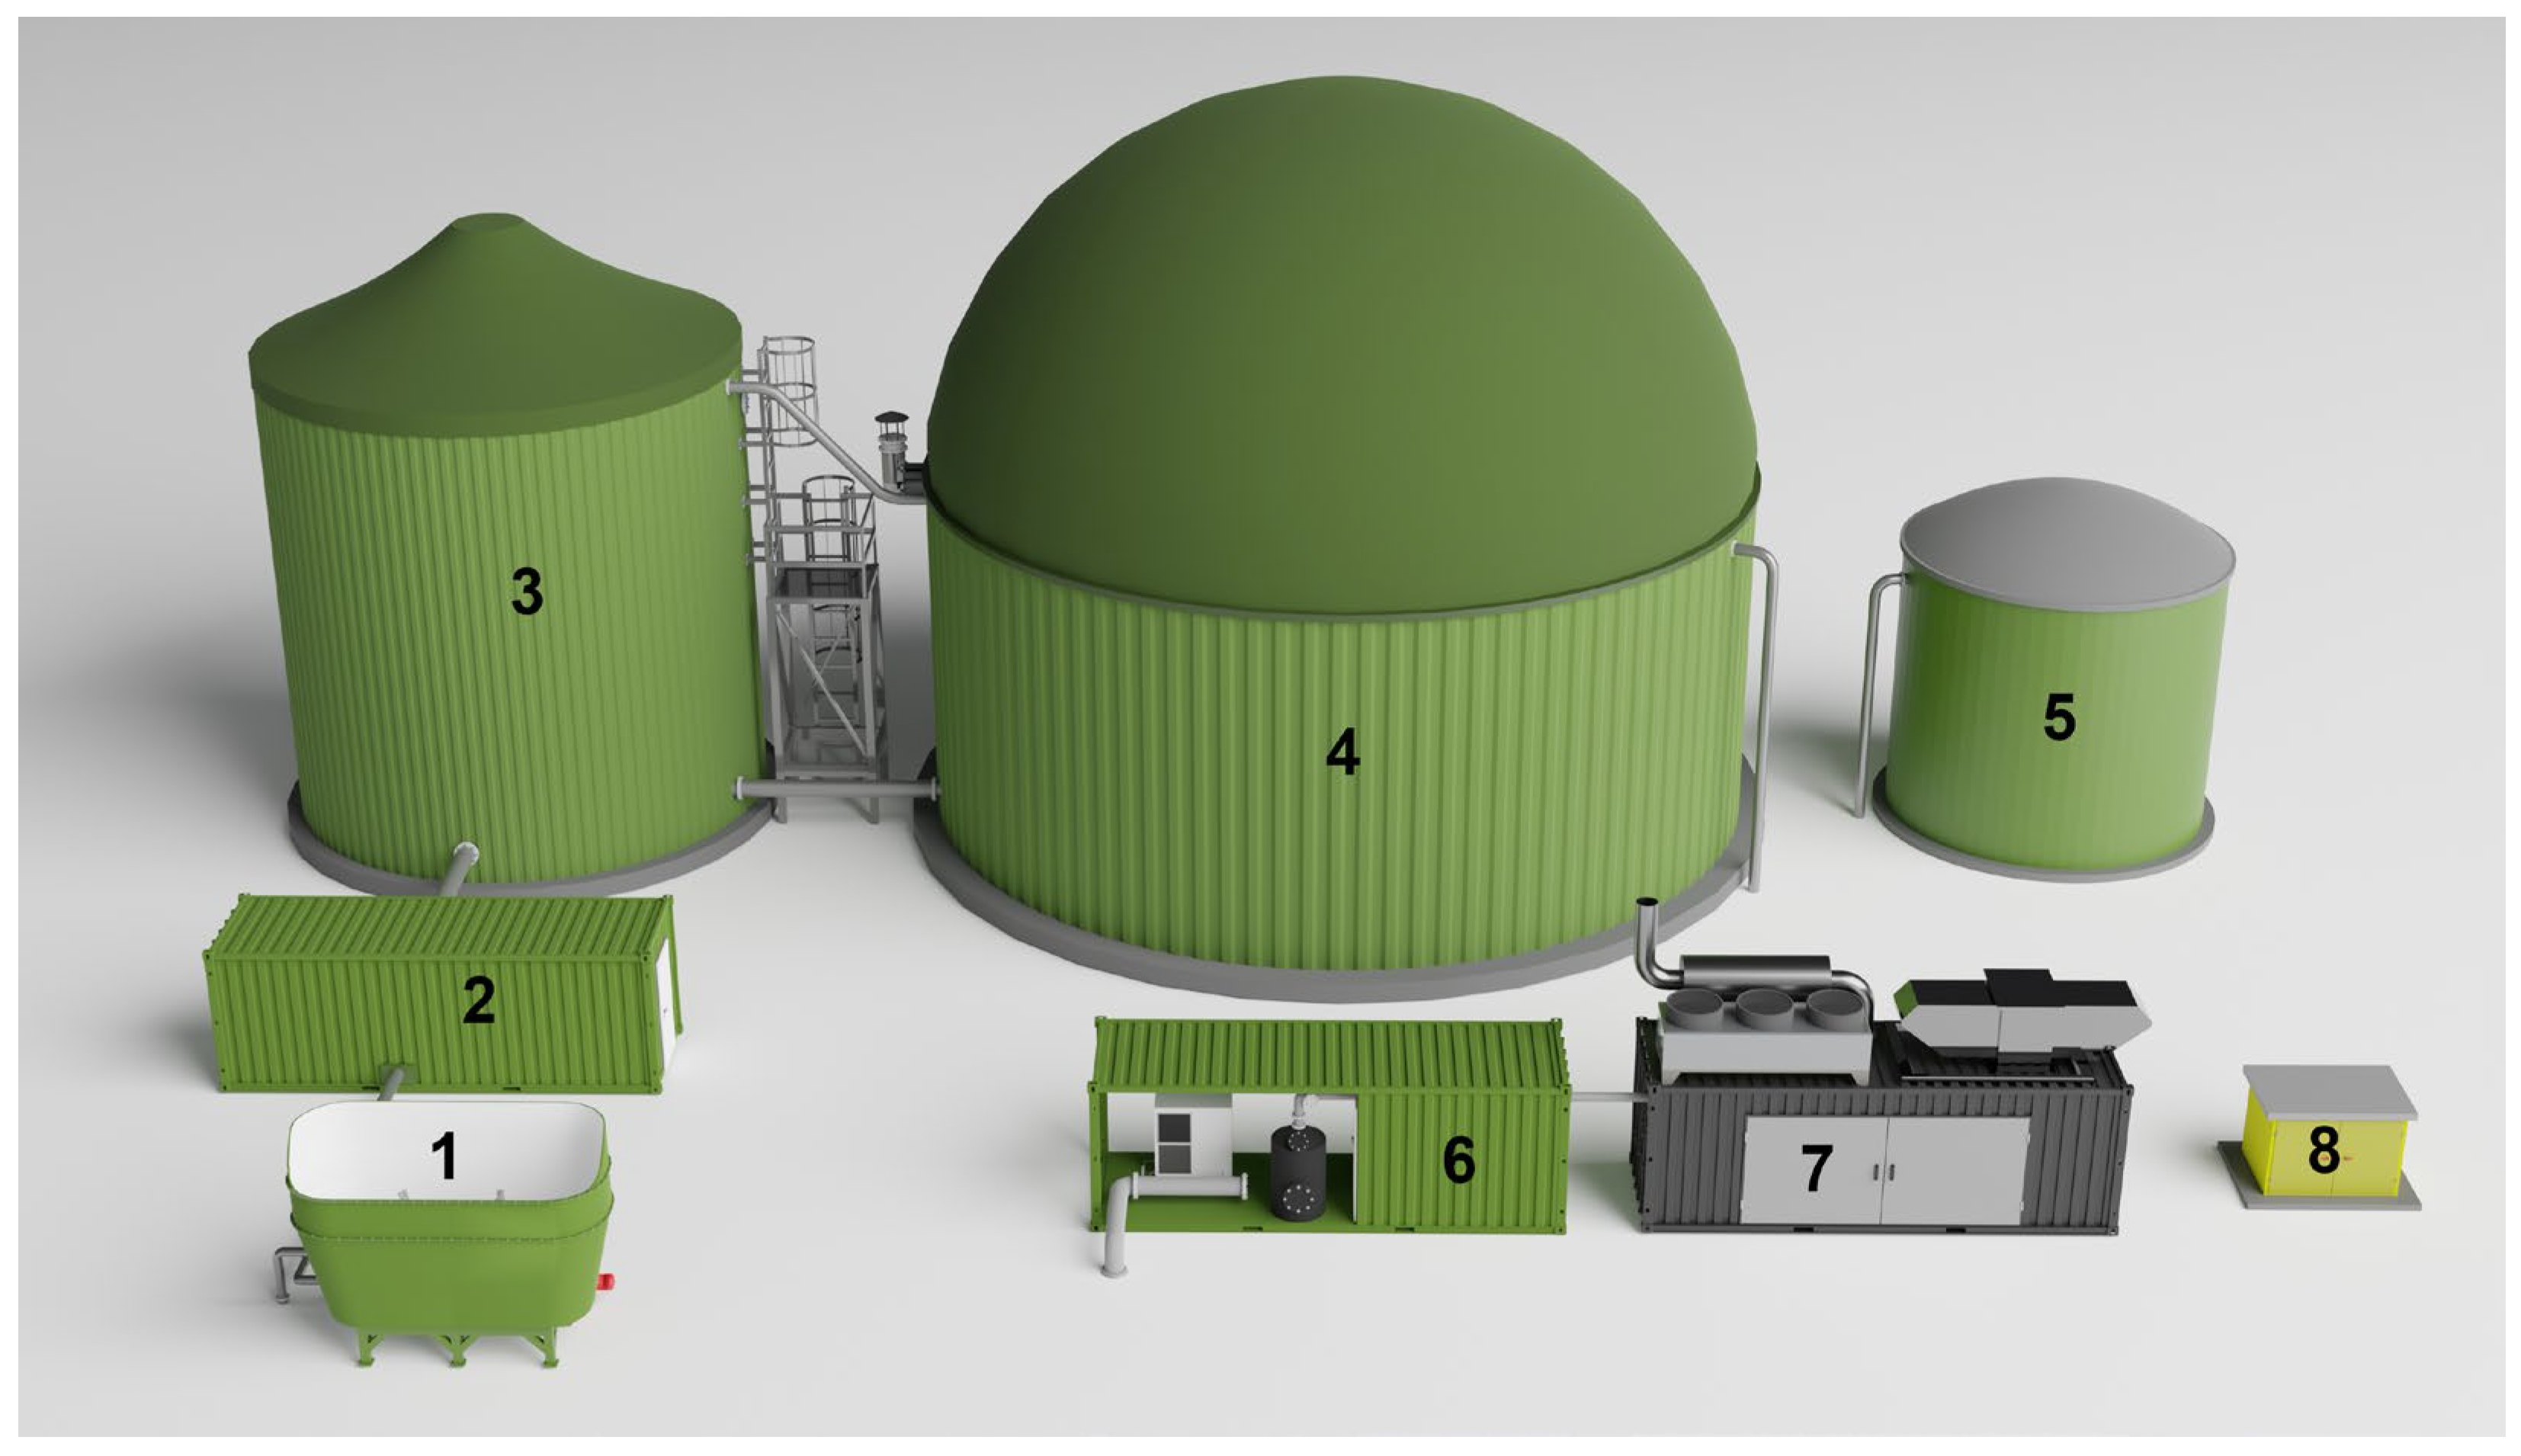
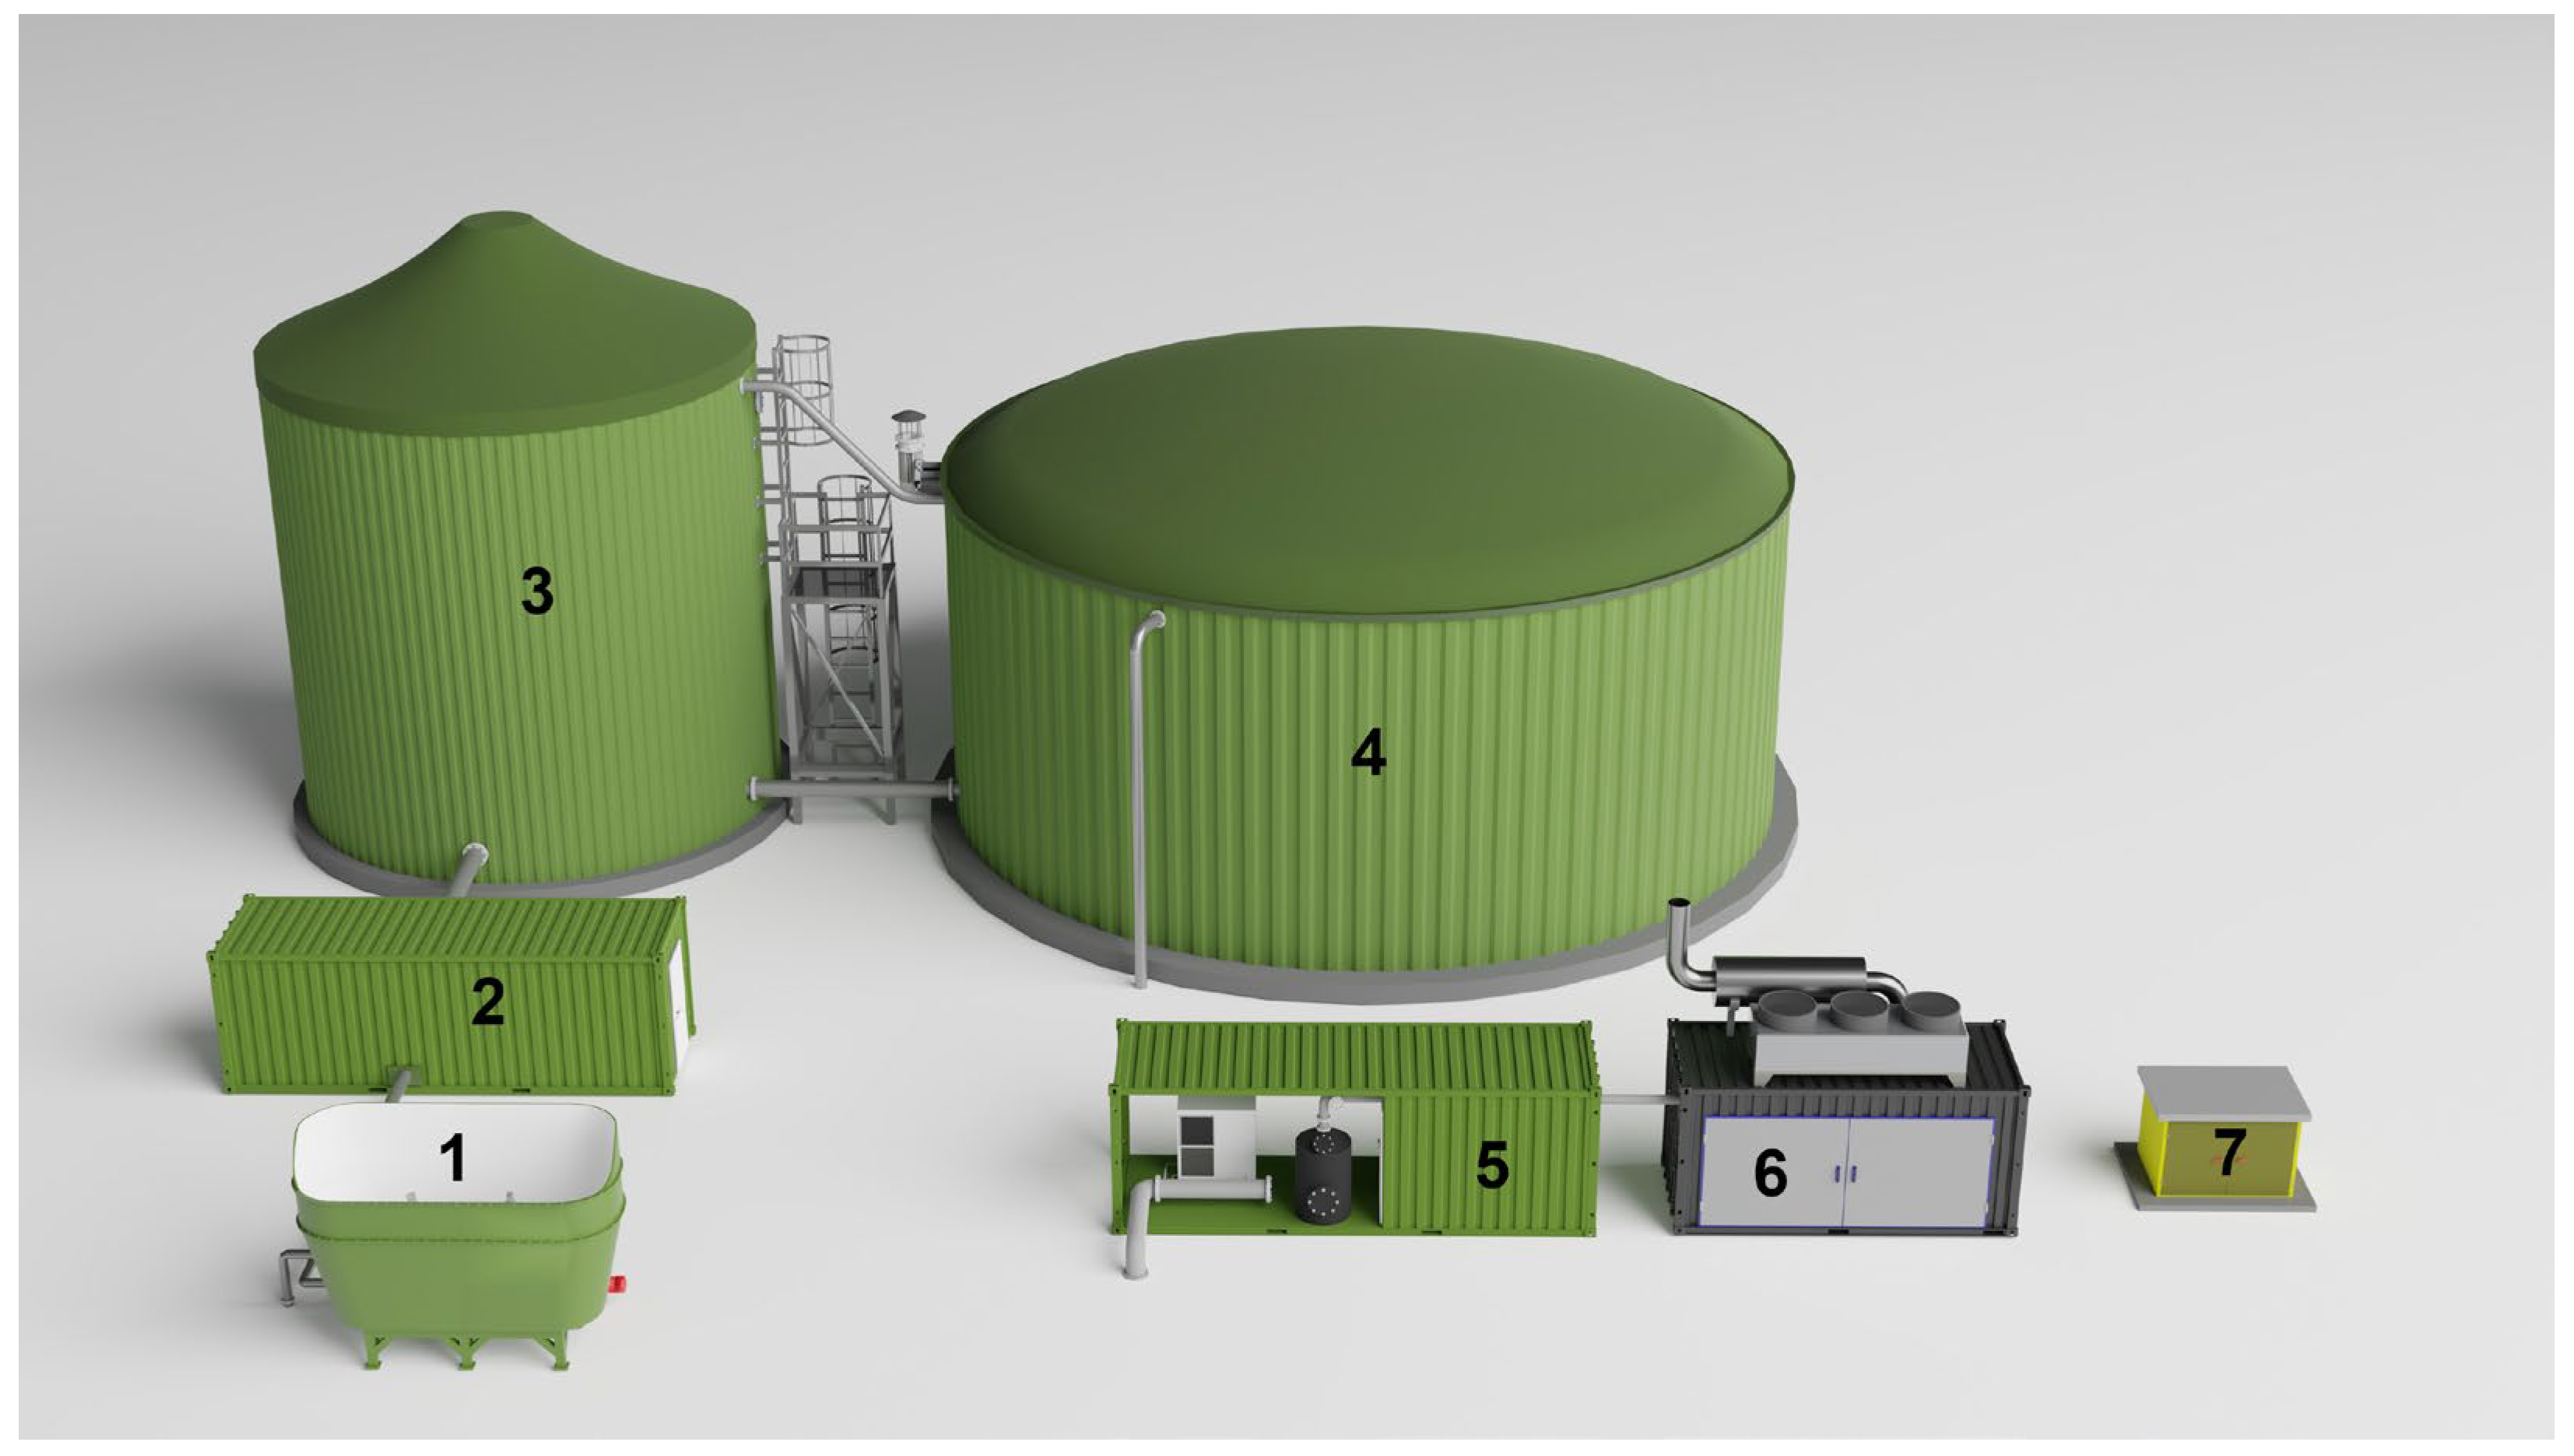
6. The Operation of Demand-Driven Biogas Plants

6.1. Comparison Between Traditional and Demand-Driven Biogas Plant

The operation of the demand-driven biogas plant shown in Figure 7 does not differ fundamentally from the operation of a traditional, linear plant as shown in Figure 8.
The energy produced in biogas plants is usually generated in CHP, which enable the simultaneous production of thermal and electrical energy by burning previously generated biogas [71]. The heat generated in cogeneration units is primarily used to maintain the right temperature for the methane fermentation process, which is necessary to optimize biogas production efficiency. Surplus heat can be used for other purposes, such as heating livestock or residential buildings. The electricity produced in cogeneration is fed into the power grid, which is monitored by the Distribution System Operator assigned to the region. Controlling the energy production in CHP requires precise management of the engine’s operation, the parameters of which, such as minimum load, start-up time, and rate of power change, determine its technical flexibility [47]. The greater the controllability in terms of adapting power to changing demand, the easier it is to use it to stabilize the PPS. The ability to quickly adjust the level of energy production in response to changes in demand enables biogas plants to act as stabilizers that can be activated when energy demand is high or deactivated during periods of low demand [72,73,74].

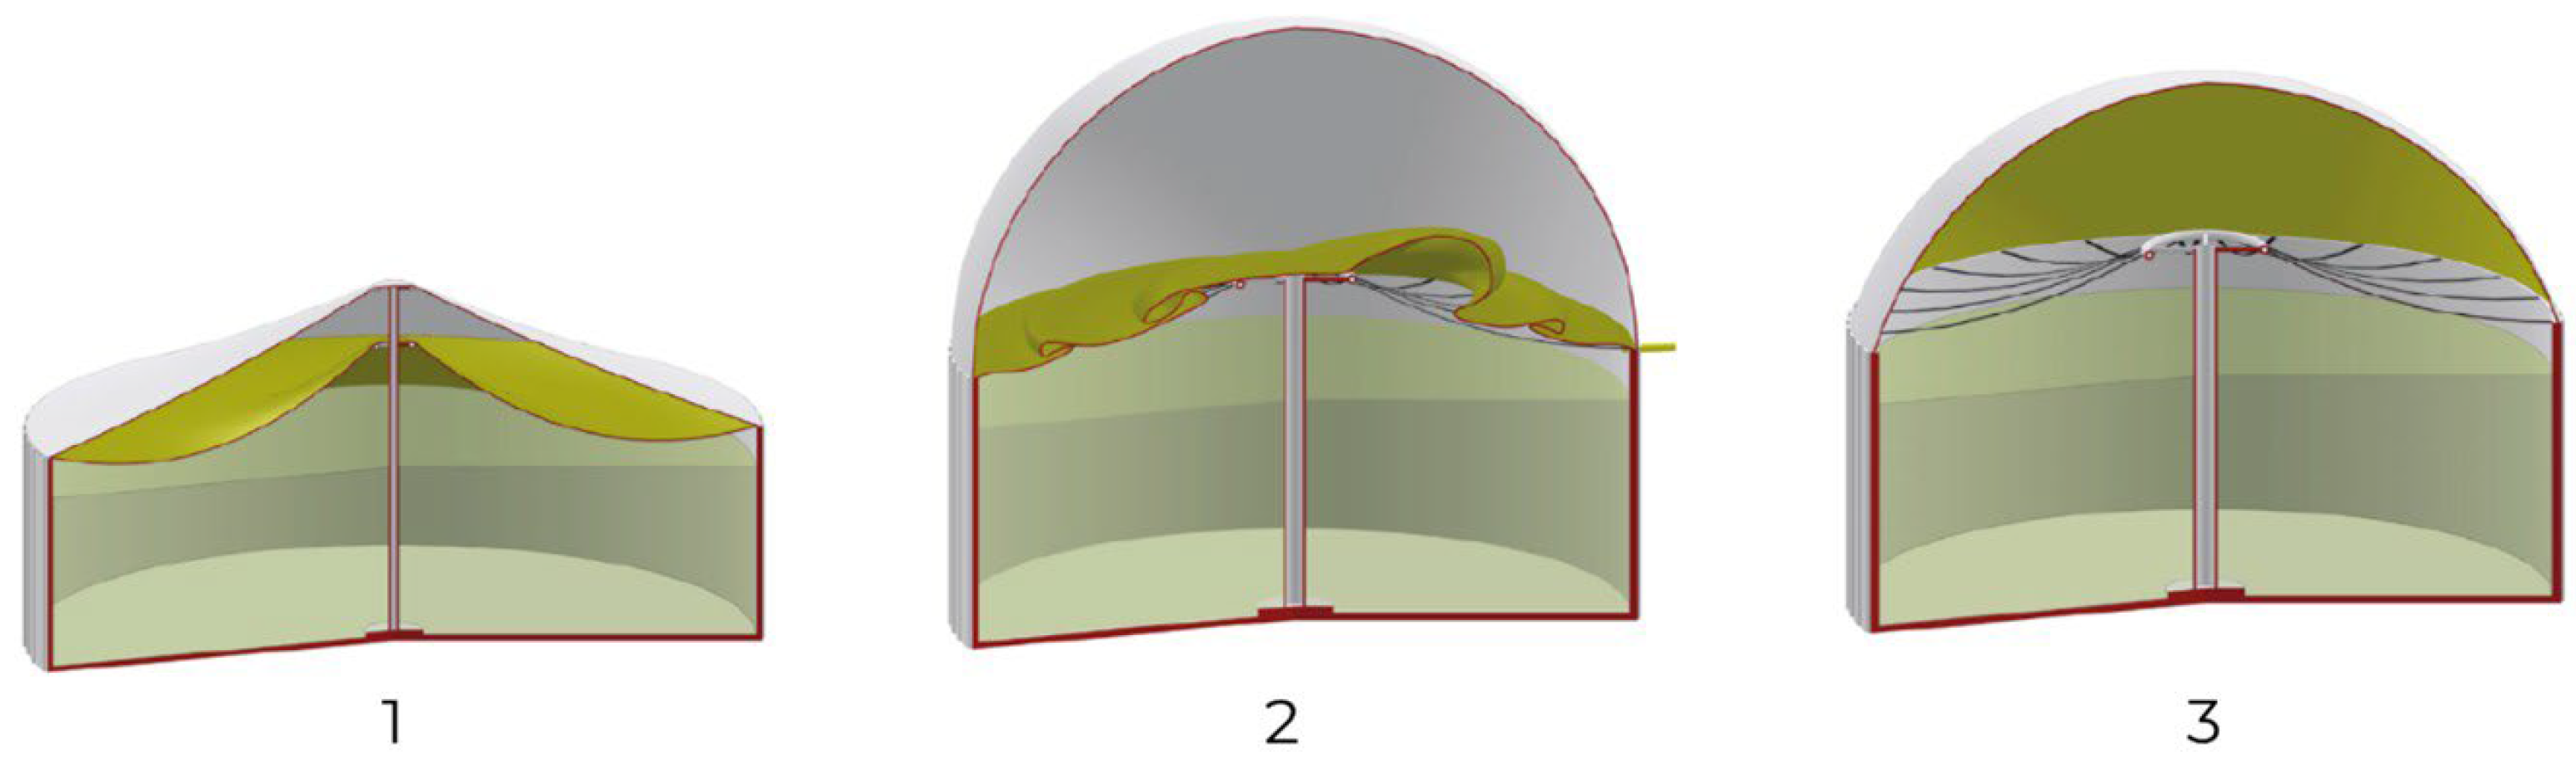
6.2. Storage of Biogas

If energy production needs to be reduced, the engine load can be lowered by reducing the amount of biogas supplied or by shutting it off completely. In both cases, the methane fermentation process is not inhibited or stopped, so energy must still be provided to biogas plant components, such as agitators, sensors, and heating tubes, in the tanks. Due to the relatively high heat production during CHP operation, part of it is directed to a heat storage system, from which it is later extracted during downtimes. Thanks to the biogas plant’s connection to the grid, the supply of electricity during this time is also not a problem. From the Distribution System Operator’s perspective, the use of demand-driven biogas plants for consuming excess electricity is a beneficial solution, enabling the stabilization of the power system, especially in situations of overproduction [75]. However, an essential aspect of their development is the loss of the biogas plant’s status of energy self-sufficiency, which can be an obstacle to obtaining financial support, such as subsidies, which are often an obligatory requirement. An alternative solution is to use PV directly integrated with biogas plants, but due to variable weather conditions, they will not be able to power such an installation 100% anyway [76]. In addition to the technical flexibility of the CHP unit, it is also crucial to select the power so that additional biogas can be burned. As mentioned earlier, during periods when the CHP is not in operation, the anaerobic fermentation process continues, resulting in the uninterrupted production of biogas. Therefore, it is necessary to provide an appropriate storage infrastructure to enable its storage and subsequent use. Modern technological solutions offer a wide range of storage tanks, including those with rigid covers on top of a biogas fermenter, dry gas storage systems, floating-roof gas storage tanks, flexible membrane gas storage systems, and double membrane gasholders, as shown in Figure 9 [77].
In practice, double membranes are the most commonly used, as they are highly resistant to fluctuations in operating pressure, extreme temperatures, and varying weather conditions. Additionally, they are characterized by low investment costs, ease of maintenance, and a long service life, estimated at 10–20 years, depending on factors such as material quality, maintenance practices, and environmental conditions [79]. The safety of the membranes is verified before commissioning using several standardized tests, including DIN 4102 (fire resistance), DIN EN 1876-1 (bending resistance), DIN 53359 (flex cracking resistance), and ASTM D1434 (gas permeability) [80,81,82,83,84]. In the case of demand-driven plants that use this type of gas storage system, special attention must be paid to fluctuating gas flows, as uncontrolled variations may lead to overpressure or underpressure, posing a risk to operational safety [78].

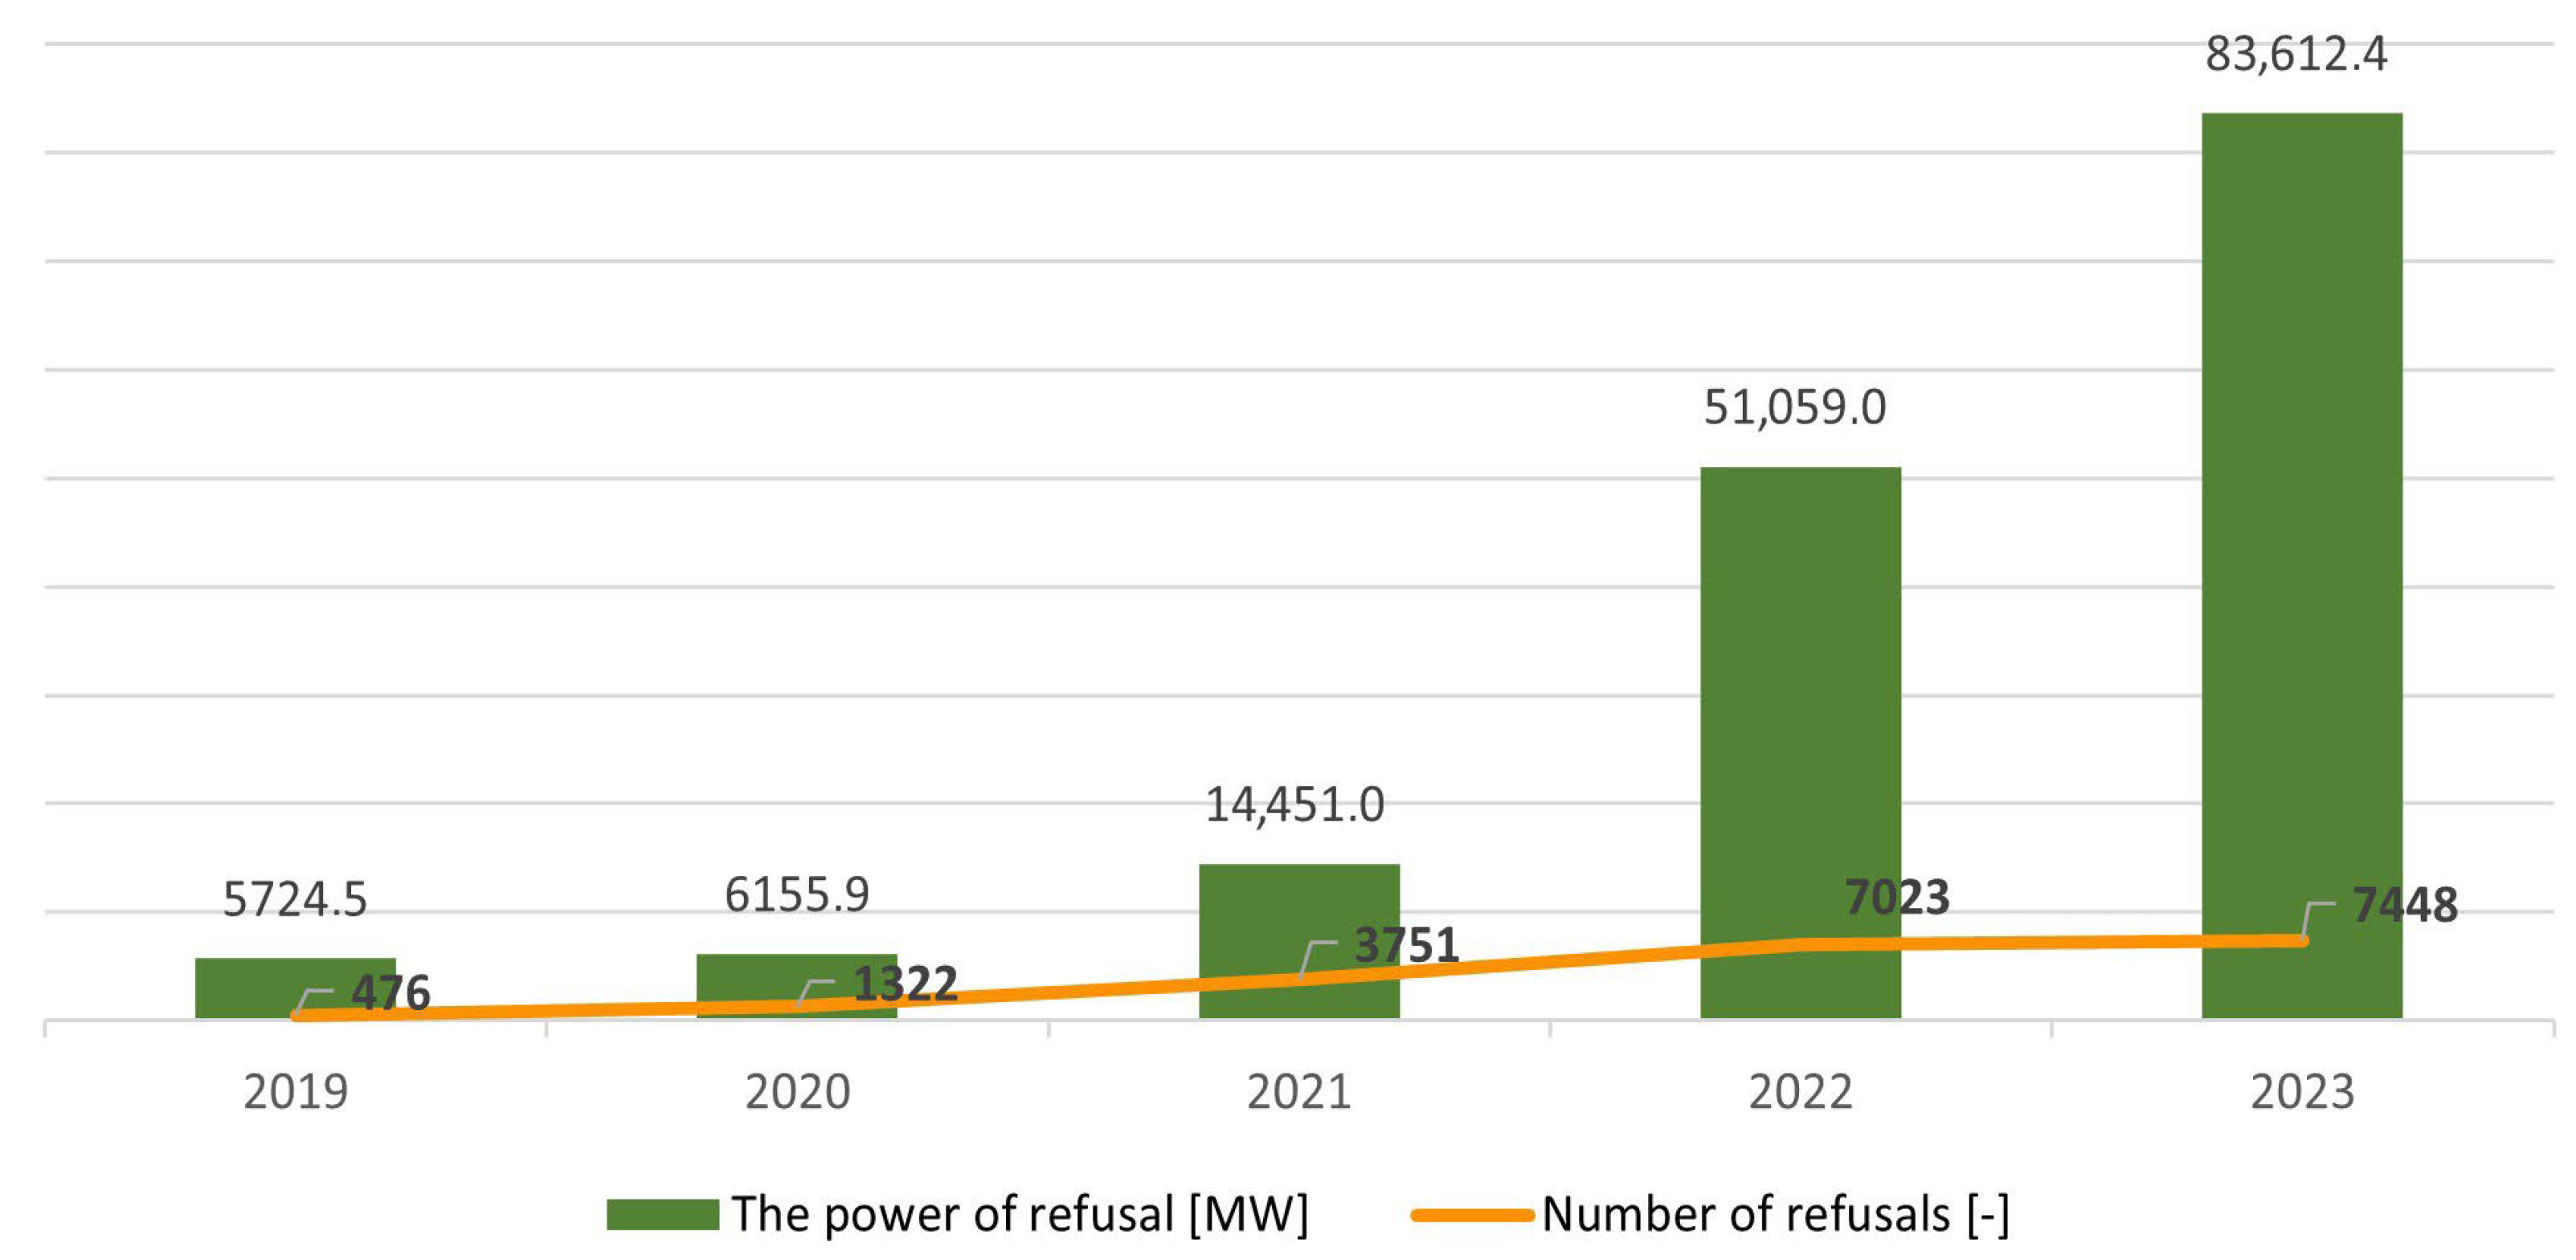
6.3. Challenges in Connecting New RES to the Power Grid

The volume of a biogas storage facility is directly dependent on its storage time, which in Poland is determined by a schedule attached to the grid connection conditions issued by the Distribution System Operator. Most demand-driven biogas plants are connected to the medium-voltage grid (MV), where the standard voltage is 15 kV or 20 kV, depending on local infrastructure conditions. The procedure for obtaining connection conditions is specified in detail in the Energy Law Act. This process begins with the submission of a complete application to determine the conditions for connecting to the power grid, which the operator then analyzes. The criteria for assessing connection possibilities include both technical aspects related to the safety and stability of the system operation, as well as the network’s capacity to absorb the electricity generated by the generating units. To clarify the analysis of newly connected sources, a few years ago, all Distribution System Operators operating in the country developed detailed guidelines that regulate this process. The document “Criteria for assessing connection possibilities and technical requirements for energy sources connected to the MV grid of the Distribution System Operator” defines key principles, including analysis of electricity quality, short-circuit and voltage conditions, and availability of power reserve at the HV/MV node. Until now, if the study showed that any of the criteria might not be met, the operator issued a refusal to connect to the grid. As RES development progressed, the number of refusals increased, including those for biogas plants, as shown in Figure 10.

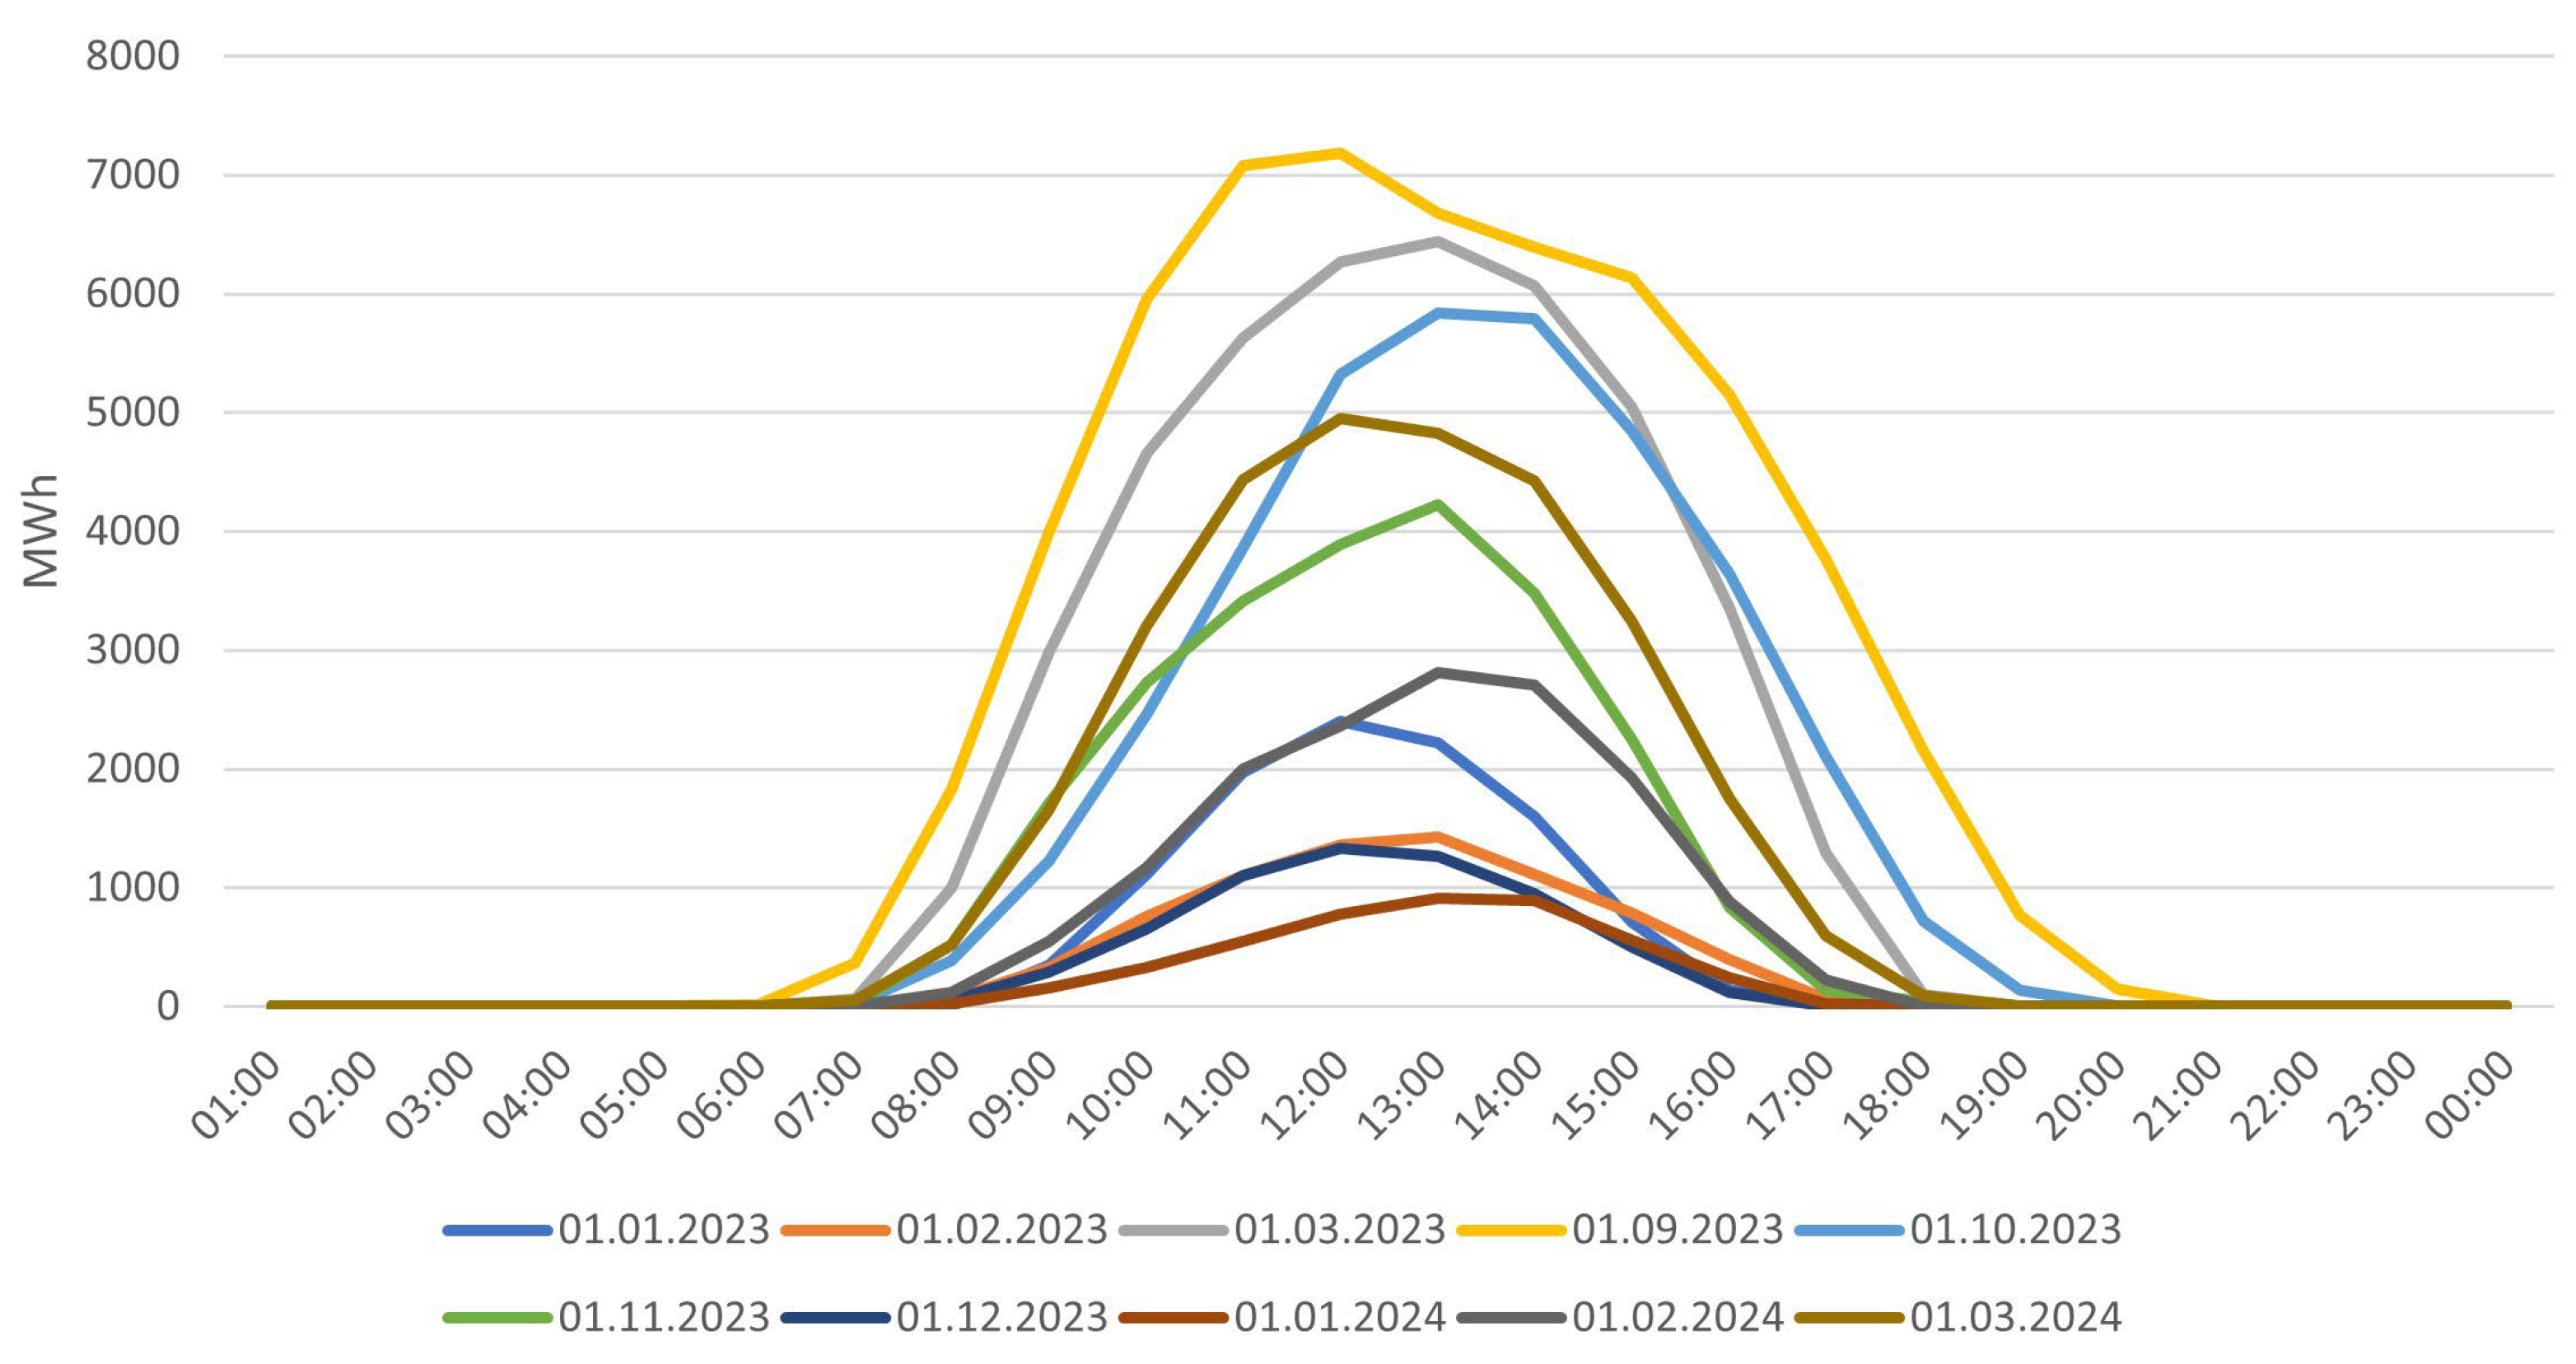
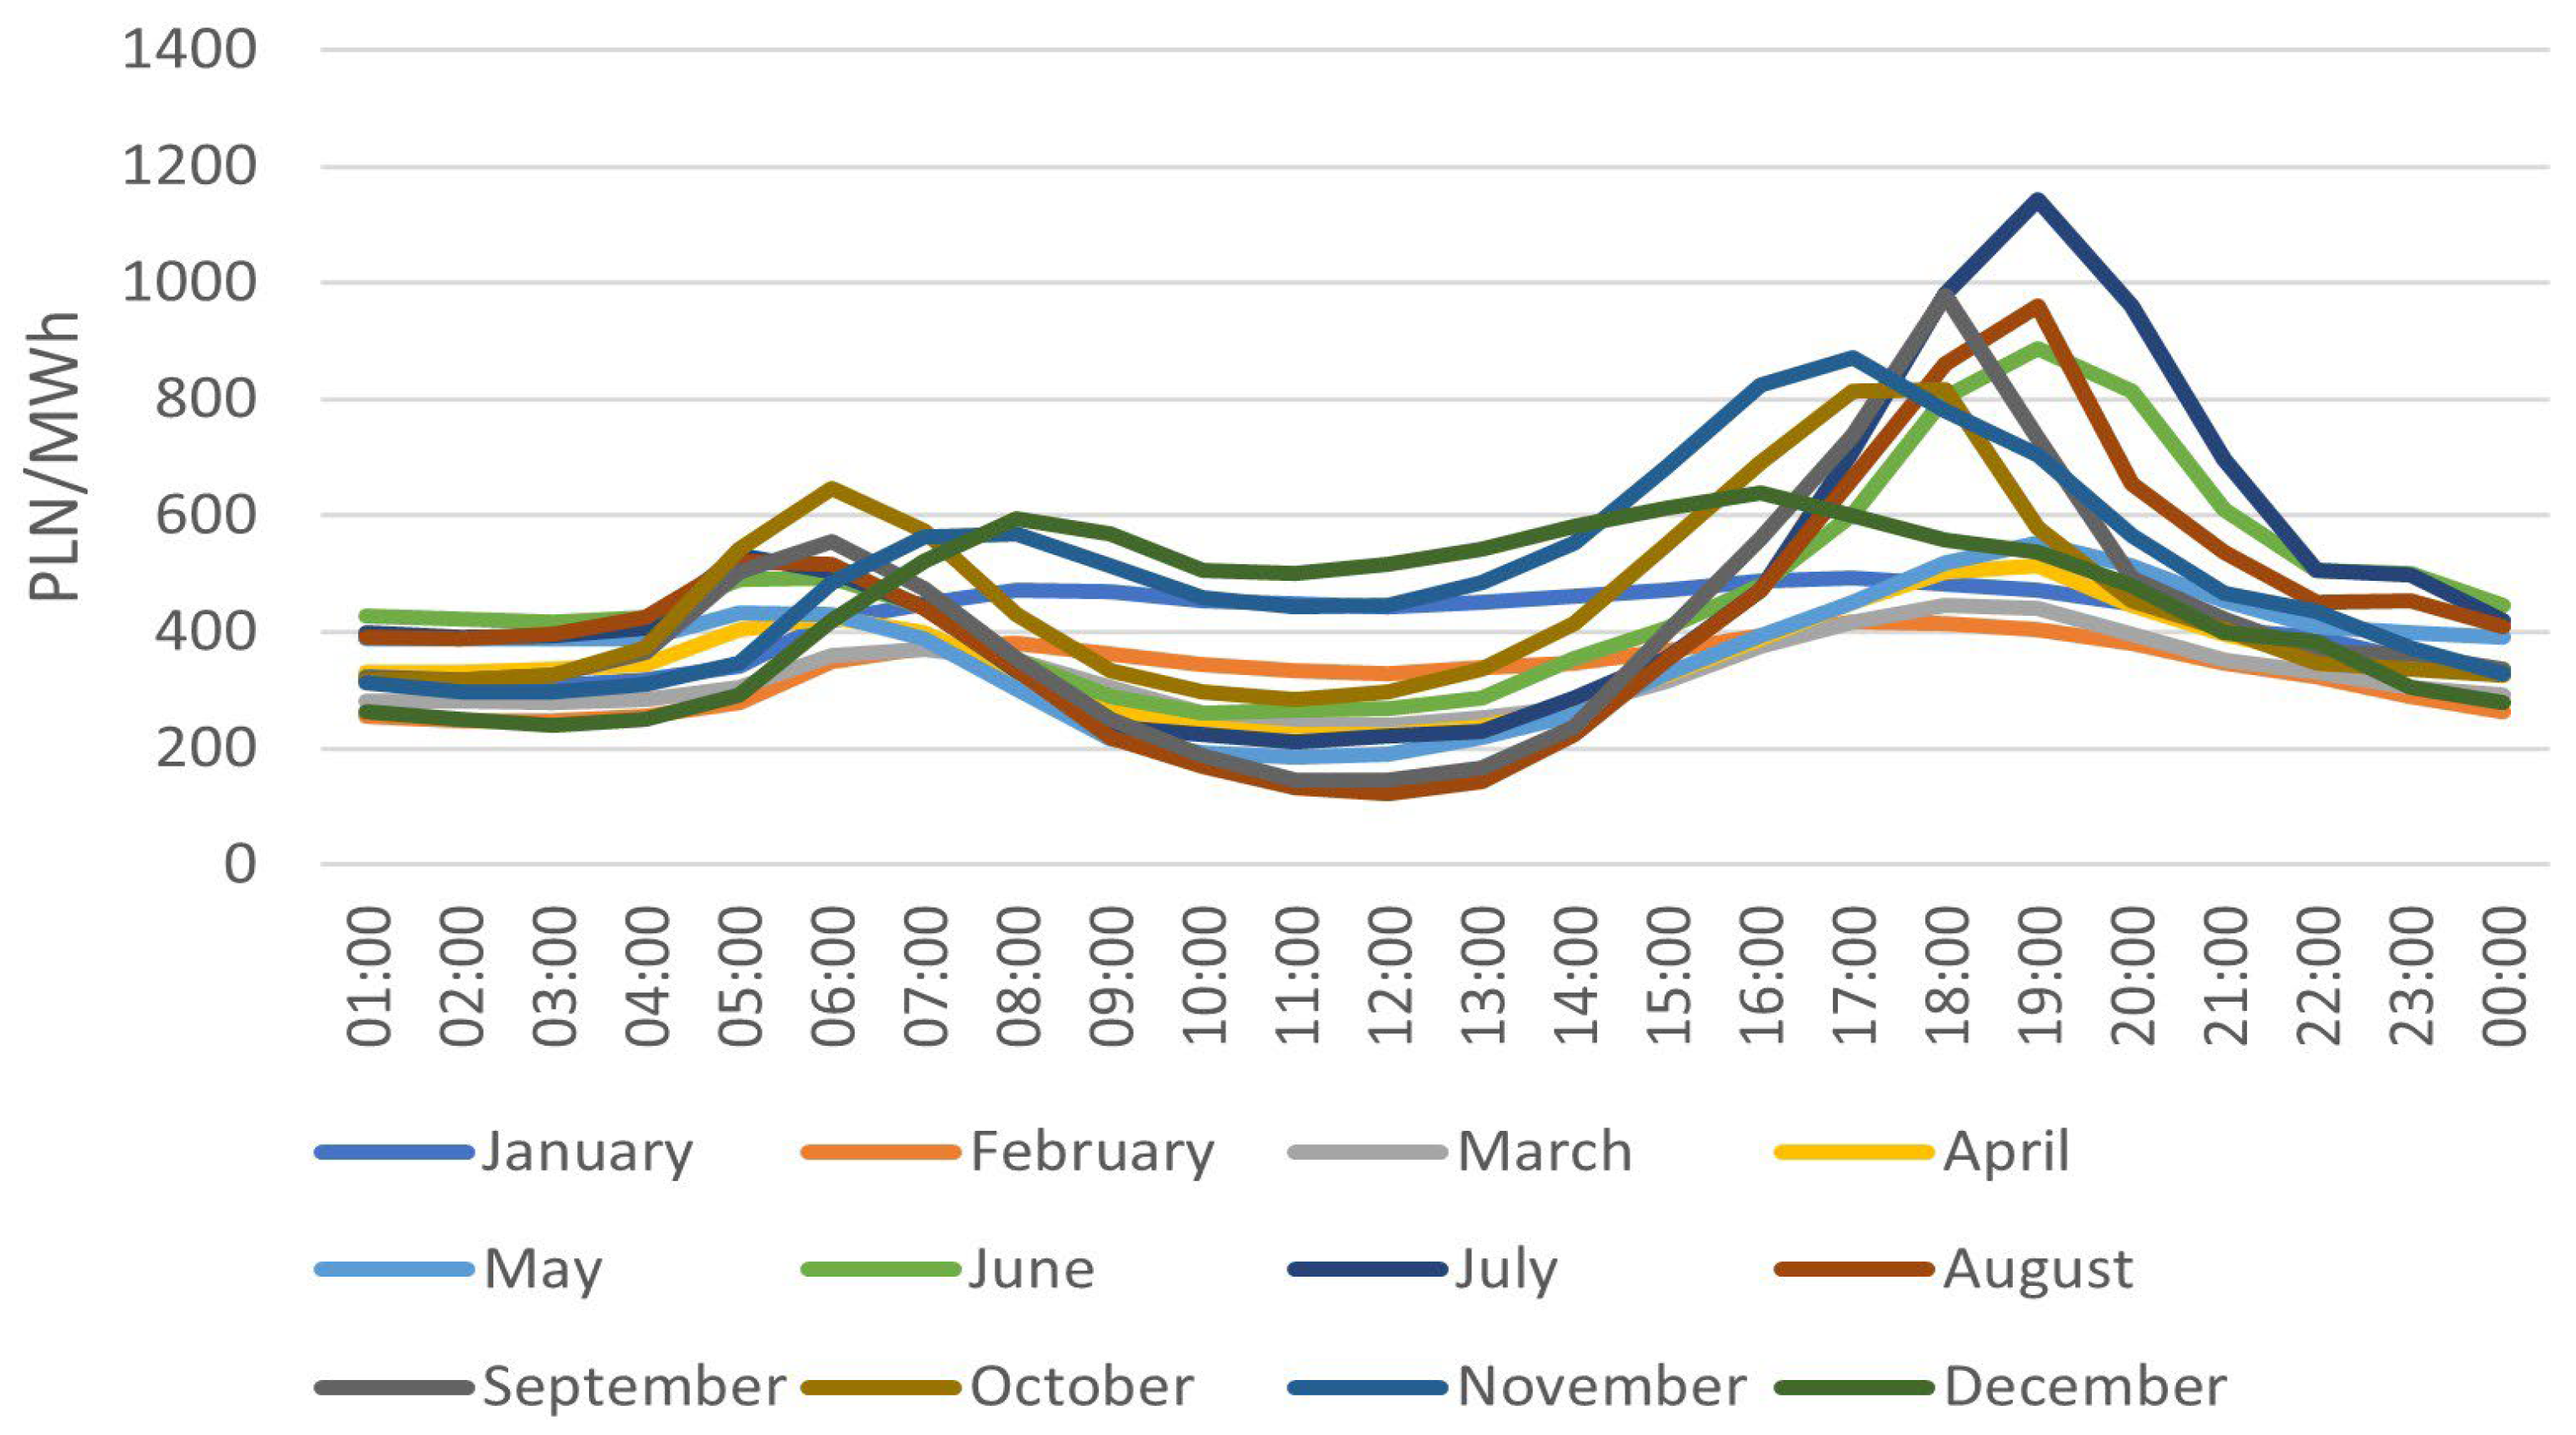
6.4. Schedule of Operation of Demand-Driven Biogas Plants

The reasons for refusal were based on the lack of technical conditions that indicated a risk of overloading the elements of the distribution network, the lack of balance between the planned total generation capacity and the demand at a specific network node to which the connection is intended, and exceeding the permissible voltage levels in the distribution network [86]. To reduce the number of grid connection refusals for biogas plants, a significant barrier to the development of this sector, the Act of 28 July 2023, amending the Energy Law and certain other acts, was introduced [12,87]. The act established preferential rules for grid connection analysis specifically for biogas plants equipped with biogas storage systems, significantly altering the existing practices of Distribution System Operators. Before the amendment, the technical analysis of connecting new biogas installations to the grid was assessed by considering the installed capacity of all energy sources in the relevant network area, both existing and planned, as well as the maximum capacity of the HV/MV transformer station. The total capacity of the new source could not exceed the capacity of the station. In the case of existing weather-dependent sources, such as PV, their installed capacity was considered, not their actual generated power. In practice, this led to overestimated system loads and the blocking of some available power by sources that, in practice, used only a small amount of power. The amendment changed the method of calculating the system’s power reserve, introducing a three-stage connection analysis procedure.
  • Stage 1—fundamental analysis, assuming whole power generation from all RES (including PV) by their rated power. If the analysis results indicate that the biogas plant cannot be connected, operators proceed to the next stage.
  • Stage 2—analysis taking into account the reduction in PV generation to 35% of its rated power, by the adopted First Schedule shown in Table 5. If the analysis results indicate that the biogas plant cannot be connected, operators proceed to the next stage [88,89,90].
  • Stage 3—final stage, involving calculations using Second Schedule shown in Table 6, in which PV generation is assumed to be 8% of the rated power. If connection is not possible, the technical criteria are not met, and the biogas plant is denied connection to the electricity grid [88,89,90].
If the technical analysis conducted in the second or third stage of the connection process yields a positive result and confirms the possibility of connecting the biogas plant to the electricity grid, the Distribution System Operator issues connection conditions. This document is accompanied by either the first or second schedule. The schedule is an integral element of the connection conditions to the power grid and specifies the periods (hours per day) during which the operator is obligated to purchase electricity produced by the biogas plant. Outside these specified hours, the operator is not legally obligated to it, and the producer waives any claims for compensation that would be available in the event of standard (non-market) curtailment of the biogas plant’s operation [91,92].

7. Factors Inhibiting the Development of Demand-Driven Biogas Plants

The biogas plant’s operating schedule is a key element in managing the energy generation process, determining both the hours of operation of the plant and the storage time of the biogas [93,94]. Appropriate adjustment of operating hours should maximize the potential of demand-driven biogas plants at a given location. In particular, it is essential to consider the changing climatic conditions and the dynamics of PPS energy demand. Critical comments primarily concern the second schedule, which stipulates that the operation of demand-driven biogas plants is reduced at 6:30. An analysis of electricity production from PV during the autumn and winter periods, covering the months of January to March and September to December, clearly demonstrated that this reduction is ineffective. During this time of year, due to limited sunlight, peak energy production from PV occurs much later in the day, most often in the morning or around noon, as shown in Figure 11.
Developing only two biogas plant operation schedules at the connection stage seems overly conservative and inadequate in light of current energy market realities. This type of restriction fails to account for the growing volatility of electricity demand or dynamic price changes on the spot market, which can consequently lead to reduced energy and economic efficiency in the entire installation. Examples from Germany suggest a more dynamic approach to operating demand-driven biogas plants. German regulations, introduced under the EEG (Energy-Effectiveness Act), allow for operation to be adapted to current market conditions [96]. Notably, German grid operators do not impose rigid operation schedules for biogas plants, unlike in Poland. Instead, they are expected to meet minimum technical requirements, such as plant operational safety and the reporting of available power in 15 min intervals [97]. This allows operators to plan multiple start-up cycles per day, maximizing energy production during peak demand hours or periods of highest energy prices on the spot or reserve market.
If the operation of demand-driven biogas plants is to be further restricted to just 12 h a day, legislative action is needed to regulate the classification of such units’ capacity. Currently, their capacity is determined by the power of the CHP, which has significant implications for both investment and management. For example, a typical agricultural biogas plant with a capacity of 499 kW, the standard model on the domestic market, would need to install a CHP with a capacity of around 1 MW to maintain annual electricity production at a level comparable to linear installations. Such a change would result in the unit being classified as a potentially significant environmental impact installation, which would require an environmental impact assessment and an environmental decision [68]. These procedures would increase both the time and cost of the investment. It is worth noting that the introduction of peak load also involves additional investment outlays, including the following:
  • Installation of an additional cogeneration engine or increasing the capacity of the existing one;
  • Construction of a biogas storage facility;
  • Construction of a heat storage facility.
To encourage biogas producers to implement the demand-driven model, mechanisms should be created to enable the sale of energy at the most favorable times. This relationship should be taken into account in the conditions of connection to the power grid to maximize the economic benefits for biogas producers. Analysis of data from the Polish Power Exchange (TGE) reveals that electricity prices fluctuate throughout the day. The highest values are observed in the morning and evening hours, as shown in Figure 12 [98].
Negative electricity prices present an additional opportunity for demand-driven biogas plants, which were first recorded in Poland on 10 June 2023 for deliveries made on 11 June 2023 in the hourly interval from 11:00 to 16:00. This phenomenon, previously observed in European markets, is shown in Figure 13 [99].
The adoption of the Act of 27 November 2024, amending the Act on Renewable Energy Sources and Certain Other Acts, introduced significant changes to the settlement system. According to this system, RES units, including biogas plants, lose their right to support at any hour with a negative price. Previously, the loss of the premium was conditional on the weighted average cost of electricity from exchange transactions being below 0 PLN/MWh for six consecutive hours. The FIT/FIP support system is a key tool for stabilizing biogas producers’ revenues; therefore, to minimize the negative impact of the new law, biogas plants should limit production during periods of negative energy prices. The solution enabling the maintenance of profitability at such times is the use of biogas storage facilities, which allow for the storage of biogas until market conditions stabilize.
Negative electricity prices, although a reversal of traditional market mechanisms, can serve as a motivator, encouraging renewable energy producers to respond dynamically to changes in the availability of renewable sources and to adjust production to meet the actual market needs. In this context, it is worth noting that the first demand-driven biogas plants in Germany were established as a result of the modernization of existing linear units, exemplifying effective adaptation to evolving market conditions.
To promote demand-driven biogas plants, Germany introduced financial support mechanisms under the Erneuerbare-Energien-Gesetz (EEG) in the form of a “Flexibilitätsprämie” and a “Flexibilitätszuschlag” [101]. The conditions and methods of awarding funds differ for both forms of subsidies, but their common goal is to increase the use of biogas plants in stabilizing the electricity market. The implementation of similar mechanisms in Poland could significantly contribute to the development of demand-driven biogas plants and increase their share in the country’s energy transformation.

8. Conclusions

Ensuring the stability and security of the PPS requires the introduction of new, flexible generating sources capable of meeting variable electricity demand, compensating for weather-related fluctuations typical of PV and wind energy, and aligning with low-emission objectives. The analysis presented in this study highlights the significant potential of demand-driven biogas plants to fulfill this role.
Poland’s agricultural sector provides a solid foundation for biogas development, with feedstock availability sufficient to support an estimated 7.4 GW of peak-load capacity. By flexibly supplying electricity, demand-driven biogas plants can enhance grid stability and reduce the risk of shortages when PV and wind outputs are insufficient.
Despite this promising outlook, several regulatory barriers still hinder the deployment of demand-driven biogas plants. The currently applied two standard operating schedules are too rigid, underscoring the need for more flexible timetables that better reflect electricity price fluctuations and actual demand patterns.
It is also recommended to exempt demand-driven plants with a production capacity not exceeding 0.5 MW from the requirement to obtain an environmental impact decision, regardless of their installed capacity. Drawing on German regulatory instruments such as the Flexibilitätsprämie and Flexibilitätszuschlag, the introduction of a flexibility premium scheme in Poland could serve as a strong incentive to promote the flexible operation of biogas plants. This is particularly relevant given that demand-driven biogas plants can help reduce the costs incurred by Distribution System Operators due to power curtailment.
Further research is essential to address the lack of demand-driven biogas plants in Poland by optimizing regulatory frameworks and operational strategies, ensuring that demand-driven biogas plants can fully realize their potential within the current energy transformation.

Author Contributions

Conceptualization, J.D.; methodology, A.Ł. and K.W.; validation, J.D. and K.W.; formal analysis, A.Ł. and K.W.; data curation, A.Ł. and K.W.; writing—original draft, A.Ł. and K.W.; writing—review and editing, J.D.; visualization, A.Ł.: supervision, J.D. and K.W.; project administration, A.Ł. All authors have read and agreed to the published version of the manuscript.

Funding

This paper was written as part of the 5th edition of the Implementation Doctorate program, titled “Energy and Economic Model for Assessing the Efficiency of Traditional and Demand-Driven Biogas Plants”, prepared by Aleksandra Łukomska, M.Sc. The study was funded by project no. DWD/6/0199/2022, financed by the Ministry of Education and Science.

Data Availability Statement

No new data were created or analyzed in this study.

Acknowledgments

We would like to express our sincere gratitude to Dynamic Biogas Company, especially to Michał Bierła, for his invaluable contribution to the development of the diagrams which form an integral part of this article.

Conflicts of Interest

Aleksandra Łukomska is employed by the Dynamic Biogas Energy Company. The remaining authors declare that the research was conducted in the absence of any commercial or financial relationships that could be construed as a potential conflict of interest.

References

  1. Statista. Distribution of Energy Sector Greenhouse Gas Emissions in the European Union (EU-27) in 2021. Available online: https://www.statista.com/statistics/1000061/ghg-emissions-sources-energy-sector-european-union-eu/ (accessed on 30 May 2025).
  2. Hafner, M.; Raimondi, P.P. Priorities and Challenges of the EU Energy Transition: From the European Green Package to the New Green Deal. Russ. J. Econ. 2020, 6, 374–389. [Google Scholar] [CrossRef]
  3. Tomaszewski, K. The Polish Road to the New European Green Deal—Challenges and Threats to the National Energy Policy. Polityka Energ.—Energy Policy J. 2020, 23, 5–18. [Google Scholar] [CrossRef]
  4. International Renewable Energy Agency (IREA). Geopolitics of the Energy Transition: Energy Security. Available online: https://www.apeg.pt/folder/documento/ficheiro/869_IRENA_Geopolitics_transition_energy_security_2024.pdf (accessed on 30 May 2025).
  5. Saleh, H.M.; Hassan, A.I. The Challenges of Sustainable Energy Transition: A Focus on Renewable Energy. Appl. Chem. Eng. 2024, 7, 2084. [Google Scholar] [CrossRef]
  6. Ang, T.-Z.; Salem, M.; Kamarol, M.; Das, H.S.; Nazari, M.A.; Prabaharan, N. A Comprehensive Study of Renewable Energy Sources: Classifications, Challenges and Suggestions. Energy Strategy Rev. 2022, 43, 100939. [Google Scholar] [CrossRef]
  7. Rybak, A.; Rybak, A.; Kolev, S.D. The Import of Energy Raw Materials and the Energy Security of the European Union—The Case of Poland. Gospod. Surowcami Miner.—Miner. Resour. Manag. 2023, 38, 29–48. [Google Scholar] [CrossRef]
  8. Stankovski, A.; Gjorgiev, B.; Locher, L.; Sansavini, G. Power Blackouts in Europe: Analyses, Key Insights, and Recommendations from Empirical Evidence. Joule 2023, 7, 2468–2484. [Google Scholar] [CrossRef]
  9. Hodgson, R. Norwegian Finance Minister Blames EU Energy Policy for Government Collapse. Available online: https://www.euronews.com/my-europe/2025/01/30/norwegian-finance-minister-blames-eu-energy-policy-for-government-collapse (accessed on 30 May 2025).
  10. Energy Market Agency (ARE). Statistical Information About Electricity. Available online: https://www.are.waw.pl/oferta/wydawnictwa (accessed on 30 May 2025). (In Polish).
  11. Pochwatka, P.; Rozakis, S.; Kowalczyk-Juśko, A.; Czekała, W.; Qiao, W.; Nägele, H.-J.; Janczak, D.; Mazurkiewicz, J.; Mazur, A.; Dach, J. The Energetic and Economic Analysis of Demand-Driven Biogas Plant Investment Possibility in Dairy Farm. Energy 2023, 283, 129165. [Google Scholar] [CrossRef]
  12. Łukomska, A.; Pulka, J.; Broński, M.; Dach, J. Demand-Driven Biogas Plants in Poland—Potential and Growth Perspectives. J. Ecol. Eng. 2024, 25, 236–248. [Google Scholar] [CrossRef]
  13. Kuchler, M.; Bridge, G. Down the Black Hole: Sustaining National Socio-Technical Imaginaries of Coal in Poland. Energy Res. Soc. Sci. 2018, 41, 136–147. [Google Scholar] [CrossRef]
  14. Szpringer, Z. Problems of Polish Mining in the Light of EU Climate Policy. Available online: https://www.ceeol.com/search/article-detail?id=1293333 (accessed on 30 May 2025).
  15. Instrat Energy & Climate. Hard Coal Production in Poland in the Years 2007–2024. Available online: https://energy.instrat.pl/en/mining/production-sales-hard-coal/ (accessed on 28 May 2025).
  16. European Environment Agency (EEA). Total Greenhouse Gas Emissions in EU Member States. Available online: https://www.eea.europa.eu/en/analysis/maps-and-charts/greenhouse-gases-viewer-data-viewers (accessed on 30 May 2025).
  17. Forum Energii. Energy Transformation in Poland. Available online: https://www.forum-energii.eu/transformacja-edycja-2024 (accessed on 28 May 2025). (In Polish).
  18. Kubiczek, P. Basic Work. Modeling the Costs of Low Flexibility of the Polish Power System. Available online: https://instrat.pl/wp-content/uploads/2023/08/Praca-w-podstawie_28.08.pdf (accessed on 30 May 2025).
  19. Fiebrandt, M.; Röder, J.; Wagner, H. Minimum Loads of Coal-fired Power Plants and the Potential Suitability for Energy Storage Using the Example of Germany. Int. J. Energy Res. 2022, 46, 4975–4993. [Google Scholar] [CrossRef]
  20. Gonzalez-Salazar, M.A.; Kirsten, T.; Prchlik, L. Review of the Operational Flexibility and Emissions of Gas- and Coal-Fired Power Plants in a Future with Growing Renewables. Renew. Sustain. Energy Rev. 2018, 82, 1497–1513. [Google Scholar] [CrossRef]
  21. Chenna, A.; Aouzellag, D.; Ghedamsi, K. Study and Control of a Pumped Storage Hydropower System Dedicated to Renewable Energy Resources. J. Eur. Syst. Autom. 2020, 53, 95–102. [Google Scholar] [CrossRef]
  22. Nikolaos, P.C.; Marios, F.; Dimitris, K. A Review of Pumped Hydro Storage Systems. Energies 2023, 16, 4516. [Google Scholar] [CrossRef]
  23. Kałuża, T.; Hämmerling, M.; Zawadzki, P.; Czekała, W.; Kasperek, R.; Sojka, M.; Mokwa, M.; Ptak, M.; Szkudlarek, A.; Czechlowski, M.; et al. The Hydropower Sector in Poland: Barriers and the Outlook for the Future. Renew. Sustain. Energy Rev. 2022, 163, 112500. [Google Scholar] [CrossRef]
  24. Grira, S.; Alkhedher, M.; Abu Khalifeh, H.; Ramadan, M.; Ghazal, M. Using Algae in Li-Ion Batteries: A Sustainable Pathway toward Greener Energy Storage. Bioresour. Technol. 2024, 394, 130225. [Google Scholar] [CrossRef] [PubMed]
  25. Stan, A.-I.; Swierczynski, M.; Stroe, D.-I.; Teodorescu, R.; Andreasen, S.J. Lithium Ion Battery Chemistries from Renewable Energy Storage to Automotive and Back-up Power Applications—An Overview. In Proceedings of the 2014 International Conference on Optimization of Electrical and Electronic Equipment (OPTIM), Bran, Romania, 22–24 May 2014; pp. 713–720. [Google Scholar] [CrossRef]
  26. Gaines, L. Profitable Recycling of Low-Cobalt Lithium-Ion Batteries Will Depend on New Process Developments. One Earth 2019, 1, 413–415. [Google Scholar] [CrossRef]
  27. Luo, G.; Zhang, Y.; Tang, A. Capacity Degradation and Aging Mechanisms Evolution of Lithium-Ion Batteries under Different Operation Conditions. Energies 2023, 16, 4232. [Google Scholar] [CrossRef]
  28. Polish Electricity Transmission System Operator. Report 2024 Polish Power System. Available online: https://www.pse.pl/dane-systemowe/funkcjonowanie-kse/raporty-roczne-z-funkcjonowania-kse-za-rok/raporty-za-rok-2024#r6_3 (accessed on 15 July 2025).
  29. Świdyńska, N. Renewable Energy Sources in Poland in 2014–2023 and the Perspective of Their Development until 2030. A Contribution to the Discussion. Olszt. Econ. J. 2024, 19, 31–44. [Google Scholar] [CrossRef]
  30. Bachanek, K.H.; Drożdż, W.; Kolon, M. Development of Renewable Energy Sources in Poland and Stability of Power Grids—Challenges, Technologies, and Adaptation Strategies. Energies 2025, 18, 2036. [Google Scholar] [CrossRef]
  31. Evro, S.; Wade, C.; Tomomewo, O. Solar PV Technology Cost Dynamics and Challenges for US New Entrants. Am. J. Energy Res. 2023, 11, 15–26. [Google Scholar] [CrossRef]
  32. Mazurek-Czarnecka, A.; Rosiek, K.; Salamaga, M.; Wąsowicz, K.; Żaba-Nieroda, R. Study on Support Mechanisms for Renewable Energy Sources in Poland. Energies 2022, 15, 4196. [Google Scholar] [CrossRef]
  33. Hebda, W.; Leśniak, K.; Stolorz, M. Wind Energy in Poland. In EU Energy and Climate Policy After COVID-19 and the Invasion of Ukraine; Routledge: London, UK, 2024; pp. 195–210. [Google Scholar] [CrossRef]
  34. Baltic Power. Baltic Power Confirms First Successful Installations of the Offshore Wind Turbines for Poland’s First Offshore Wind Farm. Available online: https://balticpower.pl/news/baltic-power-confirms-first-successful-installations-of-the-offshore-wind-turbines-for-poland-s-first-offshore-wind-farm/ (accessed on 16 July 2025).
  35. Smolinski, P.R.; Januszewicz, J.; Pawlowska, B.; Winiarski, J. Nuclear Energy Acceptance in Poland: From Societal Attitudes to Effective Policy Strategies—Network Modeling Approach. PLoS ONE 2024, 19, e0305115. [Google Scholar] [CrossRef]
  36. Mrozowska, S.; Wendt, J.A.; Tomaszewski, K. The Challenges of Poland’s Energy Transition. Energies 2021, 14, 8165. [Google Scholar] [CrossRef]
  37. Cucina, M. Integrating Anaerobic Digestion and Composting to Boost Energy and Material Recovery from Organic Wastes in the Circular Economy Framework in Europe: A Review. Bioresour. Technol. Rep. 2023, 24, 101642. [Google Scholar] [CrossRef]
  38. Lehtokunnas, T. The Circular Economy Futures in the Making: Transformativity and Object Ontologies in Food Waste Practices in Finnish Households, Supermarkets and Biogas Plants. Futures 2023, 153, 103241. [Google Scholar] [CrossRef]
  39. Burg, V.; Rolli, C.; Schnorf, V.; Scharfy, D.; Anspach, V.; Bowman, G. Agricultural Biogas Plants as a Hub to Foster Circular Economy and Bioenergy: An Assessment Using Substance and Energy Flow Analysis. Resour. Conserv. Recycl. 2023, 190, 106770. [Google Scholar] [CrossRef]
  40. Zabochnicka, M.; Wolny, L.; Zawieja, I.; Lozano Sanchez, F.D. Biogas Production from Waste Food as an Element of Circular Bioeconomy in the Context of Water Protection. Desalination Water Treat. 2023, 301, 289–295. [Google Scholar] [CrossRef]
  41. Emmanuel, J.K.; Juma, M.J.; Mlozi, S.H. Biogas Generation from Food Waste through Anaerobic Digestion Technology with Emphasis on Enhancing Circular Economy in Sub-Saharan Africa—A Review. Energy Rep. 2024, 12, 3207–3217. [Google Scholar] [CrossRef]
  42. Kuo, T.-C.; Chen, H.-Y.; Chong, B.; Lin, M. Cost Benefit Analysis and Carbon Footprint of Biogas Energy through Life Cycle Assessment. Clean. Environ. Syst. 2024, 15, 100240. [Google Scholar] [CrossRef]
  43. Michael Fredenslund, A.; Gudmundsson, E.; Maria Falk, J.; Scheutz, C. The Danish National Effort to Minimise Methane Emissions from Biogas Plants. Waste Manag. 2023, 157, 321–329. [Google Scholar] [CrossRef]
  44. Thrän, D.; Adetona, A.; Borchers, M.; Cyffka, K.-F.; Daniel-Gromke, J.; Oehmichen, K. Potential Contribution of Biogas to Net Zero Energy Systems—A Comparative Study of Canada and Germany. Biomass Bioenergy 2025, 193, 107561. [Google Scholar] [CrossRef]
  45. Ferrari, G.; Shi, Z.; Marinello, F.; Pezzuolo, A. From Biogas to Biomethane: Comparison of Sustainable Scenarios for Upgrading Plant Location Based on Greenhouse Gas Emissions and Cost Assessments. J. Clean. Prod. 2024, 478, 143936. [Google Scholar] [CrossRef]
  46. Lehtoranta, S.; Tampio, E.; Rasi, S.; Laakso, J.; Vikki, K.; Luostarinen, S. The Implications of Management Practices on Life Cycle Greenhouse Gas Emissions in Biogas Production. J. Environ. Manag. 2024, 366, 121884. [Google Scholar] [CrossRef] [PubMed]
  47. Lamidi, R.O.; Jiang, L.; Wang, Y.D.; Pathare, P.B.; Roskilly, A.P. Techno-Economic Analysis of a Biogas Driven Poly-Generation System for Postharvest Loss Reduction in a Sub-Saharan African Rural Community. Energy Convers. Manag. 2019, 196, 591–604. [Google Scholar] [CrossRef]
  48. Buonomano, A.; Del Papa, G.; Giuzio, G.F.; Palombo, A.; Russo, G. Future Pathways for Decarbonization and Energy Efficiency of Ports: Modelling and Optimization as Sustainable Energy Hubs. J. Clean. Prod. 2023, 420, 138389. [Google Scholar] [CrossRef]
  49. Nadaleti, W.C. Utilization of Residues from Rice Parboiling Industries in Southern Brazil for Biogas and Hydrogen-Syngas Generation: Heat, Electricity and Energy Planning. Renew. Energy 2019, 131, 55–72. [Google Scholar] [CrossRef]
  50. Achinas, S.; Euverink, G.J.W. Rambling Facets of Manure-Based Biogas Production in Europe: A Briefing. Renew. Sustain. Energy Rev. 2020, 119, 109566. [Google Scholar] [CrossRef]
  51. Loboichenko, V.; Iranzo, A.; Casado-Manzano, M.; Navas, S.J.; Pino, F.J.; Rosa, F. Study of the Use of Biogas as an Energy Vector for Microgrids. Renew. Sustain. Energy Rev. 2024, 200, 114574. [Google Scholar] [CrossRef]
  52. Agonafer, T.D.; Eremed, W.B.; Adem, K.D. Biogas-Based Trigeneration System: A Review. Results Eng. 2022, 15, 100509. [Google Scholar] [CrossRef]
  53. Qin, M.; Yang, Y.; Chen, S.; Xu, Q. Bi-Level Optimization Model of Integrated Biogas Energy System Considering the Thermal Comfort of Heat Customers and the Price Fluctuation of Natural Gas. Int. J. Electr. Power Energy Syst. 2023, 151, 109168. [Google Scholar] [CrossRef]
  54. Reinelt, T.; Liebetrau, J.; Nelles, M. Analysis of Operational Methane Emissions from Pressure Relief Valves from Biogas Storages of Biogas Plants. Bioresour. Technol. 2016, 217, 257–264. [Google Scholar] [CrossRef]
  55. Dotzauer, M.; Pfeiffer, D.; Lauer, M.; Pohl, M.; Mauky, E.; Bär, K.; Sonnleitner, M.; Zörner, W.; Hudde, J.; Schwarz, B.; et al. How to Measure Flexibility—Performance Indicators for Demand Driven Power Generation from Biogas Plants. Renew. Energy 2019, 134, 135–146. [Google Scholar] [CrossRef]
  56. Dittmer, C.; Krümpel, J.; Lemmer, A. Power Demand Forecasting for Demand-Driven Energy Production with Biogas Plants. Renew. Energy 2021, 163, 1871–1877. [Google Scholar] [CrossRef]
  57. Lemmer, A.; Krümpel, J. Demand-Driven Biogas Production in Anaerobic Filters. Appl. Energy 2017, 185, 885–894. [Google Scholar] [CrossRef]
  58. Ohnmacht, B.; Lemmer, A.; Oechsner, H.; Kress, P. Demand-Oriented Biogas Production and Biogas Storage in Digestate by Flexibly Feeding a Full-Scale Biogas Plant. Bioresour. Technol. 2021, 332, 125099. [Google Scholar] [CrossRef]
  59. Polish Central Statistical Office. Statistical Yearbook of the Republic of Poland. 2024. Available online: https://stat.gov.pl/obszary-tematyczne/roczniki-statystyczne/roczniki-statystyczne/rocznik-statystyczny-rzeczypospolitej-polskiej-2024,2,24.html (accessed on 16 July 2025).
  60. Polish Central Statistical Office. Statistical Yearbook of Agriculture. 2024. Available online: https://stat.gov.pl/obszary-tematyczne/roczniki-statystyczne/roczniki-statystyczne/rocznik-statystyczny-rolnictwa-2024,6,18.html (accessed on 16 July 2025).
  61. Kozłowski, K.; Dach, J.; Lewicki, A.; Malińska, K.; do Carmo, I.E.P.; Czekała, W. Potential of Biogas Production from Animal Manure in Poland. Arch. Environ. Prot. 2023, 45, 99–108. [Google Scholar] [CrossRef]
  62. DIN 38414-8; Deutsche Einheitsverfahren Zur Wasser-, Abwasser- und Schlammuntersuchung; Schlamm und Sedimente (Gruppe S); Bestimmung des Faulverhaltens (S 8). Beuth Verlag GmbH: Berlin, Germany, 1985.
  63. VDI 4630; Vergärung Organischer Stoffe Substratcharakterisierung, Probenahme, Stoffdatenerhebung, Gärversuche. VDI Verein Deutscher Ingenieure: Düsseldorf, Germany, 2016.
  64. Pochwatka, P.; Kowalczyk-Juśko, A.; Sołowiej, P.; Wawrzyniak, A.; Dach, J. Biogas Plant Exploitation in a Middle-Sized Dairy Farm in Poland: Energetic and Economic Aspects. Energies 2020, 13, 6058. [Google Scholar] [CrossRef]
  65. Rokicki, T.; Perkowska, A.; Ziółkowska, P. Changes in the Concentration of Animal Production in Poland. Ann. Pol. Assoc. Agric. Agribus. Econ. 2020, 22, 175–186. [Google Scholar] [CrossRef]
  66. Bożek, J.; Szewczyk, J. Area Structure of Farms in Poland against the Background of Other European Union Countries. Wiad. Stat. Pol. Stat. 2020, 65, 48–62. [Google Scholar] [CrossRef]
  67. Kusz, D.; Nowakowski, T.; Kusz, B. The Capacity of Power of Biogas Plants and Their Technical Efficiency: A Case Study of Poland. Energies 2024, 17, 6256. [Google Scholar] [CrossRef]
  68. Kusz, D.; Kusz, B.; Wicki, L.; Nowakowski, T.; Kata, R.; Brejta, W.; Kasprzyk, A.; Barć, M. The Economic Efficiencies of Investment in Biogas Plants—A Case Study of a Biogas Plant Using Waste from a Dairy Farm in Poland. Energies 2024, 17, 3760. [Google Scholar] [CrossRef]
  69. Jarrar, L.; Ayadi, O.; Al Asfar, J. Techno-Economic Aspects of Electricity Generation from a Farm Based Biogas Plant. J. Sustain. Dev. Energy Water Environ. Syst. 2020, 8, 476–492. [Google Scholar] [CrossRef]
  70. Trypolska, G.; Kyryziuk, S.; Krupin, V.; Wąs, A.; Podolets, R. Economic Feasibility of Agricultural Biogas Production by Farms in Ukraine. Energies 2021, 15, 87. [Google Scholar] [CrossRef]
  71. Dalpaz, R.; Konrad, O.; Cândido da Silva Cyrne, C.; Panis Barzotto, H.; Hasan, C.; Guerini Filho, M. Using Biogas for Energy Cogeneration: An Analysis of Electric and Thermal Energy Generation from Agro-Industrial Waste. Sustain. Energy Technol. Assess. 2020, 40, 100774. [Google Scholar] [CrossRef]
  72. Stürmer, B.; Theuretzbacher, F.; Saracevic, E. Opportunities for the Integration of Existing Biogas Plants into the Austrian Electricity Market. Renew. Sustain. Energy Rev. 2021, 138, 110548. [Google Scholar] [CrossRef]
  73. Mauky, E.; Jacobi, H.F.; Liebetrau, J.; Nelles, M. Flexible Biogas Production for Demand-Driven Energy Supply—Feeding Strategies and Types of Substrates. Bioresour. Technol. 2015, 178, 262–269. [Google Scholar] [CrossRef]
  74. Hahn, H.; Krautkremer, B.; Hartmann, K.; Wachendorf, M. Review of Concepts for a Demand-Driven Biogas Supply for Flexible Power Generation. Renew. Sustain. Energy Rev. 2014, 29, 383–393. [Google Scholar] [CrossRef]
  75. Barchmann, T.; Mauky, E.; Dotzauer, M.; Stur, M.; Weinrich, S.; Jacobi, H.F.; Liebetrau, J.; Nelles, M. Erweiterung Der Flexibilität von Biogas-Anlagen—Substratmanagement, Fahrplan-Synthese Und Ökonomische Bewertun. Landtechnik 2016, 71, 233–251. [Google Scholar] [CrossRef]
  76. Nassereddine, M.; Nassreddine, G.; El Arid, A. Hybrid Photovoltaic and Biogas System for Stable Power System. Next Energy 2024, 5, 100172. [Google Scholar] [CrossRef]
  77. Kube, J. Management of Gas Storages in Biogas Plants. Chem. Eng. Technol. 2018, 41, 702–710. [Google Scholar] [CrossRef]
  78. Stur, M.; Pohl, M.; Krebs, C.; Mauky, E. Characterisation of Biogas Storages: Influences and Comparison of Methods. Landtechnik 2022, 77, 21–45. [Google Scholar]
  79. Circular Renewables. Membrane Replacement. Available online: https://www.circularrenewables.co.uk/maximising-efficiency-with-flexible-biogas/ (accessed on 17 July 2025).
  80. Wang, Y.; Zhang, H.; Wang, W.; Wu, Z.; Xu, X.; Kang, X.; Zhan, O.; Lü, F.; He, P. Double Membrane Gasholder for Biogas Storage: Odor Pollution Risk and Permeation Characteristics. J. Clean. Prod. 2022, 352, 131644. [Google Scholar] [CrossRef]
  81. DIN 4102; Fire Behaviour of Building Materials and Components. Beuth Verlag GmbH: Berlin, Germany, 1981.
  82. DIN EN 1876-1; Thermal Insulating Products for Building Equipment and Industrial Installations—Determination of Steady-State Thermal Transmission Properties—Part 1: Guarded Hot Plate Method. Beuth Verlag GmbH: Berlin, Germany, 1998.
  83. DIN 53359; Testing of Plastics—Determination of Resistance to Repeated Bending. Beuth Verlag GmbH: Berlin, Germany, 2006.
  84. ASTM D1434; Standard Test Method for Determining Gas Permeability Characteristics of Plastic Film and Sheeting. ASTM International: West Conshohocken, PA, USA, 2023.
  85. Urząd Regulacji Energetyki. Report on the Activities of the President of the Energy Regulatory Office in 2023. Available online: https://www.ure.gov.pl/pl/urzad/informacje-ogolne/aktualnosci/11948,Sprawozdanie-z-dzialalnosci-Prezesa-URE-w-2023-r-jak-realniewyglada-kwestia-odm.html (accessed on 31 May 2025). (In Polish)
  86. Kryszk, H.; Kurowska, K.; Marks-Bielska, R.; Bielski, S.; Eźlakowski, B. Barriers and Prospects for the Development of Renewable Energy Sources in Poland during the Energy Crisis. Energies 2023, 16, 1724. [Google Scholar] [CrossRef]
  87. Bednarek, A.; Klepacka, A.; Siudek, A. Development Barriers of Agricultural Biogas Plants in Poland. Econ. Environ. 2023, 84, 229–258. [Google Scholar] [CrossRef]
  88. Tauron Dystrybucja. Connection Feasibility Assessment Criteria and Technical Requirements for Energy Sources Connected to the Medium-Voltage Grid of the Distribution System Operator. Available online: https://www.tauron-dystrybucja.pl/przylaczenie-do-sieci/przylaczenie/zrodla-wytworcze (accessed on 9 July 2025).
  89. PGE Dystrybucja. Connection Feasibility Assessment Criteria and Technical Requirements for Energy Sources Connected to the Medium-Voltage Grid of the Distribution System Operator. Available online: https://pgedystrybucja.pl/przylaczenia/przydatne-dokumenty (accessed on 9 July 2025).
  90. Energa Operator. Connection Feasibility Assessment Criteria and Technical Requirements for Energy Sources Connected to the Medium-Voltage Grid of the Distribution System Operator. Available online: https://energa-operator.pl/przylaczenie-do-sieci/przylaczanie-wytworcy-energii/kryteria-oceny-mozliwosci-przylaczenia (accessed on 9 July 2025).
  91. Kościelny, M.; Olczak, P. Comparative LCOE/LCA and Maintenance/Service Analysis of Renewable Energy Sources in the Context of Curtailment with the Regional Diversity in Poland. Polityka Energetyczna—Energy Policy J. 2025, 28, 5–22. [Google Scholar] [CrossRef]
  92. Pijarski, P.; Kacejko, P.; Belowski, A. Rescheduling Renewable Energy Installations in Practice—Necessity versus Consequence. Rynek Energii 2025, 177, 3–10. [Google Scholar]
  93. Körber, M.; Weinrich, S.; Span, R.; Gerber, M. Demand-Oriented Biogas Production to Cover Residual Load of an Electricity Self-Sufficient Community Using a Simple Kinetic Model. Bioresour. Technol. 2022, 361, 127664. [Google Scholar] [CrossRef]
  94. Fichtner, S.; Meyr, H. Biogas Plant Optimization by Increasing Its Flexibility Considering Uncertain Revenues. Available online: https://wiso.uni-hohenheim.de/fileadmin/einrichtungen/wiso/Forschungsdekan/Papers_BESS/DP_2019-07_online.pdf (accessed on 18 July 2025).
  95. Polish Electricity Transmission System Operator. PPS Operation—Generation of Wind and Photovoltaic Sources. Available online: https://www.pse.pl/dane-systemowe/funkcjonowanie-kse/raporty-dobowe-z-pracy-kse/generacja-zrodel-wiatrowych (accessed on 15 July 2025).
  96. Lauven, L.-P.; Geldermann, J.; Desideri, U. Estimating the Revenue Potential of Flexible Biogas Plants in the Power Sector. Energy Policy 2019, 128, 402–410. [Google Scholar] [CrossRef]
  97. Next Kraftwerke GmbH. Biogas & Control Energy—The Optimal System. Available online: https://www.next-kraftwerke.de/energie-blog/biogas-regelenergie-optimale-anlage (accessed on 15 July 2025).
  98. Lehna, M.; Scheller, F.; Herwartz, H. Forecasting Day-Ahead Electricity Prices: A Comparison of Time Series and Neural Network Models Taking External Regressors into Account. Energy Econ. 2022, 106, 105742. [Google Scholar] [CrossRef]
  99. Prokhorov, O.; Dreisbach, D. The Impact of Renewables on the Incidents of Negative Prices in the Energy Spot Markets. Energy Policy 2022, 167, 113073. [Google Scholar] [CrossRef]
  100. Timera Energy. Strong Growth in Negative Prices: A German Case Study. Available online: https://timera-energy.com/blog/strong-growth-in-negative-prices-a-german-case-study/ (accessed on 30 May 2025).
  101. Warnecke, H.-J.; Kampa, H. Flexible Production Systems in the Federal Republic of Germany. IFAC Proc. Vol. 1982, 15, 191–206. [Google Scholar] [CrossRef]
Figure 1. Employment in the hard coal mining sector in Poland in the years 2007–2024 (own study based on [15]).
Processes 13 02369 g001
Figure 2. Hard coal production in Poland in the years 2007–2024 (own study based on [15]).
Processes 13 02369 g002
Figure 3. Total greenhouse gas emissions in EU Member States (own study based on [16]).
Processes 13 02369 g003
Figure 4. Installed power capacity and electricity production structure in Poland in November 2024 (own study based on [10]).
Processes 13 02369 g004
Figure 5. Electricity production from RES in 1990–2024 (own date based on [28]).
Processes 13 02369 g005
Figure 6. The structure of electricity production from RES in Poland in 2024 [17].
Processes 13 02369 g006
Figure 7. Diagram of a demand-driven biogas plant: 1—substrate tank with macerator; 2—switchboard and control room; 3—fermentation tank; 4—post-fermentation tank with biogas storage tank; 5—heat storage; 6—biogas blower with desulfurization section; 7—enlarged cogeneration unit (CHP); 8—transformer station (diagram made by Michał Bierła).
Processes 13 02369 g007
Figure 8. Diagram of a traditional biogas plant: 1—substrate tank with macerator; 2—switchboard and control room; 3—fermentation tank; 4—post-fermentation tank; 5—biogas blower with desulfurization section; 6—cogeneration unit (CHP); 7—transformer station (diagram made by Michał Bierła).
Processes 13 02369 g008
Figure 9. Operation of the biogas tank made of a double membrane: 1—the tank is empty; 2—the tank is partially filled; 3—the tank is fully filled [78].
Processes 13 02369 g009
Figure 10. The number of grid connection refusals and the aggregate power capacity of connection applications rejected during 2019–2023 in Poland [85].
Processes 13 02369 g010
Figure 11. Electricity production from PV in autumn and winter periods in Poland (own date based on [95]).
Processes 13 02369 g011
Figure 12. Average hourly price on the Day-Ahead and Intraday Market on the TGE in 2024 [17].
Processes 13 02369 g012
Figure 13. Increase in negative electricity prices in Europe [100].
Processes 13 02369 g013
Table 1. Biogas and biomethane potential of substrates in the agri-food sector in Poland (own data based on studies by the Ecotechnology Laboratory of Poznan University of Life Sciences).
MassBiogas EfficiencyCh4 ContentAmount of BiogasAmount of Methane
Type of substratemillion Mgm3/Mg FM%million m3million m3
manure (including poultry manure)7080625600.03472.0
slurry201864360.0230.4
maize straw4420521680.0873.6
beet leaves4.57054315.0170.1
beet pulp4.54252189.098.3
cereal straw and others8520544160.02246.4
non-feed hay1.642054672.0362.9
waste animal tissue0.430066120.079.2
sediments from processing plants0.14806511.27.3
pomace and residues from processing0.9515056142.579.8
waste from dairy industry0.1540566.03.4
stillages and musts1.32456059.435.6
cellulose waste1.0814056151.284.7
refood0.361606457.636.9
Sum:117.0 13,523.97780.5
Table 2. Biogas and biomethane potential of substrates in the municipal sector in Poland (own data based on studies by the Ecotechnology Laboratory of Poznan University of Life Sciences).
MassBiogas EfficiencyCh4 ContentAmount of BiogasAmount of Methane
Type of substratemillion Mgm3/Mg FM%million m3million m3
sewage sludge0.58192.262111.569.1
kitchen waste3.75103.558388.1225.1
grass leaves1.258852110.057.2
green waste from PSZOK0.4805032.016.0
Sum:6.0 641.6367.4
Table 3. Energy potential of substrates in the agri-food sector in Poland (own data based on studies by the Ecotechnology Laboratory of Poznan University of Live Sciences).
Available BiomassAvailable BiogasAmount of MethaneAmount of ElectricityPower of Linear Biogas PlantsPower of Demand-Driven Biogas Plants
million Mgmillion m3million m3GWhGWGW
11713,523.97780.6 3.77.4
Table 4. Possible return periods of biogas plants according to selected generation capacity [70].
Parameters Generation Capacity
25 kW50 kW100 kW150 kW350 kW500 kW1 MW10 MW20 MW
Investments, EUR/kW 840084006000500045004500350018002000
Levelized generation cost, EUR/kWh0.8370.8370.6030.5000.4650.4650.3700.2200.145
Simple return period, years16.516.511.89.88.98.96.93.52.0
Simple return period (in case of potential feed-in tariff at 0.3 EUR kWh), years 8.48.46.054.54.53.51.81.4
Table 5. First schedule of operation of the demand-driven biogas plant [88,89,90].
MonthIIIIIIIVVVIVIIVIIIIXXXIXII
On time16:0016:0016:0018:0018:0018:0018:0018:0016:0016:0016:0016:00
Off time9:009:009:009:009:009:009:009:009:009:009:009:00
Time of work171717141414141417171717
Table 6. Second schedule of operation of the demand-driven biogas plant [88,89,90].
MonthIIIIIIIVVVIVIIVIIIIXXXIXII
On time18:3018:3018:3018:3018:3018:3018:3018:3018:3018:3018:3018:30
Off time6:306:306:306:306:306:306:306:306:306:306:306:30
Time of work121212121212121212121212
Disclaimer/Publisher’s Note: The statements, opinions and data contained in all publications are solely those of the individual author(s) and contributor(s) and not of MDPI and/or the editor(s). MDPI and/or the editor(s) disclaim responsibility for any injury to people or property resulting from any ideas, methods, instructions or products referred to in the content.

