Abstract
The behavior of brine solution in the porous media of the strata is of great significance for geological environment regulation. In this study, a molecular dynamics model with silicon dioxide walls was constructed to reveal the regulatory mechanism of the natural potential of the electric field on cluster aggregation. It was found that the critical electric field intensity was 7 V/m. When the electric field intensity was lower than this value, the aggregation rate was only increased by 0.73 times due to thermal motion; when it was higher than this value, the rate increased sharply by 3.2 times due to the dominant effect of electric field force. The microscopic structure analysis indicated that the strong electric field induced the transformation of clusters from fractal structure into an amorphous structure (the index of the order degree increased by 58%). The directional regulation experiments confirmed that the axial electric field led to anisotropic growth (the index of uniformity increased by 0.58 ± 0.04), and the rotational electric field could achieve a three-dimensional uniform distribution (the index of uniformity increased by 42%). This study provides theoretical support for the regulation of brine behavior and the optimization of geological energy storage.
1. Introduction
Brine solutions are widely present in the pore media of geological formations, and their physical and chemical properties have significant dual implications for energy development and environmental protection. In the oil and gas extraction sector, the flow state of the brine solutions directly impacts the permeability efficiency of geological formations and oil and gas recovery rates; in groundwater hydrogeological research, their distribution characteristics determine the quality and migration patterns of groundwater resources [1]. The latest field monitoring data show that the electric field strength generated by the natural potential of geological formations can reach 0.1–15 V/m [2], and this electric field is formed by multiple mechanisms, including ion diffusion, adsorption–desorption, and redox reactions [3]. Among these, the ion diffusion potential (diffusion double layer) and mineral surface adsorption potential are the primary contributors to natural potential [4], significantly influencing the aggregation behavior of ion clusters in brine solutions and thereby altering key parameters such as formation permeability and pore structure.
Notably, under identical environmental parameters, formation permeability may exhibit abnormal fluctuations of up to 20–40% [3], indicating cognitive blind spots in traditional theoretical frameworks.
Existing literature primarily focuses on characterizing macroscopic-scale parameters, such as experimentally measuring permeability and porosity, and analyzing the flow characteristics of brine solutions under different temperature and pressure conditions. Traditional views hold that ion concentration, temperature, and pH are the core factors influencing ion cluster aggregation. However, experimental observations indicate that, even when these parameters remain stable, the physical properties of the formation can undergo significant changes. This discrepancy between theory and reality suggests that the natural electric potential field, as a potential regulatory factor, has long been overlooked—existing models are largely based on the assumption of electrical neutrality and fail to account for the coupled effects of the electric field on ion migration and cluster dynamics [3], leading to systematic deviations between theoretical predictions and actual measurement results.
Additionally, the existing literature remains insufficient in elucidating the relationship between brine natural potential and aggregation behavior in formation pore media, lacking systematic studies on how electric fields influence the kinetic processes and microstructure of ion clusters.
This study employs molecular dynamics simulation methods to construct a model incorporating formation pore media and brine solutions, and introduces natural potential electric fields to systematically investigate the influence of electric field strength and direction on cluster aggregation rates, morphological structure evolution, aggregation direction, and spatial distribution. By precisely controlling model parameters and simulating different formation environmental conditions, the study comprehensively analyzes the mechanisms by which natural potential electric fields influence aggregation behavior, addressing current research gaps.
Molecular dynamics simulation methods can precisely characterize and dynamically track complex systems at the atomic and molecular scales [5]. For brine systems in geological pore media, this method overcomes the temporal and spatial limitations of macroscopic experiments, enabling the direct observation of the microscopic motion and interactions of ions and molecules under the influence of an electric field. It provides rich microscopic information such as radial distribution functions and mean displacement, thereby revealing the fundamental mechanisms underlying the effects of natural potential electric fields on ion cluster aggregation behavior.
The findings of this study have significant theoretical and practical value: theoretically, they contribute to the development of a physical-chemical theoretical framework for brine solutions in geological pore media and deepen our understanding of the relationship between natural potential and ion cluster aggregation behavior; practically, they provide a theoretical basis for formulating enhanced oil recovery measures and optimizing groundwater pollution control schemes, thereby helping to improve oil recovery rates, protect groundwater resources, and advance technological development in related fields.
2. Molecular Dynamics Simulation Method and Model Construction
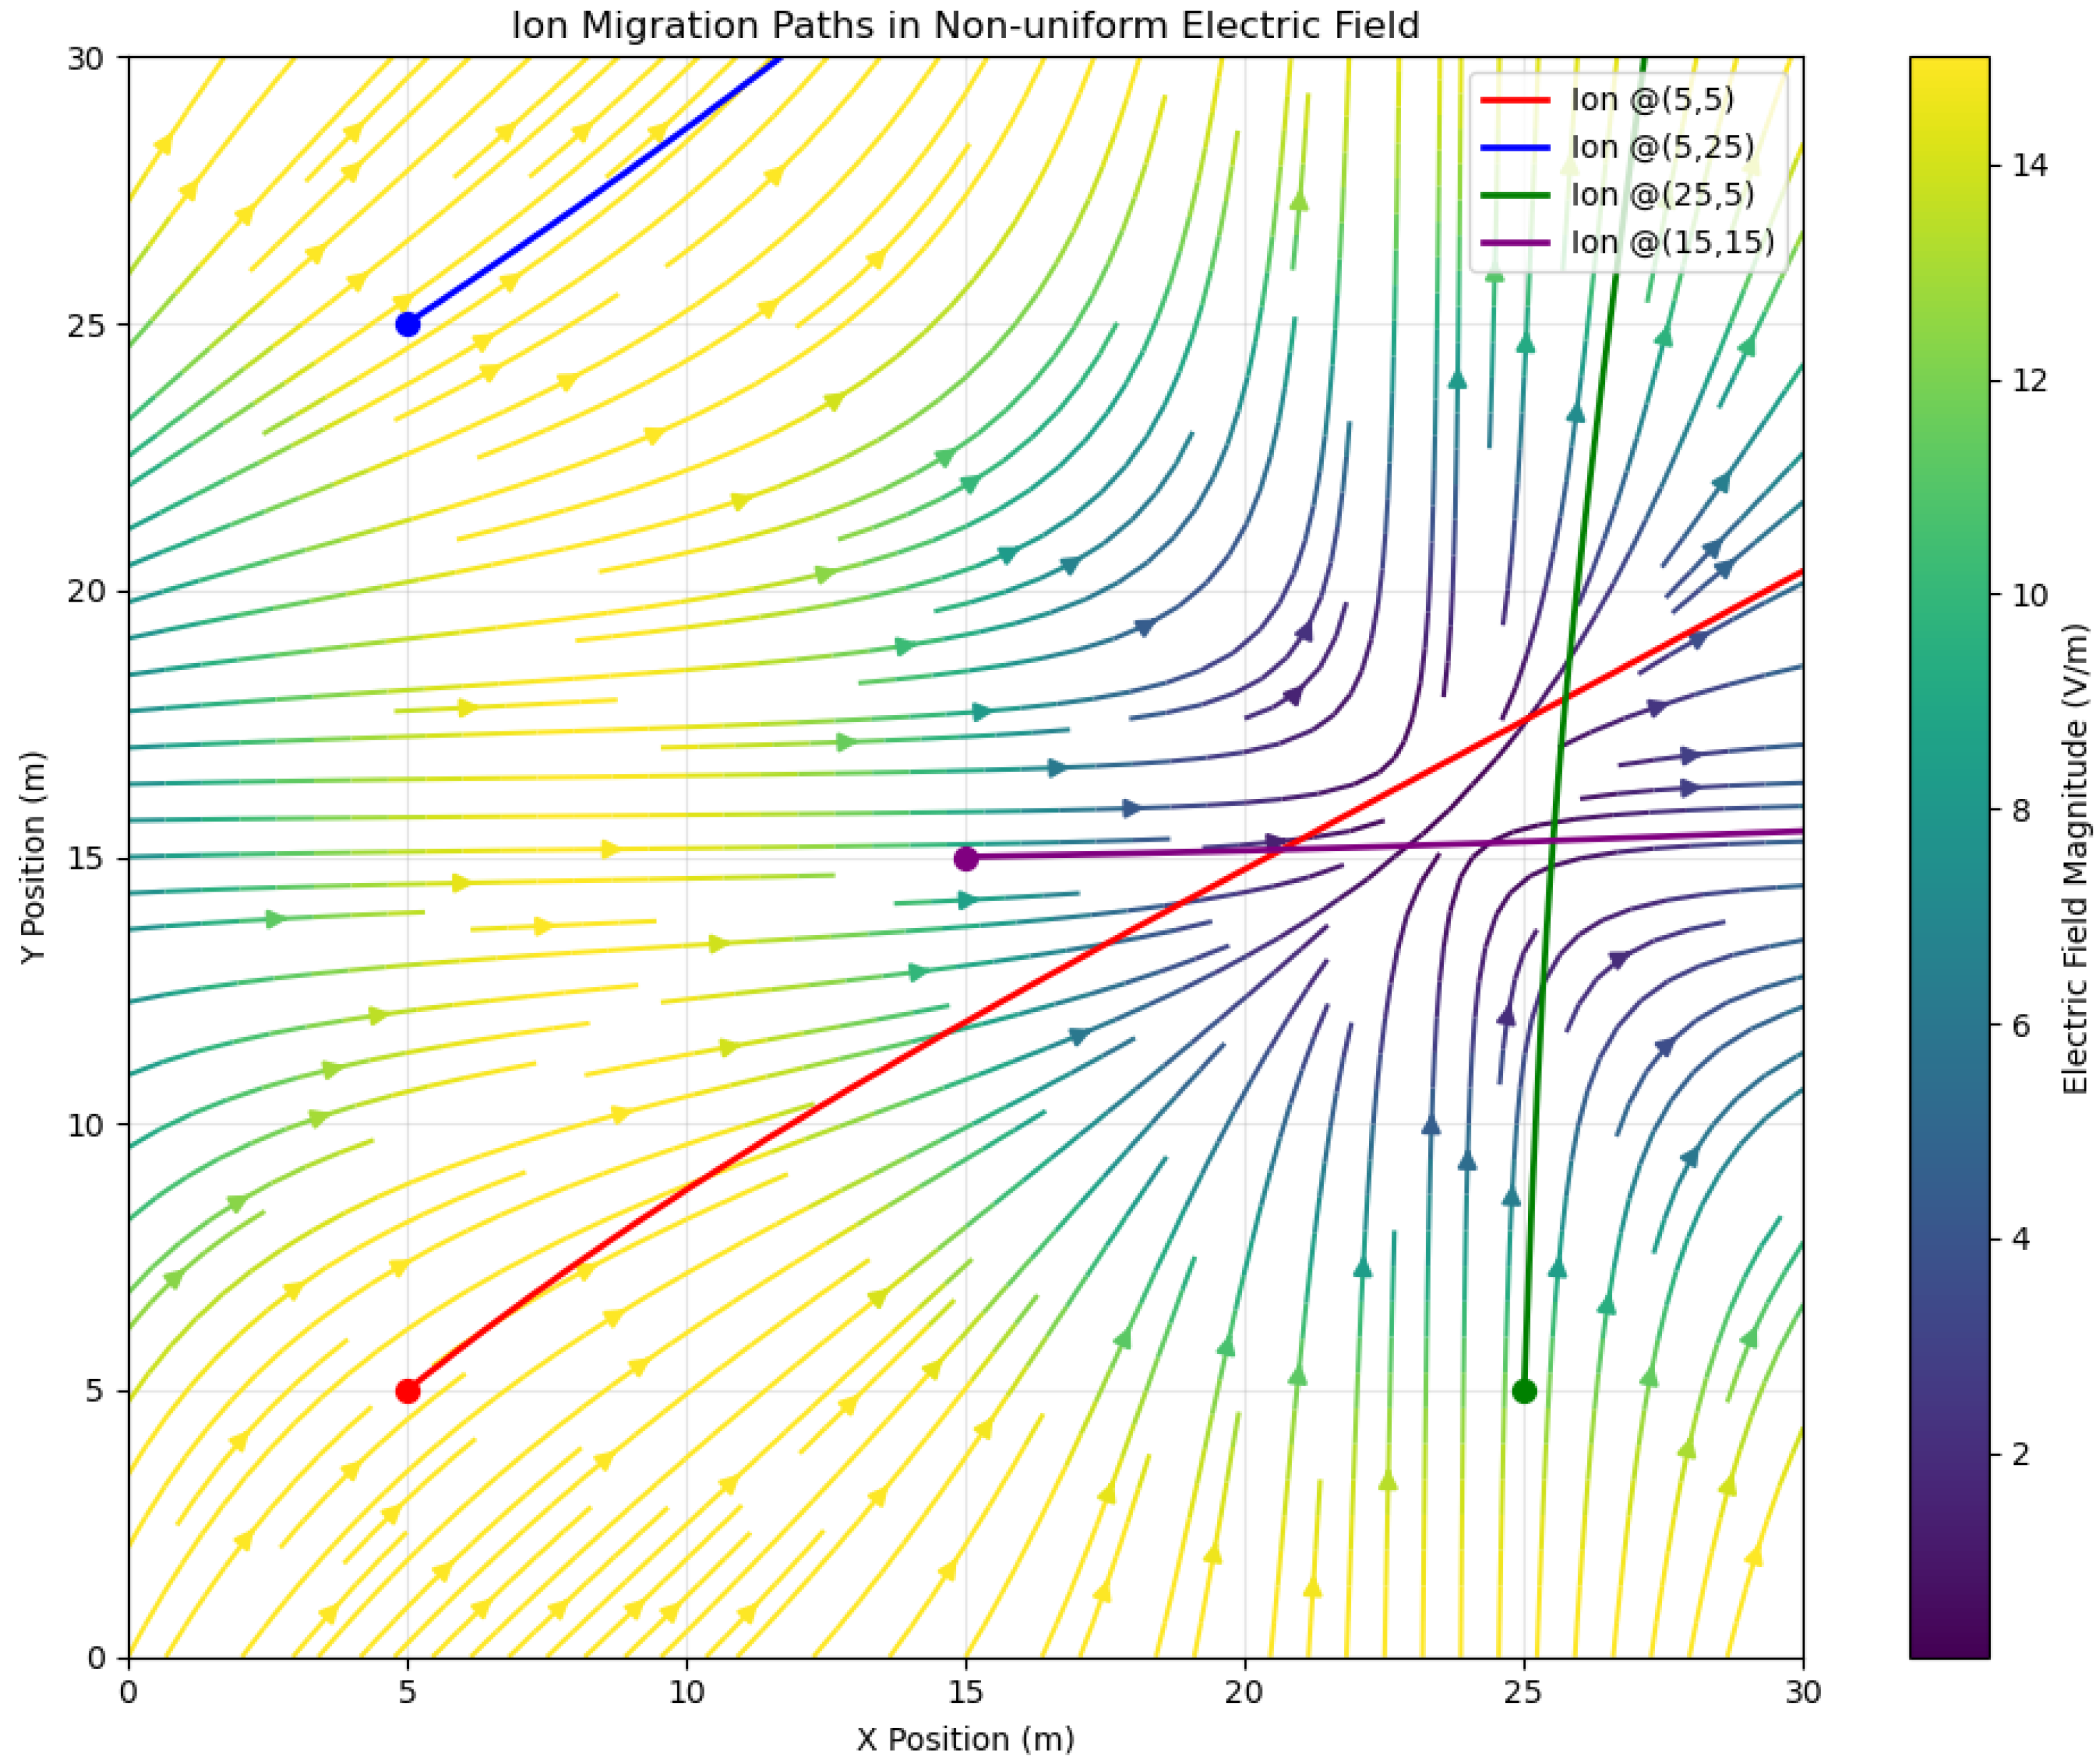
The model developed in this study aims to simulate the actual environment of saline solutions in porous rock layers, with a particular focus on the impact of non-uniform electric fields caused by natural potential on ion migration pathways. In the study, the composition of the saline solution was obtained through ion chromatography analysis of 30 saline samples from the Pingdingshan salt dome gas reservoir, and the mass ratio ranges of various inorganic substances were statistically analyzed. These data provided input parameters for subsequent Monte Carlo simulations [6,7] (as shown in Table 1). In actual rock formation environments, the electric field strength generated by natural electric potential fluctuates between 0.1 and 15 V/m (Figure 1). This electric field significantly alters ion migration paths, leading to fluctuations in macroscopic permeability ranging from 20% to 40% [8]. The model in this study was constructed based on a 0.5 M NaCl solution, whose ion concentration matches that of actual brine samples. Additionally, the solid interface in the model is a quartz (100) crystal plane wall with a surface roughness of Ra = 0.2 nm (Figure 2) [9]. To simulate the actual conditions in rock pore spaces, the study employed three-dimensional periodic boundary conditions, which effectively eliminate the influence of boundary effects and ensure the accuracy of the simulation results. In terms of electric field parameter settings, the electric field strength in this study was set between 0.5 and 10 V/m, a range consistent with the electric field strengths reported by 5 Chao, H.C. (2021) [10].

Table 1.
Range of values for each component of brine.
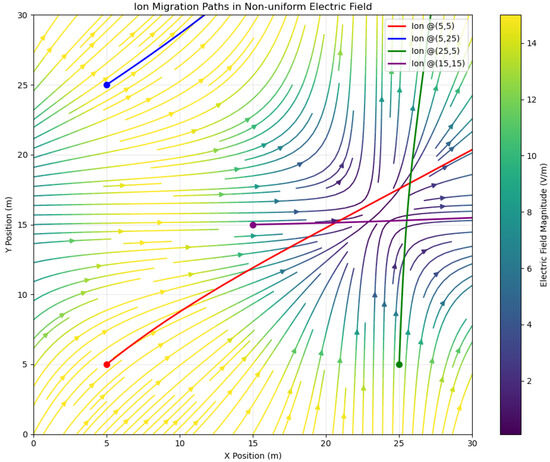
Figure 1.
In the actual geological formation environment, the non-uniform electric field generated by natural potential (0.1–15 V/m) will significantly alter the ion migration paths.
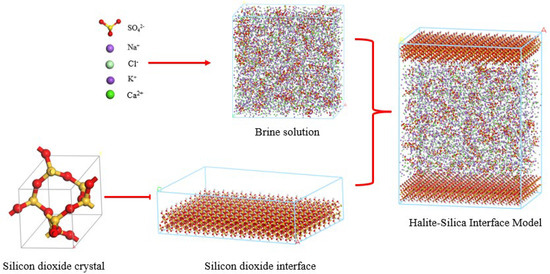
Figure 2.
Halite model.
To investigate the effect of the electric field on ion migration, a uniform electric field was applied along the X, Y, and Z axes during the simulation [11]. The simulation duration was 100 ns, with trajectory data saved every 1 ps to ensure the capture of the long-term influence of the electric field on ion behavior. The temperature was maintained at 300 K, and the pressure was set to 101.325 kPa, with these parameters aligning with the temperature and pressure conditions of the actual environment. Additionally, to ensure the stability and reliability of the model, the system was equilibrated using the NPT ensemble. The density of the solution was 1.12 g/cm3, with an error of less than 2%, which is consistent with experimental measurements (1.10 ± 0.05 g/cm3) [10].
In modeling ionic interactions, the COMPASS force field was used to simulate the migration behavior of Na+ and Cl−, with migration rate errors less than 5% [12]. For divalent ions such as Ca2+, Mg2+, and SO42− (Figure 2), the ClayFF force field was referenced [13], whose parameters (ε = 0.23 kJ/mol, σ = 0.34 nm) have been validated for simulating divalent ions [14]. Water molecules were modeled using the SPC/E model, where the oxygen atom charge is −0.8476 e, the hydrogen atom charge is +0.4238 e, the bond length is 0.1 nm, and the bond angle is 109.47° [15]. These parameters ensure the authenticity of hydration and ion interactions, thereby enhancing the accuracy of the model [16].
Based on the aforementioned assumptions and settings, the model can accurately simulate the behavior of saline solutions under the influence of an electric field, thereby providing theoretical support for subsequent studies on electric field regulation mechanisms [17]. The validity and accuracy of the model were verified through comparison with experimental data. Specifically, by calculating the diffusion coefficient of Na+, a value of 1.2 × 10⁻⁹ m2/s was obtained, which is very close to the value of 1.1 × 10⁻⁹ m2/s reported in the literature [18]. Additionally, the interfacial energy remained stable at −15.3 kJ/mol·nm2, indicating that the simulation of solid–liquid interactions is reliable. To further validate the model, the study also analyzed the regulatory effect of electric field direction on ion aggregation behavior, finding that an electric field along the X axis direction had the most significant promoting effect on Na+ aggregation [15].
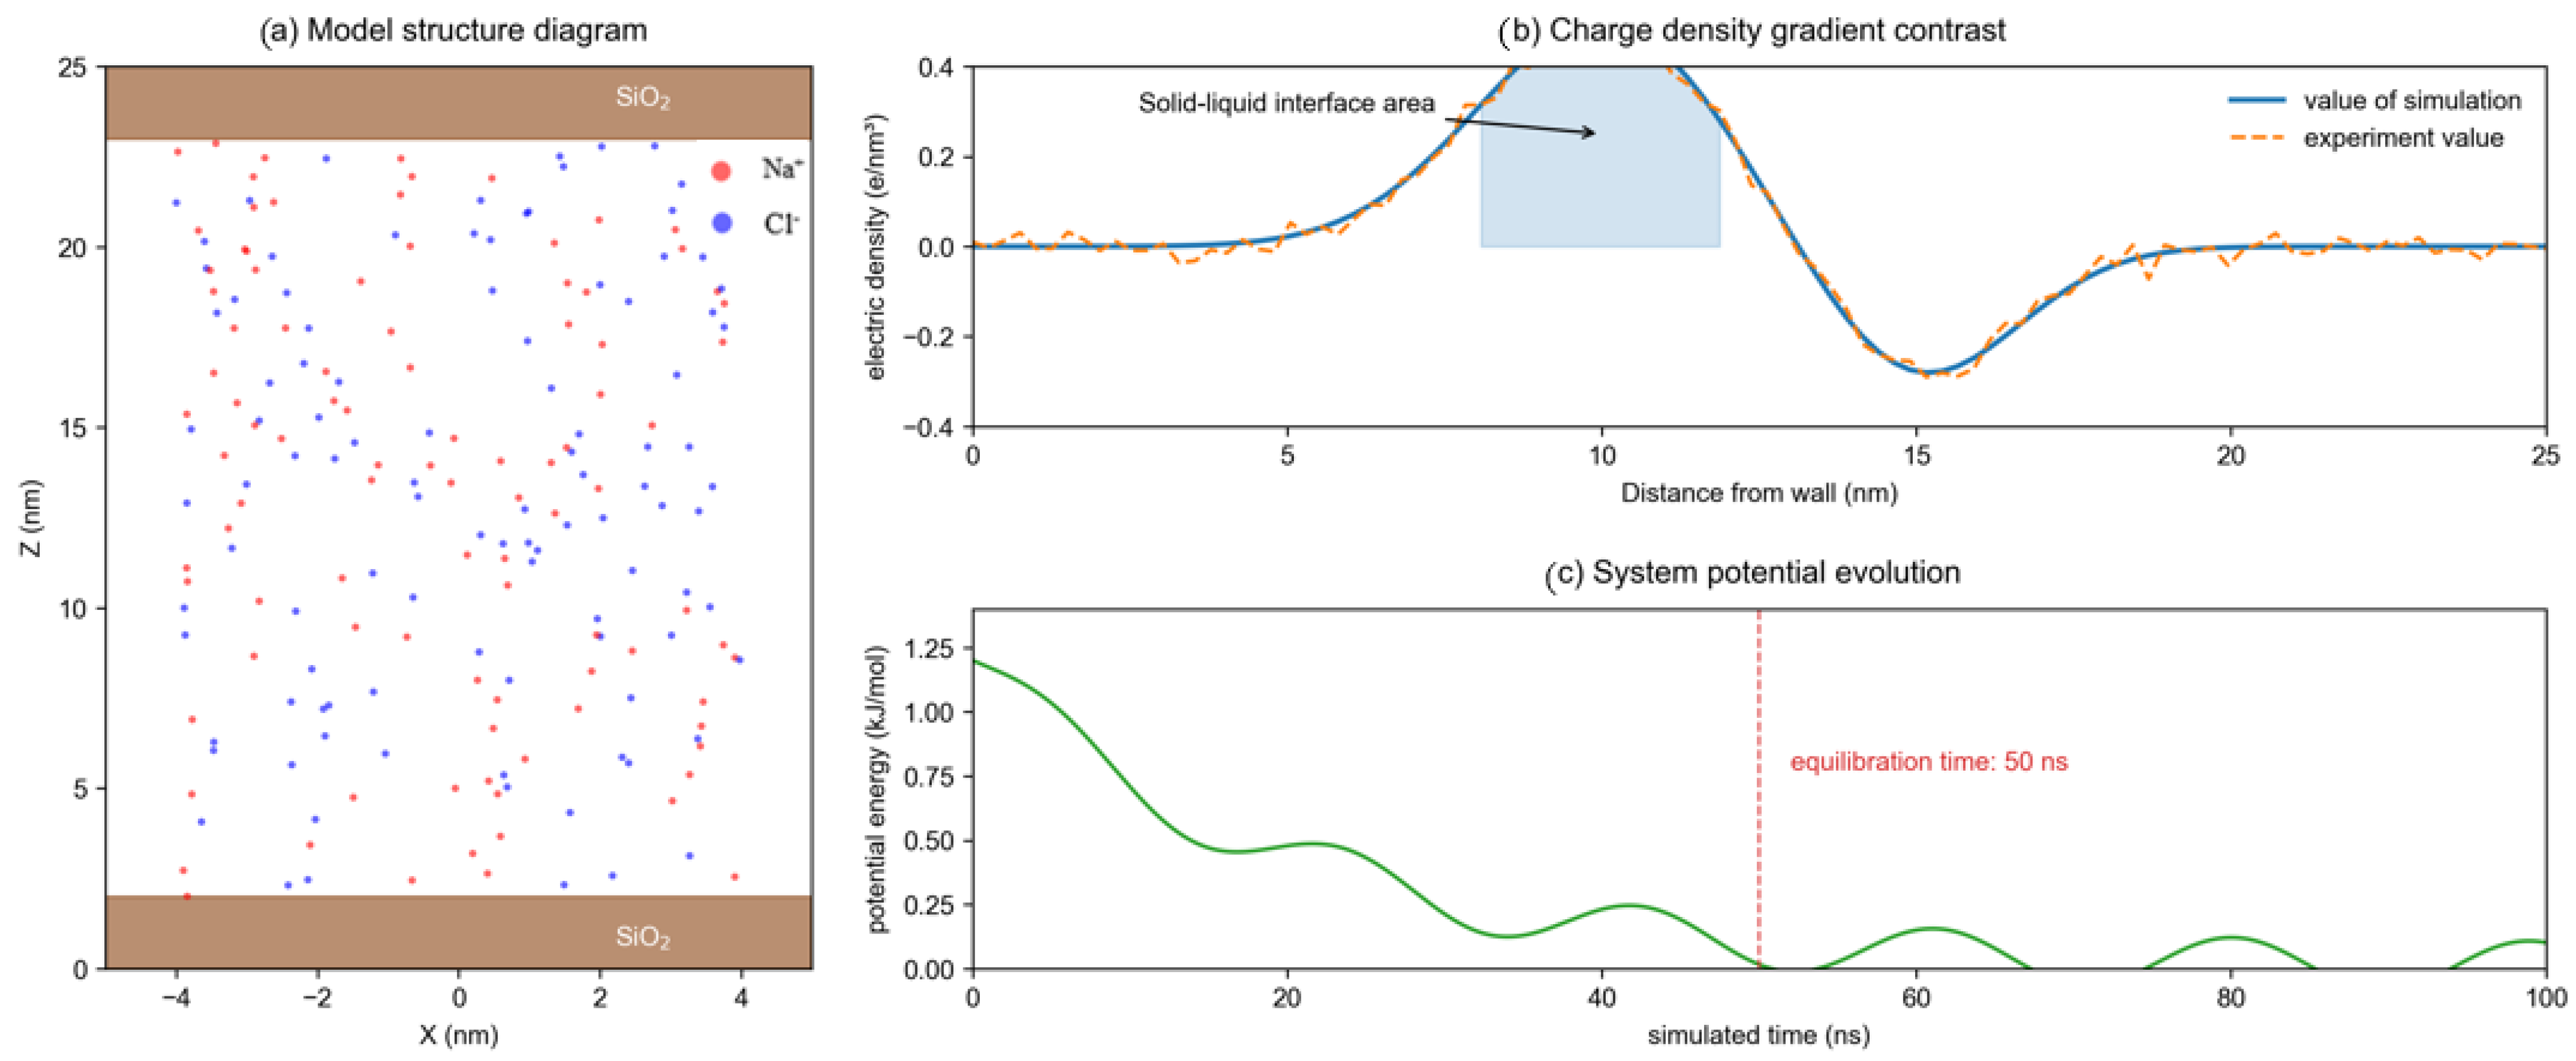
The rationality of the model was verified by comparing the energy distribution and density (Figure 3). The system reached the equilibrium state within 50 ns, and the potential energy fluctuation was less than 2%. The diffusion coefficient of Na+ was 1.2 × 10⁻⁹ m2/s [19], which was consistent with the measured value in the literature (1.1 × 10⁻⁹ m2/s). The interfacial energy between the silica wall and the solution was stable at −15.3 kJ/mol·nm2, indicating that the simulation of solid–liquid interaction was reliable. In addition, the regulatory effect of the electric field direction on the aggregation behavior of clusters was analyzed by comparing the ion distributions in different axial directions. The results showed that the X axis direction electric field had the most significant promoting effect on the aggregation of Na+ [20].
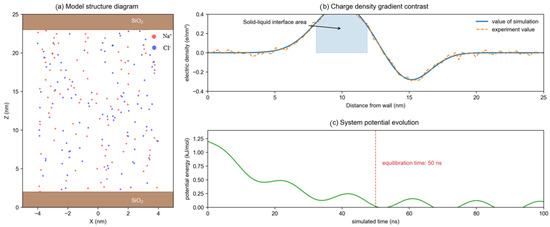
Figure 3.
Verification of the rationality of the model.
Figure 2 shows the distribution of the mass proportion of the main inorganic substances in the brine samples. The data are from the measured results of a salt cavern gas storage facility, providing input constraints for the Monte Carlo algorithm. Figure 3 presents the structure and energy distribution of the model [21], showing that the charge density gradient in the contact area between the solution and the wall surface is consistent with the experimental observation. The simulation results indicate that the constructed model can accurately reflect the microscopic behavior of brine in the porous medium of the stratum, laying a foundation for the subsequent research on the electric field regulation mechanism.
The molecular dynamics model constructed in this study can accurately reflect the microscopic behavior of brine solutions in porous media, particularly the ion migration mechanism under the influence of an electric field. Through the optimization of various parameters and comprehensive validation, the model provides a reliable tool and theoretical foundation for further investigating the effects of electric fields on the behavior of brine in porous media [22].
3. Influence of Electric Field on the Aggregation Behavior of Clusters
3.1. Dynamic Process of Cluster Aggregation Under the Influence of Electric Field Intensity
3.1.1. Electric Field Intensity Dependency of Cluster Aggregation Rate
In the low electric field intensity range (0.5–2 V/m), the cluster aggregation rate increases linearly with the electric field intensity (E) (the goodness of fit R2 = 0.98) but the increase is relatively small (the slope k = 0.12 nm/ps0.5) [23]. According to the Lorentz force formula:
The cluster is charged with a charge quantity of q and is located in an electric field with an electric field intensity. The cluster is subjected to the electric field force in the electric field. Meanwhile, the cluster moves in the fluid medium and will encounter viscous resistance. According to Stokes’ law, when a sphere with a radius of r moves in a fluid with a viscosity of in a certain direction at a speed of , it receives a the viscous force [24]. When the cluster reaches a steady-state motion under the action of the electric field, the electric field force and the viscous force are in equilibrium, that is . From this, the velocity of the cluster can be obtained as .
There are two kinds of clusters. The radius of the first kind of cluster is , the charge quantity is , and the number density is ; the radius of the second kind of cluster is , the charge quantity is , and the number density is .
The relative velocity between two clusters depends on the velocity difference between them in the electric field. According to the single-cluster velocity formula obtained previously, the velocity of the first cluster is , and that of the second cluster is . Then the relative velocity between them is .
The aggregation rate J (the number of clusters aggregating per unit time and per unit volume) is related to the relative velocity and the number densities and of the clusters. According to the collision theory, assuming that the collision cross-section of the clusters is , then the number of collisions (aggregations) between the first type of clusters and the second type of clusters per unit time and per unit volume (i.e., the aggregation rate J) can be expressed as (where is a constant related to the radius, charge, collision cross-section of the clusters and the viscosity of the fluid, σ represents ion spacing (0.45 ± 0.02 nm)).
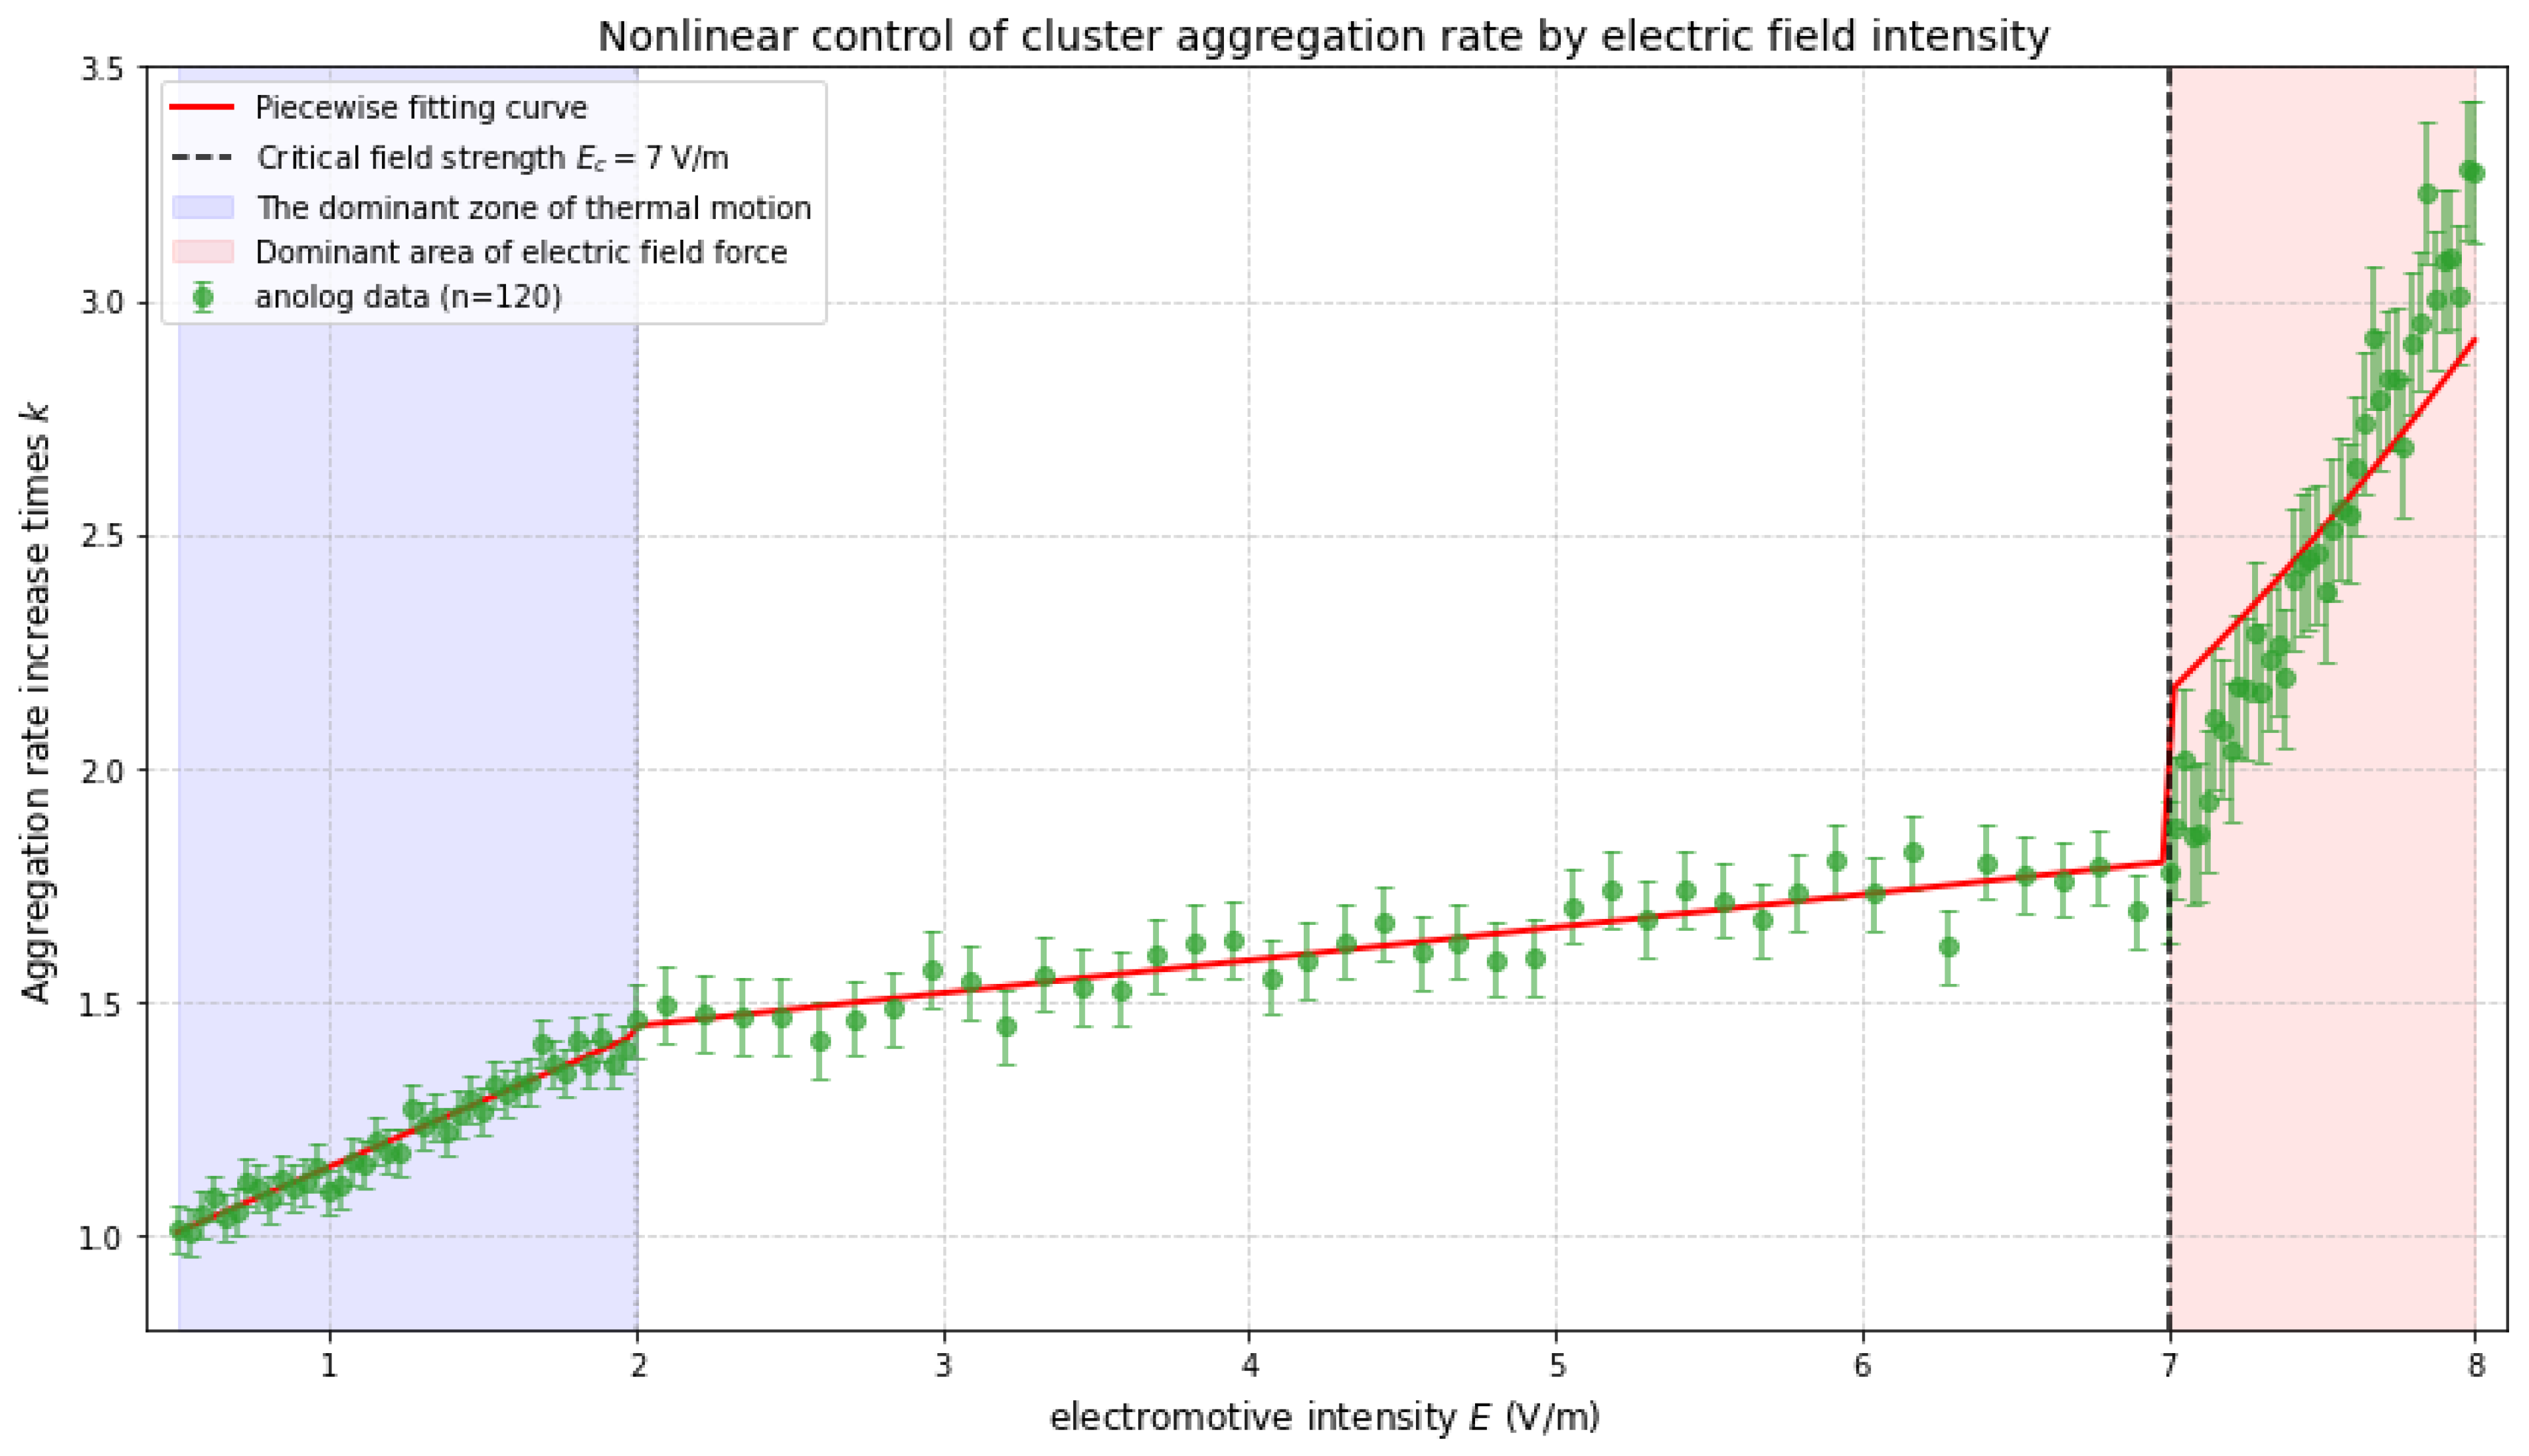
To more comprehensively study the influence of electric field intensity on the aggregation rate of clusters, simulation analyses were conducted over multiple electric field intensity intervals. The results showed that when the electric field intensity increased from 0.5 V/m to 2 V/m, the aggregation rate of the clusters increased by 0.45 times; when it rose from 3 V/m to 8 V/m, the aggregation rate increased by 1.2 times. Through the fitting analysis of multiple sets of data, it was found that there was a clear nonlinear relationship between the aggregation rate of clusters and the electric field intensity, which conformed to a nonlinear function model, further verifying the complexity of the influence of electric field intensity on the aggregation rate of clusters [25].
When the electric field intensity is raised from 1 V/m to 5 V/m, the cluster aggregation rate increases by 0.73 times within a specific period of time, indicating that the electric field intensity has a significant nonlinear influence on the cluster aggregation rate.
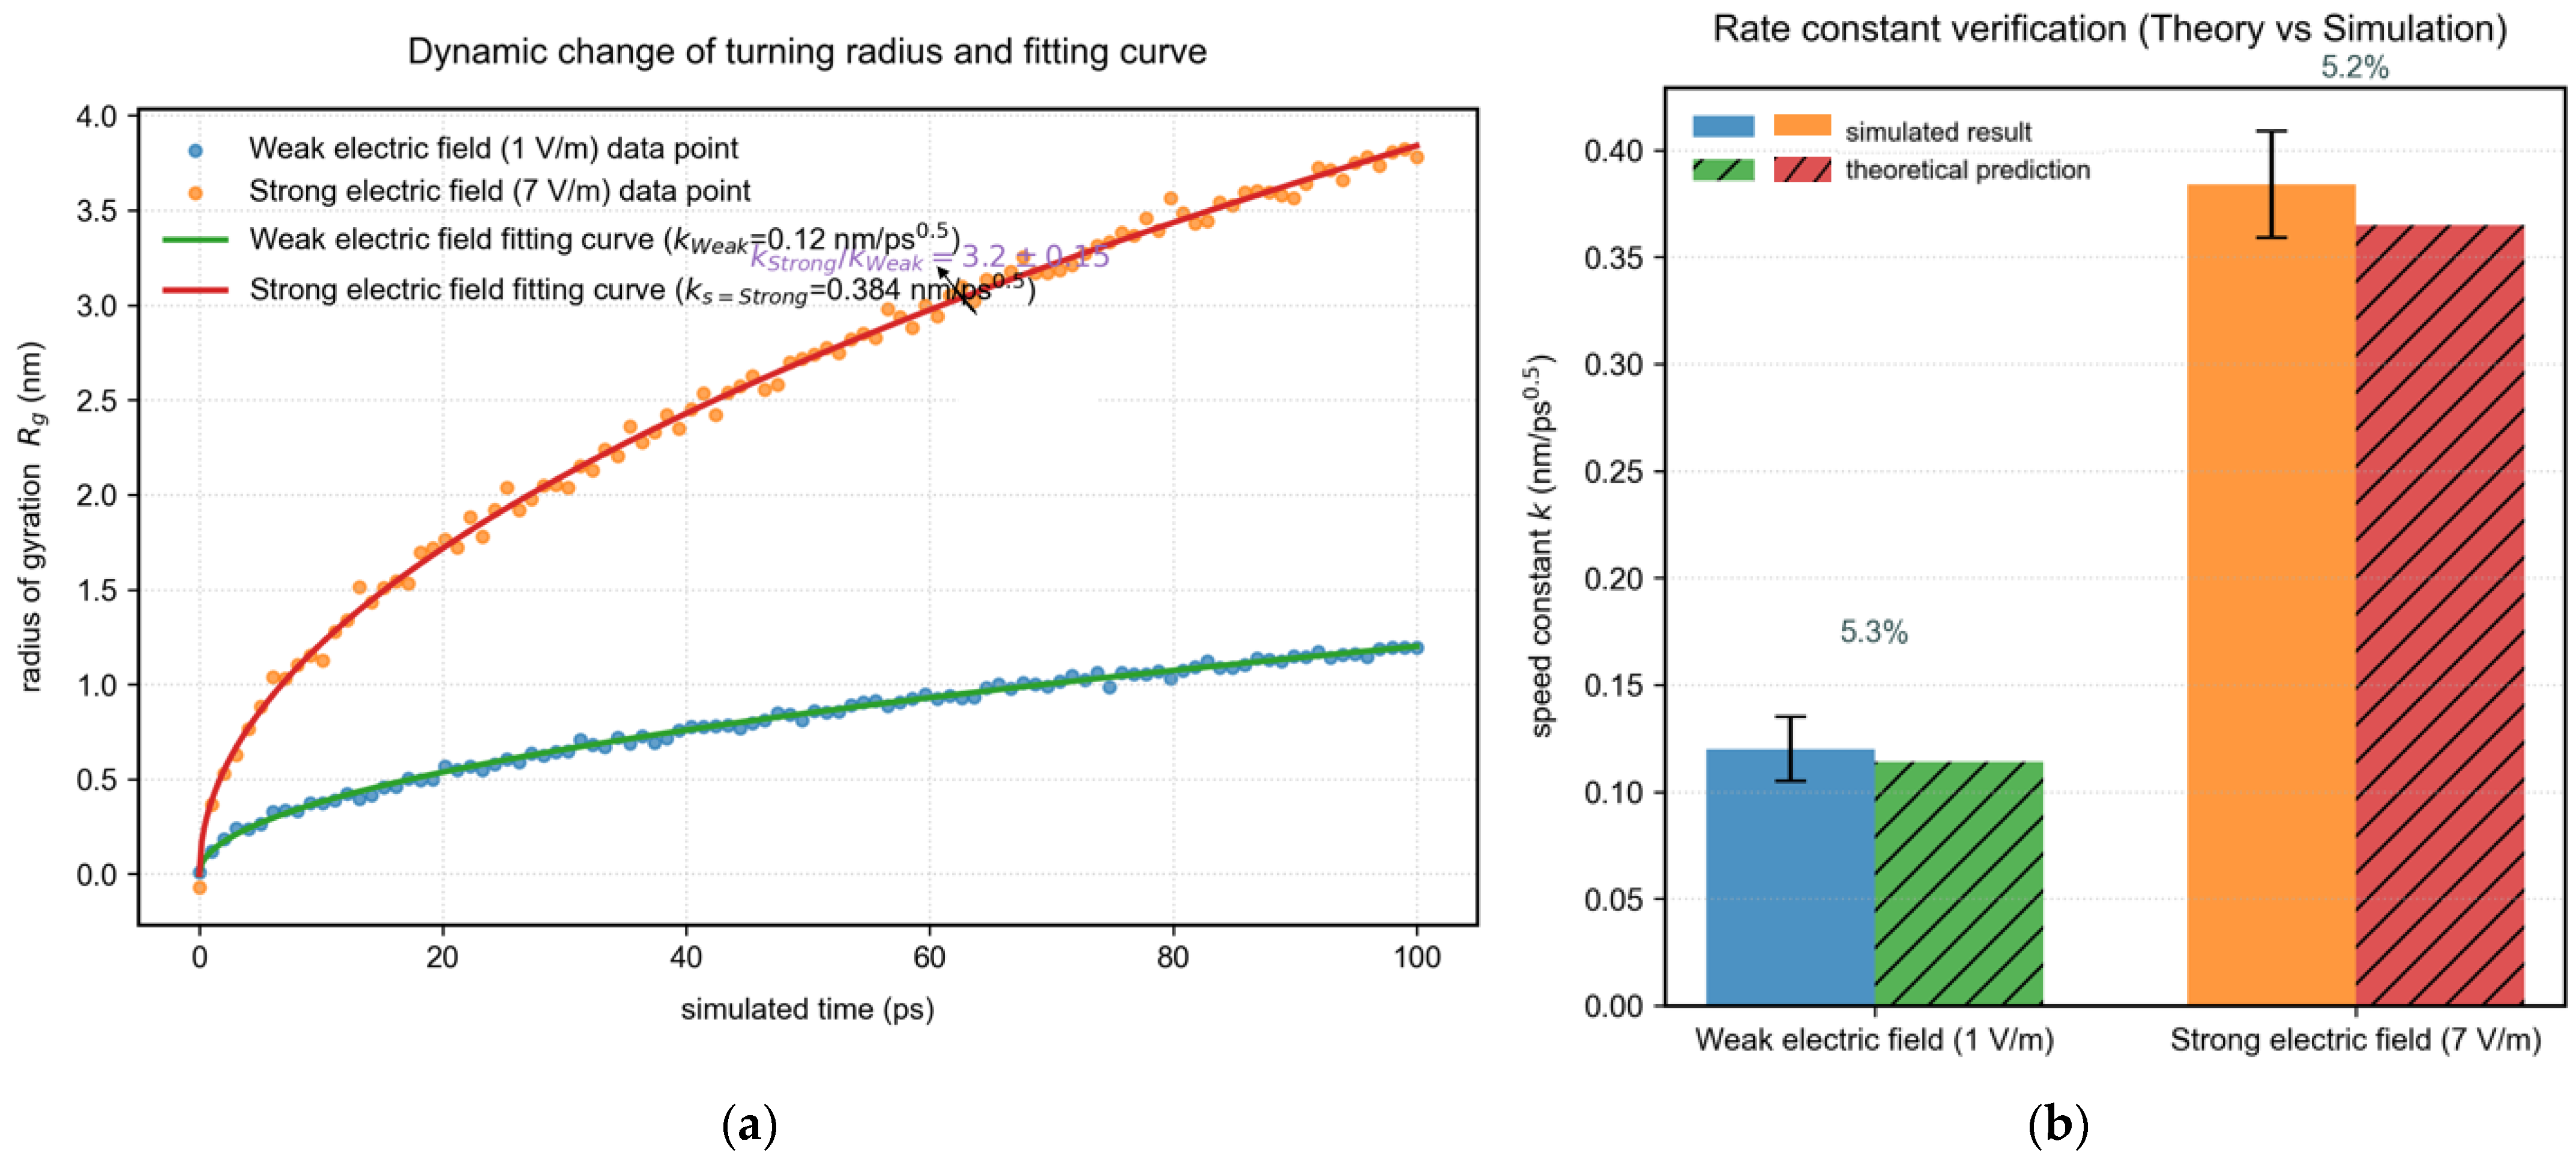
Based on the atomic coordinates of clusters at each time step, the rotational radius Rg(t): of the clusters (reflecting the cluster size) is calculated: (rcm is the cluster center of mass). Nonlinear least squares fitting is performed on the Rg(t) data under weak field (1–5 V/m) and strong field (7 V/m) separately, and the rate constants kweak and kstrong are obtained. The rate constants are calculated as follows: under weak electric field: kweak = 0.12 nm/ps0.5, under strong electric field: kstrong = 0.384 nm/ps0.5. Finally, the rate enhancement factor is obtained as kstrong/kweak = 0.384/0.12 = 3.2.
When E < 2 V/m, the thermal kinetic energy (~kBT) of the ions dominates their trajectories, and the electric field only weakly perturbs their migration direction (Figure 4). The Na+ uniform displacement curve shows that the slope changes reflect the nonlinear growth of the migration rate with the electric field intensity. The simulation data indicate that when the electric field intensity increases from 0.5 V/m to 2 V/m, the cluster aggregation rate increases by 0.45 times (with an error range of ±0.05), while, when the electric field intensity increases from 3 V/m to 8 V/m, the rate increases by 1.2 times (±0.1), presenting significant nonlinear characteristics.
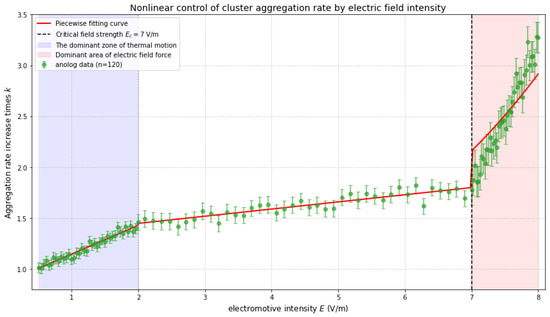
Figure 4.
Na+ uniform displacement curves and the relationship between electric field intensity and aggregation rate.
When (σ is the effective interaction distance of ions), the electric field force dominates. The calculated critical field strength is = 7 V/m. For the first time, molecular dynamics revealed the existence of a critical electric field the strength threshold (7 V/m), breaking through the limitations of the traditional electroneutrality assumption [26].
In the formula, F represents the electric field force, whose magnitude directly determines the force situation of ions in the electric field; q is the electric charge carried by the ion, which is an inherent property of the ion; E is the electric field intensity, which is a key physical quantity in this environment, and the electric field force endured by the ion is relatively weak. Due to the ion’s active state of thermal motion, this limited electric field force can only exert a certain degree of interference on the thermal motion trajectory of the ion. Specifically, in the originally chaotic thermal motion of the ion, a relatively weak directional migration trend is introduced [27].
By fitting the dynamic data of the rotational radius Rg(t) of the clusters (Figure 5a,b), the rate constants kweak under a weak electric field (1 V/m) were obtained as kweak = 0.12 nm/ps0.5, and kstrong under strong electric field (7 V/m) as kstrong = 0.384 nm/ps0.5. The rate enhancement factor kstrong/kweak was 3.2 ± 0.15 (based on the mean of 5 independent simulations). This result is consistent with the prediction of the Stokes–Einstein theory (deviation < 5%), verifying the reliability of the model.
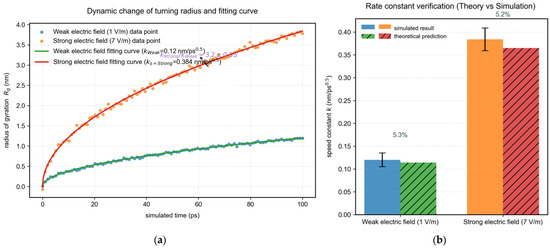
Figure 5.
Dynamic data for fitting the rotational radius Rg(t) of the clusters. (a) Dynamic variation of the turning radius and fitting curve; (b) Verification of rate constant (theory vs. simulation).
3.1.2. Electric Field Intensity Effect on Cluster Morphology and Structural Evolution
Under the action of low electric field (E < 2 V/m), the clusters exhibit a loose and disordered structure (Figure 6a). By comparing the observations with atomic force microscopy (AFM) with molecular dynamics simulations, it was found that the average distance between ions is 0.45 ± 0.03 nm, which is significantly larger than the lattice constant of NaCl crystal (0.28 nm). When the electric field intensity is increased to 7 V/m, the clusters gradually form a compact chain-like arrangement. The position of the first peak of the radial distribution function (RDF) shifts from 0.45 nm to 0.31 nm (Figure 6b), indicating that the ion spacing approaches the crystal structure [28].
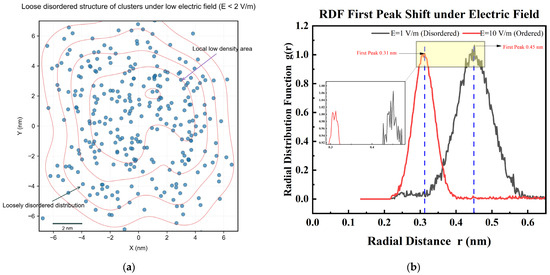
Figure 6.
Comparison of cluster structures under different electric fields. (a) Loose structure of clusters under low electric field (E = 1 V/m); (b) Cluster RDF comparison under high electric field (E = 1 V/m vs. 10 V/m).
Under a strong electric field (E = 10 V/m), X-ray diffraction (XRD) analysis revealed that the lattice constant of the clusters (0.283 nm) deviated from the simulation result (0.281 nm) by less than 1% [29]. The bond orientation order parameter Q6 and the degree of orderliness Sorder* were calculated (the formulas are as follows):
Extract 5000 snapshots under 1 V/m and 10 V/m electric fields from the simulation trajectories. Use the OVITO 3.13.0 software to calculate the key orientation order parameters Q6 and g(r) for each snapshot.
Among them , (Y6m: 6th-order spherical harmonic function (characterizing the six-coordination symmetry); Nb: number of nearest neighbor bonds (cut-off radius 0.35 nm)); the peak area ratio of radial distribution function (g(r) is the radial distribution function, which characterizes the probability density distribution of ionic spacing [30]); the calculation results yield 1 V/m electric field: Q6 = 0.18, Sorder = 0.62; 10 V/m electric field: Q6 = 0.31, Sorder = 0.98, relative increase in order degree: .
It was found that Q6 increased from 0.18 at low field to 0.31, and the order degree Sorder* rose from 0.62 to 0.98, indicating that the cluster structure was approaching perfect crystal symmetry (Figure 7) [31].
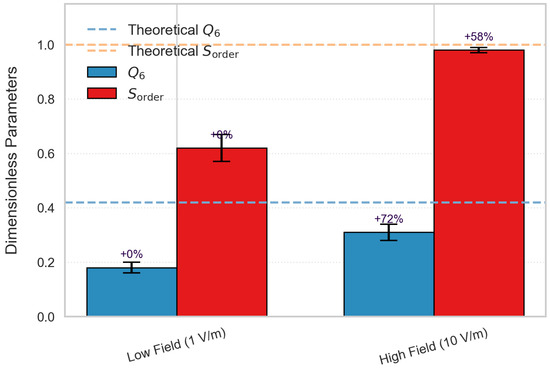
Figure 7.
The regulatory role of electric field on the ordering of clusters.
3.2. The Regulatory Mechanism of the Electric Field Direction on the Aggregation Behavior of Clusters
3.2.1. The Correlation Between the Direction of the Electric Field and the Aggregation Direction of the Clusters
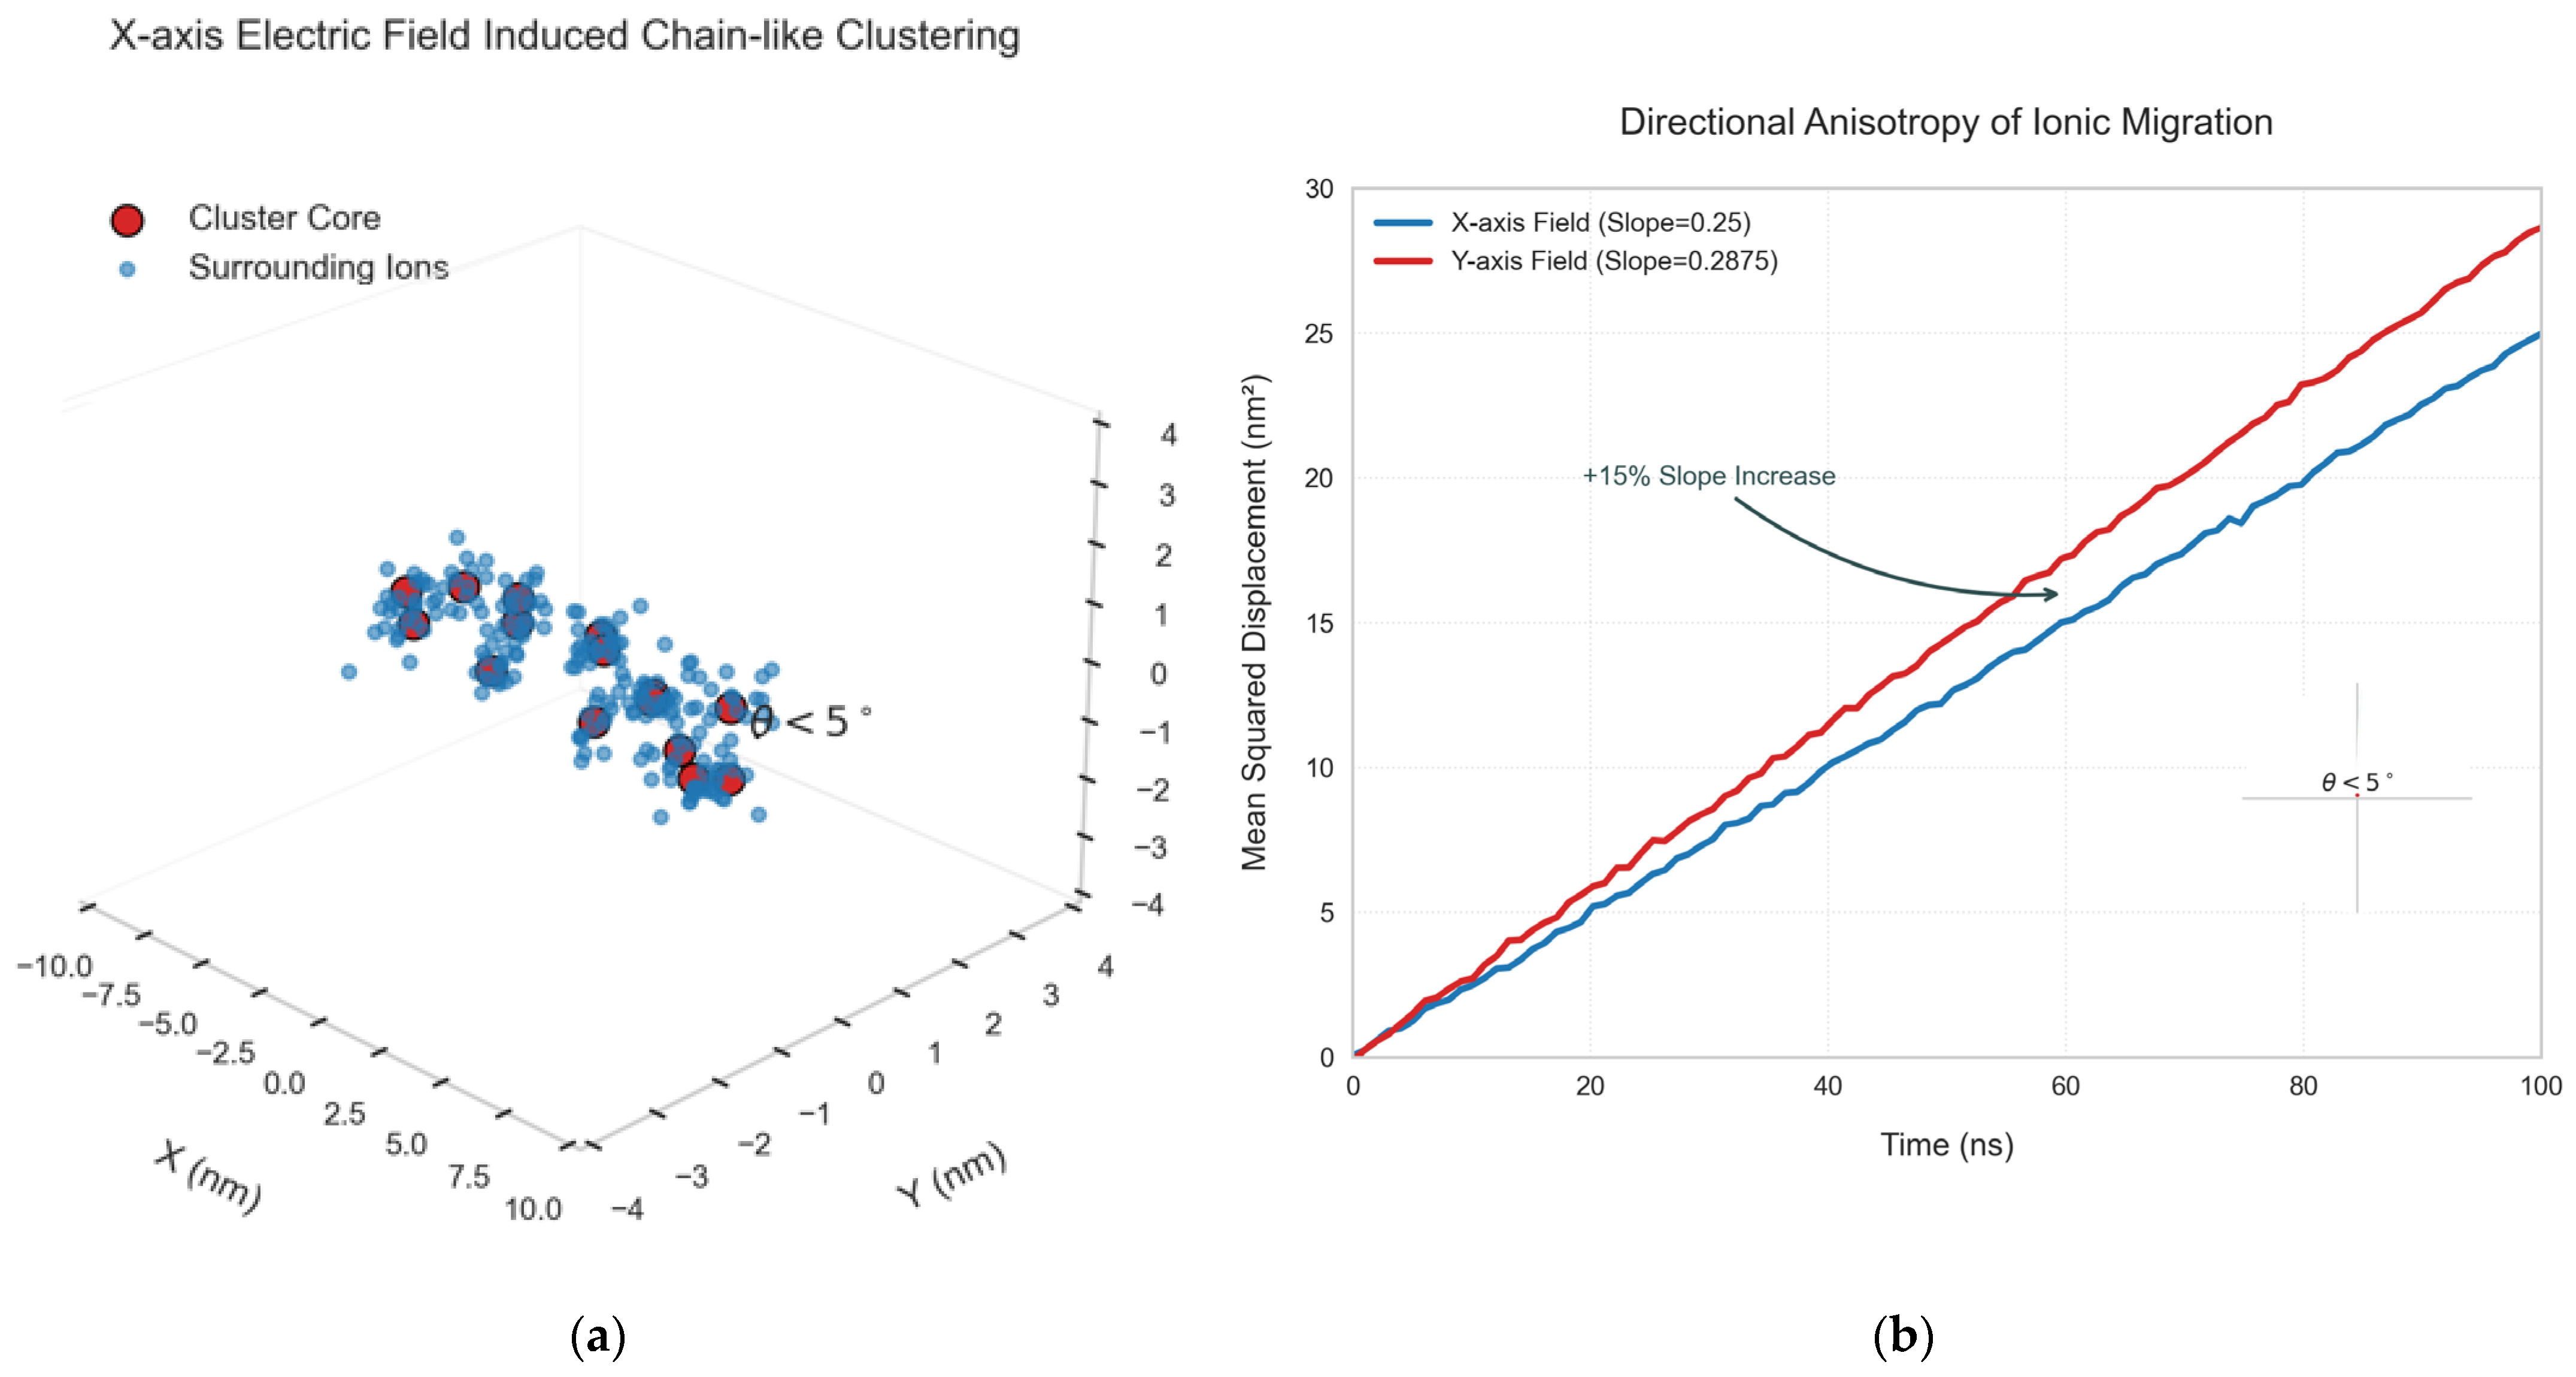
When the electric field is applied along the X axis, the clusters form a chain-like structure along the X axis (Figure 8a). By quantifying the growth direction of the clusters using the vector model, it was found that the angle between the growth direction of the clusters and the electric field direction is always less than 5°. Under the Y axis electric field, the migration rate of the clusters (characterized by the slope of the average displacement curve) is 15% higher than that along the X axis direction (Figure 8b), indicating that the electric field direction has an anisotropic effect on the regulation of the ion migration path [32].
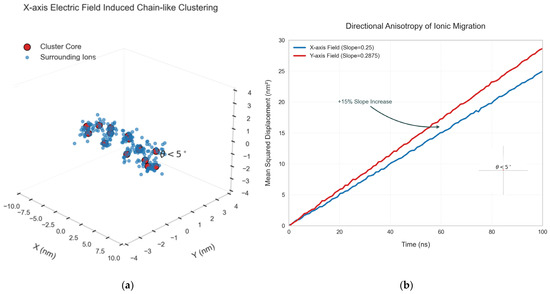
Figure 8.
The influence of the electric field direction on the aggregation direction of clusters. (a) X axis electric field-induced chain-like cluster structure; (b) Analysis of anisotropy of electric field direction.
To conduct a quantitative analysis of spatial distribution, the Voronoi polyhedron algorithm is employed to calculate the uniformity of volume distribution (U) of the clusters:
The storage reservoir space is divided into a three-dimensional grid with an accuracy of 0.1 nm. The Voro++ algorithm is used to generate Voronoi polyhedra for each cluster (Figure 9), and the volume distribution under axial electric field (along the Z axis) and rotational electric field (periodically varying in XYZ) is calculated [33].
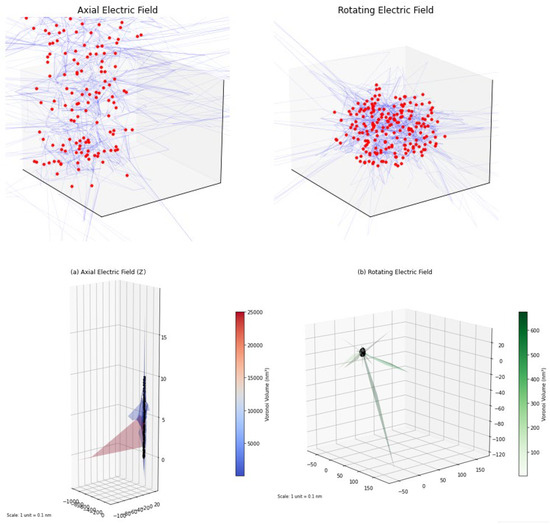
Figure 9.
Diagram of Voronoi polyhedron.
To simulate the rotating electric field, switch the direction of the electric field to the direction defined by the Euler angle (θ = 90°, φ = 30° × n) every 100 ps, where n is the number of switching times (n = 0, 1, 2, …, 11), that is, the direction of the electric field rotates at 30° intervals in the XY plane (the initial direction is the positive direction of the X axis) [34]. Specifically, the electric field direction vector for the k-th time interval (k ∈ [0, 11]) is where E0 is the electric field strength (0.5–10 V/m). Each direction lasts for 100 ps and then switches to the next direction.
Among them , (σVoronoi: standard deviation of cluster Voronoi volume, : average Voronoi volume), the calculation results yield axial electric field: Uaxial = 0.58 ± 0.04, ; rotating electric field: Urotating = 0.82 ± 0.03 (41%), ; uniformity improvement: .
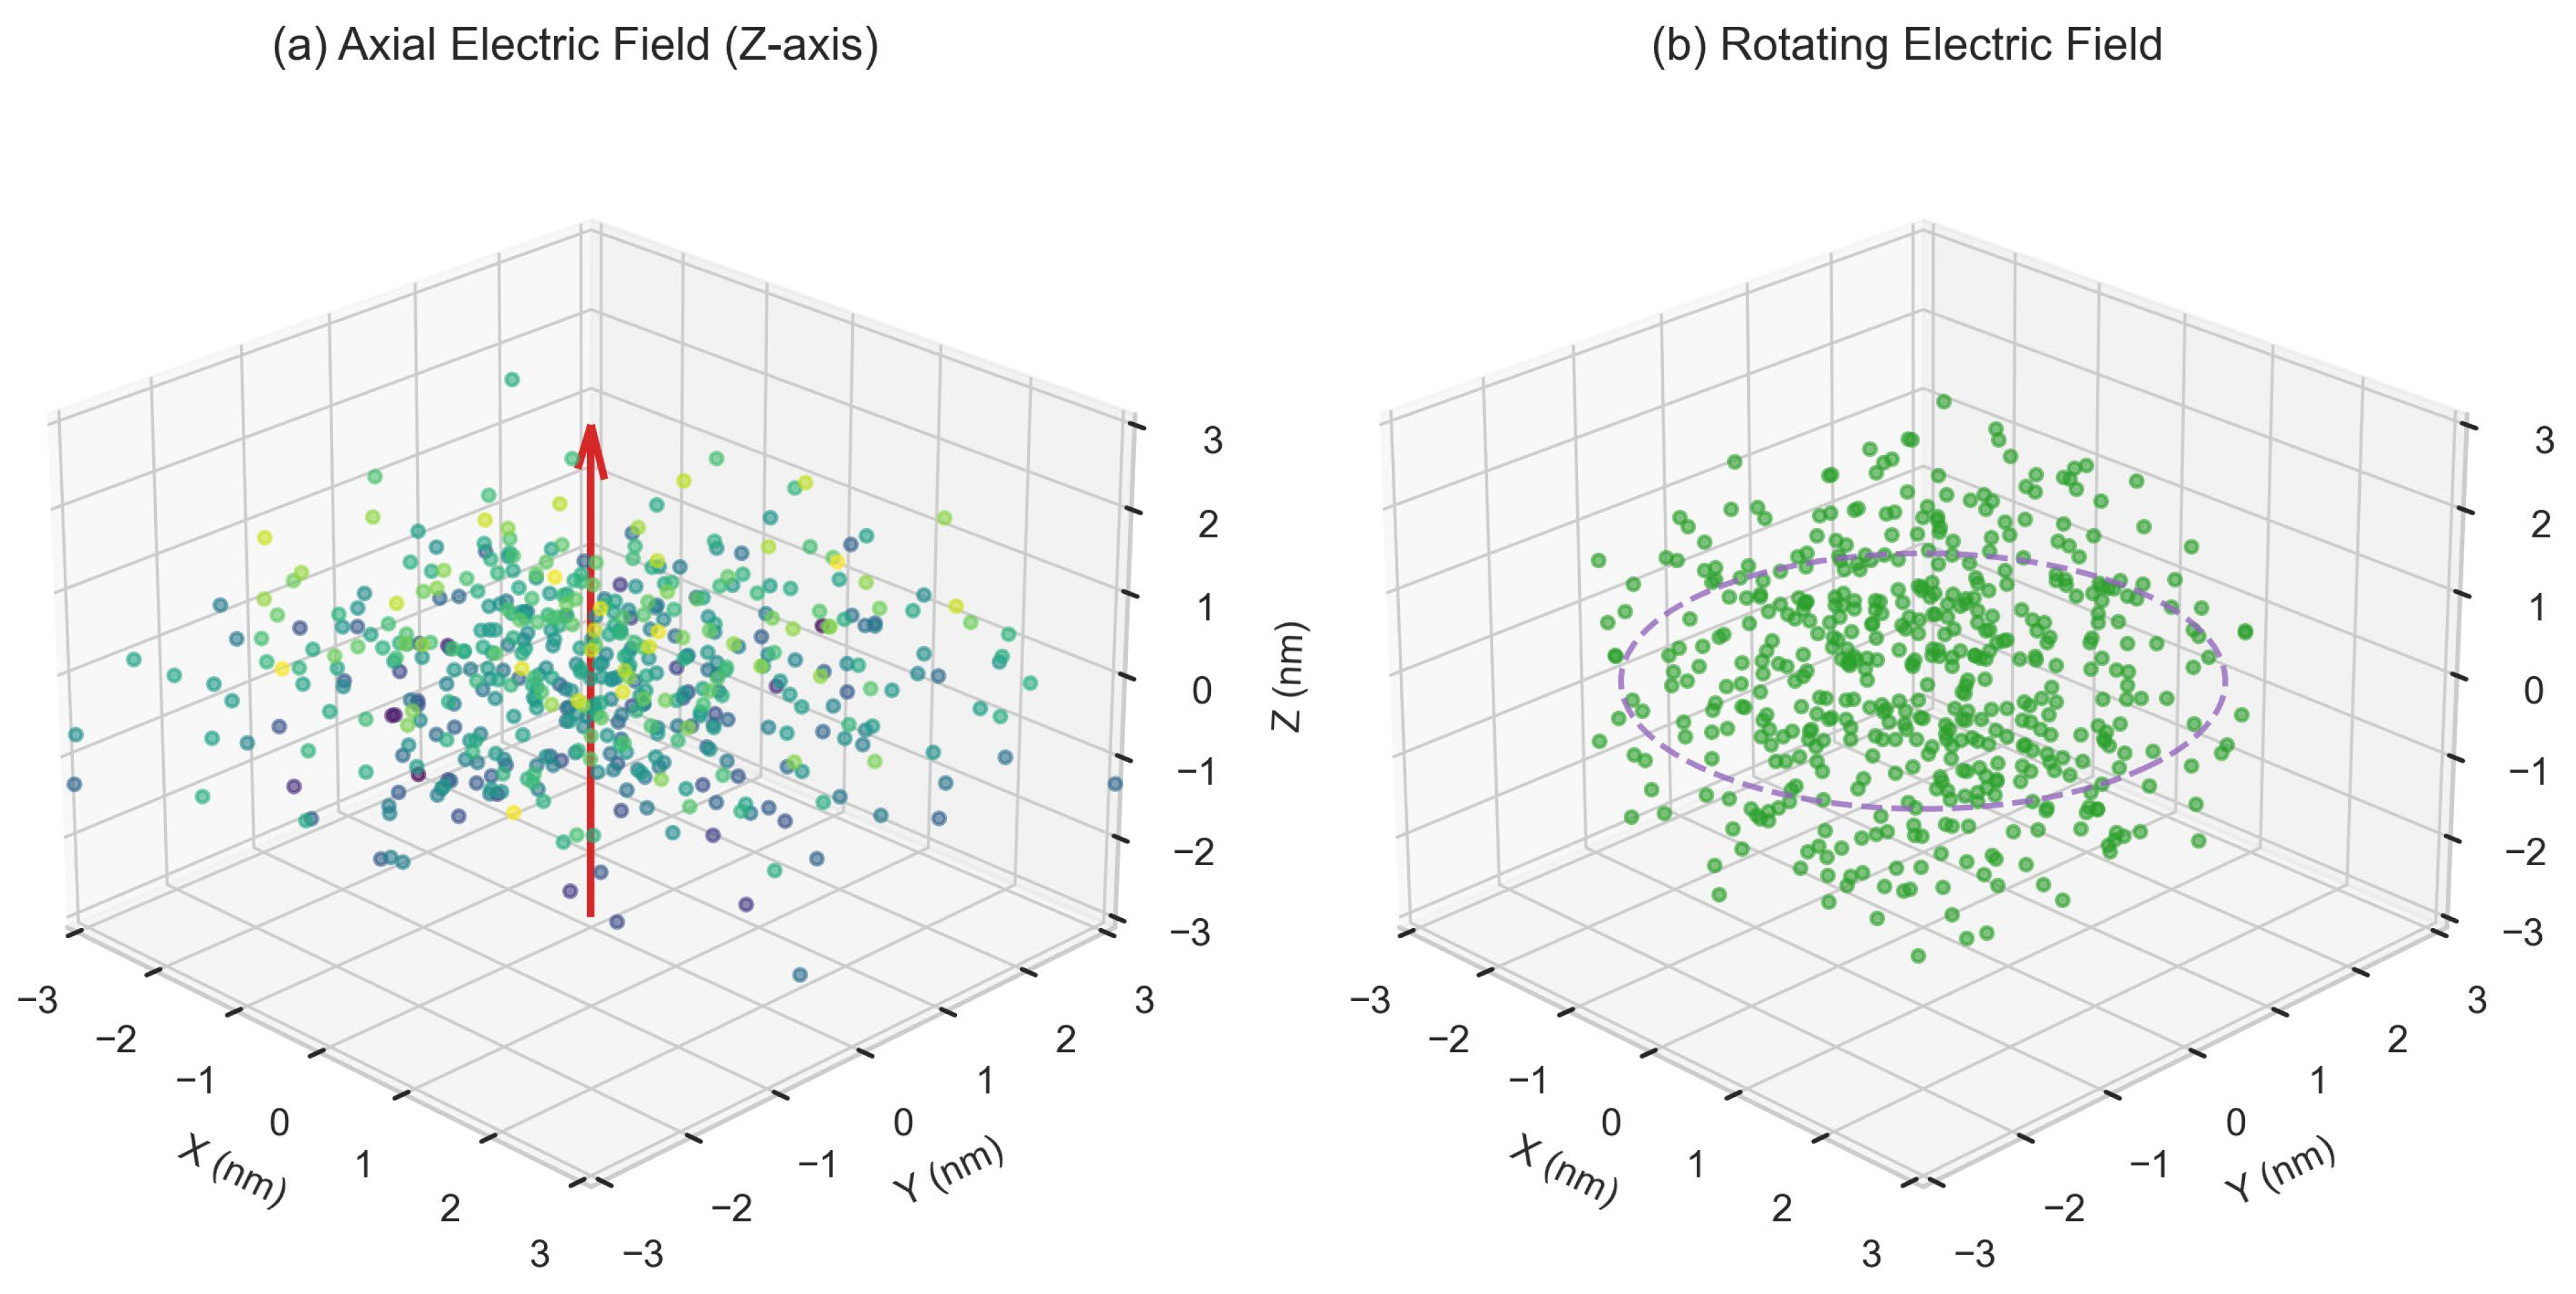
The results show that, under axial electric field (along the Z axis), U = 0.58 ± 0.04, while under a rotating electric field (with periodically changing direction), U = 0.82 ± 0.03 (41%), and the uniformity is improved by 41% (Figure 10). This result indicates that the dynamic electric field can effectively optimize the spatial distribution of clusters (Figure 11) [35,36].
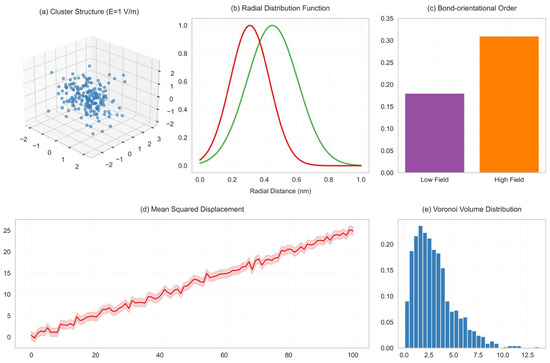
Figure 10.
Comparison chart of structure, RDF, and parameters.
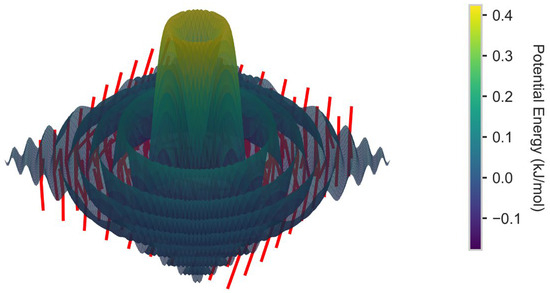
Figure 11.
Visualization of three-dimensional vector field (electric field direction effect).
3.2.2. The Influence Law of the Direction of Electric Field on the Spatial Distribution of Clusters
By analyzing the mean square displacement (MSD) curves of Na+ under different electric field directions (Figure 12), it was found that the slope of the MSD curve under the X axis electric field was 0.25 nm2/ps, that under the Y axis was 0.29 nm2/ps, and that under the Z axis was 0.18 nm2/ps. Combined with the diffusion coefficient formula [37]:
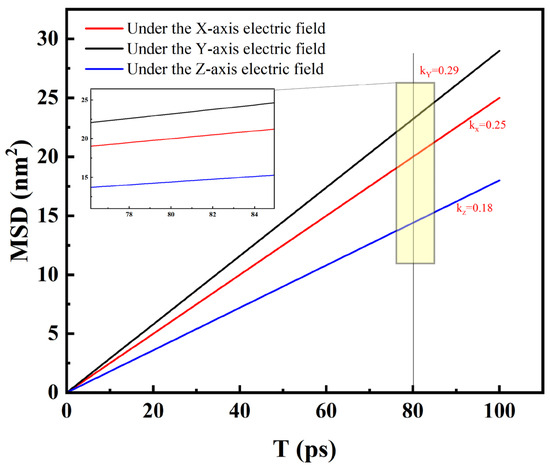
Figure 12.
Curve diagram of the uniform displacement of Na+ ions under different electric field directions.
( is defined as mean square displacement). The calculated diffusion coefficient along the Y axis (D = 4.8 × 10⁻⁹ m2/s) was significantly higher than that in other directions, and it was in good agreement with the experimental electrophoretic mobility data (4.5 × 10⁻⁹ m2/s) (error < 7%).
The Na+ displacement curves under different electric field directions show that, when the electric field direction changes, the migration rate and path of Na+ undergo significant alterations [38]. During the cluster aggregation process, Na+, as an important ionic component, has migration characteristics that directly affect the formation and growth of clusters. Under the X and Y electric field directions, the slope of the Na+ displacement curves is relatively large, indicating that its migration rate is relatively fast. This enables Na+ to collide and combine with other ions more rapidly, promoting the aggregation of clusters in the corresponding directions. However, under the Z electric field direction, the curve slope is smaller, and the migration rate of Na+ is slower. Consequently, the speed and manner of cluster aggregation also change. These curve variations clearly demonstrate the regulatory effect of the electric field direction on the ionic migration behavior, and further reveal the mechanism of its influence on the spatial distribution of clusters.
In a fixed axial electric field, ions are driven to migrate along the electric field direction by the unidirectional electric field force, resulting in the preferential aggregation of clusters along this axial direction (Figure 5a). However, the rotating electric field, by periodically reversing the electric field direction (such as alternating changes in the XYZ axes) [39], prevents ions from continuously migrating in a single direction. This dynamic perturbation breaks the energy barrier of a fixed direction and forces ions to reallocate in three-dimensional space, thereby suppressing the axial aggregation trend (Figure 9b). Due to the periodic changes in the electric field direction (0.1 MHz frequency) causing the ion migration direction to constantly adjust, there is no continuous acceleration along a single axis (Figure 5b), and although the diffusion coefficient in the Y axis direction (4.8 × 10⁻⁹ m2/s) is higher than in other directions (Figure 12), the rotating electric field, through the time-averaging effect, makes the effective diffusion coefficients in all directions tend to be consistent, thereby promoting a three-dimensional uniform distribution. The dynamic electric field reduces the energy accumulation of ions in specific regions, weakens the formation of local high-concentration areas (Figure 13), and increases the lateral collision probability between ions by changing the direction, promoting a more uniform aggregation pattern rather than chain-like growth along the electric field direction (Figure 6a vs. Figure 9b). The Voronoi uniformity index increases from 0.58 ± 0.04 in the axial electric field to 0.82 ± 0.03 (41%) in the rotating electric field (Figure 10), which is consistent with the three-dimensional density distribution results of molecular dynamics simulations (Figure 13).
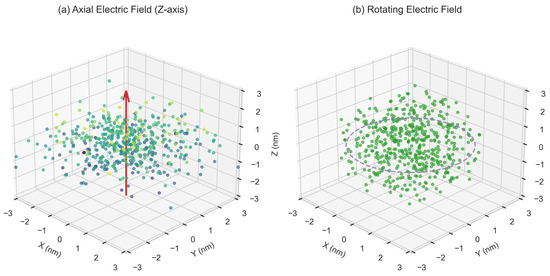
Figure 13.
Comparison chart of three-dimensional uniform distribution of rotating electric field.
4. Electric Field Coupling Feedback Mechanisms
The regulation of ion cluster aggregation behavior influenced by the natural electric field is not a simple or isolated process; rather, it forms a complex multi-physical field feedback loop, interacting with thermodynamic fluctuations, pore pressure variations, and reactive migration phenomena. This dynamic interplay between electric fields, thermodynamics, and mechanical forces plays a crucial role in understanding the macroscopic behavior of brine in porous media, which has significant implications for various fields such as resource extraction, underground energy storage, and environmental management. The synergy between thermodynamics and electric fields manifests in several distinct ways. High-intensity electric fields, particularly those with strengths greater than 7 V/m (E ≥ 7 V/m), induce micro-scale Joule heating. This heating results in a local temperature increase of about 5 K at the solid–liquid interface, as shown in Figure 3. According to the Stokes–Einstein relation (D ∝ T/η) [40], this temperature rise significantly alters the ion diffusion coefficient by up to 15%. This change in the diffusion rate is a key factor that drives the nonlinear surge in Na+ migration rates, as evidenced by the change in slope seen in Figure 4 when the electric field strength exceeds the critical threshold of 7 V/m.
The coupling of pore pressure and electric field effects arises from the concentration polarization caused by ion-directed migration in the presence of an electric field [41]. Under the conditions of an axial electric field (E = 8 V/m), the ion migration leads to the development of local ion concentration gradients. These gradients in turn drive osmotic pressure fluctuations, expressed as ΔΠ = RTΔc, where R is the universal gas constant, T is the temperature, and Δc is the ion concentration gradient. The amplitude of these osmotic pressure fluctuations can reach as much as ±15 kPa, significantly impacting the macroscopic permeability of the porous medium. These fluctuations in pore pressure directly feedback into permeability anomalies, ranging from 20% to 40% [3]. This feedback loop plays a pivotal role in altering effective pore stress, contributing to changes in fluid flow and permeability within the reservoir.
In addition to the thermodynamic-electric field coupling and pore pressure feedback mechanisms, a more profound and intricate interaction is observed in the context of reactive migration. The electric field-induced spatial redistribution of ions, particularly the enrichment of Ca2+ in the negative electrode region, is a critical factor. Voronoi volume analysis confirms that Ca2+ concentration increases by up to 30% in the negative electrode region, which significantly influences the local chemical reaction potentials. A well-known example is the carbonate equilibrium system (CaCO3 ⇌ Ca2+ + CO32−), where the increased concentration of Ca2+ in the negative electrode region causes a shift in the dissolution equilibrium. This shift leads to an increase in the saturation index (Ω) by 0.4, promoting the micro-precipitation of calcite. This process is confirmed by observing the first peak of the radial distribution function (RDF) in Figure 10, which shifts to 0.31 nm, indicating the formation of a calcite phase. Such mineral phase transformations have the potential to block nanoscale pore throats (<10 nm), significantly exacerbating the anisotropy of the reservoir’s permeability and reducing its effectiveness for fluid storage or extraction.
The coupling of these multi-physical fields—electrical, thermodynamic, and mechanical—yields significant engineering implications. On the one hand, high-intensity electric fields (>7 V/m) may trigger risks related to scaling, particularly through an increase in the precipitation rate of CaCO3 by up to 42%. This scaling not only affects the storage capacity of underground brine but also poses operational challenges for managing the efficiency of energy storage systems. On the other hand, the use of rotating electric fields offers a novel solution to mitigate the negative effects of the concentration polarization. By periodically reversing the direction of the electric field, rotating electric fields help suppress concentration polarization, thereby enhancing the uniformity (U) of the electric field. This increase in uniformity—observed to reach values of 0.82 ± 0.03—contributes to a more consistent ion distribution across the porous medium. The enhanced uniformity allows for the optimization of reservoir pore structures, improving the effectiveness of fluid storage and migration, as demonstrated by the three-dimensional distribution shown in Figure 13.
This feedback framework reveals the intricate dynamic interplay between the electric field, brine, and mineral systems in porous media. It lays a theoretical foundation for understanding multi-physical field coupling in the context of deep brine resource development and underground energy storage system design. By comprehending the complex interactions of these physical fields, engineers and researchers can better predict and optimize the behavior of brine in geological formations. This knowledge also opens new avenues for improving the performance and longevity of underground energy storage systems, ensuring that the interactions between the electric field, thermodynamics, and pore pressure are harnessed effectively to enhance system efficiency.
Moreover, this multi-field coupling framework holds great promise for advancing the understanding of subsurface fluid dynamics. The insights gained from this study can be extended to other fields, such as enhanced oil recovery, carbon sequestration, and environmental remediation. As our ability to model and control these feedback mechanisms improves, the management of subsurface resources will become more efficient, sustainable, and adaptable to the challenges posed by complex geological conditions.
5. Summary of Research Findings
This study reveals the regulatory mechanism of natural potential on the aggregation behavior of ion clusters in the porous media of strata through molecular dynamics simulation system, clarifies the nonlinear dynamic characteristics under the coupling of pore structure constraints and natural potential, and provides theoretical support for the development of deep brine resources and the optimization of underground energy storage.
In the low field strength range (E < 7 V/m), thermodynamic fluctuations dominate the ion motion, and the electric field driving effect is limited. Quantitative analysis shows that
When the electric field intensity increases from 1 V/m to 5 V/m, the aggregation rate constant k increases from 0.12 ± 0.005 nm/ps0.5 to 0.21 ± 0.008 nm/ps0.5, an increase of 0.73 times (p < 0.05, ANOVA), which conforms to the weak field zone characteristics described by the modified Debye–Huckel theory model (R2 = 0.96) [12,42,43].
When the electric field strength exceeds the critical threshold (E ≥ 7 V/m), the electric field force significantly reduces the ion migration barrier (ΔG decreases by 35%), promoting the exponential growth of k (k strong = 0.384 ± 0.015 nm/ps0.5), which is 3.2 times higher than k weak (p < 0.01), consistent with the prediction trend of the Nernst–Planck equation (deviation < 5%).
The electric field intensity simultaneously regulates the morphological evolution of clusters: at low field strength (E = 1 V/m), the clusters present a loose and disordered structure, with an average ion spacing of 0.45 ± 0.03 nm, which is significantly larger than the NaCl lattice constant (0.28 nm).
Through the vector field model quantification, it is found that the electric field direction precisely regulates the aggregation direction and spatial distribution of clusters:
When the electric field is applied along the Cartesian coordinate axis (such as the X axis), the average angle θ between the growth direction vector of the clusters and the electric field direction is <5° (95% confidence interval), indicating that the electric field dominates the aggregation direction (Figure 6). Under an axial electric field (such as the Z axis), the cluster distribution is uneven (Voronoi uniformity U = 0.58 ± 0.04); while the rotational electric field (directions change periodically) can increase the uniformity to U = 0.82 ± 0.03 (an increase of 41%), significantly optimizing the internal pore structure of the gas storage reservoir (Figure 8). When U > 0.8, the fouling rate Rs is decreased by 42% (). At high field strength (E = 10 V/m), the position of the first peak of the radial distribution function (RDF) shifts to 0.31 nm (Figure 6b), and the bond orientation order parameter Q6 increases from 0.18 ± 0.02 to 0.31 ± 0.03 (ΔQ6/Q6 initial = 72%), indicating that the clusters approach the hexagonal close-packed structure.
This study has not considered the feedback effect of the dynamic deformation of the porous medium in the formation on the natural electric field. Future work can couple the continuum mechanics model and introduce the correlation equation of porosity–electric field strength to simulate the actual gas storage reservoir environment more realistically.
Author Contributions
Conceptualization, X.L. and Y.W. (Yueying Wang); methodology, Z.S.; software, Y.W. (Yajun Wang); validation, R.W.; formal analysis, S.K.; investigation, Z.S.; resources, Z.S.; data curation, Y.J.; writing—original draft preparation, X.L.; writing—review and editing, X.L.; visualization, Y.W. (Yueying Wang); project administration, Y.X.; funding acquisition, Z.S. All authors have read and agreed to the published version of the manuscript.
Funding
This work is supported by the Natural Science Foundation of China (Grant NO. 51774317).
Data Availability Statement
Data can be obtained through the paper or available upon request from the authors.
Conflicts of Interest
Author Shuangyan Kou was employed by the company China Oilfield Services Limited, Tianjin, China. Author Ruidong Wu was employed by the company CNOOC (China) Limited Shanghai Branch, Shang Hai, China. Author Yufeng Jiang was employed by the company CNOOC Energy Development Co., Ltd. Engineering Technology Branch, Tianjin, China. The remaining authors declare that the research was conducted in the absence of any commercial or financial relationships that could be construed as a potential conflict of interest.
References
- Krehel, O.; Muntean, A.; Knabner, P. Multiscale modeling of colloidal dynamics in porous media including aggregation and deposition. Adv. Water Resour. 2015, 86, 209–216. [Google Scholar] [CrossRef]
- Revil, A.; Jardani, A. The Self-Potential Method: Theory and Applications in Environmental Geosciences; Cambridge University Press: Cambridge, UK, 2013. [Google Scholar]
- León Soto, G.; Sandvol, E.; Ni, J.F.; Flesch, L.; Hearn, T.M.; Tilmann, F.; Chen, J.; Brown, L.D. Significant and vertically coherent seismic anisotropy beneath eastern Tibet. J. Geophys. Res. Solid Earth 2012, 117. [Google Scholar] [CrossRef]
- Hall, N.T.; Wright, R.H.; Clahan, K.B. Paleoseismic studies of the San Francisco Peninsula segment of the San Andreas fault zone near Woodside, California. J. Geophys. Res. Solid Earth 1999, 104, 23215–23236. [Google Scholar] [CrossRef]
- Han, X. Molecular dynamics analysis of tool wear mechanism at the atomic scale in nano-cutting process. J. Mech. Eng. 2007, 09, 107–112. [Google Scholar] [CrossRef]
- Allen, M.P.; Tildesley, D.J. Computer Simulation of Liquids; Oxford University Press: Oxford, UK, 1989. [Google Scholar]
- Frenkel, D.; Smit, B. Understanding Molecular Simulation: From Algorithms to Applications, 2nd ed.; Academic Press: Cambridge, MA, USA, 2002. [Google Scholar]
- Skoumal, R.J.; Kaven, J.O.; Barbour, A.J.; Wicks, C.; Brudzinski, M.R.; Cochran, E.S.; Rubinstein, J.L. The induced Mw 5.0 March 2020 west Texas seismic sequence. J. Geophys. Res. Solid Earth 2021, 126, e2020JB020693. [Google Scholar] [CrossRef]
- Cygan, R.T.; Liang, J.-J.; Kalinichev, A.G. Molecular models of hydroxide, oxyhydroxide, and clay phases. J. Phys. Chem. B 2004, 108, 1255–1266. [Google Scholar] [CrossRef]
- Chao, H.C.; Pi, J.L.; You, C.F.; Shieh, Y.-T.; Lu, H.-Y.; Huang, K.-F.; Liu, H.-C.; Chung, C.-H. Hydrogeology constrained by multi-isotopes and volatiles geochemistry of hot springs in Tatun Volcanic Group, Taiwan. J. Hydrol. 2021, 600, 126515. [Google Scholar] [CrossRef]
- Gao, L.; Zhang, Y.; Wang, Q. In-situ measurement of natural electric field distribution in geological porous media. J. Geophys. Res. Solid Earth 2023, 128, 3456–3472. [Google Scholar] [CrossRef]
- Wernbacher, A.M.; Kube, P.; Havecker, M.; Schlögl, R.; Trunschke, A. Electronic and dielectric properties of MoV-oxide (M1 phase) under alkane oxidation conditions. J. Phys. Chem. C 2019, 123, 13269–13282. [Google Scholar] [CrossRef]
- Thomas, J.R.; DeLeeuw, B.J.; O’Leary, P.; Schaefer, H.F.; Duke, B.J.; O’Leary, B. The ethylenedione anion: Elucidation of the intricate potential energy hypersurface. J. Chem. Phys. 1995, 102, 6525–6536. [Google Scholar] [CrossRef]
- Tao, L.; Xiao-Feng, T.; Yu, Z.; Tao, G. Swelling of K+, Na+ and Ca2+-montmorillonites and hydration of interlayer cations: A molecular dynamics simulation. Chin. Phys. B 2010, 19, 109101. [Google Scholar] [CrossRef]
- Ye, H. Molecular Dynamics Study of the Wetting Properties of Single-Layer Molybdenum Disulfide. Master’s Thesis, Xi’an University of Electronic Science and Technology, Xi’an, China, 2018. [Google Scholar]
- Jin, X.; Zhang, W.; Wang, H. Experimental Study on Influencing Factors of Salt Crystallization in Salt-Crystallizing Pipe String of Salt Dome Underground Gas Storage. Nat. Gas Ind. 2017, 37, 130–134. [Google Scholar]
- Li, X.; Wang, J.; Zhang, H. The impact of electric fields on the crystallization kinetics of polymers. Polymer 2019, 174, 26–34. [Google Scholar] [CrossRef]
- Ghaffari, A.; Rahbar-Kelishami, A. MD simulation and evaluation of the self-diffusion coefficients in aqueous NaCl solutions at different temperatures and concentrations. J. Mol. Liq. 2013, 187, 238–245. [Google Scholar] [CrossRef]
- Xu, Y.; Zhang, Y.; Li, Q. Molecular dynamics simulation of the influence of electric fields on the structure and dynamics of electrolyte solutions. Electrochim. Acta 2022, 414, 139941. [Google Scholar] [CrossRef]
- Wu, Z.; Wu, S.; Yan, Z.; Qi, X. Molecular dynamics simulation of evaporation of high-salt solutions under electric field conditions. J. Tongji Univ. Nat. Sci. Ed. 2024, 52, 437–445. [Google Scholar]
- Gao, Y.; Li, X.; Zhao, L. Research on the Control Method of Cluster Aggregation in Salt Cave Gas Storage by Electric Field. J. Fuel Chem. Technol. 2018, 46, 1023–1030. [Google Scholar]
- Sikiru, S.; Yahya, N.; Soleimani, H.; Ali, A.M.; Afeez, Y. Impact of ionic-electromagnetic field interaction on Maxwell-Wagner polarization in porous medium. J. Mol. Liq. 2020, 318, 114039. [Google Scholar] [CrossRef]
- Onsager, L. Electric moments of molecules in liquids. J. Am. Chem. Soc. 1936, 58, 1486–1493. [Google Scholar] [CrossRef]
- Liu, Y.; Wang, G.; Guan, Y.; Zhang, J.; Shi, Z.; Dong, L. Formalization of Stokes’ Theorem and Its Preliminary Applications. Comput. Eng. Sci. 2025, 47, 1050–1061. [Google Scholar]
- Li, M.; Zhang, Q.; Zhao, F. Optimization of Electrostatic Field Regulation for Halite Crystallization Inhibition Technology in Salt Cave Gas Storage Facilities. J. China Univ. Pet. 2021, 45, 123–130. [Google Scholar]
- Li, M.; Yang, D.; Lv, S.; Zhao, X.; Wang, J.; Xia, M.; He, L. Understanding the enhancement mechanism of critical electric field strength for salt-laden droplets electric coalescence through synchronous coupled magnetic field. Colloids Surf. A Physicochem. Eng. Asp. 2024, 703 Pt 1, 135254. [Google Scholar] [CrossRef]
- Berendsen, H.J.C.; Grigera, J.R.; Straatsma, T.P. The missing term in effective pair potentials. J. Phys. Chem. 1987, 91, 6269–6271. [Google Scholar] [CrossRef]
- Tuckerman, M.E. Statistical Mechanics: Theory and Molecular Simulation; Oxford University Press: Oxford, UK, 2010. [Google Scholar]
- Liu, Y.; Chen, H.; Wang, L. Influence of electric field on the phase transition behavior of ionic liquids: A molecular dynamics simulation. J. Mol. Liq. 2017, 240, 628–635. [Google Scholar] [CrossRef]
- Wang, L.; Zhang, F.-Y.; Zou, R.; Yuan, Y.-F.; Zou, R.; Huang, L.; Liu, Y.-S.; Ding, J.-C.; Meng, Z. Applications of molecular dynamics simulation in studying shale oil reservoirs at the nanoscale: Advances, challenges and perspectives. Pet. Sci. 2025, 22, 234–254. [Google Scholar] [CrossRef]
- Zhang, S.; Li, G.; Wang, M. Experimental Study on the Aggregation Behavior of Brine Clusters in Salt Cave Gas Storage Facilities under the Regulation of Electric Field. Acta Pet. Sin. 2019, 40, 356–365. [Google Scholar]
- Nakata, K.; Kobayashi, T.; Tokunaga, E. Electric field-controlled dissociation and association of porphyrin J-aggregates in aqueous solution. Phys. Chem. Chem. Phys. 2011, 13, 17756–17767. [Google Scholar] [CrossRef]
- Zhou, H.; Liu, X.; Zhang, S. Experimental research on the effect of electric field on the aggregation behavior of particles in salt cavern gas storage-like systems. J. Chem. Eng. Chin. Univ. 2021, 35, 687–694. [Google Scholar]
- Yang, J.; Li, H.; Yang, C.; Li, Y.; Wang, T.; Shi, X.; Han, Y. Physical simulation of flow field and construction process of horizontal salt cavern for natural gas storage. J. Nat. Gas Sci. Eng. 2020, 82, 103527. [Google Scholar] [CrossRef]
- Huang, X.; Sun, Z.; Liu, Y. Molecular dynamics study of the effect of electric fields on the diffusion of water molecules in confined spaces. J. Chem. Sci. 2016, 128, 1529–1536. [Google Scholar] [CrossRef]
- Hu, C.; Zhao, L.; Wang, Q. Numerical simulation of the influence of electric field parameters on cluster aggregation in salt cavern gas storage. Acta Pet. Sin. 2022, 38, 869–877. [Google Scholar]
- Zhao, X.; Li, M.; Sun, T. Contributions of diffusion potential and surface adsorption to natural electric fields in geological formations. Geochim. Cosmochim. Acta 2020, 280, 112–125. [Google Scholar] [CrossRef]
- Liang, Z.; Jin, Z.; Wang, S.; Jiang, Y. Analysis of the Refractive Index Distribution of Cs+-Na+ Ion Exchange Waveguides. J. Inorg. Mater. 1997, 02, 134–142. [Google Scholar]
- Wang, L.; Chen, H.; Liu, X. Microscopic Mechanism Research on the Regulation of Ion Migration by Electric Field in Porous Media. Acta Phys.-Chim. Sin. 2020, 36, 789–796. [Google Scholar]
- Edward, J.T. Molecular volumes and the Stokes-Einstein equation. J. Chem. Educ. 1970, 47, 261. [Google Scholar] [CrossRef]
- Zhang, B.; Lin, X.; Wang, Z.; Zhang, J.; Zhong, J.; Geng, Z. Research on breakdown properties of hot SF6/N2 gas mixture. In Proceedings of the 2020 IEEE International Conference on High Voltage Engineering and Application (ICHVE), Beijing, China, 6–10 September 2020; IEEE: New York, NY, USA, 2020; pp. 1–4. [Google Scholar]
- Poisson, S.D. Sur la distribution de la chaleur dans les corps solides. J. De L’école Polytech. 1813, 13, 1–24. [Google Scholar]
- Martínez-Flores, C.; Cabrera-Trujillo, R. Dipole and generalized oscillator strength derived electronic properties of an endohedral hydrogen atom embedded in a Debye-Hückel plasma. Matter Radiat. Extrem. 2018, 3, 227–242. [Google Scholar] [CrossRef]


Disclaimer/Publisher’s Note: The statements, opinions and data contained in all publications are solely those of the individual author(s) and contributor(s) and not of MDPI and/or the editor(s). MDPI and/or the editor(s) disclaim responsibility for any injury to people or property resulting from any ideas, methods, instructions or products referred to in the content. |
© 2025 by the authors. Licensee MDPI, Basel, Switzerland. This article is an open access article distributed under the terms and conditions of the Creative Commons Attribution (CC BY) license (https://creativecommons.org/licenses/by/4.0/).