Article

Enhancing Methanogenic Efficiency in Dry Anaerobic Digestion of Kitchen Waste Through Optimization of Total Solids Content

1
School of Environment and Energy Engineering, Beijing University of Civil Engineering and Architecture, Beijing 100044, China
2
Technical Institute of Physics and Chemistry (TIPC), Chinese Academy of Sciences (CAS), Beijing 100190, China
3
Beijing Engineering Research Center of Sustainable Urban Sewage System Construction and Risk Control, Beijing University of Civil Engineering and Architecture, Beijing 100044, China
*
Authors to whom correspondence should be addressed.
These authors contributed equally to this work.
Processes 2025, 13(8), 2332; https://doi.org/10.3390/pr13082332
Submission received: 16 May 2025 / Revised: 9 June 2025 / Accepted: 10 June 2025 / Published: 23 July 2025
(This article belongs to the Section Environmental and Green Processes)

Abstract

The urbanization-driven surge in kitchen waste necessitates optimized dry anaerobic digestion (DAD; total solids > 15%). Despite its valorization potential, this technology requires efficiency improvements due to mass transfer constraints. This study evaluated TS effects (15%, 20%, or 25%) on methane production. The TS = 20% system achieved peak cumulative methane yield (405.73 ± 11.71 mL/gVS), exceeding TS = 15% (348.09 ± 12.19 mL/gVS) and TS = 25% (293.08 ± 3.55 mL/gVS). This optimization was attributable to synergistic maintenance of metabolic equilibrium through autonomous pH recovery, rapid VFAs degradation, and enhanced TAN tolerance. Conversely, TS = 25% exhibited impaired mass transfer efficiency under high solids, causing VFAs accumulation, ammonia toxicity, and progressive pH decline to 7.5, indicating system destabilization. Organic degradation analysis confirmed superior conversion efficiency in TS = 20% through dynamic SPS–SPN equilibrium. Microbial analysis revealed enhanced metabolic efficiency via synergistic interactions between acetoclastic and hydrogenotrophic methanogens in TS = 20%. This research provides technical parameters for optimizing methane production in kitchen waste DAD systems.

1. Introduction

Global population growth and accelerated urbanization have led to a substantial increase in municipal solid waste (MSW) generation, with kitchen waste accounting for 37–62% of the total MSW [1]. It is projected that global kitchen waste production will reach 2.2 billion tons by 2025 [2]. As the most populous nation, China faces significant challenges in managing rapidly escalating kitchen waste volumes, necessitating enhanced resource recovery efficiency [3]. Kitchen waste primarily consists of biodegradable materials, including vegetable residues, fruit peels, meat, and dairy products [4]. Its high organic content (volatile solids to total solids ratio, VS/TS > 80%) positions it as a critical target for urban organic waste valorization. However, improper disposal not only results in resource loss but also poses environmental contamination risks and public health threats [5,6]. Current mainstream treatment technologies—landfilling, composting, and incineration—exhibit inherent limitations [7]. For instance, landfilling occupies extensive land resources and generates persistent landfill leachate, causing groundwater and soil pollution [8]. Composting often suffers from incomplete organic degradation or low efficiency, leading to insufficient product maturity and compromised quality [9]. Additionally, the high moisture content and low calorific value of kitchen waste complicate incineration processes, which may emit dioxins and exacerbate air pollution [10].
Anaerobic digestion serves as a widely implemented technology for resource and energy recovery from organic solid wastes, leveraging microbial catalysis to decompose organic matter under anoxic conditions and generate renewable biogas [11]. Dry anaerobic digestion (total solids, TS > 15%) demonstrates superior efficacy over conventional wet processes (TS < 8%) in kitchen waste treatment, offering significant advantages including higher organic loading capacity, reduced reactor volume, enhanced specific biogas yield, and improved digestate reduction rates, aligning with sustainable technology development paradigms [12]. Despite its elevated methanogenic potential, maintaining process stability under high organic loads presents persistent engineering challenges. Increasing TS intensifies substrate diffusion limitations, impeding charge transfer and microbial–nutrient interactions while complicating process initiation and control [13]. Non-uniform solid aggregation exacerbates solid–liquid mass transfer resistance, promoting localized toxicity accumulation where rapid volatile fatty acids (VFAs) buildup triggers acidification inhibition [14]. Concurrently, elevated viscosity at high TS substantially increases mechanical agitation energy consumption (25–40%) [15] and induces operational complications, including clogging and equipment abrasion during continuous feeding. Although digestate recirculation mitigates acidification risks by suppressing ammonia and VFAs accumulation, excessive recycling risks nutrient depletion that compromises methanogenesis [16,17]. Consequently, TS represents a critical operational parameter governing biocatalytic thresholds, where stable system performance necessitates dynamic equilibrium among organic substrate availability, microbial biomass, acid–base balance, and sustained buffering capacity [18].
Current research predominantly documents mass transfer constraints, acid inhibition, and energy penalties at elevated TS, yet lacks quantitative analysis of system stability thresholds across TS gradients and comprehensive understanding of microbial metabolic adaptation. This study therefore establishes a multidimensional analytical framework through a multi-gradient TS experimental matrix (15%, 20%, or 25%), systematically evaluating methanogenic performance, system stability indicators including pH, total ammonia nitrogen (TAN), VFAs, organic degradation markers including soluble chemical oxygen demand (SCOD), soluble polysaccharides (SPS), soluble protein nitrogen (SPN), and microbial succession dynamics under controlled substrate equilibrium. By determining the optimal TS for stable operation and elucidating functional mechanisms linking microbial consortia to methane production, this work advances the field from empirical operation toward theoretically driven precision design. The integrated approach establishes scientific foundations for scaling ultra-high TS digestion technology while addressing the core engineering challenge of achieving self-balancing systems through optimized TS control without external intervention.

2. Materials and Methods

2.1. Substrate and Inoculum

The kitchen waste used in the experiment comprised 43% steamed bread, 14% bean curd, 23% vegetables, and 20% edible oil (mass fraction), based on the optimized ratio of material organic matter in the study of Song et al. [18] and the low lipid content characteristics of actual kitchen waste. The aforementioned waste was homogenized into a slurry phase (mean particle size < 2 mm) using a comminution device to reduce substrate particle dimensions and enhance homogeneity. Post-processing, the kitchen waste was stored at 4 °C under refrigerated conditions for subsequent utilization. The inoculum was taken from the anaerobic digestion tank of a comprehensive treatment plant in Beijing and was centrifuged at 4000 r/min for 15 min, the supernatant was discarded, and the remaining solid portion was used as the inoculum in this experiment. The basic physical and chemical characteristics of the inoculum and substrate are shown in Table 1.

2.2. Experimental Program

Three sets of experiments were set up with TS of 15%, 20%, or 25% and each set of experiments was conducted in triplicate. Batch anaerobic tests were performed using an AMPTS II instrument (Bioprocess Co., Ltd., Lund, Sweden) with automatic recording of methane gas production. The inoculum–substrate mixture was reacted in 600 mL glass vials with an effective working volume of 400 mL, with an initial inoculum-to-substrate ratio (ISR) of 2:1, using mesophilic anaerobic fermentation at 37 °C. The TS of the mixture was adjusted by the addition of deionized water prior to bottling, and each glass vial was flushed top-empty with nitrogen for 3 min prior to initiation to ensure anaerobic status, and then quickly sealed. The incubation was carried out in a water bath at 37 ± 0.2 °C, using intermittent stirring for about 30 r each time; fermentation sampling was performed using syringe negative pressure sampling (using a thicker caliber of glass tubing with rubber tubing to connect the syringe). If the pH dropped below 7.0 during the experiment, 1 mol NaHCO3 solution was used to adjust the pH to about 7.5.

2.3. Analytical Methods

TS, VS, pH and TAN, as well as polysaccharides and proteins, were determined according to standard methods [19]. The inoculated sludge was centrifuged at 8000 rpm for 10 min and then the supernatant was filtered through a 0.45 μm membrane. The filtrate was used for the analysis of VFAs, TAN, polysaccharides, and proteins. A gas chromatograph (Shimazu GC 2014, Kyoto, Japan) equipped with a flame ionization detector and a DB-FFAP capillary column (30 m × 0.32 mm × 0.25 μm) was used to analyze the VFAs, with a syringe temperature of 220 °C and a detector temperature of 250 °C. A DR2800 spectrophotometer (HACH Co., Ltd., Loveland, CO, USA) was used to determine SCOD.

2.4. Microbial Analysis

Solid-phase samples (5 mL) were collected from the anaerobic digestion systems on days 0, 5, 12, 25, and 40 of the operational phases. All specimens were immediately flash-frozen in liquid nitrogen and stored at −80 °C in ultra-low temperature freezers prior to analysis. DNA extraction was performed by Majorbio Bio-pharm Technology Co., Ltd. (Shanghai, China). following the manufacturer’s standardized protocols. Subsequent 16S rRNA gene sequencing analysis was performed using the Illumina NovaSeq (Illumina Inc., San Diego, CA, USA) platform [20].

3. Results and Discussion

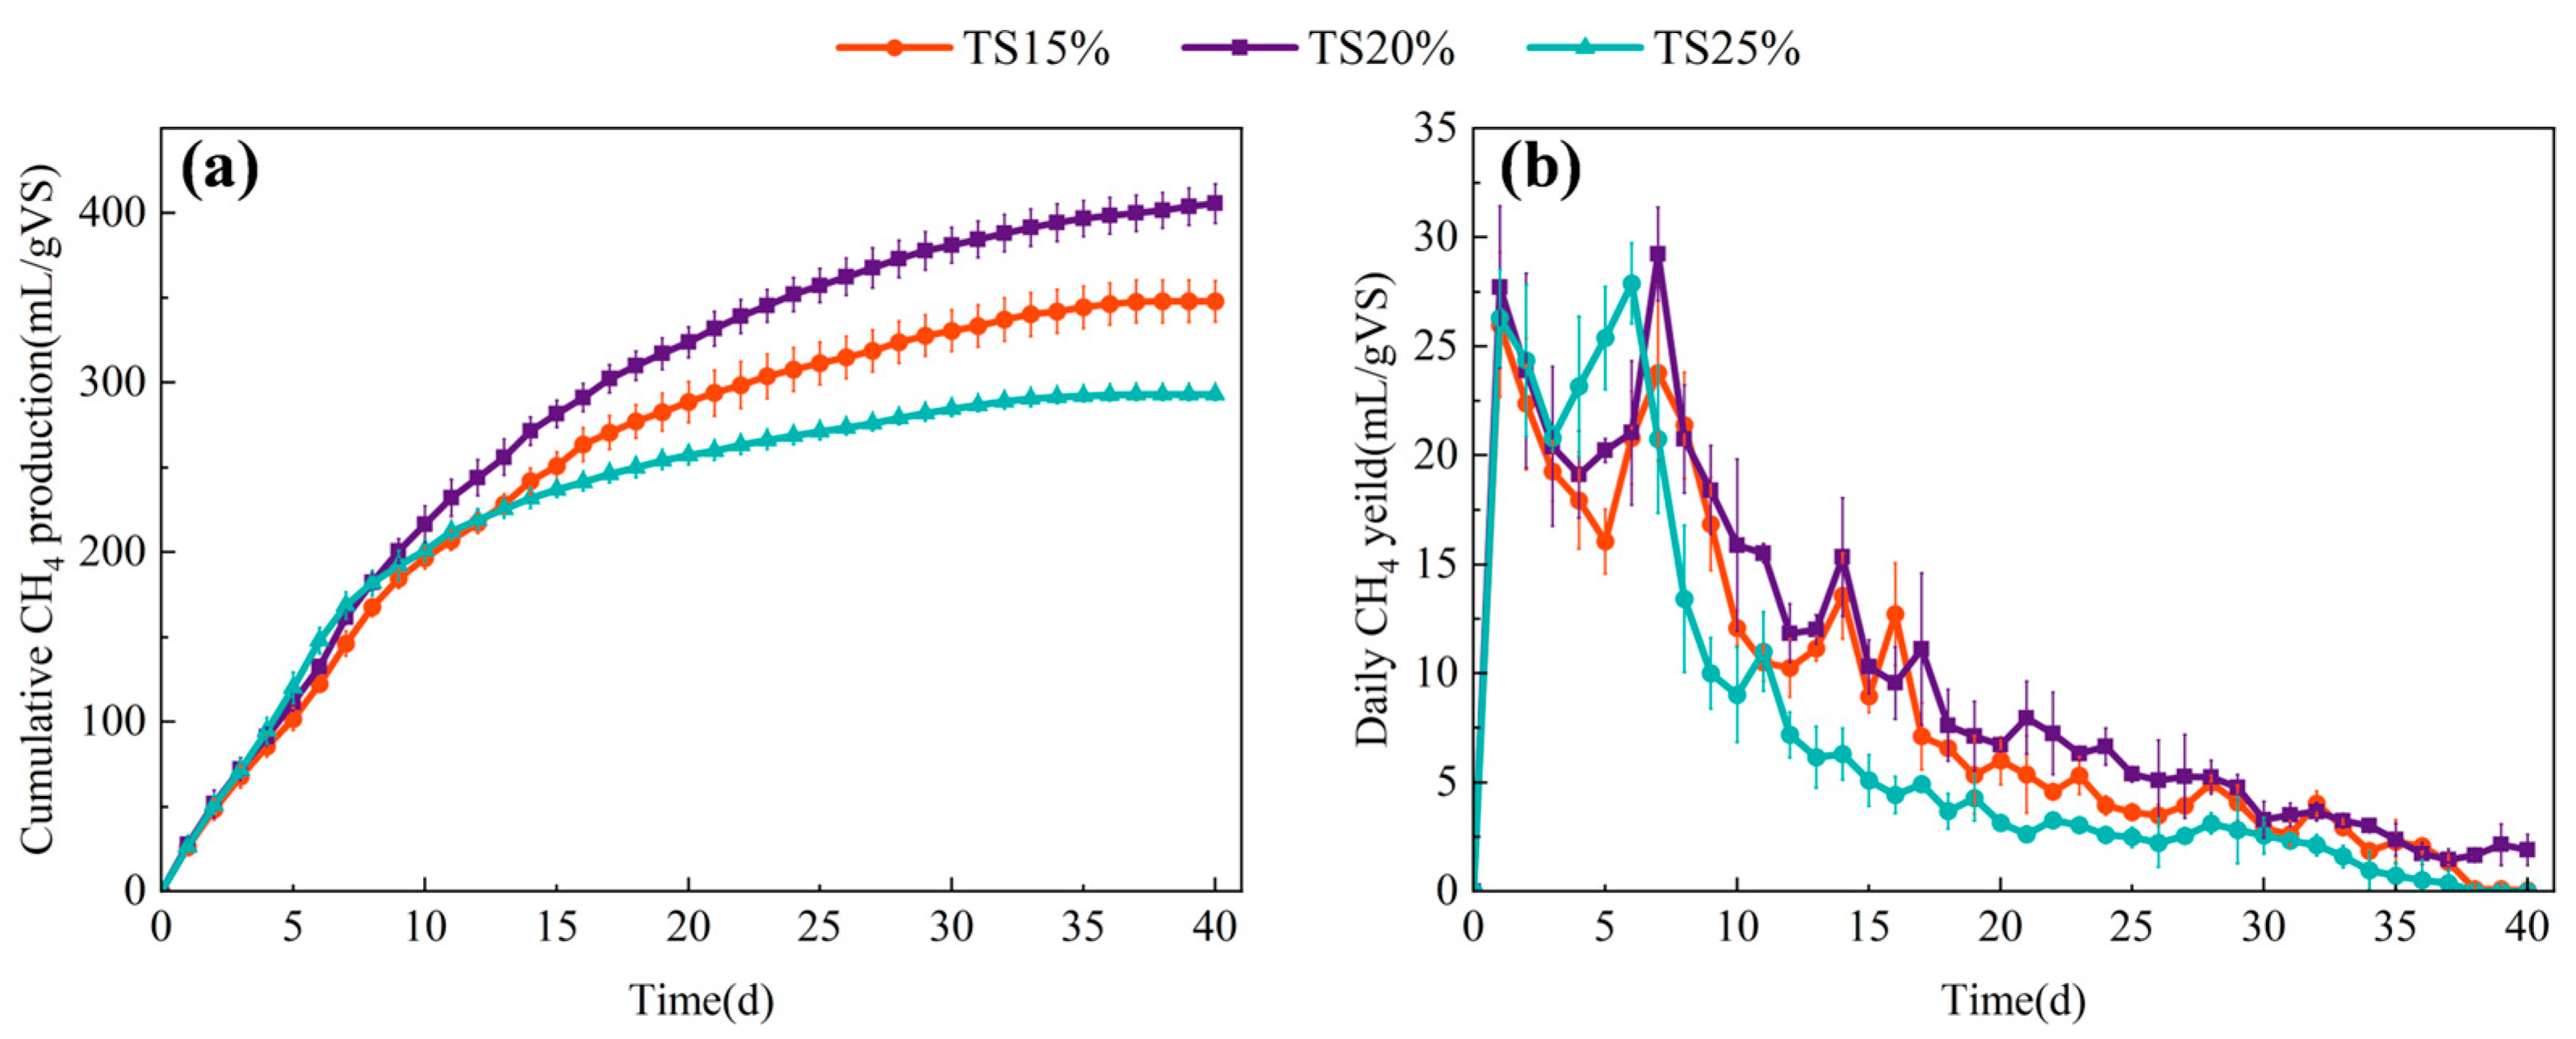
3.1. Effect of TS on the Methane Production Performance of Dry Anaerobic System

The influence of TS on methane production was investigated through comparative analysis of methanogenic performance in kitchen waste dry anaerobic digestion under varying TS conditions. As shown in Figure 1a, cumulative methane yields reached 348.09 ± 12.19, 405.73 ± 11.71, and 293.08 ± 3.55 mL/gVS for TS = 15%, 20%, and 25% systems, respectively. The TS = 20% system demonstrated 16.56% and 38.44% higher methane production relative to the TS = 15% and TS = 25% systems, respectively, indicating that moderate TS elevation enhances methanogenic efficiency through increased organic loading and substrate availability. However, elevating TS to 25% caused significant methane yield reduction accompanied by methanogenic inhibition, confirming performance enhancement is TS-dependent. This inhibition likely originates from substrate mass transfer limitations under high TS conditions and dynamic imbalances between the hydrolysis/acidogenesis and methanogenesis stages [21].
Daily methane production analysis revealed that all three anaerobic digestion systems achieved peak production around day 8 of operation, followed by a gradual decline. The TS = 25% system exhibited the highest cumulative methane production during early operational phases, attaining peak daily methane yield (27.89 ± 1.86 mL/gVS/d) earliest on day 6 (Figure 1b). This accelerated performance likely resulted from the elevated initial organic matter concentration enhancing the metabolic activity of the hydrolytic consortia, thereby facilitating rapid acidification of readily degradable components (e.g., starch, proteins). Such conditions enabled preliminary operational efficiency in high TS systems during initial reaction stages, consequently permitting an earlier achievement of peak gas production [22]. However, as the reaction process progressed, the methane yield of the TS = 25% group decreased significantly and the final accumulation was lower than that of the TS = 15% and 20% groups. This may be attributed to the high viscosity substrate at a high solid content reducing solid–liquid mass transfer efficiency, which inhibited the further decomposition of difficult-to-degrade organic matter [15]; the excessive accumulation of VFAs triggering the acidification of the system, which inhibited the metabolic activity of methanogens [23]; and the intensified competition for ecological niches among microbial communities under high organic loading compromises the synergistic interaction between hydrogenotrophic and acetoclastic methanogenic pathways [24]. In contrast, the TS = 20% group achieved efficient coupling of hydrolytic acidification and methanogenesis while maintaining a high organic load, thus exhibiting the best long-term gas production stability.

3.2. Effect of Increasing TS on the Change of System Stability

3.2.1. pH

The changes in pH at different solid contents are shown in Figure 2. The pH changes of the system under the three groups of solid content all showed a trend of rapid decrease followed by a gradual increase, and the pH of each group fluctuated between 7.2 and 8.2 throughout the experimental process. The experimental data showed that the pH of the TS = 25% group decreased rapidly from 8.19 to 7.29 in the initial stage, and the decrease was more than that of the TS = 15% and TS = 20% groups in both cases. This is closely related to the rapid hydrolysis and acidification process of high organic matter at high TS [25]. The reduction of mass transfer efficiency under high TS (>20%) leads to the local accumulation of VFAs, which in turn triggers a sudden drop in pH. The elevated initial organic loading in the TS = 25% system stimulated hydrolytic consortium metabolism; however, increased viscosity hindered timely VFAs consumption by methanogenic archaea, thus inducing accumulation-driven acidification risks.
The TS = 20% system exhibited progressive pH recovery from 7.61 to 7.85 during later operational phases, indicating optimal balance between organic loading and mass transfer efficiency that facilitated efficient VFAs utilization by methanogens. This demonstrates TS = 20% effectively reconciled substrate availability with mass transfer resistance, maintaining system pH stability. Conversely, TS = 25% showed significantly delayed pH recovery (reaching only 7.5 by day 40), attributable to incomplete hydrolysis of dissolved organic matter (e.g., polysaccharides, proteins) that exacerbated intermediate accumulation and impaired pH restoration. The low-solids system (TS = 15%) displayed a characteristic rapid initial pH decline followed by gradual recovery to 7.80, consistent with the rapid depletion of readily degradable substrates and an insufficient methanogenic substrate supply.

3.2.2. TAN

In an anaerobic digestion system, nitrogenous organic substances (e.g., proteins and amino acid compounds) are decomposed into VFAs and ammonia nitrogen (NH3/NH4+) through biotransformation in hydrolysis and acidification stages [26]. Ammonia nitrogen maintains dynamic equilibrium in the liquid phase as ionic ammonium (NH4+) and molecular free ammonia (NH3). During metabolism, heterotrophic microorganisms assimilate minor amounts as a nitrogen source for cellular synthesis. However, the absence of autotrophic nitrifying bacteria (e.g., ammonia-oxidizing bacteria) in anaerobic environments severely limits further inorganic nitrogen oxidation pathways such as nitrification. Therefore, with the continuous degradation of nitrogenous organic matter, unmetabolized ammonia nitrogen (in the form of NH3/NH4+) gradually accumulates in the system [27], and its concentration correlates with the substrate nitrogen content, hydrolysis efficiency, and mass transfer characteristics [28]. Excessive accumulation of ammonia nitrogen may trigger free ammonia toxicity, which becomes a key factor governing the stability of the system.
The variation process of TAN with anaerobic digestion time in a dry anaerobic digestion system under different TS proportions is shown in Figure 3.
Across all TS gradients, TAN concentrations increased throughout anaerobic digestion, exhibiting two distinct accumulation phases: an initial rapid stage followed by a slow accumulation period. During the rapid phase (≤5 days), TAN surged to 3746.95 ± 42.98 mg/L in TS = 25% systems, while TS = 20% (3315.51 ± 44.31 mg/L) and TS = 15% (3179.52 ± 106.22 mg/L) showed comparatively lower concentrations. Subsequently, minimal concentration changes occurred during the slow accumulation phase. Initial TAN concentrations were comparable across systems. As digestion progressed, TS = 20% and TS = 15% systems maintained similar TAN levels, whereas TS = 25% escalated to 4323.77 ± 35.41 mg/L. These differential accumulations originated from variable organic matter content in the feed substrates: higher TS systems contained greater organic nitrogen, resulting in proportionally elevated TAN concentrations during late-stage hydrolysis.
It was noted that when the TAN concentration ranged from 50–200 mg/L, it could provide an essential nitrogen source for microorganisms and promote metabolic activity [29], while the inhibition threshold of ammonia nitrogen in a wet anaerobic process was about 3000 mg/L [30]. It is worth noting that methanogenic bacteria exposed to high ammonia nitrogen for a long time can gradually recover their activity through adaptive evolution [31]. Dry and wet anaerobic treatment systems present differences in inhibitor tolerance mechanisms. Dry anaerobic digestion systems have higher biomass density and very low free water content [32], resulting in a non-homogeneous spatial distribution of metabolic intermediates. In wet anaerobic digestion systems, degradation byproducts distribute uniformly throughout the liquid-phase medium, exposing microbial populations comprehensively to inhibitors and enabling systemic metabolic inhibition upon reaching critical concentrations. Conversely, dry systems feature microorganisms organized as biofilms or aggregates, where inhibitors primarily affect the flora’s surface layer while interior microbes establish protected zones through physical barrier formation. The internal microorganisms form a “protected zone” due to the physical barrier, thus delaying the spread of the inhibitory effect. This spatial heterogeneity mechanism may make the tolerance threshold of the dry system to ammonia nitrogen significantly higher. Therefore, in this study, the TS = 15% and TS = 20% groups had already reached 3000 mg/L on day 5, but the methanogenic rate was not affected, while the methanogenic rate of TS = 25% decreased at the later stage, which suggests that the system may have reached the threshold of ammonia inhibition on day 25 at high TS.

3.2.3. VFAs and Their Compositions

VFAs comprising principal short-chain carboxylic acids like acetic, propionic, and butyric acids, represent characteristic metabolites derived from complex organic matter transformation during hydrolytic acidification in anaerobic biological treatment [33]. Among them, acetic acid, as a direct substrate of the methanogenic pathway, occupies a central position in the subsequent metabolism. Methanogenic microorganisms exhibit high sensitivity to microenvironmental perturbations; inhibition of their activity frequently induces VFAs accumulation, consequently triggering a systemic acid–base imbalance that is particularly pronounced at pH < 6.5. Therefore, monitoring the dynamic changes in VFAs concentration is of key importance in maintaining the stability of anaerobic digestion systems, especially in preventing metabolic collapse due to acid inhibition. The changes in VFAs and their composition at different TS proportions are shown in Figure 4.
During the anaerobic digestion process, TS had a significant effect on the dynamics of VFAs. As shown in Figure 4, the concentration of VFAs showed significant differences under different conditions of TS. During initial anaerobic fermentation, VFAs concentrations increased rapidly across all groups, with accumulation escalating proportionally to TS elevation from 15% to 25%. The TS = 25% system reached 4652 mg/L, significantly higher than TS = 15% (3648 mg/L) and TS = 20% (4095 mg/L), primarily due to enhanced organic hydrolysis at higher TS. As fermentation progressed, TS = 15% and TS = 20% systems exhibited significant VFAs reduction, while TS = 25% continued accumulating to 6217 mg/L. This persistent accumulation indicates delayed acidification and methanogenic inhibition in high TS systems [34].
During the operation of an anaerobic digestion system, the content of VFAs will change dynamically within a certain range. When the system is not characterized by significant inhibition, the formation and degradation of VFAs maintain a relatively stable metabolic equilibrium. However, if a continuous increasing or decreasing trend in the level of VFAs is observed, accompanied by the manifestation of other inhibitory symptoms, a high degree of attention is required [35]. In this experiment, methanogenesis at TS = 25% showed significant inhibition in the middle and late stages of anaerobic fermentation, which was obviously related to the continuous accumulation of VFAs.
Analysis revealed distinct TS-dependent VFAs transformation patterns: In TS = 15%, the acetic acid concentration increased from 65.31 mg/L (day 0) to 1962.01 mg/L (day 5) before declining to 309.39 mg/L (day 40; 84.2% removal efficiency), while propionic and butyric acids peaked at 1123.73 mg/L and 473.34 mg/L (day 5), respectively, before declining to 376.17 mg/L (66.5% removal) and 102.28 mg/L (78.4% removal) by day 40. TS = 20% exhibited enhanced acetic acid degradation (2362.23 mg/L at day 5 → 294.56 mg/L at day 40; 87.5% removal), with propionic and butyric acids achieving 81.2% and 65.7% removal efficiencies, respectively. Conversely, TS = 25% showed rapid acetic acid accumulation from 122.18 mg/L (day 0) to 3733.96 mg/L (day 25), increasing its proportion of total VFAs (TVFAs) from 48.0% to 59.9%—exceeding accumulation rates in lower-TS systems and indicating a production–degradation imbalance. Concurrent propionic acid (74.83 → 1729.34 mg/L) and butyric acid (26.99 → 699.83 mg/L) accumulation raised their combined TVFA contribution from 39.9% to 40.8% by day 40, reflecting a synergistic acidification risk [36]. Transient accumulation of branched-chain acids (e.g., isobutyric acid: 259.19 mg/L at day 12, 4.8% TVFAs) implied an association with protein degradation pathways [37], potentially exacerbating methanogenic inhibition through metabolic network interactions.
The abnormal accumulation of VFAs in the TS = 25% system can be attributed to the synergistic effect of multiple inhibitory factors. First, the limited mass transfer resulted in the scarcity of free water and the inability of acids to diffuse efficiently into the area of action of methanogens, especially the high localized concentrations of acetic and propionic acids directly inhibiting the activity of methanogens. Second, the lower pH environment weakened the function of methanogens, especially the acetate-cleaving methanogens, which are extremely sensitive to acidic conditions. In addition, the accumulation of ammonia nitrogen further inhibited the metabolic activity of microorganisms through free ammonia (FAN) toxicity. Together, these factors resulted in lower degradation rates of VFAs than in the TS = 15% and 20% systems.

3.2.4. Correlation Analysis

A correlation analysis of pH, TAN, TVFAs and cumulative methane production under different solid content rates was conducted to reveal the relationships between different stability parameters and methane production. The correlation analysis is shown in Figure 5. Stability parameters exhibiting significant correlations with methane production differed across TS gradients, as did the inter-parameter relationships, indicating that mechanisms governing methane yield variations and system stability operate through distinct pathways at different solid concentrations.
The TS = 20% system exhibited optimal buffering performance, with pH autonomously recovering to 7.85 at the end of the experiment after an initial large drop, indicating the high efficiency of the system’s carbonate buffer system. The rapid degradation of TVFAs and the sustained increase in methanogenic production further validated the stability of the system. Although the significant negative correlation (p ≤ 0.01) between pH and TVFAs suggested a risk of acidification, the organic loading under the TS = 20% system could control the peak of TVFAs. System TAN concentration did not significantly inhibit methanogenic activity, and its strong positive correlation (p ≤ 0.05) with methanogenesis suggested that ammonia nitrogen remained within the metabolism-promoting threshold. The stability of the system at this TS centered on the synergistic effect of the dynamic equilibrium of pH and the degradation rate of TVFAs.
The strong negative correlation (p ≤ 0.05) between pH and TVFAs at TS = 15% suggests that the acidification trend needs to be controlled by alkali supplementation (e.g., NaHCO3), and its stability criterion needs to be strictly limited to the peak TVFAs and TAN concentration in order to ensure a smooth growth of methanogenesis. The strong positive correlation (p ≤ 0.001) between TAN and TVFAs at TS = 25% indicated that they accumulated synergistically, leading to a continuous decrease in pH and increased acid inhibition in the mid- to late-stage of the experiment. The slowdown in the metabolism of TVFAs and the approach of the inhibition threshold of the TAN concentration together triggered the sudden decrease in the growth rate of methanogenic production.
In summary, the effects of solid content on system stability showed significant gradient differences. TS = 20% was optimal in terms of pH autonomous recovery, efficient degradation of VFAs and TAN tolerance, which was the ideal choice for balancing the efficiency and stability of methane production. The core driving factors of system stability are VFAs degradation rate, pH dynamic balance and TAN control, and real-time monitoring and dynamic regulation are the key to ensuring long-term stable operation.

3.3. Effect of Increasing TS on Organic Matter Changes
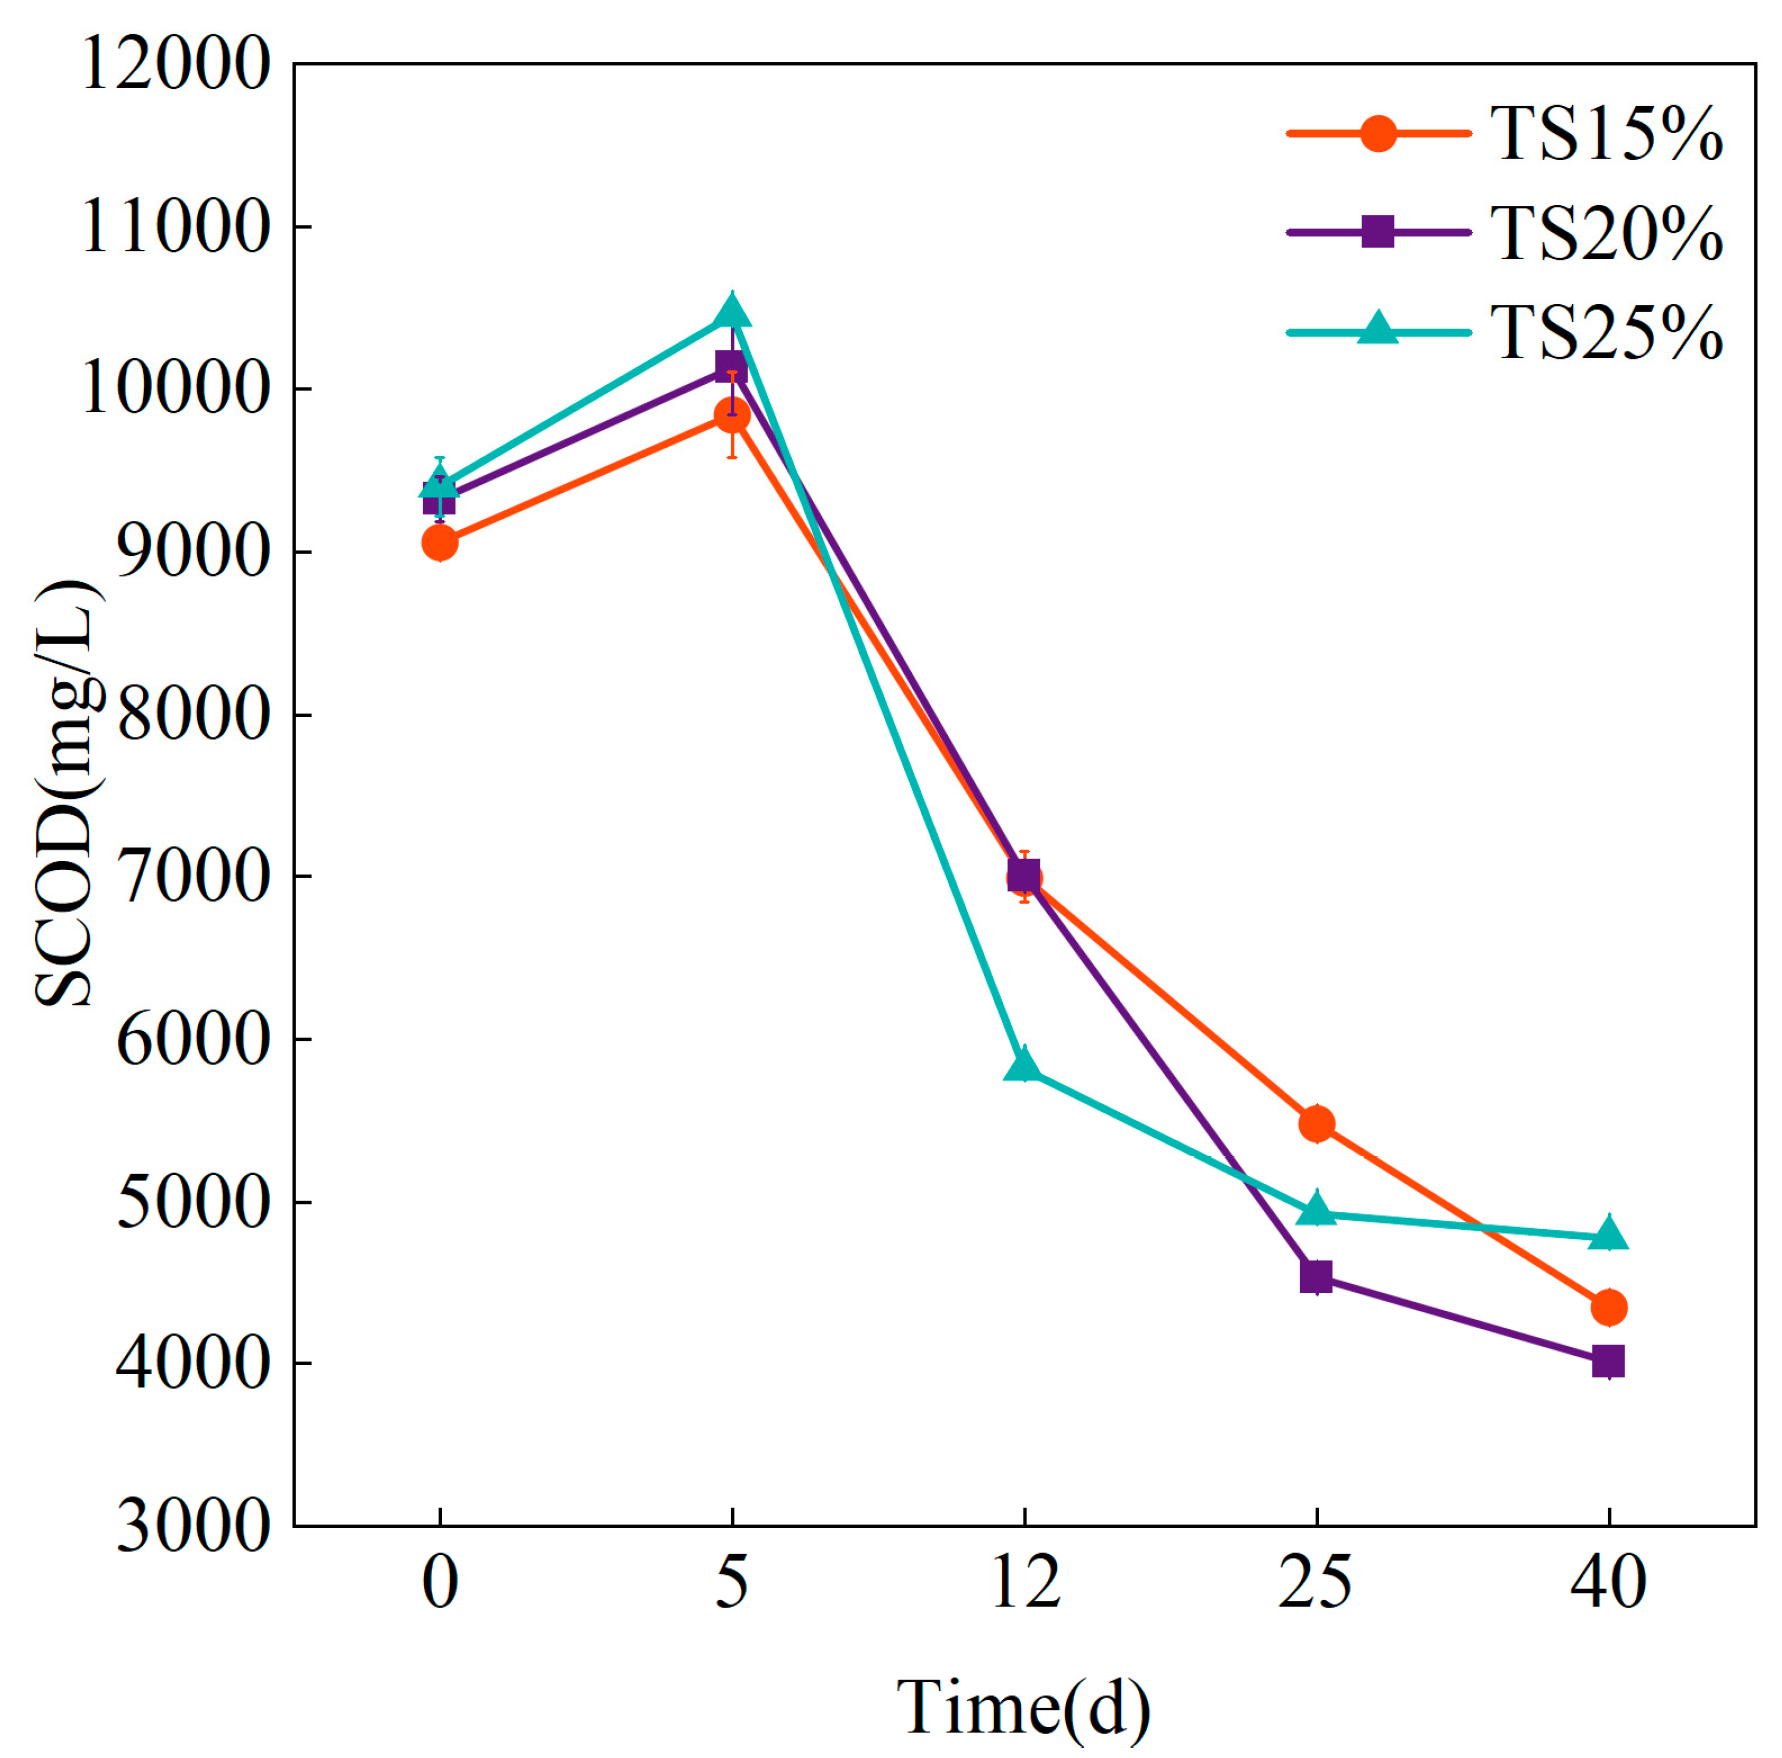
3.3.1. SCOD

The changes of SCOD under the conditions of different TS throughout the whole process of dry anaerobic digestion are shown in Figure 6. Different experimental groups showed similar patterns of change, and all of them were in the degradation model of first accumulation and then rapid consumption. Initial SCOD concentrations increased across all groups, with TS = 25% peaking at 10,454.33 ± 20.55 mg/L on day 5—marginally exceeding TS = 15% (9847.01 ± 265.23 mg/L) and TS = 20% (10,134.22 ± 294.60 mg/L). This pattern suggests elevated organic loading under high TS conditions enhances hydrolytic bacterial activity in anaerobic digestion. The rapid decomposition of complex organic matter (e.g., cellulose, hemicellulose) resulted in the release of more soluble substrates. It is worth noting that the SCOD depletion rates of the experimental groups differed in the later stages of the reaction, with the SCOD concentration of the TS = 25% group gradually decreasing from 5811.2 ± 17.87 mg/L on day 12 to 4773.33 ± 13.05 mg/L on day 40, and the decreasing curve tended to be flat. Contrastingly, the TS = 20% and TS = 15% systems exhibited accelerated SCOD depletion, decreasing from 6997.87 ± 150.75 mg/L and 7008.32 ± 21.21 mg/L (day 12) to 4354.33 ± 18.91 mg/L and 4014.32 ± 3.53 mg/L, respectively. This rapid depletion contrasts with high TS systems where methanogenic pathway mass transfer limitations during late stage operation impeded efficient soluble substrate consumption, thereby impairing microbial SCOD utilization [38]. Comparatively, the TS = 15% and TS = 20% systems experienced substantially reduced impact.

3.3.2. SPS

In an anaerobic digestion system, SPS, as a key intermediate product after hydrolysis of complex carbohydrates (e.g., starch, cellulose, etc.), is both the main metabolic substrate of acidifying flora and an important indicator to regulate the distribution of carbon flow in the system. Dynamic changes in the concentration of SPS directly reflect the hydrolysis efficiency and the metabolic balance of the subsequent acidification and methanogenesis stages. Its accumulation may be due to incomplete hydrolysis of difficult-to-degrade polysaccharides or insufficient activity of acidifying flora, whereas its excessive depletion may be due to efficient utilization of soluble substrates by methanogenic bacteria. The changes of SPS at different solid content in this study are shown in Figure 7.
The TS = 25% system exhibited the highest initial SPS concentration (1833.33 ± 15.28 mg/L), which rapidly decreased to 1127.32 ± 24.39 mg/L within the first five reaction days before stabilizing at slightly elevated levels during late-stage operation. This stabilization pattern indicates SPS consumption lagged behind production in late-phase TS = 25% systems, likely due to reduced methanogen contact efficiency with continuously released substrates under high VS conditions. In contrast, the SPS in the TS = 15% and TS = 20% groups decreased from 1583.35 ± 30.55 mg/L and 1703.42 ± 32.16 mg/L to 726.85 ± 22.32 mg/L and 812.51 ± 36.74 mg/L at the end of the experiment. It also remained at almost the same level during the experiment, indicating that in dry anaerobic digestion, the increase in TS to 20% corresponded to the increase in organic loading could basically enable the system microorganisms to maintain a certain degree of degradation capacity for SPS.

3.3.3. SPN

In anaerobic digestion systems, SPN—the principal soluble product of protein hydrolysis—serves as both a critical nitrogen source for heterotrophic microorganism metabolism and a key nitrogen cycle indicator. SPN undergoes degradation through two primary metabolic pathways: direct conversion by acidogenic bacteria into VFAs and TAN, or initial deamination to NH3 followed by direct methanogen utilization. Consequently, SPN concentration dynamics reflect the equilibrium between hydrolysis rates and subsequent metabolic consumption. The changes of SPN under different TS proportions are shown in Figure 8. It can be observed that the concentration of SPN under the three groups of TS shows a continuous increasing trend with the increase of fermentation time, but the accumulation rate and magnitude of the SPN differs under different TS proportions. The concentration of SPN in the group of TS = 25% increased continuously from the initial 1898.90 ± 78.36 mg/L to 3270.07 ± 47.86 mg/L by day 40, which was 72.3%, while the concentration of SPN in the TS = 15% and TS = 15% groups was 72.3%, and the concentration of SPN in the groups of TS = 25% and TS = 15% was 72.3%. The SPN of the TS = 15% and TS = 20% groups was 2489.05 ± 55.11 mg/L and 2783.45 ± 36.01 mg/L, respectively, by the end of the experiment, with increases of 33.4% and 43.5%, respectively. This indicates that more macromolecular organic matter is converted to SPN at higher TS, and the continuous increase of VFAs and TAN is significantly correlated with the continuous and substantial increase of SPN. The content of SPN in TS = 15% and TS = 20% tended to stabilize by the late stage of the experiment, which suggests that the microorganisms in the system consume SPN at a rate gradually exceeding the rate of hydrolysis of macromolecular organic matter in a metabolic equilibrium state. These results indicate that the consumption rate of SPN by microorganisms in the system gradually exceed the hydrolysis rate of macromolecules and are then in metabolic equilibrium.

3.4. Effect of TS on Microbial Community Structure

3.4.1. Bacterial Community Structure

As shown in Figure 9, the bacteria at the phylum level in each sample were mainly Firmicutes, Bacteroidetes, Atribacterota, Actinomycetota, Pseudomonadota, Synergistota, Chloroflexota, Thermodesulfobacteriota, etc. Firmicutes is the core functional group of bacteria in the hydrolysis–acidification stage. Its metabolic characteristics are embodied in the secretion of extracellular enzyme systems, such as cellulases, lipases, and proteases, which are capable of catalyzing fats, cellulose and other polysaccharides as well as amino acids [39]. Bacteroidetes contain multifunctional groups such as hydrolyzing bacteria, acid-producing bacteria and fermenting bacteria, which take on multidimensional metabolic roles in substrate transformation in anaerobic systems [40]. Atribacterota can collaborate with Firmicutes to decompose difficult-to-degrade organic matter such as lignocellulose. Chloroflexota is involved in volatile fatty acid biosynthesis through the organic matter metabolic pathway and is a key driver of short-chain fatty acid accumulation [41]. Synergistota produces short-chain fatty acids and acts as a synthesizing acetic acid oxidant [42]. Actinomycetota also catabolizes polysaccharide and protein substrates under anaerobic conditions [43]. Synergistota in combination with Actinomycetota enables efficient degradation of organic acids and monosaccharides and enhances the mineralization of organic intermediates in the system [44].
At the early stage of fermentation, the relative abundance of Firmicutes dominated in all three groups of solids-containing systems, with a relative abundance of 38.1%, 35.7%, and 41.7%, respectively, in each group, and the relative abundance of Bacteroidota was 39.0%, 42.6%, and 36.6%, respectively; these two phyla together constituted the core bacterial flora of the initial community. This phenomenon was highly correlated with the initial hydrolysis stage of easily degradable organic matter such as carbohydrates and proteins in kitchen waste, and the two types of bacterial flora rapidly initiated substrate decomposition through synergistic metabolism. The relative abundance of Firmicutes exhibited an initial increase followed by a decline throughout fermentation, peaking in the TS = 25% system on day 5. This maximal abundance corresponds to both the highest hydrolytic acidification intensity and initial methane production peak in high TS kitchen waste anaerobic digestion. The relative abundance of Bacteroidota, on the other hand, showed a continuous decreasing trend, and its attenuation may be related to the selective inhibition of the acidic environment due to the accumulation of VFAs and the fact that some parthenogenetic hydrolyzers of this clade (e.g., Bacteroides) were sensitive to low pH, while the competitive advantage of methanogens gradually came to the fore. Notably, the experimental group with TS raised to 25% showed an abnormal increase in Pseudomonadota abundance at the late fermentation stage, which was significantly higher than the concurrent level of the other two groups with lower TS. Combined with its metabolic properties, it was hypothesized that the high TS might lead to localized mass transfer limitations, which triggered fatty acid accumulation and then activated Pseudomonadota with resilience properties to maintain the system’s stability. Furthermore, increasing TS to increase the organic load of dry anaerobic digestion of kitchen waste, the microbial community structure during the process did not vary much and would show similar trends with fermentation time.

3.4.2. Archaeal Community Structure

The succession pattern of archaeal genus level communities is shown in Figure 10. The main dominant groups in each TS group are Methanosarcina, Bathyarchaeia, unclassified_Euryarchaeota, Methanobacterium, Methanosphaera, etc. At the initial stage of fermentation, Methanosarcina was absolutely dominant in all three groups with relative abundances of 73.6%, 78.6%, and 76.6% in the three TS groups, respectively, indicating the dominant role of the acetic acid-cracking methanogenic pathway in the initiation phase of the system. However, its relative abundance showed a significant decreasing trend as the fermentation process advanced, decreasing to 35.2% in the TS = 15% group, 41.9% in the TS = 20% group, and 32.6% in the TS = 25% group by the end of the experiment. This phenomenon is closely related to the rapid depletion of acetic acid in the substrate, which directly limits the metabolic activity of Methanosarcina colonies that depend on acetic acid as a substrate [45]. This trend corresponds to declining acetic acid concentrations in the TS = 15% and 20% systems during the mid-late experimental phases; conversely, high TS systems exhibited acetic acid accumulation, likely reflecting a reduced relative abundance of acetogenic microorganisms and consequent diminished metabolic utilization. In addition, the sustained enrichment of Bathyarchaeia in the TS = 15% group ranged from 4.84% at the beginning of the experiment to 11.6% at the end of the experiment, suggesting that it may play a key biocatalytic role in the late transformation of difficult-to-degrade substrates in TS = 15%.
Notably, in the TS = 25% experimental group, the relative abundance of the hydrogenotrophic methanogen Methanobacterium significantly increased to 32.2% by day 40, substantially surpassing those in the TS = 15% (6.05%) and TS = 20% (1.49%) groups. Its proliferation may correlate with elevated hydrogen partial pressure under high TS (25%), where methanogenic function was maintained via the CO2 reduction pathway, partially compensating for the efficiency loss in the acetoclastic pathways [46]. In the TS = 25% group, Methanosphaera proliferated to 9.57% by day 25, showing a positive correlation with ammonia nitrogen concentration. This genus utilizes methanol and methylamine substrates [47], potentially bypassing ammonia inhibition on conventional methanogenic pathways through alternative metabolic routes. During the later experimental phase, the archaeal community in the TS = 25% group exhibited “multi-core” characteristics, with high abundances of Methanobacterium and Methanosphaera coexisting. However, as methylotrophic pathways also require H2 as an electron donor [48], competitive conflicts with hydrogenotrophic pathways may arise, leading to reduced methanogenic efficiency. This result indicates that both excessively low and high functional redundancy could impair system performance.

4. Conclusions

Increasing TS content significantly influences both methanogenic efficiency and system stability thresholds in kitchen waste dry anaerobic digestion. The TS = 20% system achieves optimal dynamic equilibrium between organic loading and mass transfer efficiency, demonstrating superior methane production (405.73 ± 11.71 mL/gVS) and operational stability. This balance is maintained through synergistic self-regulating pH recovery, efficient VFAs degradation, and enhanced TAN tolerance, collectively ensuring coordinated metabolic pathway functionality. Organic degradation analysis revealed TS elevation to 25% induces abnormal SCOD and SPN accumulation due to mass transfer limitations, exacerbating acid inhibition and ammonia toxicity. Conversely, the TS = 20% system exhibits rapid SPS degradation and dynamic SPN equilibrium, confirming superior substrate utilization capacity. High-load operation at TS = 25% requires strategic interventions, including two-phase process separation or acid-tolerant microbial consortia enrichment to mitigate organic metabolic imbalance risks. Collectively, TS = 20% emerges as the optimal threshold for efficient energy recovery and stable operation, with enhanced organic degradation efficiency and microbial functional synergy, providing critical process optimization guidance.

Author Contributions

Conceptualization, J.Z.; methodology, J.Z.; validation, L.L.; investigation, L.L.; resources, J.Z. and J.L.; data curation, L.L. and J.Z.; writing—original draft preparation, L.L.; writing—review and editing, J.Z. and L.L.; visualization, L.L.; supervision, J.Z. and J.L.; project administration, J.Z.; funding acquisition, J.Z. All authors have read and agreed to the published version of the manuscript.

Funding

This research was funded by National Natural Science Foundation of China, grant number 22202223.

Data Availability Statement

Data are contained within the article.

Conflicts of Interest

The authors declare no conflicts of interest.

Abbreviations

The following abbreviations are used in this manuscript:
TSTotal Solids
VSVolatile Solids
TANTotal Ammonia Nitrogen
VFAsVolatile Fatty Acids
SCODSoluble Chemical Oxygen Demand
SPSSoluble Polysaccharides
SPNSoluble Protein Nitrogen

References

  1. Zhang, C.; Su, H.; Baeyens, J.; Tan, T. Reviewing the anaerobic digestion of food waste for biogas production. Renew. Sustain. Energy Rev. 2014, 38, 383–392. [Google Scholar] [CrossRef]
  2. Zhang, S.; Ma, X.; Sun, H.; Zhao, P.; Wang, Q.; Wu, C.; Gao, M. Response of semi-continuous anaerobic digestion of food waste to progressively increasing temperature: Methanogen community, correlation analysis, and energy balance. Ind. Crop. Prod. 2023, 192, 116066. [Google Scholar] [CrossRef]
  3. Du, M.; Liu, X.; Wang, D.; Yang, Q.; Duan, A.; Chen, H.; Liu, Y.; Wang, Q.; Ni, B.J. Understanding the fate and impact of capsaicin in anaerobic co-digestion of food waste and waste activated sludge. Water Res. 2021, 188, 116539. [Google Scholar] [CrossRef] [PubMed]
  4. Sindhu, R.; Gnansounou, E.; Rebello, S.; Binod, P.; Varjani, S.; Thakur, I.S.; Nair, R.B.; Pandey, A. Conversion of food and kitchen waste to value-added products. J. Environ. Manag. 2019, 241, 619–630. [Google Scholar] [CrossRef]
  5. Chavan, S.; Yadav, B.; Tyagi, R.D.; Wong, J.W.C.; Drogui, P. Trends and challenges in the valorization of kitchen waste to polyhydroxyalkanoates. Bioresour. Technol. 2023, 369, 128323. [Google Scholar] [CrossRef]
  6. Liu, X.; Shen, J.; Guo, Y.; Wang, S.; Chen, B.; Luo, L.; Zhang, H. Technical progress and perspective on the thermochemical conversion of kitchen waste and relevant applications: A comprehensive review. Fuel 2023, 331, 125803. [Google Scholar] [CrossRef]
  7. Su, G.; Ong, H.C.; Fattah, I.M.R.; Ok, Y.S.; Jang, J.H.; Wang, C.T. State-of-the-art of the pyrolysis and co-pyrolysis of food waste: Progress and challenges. Sci. Total Environ. 2022, 809, 151170. [Google Scholar] [CrossRef]
  8. Zhang, P.; Chai, J.; Cao, J.; Qin, Y.; Dang, M.; Geng, K.; Wei, Y. Landfill leachate generation mechanism study: A review. Int. J. Environ. Sci. Technol. 2023, 20, 9271–9290. [Google Scholar] [CrossRef]
  9. Ajay, C.M.; Mohan, S.; Dinesha, P. Decentralized energy from portable biogas digesters using domestic kitchen waste: A review. Waste Manag. 2021, 125, 10–26. [Google Scholar] [CrossRef]
  10. Wang, Z.; Wang, S.; Li, H.; Lu, Y.; Zhang, B.; Zhang, H.; Zhang, S. Synergistic effects of economic benefits, resource conservation and carbon mitigation of kitchen waste recycling from the perspective of carbon neutrality. Resour. Conserv. Recycl. 2023, 199, 107262. [Google Scholar] [CrossRef]
  11. Kim, M.-S.; Na, J.-G.; Lee, M.-K.; Ryu, H.; Chang, Y.-K.; Triolo, J.M.; Yun, Y.-M.; Kim, D.-H. More value from food waste: Lactic acid and biogas recovery. Water Res. 2016, 96, 208–216. [Google Scholar] [CrossRef] [PubMed]
  12. Wang, Z.; Jiang, Y.; Wang, S.; Zhang, Y.; Hu, Y.; Hu, Z.-h.; Wu, G.; Zhan, X. Impact of total solids content on anaerobic co-digestion of pig manure and food waste: Insights into shifting of the methanogenic pathway. Waste Manag. 2020, 114, 96–106. [Google Scholar] [CrossRef] [PubMed]
  13. Bollon, J.; Benbelkacem, H.; Gourdon, R.; Buffière, P. Measurement of diffusion coefficients in dry anaerobic digestion media. Chem. Eng. Sci. 2013, 89, 115–119. [Google Scholar] [CrossRef]
  14. Li, Y.; Park, S.Y.; Zhu, J. Solid-state anaerobic digestion for methane production from organic waste. Renew. Sustain. Energy Rev. 2011, 15, 821–826. [Google Scholar] [CrossRef]
  15. Hua, D.; Hou, X.; Zhao, Y.; Xu, H.; Jin, F.; Chen, L.; Meng, G.; Li, Y. Structural optimization and performance evaluation of high-solid anaerobic digestion reactors by CFD simulation at various scales. J. Water Process Eng. 2025, 70, 106999. [Google Scholar] [CrossRef]
  16. Peng, X.; Nges, I.A.; Liu, J. Improving methane production from wheat straw by digestate liquor recirculation in continuous stirred tank processes. Renew. Energy 2016, 85, 12–18. [Google Scholar] [CrossRef]
  17. Nie, H.; Jacobi, H.F.; Strach, K.; Xu, C.; Zhou, H.; Liebetrau, J. Mono-fermentation of chicken manure: Ammonia inhibition and recirculation of the digestate. Bioresour. Technol. 2015, 178, 238–246. [Google Scholar] [CrossRef]
  18. Song, Y.; Liu, J.; Chen, M.; Zheng, J.; Gui, S.; Wei, Y. Application of mixture design to optimize organic composition of carbohydrate, protein, and lipid on dry anaerobic digestion of OFMSW: Aiming stability and efficiency. Biochem. Eng. J. 2021, 172, 108037. [Google Scholar] [CrossRef]
  19. American Public Health Association; American Water Works Association; Water Environment Federation. Standard Methods for Examination of Water and Wastewater; American Public Health Association; American Water Works Association; Water Environment Federation: Washington, DC, USA, 2012; p. 185. [Google Scholar]
  20. Xu, M.; Gao, P.; Chen, H.-Q.; Shen, X.-X.; Xu, R.-Z.; Cao, J.-S. Metagenomic insight into the prevalence and driving forces of antibiotic resistance genes in the whole process of three full-scale wastewater treatment plants. J. Environ. Manag. 2023, 344, 118369. [Google Scholar] [CrossRef]
  21. Abbassi-Guendouz, A.; Brockmann, D.; Trably, E.; Dumas, C.; Delgenès, J.-P.; Steyer, J.-P.; Escudié, R. Total solids content drives high solid anaerobic digestion via mass transfer limitation. Bioresour. Technol. 2012, 111, 55–61. [Google Scholar] [CrossRef]
  22. Zhen, F.; Wu, D.; Sun, Y.; Qu, B.; Li, L.; Li, Y.; Li, Q.; Xing, T. Effect of different organic loads on the performance and microbial community mechanism of dry anaerobic digestion. Fuel 2024, 361, 130615. [Google Scholar] [CrossRef]
  23. Yao, Z.; Chunxing, L.; Zengwei, Y.; Ruming, W.; Irini, A.; Gefu, Z. Syntrophy mechanism, microbial population, and process optimization for volatile fatty acids metabolism in anaerobic digestion. Chem. Eng. J. 2023, 452, 139137. [Google Scholar]
  24. Mercado, J.V.; Koyama, M.; Nakasaki, K. Short-term changes in the anaerobic digestion microbiome and biochemical pathways with changes in organic load. Sci. Total Environ. 2022, 813, 152585. [Google Scholar] [CrossRef] [PubMed]
  25. Lu, Y.; Chen, R.; Huang, L.; Wang, X.; Chou, S.; Zhu, J. Acidogenic fermentation of potato peel waste for volatile fatty acids production: Effect of initial organic load. J. Biotechnol. 2023, 374, 114–121. [Google Scholar] [CrossRef]
  26. Rajagopal, R.; Massé, D.I.; Singh, G. A critical review on inhibition of anaerobic digestion process by excess ammonia. Bioresour. Technol. 2013, 143, 632–641. [Google Scholar] [CrossRef]
  27. Tian, H.; Fotidis, I.A.; Kissas, K.; Angelidaki, I. Effect of different ammonia sources on aceticlastic and hydrogenotrophic methanogens. Bioresour. Technol. 2018, 250, 390–397. [Google Scholar] [CrossRef]
  28. Yapeng, S.; Wanrong, H.; Wei, Q.; Maria, W.; Wandera, S.M.; Renjie, D. Upgrading the performance of high solids feeding anaerobic digestion of chicken manure under extremely high ammonia level. Renew. Energy 2022, 194, 13–20. [Google Scholar]
  29. Yang, J.; Zhang, J.; Du, X.; Gao, T.; Cheng, Z.; Fu, W.; Wang, S. Ammonia inhibition in anaerobic digestion of organic waste: A review. Int. J. Environ. Sci. Technol. 2024, 22, 3927–3942. [Google Scholar] [CrossRef]
  30. Niu, Q.; Qiao, W.; Qiang, H.; Li, Y.-Y. Microbial community shifts and biogas conversion computation during steady, inhibited and recovered stages of thermophilic methane fermentation on chicken manure with a wide variation of ammonia. Bioresour. Technol. 2013, 146, 223–233. [Google Scholar] [CrossRef]
  31. Zhuo, Y.; Wang, H.; Wang, X.; Jing, D.; Zhou, M.; Peng, D.; Han, Y. Performance of electroactive anaerobic granular sludge under ammonia stress: Performance, microbe and morphology. Bioresour. Technol. 2025, 424, 132295. [Google Scholar] [CrossRef]
  32. Zhu, C.; Cao, Z.; Wang, H.; Yuan, H.; Li, X. High-solid anaerobic digestion performance of municipal organic solid waste: Methane yield, microbial communities, enzymes, and key metabolic pathways. J. Environ. Chem. Eng. 2025, 13, 116297. [Google Scholar] [CrossRef]
  33. Zhao, J.; Zhang, H.; Guan, D.; Wang, Y.; Fu, Z.; Sun, Y.; Wang, D.; Zhang, H. New insights into mechanism of emerging pollutant polybrominated diphenyl ether inhibiting sludge dark fermentation. Bioresour. Technol. 2023, 368, 128358. [Google Scholar] [CrossRef] [PubMed]
  34. Chen, Y.-W.; Feng, G.; Hong, X.; Wang, M.; Zhang, Q.; Sun, Z.-Y.; Chen, Y.-T.; Tang, Y.-Q. Effects of high solid content and straw proportion on volatile fatty acids production from straw, sludge and food wastes: Performance and microbial community characteristics. Appl. Biol. Chem. 2024, 67, 83. [Google Scholar] [CrossRef]
  35. Chen, X.; Liu, W.; Zhao, Y.; He, H.; Ma, J.; Cui, Z.; Yuan, X. Optimization of semi-continuous dry anaerobic digestion process and biogas yield of dry yellow corn straw: Based on “gradient anaerobic digestion reactor”. Bioresour. Technol. 2023, 389, 129804. [Google Scholar] [CrossRef]
  36. Liang, Y.; Yu, J.; Yao, Z.; Sun, Y.; Zhao, L. Performance, interaction, and metabolic pathway of novel dry–wet anaerobic digestion for treating high-solid agricultural waste. Energy 2024, 304, 132055. [Google Scholar] [CrossRef]
  37. Nam, J.-Y.; Yates, M.D.; Zaybak, Z.; Logan, B.E. Examination of protein degradation in continuous flow, microbial electrolysis cells treating fermentation wastewater. Bioresour. Technol. 2014, 171, 182–186. [Google Scholar] [CrossRef]
  38. Tiedong, L.; Tianming, S.; Xuelian, L.; Yuansong, W.; Junya, Z.; Tieguang, H. Dual character of methane production improvement and antibiotic resistance genes reduction by nano-Fe2O3 addition during anaerobic digestion of swine manure. J. Clean. Prod. 2022, 376, 134240. [Google Scholar]
  39. Ren, S.; Usman, M.; Tsang, D.C.W.; O-Thong, S.; Angelidaki, I.; Zhu, X.; Zhang, S.; Luo, G. Hydrochar-Facilitated Anaerobic Digestion: Evidence for Direct Interspecies Electron Transfer Mediated through Surface Oxygen-Containing Functional Groups. Environ. Sci. Technol. 2020, 54, 5755–5766. [Google Scholar] [CrossRef]
  40. Lee, J.; Hong, J.; Jeong, S.; Chandran, K.; Park, K.Y. Interactions between substrate characteristics and microbial communities on biogas production yield and rate. Bioresour. Technol. 2020, 303, 122934. [Google Scholar] [CrossRef]
  41. Zixin, W.; Cheng, Z.; Jamison, W.; Sharma, B.K.; Buchun, S.; Yuanhui, Z. Adsorption or direct interspecies electron transfer? A comprehensive investigation of the role of biochar in anaerobic digestion of hydrothermal liquefaction aqueous phase. Chem. Eng. J. 2022, 435, 135078. [Google Scholar]
  42. Zamorano-López, N.; Borrás, L.; Seco, A.; Aguado, D. Unveiling microbial structures during raw microalgae digestion and co-digestion with primary sludge to produce biogas using semi-continuous AnMBR systems. Sci. Total Environ. 2020, 699, 134365. [Google Scholar] [CrossRef] [PubMed]
  43. Zou, X.; Wang, Y.; Dai, Y.; Zhou, S.; Wang, B.; Li, Y.; Li, J. Batch and semi–continuous experiments examining the sludge mesophilic anaerobic digestive performance with different varieties of rice straw. Bioresour. Technol. 2022, 346, 126651. [Google Scholar] [CrossRef] [PubMed]
  44. Ariesyady, H.D.; Ito, T.; Okabe, S. Functional bacterial and archaeal community structures of major trophic groups in a full-scale anaerobic sludge digester. Water Res. 2007, 41, 1554–1568. [Google Scholar] [CrossRef]
  45. Liu, C.; Li, H.; Zhang, Y.; Si, D.; Chen, Q. Evolution of microbial community along with increasing solid concentration during high-solids anaerobic digestion of sewage sludge. Bioresour. Technol. 2016, 216, 87–94. [Google Scholar] [CrossRef] [PubMed]
  46. Xia, Y.; Wang, Y.; Wang, Y.; Chin, F.Y.L.; Zhang, T. Cellular adhesiveness and cellulolytic capacity in Anaerolineae revealed by omics-based genome interpretation. Biotechnol. Biofuels 2016, 9, 111. [Google Scholar] [CrossRef]
  47. Kurth, J.M.; Op den Camp, H.J.M.; Welte, C.U. Several ways one goal—Methanogenesis from unconventional substrates. Appl. Microbiol. Biotechnol. 2020, 104, 6839–6854. [Google Scholar] [CrossRef]
  48. Conrad, R. Importance of hydrogenotrophic, aceticlastic and methylotrophic methanogenesis for methane production in terrestrial, aquatic and other anoxic environments: A mini review. Pedosphere 2020, 30, 25–39. [Google Scholar] [CrossRef]
Figure 1. Methane production at different TS proportions. (a) Cumulative methane production; (b) daily methane production.
Processes 13 02332 g001
Figure 2. Changes in pH at different TS proportions.
Processes 13 02332 g002
Figure 3. Variation of TAN with different TS proportions.
Processes 13 02332 g003
Figure 4. VFAs and their compositional changes at different TS proportions.
Processes 13 02332 g004
Figure 5. Correlations between methane production and stability parameters at different TS proportions.
Processes 13 02332 g005
Figure 6. Variation of SCOD at different TS proportions.
Processes 13 02332 g006
Figure 7. Variation of SPS at different TS proportions.
Processes 13 02332 g007
Figure 8. Variation of SPN at different TS proportions.
Processes 13 02332 g008
Figure 9. Variation of gate level bacteria at different TS proportions.
Processes 13 02332 g009
Figure 10. Variation of Archaea at different TS proportions.
Processes 13 02332 g010
Table 1. Main properties of inoculation sludge and kitchen waste.
ParametersInoculation SludgeKitchen WasteMixture
TS (%)24.7352.325.41
VS (%)8.7551.811.36
VS/TS (%)35.3999.0444.7
pH8.465.028.14
TAN/(mg/L)1589.76-2332.89
SCOD/(mg/L)8202.5-9452.5
SPN/(mg/L)1580.29-1951.62
SPS/(mg/L)1309.03-1834.22
Disclaimer/Publisher’s Note: The statements, opinions and data contained in all publications are solely those of the individual author(s) and contributor(s) and not of MDPI and/or the editor(s). MDPI and/or the editor(s) disclaim responsibility for any injury to people or property resulting from any ideas, methods, instructions or products referred to in the content.

