Abstract
This study examines the effects of polyester and denim microfibers (MFs) on aerobic granular sludge (AGS) over a 42-day period. Treatment performance, granulation, and microbial community changes were assessed at 0, 10, 70, 210, and 1500 MFs/L. Reactors with 70 MFs/L achieved rapid granulation and showed improved settling by day 9, while 0 and 10 MFs/L reactors showed delayed granule formation, which was likely due to limited nucleation and weaker shear conditions. Severe clogging and frequent maintenance occurred at 1500 MFs/L. Despite > 98% MF removal in all reactors, treatment performance declined at higher MF loads. Nitrogen removal dropped from 93% to 68%. Phosphate removal slightly increased in reactors with no or low microfiber loads (96–99%), declined in reactors with 70 or 210 MFs/L (92–91%, 89–88%), and dropped significantly in the reactor with1500 MFs/L (86–70%, p < 0.05). COD removal declined with increasing MF load. Paracoccus (denitrifiers) dominated low-MF reactors; Acinetobacter (associated with complex organic degradation) and Nitrospira (nitrite-oxidizing genus) were enriched at 1500 MFs/L. Performance decline likely stemmed from nutrient transport blockage and toxic leachates, highlighting the potential threat of MFs to wastewater treatment and the need for upstream MF control.
1. Introduction
Anthropogenic microfibers (MFs), are prevalent and persistent contaminants in wastewater treatment systems. They are long, slender, and threadlike strands with a consistent width throughout their entire length, typically measuring less than 5 mm [1,2,3]. They originate largely from synthetic and natural textiles that are released into wastewater systems through activities like household laundry. Due to their small sizes, MFs can bypass pretreatment barriers and enter the downstream treatment processes [4,5,6,7,8], leading to a significant enrichment in treated wastewater and sewage sludge [9,10,11]. Recent findings show that more than 50 million microplastic (MP) particles may routinely be discharged in wastewater treatment plant (WWTP) effluents, with fibers being the most dominant form, accounting for approximately 59% of the particles analyzed [12]. Their prevalence is influenced by factors such as wastewater sources (municipal vs. industrial) and the treatment technologies employed. For instance, textile industry WWTPs have higher influent concentrations of MFs compared to municipal WWTPs [11,13].
Microfibers pose ecological and health risks by containing, adsorbing, transporting, and releasing harmful contaminants such as endocrine disruptors and bacterial pathogens [14,15], yet their impact on wastewater treatment systems themselves remain poorly understood. Among the various MFs, denim and polyester fibers are the most prevalent particles in wastewater [16,17].
Denim jeans made from cotton, polyester, lyocell, and polyurethane are widely worn globally [18,19], with 46–76% of Canadians and Americans wearing them daily and 450 million pairs being sold annually in the U.S. [20,21]. Washing jeans releases MFs into wastewater, with a single pair of jeans shedding up to 560,000 MFs per wash [22]. In Canada alone, laundering jeans releases 130 million MFs annually, while Canadian and American households discharge 533 million MFs annually, equivalent to 22 kilotonnes of MFs entering wastewater [22,23]. Polyester, which accounts for 49% of global clothing production [24,25,26], is expected to reach a production volume of 84 million metric tonnes by 2025 [24,27]. A single garment washed domestically can release over 1900 fibers, with polyester-based clothing being the primary source of microfiber release [28]. Congruently, polyester MFs are the dominant MF found in effluents from commercial washing machines [17].
Conventional and industrial WWTPs are not designed to remove microplastics, making them both for and sources of environmental microplastic contamination [8,29]. Although some microplastics are removed during pretreatment, up to 50% can reach the biological treatment stages, where they can interfere with microbial processes [30]. Even in systems achieving high removal rates (e.g., membrane bioreactors (MBRs) with efficiencies up to 99.9%, dissolved air flotation (DAF) at ~97%, and rapid sand filtration (RSF) at ~95%), microplastics, including MFs, can still persist in effluents [13]. In addition, a significant portion, often over 80% of the influent concentration, is retained in sludge and potentially redistributed through land-applied biosolids [13,30,31,32]. Within wastewater treatment systems, growing evidence shows that microplastics can disrupt floc formation and inhibit key microbial groups involved in nitrification and denitrification, ultimately compromising treatment performance and stability [8,30].
The potential effects of microplastics on wastewater treatment depend on their type, concentration, and the reactor system involved. For example, previous research has shown that low concentrations of polyethylene terephthalate (PET) microplastics had no impact on chemical oxygen demand (COD) removal and only slightly inhibited total nitrogen (TN) removal in an MBR (membrane bioreactor), while higher PET concentrations (75–300 particles/L) led to COD inhibition and reduced methane production in an upflow anaerobic sludge blanket (UASB) reactor [33,34]. Similarly, polyamides (PA66) at concentrations of 0.1–0.5 g/L was reported to inhibit ammonia removal and to slightly affect COD and TN removals in an aerobic granular sludge (AGS) system [35]. Interestingly, the microbial community in the AGS system adapted over time, resulting in a recovery and eventual improvement of both ammonia and TN removal efficiency in the system [35]. These results indicated, that AGS might be resilient to potential toxic effects from microplastic contamination in wastewater.
The reported resilience of AGS to microplastic impacts on wastewater treatment effectiveness is consistent with previous reports on AGS performance that reported high settling performance, simultaneous nitrogen and phosphorus removal, and resistance to a variety of toxins [36,37]. The treatment efficiency and resilience of AGS in comparison to conventional activated sludge systems, is rooted in its compact granule structure that supports high microbial activity and diversity [38,39]. Despite these encouraging findings for AGS application in the presence of ubiquitous microplastic contamination, the extent–and limits–of this resilience are not well understood.
For example, previous research on polyethylene (PE) microplastics in an AGS system reduced the relative abundance of Proteobacteria, which are key denitrifying organisms in AGS [8]. Similarly, the number of Bacteroidetes, which are associated with microbial immunity, also declined, suggesting a potential reduction in the system’s resistance to environmental toxicity [40]. Furthermore, prolonged exposure to bisphenol A (BPA) weakened the activity of heterotrophic and nitrifying bacteria, resulting in the reduced removal of COD and ammonia in AGS systems [8,41]. These findings highlight a critical knowledge gap in understanding how microplastics and their associated additives interact with AGS and affect its long-term treatment performance.
Another important knowledge gap lies in the focus of previous research on the potential impact of spherical microplastic particles [33] on AGS systems. Conversely, MFs remain a highly abundant yet underexplored form of microplastics. Given their prevalence in wastewater and wastewater treatment systems, understanding their interactions with biological systems is critical for advanced technologies like AGS. In this research, we investigated the impacts and fate of polyester and denim MFs on AGS-based treatment systems. The objectives of this work were to (1) assess the effects of increasing MF concentrations on granule formation and settling properties; (2) evaluate their impact on the removal of organic matter and nutrients, particularly with respect to key nitrifying and denitrifying organisms; and (3) examine changes in microbial community structure and dynamics in response to MF exposure. The results enable us to assess AGS performance under realistic loading scenarios and identify its potential vulnerabilities and adaptive responses to MF pollution.
2. Materials and Methods
2.1. Sources and Fiber Concentrations
The denim fibers, averaging 4 mm in size, were procured from levis.com in Canada, while the polyester fibers were obtained from the Fabric Land Home Decor Centre in Ontario, Canada. These fibers were precision-cut to 4 mm in length using needles, Fiskars scissors, and fabric cutters. Influent concentrations of 10, 70, 210, and 1500 microfibers/ liter (MFs/L) were chosen, as they represented the minimum, median, triple of the median, and 95th percentile concentration of microplastics in the influents of WWTPs globally from an extensive literature review covering 31 peer-reviewed journal articles (Supplementary Table S1).
2.2. Reactor Configuration and Experimental Setup
The experimental study employed five polyvinyl chloride bubble column sequencing batch reactors (SBR), one for each of the tested MF concentrations (SBR-0, SBR-10, SBR-70, SBR-210, and SBR-1500), with a uniform configuration: 70 cm in height, 1.38 L total volume, and 5 cm internal diameter. The reactors operated at a height-to-diameter ratio (H/D) of 12.2 and a working volume of 1.2 L. Aeration was provided by fine bubble diffusers at the reactor bottom, with airflow regulated at 3 L min, resulting in a superficial air velocity of 2.55 cm/s. Each reactor ran for 42 days. The experiments were conducted at ambient temperatures (22–25 °C) in the laboratory, with no external pH control and with dissolved oxygen maintained above 2 mg/L.
Feeding influents into and discharging treated effluents out of the reactors was achieved with the aid of peristaltic pumps. The feeding port of the reactors was located at the bottom of each reactor, while the decant ports were located at the midpoint of each reactor, leading to a volumetric exchange ratio (VER) of 50%. The reactors were operated sequentially on a 4-h cycle. The sequential operation included influent filling (40 min), aeration (140 min), settling (30 min), effluent decanting (20 min), and idle time (10 min). A schematic diagram of the AGS reactor setup is shown in Figure 1. Throughout the duration of the experimental study, influent filling, aeration, treated effluent discharge, and idle values remained constant.
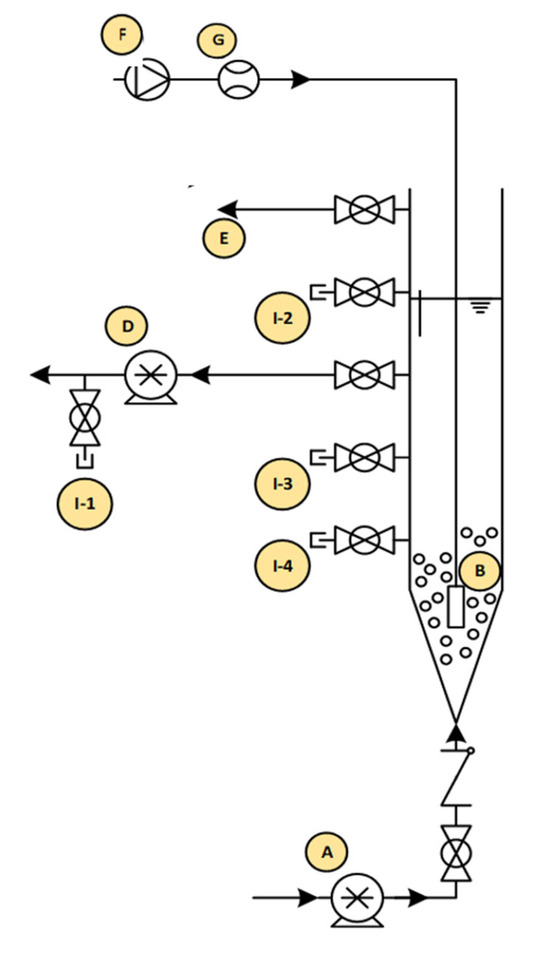
Figure 1.
Schematic of the AGS reactor setup: (A) feed pump, (B) air diffuser, (C) pH probe, (D) decant pump, (G) air pump, (H) flow meter, (I-1) effluent sample port, (I-2-3) spare sample ports, and (1-4) sludge sample port.
2.3. Seed Sludge and Feed Wastewater
Return-activated sludge (RAS) from the Ashbridge’s Bay WWTP in Toronto, Ontario, Canada was used to inoculate the SBRs. Synthetic wastewater as the feed was prepared based on a study by Tay et al. (2003) [42] with slight modifications. In brief, sodium acetate was used as the carbon source, NH4Cl as the nitrogen source, and monobasic and dibasic phosphorus (K2HPO4 and KH2PO4) as the phosphorus sources. A chemical oxygen demand: nitrogen: phosphorus (COD:N:P) ratio of 100:4.5:0.45 was used, with a sodium acetate anhydrous concentration of 1.92 g/L (COD of 1500 g/L), a NH4Cl concentration of 0.26 g/L, and K2HPO4 and KH2PO4 concentrations of 0.023 g/L and 0.015 g/L, respectively. The pH of the wastewater ranged from 7 to 8.05 without any external manipulation.
2.4. Wastewater Characterization and Microfiber Analysis
The biomass and wastewater characteristics of the influents and effluents, such as mixed-liquor suspended solids (MLSS), mixed-liquor volatile suspended solids (MLVSS), total suspended solids (TSS), volatile suspended solids (VSS), and sludge volume index (SVI), were determined according to the Standard Methods for the Examination of Water and Wastewater (APHA/AWWA/WEF, 2012) [43].
MLSS and MLVSS were measured according to Standard Methods 2540 D and 2540 E [43]. A well-mixed sample was filtered through a pre-weighed 47 mm glass fiber filter (Whatman GF/C, ~1.2 µm). The filter and retained solids were dried at 103–105 °C to determine the MLSS, then they were ignited at 550 °C to determine the MLVSS as the volatile fraction. All effluent samples were filtered using 0.45 µm Acrodisc® sterile syringe filters with Supor ® polyethersulfone membranes (Pall Laboratory, Port Washington, NY, USA). Soluble chemical demand (sCOD) was determined using the USEPA reactor digestion method with a COD HR HACH kit (HACH Company, Loveland, CO, USA), also supplied by VWR International (Mississauga, ON, Canada). Digestion was conducted using a DRB 200 reactor (HACH Company, Loveland, CO, USA). A DR 3900 laboratory spectrophotometer (HACH Company, Loveland, CO, USA) was used to analyze sCOD, TN, reactive phosphorus (P and PO43−) and ammonia concentrations using HACH reagent kits, as follows: the salicylate method (Method 10031) for NH3, the persulfate digestion method (Method 10071) for TN, and the molybdovanadate method (Method 8114) for reactive phosphorus.
MFs with an average size of 4 mm were dosed daily into the influent wastewater of the SBRs for the duration of the experiment at concentrations of 0 MFs/L, 10 MFs/L, 70 MFs/L, 210 MFs/L, and 1500 MFs/L with equal amounts of polyester MFs and denim MFs. Fiber amounts were determined based on a five-point calibration curve, including 0, 50, 500, 2000, and 8000 dry and wet fibers (Supplementary Figure S1). The MFs were analyzed visually and with the aid of a DM1000 LED microscope (Leica Microsystems, Wetzlar, Hesse, Germany). A subset of fibers was further characterized chemically to confirm polymer type using an 8700 Laser Direct Infrared (LDIR) chemical imaging system (Agilent Technologies, Santa Clara, CA, USA). This is in line with previous research, which encourages chemical analysis after visual identification [44]. Biomass samples were collected weekly from the lowest sample port of each reactor and the granule structure and morphology were analyzed using the Leica DM1000 LED microscope.
2.5. Microbial Community Analysis
The granules and biofilms (biomass attached to MFs) were processed for genomic DNA extraction using a previously published method [45]. Briefly, the MFs were picked from the granular sludge with forceps. The MFs were rinsed in deionized water to remove loosely bound granular sludge from the biofilms. The biomass samples were centrifuged at 8000 rpm for five minutes, after careful separation of the MFs and granular sludge. The supernatant was discarded, and the pellet was stored at −80 °C until further processing. DNA extractions were conducted with the DNeasy PowerSoil Pro Kit (QIAGEN, Germantown, MD, USA) in conjunction with Qiagen’s QIAcube instrument, adhering rigorously to the manufacturer’s provided protocols [46]. An MBI nanophotometer was used to accurately quantify genomic DNA. Microbial community structure was determined by 16S rRNA high-throughput sequencing (Illumina MiSeq-PE250, San Diego, CA, USA), conducted at Génome Québec (Montreal, QC, Canada). The V3–V4 region of the 16S rRNA gene was amplified using the primers 347F (GGAGGCAGCAGTRRGGAAT) and 803R (CTACCRGGGTATCTAATCC). Equimolar concentrations of genomic DNA were used for sequencing. The forward and reverse sequences were merged, and low-quality sequences were removed using the DADA2 software (v1.26) [47]. The sequences were analyzed using Microbiome Analyst (v2.0) to estimate the relative abundance of microbial communities and alpha diversity analyses [48]. The 16S rRNA gene sequencing data can be accessed from the National Library of Medicine, in the National Center for Biotechnology Information.
The Shannon diversity index value, indicating the richness and abundance of species in the AGS samples, was calculated by taking an average of the relative abundance of 3 technical replicates for each of the 5 reactors [49].
2.6. Quality Assurance
Numerous steps were taken to avoid contamination of the samples throughout the sample processing and analysis. All laboratory surfaces were thoroughly wiped with 70% ethanol three times before use. During sampling, cotton laboratory coats and nitrile gloves were worn to decrease contamination. All bottles, buckets, covers, and containers used were covered whenever possible. All the containers used were thoroughly washed with bleach and then rinsed with hot water and distilled water three times. Any filter used in the experiments was microscopically examined to ensure that there were no fibers on it before use. Before performing MLSS and TSS tests, aluminum dishes and filters were heated in the incinerator for 15 min to incinerate any impurities that were present and immediately stored in a tightly closed desiccator to prevent atmospheric contamination. Brightly colored fibers were used for ease of identification (red and yellow) and to prevent the fibers from getting lost within the biomass. All tests were performed in duplicate. The fibers were stored in tightly closed glass bottles with aluminum covers to prevent atmospheric contamination. Three blank control samples were tested to evaluate potential atmospheric laboratory contamination with MFs. These blanks contained none of the tested MFs. Direct filtration was applied where possible to minimize transfer and to reduce the risk of MF loss. Closed or semi-closed systems prevented MF loss through air or evaporation. Equipment and surfaces were rinsed with deionized water to recover any adhering MFs. Sampling occurred in a controlled environment with minimal airflow. Finally, the polymer type of the tested fibers was confirmed using an Agilent Technology 8700 LDIR (Agilent Technology, Santa Clara, CA, USA). For microbial analysis, low-quality sequences and chimera sequences were removed from the downstream analyses.
2.7. Data Analysis
Statistical analyses were conducted using Microsoft Excel. To assess the significant differences between reactors, Student’s t-tests were performed. Pearson correlation was employed to examine the correlations between fiber concentration and removal efficiencies, as well as between runtime and removal efficiencies. The significance level was set at p < 0.05. Normality was checked using a quantile plot.
3. Results and Discussion
3.1. Inhibitory Effect of Microfibers on COD, TN, NH3, and PO43− Removal Efficiency
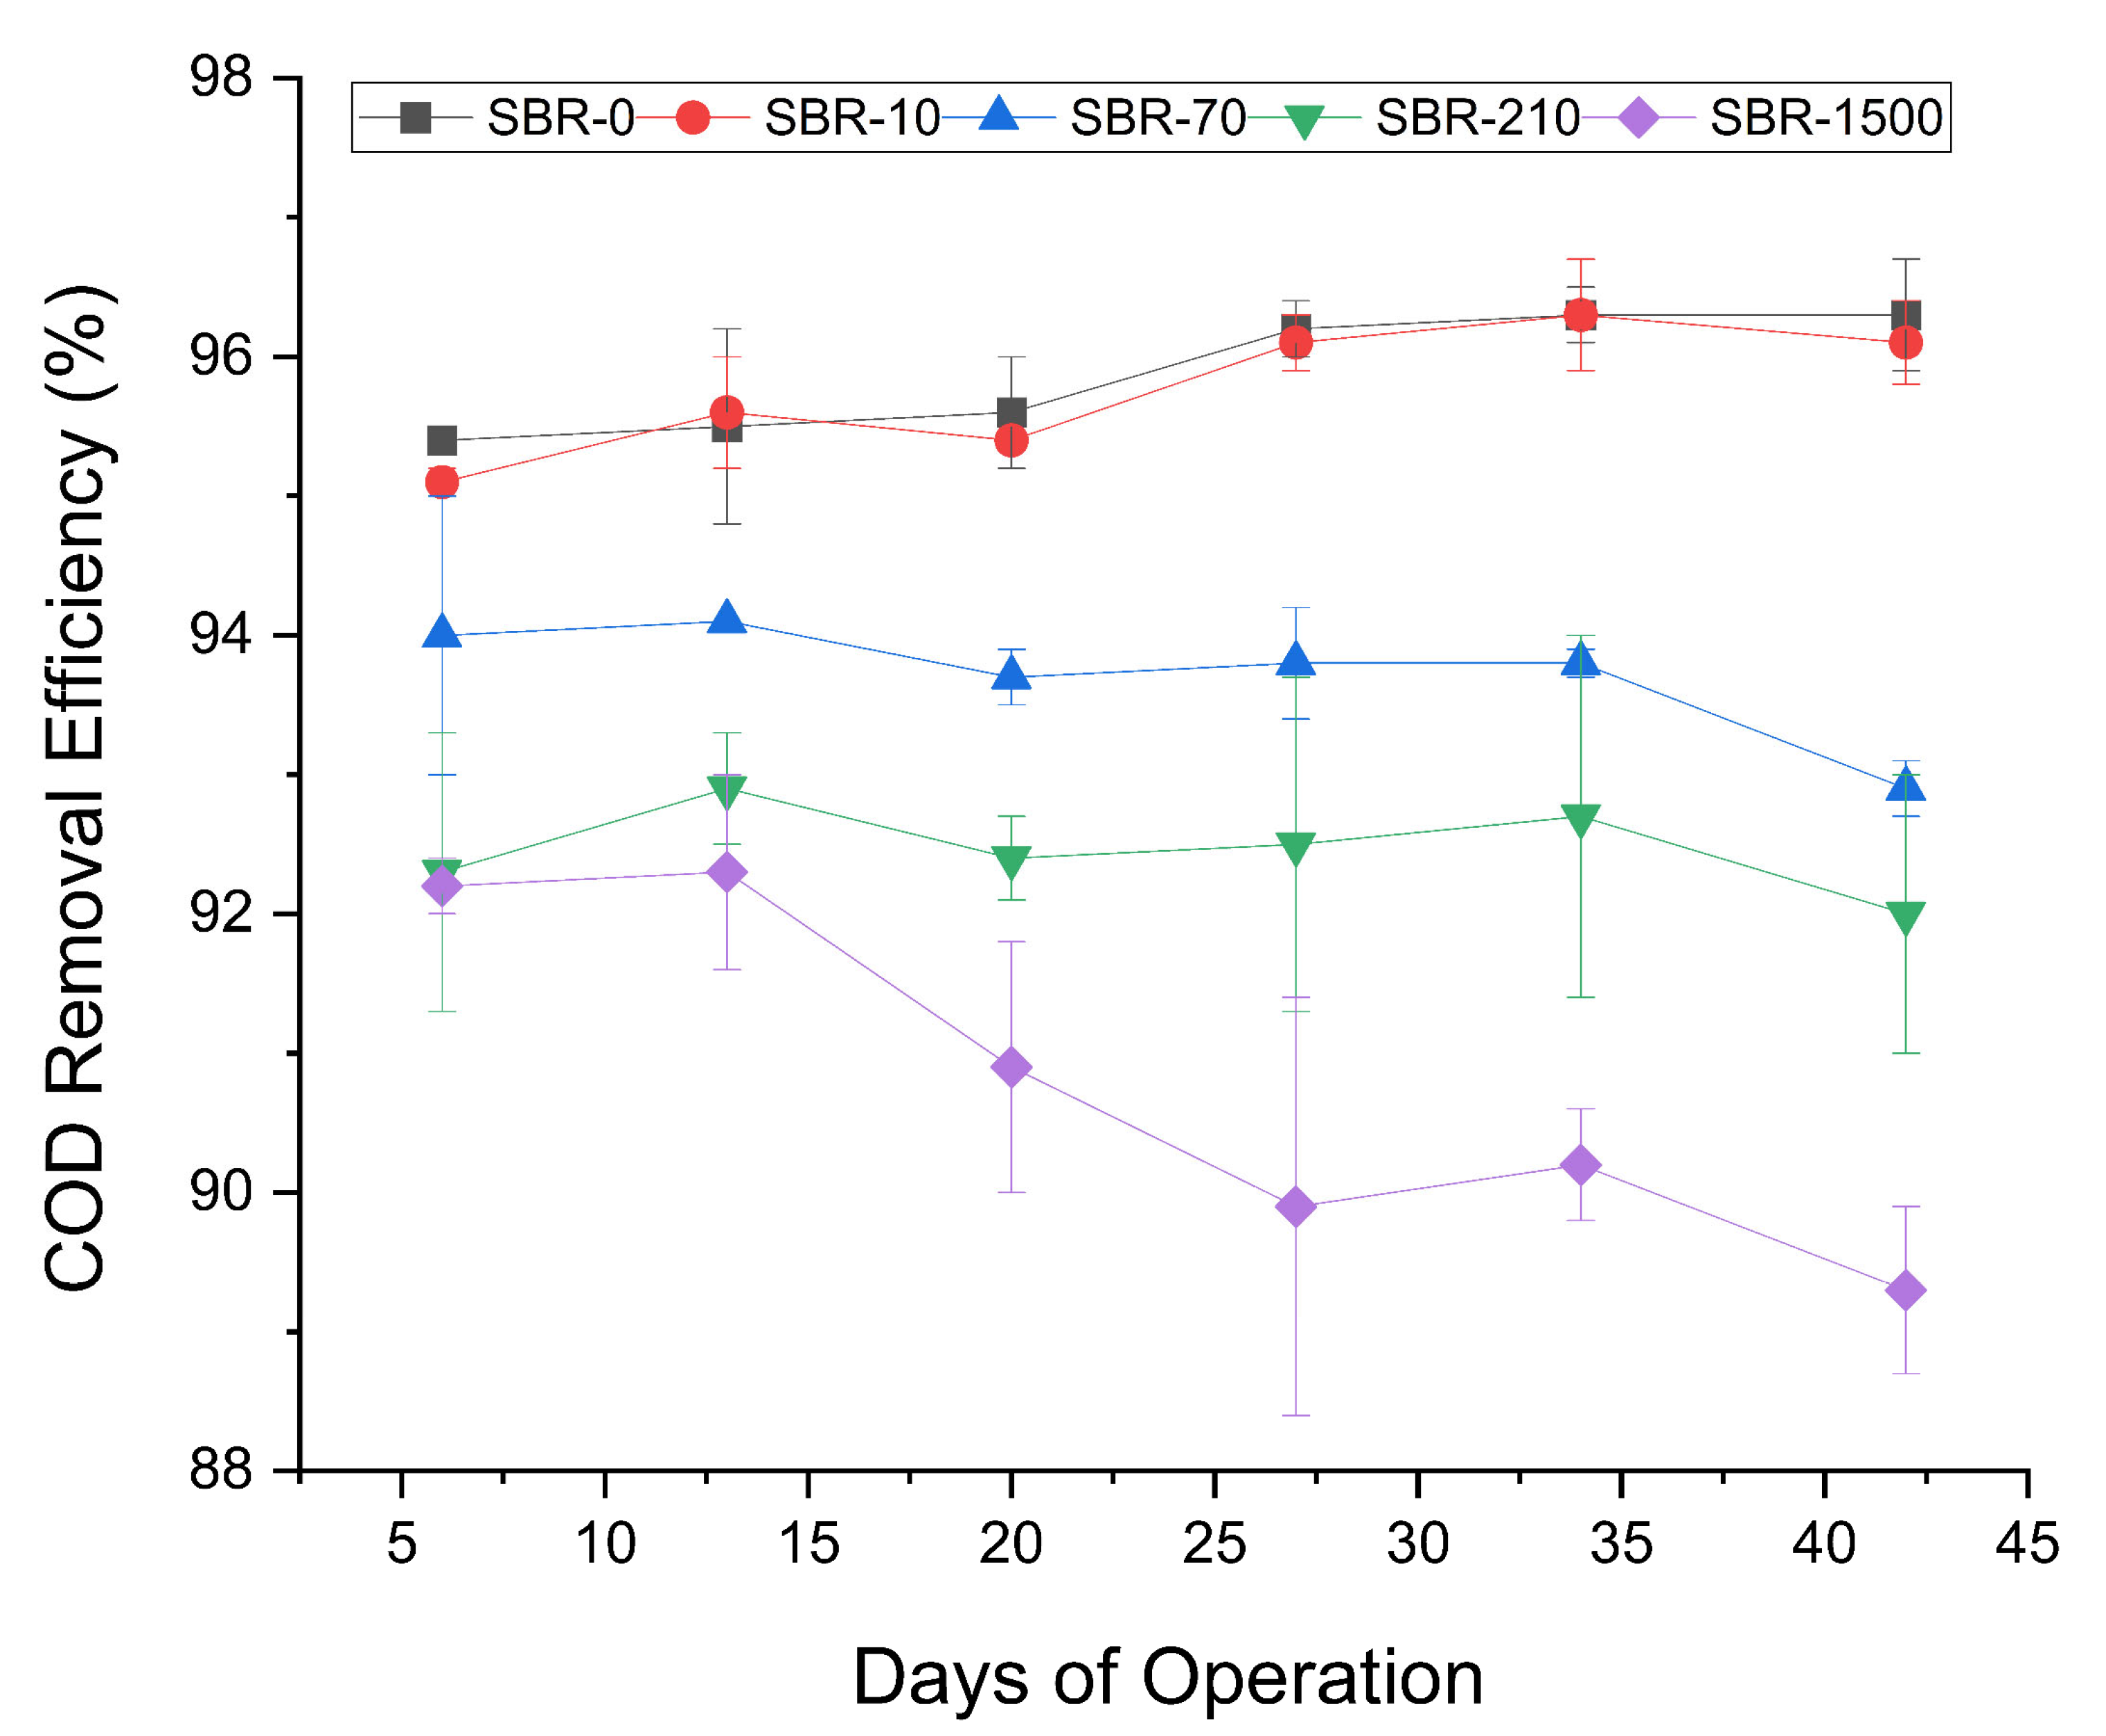
The COD removal efficiencies of the control reactor SBR-0 and the reactor with the lowest amount of MFs, (SBR-10), were high and remained consistent throughout the experiment (Figure 2), with an average removal rate of 96% ± 0.3 and 96% ± 0.2, respectively. The remaining three reactors showed slightly decreasing COD removal rates, with SBR-70 decreasing from 94–93%, SBR-210 from 92.3–92%, and SBR-1500 from 92–89% (Figure 2). Despite the overall low decrease in COD removal, the consistent temporal and fiber concentration-dependent effect led us to infer that a high concentration of denim and polyester MFs had a certain inhibitory effect on COD removal. These results were consistent with the inhibitory effects on COD removal reported by previous research on the effect of up to 0.5 g/L polyamide microplastics on AGS, wherein COD removal declined from 89% to 85% [35]. Likewise, the exposure of AGS to 75–300 MP/L of PET microplastics was previously reported to decrease the COD removal efficiency from 89.9% to 60.5% [33]. The reduction of COD removal could be due to the obstruction of nutrient transport channels within AGS, at high microplastic concentrations. Such a blockage could limit the diffusion of oxygen and the nutrients necessary for microbial activity [50].
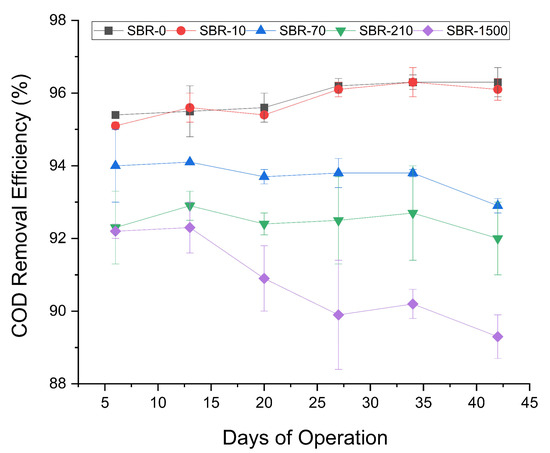
Figure 2.
Profile of COD removal efficiencies for SBR-0, SBR-10, SBR-70, SBR-210, and SBR-1500.
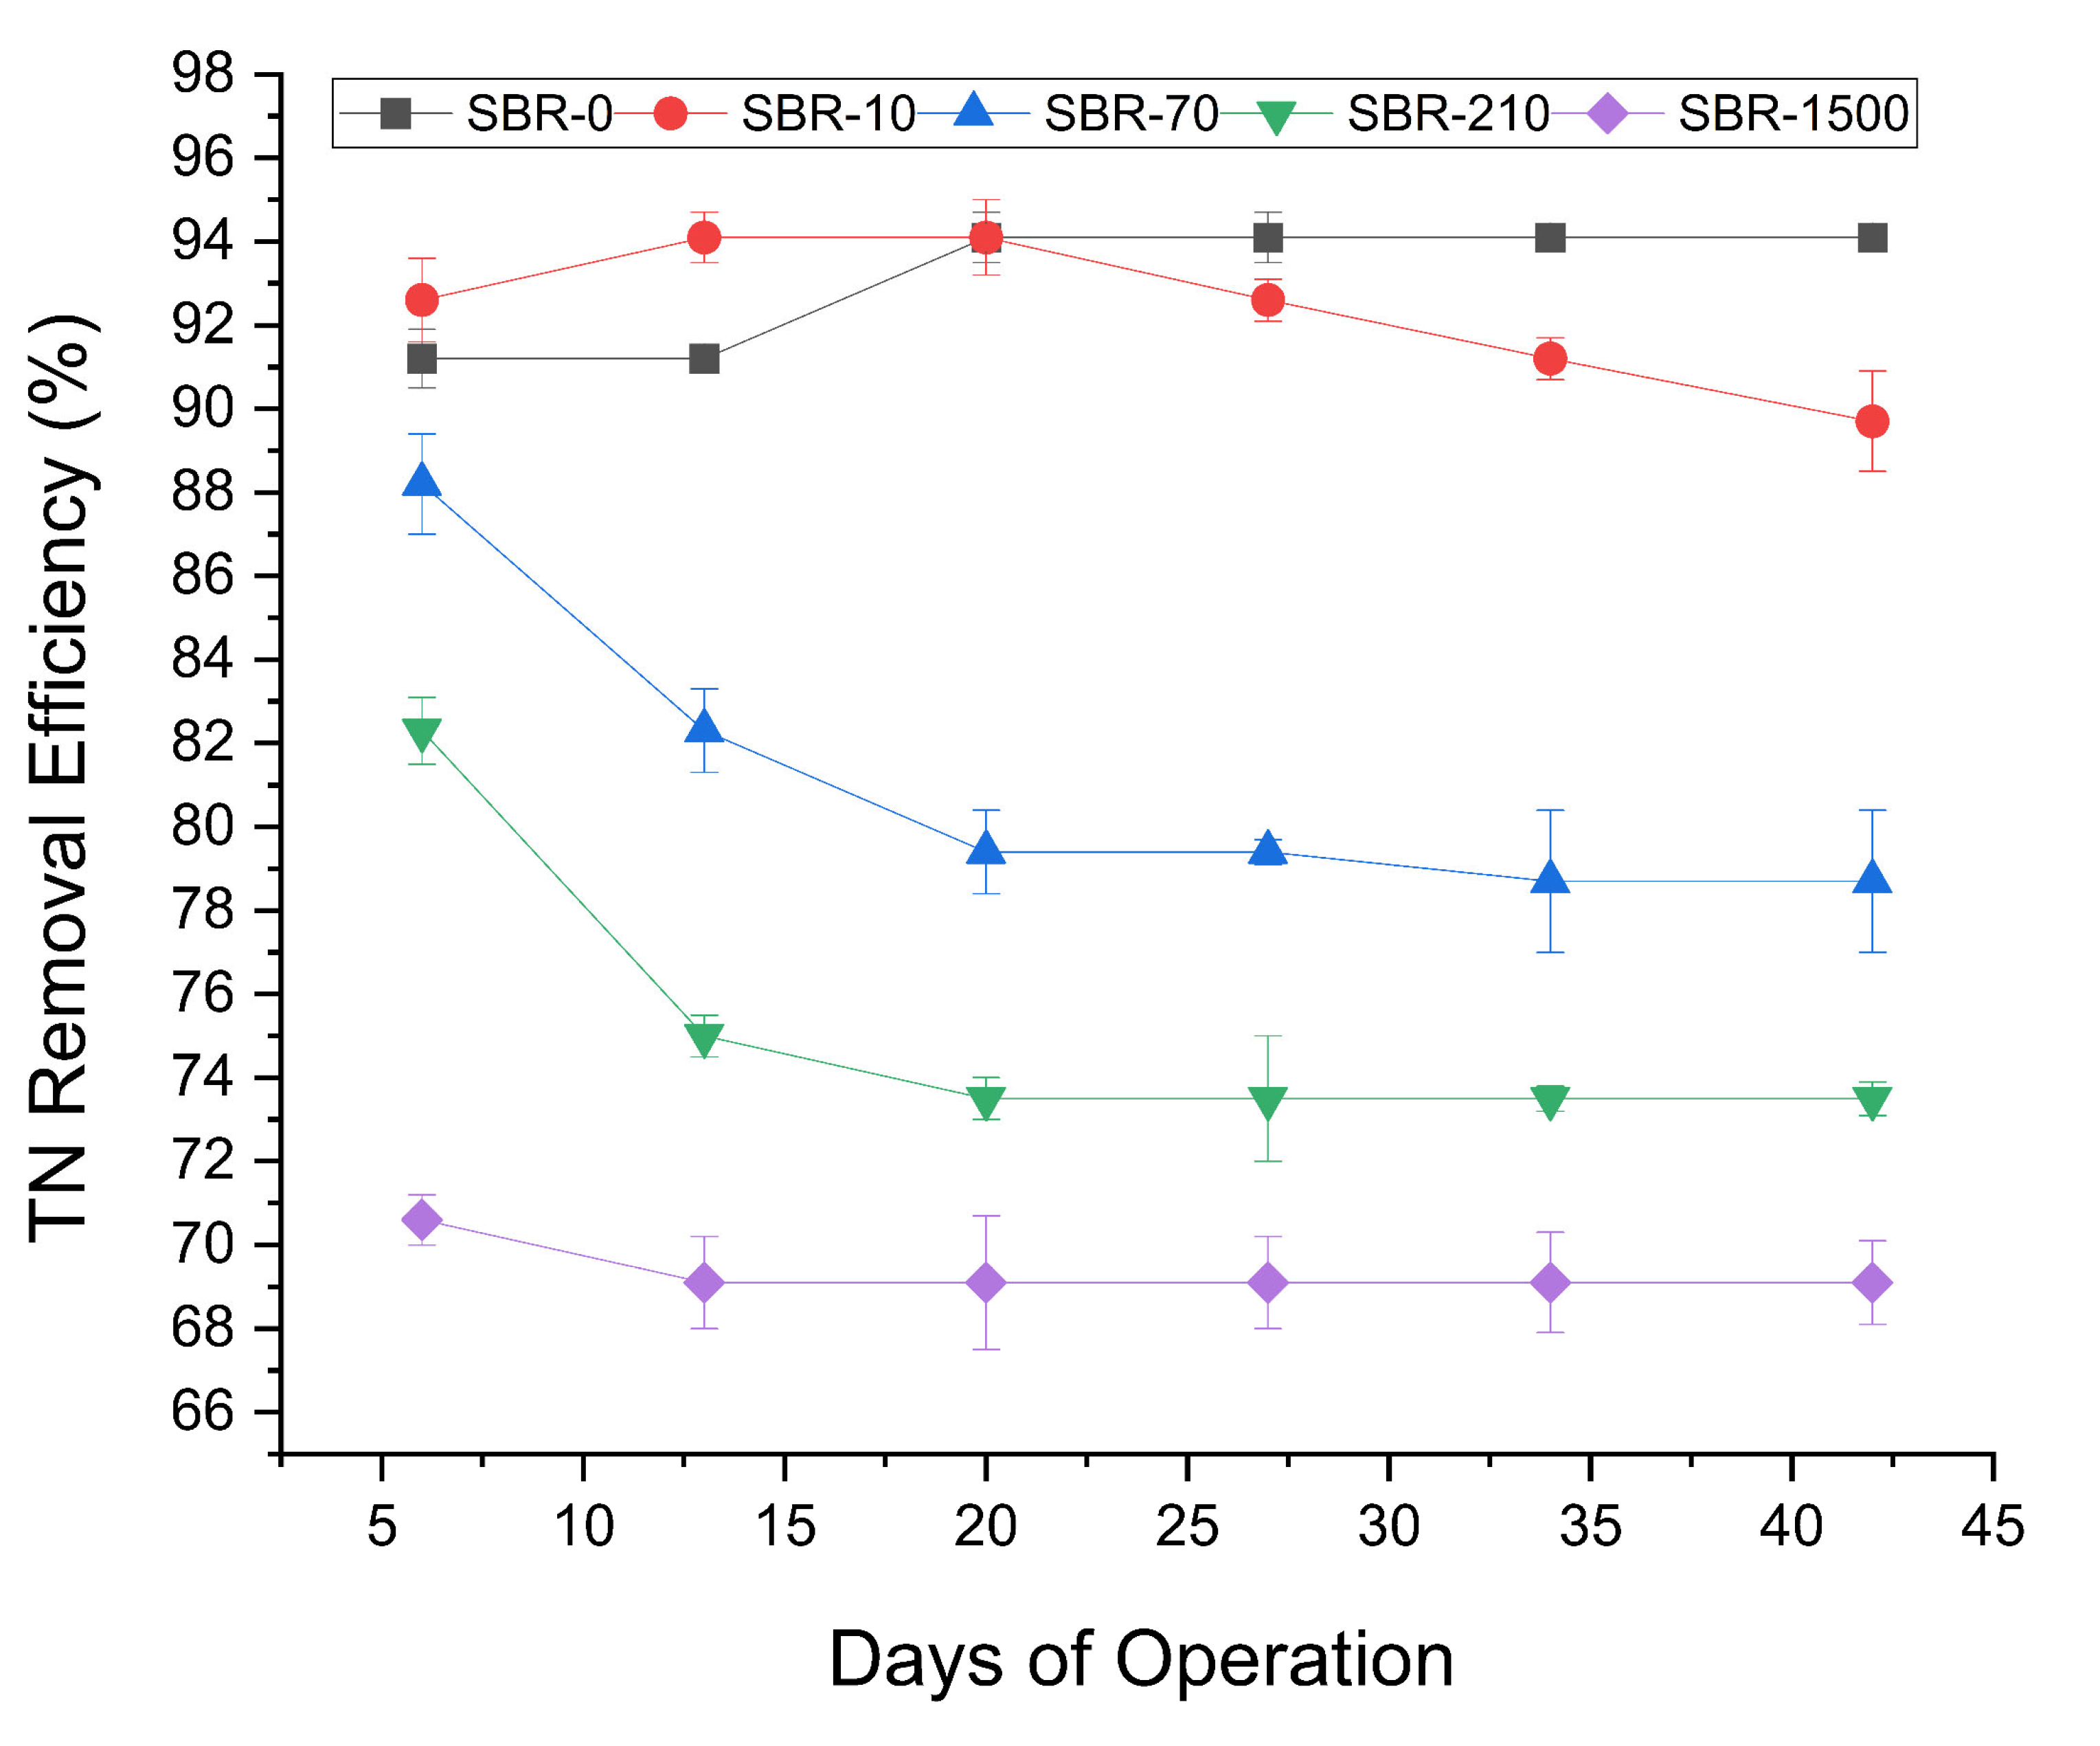
TN removal efficiency fluctuated in all five reactors during the early stages of operation but later stabilized (Figure 3). The highest average TN removal was observed in SBR-0 and SBR-10 (94% and 90%, respectively). After day 20, TN removal in SBR-10 began to decline to 91%, while SBR-0 remained stable at 94%. Conversely, Average TN removal decreased substantially in the reactors with higher MF concentrations, with average TN removal efficiencies across increasing MF concentrations (SBR-0 to SBR-1500) of 93%, 93%, 81%, 75%, and 68%, respectively. The statistically significant decline in TN removal (Student’s t-test, p < 0.05) in reactors with MF concentrations above 70 MF/L compared to the control, as well as the negative correlation between increasing MF concentrations and TN removal (Pearson R = −0.79), highlighting the adverse impact of elevated MF loads. A previous AGS study reported similar trends, wherein 200 MP/L of polyethylene microplastics reduced TN removal from 83% to 73% [37]. Interestingly, the ammonia (NH3) removal remained consistently high (>95%) in all SBRs, suggesting that nitrification was unaffected despite the impact on TN removal. This decoupling from a decline in TN removal suggested the selective disruption of denitrification at higher MF concentrations. Likely causes include an altered biofilm structure, limited carbon availability, or potential inhibitory effects of leached plastic additives and dyes on denitrifiers. Although nitrate and nitrite were not measured—a limitation of this study—microbial analysis confirmed the presence of denitrifiers (e.g., Paracoccus), suggesting that denitrification occurred at least to some degree. Without intermediate nitrogen species data the extent and completeness of this process remain uncertain. Future work should include nitrate/nitrite profiling to clarify the impact of MFs on denitrification.
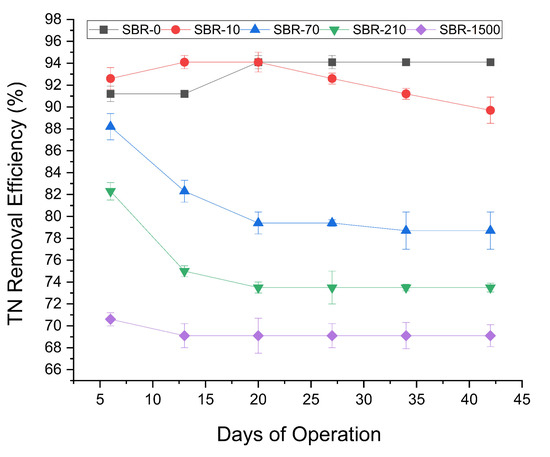
Figure 3.
Profile of TN removal efficiencies for SBR-0, SBR-10, SBR-70, SBR-210, and SBR-1500.
Nitrogen assimilation into biomass may have contributed to removal as well, particularly in the early stages. However, given the stable COD loading (Figure 2) and consistent nitrification performance (Figure 3), assimilation alone is unlikely to explain the removal of TN at low MF concentrations or the continued removal of ammonia even at high MF concentrations. These observations suggest that reduced TN removal efficiency is primarily due to disruptions in denitrification or other dissimilatory nitrogen pathways. This effect has not previously been reported and is an important indication of the potential toxic impacts of MFs on WWTPs, warranting further studies.
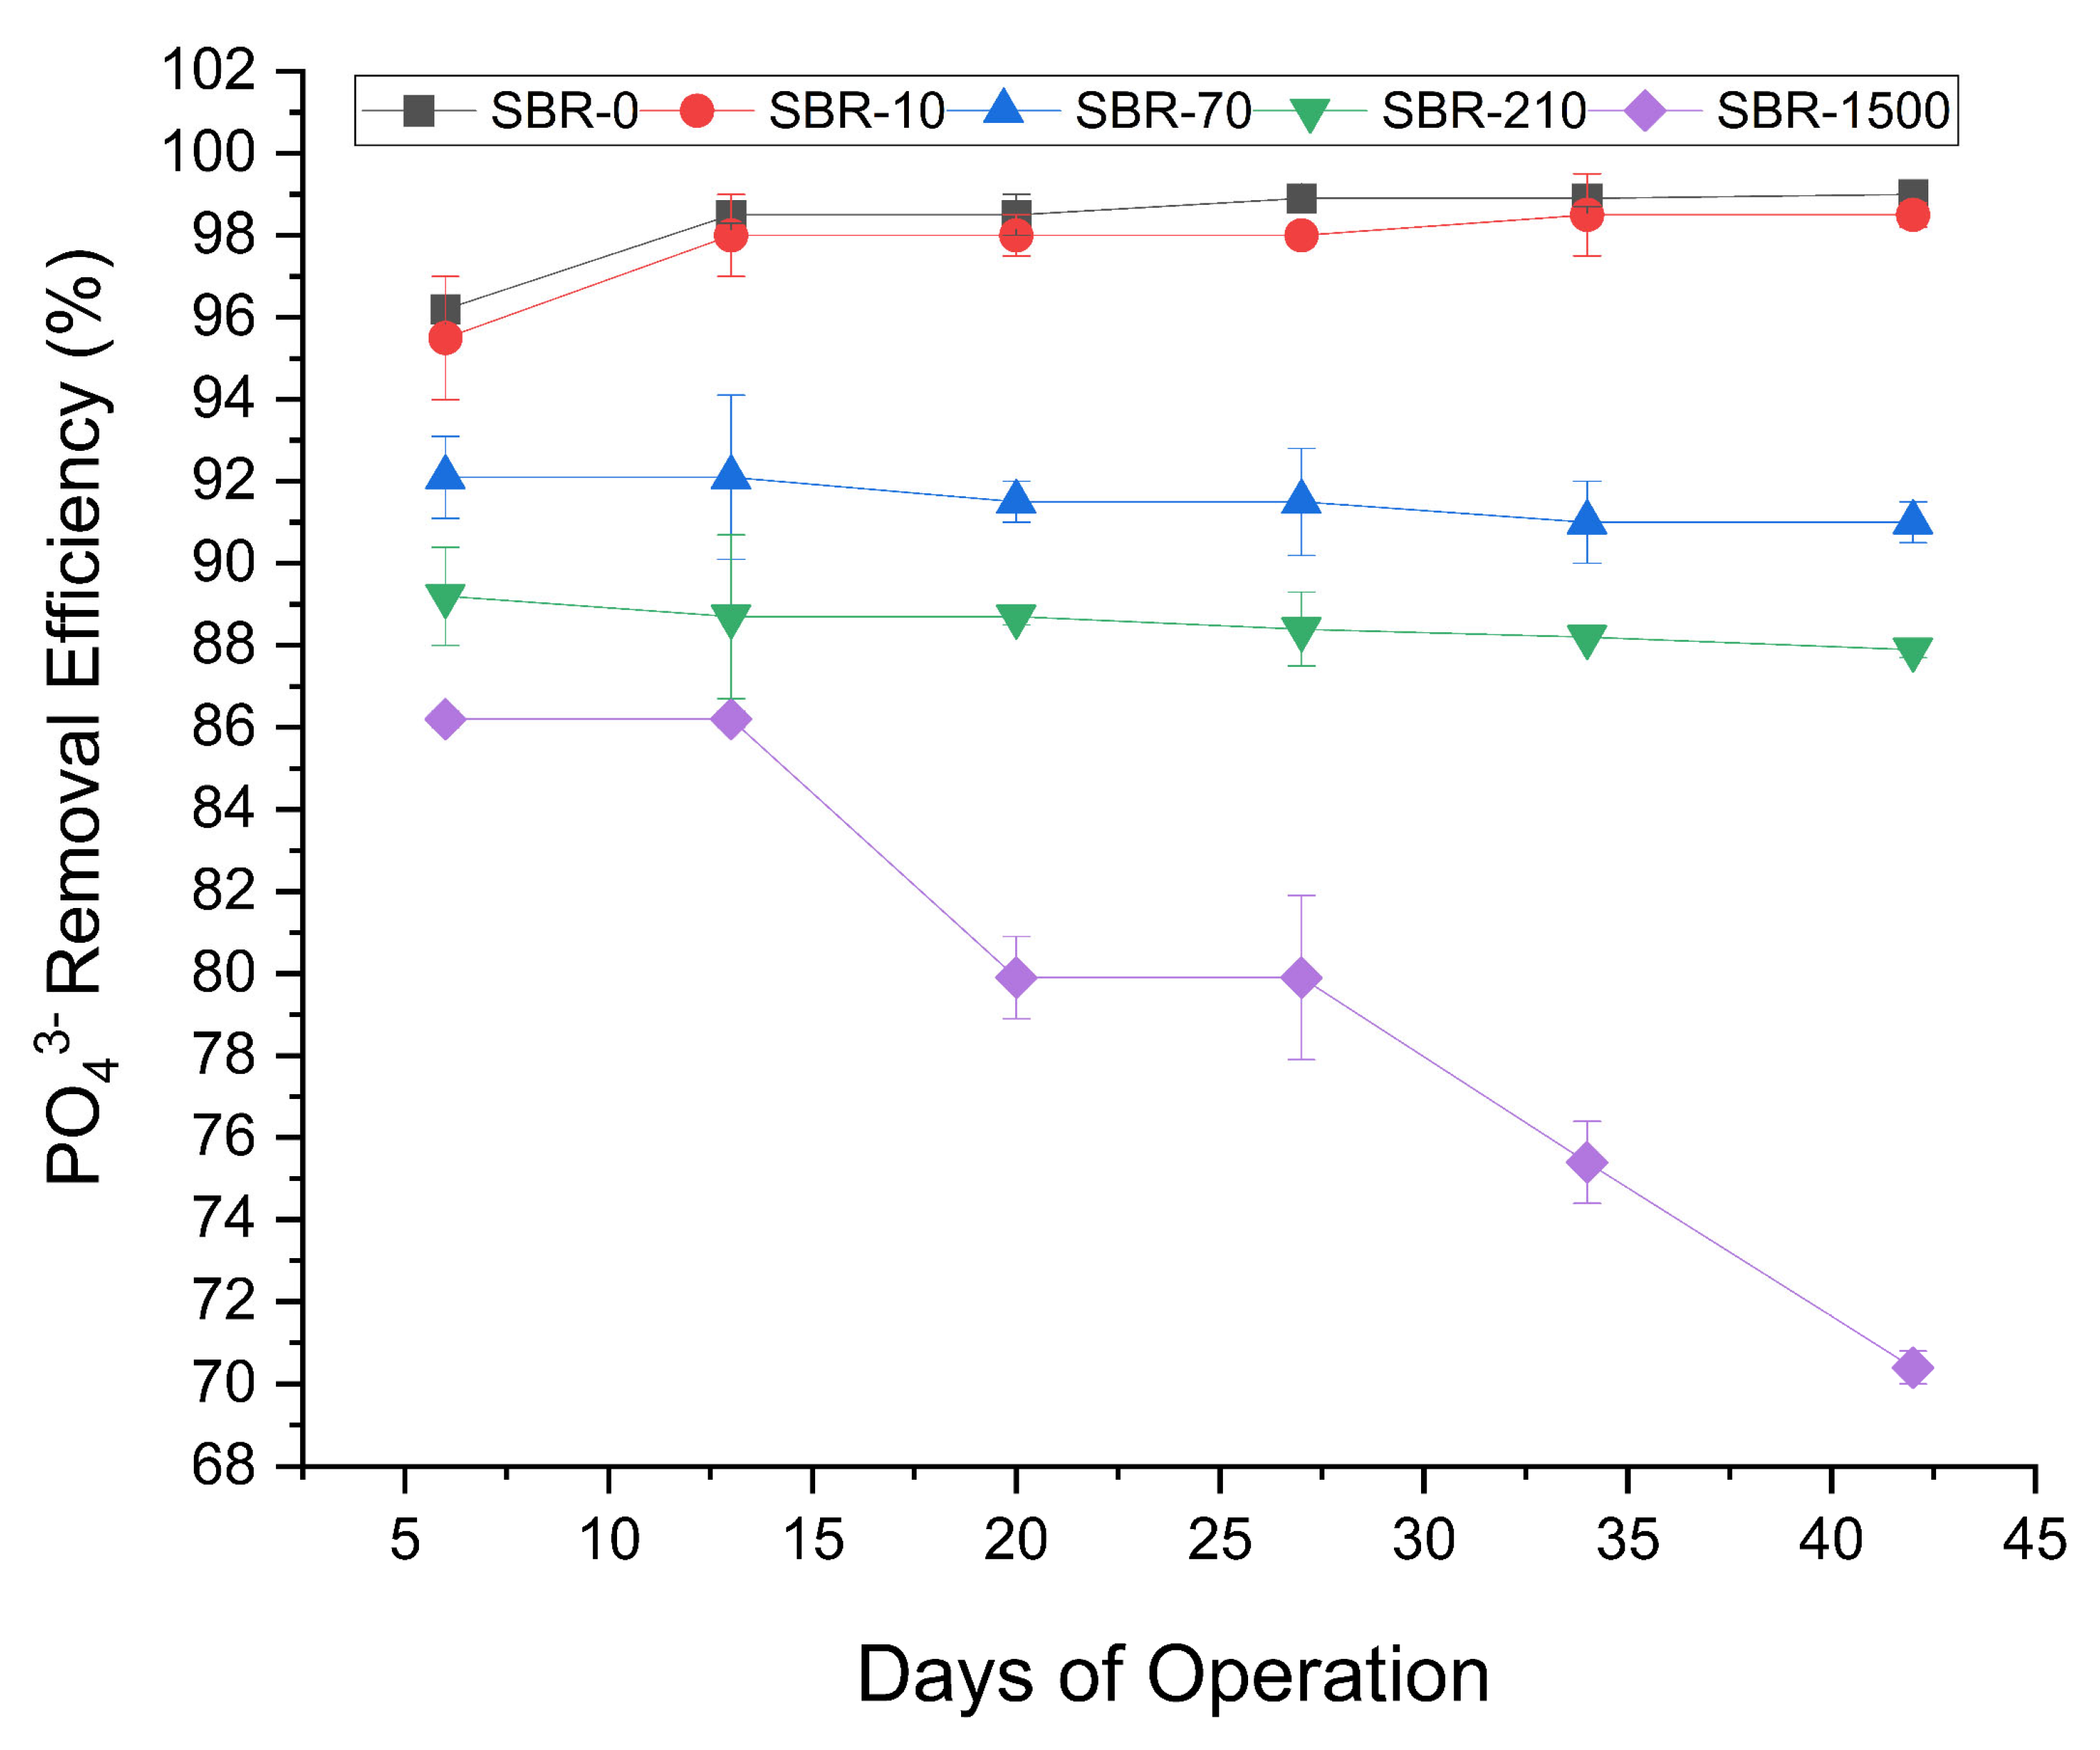
The phosphate removal profiles (Figure 4) across the five reactors showed three discernible trends: (1) the reactor with no fibers and that with low influent MF concentrations, namely, SBR-0 and SBR-10, exhibited a slight increase in PO43− removal, increasing from 96% to 99%; (2) the reactors with MF concentrations of 70 MFs/L and 210 MFs/L showed a marginal decline in PO43− removal, decreasing from 92% to 91% and 89% to 88%, respectively; and (3) most notably, the reactor dosed with the highest MF concentration of 1500 fibers/L exhibited a significant reduction in PO43− removal, declining from 86% to 70% (Student’s t-test, p < 0.05) showing the negative impact of MFs on the removal of phosphate from WWTPs (Figure 4). This was consistent with a previous study on PE microplastics in AGS, which likewise reported a significant inhibitory effect on the removal of total phosphate (74% to 62%) [40]. Similar to the decreased nitrogen removal, the decrease in phosphate removal rates might have been caused by MF toxicity, changes in biofilm structures, or due to physical barriers for the nutrient transport channels in AGS, making it difficult for nutrients like nitrogen and phosphate to be absorbed and processed by microbial communities [51]. The potential toxic effects of MFs could be explained by the release of plastic additives and dyes that are toxic to the microbes involved in nutrient removal. Previous research has shown that many toxic water-soluble plastic additives are released from microplastics once they are in contact with water [52]. Likewise, it has been reported that synthetic textile dyes can reduce dissolved oxygen in aquatic environments, which leads to anoxic conditions that are not suitable for many microbes [53].

Figure 4.
Profile of PO43− removal efficiencies for SBR-0, SBR-10, SBR-70, SBR-210, and SBR-1500.
3.2. Impact of MFs on the Granulation Process
In addition to the nutrient removal, MFs significantly influenced the formation of granules in this study (Student’s t-test, p ˂ 0.05). The reactors that operated at 0 or 10 MFs/L required more time for the formation of visible granular structures (see Figure 5, SBR-0 and SBR-10). By the sixth day, we noted the development of small aggregates, approximately 30 µm in size, which subsequently evolved into well-defined granules ranging from 48 to 140 µm in diameter by the ninth day (Figure 5) but required until day 28 to form fully matured granules. Reactors with elevated fiber concentrations, i.e., SBR-70, SBR-210, and SBR-1500, on the other hand, already showed mature granules after 10 days. By the 28th day, all reactors displayed stable and mature granules of different sizes, ranging from 210 µm in SBR-10 to 523 µm in SBR-1500. The microscopic observation highlighted that two types of granules were present in the reactors, one fluffy and irregular without definite cores, while the others had smooth margins and well-defined cores. On day 28, the reactors with high concentrations of MFs (70, 210, and 1500 MFs/L) displayed granules that mostly showed well-defined cores, while the control and SBR-10 reactors still showed some fluffy and irregular granules (Figure 5). The accelerated pace and improved structure of the granules in the presence of MFs can be attributed to the increase in shear force due to the aeration and immobilization of biomass and attachment to the MFs [54]. Microplastics can promote AGS granulation through various mechanisms, including enhancing extracellular polymeric substance (EPS) production [55], modifying microbial communities by enriching the functional bacteria that support granulation, acting as nucleation sites for microbial aggregation [51], and improving sludge settling properties and compactness, due to enhanced hydrophobicity.
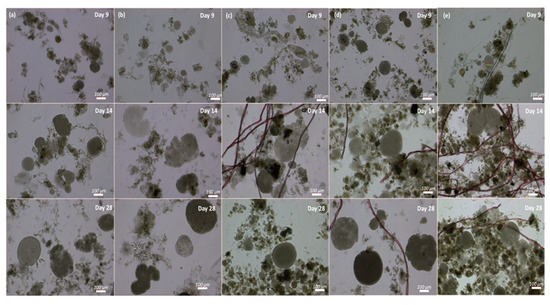
Figure 5.
Granulation process from cultivation to maturation in SBR-0 (a), SBR-10 (b), SBR-70 (c), SBR-210 (d), and SBR-1500 (e) on days 9, 14, and 28.
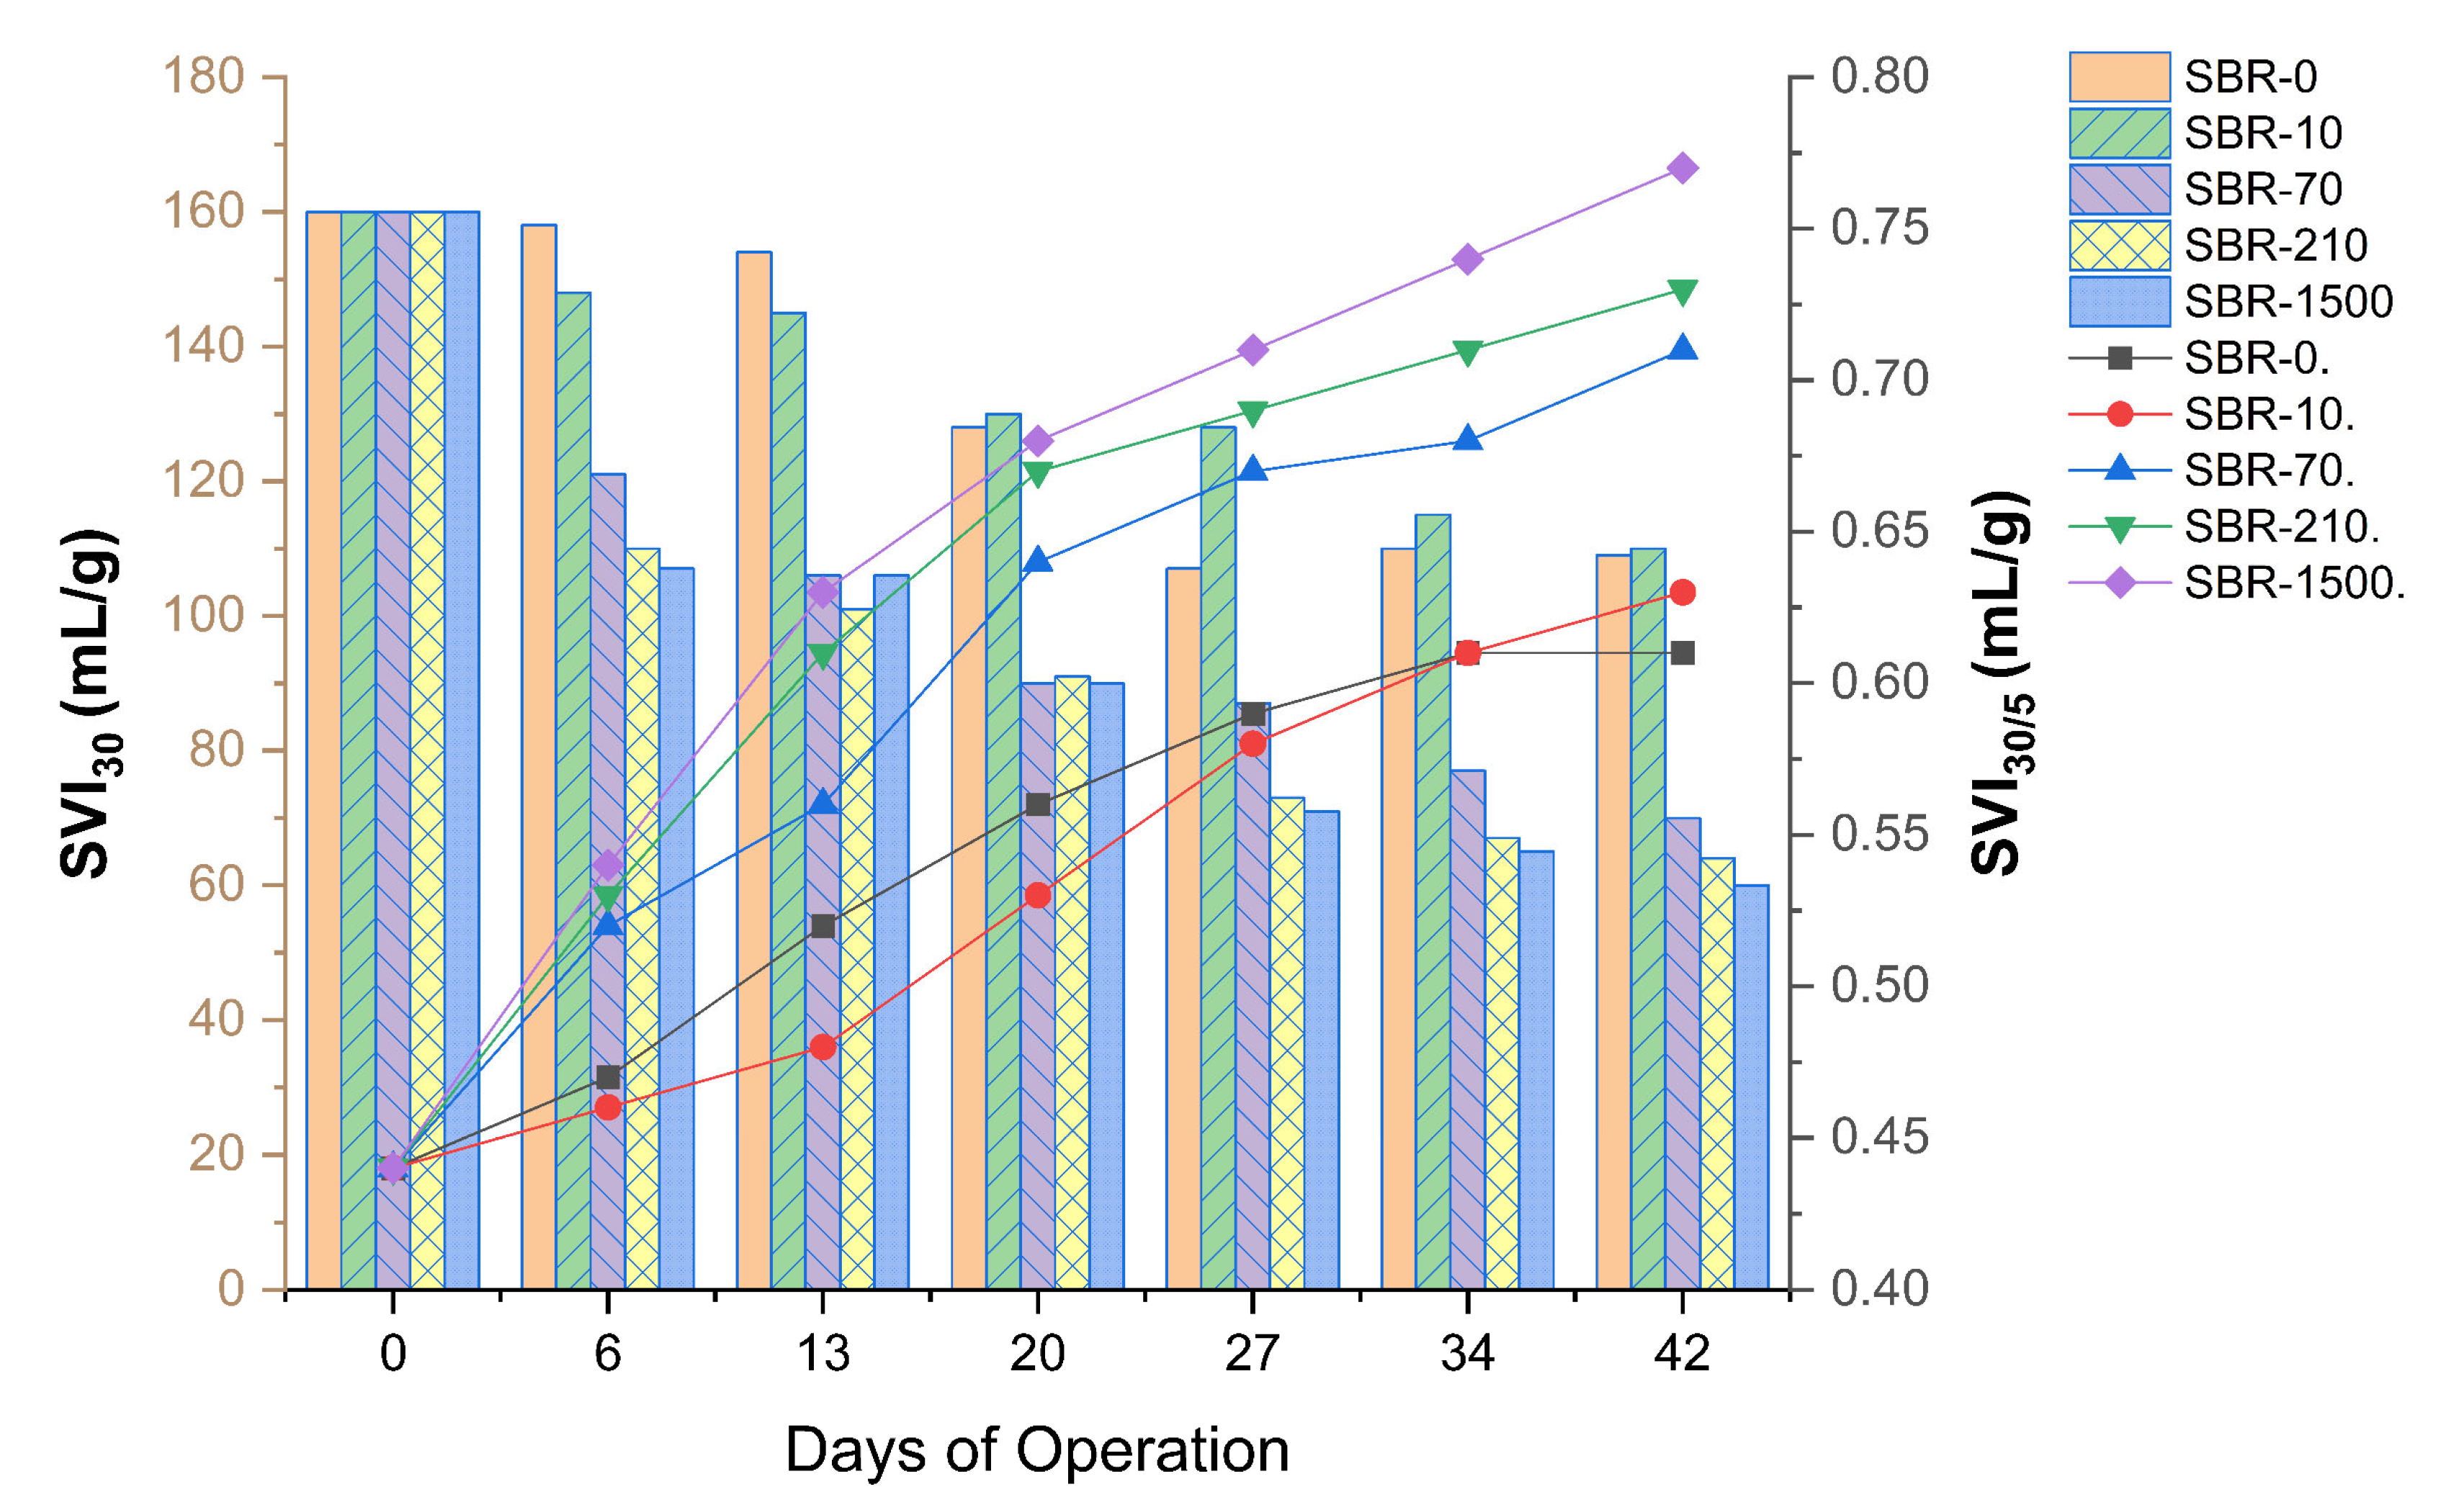
To fully explore the impact of MFs on the aerobic granulation process, granulation indices other than size, such as MLSS, SVI30, and SVI5, were investigated (Figure 6). Biomass settleability showed continuous improvement, where the SVI profiles of reactors SBR-0, SBR-10, SBR-70, SBR-210, and SBR-1500 exhibited a consistently declining trend over the experimental period (Figure 6). The SVI30 and SVI5 values across all reactors (SBR-0, SBR-10, SBR-70, SBR-210, and SBR-1500) demonstrated a reduction over time, ranging from 60 to 160 mL/g and 78 to 360 mL/g, respectively, throughout the 42-day duration of the study. Furthermore, the SVI5 values (after 5 min of settling time) gradually approached proximity with the SVI30 values (after 30 min of settling time) in all reactors on the 42nd day, which is indicative of stable granulation. A difference between SVI5 and SVI30 of within 10% is typically seen as a measure for full granulation [45], while lower SVI30/SVI5 ratios indicate the coexistence of granules and dense flocs within an AGS system [56,57].
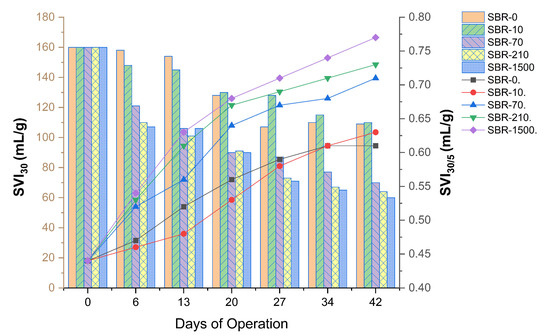
Figure 6.
SVI30 (bars) and SVI30/5 (lines) profiles for SBR-0, SBR-10, SBR-70, SBR-210, and SBR-1500.
The SVI30/SVI5 ratios for SBR-0, SBR-10, SBR-70, SBR-210, and SBR-1500 started at 0.44 and increased progressively to 0.61, 0.63, 0.71, 0.73, and 0.77, respectively (Figure 6), corresponding to granulation percentages of 61%, 63%, 71%, 73%, and 77%. Our findings demonstrate a clear positive relationship between granulation speed and overall granulation percentage with MF concentration (Figure 6). This suggests that MFs may have a positive impact on the physical aspects of the AGS system, such as promoting microbial aggregation and enhancing sludge settleability.
At the same time, MF accumulation led to a progressive increase in MLSS levels, particularly in SBR-1500 (Supplementary Figure S2). MLSS concentrations increased in all reactors during the experiment, with substantial fluctuations in the first 14 days, ranging from 4180 to 8010 mg/L. The initial MLSS concentration of 4000 mg/L rose to 6500 mg/L in SBR-0, 6900 mg/L in SBR-10, 7980 mg/L in SBR-70, and 9600 mg/L in SBR-210 (Supplementary Figure S2). The highest increase occurred in SBR-1500, reaching 13,770 mg/L. The observed buildup was due not only to improved biomass retention from granulation but also to the physical entrapment of synthetic fibers. While moderate increases in MLSS may support reactor stability, excessive accumulation can disrupt internal hydrodynamics, reduce effective reactor volume, and impair mass transfer [58]. In SBR-1500, these effects culminated in physical clogging and the need for frequent maintenance, highlighting the negative operational impacts of high MF loads.
Notably, the physical benefits of MF presence did not translate into improved biological performance, as evidenced by the significant reduction in TN removal at higher MF concentrations. This apparent contradiction may be explained by a decoupling of structural and functional performance in the AGS system. While MFs likely acted as physical scaffolds that enhanced microbial aggregation and were stabilized within the EPS matrix, they may have simultaneously disrupted dissimilatory nitrogen removal pathways and potential toxic effects for key microbes. Increased granule density and altered porosity could have impaired internal substrate diffusion, limiting the penetration of nitrate and carbon sources into the anoxic zones required for effective denitrification. In addition, the adsorption of bioavailable COD onto synthetic fibers may have further reduced its accessibility to heterotrophic denitrifiers. These effects were compounded by the microbial community shifts observed at elevated MF concentrations, suggesting the potential inhibition or displacement of key denitrifying taxa. Thus, although MFs enhanced granule formation and settling properties, they negatively impacted the microenvironmental and microbial conditions essential for complete nitrogen removal and effective wastewater treatment.
3.3. Microbial Community Structure in AGS
To investigate the potential origins of the observed reduction in TN and phosphate removal, changes in the microbial communities within the reactors were investigated. The composition of microorganisms in the SBRs was found to be distinctive and dynamic at the family level (Figure 7). However, certain trends were observed. For instance, the community of microbes in reactors with lower concentrations of MFs appeared to be similar.
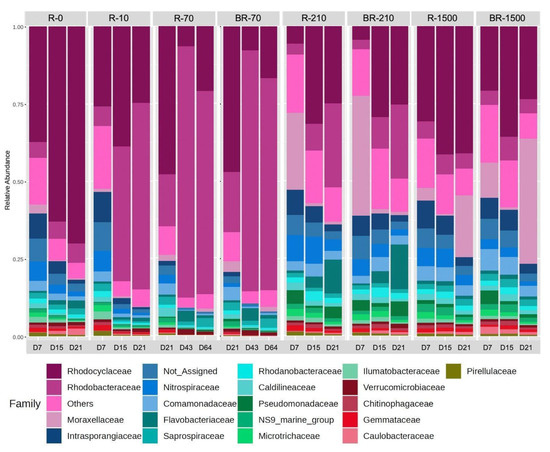
Figure 7.
Relative abundance of the most abundant bacterial families in the studied samples (R-0 = SBR-0, R-10 = SBR-10, R-70 = SBR-70, BR-70 = biofilm from reactor SBR-70, R-210 = SBR-210, R-1500 = SBR-1500, and BR-1500 = biofilm from reactor SBR-1500).
In SBR-0, Rhodocyclaceae dominated from day 7 to day 21. In SBR-10 and SBR-70, Rhodocyclaceae dominated on day 7 but shifted to Rhodobacteraceae by day 21 (Figure 7). SBR-210 was dominated by Rhodobacteraceae, with Moraxellaceae becoming dominant on day 21. In contrast, SBR-1500 showed Rhodocyclaceae dominance on day 7, shifting to Moraxellaceae dominance by day 21 (Figure 7). The abundance of denitrifying bacteria related to the family Rhodocyclaceae has been observed when readily available dissolved organic substrates, such as sodium acetate, are fed into the wastewater treatment system [59]. Rhodobacteraceae are capable of aerobic denitrification and degrade complex organic substrates [60,61]. Similarly, bacteria related to the Moraxellaceae family are also capable of degrading complex organic substrates and are linked to the removal of nitrogen and phosphorus [62]. Therefore, the metabolic activity of Rhodobacteraceae and Moraxellaceae may have benefited from the presence of MFs in the bioreactors.
The initial dominance of Rhodocyclaceae in reactors with lower MF concentrations likely reflects their metabolic versatility in terms of degrading various organic compounds [63]. The shift to Rhodobacteraceae in reactors with higher MF concentrations suggests an adaptation to diverse carbon sources under these conditions [64]. This transition may also result from the adverse environmental effects of MFs on certain microbial families, as microplastic pollution can reduce bacterial diversity and alter taxonomic abundance [65]. The dominance of Moraxellaceae by day 21 in the R-1500 and BR-1500 reactors suggests their role in late-stage degradation or resilience to prolonged MF exposure, particularly as they were significantly more abundant in reactors with higher MF concentrations (R-210 and R-1500) (Student’s t-test, p < 0.05) [66]. These findings highlight the dynamic, adaptive nature of microbial communities in aerobic SBRs, emphasizing the need for further research into their specific roles in MF degradation, microbial interactions, and reactor performance.
Microbial distribution at the genus level in the SBRs was dynamic over 21 days. Denitrifiers such as Paracoccus, Thauera, and Zoogloea were the most prevalent, alongside others like Dechloromonas, Fusibacter, and Flavobacterium, which was consistent with other AGS studies [67] (Figure 8). Paracoccus increased in relative abundance across most reactors, except in SBR-1500, where it remained below 5% throughout the experiment. Despite SBR-1500 having the highest fiber content and microbial diversity, Paracoccus was likely outcompeted by other genera due to niche partitioning and resource competition in this environment [68]. Thauera (related to the family Rhodocyclaceae) and Zoogloea (related to the family Zoogloeaceae) denitrifiers are predominant in wastewater treatment systems that are fed with readily available dissolved organic substrates, such as sodium acetate [59]. Thauera and Zoogloea were also observed to be predominant in the control bioreactor, which was operating without MFs. Paracoccus (related to the family Rhodobacteraceae) are capable of aerobic denitrification and also of degrading complex organic substrates [68], which could explain their predominance in the bioreactors with MFs that leached e.g. additives and dyes.
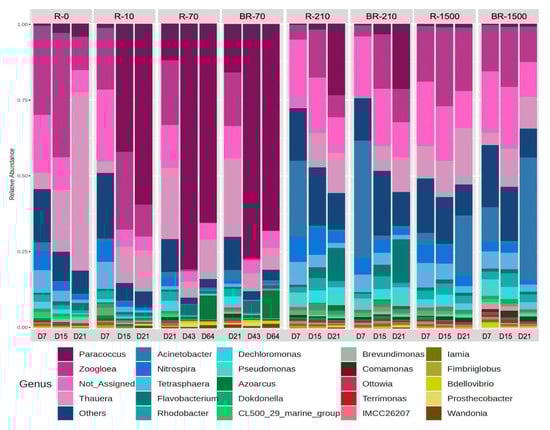
Figure 8.
Relative abundance of the most abundant bacterial genera in the studied samples (R-0 = SBR-0, R-10 = SBR-10, R-70 = SBR-70, BR-70 = biofilm from reactor SBR-70, R-210 = SBR-210, R-1500 = SBR-1500, and BR-1500 = biofilm from reactor SBR-1500).
Nitrospira and Acinetobacter were most abundant during the early days of reactor operation, with high MF concentrations (Figure 8). Nitrospira, which is capable of both ammonia and nitrite oxidation, is crucial for nitrification and nitrogen reduction in wastewater. Acinetobacter abundance declined over time in all reactors except SBR-1500, where it persisted (Figure 8). Known for heterotrophic nitrification, aerobic denitrification, and phosphorus removal, Acinetobacter thrives under low-nutrient conditions [69,70]. This presence of heterotrophic nitrifiers was consistent with the observed ammonia removal even at high MF concentrations. Pseudomonas was most abundant in SBR-1500 and in reactors with high fiber concentrations compared to SBR-0 and SBR-10.
Thauera and Zoogloea showed significant fluctuations (Student’s t-test, p < 0.05) in reactors with lower MF concentrations (≤SBR-70) but remained stable in SBR-1500 with the highest MF concentration (Figure 8). This likely explains the higher TN removal efficiency seen in SBR-0 compared to reactors with higher MF concentrations. Thauera plays a key role in simultaneous carbon and nitrogen removal, contributing to the high COD and TN removal efficiencies observed in SBR-0 [71]. Zoogloea, which is capable of utilizing diverse carbon sources and enhancing biological phosphorus removal, was more abundant in SBR-0, especially early on, likely explaining the high observed PO43− removal [71,72]. The observed changes in the microbial community structure may have resulted from toxic substances leaching from MFs [73,74] and the adsorption of MFs on granular sludge surfaces [41].
Interestingly, among the five SBRs tested (SBR-0, SBR-10, SBR-70, SBR-210, and SBR-1500), SBR-1500 and its biofilm exhibited the highest microbial diversity, with 657 and 660 observed species, respectively (Supplementary Figure S3). The diversity levels in the other reactors were: SBR-0 (580), SBR-10 (606), SBR-70 (615), SBR-210 (600), BR3 (637), and BR5 (615). The increased diversity in AGS reactors with fibers can be attributed to the layered granule structures, creating distinct aerobic, anaerobic, and anoxic zones, which was consistent with findings from polyethylene microplastic studies [75,76] and the observations of enhanced granulation in this study. The fibers provided stratified structures that supported diverse microbial communities [77], as evidenced by SBR-0’s lower diversity (580 species) compared to fiber-containing reactors. However, as discussed previously, this enhanced structure, and diversity did not seem to protect the system against the negative impacts of MFs on nutrient removal.
3.4. Microfibre Removal Efficiencies of AGS-SBR
Contrary to the nutrient removal, all reactors showed high MF removal efficiency. SBR-10 achieved 100% removal, likely due to low influent fiber concentrations and efficient settling processes in the sludge (Supplementary Figure S4). SBR-70, SBR-210, and SBR-1500 achieved removal efficiencies of 99 ± 0.6%, 99 ± 0.3%, and 98 ± 0.1%, respectively, primarily through biomass entrapment. These results align with previous studies reporting 98–99% MF removal in SBRs and WWTPs [15,78]. The persistently high effluent concentrations reported in the literature [78,79] despite these high removal efficiencies highlight the exposure of WWTP to substantial MFs loads and the need for source control to reduce influent concentrations, especially given their potential impact on treatment performance. Such measures should address both textile manufacturing practices and consumer behavior to reduce MF release at the origin point. Key strategies include the development of more environmentally sustainable textile designs, modifications to fiber manufacturing processes, behavioral shifts in laundering practices, and the promotion of washing machine filters.
These strategies must be supported by robust regulatory frameworks, including mandatory standards for textile shedding and appliance-based filtration. In parallel, research into the chronic ecotoxicological impacts of MFs and associated additives on aquatic ecosystems is urgently needed to inform evidence-based policy. In particular, long-term studies on low-dose exposure, trophic transfer, and impacts on microbial processes in engineered systems are essential. Additionally, further investigation into the resilience of biological treatment systems under chronic MF stress would help guide design and operational adaptations for future-proofing wastewater infrastructure.
When implemented collectively, these source control and policy initiatives—coupled with targeted research—have the potential to significantly reduce MF emissions and their downstream risks as well as increase the resilience of wastewater treatment to impacts of microplastics. Given the limitations of end-of-pipe removal technologies, upstream interventions remain essential for minimizing the ecological and operational burden posed by microfibers [80,81,82].
3.5. Future Directions and Policy Implications
To build on these findings and strengthen AGS resilience, future work should address key limitations. Specifically, full nitrogen profiling, including nitrate and nitrite measurements, is needed to clarify the transformation pathways. EPS composition analysis would offer insight into structural microbial responses under MF stress. Additionally, longer exposure periods and the evaluation of plastic additives and textile dyes are essential to understanding chronic toxicity and system adaptability.
These findings confirm that MF pollution poses a process-level threat to biological nutrient removal, even in advanced systems like AGS. Mitigating this risk will require upstream source control (e.g., filtration at the laundry stage and at industrial discharge points), regulatory support, and continued investigation into the fate of MFs, microbial interactions, and system-level resilience.
4. Conclusions
The addition of MFs significantly affected nutrient removal in AGS SBRs. Higher MF concentrations (70, 210, and 1500 MFs/L) inhibited COD, PO43−, and TN removal efficiencies, while NH3 removal remained unaffected. MLSS levels increased across all reactors, with the steepest rise seen in SBR-1500, posing risks of clogging and reduced WWTP performance.
The results of our study highlight that polyester and denim MFs, although efficiently captured in AGS systems (>98% removal), impose concentration-dependent functional and microbial burdens, even in resilient biological processes. As MF loading increased, TN removal declined from 93% to 68%, and phosphate removal dropped significantly from 86% to 70% (p < 0.05). COD removal, while remaining high, decreased slightly from 96% to 89%. Nitrification (NH3 removal) was unaffected, but MLSS levels increased with MF concentration, with SBR-1500 showing the steepest rise and operational instability. Microbial shifts accompanied these changes: Paracoccus dominated low-MF reactors, while Acinetobacter and Pseudomonas increased under higher MF loads. Diversity was greater in reactors exposed to ≥70 MFs/L, indicating ecological restructuring. Dominant families such as Rhodocyclaceae, Rhodobacteraceae, and Moraxellaceae shifted with MF exposure, pointing to a functional reorganization of the microbial community.
Overall, the results highlighted the risk that MF pose for biological wastewater treatment at concentrations currently seen in global facilities. This information is crucial for the assessment of potential secondary effects of MFs on water quality and the true impacts of MF contamination in our wastewater systems.
Supplementary Materials
The following supporting information can be downloaded at: https://www.mdpi.com/article/10.3390/pr13072272/s1, Table S1: Influent and effluent concentrations of MPs in WWTPs globally [4,5,15,83,84,85,86,87,88,89,90,91,92,93,94,95,96,97,98,99,100,101,102,103,104,105,106,107,108,109]; Table S2: SVI30 and SVI30/5 profiles for SBR-0, SBR-10, SBR-70, SBR-210, and SBR-1500; Figure S1: The five-point calibration curve for dosing; Figure S2: MLSS profiles for SBR-0, SBR-10, SBR-70, SBR-210, and SBR-1500. Figure S3: Shannon diversity values of the microbial communities within the five studied reactors. Figure S4: Fibers enmeshed in and around biomass.
Author Contributions
Conceptualization, R.S. and R.H.; Methodology, V.O.O. and R.H.; Software, H.A.; Validation, H.A. and R.H.; Formal analysis, R.H. and R.S.; Investigation, V.O.O., H.A. and K.A.G.; Resources, S.N.L., K.A.G., R.S. and R.H.; Data curation, V.O.O. and H.W.; Writing—original draft, V.O.O., H.W., R.S. and R.H.; Writing—review and editing, H.W., S.N.L., K.A.G., R.S. and R.H.; Supervision, R.S. and R.H.; Funding acquisition, R.S. and R.H. All authors have read and agreed to the published version of the manuscript.
Funding
This research was funded by the Natural Sciences and Engineering Council of Canada (NSERC) Discovery grant (RGPIN-2021-03770) and the Faculty of Engineering and Architectural Science (FEAS) at Toronto Metropolitan University, Toronto, Canada.
Data Availability Statement
Data will be made available on request.
Conflicts of Interest
The authors declare no conflicts of interest.
References
- Roblin, B.; Ryan, M.; Vreugdenhil, A.; Aherne, J. Ambient atmospheric deposition of anthropogenic microfibers and microplastics in the remote region of Newfoundland, Canada. Environ. Sci. Technol. 2020, 54, 11100–11108. [Google Scholar] [CrossRef]
- Welsh, B.; Aherne, J.; Paterson, A.; Yao, H.; McConnell, C. Atmospheric deposition of anthropogenic particles and microplastics in south-central Ontario, Canada. Sci. Total Environ. 2022, 835, 155426. [Google Scholar] [CrossRef] [PubMed]
- Henry, B.; Laitala, K.; Klepp, I.G. Microfibres from apparel and home textiles: Prospects for including microplastics in environmental sustainability assessment. Sci. Total Environ. 2019, 652, 483–494. [Google Scholar] [CrossRef] [PubMed]
- Carr, S.A.; Liu, J.; Tesoro, A.G. Transport and fate of microplastic particles in wastewater treatment plants. Water Res. 2016, 91, 174–182. [Google Scholar] [CrossRef] [PubMed]
- Dris, R.; Imhof, H.; Sanchez, W.; Gasperi, J.; Galgani, F.; Tassin, B.; Laforsch, C. Beyond the ocean: Contamination of freshwater ecosystems with micro-plastic particles. Environ. Chem. 2015, 12, 539–550. [Google Scholar] [CrossRef]
- Mintenig, S.M.; Int-Veen, I.; Löder, M.G.J.; Primpke, S.; Gerdts, G. Identification of microplastic in effluents of wastewater treatment plants using focal plane array-based micro-Fourier-transform infrared imaging. Water Res. 2017, 108, 365–372. [Google Scholar] [CrossRef]
- Raju, S.; Carbery, M.; Kuttykattil, A.; Senathirajah, K.; Subashchandrabose, S.R.; Evans, G.; Thavamani, P. Transport and fate of microplastics in wastewater treatment plants: Implications to environmental health. Rev. Environ. Sci. Biotechnol. 2018, 17, 637–653. [Google Scholar] [CrossRef]
- Zhou, S.; Wang, L.; Liu, J.; Zhang, C.; Liu, X. Microplastics’ toxic effects and influencing factors on microorganisms in biological wastewater treatment units. Water Sci. Technol. 2024, 89, 1539–1553. [Google Scholar] [CrossRef]
- Yaseen, A.; Assad i Sofi, M.; Hashmi, M.; Bhat, S. A global review of microplastics in wastewater treatment plants: Understanding their occurrence, fate and impact. Environ. Res. 2022, 212 Pt B, 113258. [Google Scholar] [CrossRef]
- Sol, D.; Laca, A.; Laca, A.; Díaz, M. Microplastics in Wastewater and Drinking Water Treatment Plants: Occurrence and Removal of Microfibres. Appl. Sci. 2021, 11, 10109. [Google Scholar] [CrossRef]
- Liu, J.; Liu, Q.; An, L.; Wang, M.; Yang, Q.; Zhu, B.; Ding, J.; Ye, C.; Xu, Y. Microfiber Pollution in the Earth System. Rev. Environ. Contam. Toxicol. 2022, 260, 13. [Google Scholar] [CrossRef]
- Priya, A.; Anusha, G.; Thanigaivel, S.; Karthick, A.; Mohanavel, V.; Velmurugan, P.; Balasubramanian, B.; Ravichandran, M.; Kamyab, H.; Kirpichnikova, I.M. Removing microplastics from wastewater using leading-edge treatment technologies: A solution to microplastic pollution—A review. Bioprocess Biosyst. Eng. 2023, 46, 309–321. [Google Scholar] [CrossRef]
- Xu, X.; Hou, Q.; Xue, Y.; Jian, Y.; Wang, L. Pollution characteristics and fate of microfibers in the wastewater from textile dyeing wastewater treatment plant. Water Sci. Technol. 2018, 78, 2046–2054. [Google Scholar] [CrossRef]
- Bayo, J.; Olmos, S.; López-Castellanos, J.; Alcolea, A. Microplastics and microfibers in the sludge of a municipal wastewater treatment plant. Int. J. Sustain. Dev. Plan. 2016, 11, 812–821. [Google Scholar] [CrossRef]
- Lares, M.; Ncibi, M.C.; Sillanpää, M.; Sillanpää, M. Occurrence, identification and removal of microplastic particles and fibers in conventional activated sludge process and advanced MBR technology. Water Res. 2018, 133, 236–246. [Google Scholar] [CrossRef] [PubMed]
- Grbić, J.; Helm, P.; Athey, S.; Rochman, C.M. Microplastics entering northwestern Lake Ontario are diverse and linked to urban sources. Water Res. 2020, 174, 115623. [Google Scholar] [CrossRef] [PubMed]
- Pedrotti, M.L.; Petit, S.; Eyheraguibel, B.; Kerros, M.E.; Elineau, A.; Ghiglione, J.F.; Loret, J.F.; Rostan, A.; Gorsky, G. Pollution by anthropogenic microfibers in North-West Mediterranean Sea and efficiency of microfiber removal by a wastewater treatment plant. Sci. Total Environ. 2021, 758, 144195. [Google Scholar] [CrossRef] [PubMed]
- McQueen, R.H.; Batcheller, J.C.; Moran, L.J.; Zhang, H.; Hooper, P.M. Reducing laundering frequency to prolong the life of denim jeans. Int. J. Consum. Stud. 2017, 41, 36–45. [Google Scholar] [CrossRef]
- Periyasamy, A.P.; Duraisamy, G. Carbon footprint on denim manufacturing. Handb. Ecomater. 2019, 3, 1581–1598. [Google Scholar] [CrossRef]
- Memon, N.A. Cotton denim fabrics: Pakistan key supplier in Global market. Pak. Text. J. 2017, 66, 44–45. [Google Scholar]
- Miller, D.; Woodward, S. Manifesto for a study of denim. Soc. Anthropol. 2007, 15, 335–351. [Google Scholar] [CrossRef]
- Athey, S.N.; Adams, J.K.; Erdle, L.M.; Jantunen, L.M.; Helm, P.A.; Finkelstein, S.A.; Diamond, M.L. The Widespread Environmental Footprint of Indigo Denim Microfibers from Blue Jeans. Environ. Sci. Technol. Lett. 2020, 7, 840–847. [Google Scholar] [CrossRef]
- Vassilenko, E.; Watkins, M.; Chastain, S.; Mertens, J.; Posacka, A.M.; Patankar, S.; Ross, P.S. Domestic laundry and microfiber pollution: Exploring fiber shedding from consumer apparel textiles. PLoS ONE 2021, 16, e0250346. [Google Scholar] [CrossRef] [PubMed]
- Acharya, S.; Rumi, S.S.; Hu, Y.; Abidi, N. Microfibers from synthetic textiles as a major source of microplastics in the environment: A review. Text. Res. J. 2021, 91, 2136–2156. [Google Scholar] [CrossRef]
- Cesa, F.S.; Turra, A.; Baruque-Ramos, J. Synthetic fibers as microplastics in the marine environment: A review from textile perspective with a focus on domestic washings. Sci. Total Environ. 2017, 598, 1116–1129. [Google Scholar] [CrossRef]
- Corami, F.; Rosso, B.; Bravo, B.; Gambaro, A.; Barbante, C. A novel method for purification, quantitative analysis and characterization of microplastic fibers using Micro-FTIR. Chemosphere 2020, 238, 124564. [Google Scholar] [CrossRef]
- Hartline, N.L.; Bruce, N.J.; Karba, S.N.; Ruff, E.O.; Sonar, S.U.; Holden, P.A. Microfiber Masses Recovered from Conventional Machine Washing of New or Aged Garments. Environ. Sci. Technol. 2016, 50, 11532–11538. [Google Scholar] [CrossRef]
- Carney Almroth, B.M.; Åström, L.; Roslund, S.; Petersson, H.; Johansson, M.; Persson, N.K. Quantifying shedding of synthetic fibers from textiles; a source of microplastics released into the environment. Environ. Sci. Pollut. Res. 2018, 25, 1191–1199. [Google Scholar] [CrossRef]
- Fries, E.; Grewal, T.; Sühring, R. Persistent, mobile, and toxic plastic additives in Canada: Properties and prioritization. Environ. Sci. Process. Impacts 2022, 24, 1945–1956. [Google Scholar] [CrossRef]
- Li, L.; Song, K.; Yeerken, S.; Geng, S.; Liu, D.; Dai, Z.; Xie, F.; Zhou, X.; Wang, Q. Effect evaluation of microplastics on activated sludge nitrification and denitrification. Sci. Total Environ. 2020, 707, 135953. [Google Scholar] [CrossRef]
- Fuschi, C.; Pu, H.; MacDonell, M.; Picel, K.; Negri, M.; Chen, J. Microplastics in the Great Lakes: Environmental, health, and socioeconomic implications and future directions. ACS Sustain. Chem. Eng. 2022, 10, 14074–14091. [Google Scholar] [CrossRef]
- Munno, K.; Helm, P.A.; Rochman, C.; George, T.; Jackson, D.A. Microplastic contamination in Great Lakes fish. Conserv. Biol. 2022, 36, e13794. [Google Scholar] [CrossRef]
- Zhang, Y.T.; Wei, W.; Huang, Q.S.; Wang, C.; Wang, Y.; Ni, B.J. Insights into the microbial response of anaerobic granular sludge during long-term exposure to polyethylene terephthalate microplastics. Water Res. 2020, 179, 115898. [Google Scholar] [CrossRef]
- Yi, K.; Huang, J.; Li, X.; Li, S.; Pang, H.; Liu, Z.; Zhang, W.; Liu, S.; Liu, C.; Shu, W. Long-term impacts of polyethylene terephthalate (PET) microplastics in membrane bioreactor. J. Environ. Manag. 2022, 323, 116234. [Google Scholar] [CrossRef]
- Zhao, L.; Su, C.; Liu, W.; Qin, R.; Tang, L.; Deng, X.; Wu, S.; Chen, M. Exposure to polyamide 66 microplastic leads to effects performance and microbial community structure of aerobic granular sludge. Ecotoxicol. Environ. Saf. 2019, 190, 110070. [Google Scholar] [CrossRef] [PubMed]
- Rosa-Masegosa, A.; Perez-Bou, L.; Muñoz-Palazon, B.; Monteoliva-García, A.; Gonzalez-Martinez, A.; Gonzalez-Lopez, J.; Correa-Galeote, D. Effects of sulphur amino acids on the size and structure of microbial communities of aerobic granular sludge bioreactors. Amino Acids 2022, 54, 1403–1419. [Google Scholar] [CrossRef] [PubMed]
- Zhang, B.; Huang, S.; Wu, L.; Guo, Y.; Shi, W.; Lens, P.N.L. Micro(nano)plastic size and concentration co-differentiate the treatment performance and toxicity mechanism in aerobic granular sludge systems. Chem. Eng. J. 2023, 457, 141212. [Google Scholar] [CrossRef]
- Aqeel, H.; Weissbrodt, D.G.; Cerruti, M.; Wolfaardt, G.M.; Wilén, B.M.; Liss, S.N. Drivers of bioaggregation from flocs to biofilms and granular sludge. Environ. Sci. Water Res. Technol. 2019, 5, 2072–2089. [Google Scholar] [CrossRef]
- Dai, M.; Wu, Y.; Wang, J.; Lv, Z.; Li, F.; Zhang, Y.; Kong, Q. Constructed wetland-microbial fuel cells enhanced with iron carbon fillers for ciprofloxacin wastewater treatment and power generation. Chemosphere 2022, 305, 105048. [Google Scholar] [CrossRef]
- Zheng, X.; Han, Z.; Shao, X.; Zhao, Z.; Zhang, H.; Lin, T.; Yang, S.; Zhou, C. Response of aerobic granular sludge under polyethylene microplastics stress: Physicochemical properties, decontamination performance, and microbial community. J. Environ. Manag. 2022, 323, 116215. [Google Scholar] [CrossRef]
- Lin, X.; Su, C.; Deng, X.; Wu, S.; Tang, L.; Li, X.; Liu, J.; Huang, X. Influence of polyether sulfone microplastics and bisphenol A on anaerobic granular sludge: Performance evaluation and microbial community characterization. Ecotoxicol. Environ. Saf. 2020, 205, 111318. [Google Scholar] [CrossRef]
- Tay, J.H.; Tay, S.T.L.; Ivanov, V.; Pan, S.; Jiang, H.L.; Liu, Q.S. Biomass and porosity profiles in microbial granules used for aerobic wastewater treatment. Lett. Appl. Microbiol. 2003, 36, 297–301. [Google Scholar] [CrossRef] [PubMed]
- APHA (American Public Health Association); American Water Works Association; Water Environment Federation. Standard Methods for the Examination of Water and Wastewater, 22nd ed.; APHA Press: Washington, DC, USA, 2012. [Google Scholar]
- Hidalgo-Ruz, V.; Gutow, L.; Thompson, R.C.; Thiel, M. Microplastics in the marine environment: A review of the methods used for identification and quantification. Environ. Sci. Technol. 2012, 46, 3060–3075. [Google Scholar] [CrossRef] [PubMed]
- Aqeel, H.; Liss, S.N. Fate of sloughed biomass in integrated fixed-film systems. PLoS ONE 2022, 17, e0262603. [Google Scholar] [CrossRef] [PubMed]
- Oliva, G.; Pahunang, R.R.; Vigliotta, G.; Zarra, T.; Ballesteros, F.C.; Mariniello, A.; Buonerba, A.; Belgiorno, V.; Naddeo, V. Advanced treatment of toluene emissions with a cutting-edge algal bacterial photo-bioreactor: Performance assessment in a circular economy perspective. Sci. Total Environ. 2023, 878, 163005. [Google Scholar] [CrossRef]
- Callahan, B.J.; McMurdie, P.J.; Rosen, M.J.; Han, A.W.; Johnson, A.J.A.; Holmes, S.P. DADA2: High-resolution sample inference from Illumina amplicon data. Nat. Methods 2016, 13, 581–583. [Google Scholar] [CrossRef]
- Dhariwal, A.; Chong, J.; Habib, S.; King, I.L.; Agellon, L.B.; Xia, J. Microbiome Analyst: A web-based tool for comprehensive statistical, visual and meta-analysis of microbiome data. Nucleic Acids Res. 2017, 45, W180–W188. [Google Scholar] [CrossRef]
- Feng, L.; Xu, J.; Xu Xiang Zhu, L.; Xu, J.; Ding, W.; Luan, J. Enhanced Biological Nitrogen Removal via Dissolved Oxygen Partitioning and Step Feeding in a Simulated River Bioreactor for Contaminated Source Water Remediation. Int. Biodeterior. Biodegrad. 2012, 71, 72–79. [Google Scholar] [CrossRef]
- Guo, X.; Ma, X.; Niu, X.; Li, Z.; Wang, Q.; Ma, Y.; Cai, S.; Li, P.; Li, H. The impacts of biodegradable and non-biodegradable microplastic on the performance and microbial community characterization of aerobic granular sludge. Front. Microbioogyl. 2024, 15, 1389046. [Google Scholar] [CrossRef]
- Fries, E.; Sühring, R. The unusual suspects: Screening for persistent, mobile, and toxic plastic additives in plastic leachates. Environ. Poll. 2023, 335, 122263. [Google Scholar] [CrossRef]
- Jamee, R.; Siddique, R. Biodegradation of synthetic dyes of textile effluent by microorganisms: An environmentally and economically sustainable approach. Eur. J. Microbiol. Immunol. 2019, 9, 114–118. [Google Scholar] [CrossRef] [PubMed]
- Xu, J.; Xu, D.; Wang, X.; Long, S.; Yang, J. Improved interfacial shear strength of carbon fiber/polyphenylene sulfide composites by graphene. High Perform. Polym. 2017, 29, 913–921. [Google Scholar] [CrossRef]
- Tan, C.; Wang, Q.; Li, F. Effects of Microplastics on Granular Sludge: A Review; Institute of Coastal Environmental Pollution Control, Key Laboratory of Marine Environment and Ecology, Ministry of Education, College of Environmental Science and Engineering, Ocean University of China: Qingdao, China, 2024. [Google Scholar]
- Hamza, R.A.; Iorhemen, O.T.; Zaghloul, M.S.; Tay, J.H. Rapid formation and characterization of aerobic granules in pilot-scale sequential batch reactor for high-strength organic wastewater treatment. J. Water Process Eng. 2018, 22, 27–33. [Google Scholar] [CrossRef]
- Aqeel, H.; Basuvaraj, M.; Hall, M.; Neufeld, J.D.; Liss, S.N. Microbial dynamics and properties of aerobic granules developed in a laboratory-scale sequencing batch reactor with an intermediate filamentous bulking stage. Appl. Microbiol. Biotechnol. 2016, 100, 447–460. [Google Scholar] [CrossRef]
- Campbell, K.; Wang, J.; Daigger, G.T. Filamentous organisms degrade oxygen transfer efficiency by increasing mixed liquor apparent viscosity: Mechanistic understanding and experimental verification. Water Res. 2020, 173, 115570. [Google Scholar] [CrossRef]
- Aqeel, H.; Asefa, B.; Liss, S.N. Nitrospira dominant pin-point flocs with granule-like settleability in stirred tank reactors with oxic/hypoxic/oxic zones. Front. Microbiol. 2023, 14, 1307727. [Google Scholar] [CrossRef]
- Rajeev, M.; Cho, J.C. Rhodobacteraceae are Prevalent and Ecologically Crucial Bacterial Members in Marine Biofloc Aquaculture. J. Microbiol. 2024, 62, 985–997. [Google Scholar] [CrossRef]
- Gui, X.; Wang, Z.; Li, K.; Li, Z.; Mao, X.; Geng, J.; Pan, Y. Enhanced nitrogen removal in sewage treatment is achieved by using kitchen waste hydrolysate without a significant increase in nitrous oxide emissions. Sci. Total Environ. 2024, 906, 167108. [Google Scholar] [CrossRef]
- Wang, B.Y.; Xin, Y.; Lin, G.F.; Gao, D.W.; Liu, L. Nitrogen removal from decentralized domestic wastewater in gravel-bed coupled with wood chip under variable hydraulic loading rate. Desalination Water Treat. 2025, 322, 101219. [Google Scholar] [CrossRef]
- Fang, D.; Wu, A.; Huang, L.; Shen, Q.; Zhang, Q.; Jiang, L.; Ji, F. Polymer substrate reshapes the microbial assemblage and metabolic patterns within a biofilm denitrification system. Chem. Eng. J. 2020, 387, 124128. [Google Scholar] [CrossRef]
- Chen, Y.J.; Leung, P.M.; Wood, J.L.; Bay, S.K.; Hugenholtz, P.; Kessler, A.J.; Shelley, G.; Waite, D.W.; Franks, A.E.; Cook, P.L.M.; et al. Metabolic flexibility allows bacterial habitat generalists to become dominant in a frequently disturbed ecosystem. ISME J. 2021, 15, 2986–3004. [Google Scholar] [CrossRef]
- Jain, R.; Gaur, A.; Suravajhala, R.; Chauhan, U.; Pant, M.; Tripathi, V.; Pant, G. Microplastic pollution: Understanding microbial degradation and strategies for pollutant reduction. Sci. Total Environ. 2023, 905, 167098. [Google Scholar] [CrossRef] [PubMed]
- Sun, H.; Yu, P.; Li, Q.; Ren, H.; Liu, B.; Ye, L.; Zhang, X.X. Transformation of anaerobic granules into aerobic granules and the succession of bacterial community. Appl. Microbiol. Biotechnol. 2017, 101, 7703–7713. [Google Scholar] [CrossRef] [PubMed]
- Fall, C.; Barrón-Hernández, L.M.; Gonzaga-Galeana, V.E.; Olguín, M.T. Ordinary heterotrophic organisms with aerobic storage capacity provide stable aerobic granular sludge for C and N removal. J. Environ. Manag. 2022, 308, 114662. [Google Scholar] [CrossRef] [PubMed]
- Chang, F.; Liu, W.; Fan, X.; Yu, C.; Liu, H.; Li, Q. Characteristics of aerobic denitrification and ammonia assimilation for nitrogen removal by Paracoccus binzhouensis wg1. J. Environ. Chem. Eng. 2025, 13, 116529. [Google Scholar] [CrossRef]
- Su, J.F.; Zhang, K.; Huang, T.L.; Wen, G.; Guo, L.; Yang, S.F. Heterotrophic nitrification and aerobic denitrification at low nutrient conditions by a newly isolated bacterium, Acinetobacter sp. SYF26. Microbiology 2015, 161, 829–837. [Google Scholar] [CrossRef]
- Hamza, R.A.; Zaghloul, M.S.; Iorhemen, O.T.; Sheng, Z.; Tay, J.H. Optimization of organics to nutrients (COD:N:P) ratio for aerobic granular sludge treating high-strength organic wastewater. Sci. Total Environ. 2019, 650, 3168–3179. [Google Scholar] [CrossRef]
- Zhao, Y.; Huang, J.; Zhao, H.; Yang, H. Microbial community and N removal of aerobic granular sludge at high COD and N loading rates. Bioresour. Technol. 2013, 143, 439–446. [Google Scholar] [CrossRef]
- Huang, T.-L.; Zhou, S.-L.; Zhang, H.-H.; Bai, S.-Y.; He, X.-X.; Yang, X. Nitrogen removal characteristics of a newly isolated indigenous aerobic denitrifier from oligotrophic drinking water reservoir, Zoogloea sp. N299. Int. J. Mol. Sci. 2015, 16, 10038–10060. [Google Scholar] [CrossRef]
- Zhang, B.; Wu, L.; Shi, W.; Zhang, Z.; Lens, P.N.L. A novel strategy for rapid development of a self-sustaining symbiotic algal-bacterial granular sludge: Applying algal-mycelial pellets as nuclei. Water Res. 2022, 214, 118210. [Google Scholar] [CrossRef]
- Zhang, Q.; Zhao, L.; Zhang, J.; Liu, W.; Cai, S.; Chen, L.; Cai, T.; Ji, X.M. Nitrogen contribution and microbial community of size-fractionated anammox sludge in continuous stirred-tank reactors. Bioresour. Technol. 2022, 362, 127857. [Google Scholar] [CrossRef]
- Campo, R.; Lubello, C.; Lotti, T.; Di Bella, G. Aerobic granular sludge–membrane bioreactor (Ags–mbr) as a novel configuration for wastewater treatment and fouling mitigation: A mini-review. Membranes 2021, 11, 261. [Google Scholar] [CrossRef]
- Ali, I.; Ding, T.; Peng, C.; Naz, I.; Sun, H.; Li, J.; Liu, J. Micro- and nanoplastics in wastewater treatment plants: Occurrence, removal, fate, impacts and remediation technologies—A critical review. Chem. Eng. J. 2021, 423, 130205. [Google Scholar] [CrossRef]
- Kelly, J.J.; London, M.G.; McCormick, A.R.; Rojas, M.; Scott, J.W.; Hoellein, T.J. Wastewater treatment alters microbial colonization of microplastics. PLoS ONE 2021, 16, e0244443. [Google Scholar] [CrossRef] [PubMed]
- Lee, S.; Kim, J. Microplastic removal efficiency in sequencing batch reactors and wastewater treatment plants. Environ. Sci. Technol. 2018, 52, 12345–12356. [Google Scholar]
- Cristaldi, A.; Fiore, M.; Zuccarello, P.; Oliveri Conti, G.; Grasso, A.; Nicolosi, I.; Copat, C.; Ferrante, M. Efficiency of Wastewater Treatment Plants (WWTPs) for Microplastic Removal: A Systematic Review. Int. J. Environ. Res. Public Health 2020, 17, 8014. [Google Scholar] [CrossRef] [PubMed]
- Haque, M.; Kabir, A.; Latifi, E.; Mahmud, S.; Hossain, M.; Himu, H.; Fatema, U.; Tareq, S. Microfiber prevalence and removal efficiency of textile effluent treatment plants in Bangladesh. J. Hazard. Mater. Adv. 2024, 14, 100436. [Google Scholar] [CrossRef]
- Weis, J.S.; De Falco, F. Microfibers: Environmental Problems and Textile Solutions. Microplastics 2022, 1, 626–639. [Google Scholar] [CrossRef]
- Acarer, S. Microplastics in wastewater treatment plants: Sources, properties, removal efficiency, removal mechanisms, and interactions with pollutants. Water Sci. Technol. 2023, 87, 685–710. [Google Scholar] [CrossRef]
- Allen, E.; Henninger, C.E.; Garforth, A.; Asuquo, E. Microfiber Pollution: A Systematic Literature Review to Overcome the Complexities in Knit Design to Create Solutions for Knit Fabrics. Environ. Sci. Technol. 2024, 58, 4031–4045. [Google Scholar] [CrossRef]
- Lv, X.; Dong, Q.; Zuo, Z.; Liu, Y.; Huang, X.; Wu, W.-M. Microplastics in a Municipal Wastewater Treatment Plant: Fate, Dynamic Distribution, Removal Efficiencies, and Control Strategies. J Clean. Prod. 2019, 225, 579–586. [Google Scholar] [CrossRef]
- Talvitie, J.; Heinonen, M.; Pääkkönen, J.P.; Vahtera, E.; Mikola, A.; Setälä, O.; Vahala, R. Do Wastewater Treatment Plants Act as a Potential Point Source of Microplastics? Preliminary Study in the Coastal Gulf of Finland, Baltic Sea. Water Sci. Technol. 2015, 72, 1495–1504. [Google Scholar] [CrossRef]
- Conley, K.; Allan, C.; Jestine, D.; Haven, L.; Barbara, B. Wastewater Treatment Plants as a Source of Microplastics to an Urban Estuary: Removal Efficiencies and Loading per Capita over One Year. Water Res. X 2019, 3, 100030. [Google Scholar] [CrossRef]
- Akarsu, C.; Halil, K.; Kerem, G.; Ahmet, K.; Anna, S.-V. Microplastics Composition and Load from Three Wastewater Treatment Plants Discharging into Mersin Bay, North Eastern Mediterranean Sea. Mar. Pollut. Bull. 2020, 150, 110776. [Google Scholar] [CrossRef]
- Ziajahromi, S.; Neale, P.A.; Rintoul, L.; Leusch, F.D.L. Wastewater Treatment Plants as a Pathway for Microplastics: Development of a New Approach to Sample Wastewater-Based Microplastics. Water Res. 2017, 112, 93–99. [Google Scholar] [CrossRef]
- Magni, S.; Andrea, B.; Lucia, P.; Carlo, G.A.; Camilla, D.T.; Camilla, C.P.; Stefania, G.; Francesco, R. The Fate of Microplastics in an Italian Wastewater Treatment Plant. Sci. Total Environ. 2019, 652, 602–610. [Google Scholar] [CrossRef] [PubMed]
- Bayo, J.; Sonia, O.; Joaquín, L.-C. Microplastics in an Urban Wastewater Treatment Plant: The Influence of Physicochemical Parameters and Environmental Factors. Chemosphere 2020, 238, 124593. [Google Scholar] [CrossRef] [PubMed]
- Long, Z.; Pan, Z.; Wang, W.; Ren, J.; Yu, X.; Lin, L.; Lin, H.; Chen, H.; Jin, X. Microplastic Abundance, Characteristics, and Removal in Wastewater Treatment Plants in a Coastal City of China. Water Res. 2019, 155, 255–265. [Google Scholar] [CrossRef] [PubMed]
- Talvitie, J.; Mikola, A.; Setälä, O.; Heinonen, M.; Koistinen, A. How Well Is Microlitter Purified from Wastewater? A Detailed Study on the Stepwise Removal of Microlitter in a Tertiary Level Wastewater Treatment Plant. Water Res. 2017, 109, 164–172. [Google Scholar] [CrossRef]
- Raju, S.; Carbery, M.; Kuttykattil, A.; Senthirajah, K.; Lundmark, A.; Rogers, Z.; Suresh, S.; Evans, G.; Palanisami, T. Improved Methodology to Determine the Fate and Transport of Microplastics in a Secondary Wastewater Treatment Plant. Water Res. 2020, 173, 115549. [Google Scholar] [CrossRef]
- Lee, H.; Kim, Y. Treatment Characteristics of Microplastics at Biological Sewage Treatment Facilities in Korea. Mar. Pollut. Bull. 2018, 137, 1–8. [Google Scholar] [CrossRef] [PubMed]
- Magnusson, K.; Norén, F. Screening of Microplastic Particles in and Down-Stream a Wastewater Treatment Plant; Report C55; IVL Swedish Environmental Research Institute: Stockholm, Sweden, 2014. [Google Scholar]
- Murphy, F.; Ewins, C.; Carbonnier, F.; Quinn, B. Wastewater Treatment Works (WWTW) as a Source of Microplastics in the Aquatic Environment. Environ. Sci. and Technol. 2016, 50, 5800–5808. [Google Scholar] [CrossRef] [PubMed]
- Ren, P.J.; Dou, M.; Wang, C.; Li, G.Q.; Jia, R. Abundance and Removal Characteristics of Microplastics at a Wastewater 020-09611-5. Treatment Plant in Zhengzhou. Environ. Sci. Pol. Res. 2020, 27, 36295–36305. [Google Scholar] [CrossRef] [PubMed]
- Gündoğdu, S.; Cem, Ç.; Evşen, G.; Serdar, K. Microplastics in Municipal Wastewater Treatment Plants in Turkey: A Comparison of the Influent and Secondary Effluent Concentrations. Environ. Mon Assess. 2018, 190, 626. [Google Scholar] [CrossRef]
- Bilgin, M.; Meral, Y.; Fatih, K. Microplastic Removal by Aerated Grit Chambers versus Settling Tanks of a Municipal Wastewater Treatment Plant. J. Water Process Eng. 2020, 38, 101604. [Google Scholar] [CrossRef]
- Gies, E.A.; Jessica, L.L.; Marie, N.; Anahita, E.; Farida, B.; Eric, R.H.; Peter, S.R. Retention of Microplastics in a Major Secondary Wastewater Treatment Plant in Vancouver, Canada. Mar. Pollut. Bull. 2018, 133, 553–561. [Google Scholar] [CrossRef]
- Ziajahromi, S.; Neale, P.A.; Silveira, I.T.; Chua, A.; Leusch, F.D.L. An Audit of Microplastic Abundance throughout Three Australian Wastewater Treatment Plants. Chemosphere 2021, 263, 128294. [Google Scholar] [CrossRef]
- Leslie, H.A.; Brandsma, S.H.; Van-Velzen, M.J.M.; Vethaak, A.D. Microplastics En Route: Field Measurements in the Dutch River Delta and Amsterdam Canals, Wastewater Treatment Plants, North Sea Sediments and Biota. Environ. Int. 2017, 101, 133–142. [Google Scholar] [CrossRef]
- Xu, X.; Jian, Y.; Xue, Y.; Hou, Q.; Wang, L.P. Microplastics in the Wastewater Treatment Plants (WWTPs): Occurrence and Removal. Chemosphere 2019, 235, 1089–1096. [Google Scholar] [CrossRef]
- Liu, X.; Yuan, W.; Di, M.; Li, Z.; Wang, J. Transfer and Fate of Microplastics during the Conventional Activated Sludge Process in One Wastewater Treatment Plant of China. Chem. Eng. J. 2019, 362, 176–182. [Google Scholar] [CrossRef]
- Michielssen, M.R.; Michielssen, E.R.; Ni, J.; Duhaime, M.B. Fate of Microplastics and Other Small Anthropogenic Litter (SAL) in Wastewater Treatment Plants Depends on Unit Processes Employed. Environ. Sci. Water Res. Technol. 2016, 2, 1064–1073. [Google Scholar] [CrossRef]
- Edo, C.; Miguel, G.-P.; Francisco, L.; Francisca, F.-P.; Rosal, R. Fate of Microplastics in Wastewater Treatment Plants and Their Environmental Dispersion with Effluent and Sludge. Environ Poll. 2020, 259. [Google Scholar] [CrossRef] [PubMed]
- Franco, A.A.; Arellano, J.M.; Albendín, G.; Rodríguez-Barroso, R.; Quiroga, J.M.; Coello, M.D. Microplastic Pollution in Wastewater Treatment Plants in the City of Cádiz: Abundance, Removal Efficiency and Presence in Receiving Water Body. Sci Tot Environ. 2021, 776, 145795. [Google Scholar] [CrossRef]
- Talvitie, J.; Heinonen, M. Preliminary Study on Synthetic Microfibers and Particles at a Municipal Wastewater Treatment Plant; HELCOM BASE Project—Implementation of the Baltic Sea Action Plan in Russia; Baltic Marine Environment Protection Commission; Helsinki Commission: Helsinki, Finland, 2014. [Google Scholar]
- Hidayaturrahman, H.; Tae-Gwan, L. A Study on Characteristics of Microplastic in Wastewater of South Korea: Identification, Quantification, and Fate of Microplastics during Treatment Process.” Mar. Pollut. Bull. 2019, 146, 696–702. [Google Scholar] [CrossRef]
- Simon, M.; Alst, N.V.; Vollertsen, J. Quantification of Microplastic Mass and Removal Rates at Wastewater Treatment Plants Applying Focal Plane Array (FPA)-Based Fourier Transform Infrared (FT-IR) Imaging. Water Res. 2018, 142, 1–9. [Google Scholar] [CrossRef]


Disclaimer/Publisher’s Note: The statements, opinions and data contained in all publications are solely those of the individual author(s) and contributor(s) and not of MDPI and/or the editor(s). MDPI and/or the editor(s) disclaim responsibility for any injury to people or property resulting from any ideas, methods, instructions or products referred to in the content. |
© 2025 by the authors. Licensee MDPI, Basel, Switzerland. This article is an open access article distributed under the terms and conditions of the Creative Commons Attribution (CC BY) license (https://creativecommons.org/licenses/by/4.0/).