
Economic Operation Optimization for Electric Heavy-Duty Truck Battery Swapping Stations Considering Time-of-Use Pricing


Abstract
1. Introduction
2. System Model
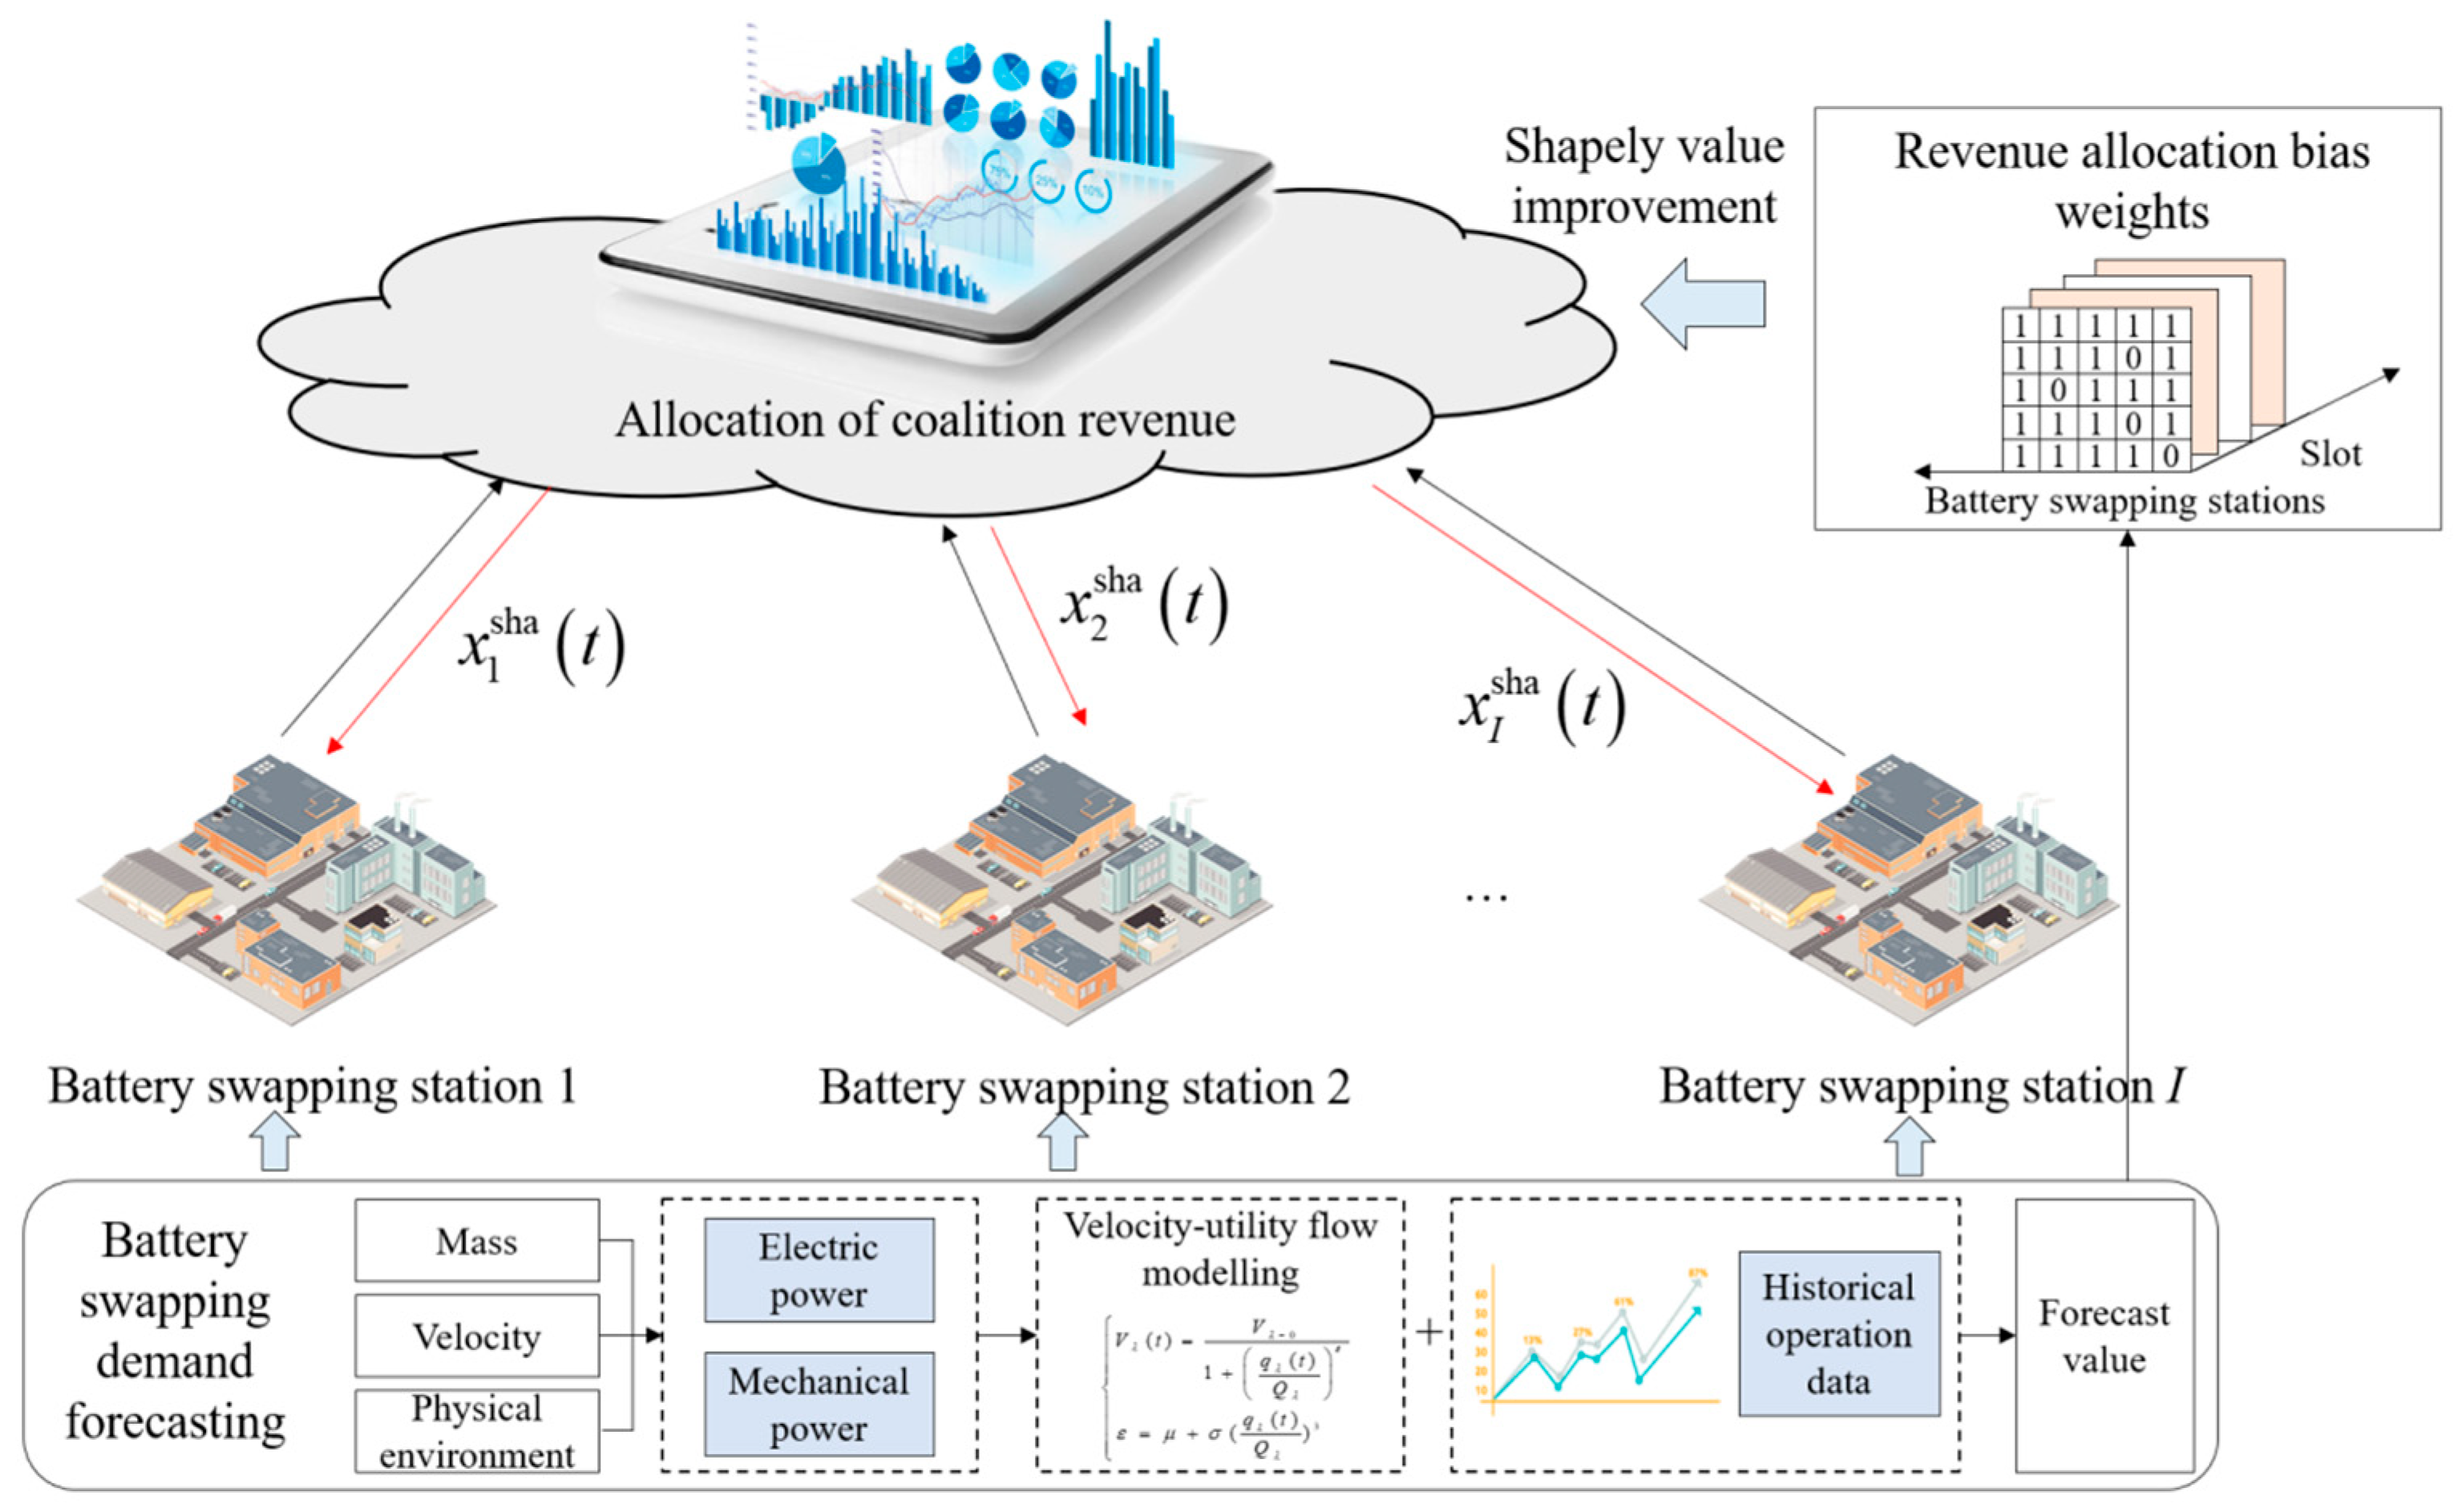
2.1. Demand-Forecasting Model for Battery Swapping Considering Multi-Dimensional Factors
2.2. Time-of-Use Pricing
2.3. Operational Model of a Battery-Swapping Station
2.4. Peak-Shaving and Valley-Filling Effect Model
2.5. Model of Economic Operations of a Battery-Swapping Station
2.5.1. Charging Revenue
2.5.2. Cost of Time-of-Use Pricing
2.5.3. Total Revenue
3. Optimization of Economic Operations for a Coalition of Battery-Swapping Stations Based on Adaptive Shapley Value
3.1. Optimization Problem Modeling
3.2. An Improved Shapley Value Model for the Economic Operation of Electric Heavy-Duty Truck Battery-Swapping Stations
3.3. Improved Shapley Game Model Constraints
4. Process of Optimization of Economic Operations for a Coalition of Battery-Swapping Stations Based on the Adaptive Shapley Value
- Sample starting points and initial departure times of electric heavy-duty trucks.
- Sample the distance from the starting points to the BSSs.
- Determine the travel velocity on each road based on road grade and traffic flow.
- Determine the weight of the cargo based on order information.
- Calculate the energy consumption of the electric heavy-duty truck upon reaching the BSS.
- Assess whether the electric heavy-duty truck requires battery swapping.
- We sum the number of electric heavy-duty trucks requiring battery swapping and combine the resulting value with historical operational data to obtain the BSS demand.
- Each BSS submits its demand forecast and charging strategy based on time-of-use pricing.
- The marginal contribution of each station to the coalition is calculated using the characteristic function.
- The revenue-allocation bias weights are dynamically adjusted to ensure a fair distribution of coalition revenue.
- An iterative optimization process is conducted to refine the revenue allocation and charging strategy until an equilibrium state is reached.
- The BSS enters its operational state.
- Each BSS submits applications based on its basic demand forecast.
- To maximize coalition revenue, the charging needs of each entity are evaluated against the constraints at the model runtime, as specified by (22), (26), and (27), to determine the charging scheme for the BSSs.
- The marginal cost of the BSS operation is calculated, and the weights are optimized based on the basic demand forecast of the BSS and time-of-use pricing.
- The marginal cost in Step 4 and the charging strategy in Step 3 are brought into the characteristic function to realize the optimization of the economic operations of the BSSs based on the adaptive Shapley value and compute the subject’s optimal charging strategy to obtain both the charging strategy and the revenue-allocation scheme.
- Adjust according to the revenue-allocation scheme and compare the current revenue value with the previous value. If the deviation is below the threshold, the optimization ends; otherwise, take the current price into step 4, replace the marginal price cost, and continue the optimization.
| Algorithm 1. Optimization of Economic Operations for a Swapping-Station Coalition based on Adaptive Shapley Value. | |
| 1 | Initialization: |
| 2 | Initialize charging strategy for all stations; |
| 3 | Set iteration counter , max iterations , and convergence threshold ; |
| 4 | Iterative Optimization: |
| 5 | while and |
| 6 | ; |
| 7 | for each time slot do |
| 8 | Step 1: Demand Forecasting |
| 9 | for each station do |
| 10 | Calculate predicted demand via Monte Carlo and Equation (11); |
| 11 | end for |
| 12 | Step 2: Run Adaptive Shapley Value Game |
| 13 | for each station do |
| 14 | Calculate marginal contributions for all ; |
| 15 | Calculate expected influence factor and bias weight via Equation (24); |
| 16 | end for |
| 17 | Calculate adaptive Shapley value for each station via Equations (23) and (25); |
| 18 | Step 3: Optimization and Policy Update |
| 19 | Solve optimization problem P1 (Equation (22)) to obtain optimal charging power ; |
| 20 | end for |
| 21 | Update policy and total coalition revenue ; |
| 22 | end while |
| 23 | Output: optimized charging strategy and profit-allocation scheme. |
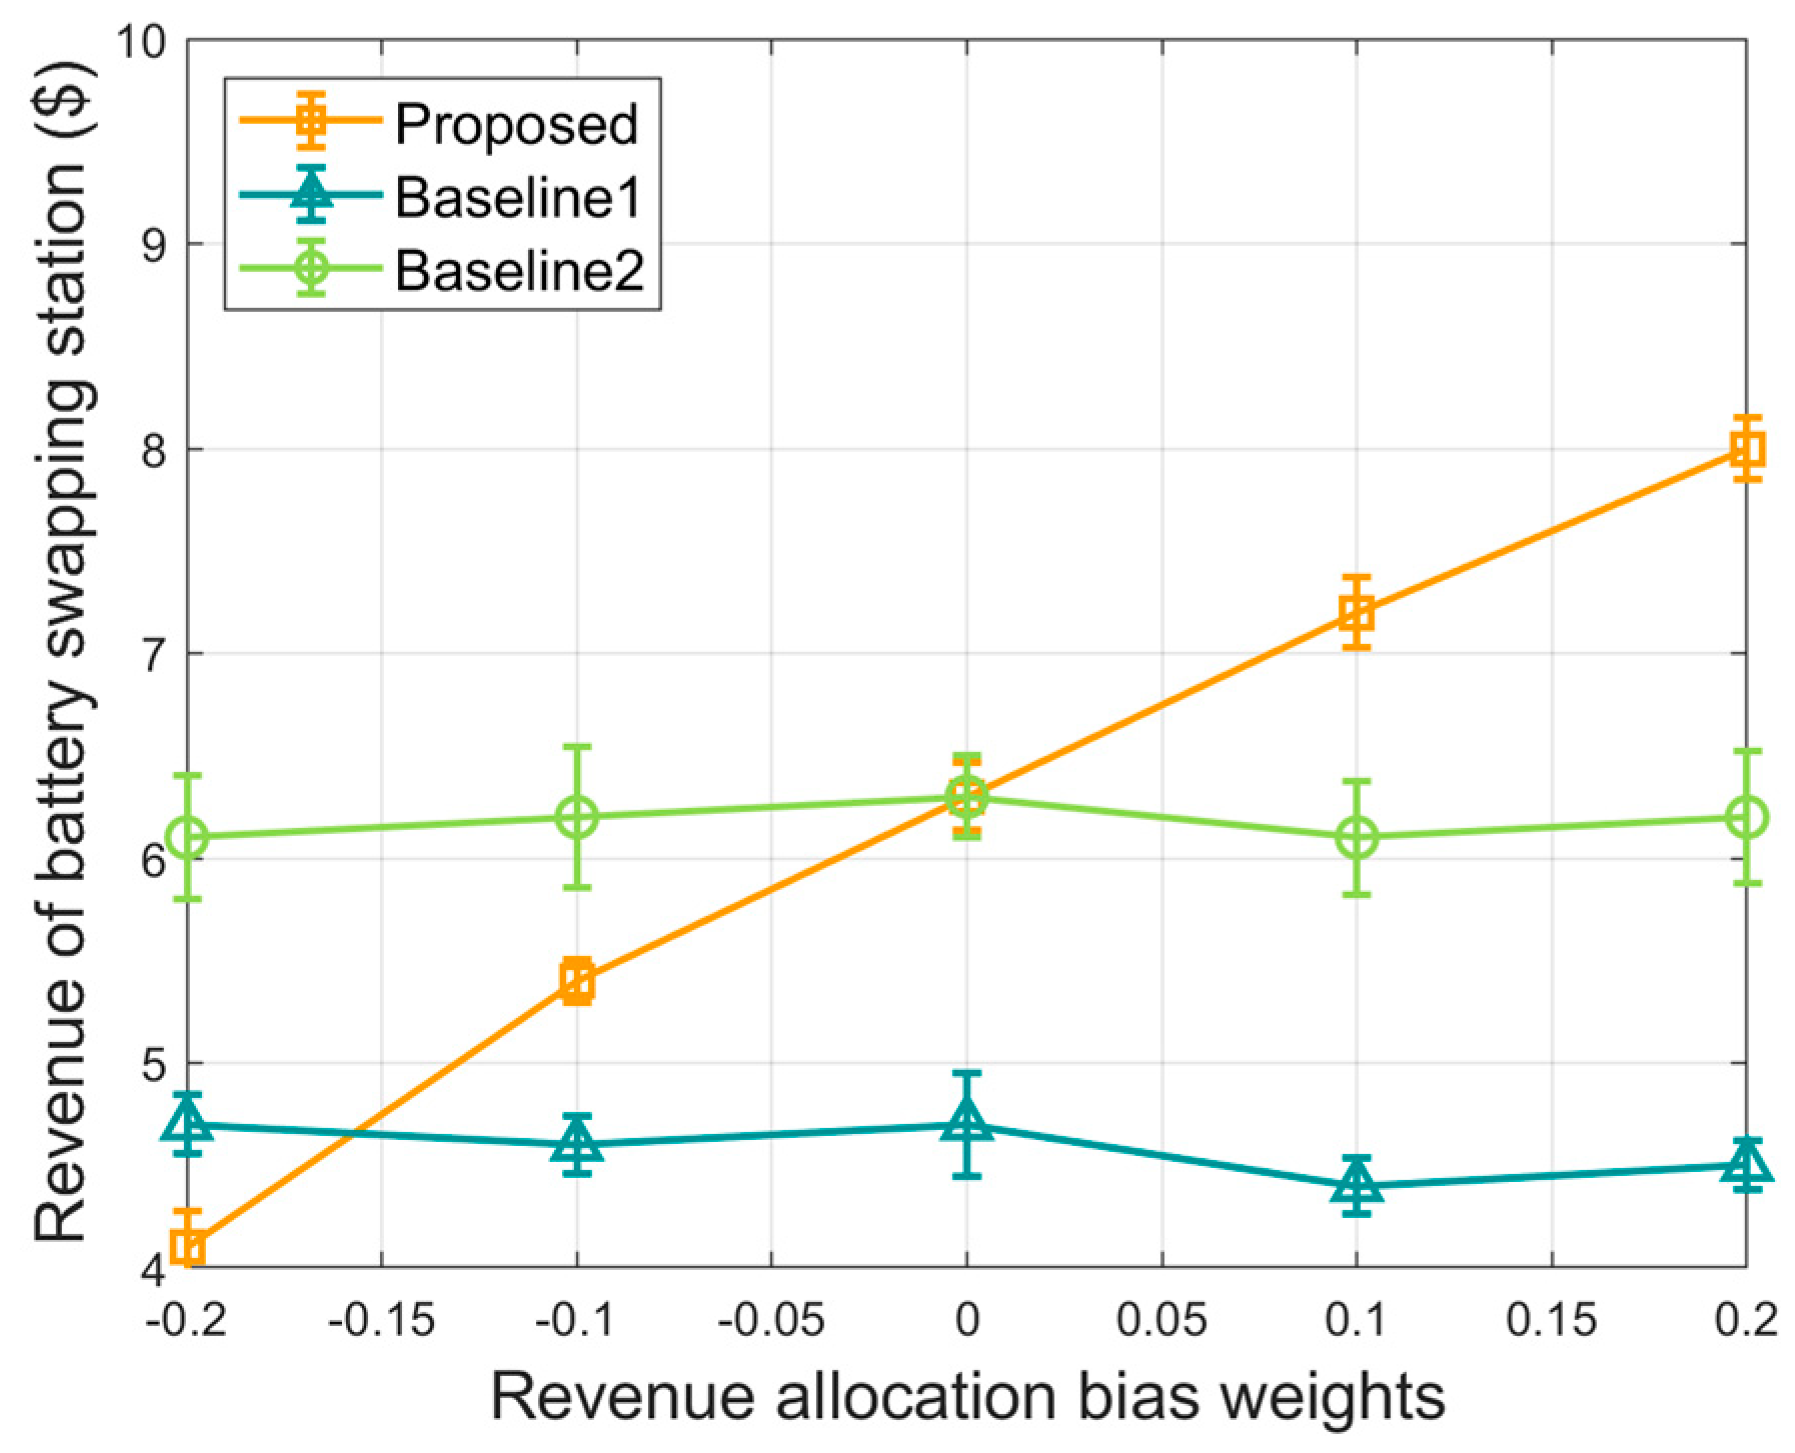
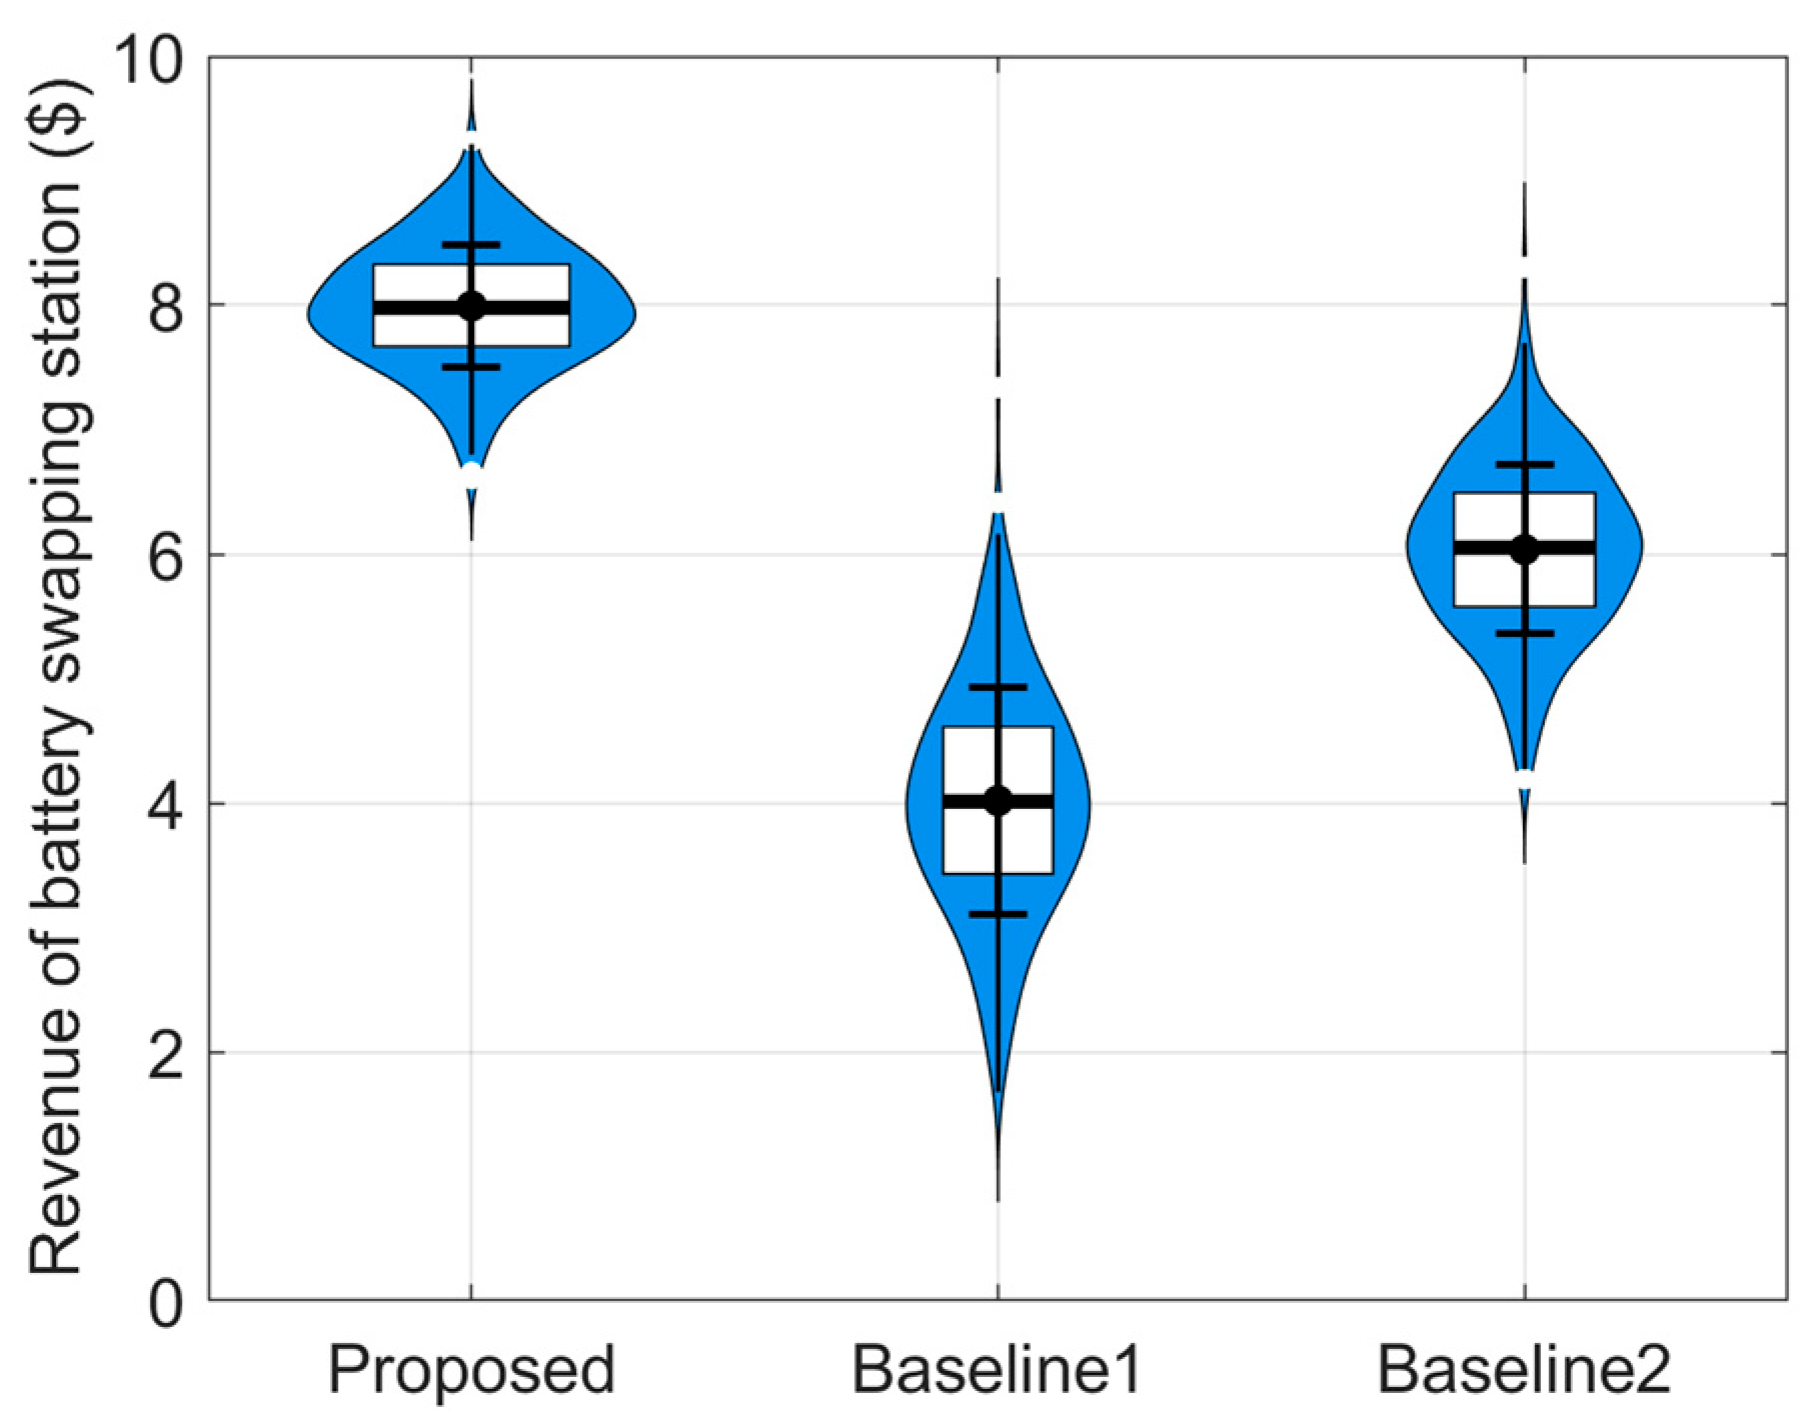
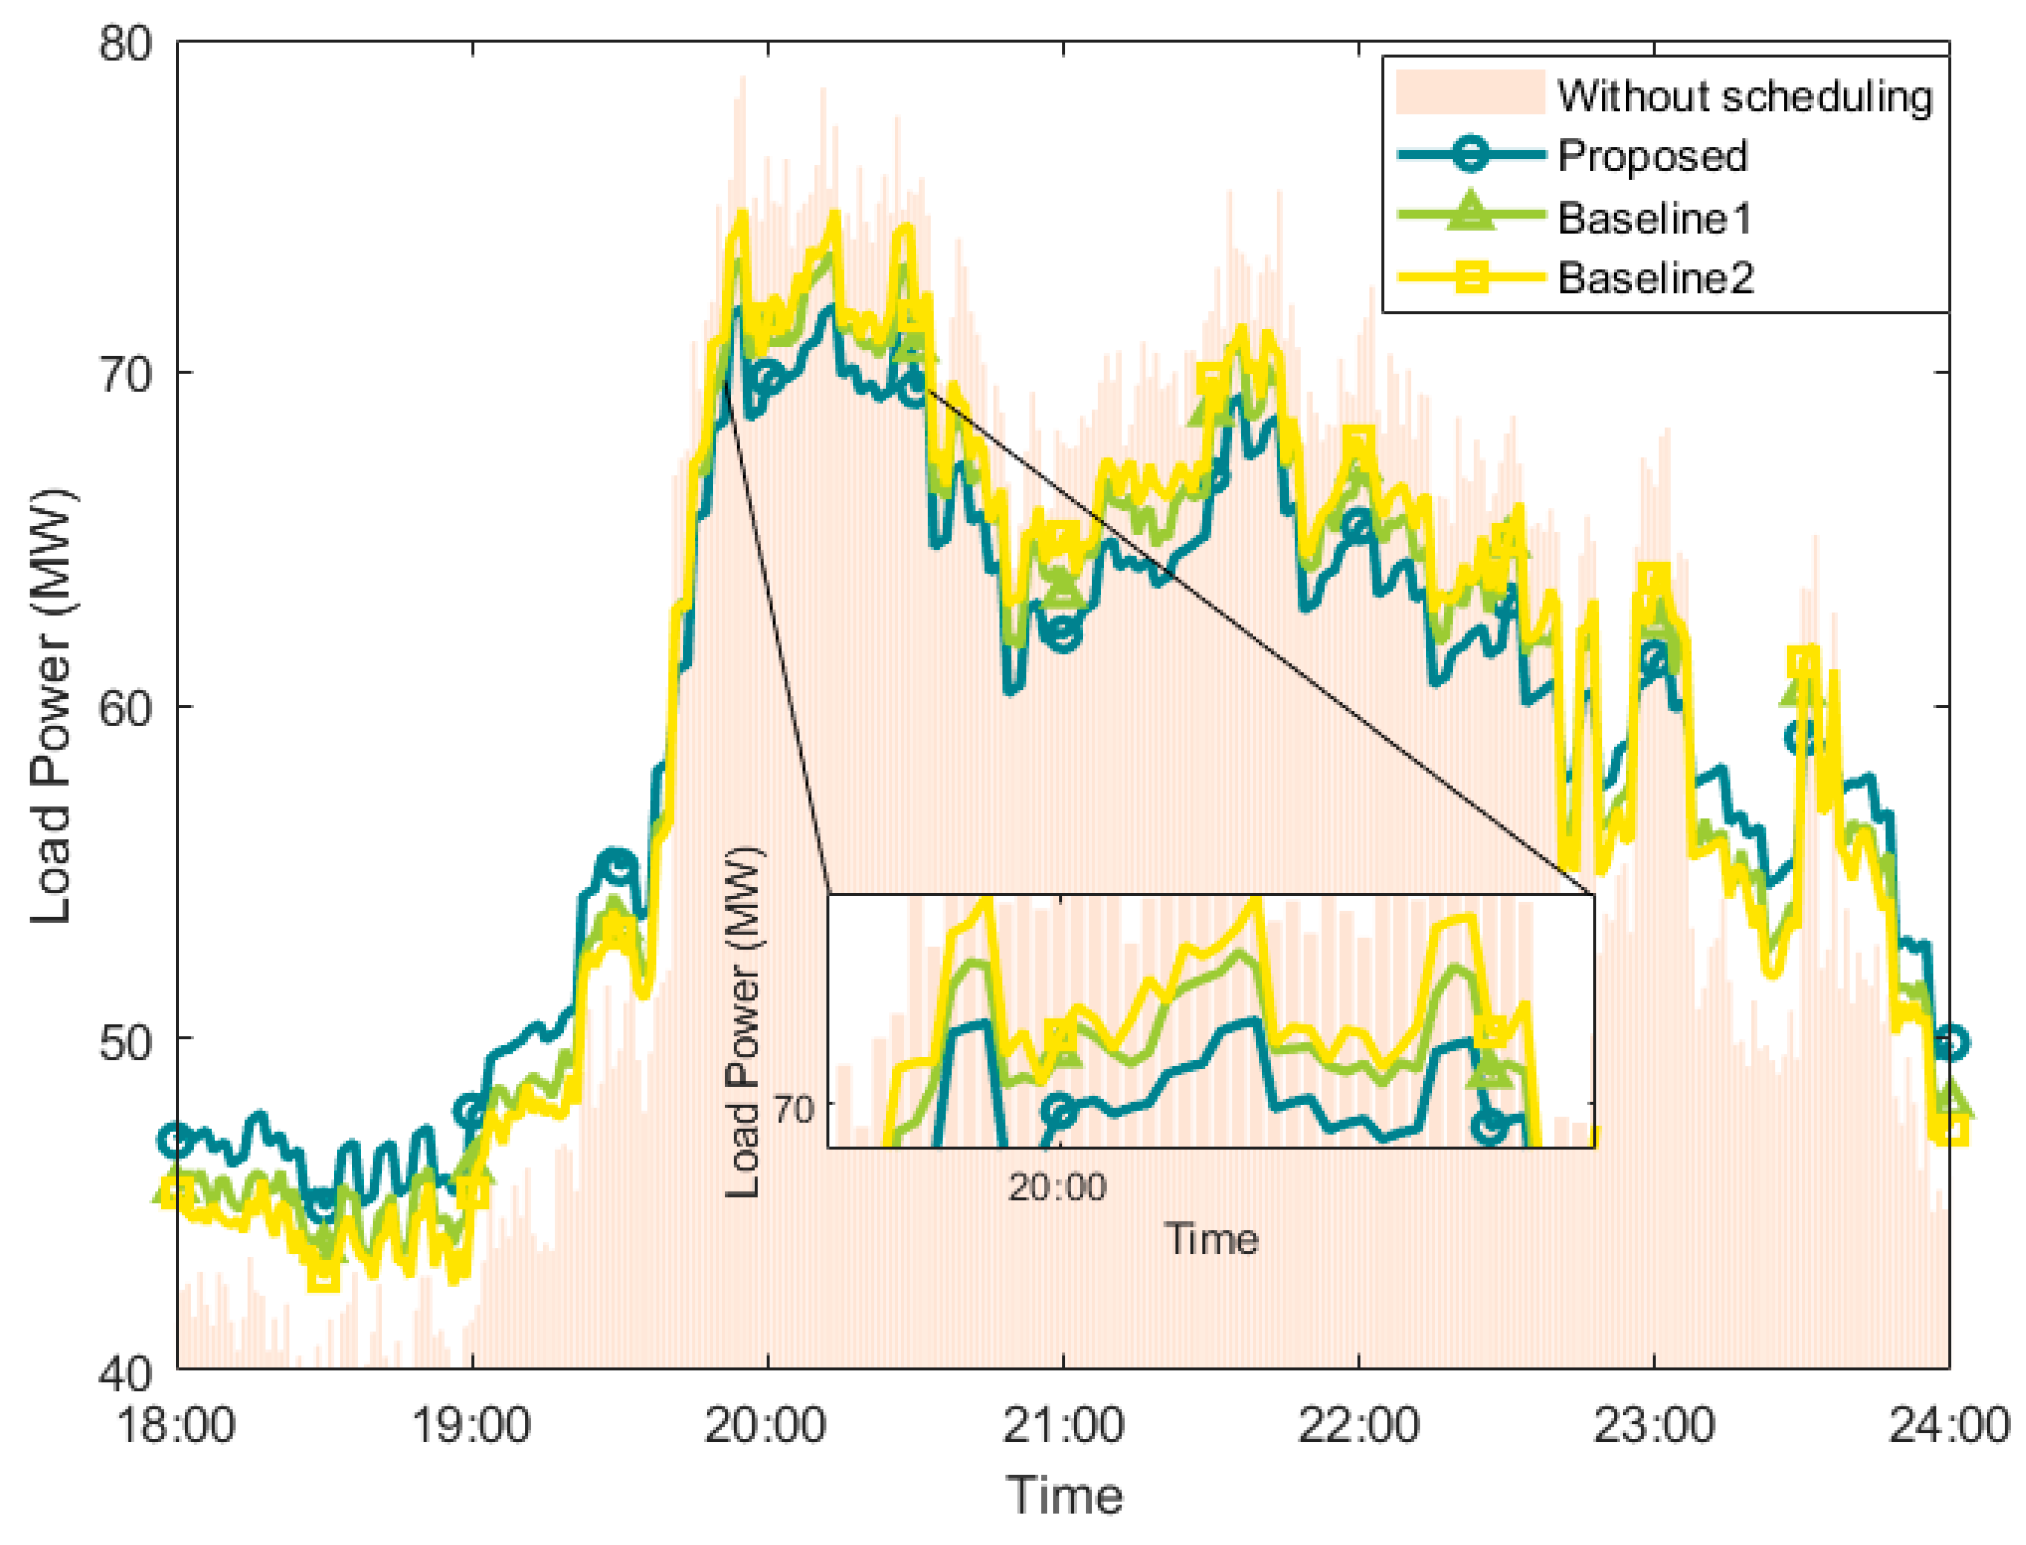
5. Simulation
6. Conclusions
Author Contributions
Funding
Data Availability Statement
Acknowledgments
Conflicts of Interest
Nomenclature
| Set of BSSs | Battery power | ||
| Total number of BSSs | Battery efficiency during discharging/charging | ||
| Set of time slots in a day | Overall energy conversion efficiency | ||
| Total number of time slots | Energy consumption of an electric heavy-duty truck for a single trip | ||
| Time step of a time slot | Driving distance | ||
| Rated capacity of a battery | Speed on road at time slot | ||
| Rated charging power of a battery | Free-flow speed on road | ||
| Driving force of the electric heavy-duty truck | Traffic flow on road at time slot | ||
| Total mass of the electric heavy-duty truck | Maximum capacity of road | ||
| Acceleration | Adaptive coefficients in the speed-flow utility model | ||
| Rolling resistance | Predicted swapping demand for station at time slot | ||
| Aerodynamic drag | Base and extreme demands from statistical forecasting | ||
| Grade resistance | Energy threshold for swapping | ||
| Gravitational acceleration | Weighting factor and probability in the demand-forecasting model | ||
| Rolling resistance coefficient | Indicator function (1 if condition is true, 0 otherwise) | ||
| Road grade | Time-of-use price for purchasing electricity from the grid | ||
| Frontal area of the electric heavy-duty truck | Peak, flat, and valley electricity prices | ||
| Air density | Background load value | ||
| Aerodynamic drag coefficient | Average load value | ||
| Instantaneous speed | Sum of squared deviations of the load curve | ||
| Mechanical power | Revenue from charging services | ||
| Electric power | Charging service price for electric heavy-duty trucks | ||
| Motor system efficiency regression coefficients for driving/regenerative braking | Cost of purchasing electricity | ||
| Total number of batteries at station | Total revenue of the coalition | ||
| Number of fully charged batteries | Value of the optimization objective function | ||
| Number of non-input rechargeable batteries | Number of rechargeable batteries | ||
| Total charging power of station | Weighting coefficient to balance revenue and load fluctuation | ||
| Charging power of station at time (decision variable) | Characteristic function (coalition revenue) of coalition at time | ||
| Minimum/Maximum charging power of station | Traditional Shapley value revenue for member | ||
| Expected influence factor | Revenue allocation bias weight for member | ||
| Adaptive Shapley value revenue for member |
References
- Connor, W.D.; Wang, Y.; Malikopoulos, A.A.; Advani, S.G.; Prasad, A.K. Impact of connectivity on energy consumption and battery life for electric vehicles. IEEE Trans. Intell. Veh. 2021, 6, 14–23. [Google Scholar] [CrossRef]
- Wang, Y.; Ding, W.; Huang, L.; Wei, Z.; Liu, H.; Stankovic, J.A. Toward urban electric taxi systems in smart cities: The battery swapping challenge. IEEE Trans. Veh. Technol. 2018, 67, 1946–1960. [Google Scholar] [CrossRef]
- Yang, J.; Wang, W.; Ma, K.; Yang, B.; Dou, C.-X. Optimization and self-adaptive dispatching strategy for multiple shared battery stations of electric vehicles. IEEE Trans. Ind. Inform. 2021, 17, 1363–1374. [Google Scholar] [CrossRef]
- Mueller, C. Transition to battery-electric and fuel cell heavy-duty trucks: A multi-level, multi-dimensional approach. Transportation research, Part D. Transp. Environ. 2024, 127, 104052.1–104052.17. [Google Scholar]
- Gunawan, T.A.; Monaghan, R.F.D. Techno-econo-environmental comparisons of zero- and low-emission heavy-duty trucks. Appl. Energy 2022, 308, 118327–118339. [Google Scholar] [CrossRef]
- Borlaug, B.; Muratori, M.; Gilleran, M.; Woody, D.; Muston, W.; Canada, T.; Ingram, A.; Gresham, H.; McQueen, C. Heavy-duty truck electrification and the impacts of depot charging on electricity distribution systems. Nat. Energy 2021, 6, 673–682. [Google Scholar] [CrossRef]
- Liu, B.; Chen, J.; Zhang, N.; Liu, J. Optimized scheduling of an integrated energy system with an electric truck battery swapping station. Processes 2024, 12, 84. [Google Scholar] [CrossRef]
- Fang, C.; Zhao, X.; Xu, Q.; Feng, D.; Wang, H.; Zhou, Y. Aggregator-based demand response mechanism for electric vehicles participating in peak regulation in valley time of receiving-end power grid. Glob. Energy Interconnect. 2020, 3, 453–463. [Google Scholar] [CrossRef]
- Li, S.; Zhao, P.; Gu, C.; Li, J.; Huo, D.; Cheng, S. Aging mitigation for battery energy storage system in electric vehicles. IEEE Trans. Smart Grid 2023, 14, 2152–2163. [Google Scholar] [CrossRef]
- Wu, C.; Lin, X.; Sui, Q.; Wang, Z.; Feng, Z.; Li, Z. Two-stage self-scheduling of battery swapping station in day-ahead energy and frequency regulation markets. Appl. Energy 2021, 283. [Google Scholar] [CrossRef]
- Yuan, H.; Wei, G.; Zhu, L.; Zhang, X.; Zhang, H.; Luo, Z.; Hu, J. Optimal scheduling for micro grid considering EV charging-swapping-storage integrated station. IET Gener. Transm. Distrib. 2020, 14, 1127–1137. [Google Scholar] [CrossRef]
- Wu, H.; Pang, G.K.H.; Choy, K.L.; Lam, H.Y. An optimization model for electric vehicle battery charging at a battery swapping station. IEEE Trans. Veh. Technol. 2018, 67, 881–895. [Google Scholar] [CrossRef]
- Esmaeili, S.; Anvari-Moghaddam, A.; Jadid, S. Optimal operation scheduling of a microgrid incorporating battery swapping stations. IEEE Trans. Power Syst. 2019, 34, 5063–5072. [Google Scholar] [CrossRef]
- Bichler, M.; Kalagnanam, J.; Katircioglu, K.; King, A.J.; Lawrence, R.D.; Lee, H.S.; Lin, G.Y.; Lu, Y. Applications of flexible pricing in business-to-business electronic commerce. IBM Syst. J. 2002, 41, 287–302. [Google Scholar] [CrossRef]
- Li, B.; Guo, Y.; Du, Q.; Zhu, Z. PP33: Privacy-preserving prediction of real-time energy demands in ev charging networks. IEEE Trans. Ind. Inform. 2023, 19, 3029–3038. [Google Scholar] [CrossRef]
- Kim, H.J.; Kim, M.K. Spatial-temporal graph convolutional-based recurrent network for electric vehicle charging stations demand forecasting in energy market. IEEE Trans. Smart Grid 2024, 15, 3979–3993. [Google Scholar] [CrossRef]
- Hu, T.; Ma, H.; Liu, H.; Sun, H.; Liu, K. Self-attention-based machine theory of mind for electric vehicle charging demand forecast. IEEE Trans. Ind. Inform. 2022, 18, 8191–8202. [Google Scholar] [CrossRef]
- Li, H.; Xia, Y.; Yu, S.; Zhao, X.; Fang, C.; Feng, D.; Zhou, Y. Research on capacity expansion and planning for urban electric vehicle charging station based on user-side active charging guidance. Proc. Chin. Soc. Electr. Eng. 2023, 43, 5342–5357. [Google Scholar]
- Zou, N.; Liu, X.; Wang, Y.; Zhang, M. Optimal dispatchable space considering aggregation of ev swapping and charging stations to participate in demand response. In Proceedings of the 2023 IEEE 3rd International Conference on Power, Electronics and Computer Applications, Shenyang, China, 29–31 January 2023; pp. 277–282. [Google Scholar]
- Sun, X.; Xie, H.; Xiao, Y.; Bie, Z. Incentive compatible pricing for enhancing the controllability of price-based demand response. IEEE Trans. Smart Grid 2024, 15, 418–430. [Google Scholar] [CrossRef]
- Wen, L.; Zhou, K.; Feng, W.; Yang, S. Demand side management in smart grid: A dynamic-price-based demand response model. IEEE Trans. Eng. Manag. 2024, 71, 1439–1451. [Google Scholar] [CrossRef]
- Jin, Y.; Yu, B.; Seo, M.; Han, S. Optimal aggregation design for massive V2G participation in energy market. IEEE Access 2020, 8, 211794–211808. [Google Scholar] [CrossRef]
- Sadeghianpourhamami, N.; Deleu, J.; Develder, C. Definition and evaluation of model-free coordination of electrical vehicle charging with reinforcement learning. IEEE Trans. Smart Grid 2020, 11, 203–214. [Google Scholar] [CrossRef]
- Borgonovo, E.; Plischke, E.; Rabitti, G. The many Shapley values for explainable artificial intelligence: A sensitivity analysis perspective. Eur. J. Oper. Res. 2024, 318, 911–926. [Google Scholar] [CrossRef]
- Liu, X.; Wang, X.; Zhang, Y.; Liu, L. Application of Shapley value in cooperative game theory for multi-agent systems. IEEE Trans. Syst. Man. Cybern. Syst. 2020, 50, 1234–1245. [Google Scholar]
- Zhang, H.; Chen, Y.; Li, M.; Wang, J. A game-theoretic approach for energy management in microgrids using Shapley value. IEEE Trans. Smart Grid 2021, 12, 56–65. [Google Scholar]
- Yang, K.; Li, R.; Huang, D.; Wu, Y. Shapley value-based resource allocation in cloud computing environments. IEEE Trans. Cloud Comput. 2019, 7, 789–800. [Google Scholar]
- Kim, J.; Park, S.; Lee, H.; Kim, C. Fair resource allocation in wireless networks based on Shapley value. IEEE Trans. Wirel. Commun. 2022, 21, 45–55. [Google Scholar]
- Zhang, L.; Gao, X.; Liu, Y.; Wang, M. Shapley value in multi-criteria decision making for smart grid. IEEE Trans. Power Syst. 2023, 38, 987–999. [Google Scholar]
- Mohamed, A.A.S.; Jun, M.; Mahmud, R.; Mishra, P.; Patel, S.N.; Tolbert, I. Hierarchical control of megawatt-scale charging stations for electric trucks with distributed energy resources. IEEE Trans. Transp. Electrif. 2023, 9, 4951–4963. [Google Scholar] [CrossRef]
- Li, Y.; Cai, Y.; Zhao, T.; Liu, Y.; Wang, J.; Wu, L.; Zhao, Y. Multi-objective optimal operation of centralized battery swap charging system with photovoltaic. J. Mod. Power Syst. Clean. Energy 2022, 10, 149–162. [Google Scholar] [CrossRef]
- Liu, C.; Wang, C.; Yao, W.; Liu, C. Distributed low-carbon economic dispatching for multiple park-level integrated energy systems based on improved Shapley value. IEEE Trans. Ind. Appl. 2024, 60, 8088–8102. [Google Scholar] [CrossRef]
- Wang, Z.; Sun, P.; Hu, Y.; Boukerche, A. A novel hybrid method for achieving accurate and timeliness vehicular traffic flow prediction in road networks. Comput. Commun. 2023, 209, 378–386. [Google Scholar] [CrossRef]


| Role in Balancing Grid Load | Role in Carbon Neutrality | Multidimensional Load Forecasting | Improvement of Shapley Value | Comprehensive Revenue Optimization | ||
|---|---|---|---|---|---|---|
| Peak Shaving and Valley Filling | Revenue Maximization | |||||
| [4] | ✗ | ✓ | ✗ | ✗ | ✗ | ✓ |
| [5] | ✗ | ✓ | ✗ | ✓ | ✗ | ✓ |
| [6] | ✓ | ✗ | ✗ | ✗ | ✓ | ✗ |
| [7] | ✓ | ✗ | ✓ | ✓ | ✓ | ✗ |
| Baseline 1 [14] | ✗ | ✗ | ✗ | ✓ | ✗ | ✓ |
| Baseline 2 [18] | ✓ | ✗ | ✓ | ✗ | ✓ | ✗ |
| Proposed | ✓ | ✓ | ✓ | ✓ | ✓ | ✓ |
| Parameter | Definition | Value |
|---|---|---|
| Number of BSSs | 5 | |
| Total daily time slots (5 min step) | 288 | |
| Speed-flow utility model shape coefficient | {1.72, 2.07, 2.39} | |
| Speed-flow utility model adjustment coefficient | {3.15, 2.87, 2.56} | |
| Peak electricity price | 0.167 $/kWh | |
| Flat electricity price | 0.127 $/kWh | |
| Valley electricity price | 0.091 $/kWh | |
| Weight of squared load deviations | [0.4, 1.6] |
Disclaimer/Publisher’s Note: The statements, opinions and data contained in all publications are solely those of the individual author(s) and contributor(s) and not of MDPI and/or the editor(s). MDPI and/or the editor(s) disclaim responsibility for any injury to people or property resulting from any ideas, methods, instructions or products referred to in the content. |
© 2025 by the authors. Licensee MDPI, Basel, Switzerland. This article is an open access article distributed under the terms and conditions of the Creative Commons Attribution (CC BY) license (https://creativecommons.org/licenses/by/4.0/).
Share and Cite
Shi, P.; Ni, G.; Jin, R.; Wang, H.; Wang, J.; Chen, X. Economic Operation Optimization for Electric Heavy-Duty Truck Battery Swapping Stations Considering Time-of-Use Pricing. Processes 2025, 13, 2271. https://doi.org/10.3390/pr13072271
Shi P, Ni G, Jin R, Wang H, Wang J, Chen X. Economic Operation Optimization for Electric Heavy-Duty Truck Battery Swapping Stations Considering Time-of-Use Pricing. Processes. 2025; 13(7):2271. https://doi.org/10.3390/pr13072271
Chicago/Turabian StyleShi, Peijun, Guojian Ni, Rifeng Jin, Haibo Wang, Jinsong Wang, and Xiaomei Chen. 2025. "Economic Operation Optimization for Electric Heavy-Duty Truck Battery Swapping Stations Considering Time-of-Use Pricing" Processes 13, no. 7: 2271. https://doi.org/10.3390/pr13072271
APA StyleShi, P., Ni, G., Jin, R., Wang, H., Wang, J., & Chen, X. (2025). Economic Operation Optimization for Electric Heavy-Duty Truck Battery Swapping Stations Considering Time-of-Use Pricing. Processes, 13(7), 2271. https://doi.org/10.3390/pr13072271