Article

The Influence of Secondary Air Guide Vanes on the Flow Field and Performance of a Turbine Air Classifier

College of Materials Science and Engineering, Nanjing Tech University, Nanjing 211816, China
*
Author to whom correspondence should be addressed.
Processes 2025, 13(7), 2268; https://doi.org/10.3390/pr13072268
Submission received: 24 June 2025 / Revised: 11 July 2025 / Accepted: 15 July 2025 / Published: 16 July 2025
(This article belongs to the Section Separation Processes)

Abstract

To address the issue where the axial negative velocity on the cylinder wall of the traditional bottom-inlet rotor classifier causes fine particles to be mixed into coarse powder, reducing classification efficiency, this study proposes adding guide vanes to the rotor classifier. By improving the stability of the secondary elutriation flow field, we enhance the secondary classification of coarse particles. Airflow simulations based on ANSYS Fluent show that the guide vanes can significantly strengthen the intensity of the secondary elutriation zone, increase the tangential velocity in the classification zone, and reduce the particle concentration in the secondary air volute. The key results are as follows: when the installation angle is 30°, the classification accuracy reaches its peak with K = 0.71, and the cut size D50 = 48.9 μm. This research provides a theoretical basis for optimizing the structural design of classifiers.

1. Introduction

Particle classification is the process of classifying or grading particles according to their size, shape, or other characteristics. Turbo air classifiers are widely used in food, medicine, chemical industry, materials, and other fields [1,2]. The rotor classifier is a third-generation classifier. It features a simple structure, adjustable operating parameters, and produces fine powder products with a wide particle size range.
With the rapid development of computational fluid dynamics (CFD), the modeling and analysis of classifiers have received extensive attention and research [3,4,5,6]. Some researchers have improved classification performance by optimizing the classifier’s process parameters. For example, Esmaeilpour [7] and Kim [8] investigated the effect of rotor rotational speed on the classification performance. Their results showed that the cut particle size decreased gradually as the rotational speed increased. Abohelwa [9] established an equilibrium relationship between rotor speed and inlet wind speed. Satisfying this equilibrium condition enabled the best separation effect with high classification accuracy. This conclusion has also been experimentally verified by some scholars [10,11,12]. Other researchers have also optimized the structure of the classifier to enhance classification performance. For instance, Mou [13] and Jia [14] studied the effect of conical rotary cages on the velocity of the classification zone. They found that a suitable tilting angle can effectively improve the flow field distribution in the grading zone and enhance the grading performance. Similarly, Li [15] and Yang [16] investigated the effect of the size of the deflector cone on the grading performance. Their findings revealed that as the height of the deflector cone increased, the flow field distribution became more uniform, leading to higher grading accuracy.
Guide vanes are important components of rotor classifiers. Their optimization is typically conducted through experiments, numerical simulations, and analyses. Yu [17] designed a guide vane with a setting angle of 10° based on the airflow trajectory in the volute. This design effectively eliminated the uneven flow field distribution in the annular region, thereby achieving consistent separation results for particles of the same size. Liu [18] designed an axially inclined guide vane model to reduce the axial positive velocity in the annular region. It was found that at an inclination angle of 2.5°, the airflow distribution became uniform and flow field stability improved. To address the problem of ultrafine particle agglomeration, Yu [19] designed a guide vane with a cylindrical tail. Experiments showed that when the cylinder diameter was greater than or equal to 2 mm, it significantly impacted powder dispersibility. Huang [20] compared the effects of straight, positive bow, and negative bow blades on the classifier’s flow field. The results demonstrated that positive bow blades substantially improved the tangential and radial velocity distributions in the annular region. Zeng [21] designed three guide vane types: straight, L-shaped, and logarithmic spiral. Analyses of tangential and radial velocity distributions confirmed that logarithmic spiral guide vanes enabled airflow to follow the rotating cage uniformly. Liu [22] numerically simulated the influence of guide vane position on the annular region flow field. Simulations revealed that increasing the annular region width decreased tangential velocity near the guide vane’s inner edge and increased the tangential velocity gradient. Although significant progress has been made in these studies, most research on guide vanes has focused on optimizing structural parameters, with limited exploration of their impact on the stability of the secondary elutriation flow field. Conversely, some scholars [23,24,25] have focused on analyzing the contribution of the secondary air elutriation flow field and the primary air effect to classification performance, yet they generally overlook the potential role of guide vanes in regulating this flow field. To address this research gap, this paper conducts an in-depth investigation into the influence mechanism of guide vanes on the stability of the secondary elutriation flow field.
In this study, ANSYS Fluent 19.2 software is used to model and simulate the flow field within the rotor classifier, investigating the influence of its guide vanes on the internal flow field and particle classification performance. Additionally, the simulation results are validated through material classification experiments. This research not only proposes a method for flow field improvement but also provides a theoretical basis for the design and optimization of rotor classifiers.

2. Calculation Methodology

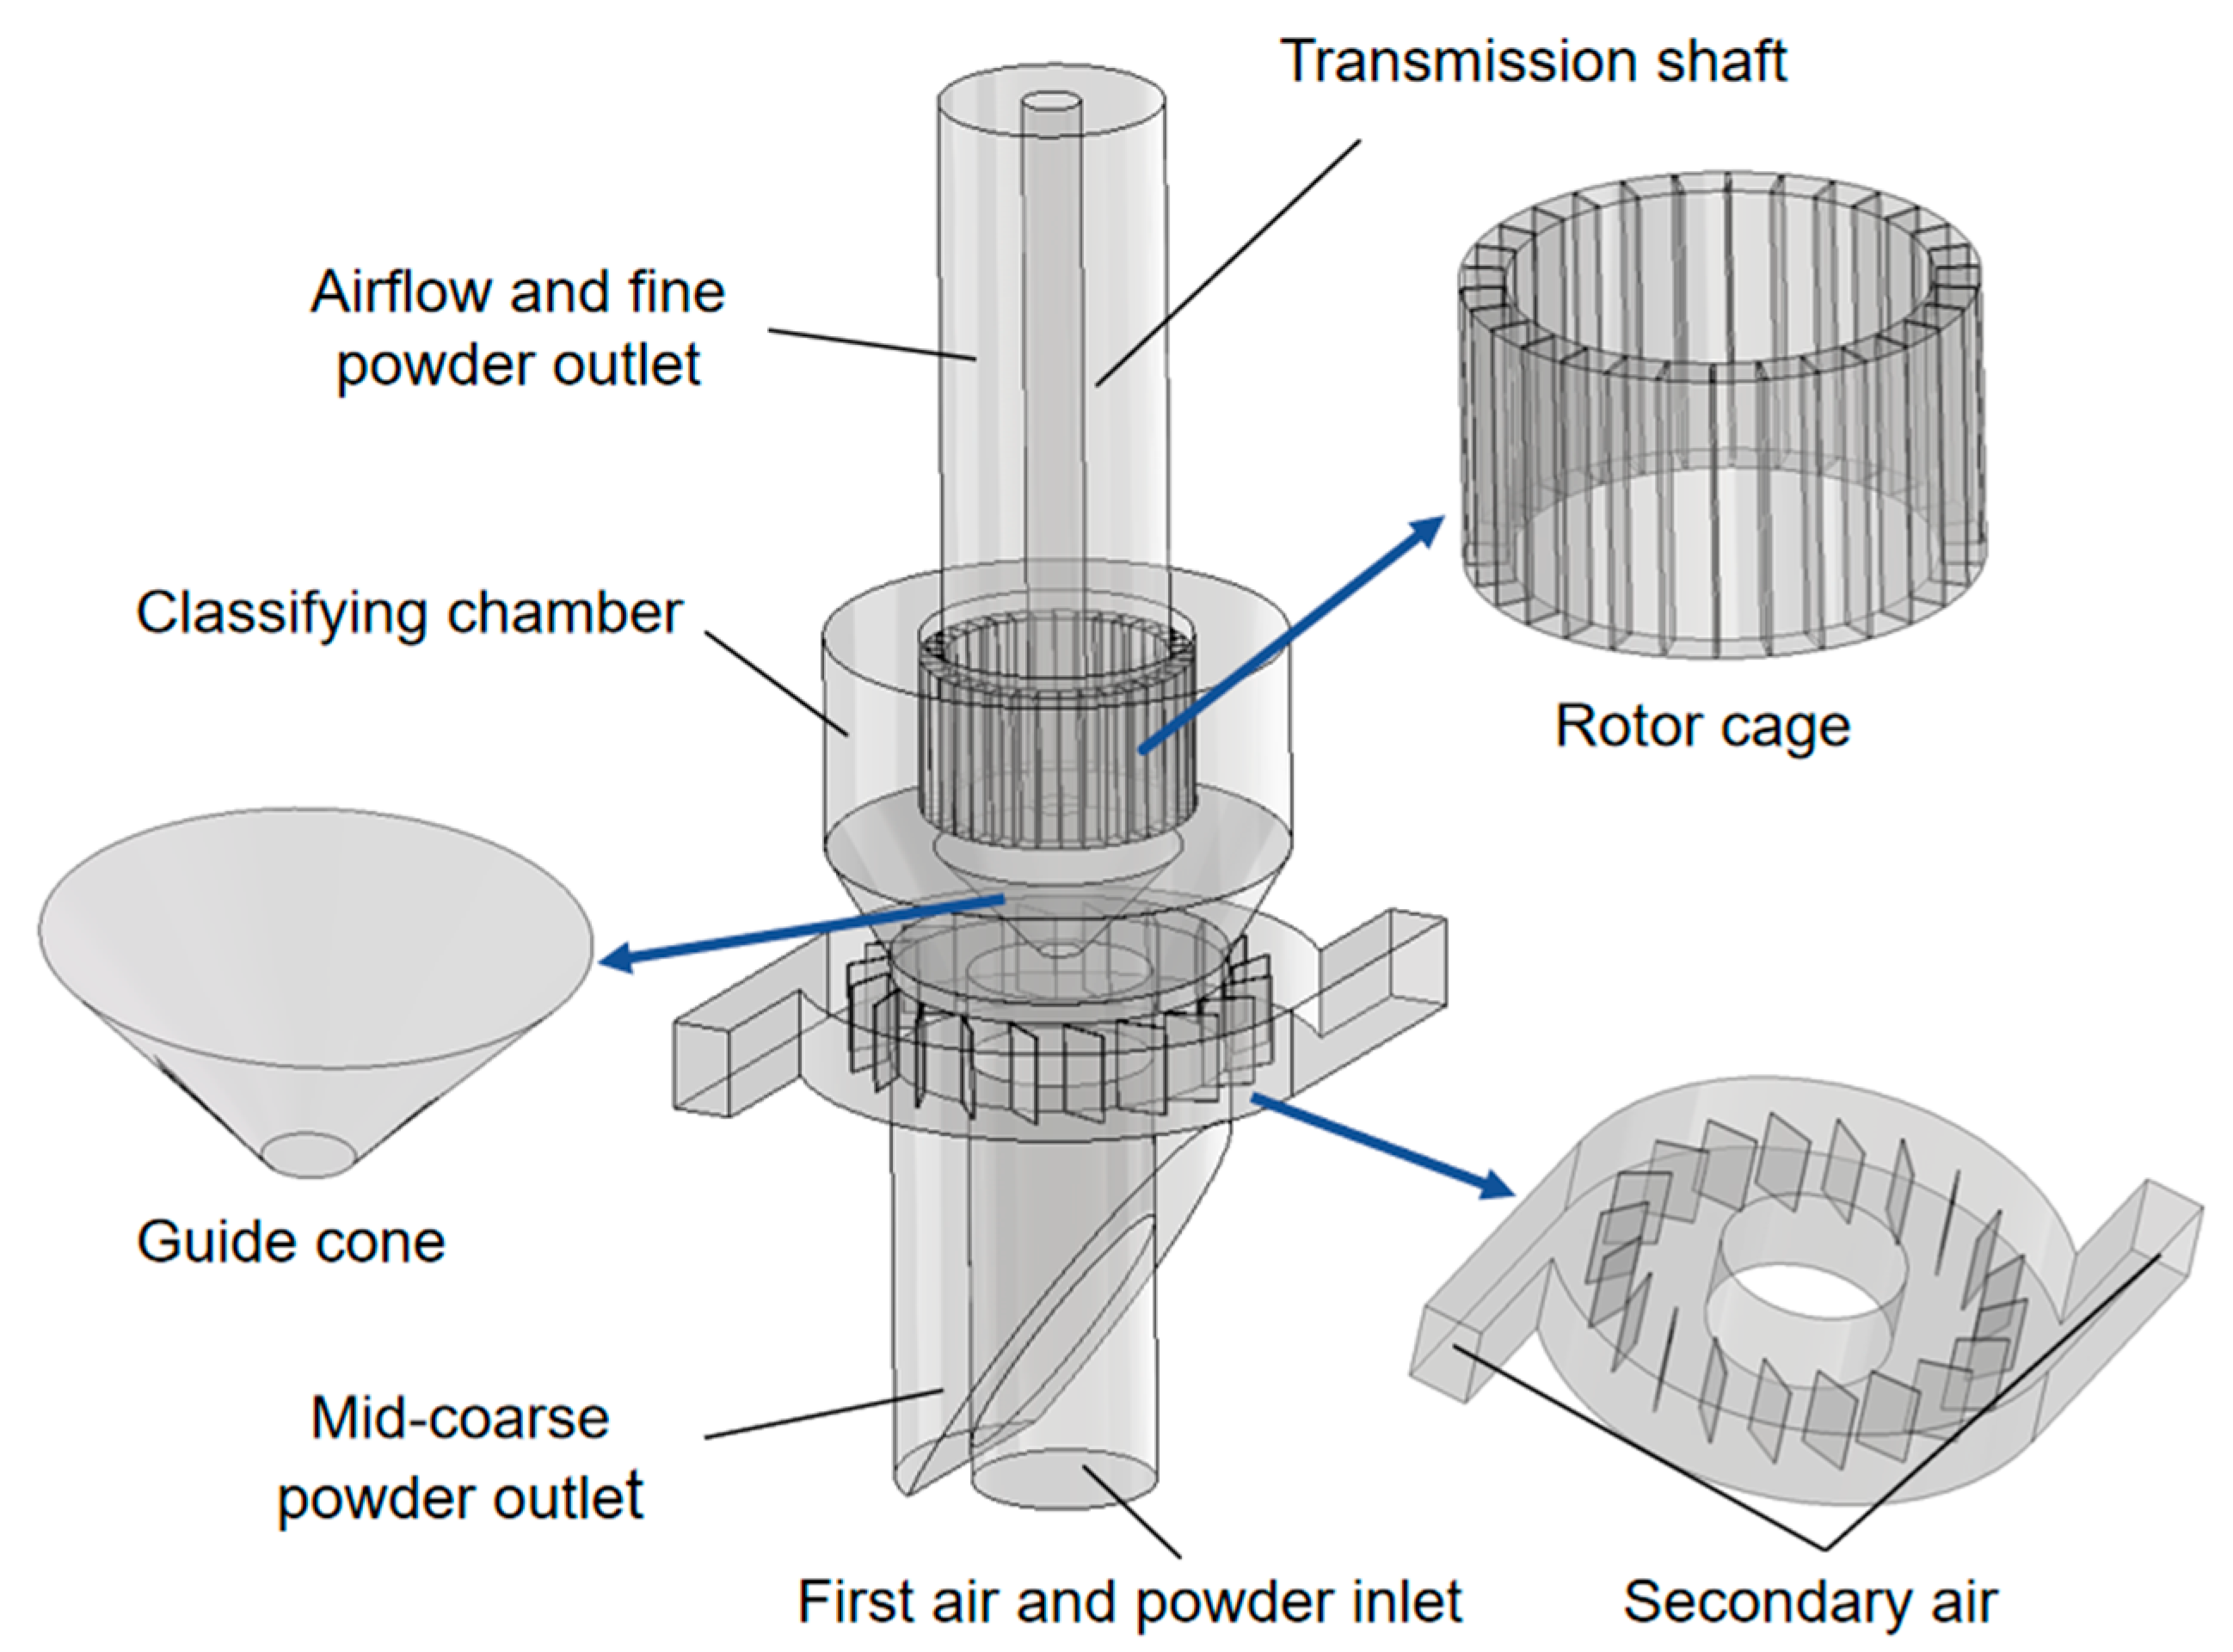
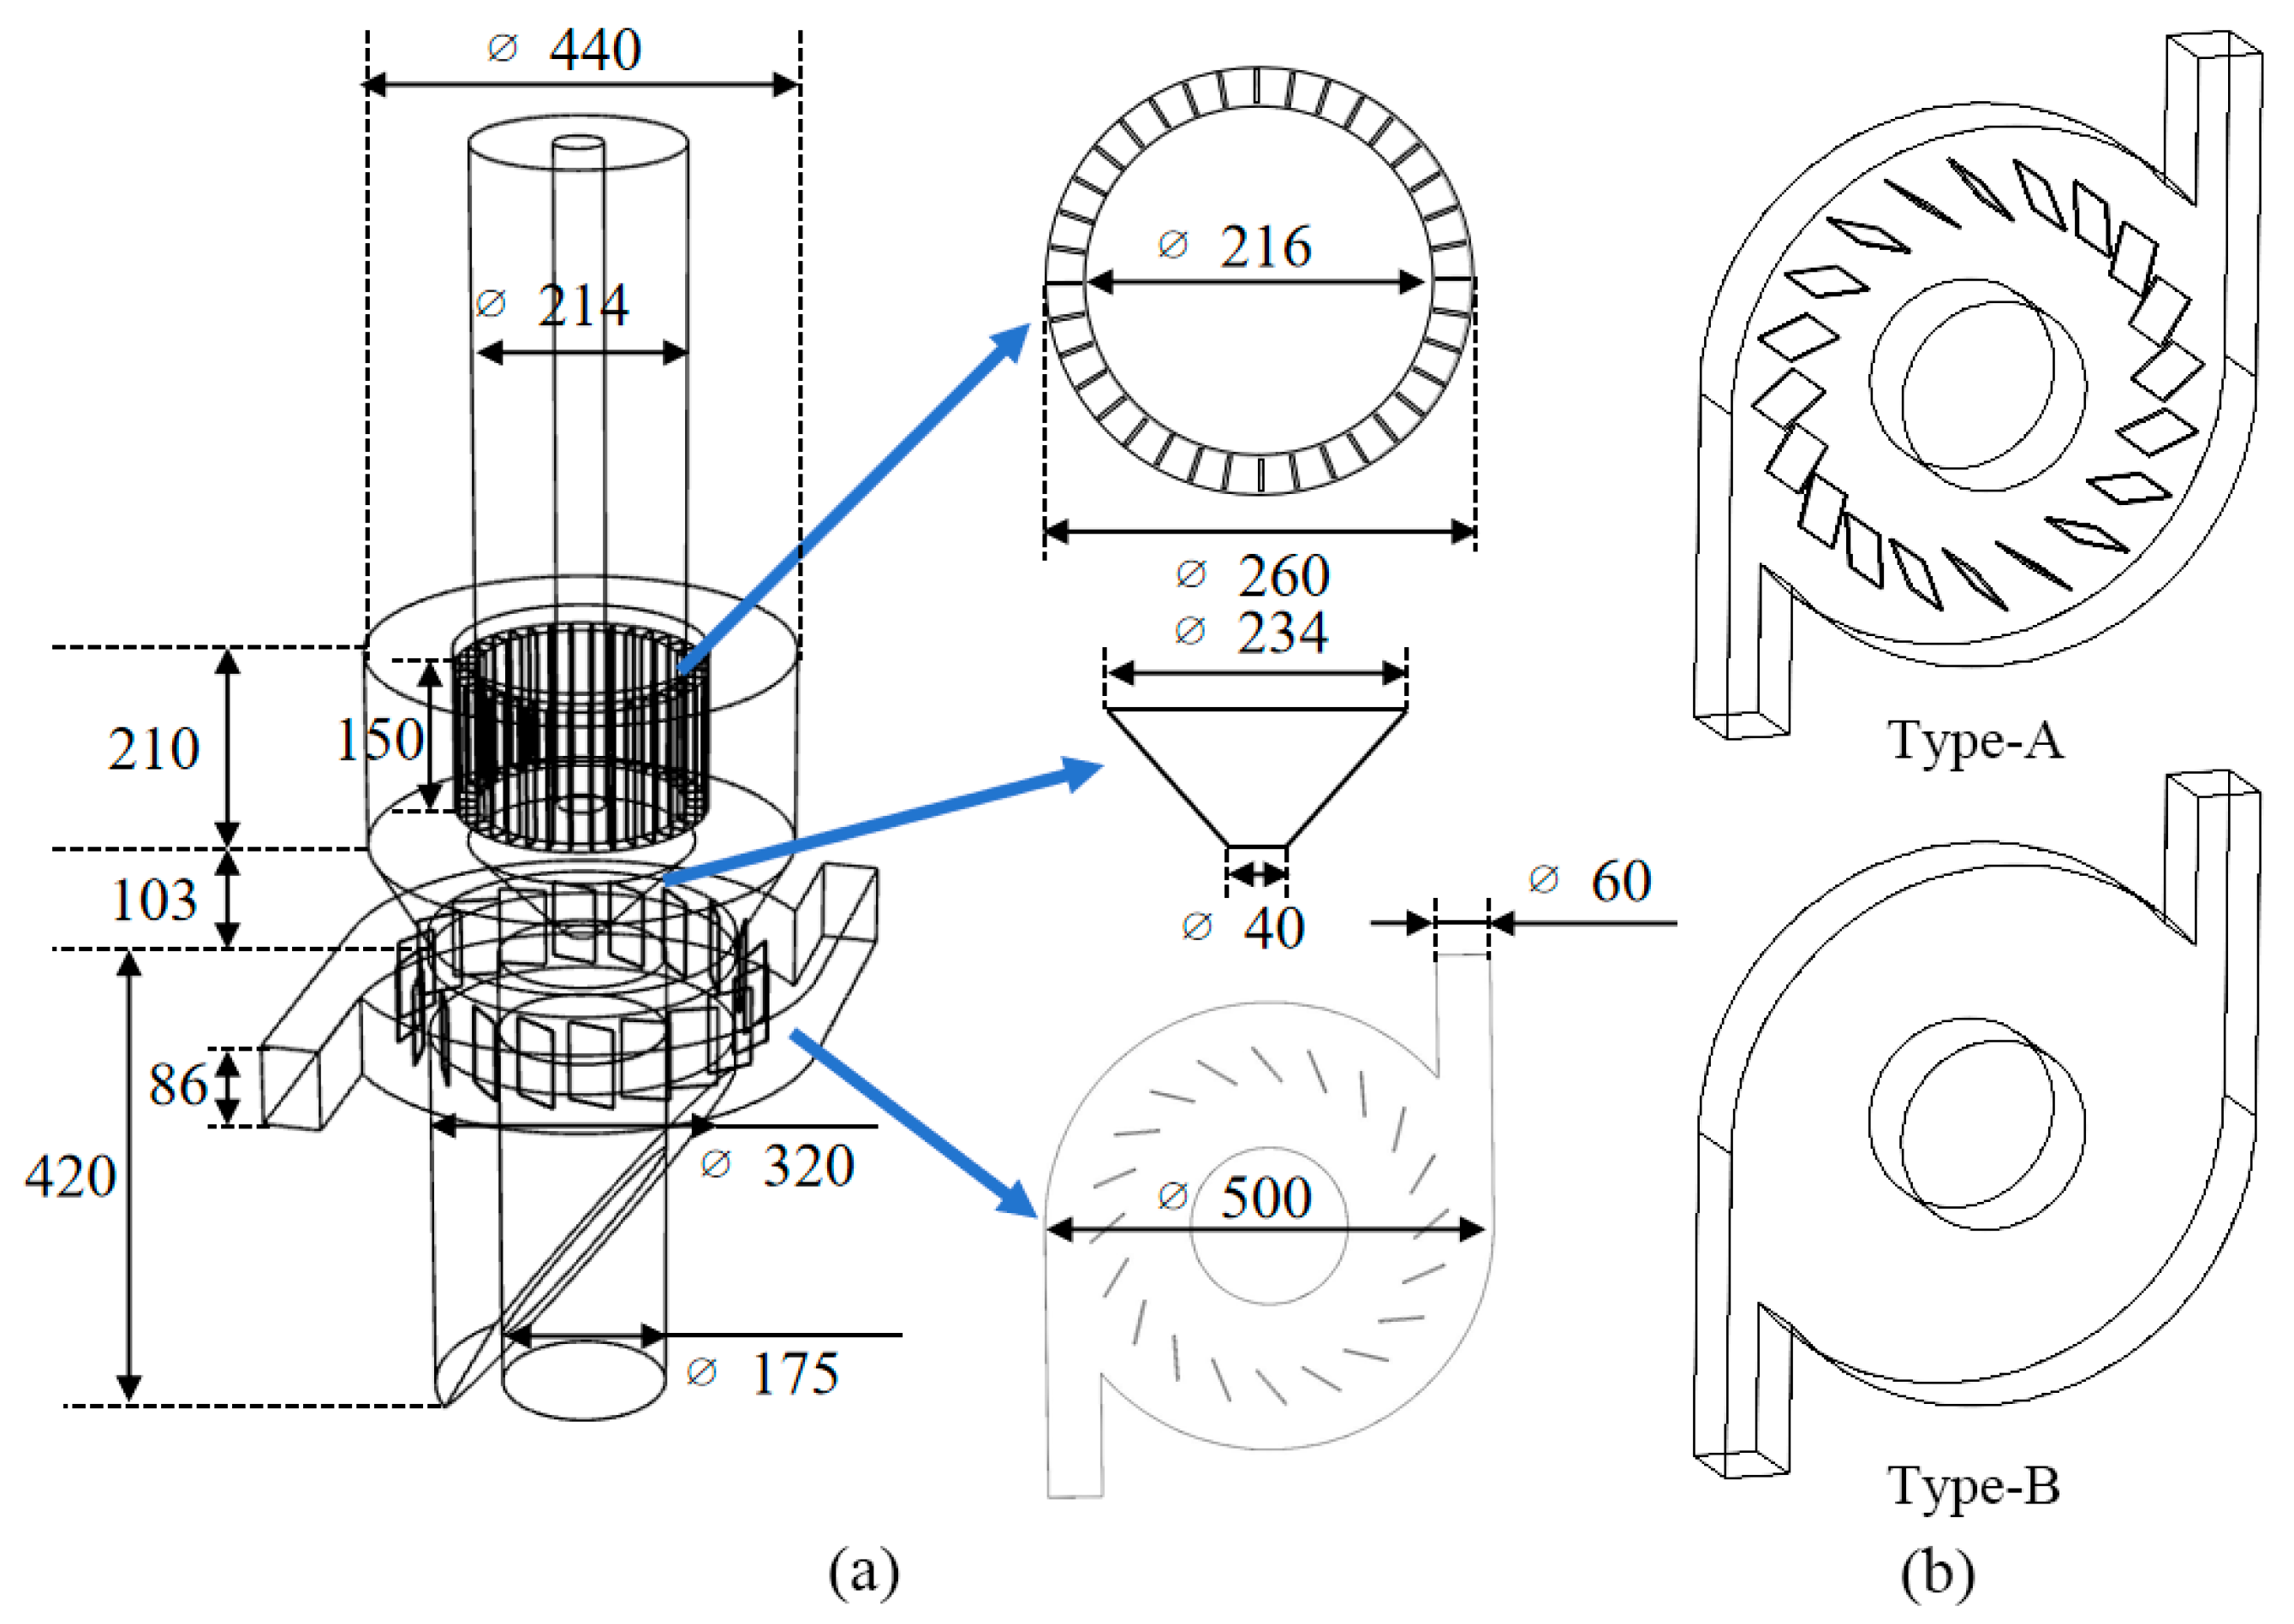
2.1. Description of the Equipment

The three-dimensional structure of the rotor classifier is shown in Figure 1. The annular area serves as the primary classification zone. The classifier employs a downward feeding method with pneumatic conveying, where material enters the classification zone and undergoes grading driven by the airflow. A secondary air structure is incorporated into the coarse powder recycling area. The resulting flow field facilitates secondary elutriation of coarse powder, enhancing fine powder recovery and mitigating efficiency loss caused by particle agglomeration. Compared to traditional turbo air classifiers, the rotor classifier features only one moving component—the rotor cage—enabling higher product fineness at lower energy consumption.
The working principle of the rotor classifier is as follows: Material enters the lower feed pipe entrained by the primary air stream. The airflow disperses the material in the guide cone region, aided by collisions with the cone surface. Following collision, coarser particles, influenced by their inertia and the drag force of the airflow, decelerate and migrate toward the cylinder wall. Upon reaching the vicinity of the wall, they descend under the airflow and settle as coarse powder. Finer particles, due to their lower inertia, remain entrained by the airflow and proceed directly into the classification zone. Passing through the high-speed rotating cage, they exit via the fine powder collection vent. Within the classification chamber, a portion of the particles is captured as fine powder by the rotating cage. Another portion, driven by centrifugal force, migrates toward the cylinder wall and begins to settle. After undergoing secondary air elutriation, some of these particles return to the classification chamber for reclassification, while the remainder continue to settle and are collected as coarse powder.

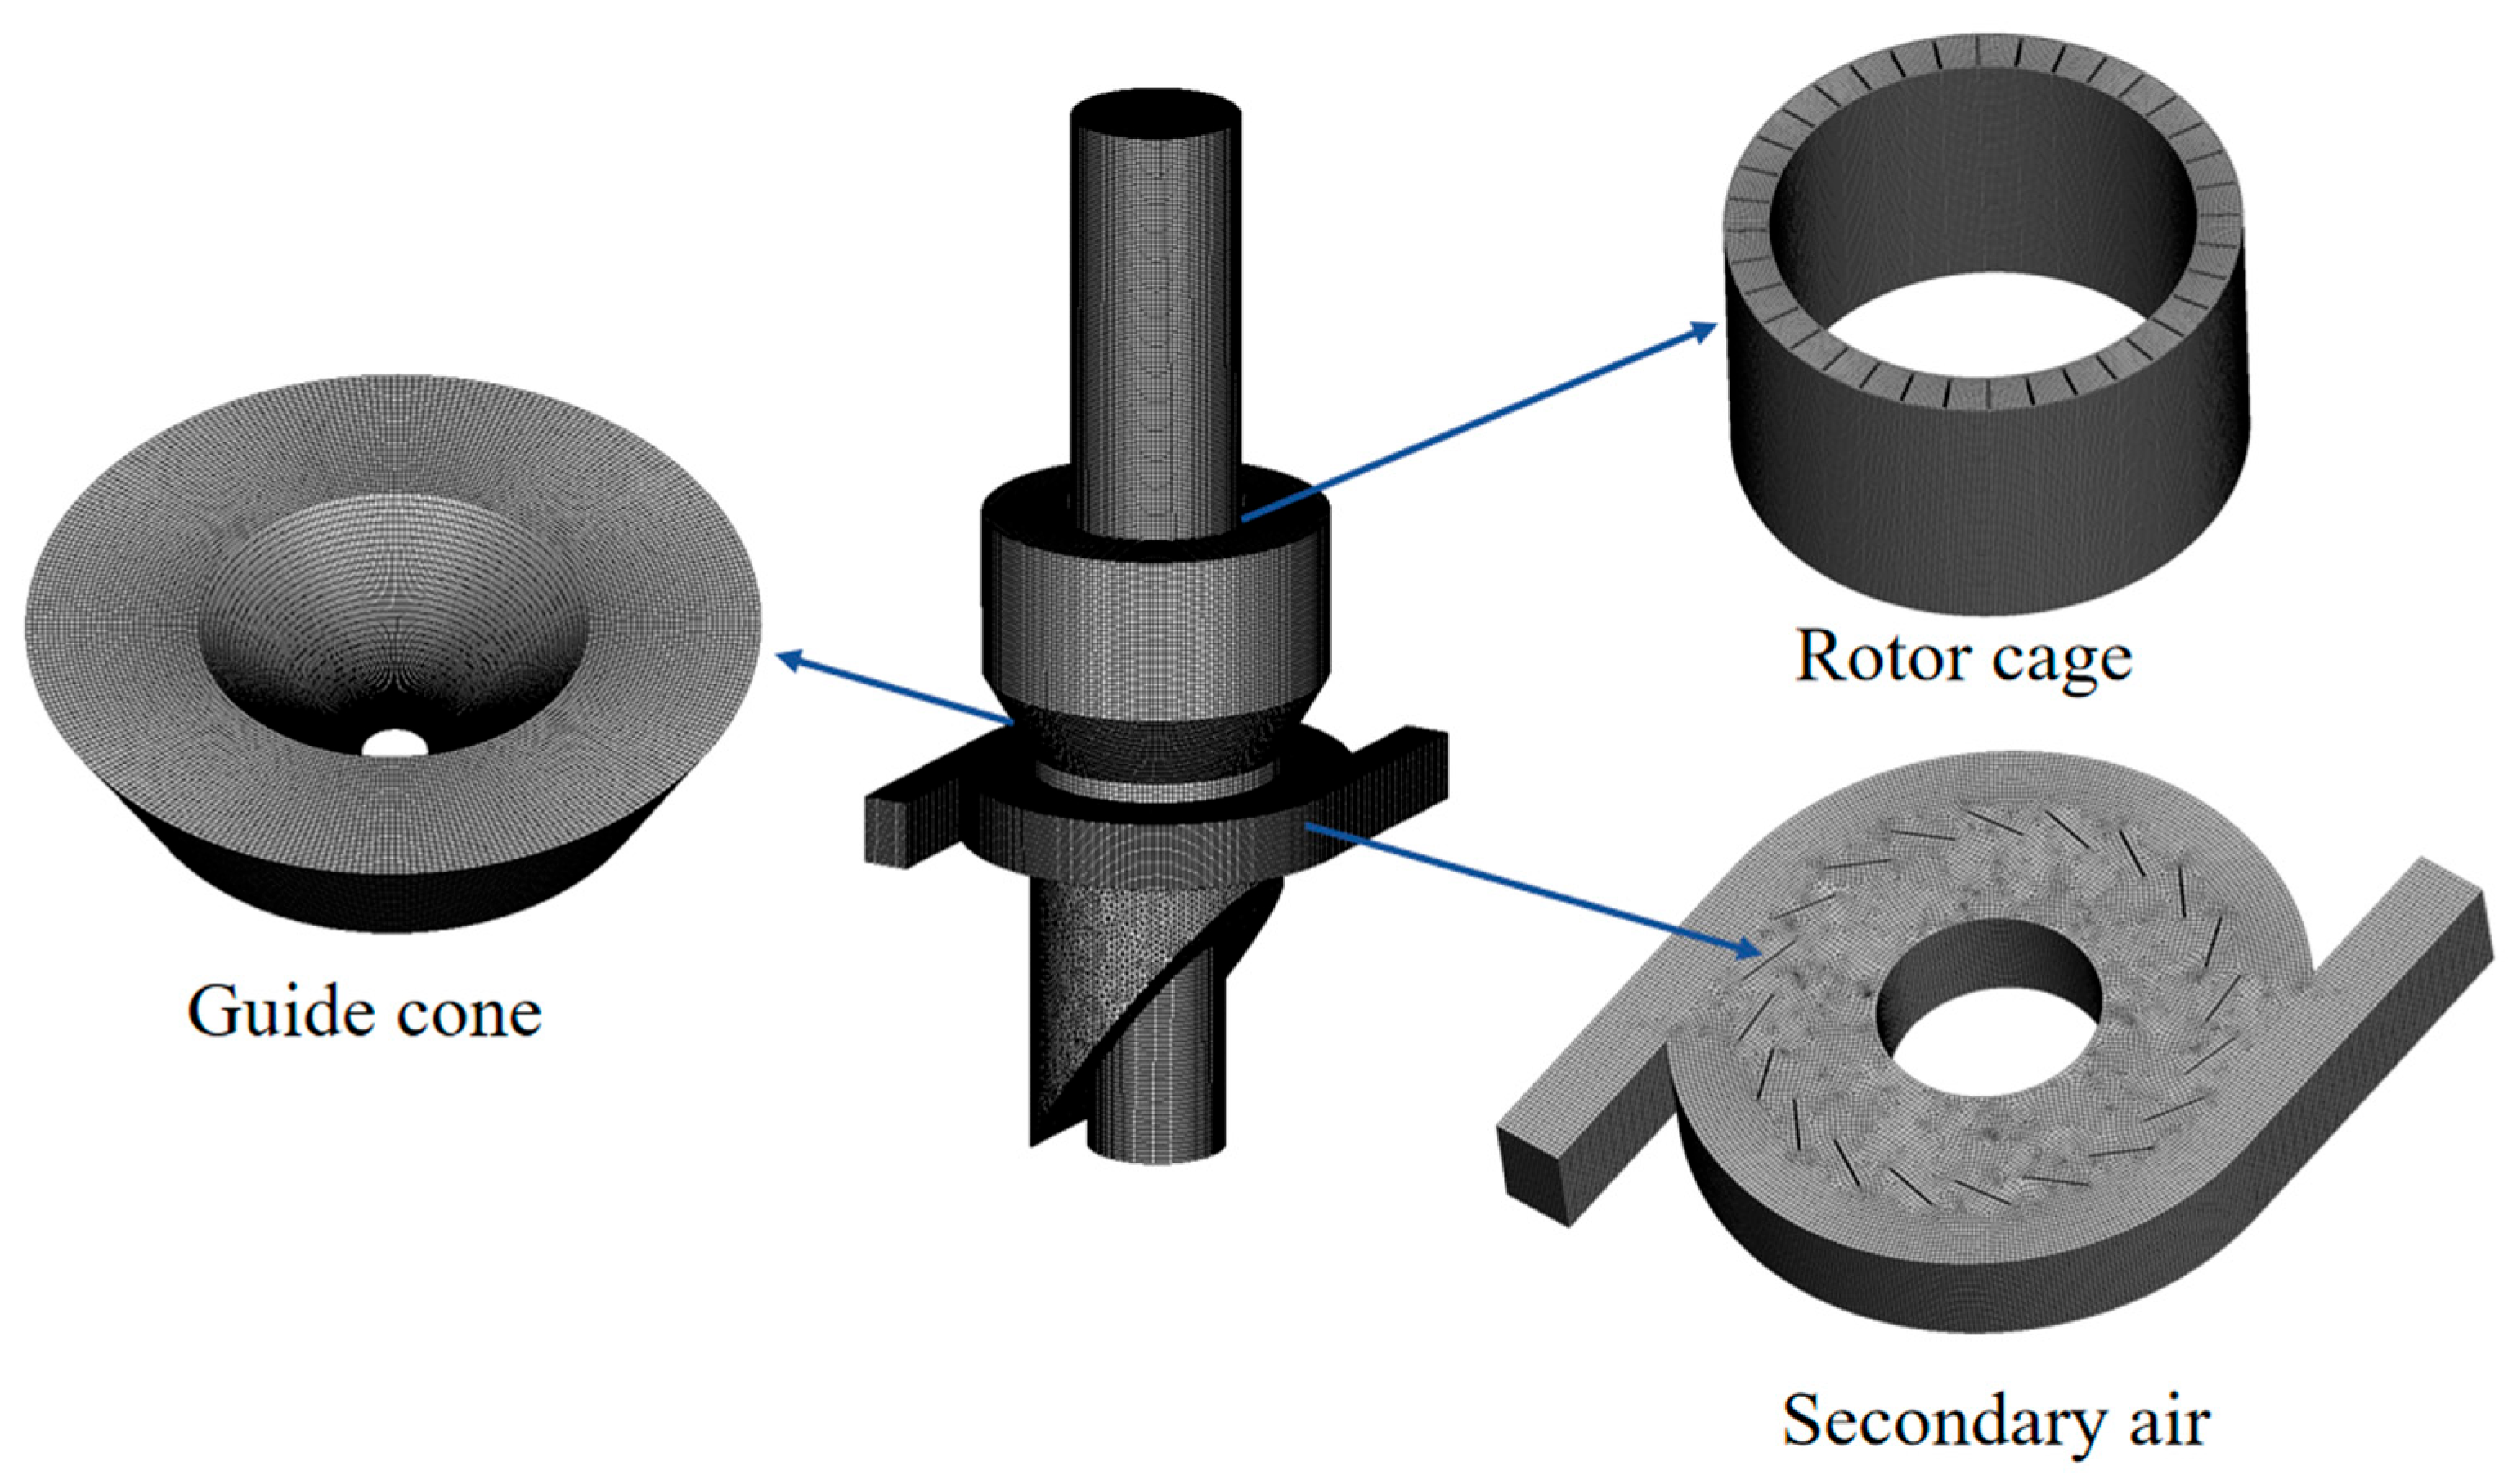
2.2. Model Establishment and Mesh Generation

The rotor classifier was designed and modeled in SolidWorks 2023, then meshed using ICEM CFD 2022 R1. To facilitate Fluent calculations, the classifier geometry was divided into seven components: the fine powder outlet, rotor cage, classification chamber, deflector cone, secondary air inlet, coarse powder outlet, and primary air inlet. Key model dimensions are shown in Figure 2a: the diameter of the fine powder outlet was 214 mm, the height of the rotor cage was 150 mm, the diameter was 260 mm, and the cage featured 36 blades radially distributed around its circumference. Each blade measured 20 mm in length, 2 mm in width, and 150 mm in height. The classification chamber was 210 mm in height and 440 mm in diameter, the height of the deflector cone was 103 mm, the diameter of the upper diameter was 234 mm, and the diameter of the lower diameter was 40 mm. The secondary air inlet was 86 mm high and 60 mm wide. The secondary air deflector blades had a total of 20 pieces, and each piece was 50 mm long, 2 mm wide, 86 mm high, and blades were evenly distributed along the radius of 180 mm on the circumference. The primary structural dimensions of the secondary air system were identical for configurations both with and without guide vanes. These two structures were designated as Type A (with guide vanes) and Type B (without guide vanes), respectively, as shown in Figure 2b.
Figure 3 shows the rotor classifier mesh. The coarse powder outlet and secondary air region used tetrahedral unstructured mesh, while the other parts used hexahedral structured mesh. To verify the accuracy of the numerical solution and to reduce computational resource consumption and time, it was necessary to perform mesh independence verification. This verification was carried out for five different mesh counts: 7,731,789, 1,017,169, 2,029,664, 2,418,224, and 2,992,574. The radial velocity distribution at the outer edge of the rotating cage was calculated for these five mesh counts, as shown in Figure 4. When the mesh count reached 2,418,224, the radial velocity remained unchanged. This indicates that this mesh count meets the computational requirements and satisfies the mesh independence criterion. To save computational cost and time, a mesh count of 2,418,224 was used for the classifier simulations in this study. Table 1 lists the number of grids in each region.

2.3. Turbulence Model and Simulation Conditions

This study employed ANSYS Fluent 19.2 for three-dimensional steady-state simulations. The fluid was treated as incompressible, and the finite volume method was adopted to solve the governing equations. The Eulerian approach was applied to model the fluid phase. The mass and momentum conservation equations are as follows:
u i x i = 0 ,
ρ u j u i x j = p x i + x j u u i x j u j x i ρ u i u j ¯ x i ,
where ρ is the gas-flow density, u i is the gas velocity, x i is the position, p is the static pressure, and
ρ u i u j ¯ x i
is the Reynolds stress term.
The Reynolds stress model (RSM) is an advanced turbulence closure model well-suited for simulating anisotropic flows in air classifiers. The flow conditions examined in this study exhibited prominent anisotropic turbulence characteristics, including (1) strong anisotropy induced by rotor rotation, (2) complex turbulent structures in flow separation and recirculation zones, and (3) enhanced anisotropy due to gas–solid interactions. These phenomena significantly increased the anisotropy of turbulent stresses. However, traditional eddy viscosity models (e.g., k-ε and k-ω) relate Reynolds stresses to strain rates through isotropic eddy viscosity coefficients. This approach cannot accurately capture such anisotropic turbulence and often yields substantial errors.
However, the Reynolds stress model (RSM) also has limitations, primarily stemming from its classification as a Reynolds-averaged Navier–Stokes (RANS) model. The core principle of RANS involves applying statistical averaging to turbulence, solving for time-averaged flow fields and turbulence statistics. Consequently, it cannot directly resolve transient phenomena evolving rapidly over time (e.g., vortex shedding and flow instabilities), providing only their time-averaged effects.
The transport equation for Reynolds stress can be written as:
t ρ u i u j ¯ + x k ρ U k u i u j ¯ = D i j + φ i j + G i j + ε i j ,
D i j = x k ρ u k u i u j ¯ + p u j ¯ δ i k + p u i ¯ δ j k μ x k u i u j ¯ ,
φ i j = p u i x j + u j x i ¯ ,
G i j = ρ u i u k ¯ u j x k + u j u k ¯ u i x k ,
ε i j = 2 μ u j x k u i x k .
The whole equation describes the transport of Reynolds stress in turbulent flow, including its variation, generation, redistribution, and dissipation in time and space. In Equation (3), the two terms on the left side are the time rate of change of the Reynolds stress and the convection term, respectively. The four terms on the right-hand side are the diffusion term D i j , the pressure-strain term φ i j , the stress-generation term G i j , and the turbulence dissipation term ε i j . D i j consists of three components: the turbulent diffusion term, the pressure-diffusion term, and the viscous-diffusion term. φ i j consists of the turbulent pressure and turbulent strain, and it is also known as the Reynolds stress redistribution term. G i j denotes the interaction of the Reynolds stress with the mean flow gradient. It enhances the source of Reynolds stress. ε i j consists of the fluid viscosity coefficient and turbulent velocity gradient, and its main function is to dissipate the turbulent energy.
The no-slip boundary condition with a roughness height of 0.01 mm was applied to all walls, treated by the standard wall function. The rotor cage, defined as the moving region, was modeled using the multiple reference frame (MRF) approach. To ensure mesh connectivity between the rotating cage and stationary regions, an interface boundary was established at their intersection. The cage rotation direction was set as clockwise. Pressure–velocity coupling was solved via the SIMPLEC algorithm, while convection and diffusion terms were discretized using the QUICK scheme.
The boundary conditions for the main air inlet and the two secondary air inlets were set as “velocity-inlet”. The boundary condition for the fine powder outlet was set as “outflow boundary”. In industrial applications, the coarse powder outlet is usually in a closed state, so its boundary condition was set as “wall”. The residual accuracy was set to 10−4. The parameter settings for the inlet boundary are shown in Table 2.

2.4. Discrete-Phase Model

To solve the dispersed-phase problem, a discrete-phase model (DPM) was used, which analyzes the particle behavior from both Lagrangian and discrete perspectives. The discrete-phase model used by Fluent requires that the volume fraction of the discrete phase be quite low, usually less than 10% [26]. Calcium carbonate particles enter the classifier through the feed port with the main air, and their direction is perpendicular to the plane where the air inlet is located. The mass flow rate was set to 0.005 kg/s, the particle density was 2750 kg/m3, and the particle size distribution adopted the Rosin–Rammler function. The measured particle volume fraction was approximately 0.062%, and the mass flow ratio was about 0.0135, which meet the DPM requirements. The normal reflection coefficient en of particle–wall collision was 0.5, the tangential reflection coefficient et was 0.2, and the gravitational acceleration was −9.81 m/s2 (the positive direction of the Z-axis was upward). Considering the interaction between particles and vortices, the discrete random walk (DRW) model was used to simulate the dispersion effect of turbulence on particles. Steady-state tracking of the discrete-phase model was performed to predict the trajectory of the particles. When particles are released, they will be tracked until they reach a boundary, and the tracking stops according to the boundary type. The fine powder outlet discrete boundary condition was set to “escape”, the coarse powder outlet discrete boundary condition was set to “capture”, and the remaining wall discrete boundary condition was set to “reflection”.

2.5. Classification Performance Indexes

The partial classification efficiency refers to the ratio of the mass of particles in a certain particle size interval to the total mass of particles in that interval after dividing the particle size into multiple intervals. It reflects the classification effect of particles within that particle size interval [27]. The partial classification efficiency curve, which is a curve that varies with particle size, is also known as the Tromp curve. The Tromp curve reflects the grading accuracy index K, expressed as K = D25/D75. The parameters D25, D75, and D50 are defined as the particle size at which the efficiency of partial classification is 25%, 75%, and 50%, respectively. Namely, with the cut size, the steeper the curve, the higher the classification accuracy.

3. Effect of the Presence or Absence of Secondary Air Guide Vanes on the Flow Field

3.1. Overall Flow Field Distribution

To investigate the flow field characteristics of Type-A (with guide vanes) and Type-B (without guide vanes) classifier configurations, simulations were conducted at 600 rpm rotor speed, 12 m/s primary air velocity, and 2 m/s secondary air velocity (denoted as 600-12-2). As illustrated in Figure 5, the global airflow trajectory encompassed three distinct regimes: (a) entry paths of primary/secondary airflows, (b) main classification zone dynamics, and (c) coarse powder region behavior. Primary air enters the classifier base, generating a vortex within the classification chamber under rotor cage rotation. This swirling flow drives air to spiral inward along the cage periphery toward its center before exiting through the fine powder outlet. Tangentially injected secondary air maintains high angular momentum, bifurcating upon entry: one stream flows tangentially into the classification zone, enhancing particle separation, while the other forms recirculation in the guide cone and coarse powder recovery area to enable material reclassification.
The introduction of secondary air deflector blades promotes more uniform airflow distribution within the classifier, reducing vortices and turbulence while enhancing flow field stability. This significantly improves particle classification precision. The trajectory of particles in the classifier is shown in Figure 6. After particles enter the classifier with the main airflow from the lower air inlet, part of them enter the rotating cage and are collected as fine powder, while the other part falls along the cylinder wall and are collected as coarse powder. Some of the particles in the Type-B structure will enter the secondary wind snail shell with the airflow after the secondary wind amalgamation flow field, which is not conducive to the grading of the particles. Crucially, this detrimental particle entrainment is prevented in Type-A structures with guide vanes.

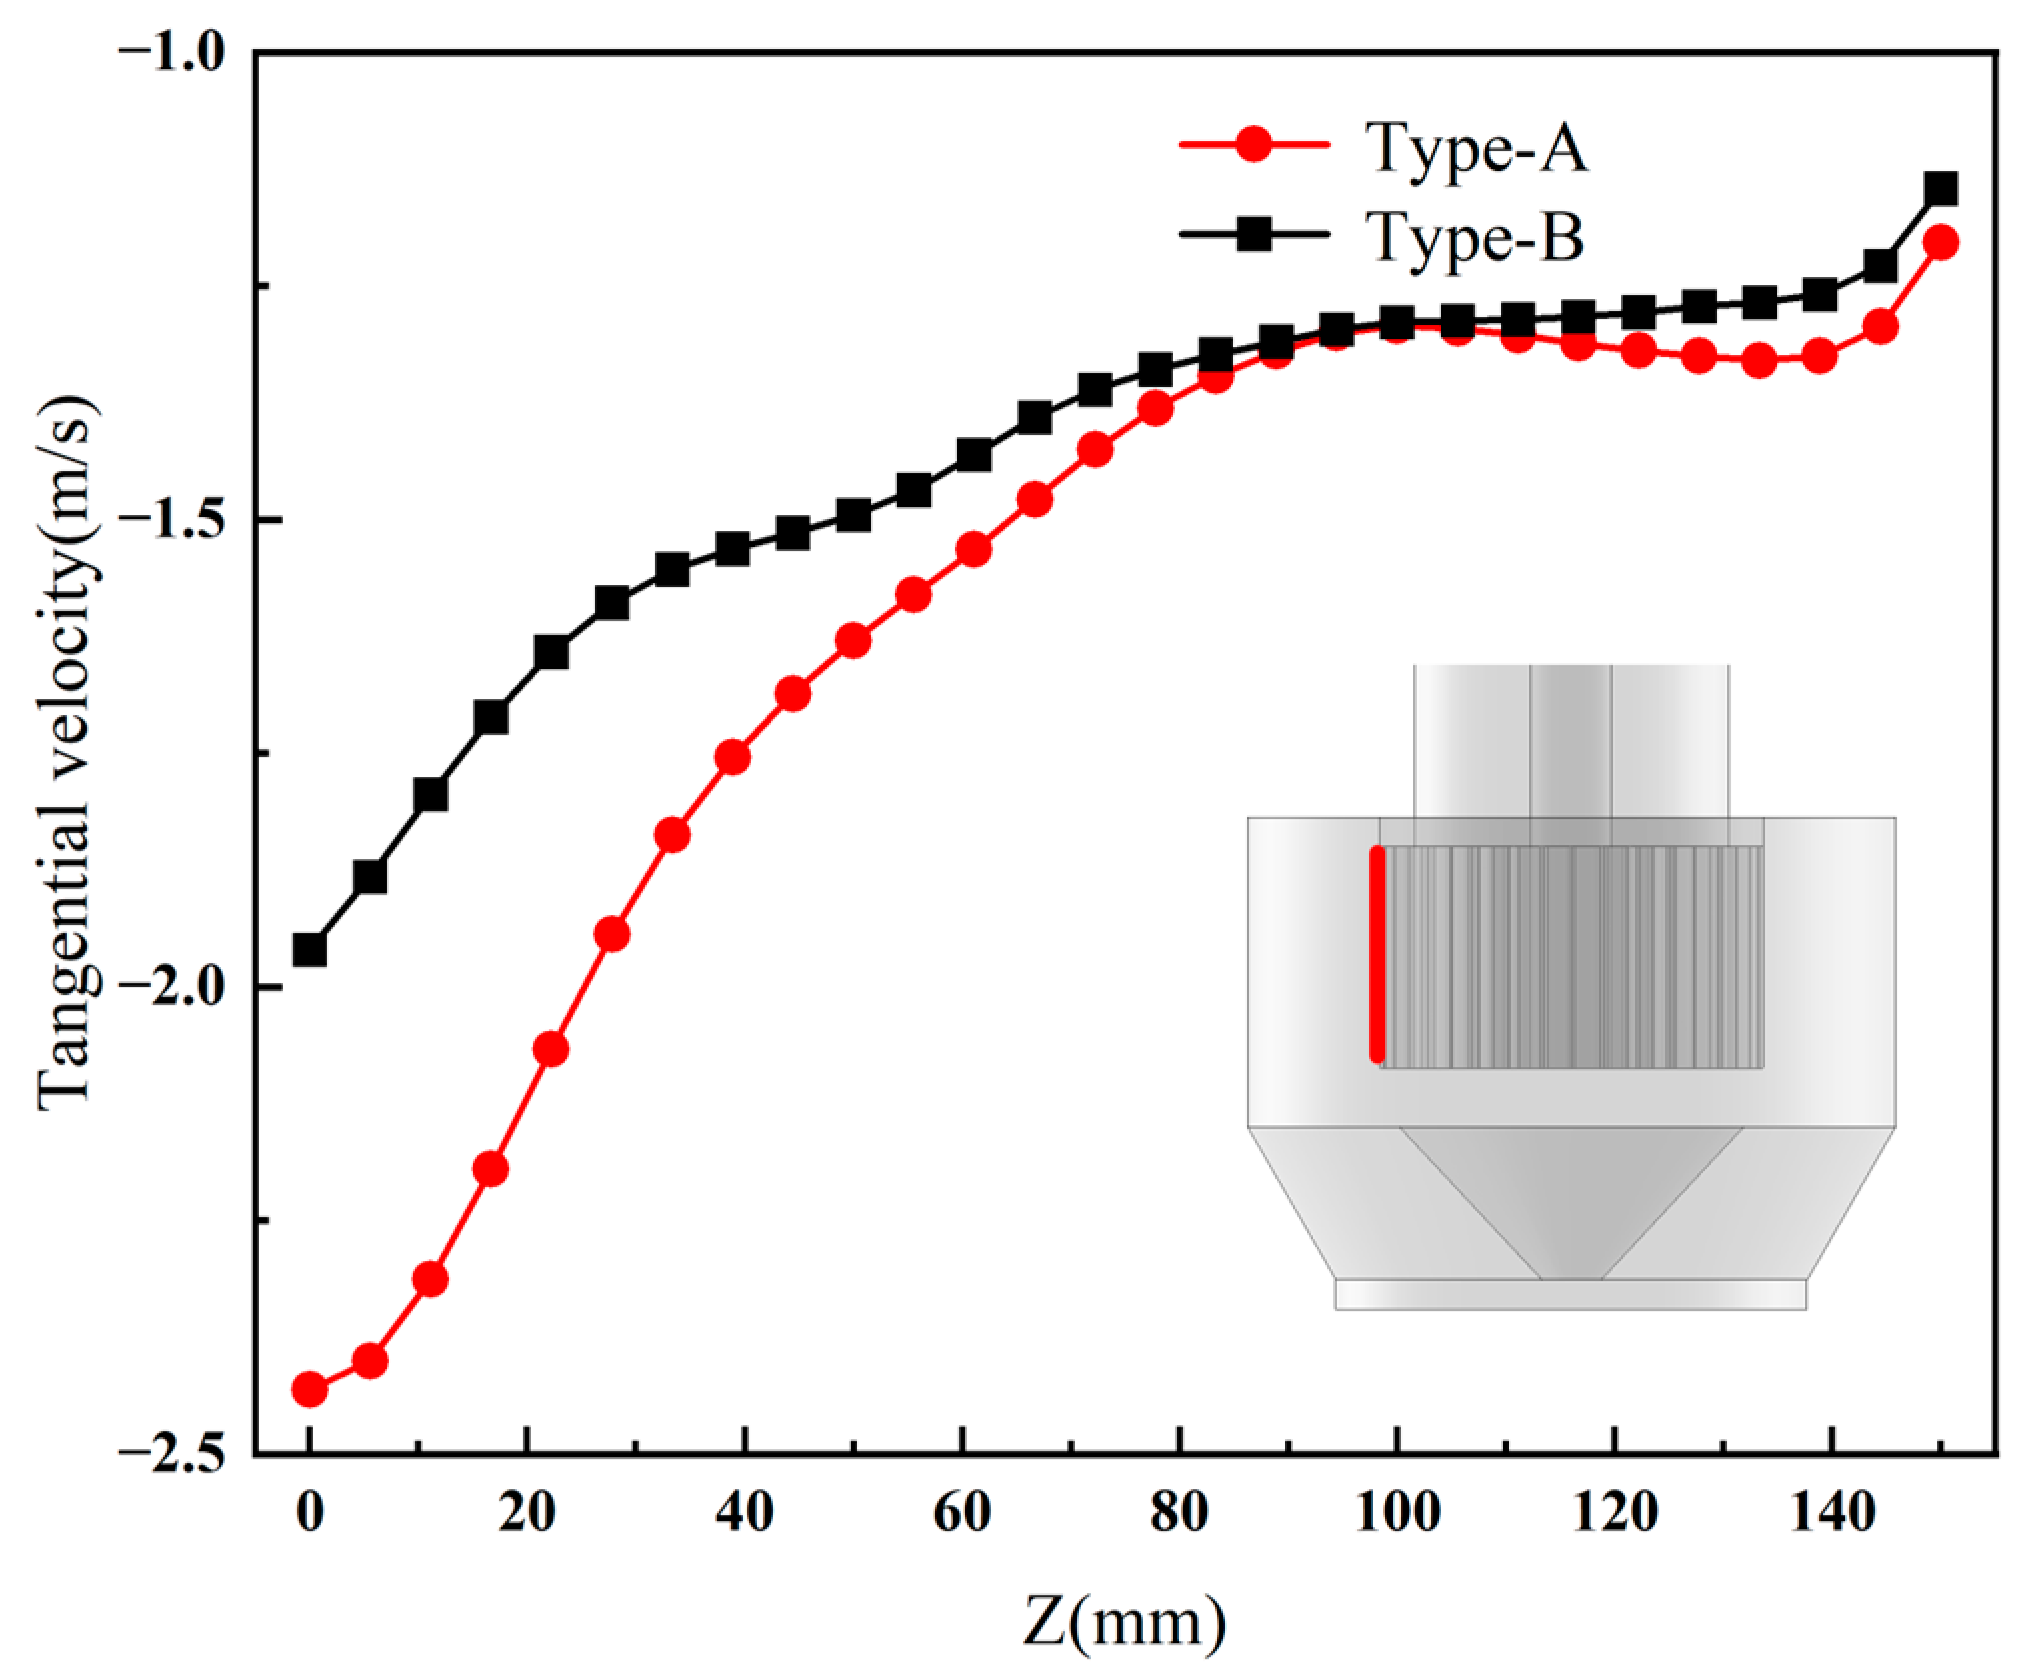
3.2. Effect of Type-A and Type-B Structures on Tangential Velocity in the Annular Zone

The secondary air enters tangentially, undergoing pre-spin acceleration within its inlet structure. This reduces the velocity gradient relative to the fluid at the rotating cage periphery. The accelerated airflow then spirals upward through the annular region into the rotating cage, imparting shear stress to adjacent flows. Figure 7 quantifies the tangential velocity distribution along the cage outer edge, ranging from −2.43 m/s to −1.15 m/s. Significant velocity variations occur in the lower cage section, with a continuous increasing trend, while mid–upper regions maintain relatively stable profiles. Compared to Type-B, the Type-A configuration demonstrates substantially enhanced tangential velocities at the cage edge—attributable to guide vane optimization of secondary flow patterns. By aligning the airflow trajectory with the cage rotation direction, the vanes reduce energy-dissipating collisions between primary and secondary streams, thereby increasing tangential velocity.

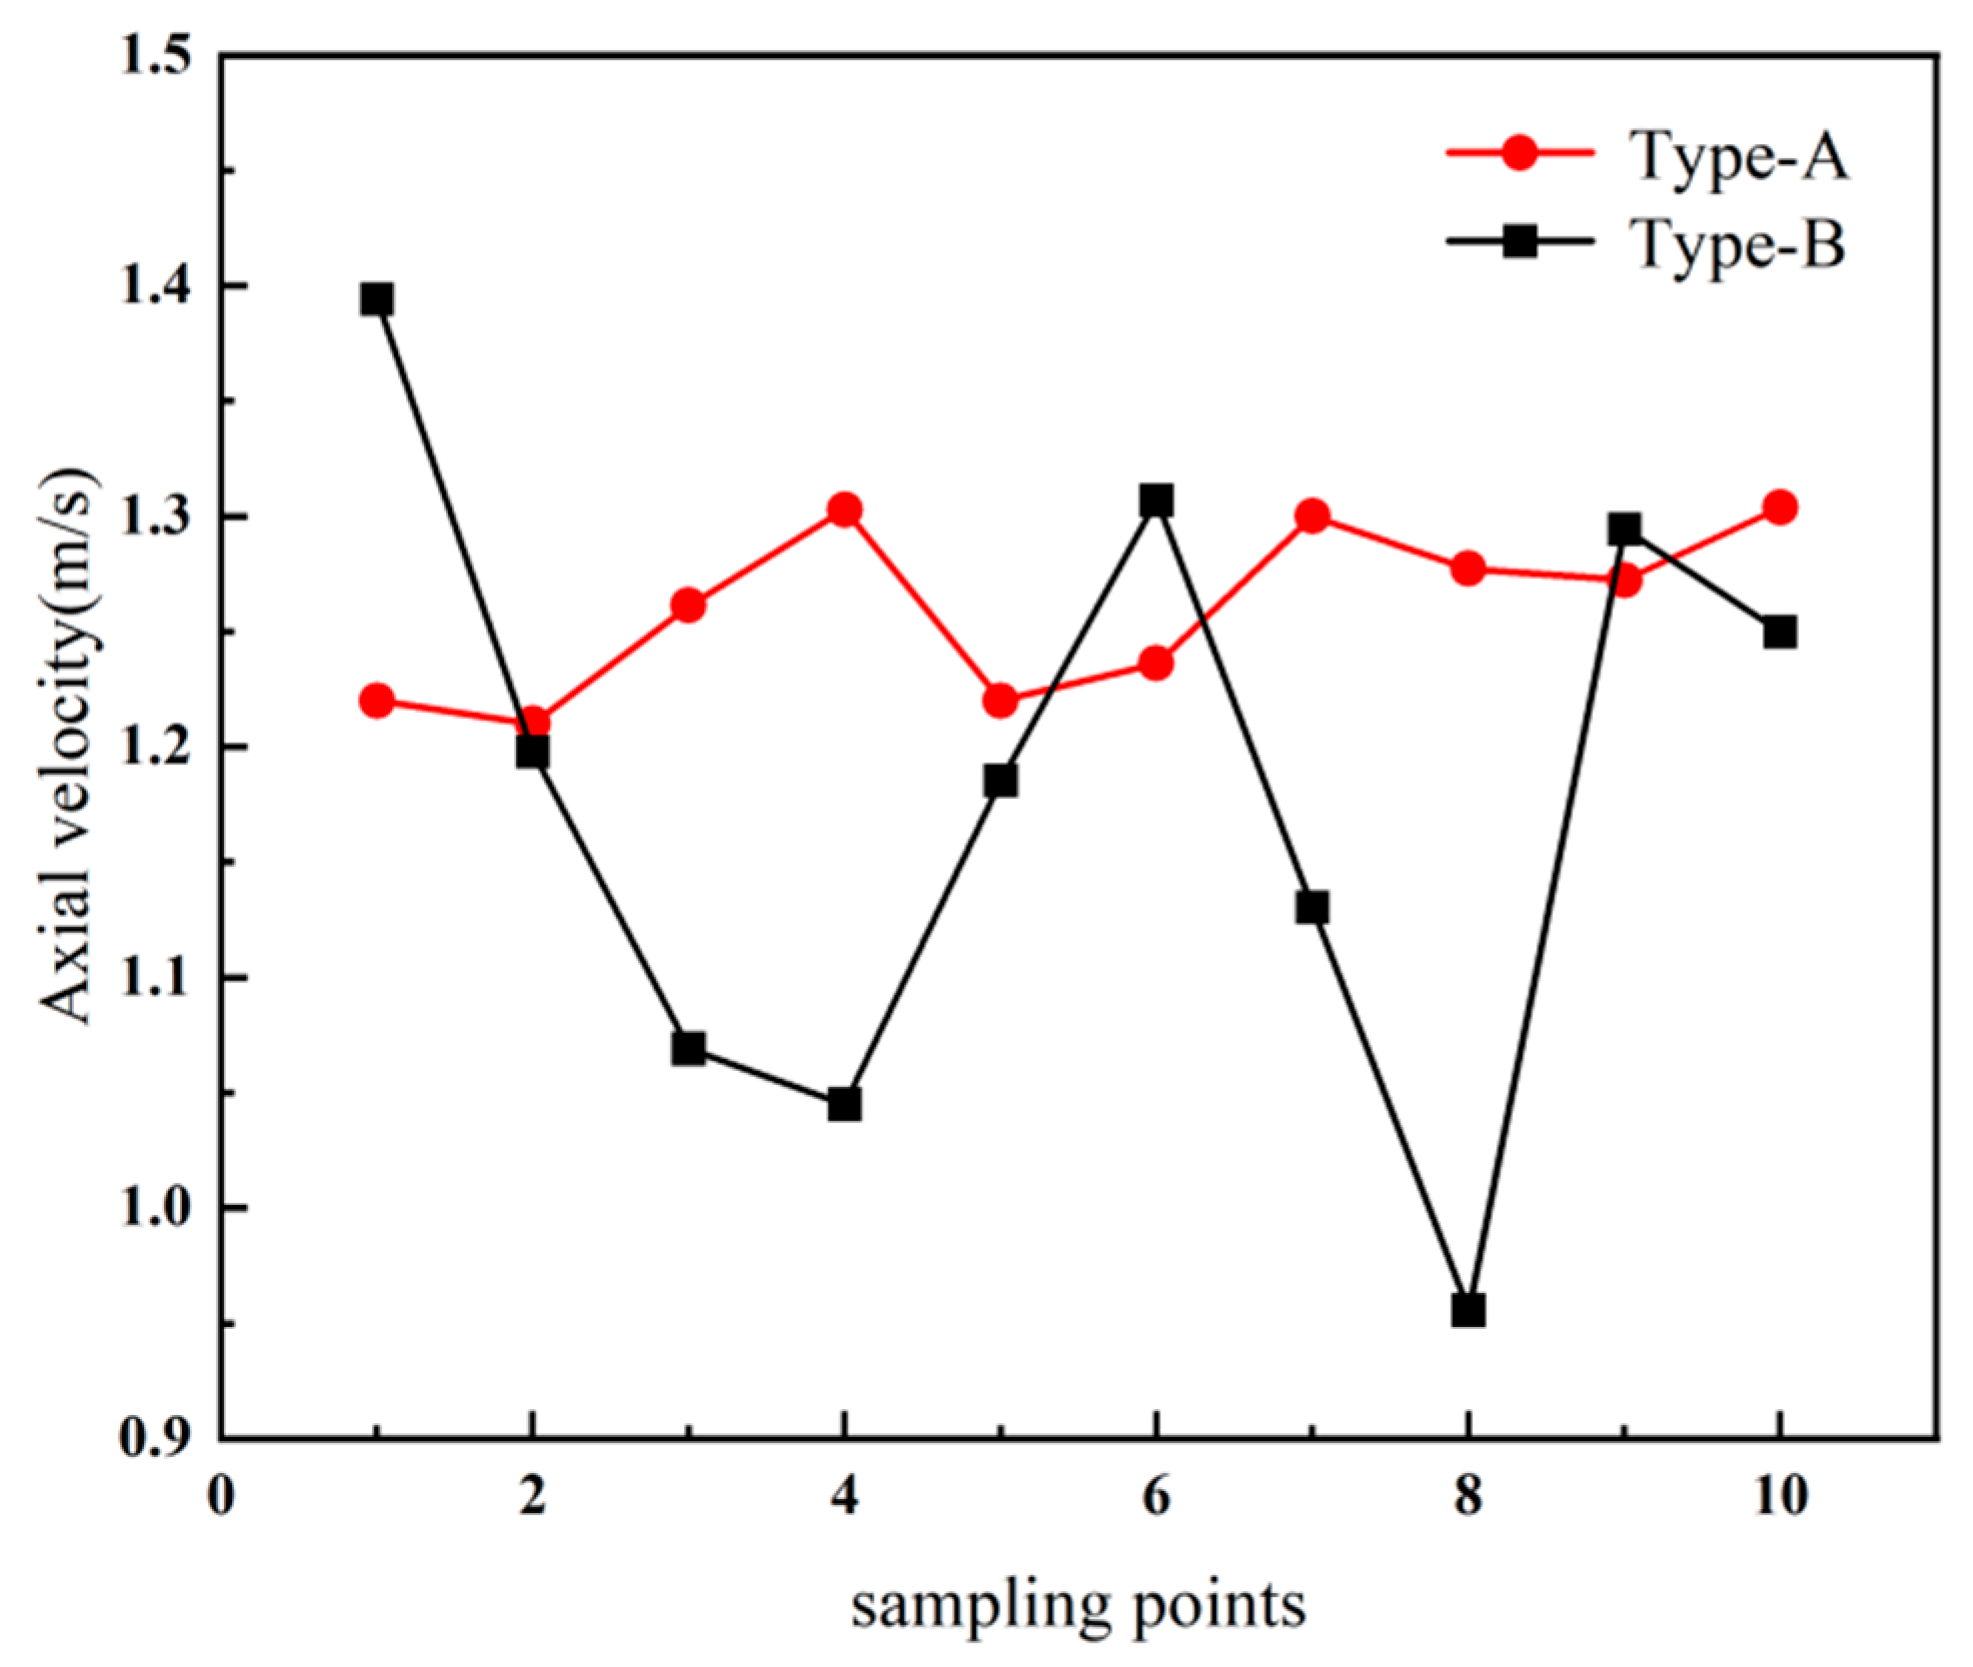
3.3. Influence of Type-A and Type-B Structures on the Flow Field in the Secondary Elution Zone

The secondary elution area formed by the secondary wind consists of the deflector cone area and the coarse powder collection area. To compare the effects of Type-A and Type-B structures on the flow field in the secondary elution zone, the axial velocity cloud over the cross-section of the deflector cone region was analyzed, as shown in Figure 8. The axial velocity distribution of the Type-A structure is more uniform than that of the Type-B structure. To analyze this phenomenon, ten sampling points were uniformly selected on the circumference at Z = −103 mm on the surface of the annular region, and the axial velocity distributions at these sampling points were calculated, as shown in Figure 9. The axial velocity distribution of the Type-A structure is more uniform than that of the Type-B structure, with velocities ranging between 1.21 m/s and 1.3 m/s. In contrast, the axial velocity distribution of the Type-B structure is more variable, ranging from 0.96 m/s to 1.39 m/s. This occurs because the secondary wind entering the classifier in the Type-B structure has randomness in both direction and speed distribution. It mixes with the primary wind in a more turbulent manner, resulting in energy loss and reduced axial velocity. In the Type-A structure, the guide vanes direct and constrain the flow path of the secondary air. After passing through these vanes, the secondary air mixes with the primary air in a specific direction and at a defined angle in an orderly manner. This reduces disordered collisions and energy loss of the airflow, thus resulting in a more uniform flow field distribution.
To facilitate the observation and analysis of the axial velocity cloud map in the coarse powder collection area, a visualization processing method was applied. A cutting line was selected on the side of the coarse powder collection port, and the three-dimensional data were expanded to form a two-dimensional plan view, as shown in Figure 10. The analysis shows that the Type-A structure plays a significant role in regulating the flow field morphology. The Type-A structure exhibits a symmetric distribution of axial positive and negative velocity zones and forms a stable ring vortex structure. This uniform velocity distribution is conducive to establishing a steady-state flow field, increasing the separation efficiency and washing capacity of fine and coarse particles in the secondary elutriation flow field. In contrast, the flow field of the Type-B structure shows significant asymmetry. The axial positive velocity zone accounts for a significantly larger proportion than the axial negative velocity zone. This asymmetry causes instability in the flow field, which reduces the particle classification accuracy.

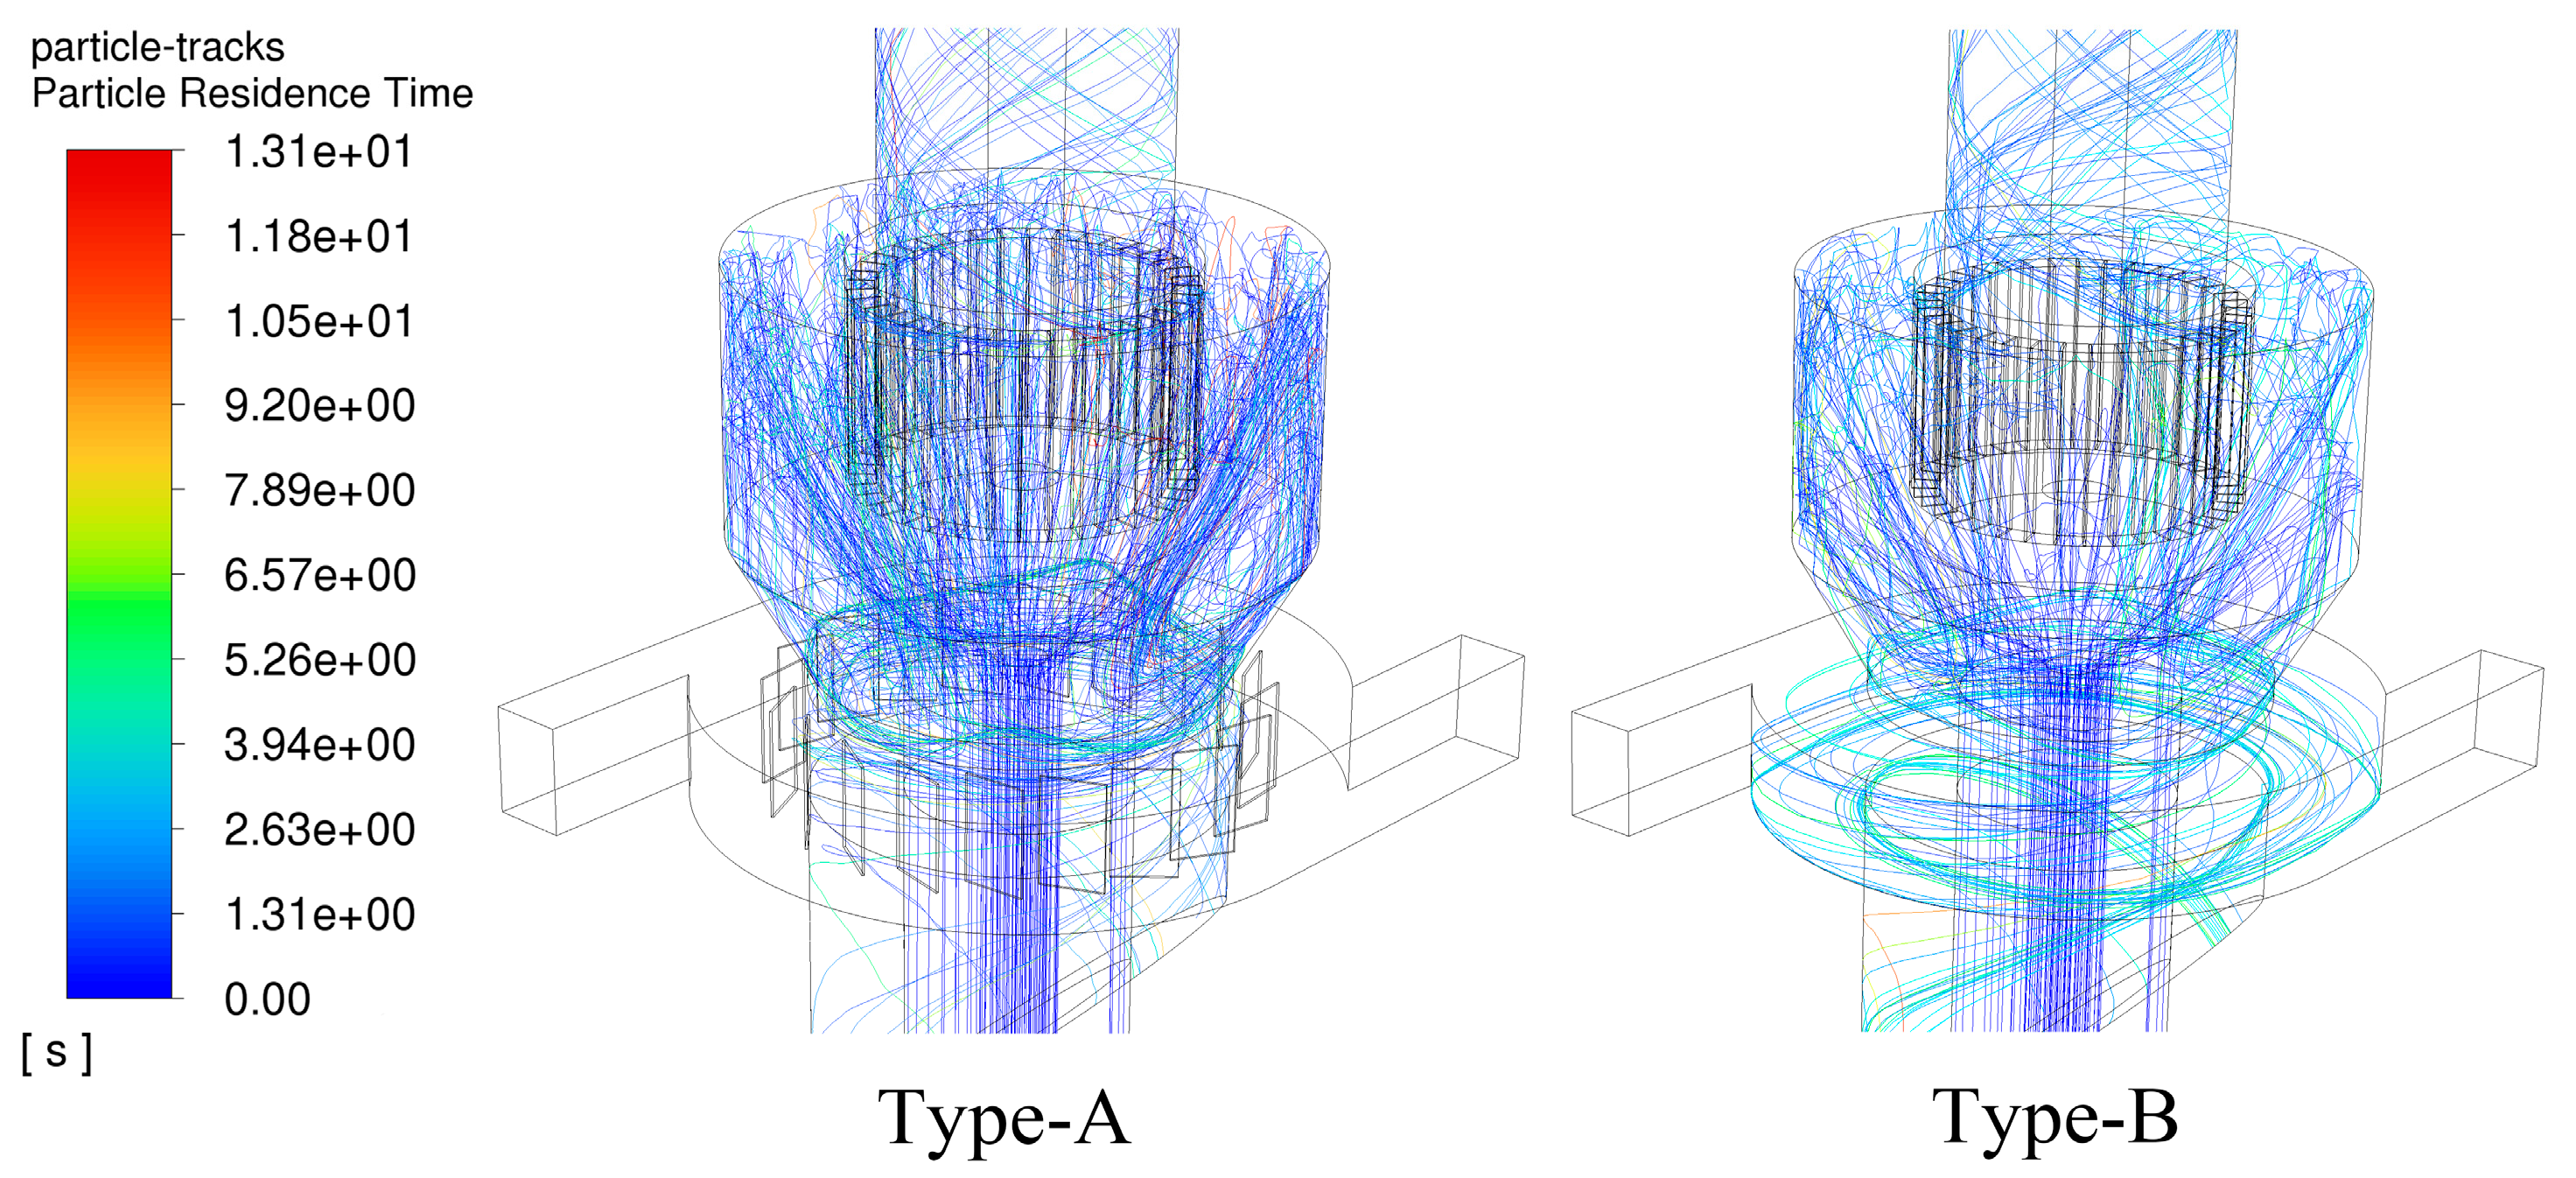
3.4. Analysis of Discrete-Phase Simulation Results

Based on DPM simulation results, Figure 11 compares the Tromp curves for configurations with (Type-A) and without (Type-B) guide vanes. The Type-A configuration demonstrates significantly superior classification performance. Specifically, Type-A exhibits a clear improvement in classification precision over Type-B. This enhancement is attributed to the guide vanes’ ability to direct airflow, forming a stable velocity gradient that reduces particle disorder collisions and entrainment losses, thereby improving classification precision. As shown in Figure 11a–d, the Tromp curve for Type-B is shifted leftward relative to Type-A, indicating a reduced cut size (D50). Particle trajectory analysis (Figure 6) reveals that the swirling effect induced by the Type-B volute increases the average particle residence time from 2.62 s (Type-A) to 2.94 s. While a prolonged residence time can enhance particle separation, it also increases the particle concentration within the volute and can trigger particle deposition—a phenomenon later confirmed by particle concentration distribution echograms. These results demonstrate that guide vanes play a critical role in optimizing flow field uniformity and shortening the effective separation time.
As shown in Figure 12, the particle concentration cloud maps for the structure with and without guide vanes at different radii are presented, and Table 3 lists the area-weighted averages of particle concentration corresponding to these cloud maps. Specifically, Figure 12a–d and Figure 12e–h, respectively, show the particle concentration distribution characteristics within the Type-A and Type-B secondary air volutes (R = 250 mm) at radii of R = 245 mm, R = 224 mm, R = 200 mm, and R = 173 mm. From Figure 12a–d, the overall particle concentration in the Type-A structure is relatively low. At radii R = 245 mm and R = 224 mm, the particle concentrations are extremely small, with area-weighted averages of 3.7 × 10⁻⁶ kg/m3 and 3 × 10⁻³ kg/m3, respectively. This occurs because the presence of guide vanes forms a spatial barrier, hindering particles from entering the region between the volute and the vanes. At R = 200 mm and R = 173 mm, some particles collide with and are blocked by the guide vanes, maintaining the particle concentration at a low level. In comparison, Figure 12e–h show that the particle concentration in the Type-B structure is significantly higher. Particularly at R = 245 mm, particles form distinct deposition near the volute wall, with the area-weighted average reaching 2.03 kg/m3. This phenomenon indicates that, compared to the Type-B structure, the optimized guide vane design in the Type-A structure effectively reduces the particle concentration within the volute, thereby avoiding particle deposition caused by excessively high concentrations.

4. Influence of the Angle of the Secondary Air Guide Blade on the Flow Field

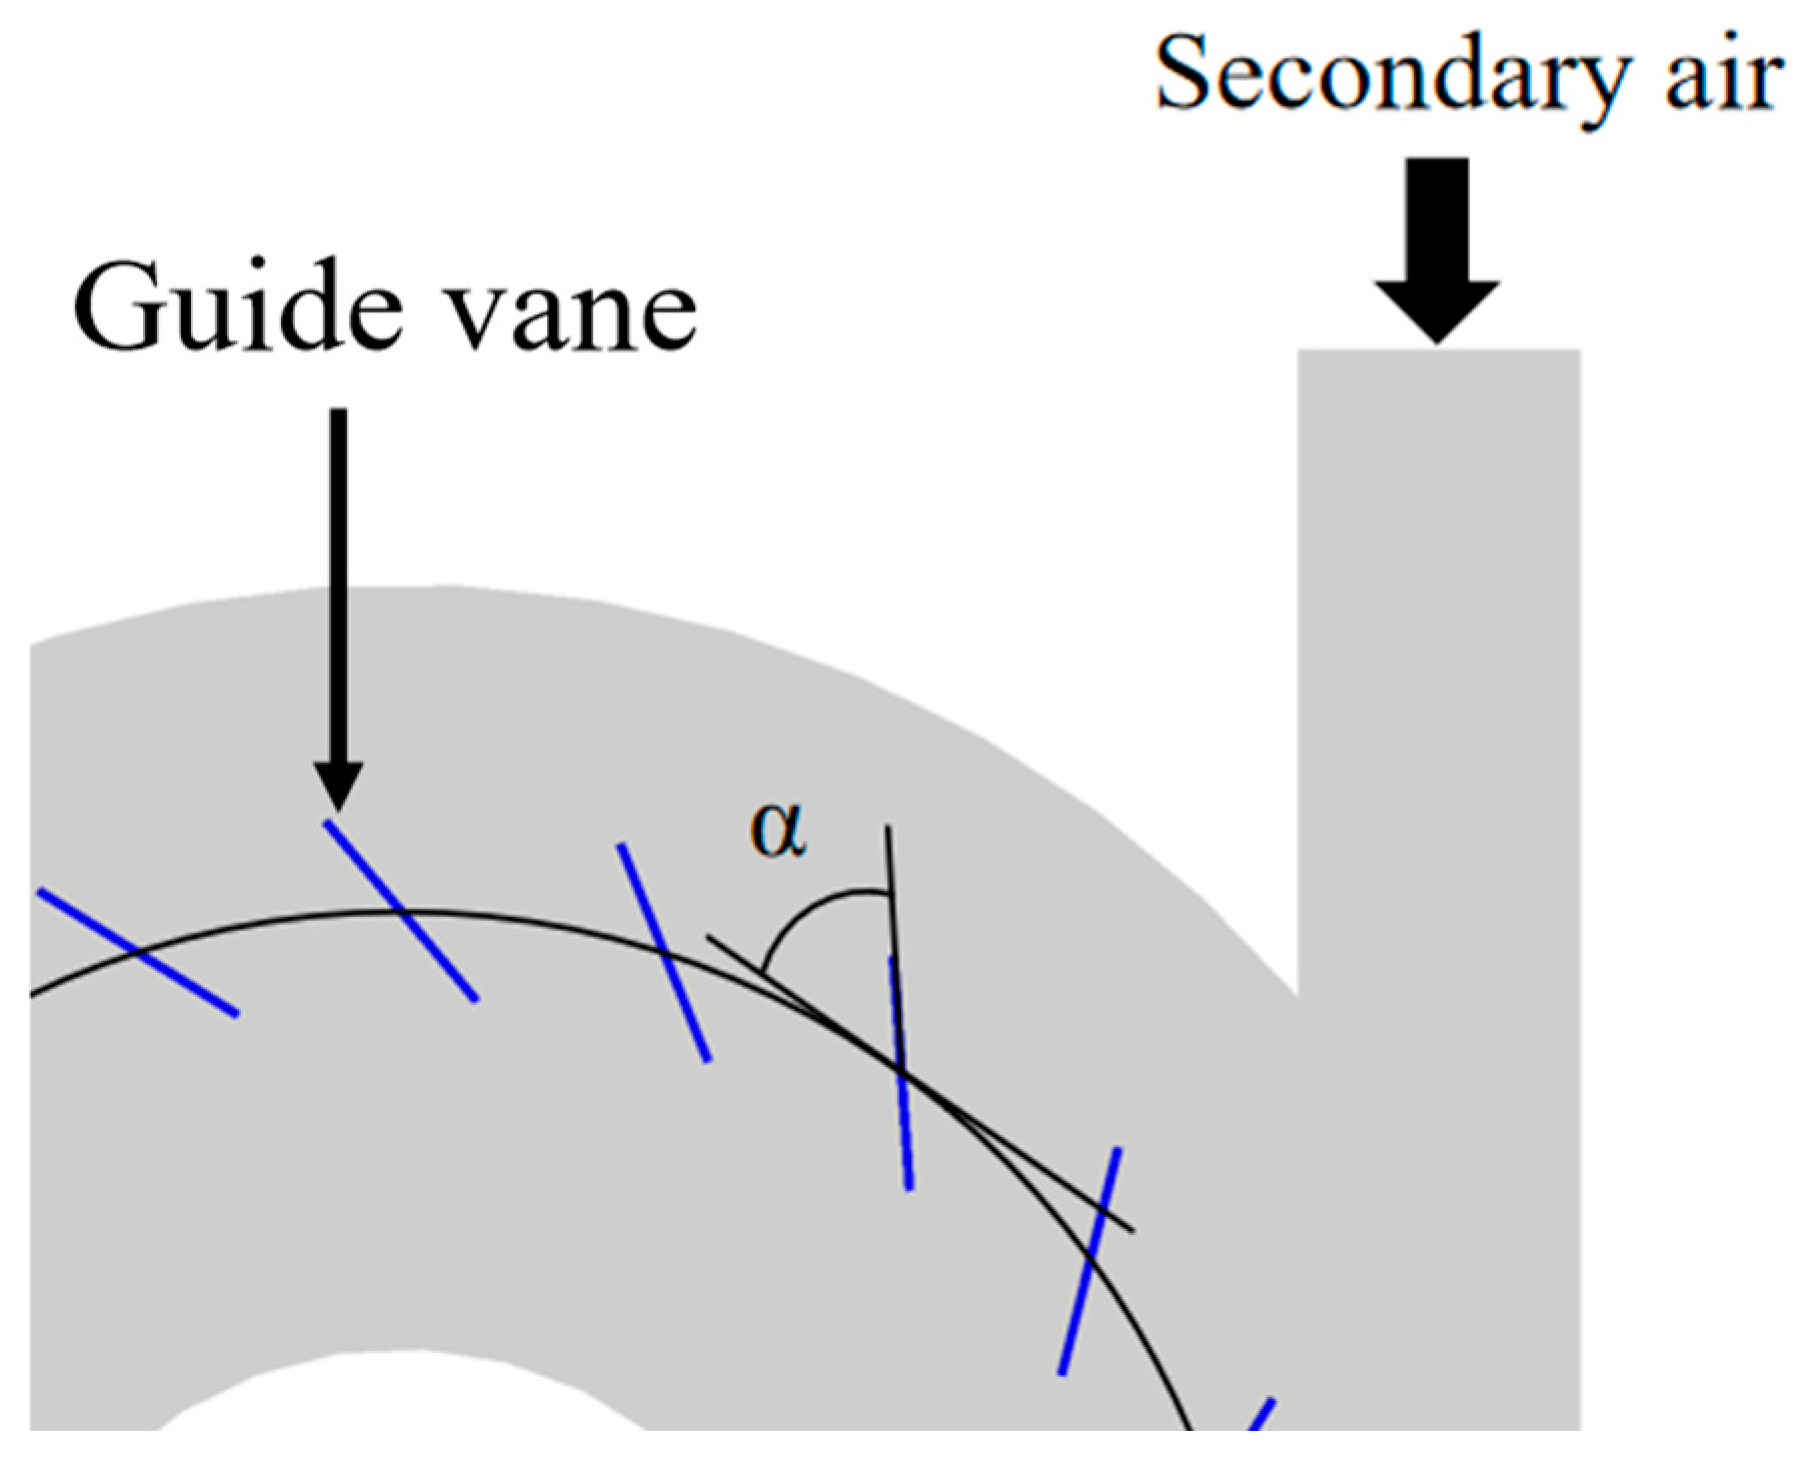
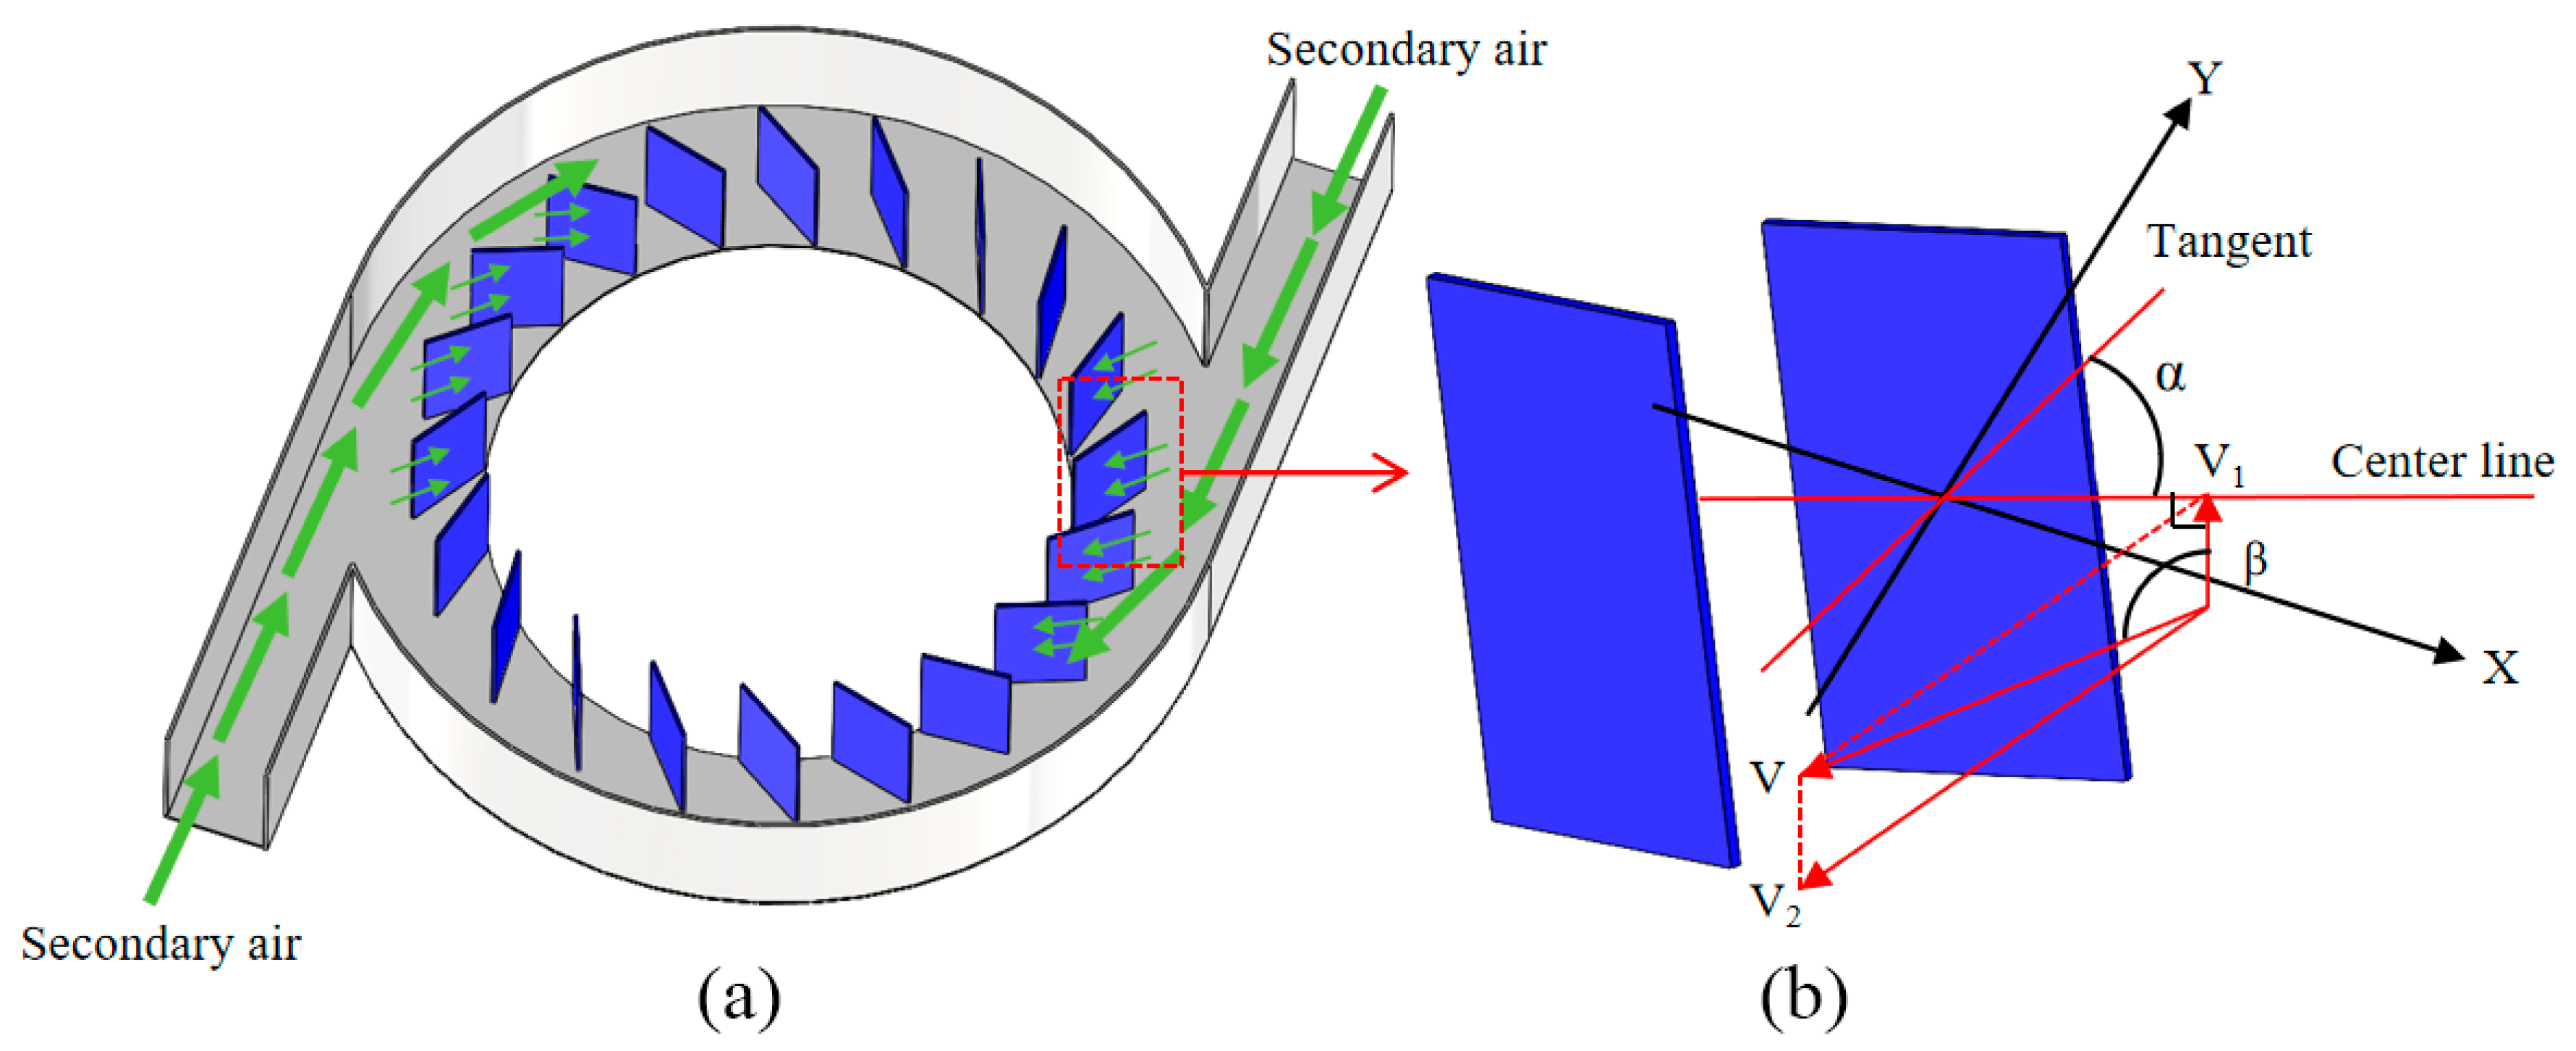
4.1. Guide Blade Setting Angle Model

According to Section 3, the secondary air deflector blade structure can effectively enhance the classification performance of the turbine air classifier. To explore the optimization effect of the installation angle on the performance of the turbine air classifier, as shown in Figure 13, the installation angle α of the guide vane is defined as the angle between the centerline of the vane and the tangent line of the circumference (diameter R = 180 mm), where the center point is located. This geometric parameter has a decisive influence on the classification accuracy and energy consumption characteristics. To reveal the regulation law of the α angle on the classification flow field, this study adopted the comparative experimental design method and selected α = 30°, 40°, and 50°, three kinds of typical installation angles, as the comparative working condition. The tangential velocity distribution law of the flow field between the guide vanes and its mechanism on the classification efficiency were investigated by numerical simulation under the simulated working condition 600-12-2.

4.2. Guide Vane Design and Flow Characterization

The airflow motion characteristics in the guide vane channel are shown in Figure 14a. When the secondary wind enters the worm shell, its motion trajectory is deflected by the curvature of the worm shell. When flowing through the region of the guide vanes, the airflow generates a diversion, and part of it enters the guide vane channel, while the other part continues to move along the wall of the worm shell. Figure 14b shows, in detail, the trajectory of the airflow in the XY plane in the guide vane channel and its force characteristics, where α is the installation angle of the guide vane and β is the angle between the airflow velocity V and its component V1 normal to the vane. Since the airflow velocity V remains constant at different installation angles, according to the velocity quadrilateral decomposition law, V2 is the tangential velocity component. Theoretical analysis shows that when the mounting angle α increases, the normal velocity component V1 increases consequently, resulting in an enhanced impact effect of the airflow on the blade surface. This strong impact effect will trigger the airflow to rebound and interact with the subsequent incoming flow to form a complex turbo structure, thus reducing the stability of the channel flow field. On the contrary, when the mounting angle α decreases, the β angle decreases accordingly, and the V1 component decreases, at which time the airflow trajectory matches the blade geometry more closely. However, too small a mounting angle can lead to too narrow a blade channel, which not only increases the flow resistance but also causes significant energy loss. Therefore, by optimizing the installation angle of the guide vanes, the stability of the flow field can be effectively improved, and the flow loss can be reduced while ensuring the channel flow capacity.

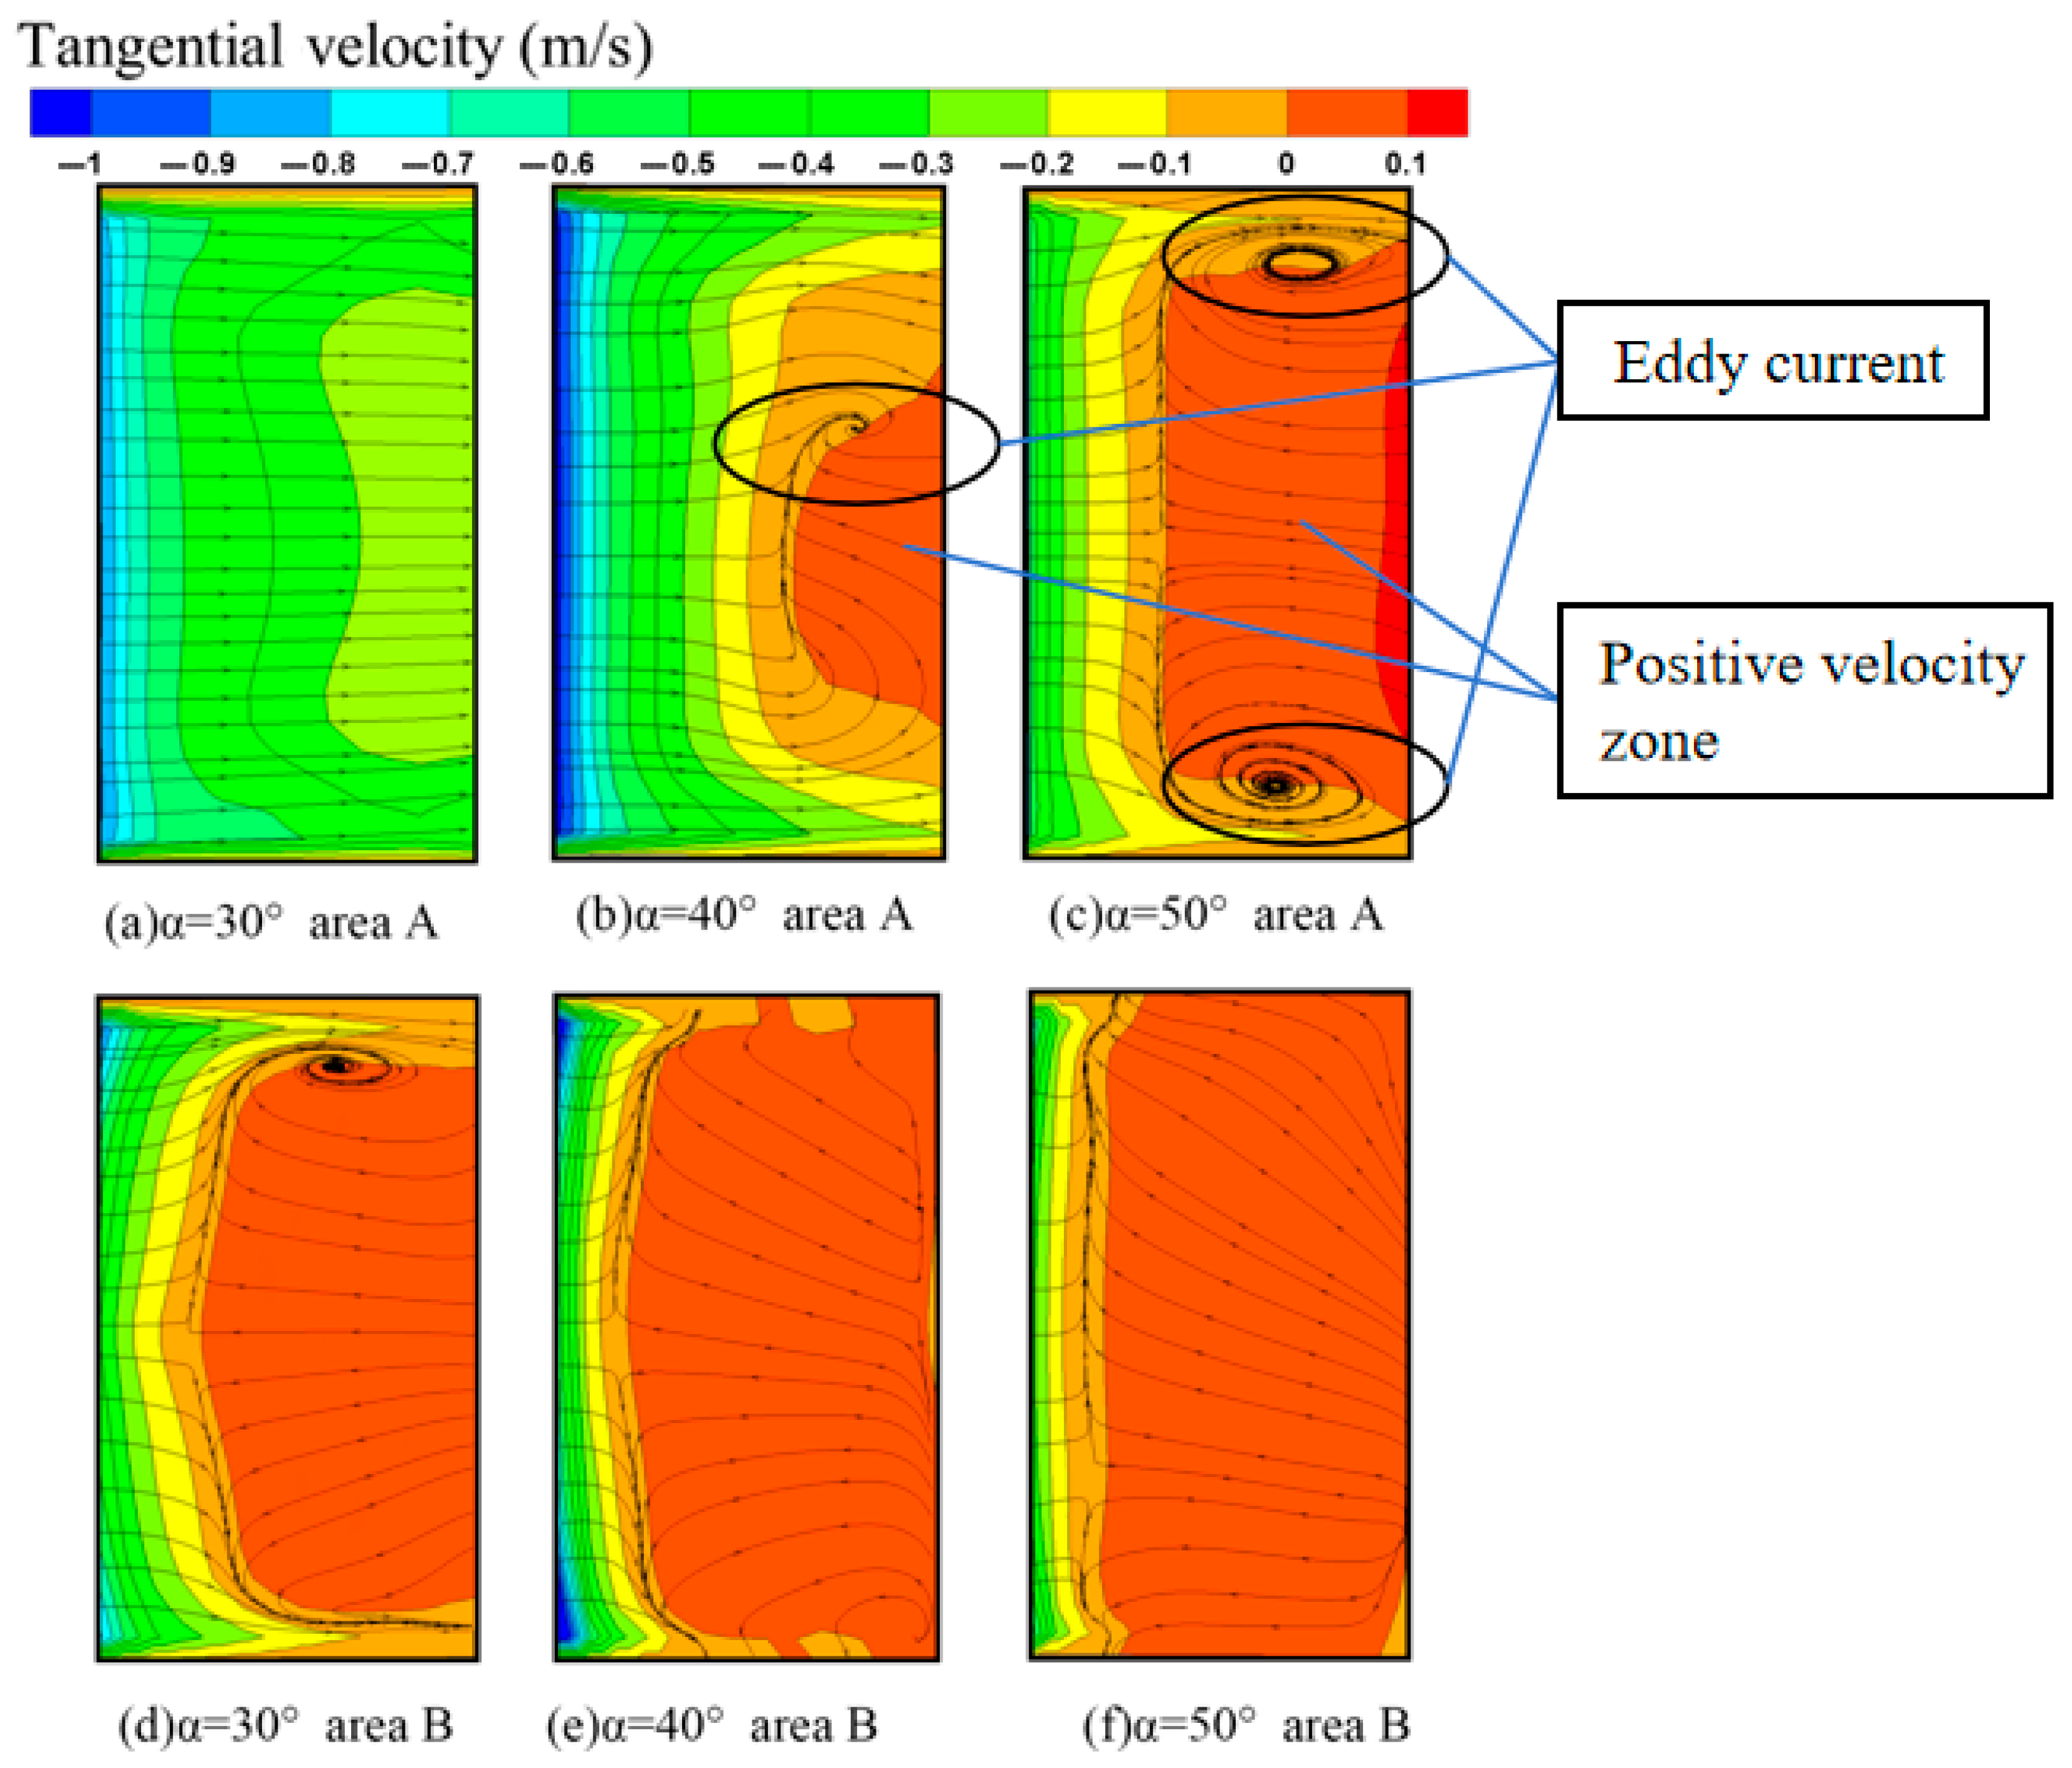
4.3. Effect of Different Angles of Guide Vanes on Tangential Velocity

Tangential velocity is a key parameter characterizing the secondary wind structure, and its distribution directly affects the stability of the classifier’s secondary elutriation flow field. To study the flow characteristics of the secondary wind within the channels formed by deflector blades at different angles and based on the strict geometric symmetry of the secondary wind structure, a single air inlet was selected as the study object. At this inlet, representative guide vanes were selected from its inner and outer ends, designated A and B, respectively. The regions near the pressure surfaces of these vanes were defined as channels for observing airflow velocity.
The airflow traces and tangential velocity clouds on the blade surface at different installation angles are shown in Figure 15. As shown in Figure 15a–c, the variation of the tangential velocity distribution in region A with the mounting angle α is significantly characterized. When α = 30°, the tangential velocities in the region are all negative, indicating that the airflow passes smoothly through the blade channel, which is conducive to maintaining flow field stability. However, when α increases to 40° and 50°, a localized positive velocity region appears on the inner side of the blade, forming a larger velocity gradient with the negative velocity region on the outer side. From the airflow traces, it can be clearly observed that this velocity gradient results in a distinct vortex structure, and the scale of the vortex increases with the installation angle. This behavior aligns with the flow characteristics inherent to the blade design and will significantly reduce flow field stability. As shown in Figure 15d–f, the tangential velocity magnitude in region B is overall smaller than in region A. With increasing mounting angle α, the tangential velocity in region B also shows a decreasing trend. Specifically, when α = 30°, the airflow traces maintain symmetry between the upper and lower regions. However, when α is increased to 40° and 50°, this symmetry is gradually compromised. This asymmetric flow characteristic exacerbates the instability of the flow field.

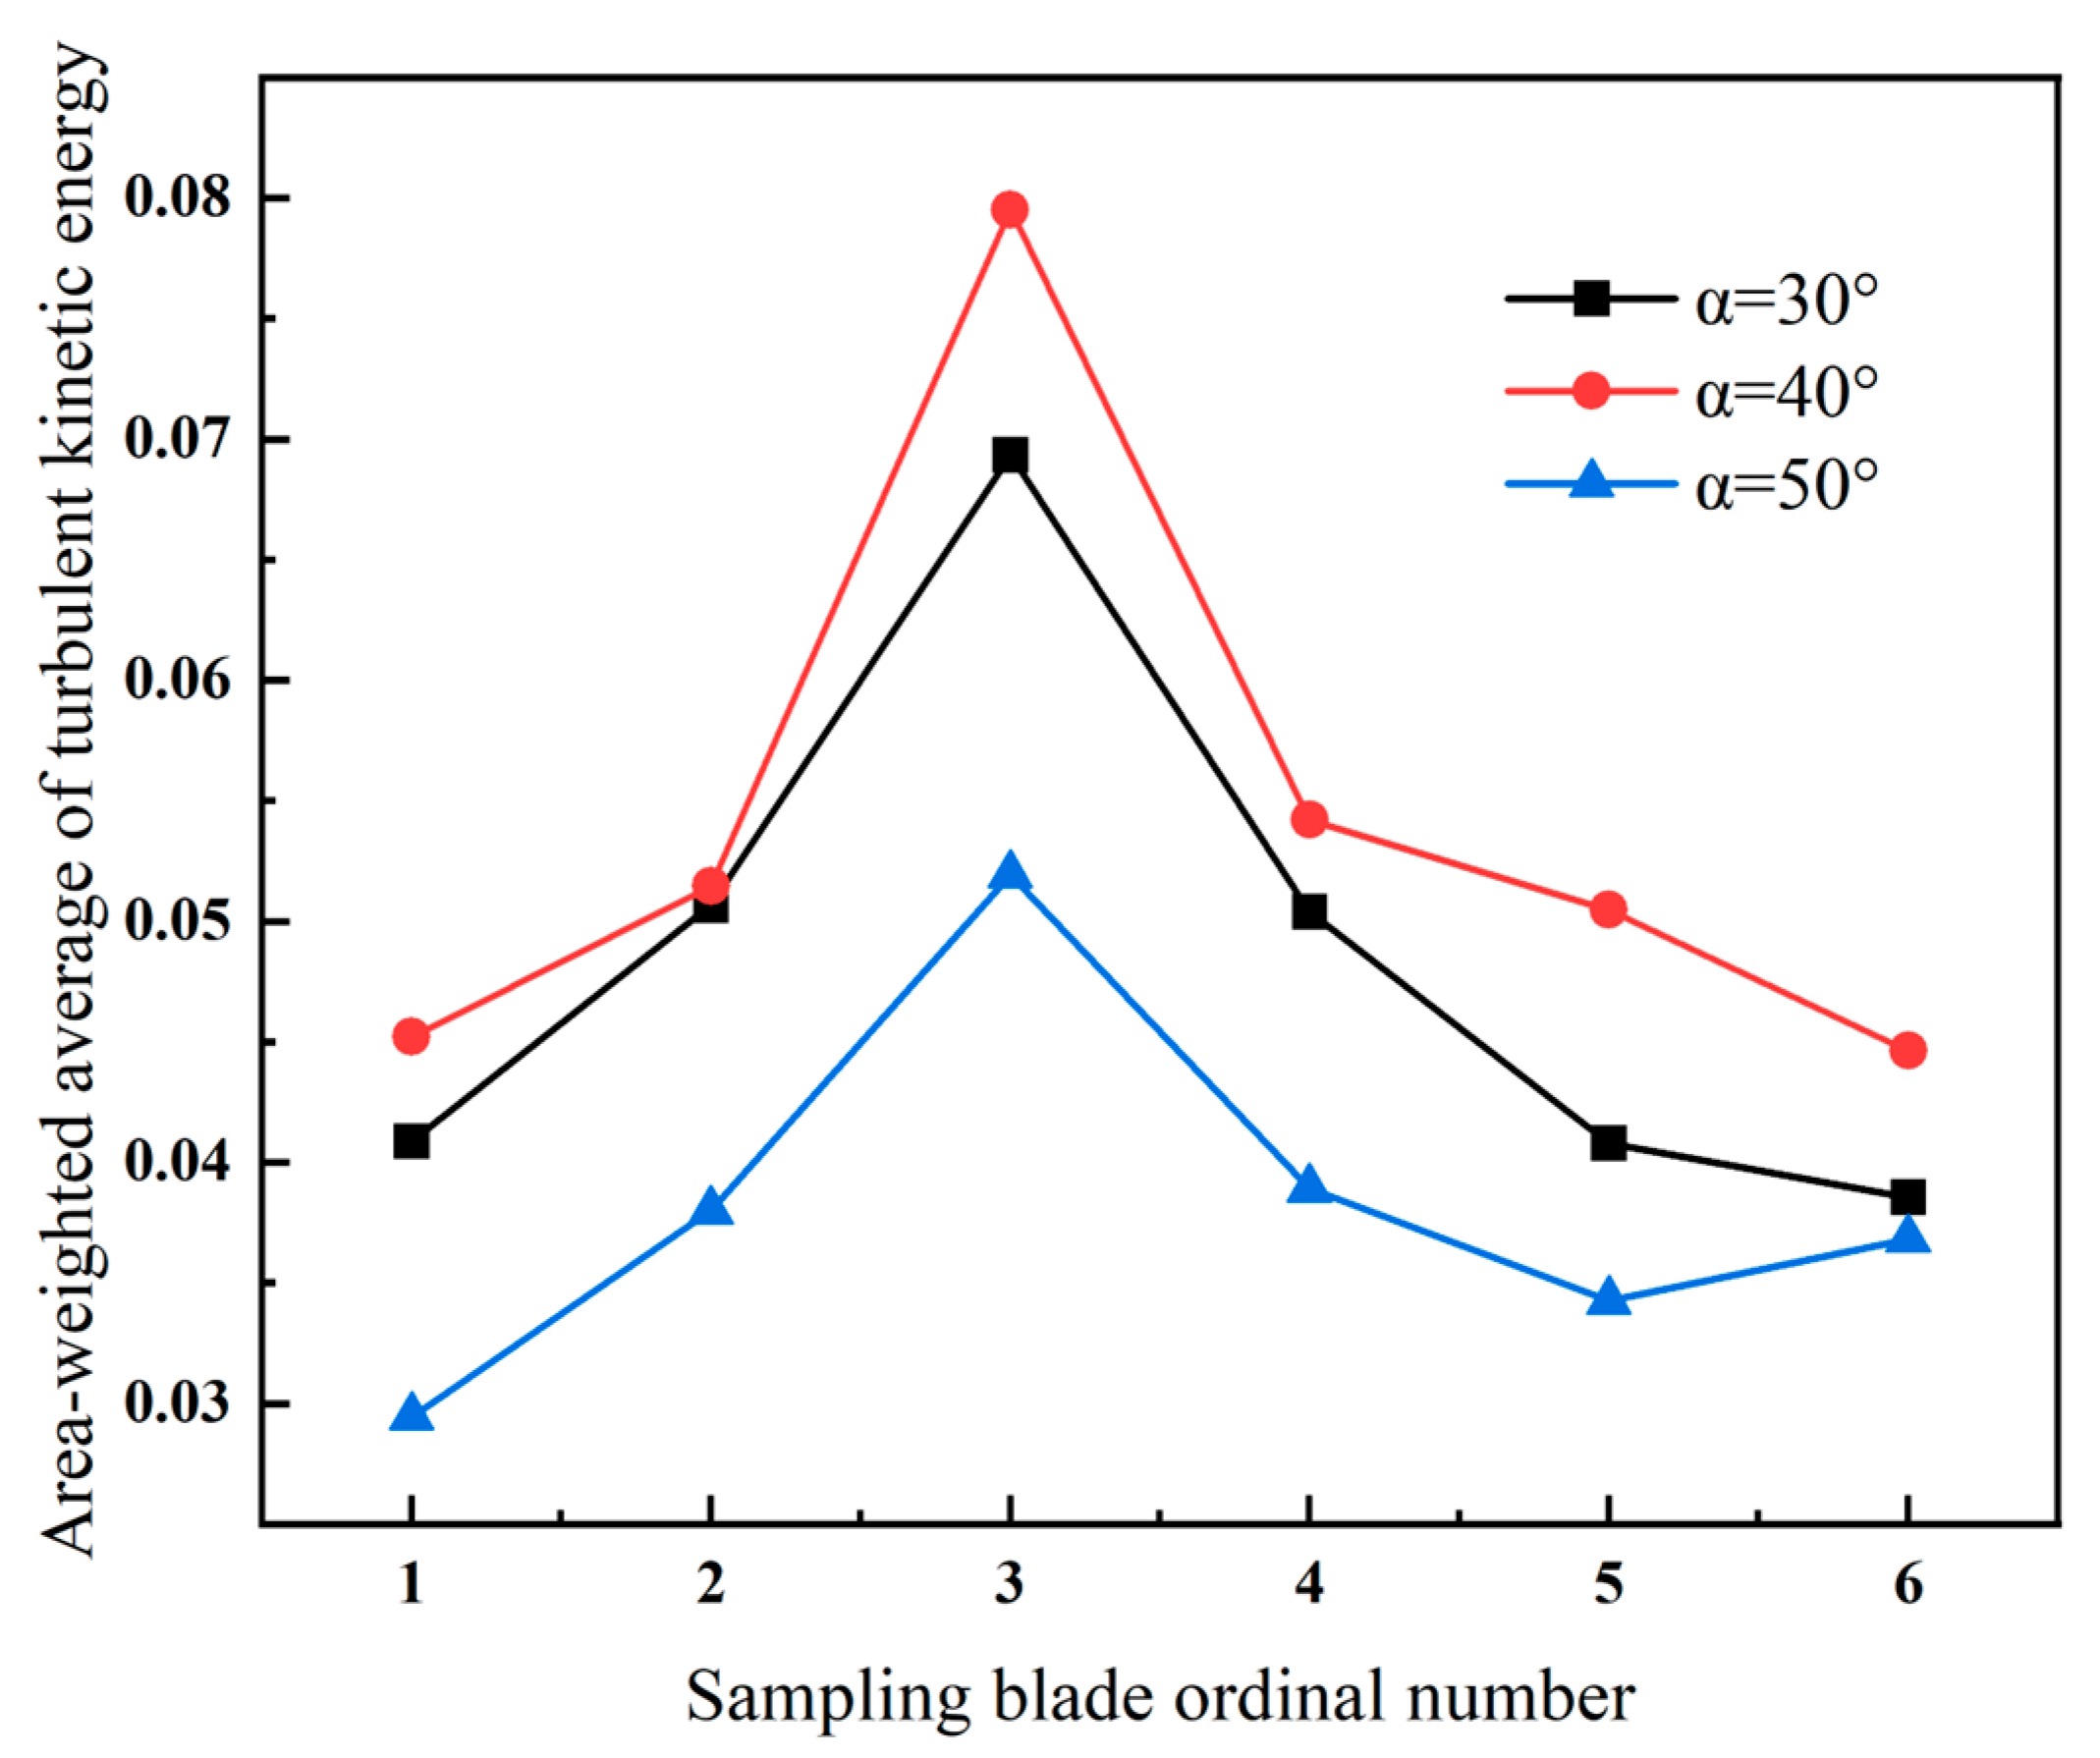
4.4. The Influence of Installation Angle on the Vorticity and Turbulent Kinetic Energy of Guide Vanes

To investigate the influence of the installation angle of guide vanes on the vorticity near the vanes and the turbulent kinetic energy on the vane surface, sampling and analysis were conducted on six guide vanes (sampling numbers 1–6) from the proximal end to the distal end of the secondary air inlet. The vorticity contour near the vanes is shown in Figure 16. It can be observed that as the installation angle increases, the vorticity near the vanes gradually decreases. At α = 30°, although the local vorticity is relatively high, indicating stronger vortex activities and turbulent fluctuations, this may be beneficial to the classification process. These moderate vortices provide favorable conditions for material dispersion and efficient classification. However, the significant reduction in vorticity caused by larger angles may make it difficult for particles with larger inertia to completely follow the airflow deflection, resulting in some particles deviating from the ideal trajectory, impacting the vanes or entering the volute, thus reducing the classification accuracy. The area-weighted average turbulent kinetic energy (TKE) on the vane surface is shown in Figure 17. The area-weighted average TKE for vanes 1 to 6 shows a trend of first increasing and then decreasing, with a maximum value of 0.0795 m2/s2 and a minimum value of 0.0295 m2/s2. It is worth noting that excessively high TKE causes disordered airflow distribution within the vane channels, thereby interfering with the classification process. Conversely, excessively low TKE weakens the airflow’s carrying capacity for particles, leading to an increased particle concentration on the vane surface (as shown in Figure 12c,d). In comparison, the curve at α = 30° exhibits a moderate level of TKE. This condition can not only effectively regulate the airflow state between the vanes but also reduce the deposition concentration of particles on the vane surface.

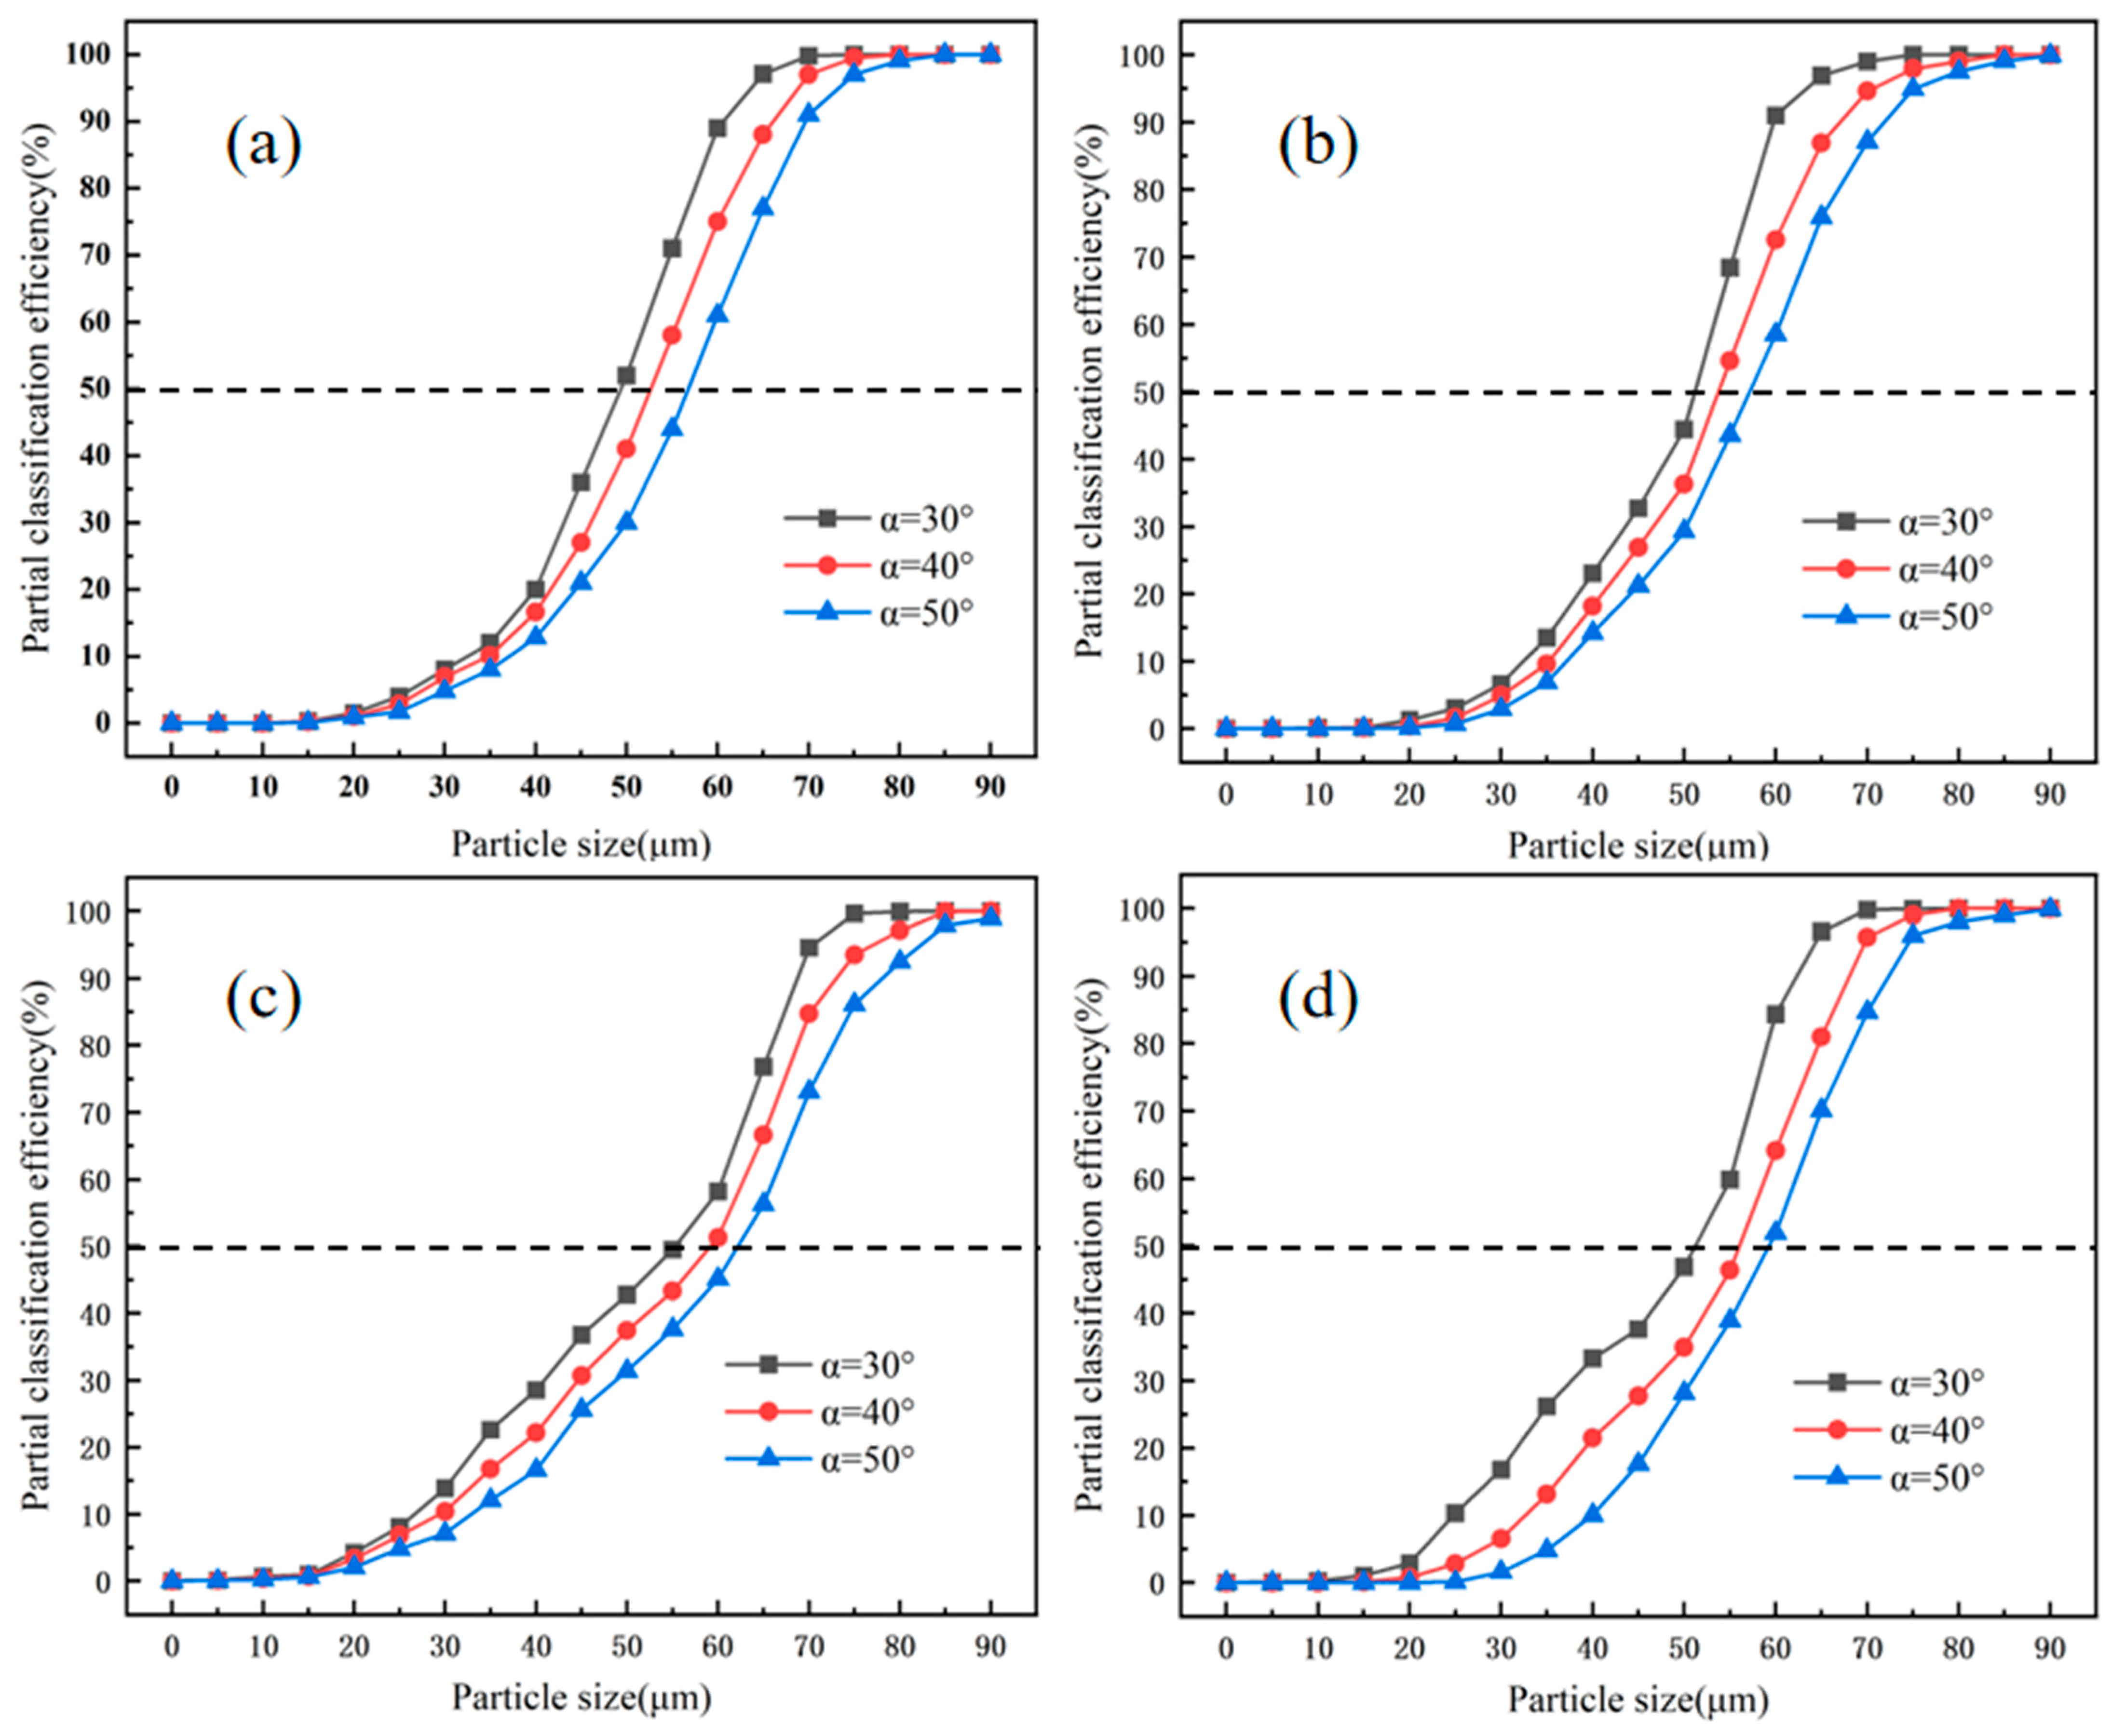
4.5. Analysis of Discrete-Phase Simulation Results

To further validate the findings, this study employed the discrete-phase model (DPM) to conduct numerical simulations on the motion trajectories of 18 groups of particles with different sizes under various operating conditions. The focus was on comparing size distribution characteristics at different installation angles. Analysis of the Tromp curves in Figure 18a–d reveals that as the installation angle α increases from 30° to 50°, the curves exhibit a distinct rightward shift. Among these, the Tromp curve at α = 30° is the steepest, indicating higher classification precision. Simultaneously, the cut size increases with larger installation angles. Comparing Figure 18a with Figure 18b,c, it is evident that rotor speed and primary air velocity have minimal influence on the Tromp curves. This occurs because their primary effects are confined to the classification zone, with limited impact on the secondary elutriation zone. In contrast, comparing Figure 18a with Figure 18d demonstrates that secondary air velocity significantly affects the Tromp curves, particularly for fine particles. This observation aligns with the action mechanism of the secondary air elutriation flow field.

5. Experimental Results and Analysis

5.1. Experimental Setup and Material

Figure 19a shows that the experimental classification system consisted of the screw feeder, rotor classifier, cyclone collector, bag filter, and draft fan. The parameters of the system equipment are detailed in Table 4. In this experiment, calcium carbonate was used as the raw material, and the feed quantity was about 0.5 kg each time. The particle size of the powder sample was measured using a Bettersize 2000 (Dandong Bettersize Instruments Co., Ltd., Dandong, China) laser particle size distribution meter, and the particle size distribution of the raw material is shown in Figure 19b.

5.2. Comparison of Simulation and Experimental Results

To verify the reliability of the numerical simulation, this study carried out a quantitative comparative analysis between the powder classification experiment and the discrete-phase model (DPM) for the Type-A (α = 30°) and Type-B structures under the 600-12-2 working condition. As shown in Figure 20, some of the grading efficiency curves of the simulation and experiment showed a typical S-shaped distribution. As the particle size increased, the classification efficiency increased monotonically, and the trend of the two was highly consistent. There was a “fishhook effect” in the experimental part, where the particles were smaller. This is because when the particle size is small, agglomeration is prone to occur, causing some fine particles to be collected as coarse powder, while this situation did not exist in the simulation. To enhance the reliability of the experimental results, repeated tests were conducted under identical operating conditions. The findings indicate that the error range increased as particle size grew, but consistently remained within an acceptable range of 5%. Comparisons of the experimental and simulated values and K-values are shown in Table 5. In the Type-A structure, the experimentally measured cut particle size D50 = 56 μm, while the predicted value of DPM was 48.9 μm, with a relative error of 12.7%. In the Type-B structure, the experimentally measured cut particle size D50 = 48.7 μm, while the predicted value of DPM was 43.8 μm, with a relative error of 10.1%. Both were within the acceptable range for gas–solid two-phase flow simulation. In terms of the K value, the experimental values were all lower than the simulated values, with errors of 9.2% and 13.3% for the two structures, respectively. This is because the DPM does not consider the collision and aggregation between particles. Nevertheless, the DPM model can still effectively predict the change rule of classification performance, which is helpful for the optimization of the structure of air classifiers.

6. Conclusions

In this paper, the flow field distribution inside the rotor classifier was calculated using finite volume computational fluid dynamics using ANSYS Fluent 19.2 software. A discrete-phase model was used to predict the motion of particles in a single-phase flow. The following conclusions were drawn:
  • Compared to the secondary air configuration without guide vanes, the configuration with guide vanes exerted a more significant influence on the tangential velocity in the classification zone, substantially enhancing it. Furthermore, this design significantly improved the axial velocity and flow field stability in the secondary elutriation zone. Additionally, the guide vane structure effectively mitigated the rise in particle concentration within the volute.
  • The secondary air guide vane structure significantly enhanced the classifier’s performance, demonstrating its most pronounced improvement at an installation angle of 30°. This angle effectively promoted flow field stability, maintaining turbulent kinetic energy on the guide vane surfaces within an optimal range. Experimental studies indicated that installation angles either too large or too small adversely affected particle classification. Furthermore, DPM model simulations confirmed that classification efficiency peaked at 30°, optimizing powder separation efficiency.
  • Material experiments revealed that although some discrepancies existed between simulation and experimental results, the DPM model could still accurately predict the trend of grading efficiency. This demonstrates its value for the structural optimization of the air classifier.
  • This study elucidated how the angle of the guide vanes regulated the secondary air flow field and classification performance, identifying 30° as the optimal angle. Implementing this optimal angle can directly enhance the efficiency and stability of existing classifiers, while simultaneously reducing energy consumption and maintenance costs. Future research will explore curved guide vane geometries, unsteady flow simulations, and adaptability to multiple materials, and will further verify the application of this optimized design in industrial classifiers.

Author Contributions

Y.F. provided the design idea of the new classifier and supervised the research; F.W. was responsible for the analysis of experimental results, writing, and editing the manuscript; Z.Z. and J.P. were responsible for making modifications. All authors have read and agreed to the published version of the manuscript.

Funding

This research received no external funding.

Data Availability Statement

The original contributions presented in this study are included in the article. Further inquiries can be directed to the corresponding author.

Conflicts of Interest

The authors declare no potential conflicts of interest with respect to the research, authorship, and/or publication of this article.

References

  1. Lee, S.; Jeong, S.B. Enrichment by air classification of indium components from In-containing scrap powders scraped by sand-blasting chamber shields of sputter coaters. Rare Met. 2010, 29, 1–8. [Google Scholar] [CrossRef]
  2. Denmud, N.; Baite, K. Effects of Operating Parameters on the Cut Size of Turbo Air Classifier for Particle Size Classification of SAC305 Lead-Free Solder Powder. Processes 2019, 7, 427. [Google Scholar] [CrossRef]
  3. Yu, Y.; Kong, X. Effect of rotor cage’s outer and inner radii on the inner flow field of the turbo air classifierEinfluss von Aussen- und Innenradien des Rotorkafigs auf das innere Flussfeld von einem Turbo-Luftsichter. Mater. Werkst. 2020, 51, 908–919. [Google Scholar] [CrossRef]
  4. Yu, Y.; Liu, J. A parametric cut size prediction model for a turbo air classifier. Mater. Werkst. 2018, 49, 1510–1519. [Google Scholar] [CrossRef]
  5. Zeng, Y.; Zhang, S. Numerical Simulation of a Flow Field in a Turbo Air Classifier and Optimization of the Process Parameters. Processes 2020, 8, 237. [Google Scholar] [CrossRef]
  6. Hui, C.X.; Li, Q. Computational fluid dynamics simulation and performance study of a three-separation combined air classifier. Therm. Sci. 2024, 28, 1589–1603. [Google Scholar] [CrossRef]
  7. Esmaeilpour, M.; Mohebbi, A. CFD simulation and optimization of an industrial cement gas-solid air classifier. Particuology 2024, 89, 172–184. [Google Scholar] [CrossRef]
  8. Kim, M.; Cha, J. Ring-Shaped Baffle Effect on Separation Performance of Lithium Carbonate Micro Particles in a Centrifugal Classifier. Micromachines 2020, 11, 980. [Google Scholar] [CrossRef] [PubMed]
  9. Abohelwa, M.; Benker, B. Limitation in the Performance of Fine Powder Separation in a Turbo Air Classifier. Processes 2023, 11, 2817. [Google Scholar] [CrossRef]
  10. Yu, Y.; Wang, L. Analysis of numerical simulation models for the turbo air classifierAnalyse eines numerischen Simulationsmodells fur einen Turbowindsichter. Mater. Werkst. 2022, 53, 644–657. [Google Scholar] [CrossRef]
  11. Peng, J.X.; Hui, C.X. Research and Optimization of Operating Parameters of a Rotor Classifier for Calcined Petroleum Coke. Processes 2024, 12, 603. [Google Scholar] [CrossRef]
  12. Yu, Y.; Ren, W. Analysis and optimization of process parameters affecting classification performances indices of the turbo air classifier. Mater. Werkst. 2015, 46, 970–977. [Google Scholar] [CrossRef]
  13. Mou, X.L.; Jia, F.C. CFD-Based Structural Optimization of Rotor Cage for High-Efficiency Rotor Classifier. Processes 2021, 9, 1148. [Google Scholar] [CrossRef]
  14. Jia, F.C.; Mou, X.L. A New Rotor-Type Dynamic Classifier: Structural Optimization and Industrial Applications. Processes 2021, 9, 1033. [Google Scholar] [CrossRef]
  15. Li, Q.; Mou, X.L. Effects of a Guide Cone on the Flow Field and Performance of a New Dynamic Air Classifier. Processes 2022, 10, 874. [Google Scholar] [CrossRef]
  16. Yang, H.D.; Sun, Z.P. Vortex analysis and flow field optimization for the particle classifier with three rotary cages. Adv. Powder Technol. 2023, 34, 12. [Google Scholar] [CrossRef]
  17. Yu, Y.; Chen, W. Design of the new guide vane for the turbo air classifierDesign eines neuen Austrittsleitrads fur Turbo-Luftsichter. Mater. Werkst. 2023, 54, 196–206. [Google Scholar] [CrossRef]
  18. Liu, R.R.; Liu, J.X. Effects of axial inclined guide vanes on a turbo air classifier. Powder Technol. 2015, 280, 1–9. [Google Scholar] [CrossRef]
  19. Yu, Y.; Li, X.S. Influence of guide vane on dispersion of aggregates near the guide vane in a turbo air classifier. Powder Technol. 2024, 434, 12. [Google Scholar] [CrossRef]
  20. Huang, Q.; Liu, J.X. Turbo air classifier guide vane improvement and inner flow field numerical simulation. Powder Technol. 2012, 226, 10–15. [Google Scholar] [CrossRef]
  21. Zeng, Y.; Huang, B.W. Numerical and Experiment Investigation on Novel Guide Vane Structures of Turbo Air Classifier. Processes 2022, 10, 844. [Google Scholar] [CrossRef]
  22. Liu, K.; Chen, W. The influence of the guide vane positioning on the flow field of a turbo air classifier. Mater. Werkst. 2024, 55, 1385–1394. [Google Scholar] [CrossRef]
  23. Zhao, Z.W.; Hili, C. Influence of secondary air on the flow field of NGZF classifier. Therm. Sci. 2024, 28, 4637–4653. [Google Scholar] [CrossRef]
  24. Sun, Z.P.; Liang, L.L. CFD simulation and performance optimization of a new horizontal turbo air classifier. Adv. Powder Technol. 2021, 32, 977–986. [Google Scholar] [CrossRef]
  25. Braun, R.M.; Kolacz, J. Fine dry comminution of calcium carbonate in a Hicom mill with an Inprosys air classifier. Miner. Eng. 2002, 15, 123–129. [Google Scholar] [CrossRef]
  26. Gao, L.P.; Yu, Y. Study on the cut size of a turbo air classifier. Powder Technol. 2013, 237, 520–528. [Google Scholar] [CrossRef]
  27. Yu, Y.; Liu, R.R. Correspondence analysis and establishment of evaluation model of classification performance indices for a turbo air classifier. Mater. Werkst. 2014, 45, 900–911. [Google Scholar] [CrossRef]
Figure 1. The three-dimensional structure of the rotor classifier.
Processes 13 02268 g001
Figure 2. Classifier dimensions (a) and two guide vane configurations (b).
Processes 13 02268 g002
Figure 3. Meshes of the rotor classifier.
Processes 13 02268 g003
Figure 4. Radial velocity distribution for different mesh numbers.
Processes 13 02268 g004
Figure 5. Classifier airflow traces: (a) Overall airflow trajectory. (b) Primary air flow trajectory. (c) Secondary air flow trajectory.
Processes 13 02268 g005
Figure 6. Particle trajectory.
Processes 13 02268 g006
Figure 7. Tangential velocity distribution.
Processes 13 02268 g007
Figure 8. Cloud diagram of axial velocity distribution in the region of the deflector cone in the secondary elution zone.
Processes 13 02268 g008
Figure 9. Axial velocity distribution at sampling points.
Processes 13 02268 g009
Figure 10. Cloud diagram of axial velocity distribution in the coarse powder collection area of the secondary elution zone.
Processes 13 02268 g010
Figure 11. Tromp curves with and without guide vanes: (a) 600-12-2, (b) 500-12-2, (c) 600-14-2, and (d) 600-12-1.5.
Processes 13 02268 g011
Figure 12. Particle concentration cloud map.
Processes 13 02268 g012
Figure 13. Guide blade mounting angle α.
Processes 13 02268 g013
Figure 14. Characteristics of airflow motion (a) and airflow force between blades (b).
Processes 13 02268 g014
Figure 15. Airflow trajectory and tangential velocity diagram.
Processes 13 02268 g015
Figure 16. Vorticity contour map near the guide vanes.
Processes 13 02268 g016
Figure 17. Area-weighted average of turbulent kinetic energy.
Processes 13 02268 g017
Figure 18. Tromp curves for different mounting angles: (a) 600-12-2, (b) 500-12-2, (c) 600-14-2, and (d) 600-12-1.5.
Processes 13 02268 g018
Figure 19. Schematic of the experimental setup (a) and particle size distribution of the raw material (b).
Processes 13 02268 g019
Figure 20. Experimentation and simulation of Tromp curves.
Processes 13 02268 g020
Table 1. Number of meshes in each region.
RegionMesh Number
Fine powder outlet276,628
Rotor cage376,992
Classification chamber353,640
Deflector cone356,048
Secondary air inlet332,729
Coarse powder outlet379,128
Primary air inlet343,059
Sum2,418,224
Table 2. Boundary parameters.
Boundary TypePrimary Air InletSecondary Air Inlet
Velocity12 m/s2 m/s
Turbulence intensity3.6%5.1%
Hydraulic diameter175 mm70 mm
Pressure0 pa0 pa
Table 3. Area-weighted average of particle concentration.
Type-AType-B
R (mm)245224200173245224200173
Area-weighted average (kg/m3)3.7 × 10−63 × 10−35.8 × 10−21.32 × 10−12.031.811.991.78
Table 4. The classification system equipment list.
No.Name of EquipmentSpecification TypeTechnical ParametersNote
01Raw material siloφ600Effective volume 0.2 m3
02Single-tube screw feederLX-φ122*1200Feed rate 10~200 kg·h−1
Reduction motor power 1.1 kW
Inverter speed
control
03Rotor classifierZF-15Treatment air volume
300~1200 m3 h−1
Rotor speed 200~1450 rpm
Motor power 2.2 kW
Inverter speed
control
04Cyclone dust collectorφ300
05Bag filter dust collectorHMC-32AFilter area 24 m2
06Centrifugal fan9–19Air volume 300~2200 m3 h−1
Full pressure 6870~5680 Pa
Motor power 11 kW
Damper adjustment
Table 5. Comparison of experimental and simulated values and K.
EXP, Type-ACFD, Type-ARelative
Error (%)
EXP, Type-BCFD, Type-BRelative Error (%)
D2543.540.56.936345.6
D505648.912.748.743.810.1
D7566.55714.3605016.7
K0.650.719.20.60.6813.3
Disclaimer/Publisher’s Note: The statements, opinions and data contained in all publications are solely those of the individual author(s) and contributor(s) and not of MDPI and/or the editor(s). MDPI and/or the editor(s) disclaim responsibility for any injury to people or property resulting from any ideas, methods, instructions or products referred to in the content.

