Article

Enhancing Wastewater Treatment Through Python ANN-Guided Optimization of Photocatalysis with Boron-Doped ZnO Synthesized via Mechanochemical Route

1
Technical Faculty in Bor, University of Belgrade, V.J. 12, 19210 Bor, Serbia
2
Research Institute for Renewable Energies, University Politehnica Timişoara, G. Muzicescu 138, 300501 Timişoara, Romania
*
Author to whom correspondence should be addressed.
Processes 2025, 13(7), 2240; https://doi.org/10.3390/pr13072240
Submission received: 11 June 2025 / Revised: 10 July 2025 / Accepted: 12 July 2025 / Published: 14 July 2025
(This article belongs to the Special Issue Metal Oxides and Their Composites for Photocatalytic Degradation)

Abstract

This study explores the enhanced photocatalytic performance of boron-doped zinc oxide (ZnO) nanoparticles synthesized via a scalable mechanochemical route. Utilizing X-ray diffraction (XRD) and scanning electron microscopy with energy-dispersive spectroscopy (SEM-EDS), the structural and morphological properties of these nanoparticles were assessed. Specifically, nanoparticles with 1 wt%, 2.5 wt%, and 5 wt% boron doping were analyzed after calcination at temperatures of 500 °C, 600 °C, and 700 °C. The obtained results indicate that 1 wt% B-ZnO nanoparticles calcined at 700 °C show superior photocatalytic efficiency of 99.94% methyl orange degradation under UVA light—a significant improvement over undoped ZnO. Furthermore, the study introduces a predictive model using the artificial neural network (ANN) technique, developed in Python, which effectively forecasts photocatalytic performance based on experimental conditions with R2 = 0.9810. This could further enhance wastewater treatment processes, such as heterogeneous photocatalysis, through ANN-guided optimization.

1. Introduction

Water pollution caused by various harmful compounds remains a significant environmental challenge, particularly due to persistent organic pollutants (POPs) and other hazardous contaminants of high toxicity and bio-recalcitrant nature, such as dyes, pesticides, phenolic compounds, pharmaceuticals, agrochemicals, etc. [1,2,3]. Traditional wastewater treatment methods, including physical, chemical, and biological processes, use techniques such as chemical deposition, separation, coagulation, adsorption on activated carbon, chlorination, and ozonation. Chemical methods, like chlorination and ozonization, are relatively slow and often too expensive for widespread use, while physical methods, such as filtration, are not very effective and mostly shift pollutants from one phase to another instead of fully removing them [4,5]. As a result, these traditional approaches have limited success in treating industrial wastewater.
In response to these limitations, advanced oxidation processes (AOPs) have emerged as a highly efficient alternative for wastewater treatment. AOPs employ hydroxyl radicals (OH), powerful and non-selective oxidants capable of breaking down complex molecular structures. Among these AOPs, heterogeneous photocatalytic degradation has emerged as a promising and sustainable approach due to its ability to mineralize complex organic compounds into less harmful byproducts. This process, characterized by the direct degradation of pollutants within the photocatalyst matrix, operates under ambient conditions and enables the complete mineralization of organic compounds into water and carbon dioxide. Its most significant advantage lies in leveraging renewable solar energy, making it a promising solution for sustainable wastewater remediation [5,6].
Zinc oxide (ZnO) nanoparticles have garnered significant attention in the realm of nanoscience and nanotechnology, particularly due to their unique properties and wide range of applications [5,7,8]. Its dynamic and adaptable characteristics enable extensive functionalization, leading to improved photocatalytic performance. [5]. As a semiconductor with a wide bandgap, ZnO exhibits excellent photocatalytic activity, making it a prime candidate for environmental remediation and energy applications [9]. The photocatalytic efficiency of ZnO can be further enhanced through doping with various elements, which alter its electronic and structural properties. ZnO nanoparticles, either used alone or in nanocomposite forms, are effective in degrading POPs into carbon dioxide and water. This growing interest in ZnO nanoparticles is well-documented in various studies, including those by [5,7,8,10,11,12]. Conventional synthesis methods of ZnO nanoparticles often suffer from drawbacks such as complex procedures, high energy consumption, and the use of hazardous chemicals [13].
To overcome these challenges, the mechanochemical route has emerged as an innovative and eco-friendly approach for the synthesis of ZnO nanoparticles. The mechanochemical method offers distinct advantages over traditional methods, including simplicity, scalability, cost-effectiveness, and the ability to produce nanoparticles with enhanced properties [14,15,16,17]. Mechanochemical synthesis stands out not only for its operational simplicity and scalability but also possesses a capacity for morphological uniformity and stoichiometric tunability, positioning it as a powerful tool for the tailored design of functional materials [14,18]. In recent years, awareness of mechanochemistry’s environmental advantages has grown, as it enables solvent-free reactions at near-room temperature that typically require elevated thermal conditions [14]. This method offers significant advantages by enabling reactions to proceed under milder conditions, minimizing the use and formation of hazardous materials, and limiting the energy requirements of the process [19]. Mechanical forces distort molecular structures and introduce disorder into crystal lattices, effectively lowering activation energy barriers and facilitating chemical transformations at reduced temperatures and shorter durations. Additionally, the localized conversion of mechanical energy into heat at contact points between particles enhances molecular mobility and can promote bond disruption or phase changes. These synergistic effects make this method a highly efficient and energy-saving strategy for material synthesis [20]. Additionally, mechanochemical synthetic approaches are considered highly reproducible and easily scaled up [16].
Boron (B) doping in ZnO nanoparticles introduces enhancements to their photocatalytic capabilities. As an electron acceptor, boron can change the electronic structure of ZnO, which can lead to improved photocatalytic performance. This enhancement is attributed to the alteration in bandgap and increased charge carrier separation efficiency [21]. Wang et al. (2017) demonstrated that B-doping in ZnO nanoparticles enhances photocatalytic activity by promoting the separation of photo-generated electron–hole pairs [22]. This enhancement is crucial for improving the efficiency of photocatalytic processes.
Furthermore, Wang et al. (2012) found that B-doping in TiO2-based nanomaterials has led to enhanced photocatalytic activities up to 50% greater than commercial Degussa P25 under visible light [23]. According to the literature, boron-doped ZnO is reported to have improved photocatalytic activity but also to influence other properties, mainly optical absorption, electrical conductivity, and stability [24,25].
Boron-doped ZnO nanoparticles have shown promise in various fields, including optoelectronics, spintronics, and biosensing. For instance, the modified electronic properties of B-doped ZnO can be exploited in the development of efficient optoelectronic devices. Similarly, their enhanced photocatalytic activity can be utilized in environmental applications, such as the degradation of organic pollutants and water purification [26]. Qi et al. (2017) highlighted that doping ZnO with metal/nonmetal atoms can not only enhance its photocatalytic activity but also improve its antibacterial properties for environmental applications [27]. This opens the possibility for B-doped ZnO nanoparticles in areas such as water treatment and surface sterilization. Additionally, boron doping has been associated with improvements in the electrical conductivity and optical properties of ZnO, as boron atoms act as electron donors, leading to a decrease in resistivity and an increase in band gap energy due to the Burstein–Moss shift [28]. These changes are important for applications such as transparent conductive oxides in photovoltaic cells, where the electrical and optical properties of the material are critical [29].
In this study, B-doped ZnO nanoparticles were synthesized with varying concentrations of boron (1 wt%, 2.5 wt%, and 5 wt%) and calcined at different temperatures (500 °C, 600 °C, and 700 °C), with the focus on applicability in the UV-A spectrum.
This research advances the fundamental understanding of doping-induced modifications in ZnO and also integrates machine learning through the development of a unique predictive ANN model, implemented entirely in Python. The ANN accurately forecasts photocatalytic performance based on experimental parameters, offering a transformative tool for material design and process optimization, considering parameters necessary for photocatalytic experiments in the UV-A spectrum. By tailoring parameters relevant to UV-A spectrum photocatalysis, this study bridges the gap between experimental research and computational modeling.

2. Materials and Methods

2.1. Materials and Reagents

Zinc acetate dihydrate (Zn(CH3COO)2∙2H2O) and oxalic acid dihydrate ((COOH)2∙H2O)—the analytical-grade reagents—were used in the synthesis of the nanoparticle samples. For doping purposes, boric acid (H3BO3) was used. All reagents were obtained from Sigma-Aldrich, Taufkirchen, Germany.
Undoped and doped ZnO nanoparticles were synthesized by the mechanochemical route with a calcination step. To prepare undoped and doped ZnO NP, zinc acetate dihydrate (5 g) and oxalic acid dihydrate (5.7428 g) were mixed and ground in an agate mortar for 10 min to obtain a paste of zinc oxalate dihydrate and acetic acid. Besides that, for the boron-doped ZnO NP, an adequate amount of orthoboric acid was added to the paste, and the grinding process was continued for a further 10 min to obtain the precursor. The undoped and doped ZnO NPs were obtained by calcination at temperatures of 500, 600, and 700 °C for 3 h.

2.2. Photocatalysis Experiments

In a typical photocatalysis experiment, 100 mg of prepared nanoparticles were added to 30 mL of a methyl-orange stock solution with an initial concentration of 5 ppm. The mixture was first stirred on a magnetic stirrer (300 rpm) in the dark for 60 min to achieve adsorption–desorption equilibrium. After this step, the solution was withdrawn and centrifuged at 3000 rpm for 30 min to separate the nanoparticles.
The photocatalytic activity was then evaluated by irradiating the remaining mixture under a UVA light source (GL-UV100W-395, λ = 395 nm; 100 W; Glostars, Shenzhen, China) for a specified period. To determine the photocatalytic degradation efficiency, the concentration of a model pollutant (methyl orange) in the samples was measured using a UV/VIS spectrometer at a wavelength of 484 nm.

2.3. Characterization Techniques

X-ray diffraction (XRD) patterns of synthesized nanoparticles were obtained via an X’Pert3 Powder X-ray diffractometer with Cu-Kα radiation (λ = 0.l5406 nm) for 2θ = 20–80°. Scanning electron microscopy (SEM) was performed to observe the morphology of the samples. SEM photographs were taken via a QUANTA FEG 250 SEM microscope (Thermo Fisher Scientific, Hillsboro, OR, USA). The elemental analysis of nanoparticles was carried out using energy-dispersive spectroscopy (EDX). The optical absorbance measurements of these samples were taken by a UV/VIS spectrophotometer, Beckman DU-65 (Beckman Coulter, Inc., Brea, CA, USA).

3. Results and Discussion

3.1. X-Ray Diffraction Analysis

The X-ray diffraction (XRD) pattern presented in Figure 1 shows the crystalline structure of 1 wt% boron-doped zinc oxide compared to standard ZnO, as indicated by the Joint Committee on Powder Diffraction Standards (JCPDS). The pattern suggests that the incorporation of boron has influenced the crystalline structure of ZnO.
A slight shift in the first three distinctive diffraction peaks was observed for the doped sample. The corresponding angle values are 31.76°, 34.42°, and 36.25°, associated with the (100), (002), and (101) planes, respectively. In comparison, the undoped sample exhibited diffraction peak angles of 31.84°, 34.48°, and 36.32°. Doping of ZnO with boron can lead to shifts in peak positions towards the lower angle values, indicating an increase in lattice constants due to the incorporation of boron atoms into the ZnO lattice [30].
All diffraction patterns observed in the samples correspond to the wurtzite hexagonal structure of ZnO, characterized by the space group P63mc. These patterns align with the (100), (002), (101), (102), (110), (103), and (112) planes, as referenced in the Joint Committee on Powder Diffraction Standards (JCPDS) card file 36–1451 [15,31,32]. A strong peak observed in nanoparticles at 35.82° corresponds to the ZnO (101) phase. Based on the distinct peaks detected, the hexagonal wurtzite structure of ZnO without any secondary phases can be confirmed [30,33,34].
The incorporation of boron into ZnO films has an evident and previously established impact on their crystallinity, without altering the crystalline structure. The absence of impurity phases in synthesized samples implies that B ions predominantly occupy positions within the ZnO lattice, which is in accordance with the minor shift toward lower angles upon B-doping. This shift can be attributed to the substitution of Zn ions with B ions, suggesting that the doping process was successful [35]. The crystal quality decreases with the addition of boron due to lattice defects and the formation of nucleation centers associated with lattice distortion [30]. The degree of crystal lattice distortion was calculated using the following Equation (1) [30]:
R = 2 a ( 2 / 3 ) 1 / 2 c
The obtained values for R are presented in Table 1 and reveal that the crystal lattice distortion degree has increased with B-doping. The distortion of the ZnO lattice was caused by differences in ionic radii of the B3+ ions (0.23 Å), which substitute Zn2+ ions (0.74 Å) in the ZnO lattice [35,36,37,38]. In addition, boron acts as a nucleation center in the ZnO crystal structure, which leads to a reduction in crystallite size.
The wurtzite structure ZnO lattice constants a and c calculations are implemented through Bragg’s law [39]:
n λ = 2 dsin θ
In this equation, n is the diffraction order, λ is the wavelength of the X-ray, hkl are Miller indices, and d is the space between planes [39]. The shift of the (101) Bragg reflection toward lower angles in the XRD patterns of doped ZnO, compared to pure ZnO, indicates lattice expansion typically associated with the successful incorporation of nonmetal dopants into the ZnO crystal structure [40].
The lattice parameters a and c were determined using Equations (3) and (4) [34,41,42,43]:
a = λ 3 sin θ
c = λ sin θ
where λ stands for the wavelength of X-rays (0.1540 nm) and θ represents the Bragg angle. Lattice constants fundamentally offer an approximate understanding of the spatial arrangement of atoms within a molecule by defining the geometry of its unit cell. In hexagonal crystal structures, the parameters a and b represent the dimensions of the hexagonal face and are typically equal due to symmetry, while c denotes the height of the unit cell along the vertical axis. The c/a ratio for the stoichiometric wurtzite structure is 1.633. The results in Table 1 show that the c/a ratio for undoped and B-doped ZnO is 1.60, which is slightly lower. The lower value of the c/a ratio is due to the presence of oxygen vacancies and defects in the crystal structure [44]. The results presented in Table 1 show that the lattice parameters a and c increase due to the distortion of the crystal structure of ZnO by B-doping.
The size of the nanoparticles was derived from the full width at half maximum (FWHM) of the most intense crystal peaks, via the Debye–Scherrer Equation (5) [45]:
D = K λ β hkl cos θ
where D is the diameter of the particles, λ is the wavelength of X-rays (0.1540 nm), β is the full width at half maximum of the peak, θ is the Bragg angle, and K takes the value of 0.9 [45,46].
Crystallite size values shown in Table 1 decrease after B-doping due to the incorporation of B ions into the ZnO crystal structure [28,38,47,48,49]. Also, the decrease in crystallite size suggests the formation of B-O-Zn bonds due to segregation of the boron, resulting in the inhibition of ZnO crystal growth [49,50]. The decreased crystallite size in B-doped ZnO suggests more grain boundaries and potential active sites for photocatalytic reactions [51].
Interplanar spacing dhkl was determined using Miller indices ‘h’, ‘k’, and ‘l’ and lattice parameters a and c, according to Equation (6) [52]:
1 d hkl 2 = 4 3 h 2 + hk + k 2 a 2 + l 2 c 2
According to the results shown in Table 1, the interplanar spacing values increase after B-doping due to the distortion of the hexagonal structure of ZnO. The distortion is due to the change in bond lengths between the ions in the crystalline structure, which leads to an expansion of strain in the structure [53].
Equation (7) represents the formula for calculating the volume of a crystal’s unit cell, V, using lattice parameters a and c [54]:
V = 3 a 2 c 2
The values for V indicate that the volume of the unit cell increases with the addition of boron ions. The results shown in Table 1 may seem unexpected since the addition of species with a smaller ionic radius to the host crystal structure usually leads to a decrease in the volume of the unit cell. However, the influence of the dopant on the unit cell volume is more complex, and the unit cell volume does not depend only on the ionic radius of the dopant. The smaller dopant can form vacancies in the lattice structure due to the different size or charge in relation to the host ion in the crystal structure. In addition, the smaller dopant can lead to a deformation of the lattice, which increases the volume of the unit cell. The different charge of the dopant can cause a change in the electronic structure of the material, which affects the binding forces between the ions in the lattice and leads to an increase in the volume of the unit cell, leading to enhancements in photocatalytic activity [55,56].
Equation (8) provides the expression for calculating the Zn–O bond length L, which includes the lattice parameters a and c and the position parameter u, which represents a measure of the amount of displacement of each atom with respect to the next atom along the c-axis [49,57].
L = a 2 3 + 1 2 u 2 c 2
The positional parameter for the hexagonal lattice was determined according to Equation (9) [49]:
u = a 2 3 c 2 + 0.25
The calculation of the Zn-O bond length is a suitable method for checking the presence of dopants. In the presence of a dopant, the bond length varies in comparison to the undoped crystal structure, which can be used to check the doping success (Table 1).
The microstrain values were calculated using the following Equation [49,58,59]:
ε = β cos θ 4
The microstrain is derived from the breadth of diffraction lines, indicating strains within the crystal lattice due to crystal imperfection and distortion [49,58,59]. Dopants can change the structure, morphology, and particle size and accordingly influence the occurrence of imperfections in the crystal structure, which leads to a change in the microstrain values [60]. The observed increase in microstrain (Table 1) may result from decreased crystallite size with the addition of boron ions [41]. The increase in microstrain values also indicates the formation of defects in the ZnO lattice, such as vacancies or interstitial sites [60]. The literature supports that doping can induce such strain due to lattice mismatch and potential alterations in bond lengths [56]. Also, the difference in charge leads to a change in the bond lengths in the ZnO lattice, which leads to an increase in microstrain.
To calculate the stacking fault α*, Equation (11) was used [41,45]:
α * = 2 π 2 45 3 tan θ 1 2 β hkl
The stacking fault value increases after B-doping, according to the results presented in Table 1, showing that in the presence of the dopant crystallinity of the sample decreases [61].
The size of crystal dislocations δ was determined according to Equation (12) [49]:
δ = 1 D 2
These dislocations are crucial for understanding the mechanical properties of materials at the nano-level [49]. Dislocation density provides insight into the crystallinity of the material. Higher dislocation density values, which are presented in Table 1, were noticed in the doped sample, suggesting a greater number of lattice imperfections or dislocations per unit volume, which typically means lower crystallinity. As the crystallite size decreases, dislocation density tends to increase. This correlation is crucial in nanomaterials, as reducing crystallite size typically introduces more lattice defects, impacting material properties [43,49,62,63]. These findings are in agreement with the observation discussed before.
The atomic packing factor (APF), the parameter that reflects the efficiency of atomic packing within the crystal cell, for hexagonal structures, was calculated according to Equation (13) [64]:
APF = 2 π a 3 3 c
According to the obtained results, the APF of the doped sample is slightly higher than the undoped ZnO, which is shown in Table 1. This might occur due to size differences in nanocrystal samples. Also, an increase in the APF values indicates that B3+ ions were incorporated in the ZnO lattice [64].
The XRD analysis illustrates that boron doping has surely affected the crystallographic structure of ZnO nanoparticles. The modifications in the structural parameters can have significant effects on the material’s photocatalytic properties. These changes are anticipated to enhance photocatalytic performance, which has been attributed to improved light absorption and charge carrier dynamics, as supported by studies that have demonstrated that doping can improve the photocatalytic efficiency of ZnO [33,56].

3.2. SEM/EDX Analysis

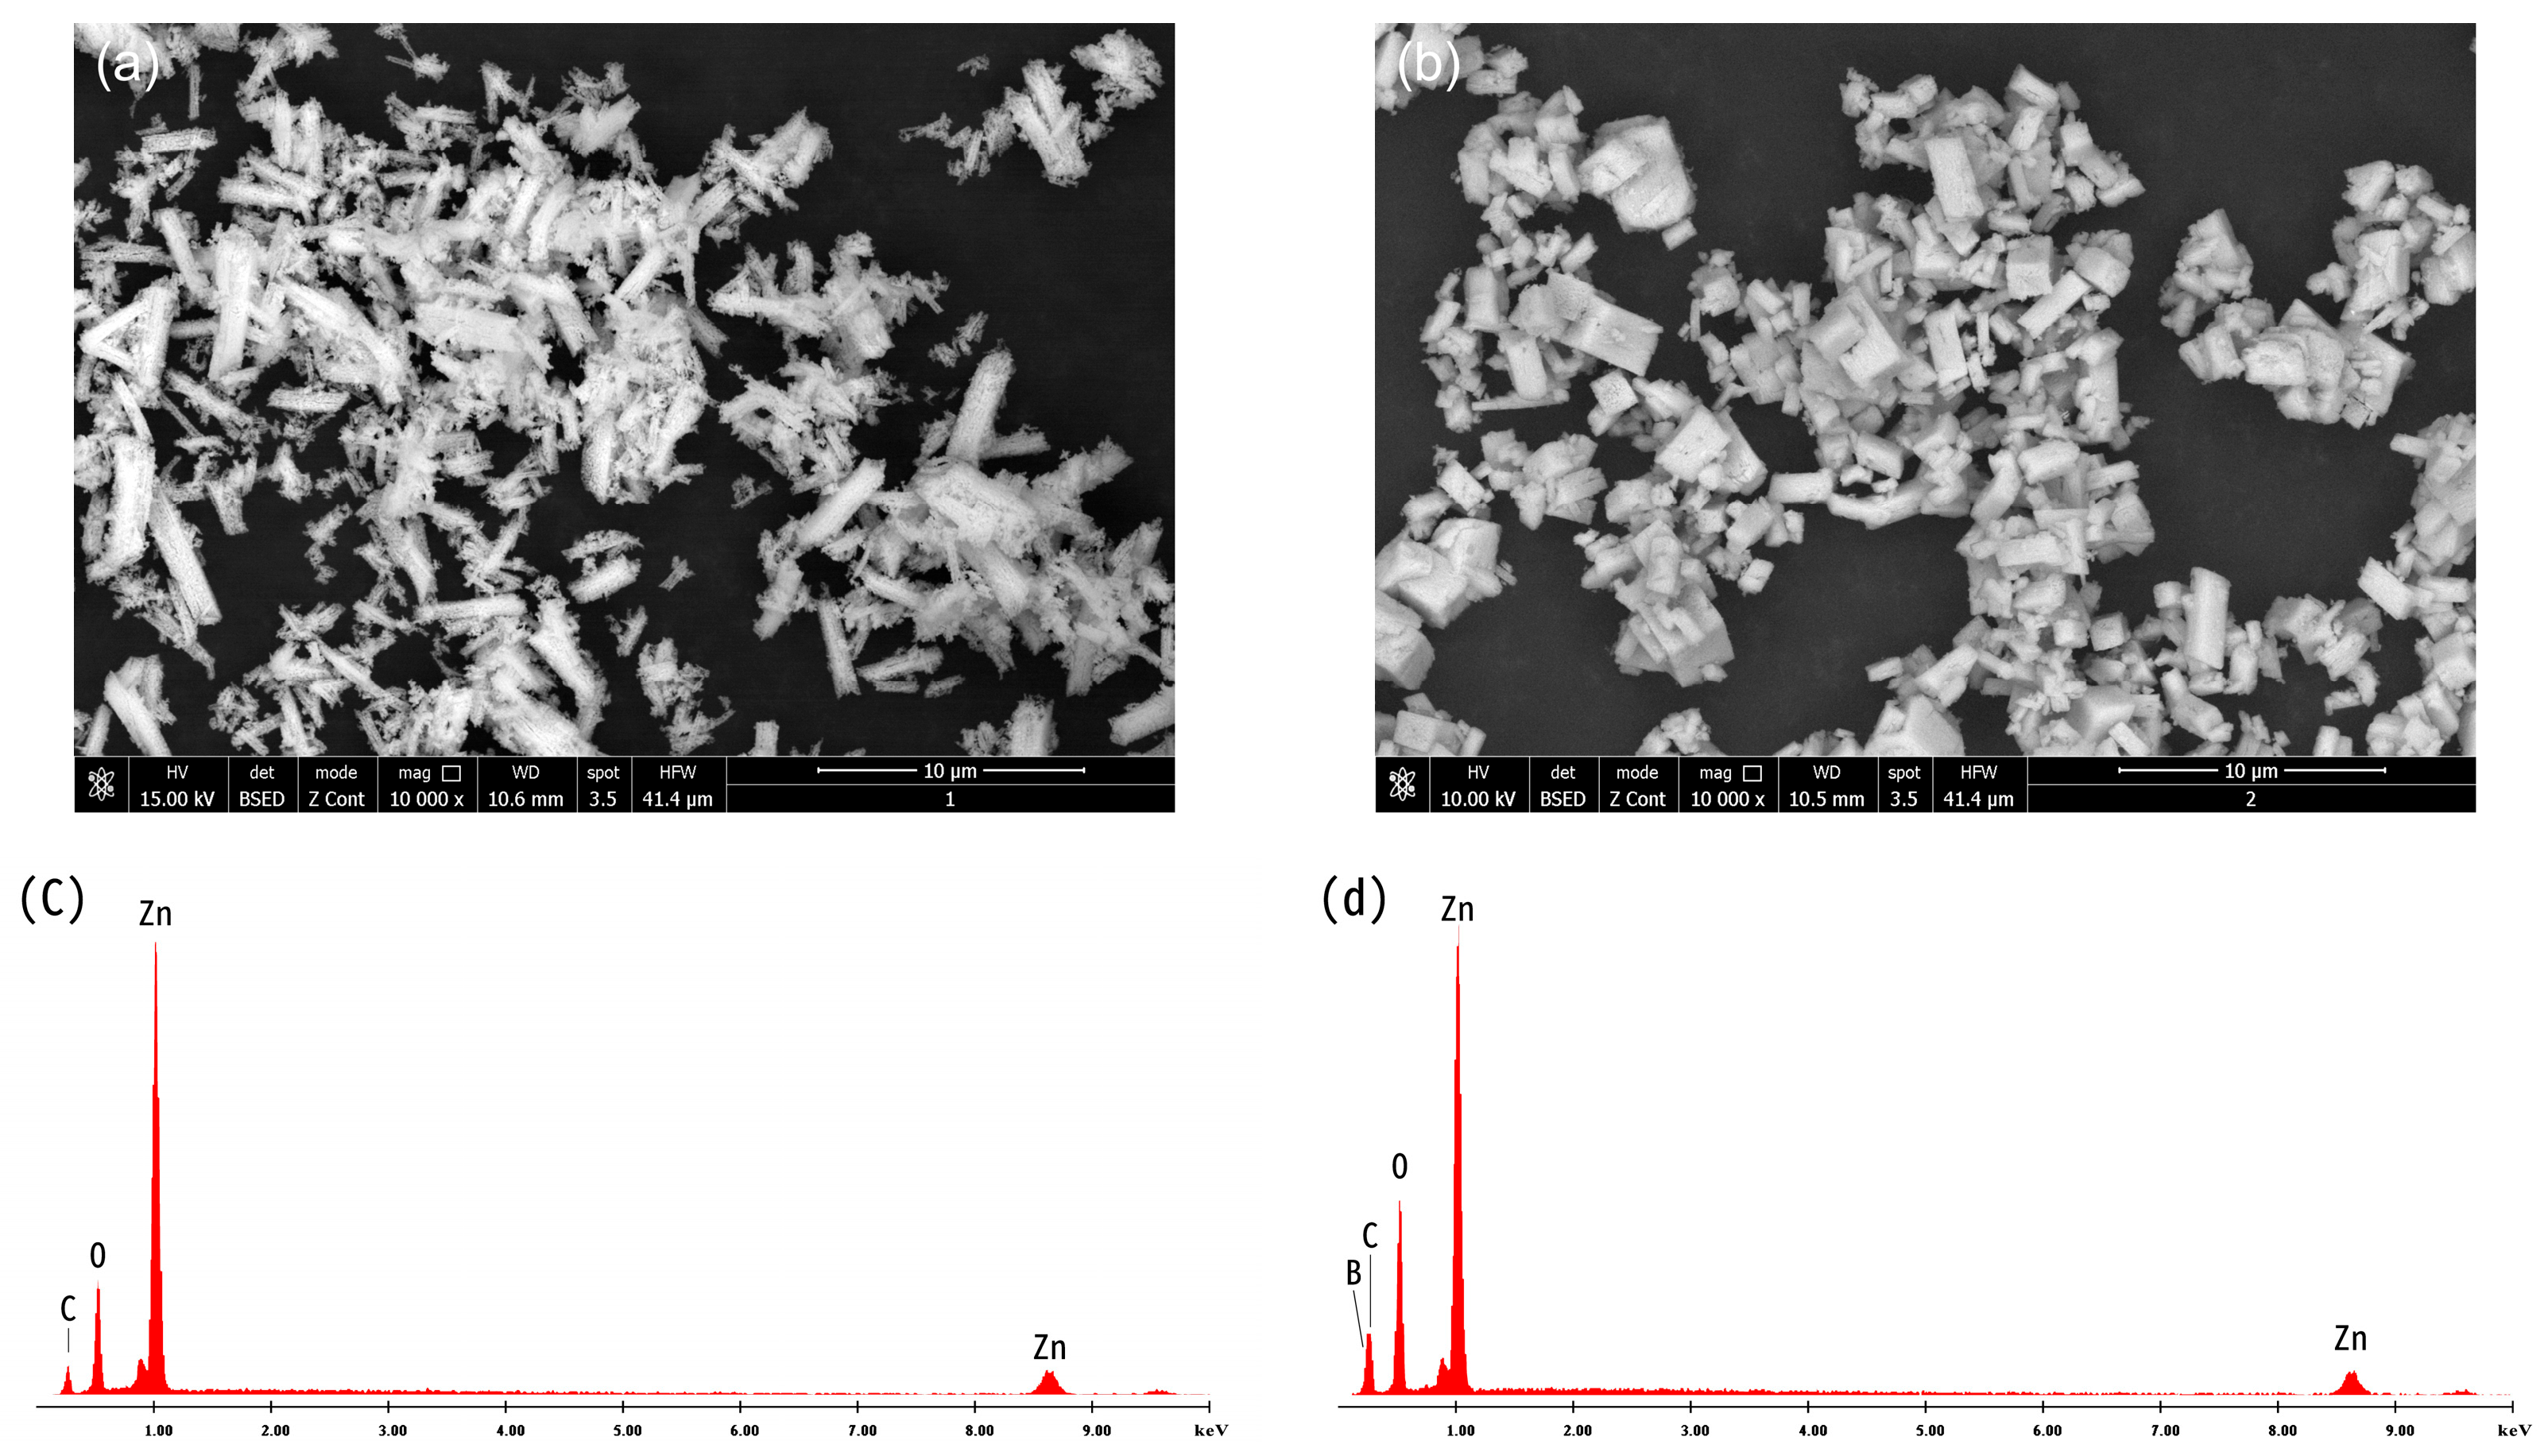
Building on the X-ray diffraction analysis previously discussed, these scanning electron microscopy (SEM) images further elucidate the morphological characteristics of boron-doped zinc oxide. SEM images and EDX spectra of pure and boron-doped nanoparticles are shown in Figure 2.
Figure 2a showcases a pure ZnO crystal morphology. The shape and size can be attributed to the growth conditions and boron concentration during the synthesis process. The presence of boron has been reported to affect the surface morphology of ZnO nanostructures, which can alter the optical and electronic properties of the material [30,65]. Figure 2b presents a look at the nanorod-shaped boron-doped ZnO sample, indicating a uniform growth direction and aspect ratio [33,66]. The SEM analysis aligns with the observed XRD results, confirming that boron doping has indeed modified the nanostructure of ZnO due to enhanced electron mobility and decreased electron–hole recombination [35].
The EDX analysis (Figure 2c,d) confirms the presence of Zn and O in both ZnO samples, as well as the presence of boron in the boron-doped sample. It is also confirmed that no other foreign elements were present in the synthesized samples.

3.3. Degradation Efficiency and Kinetics

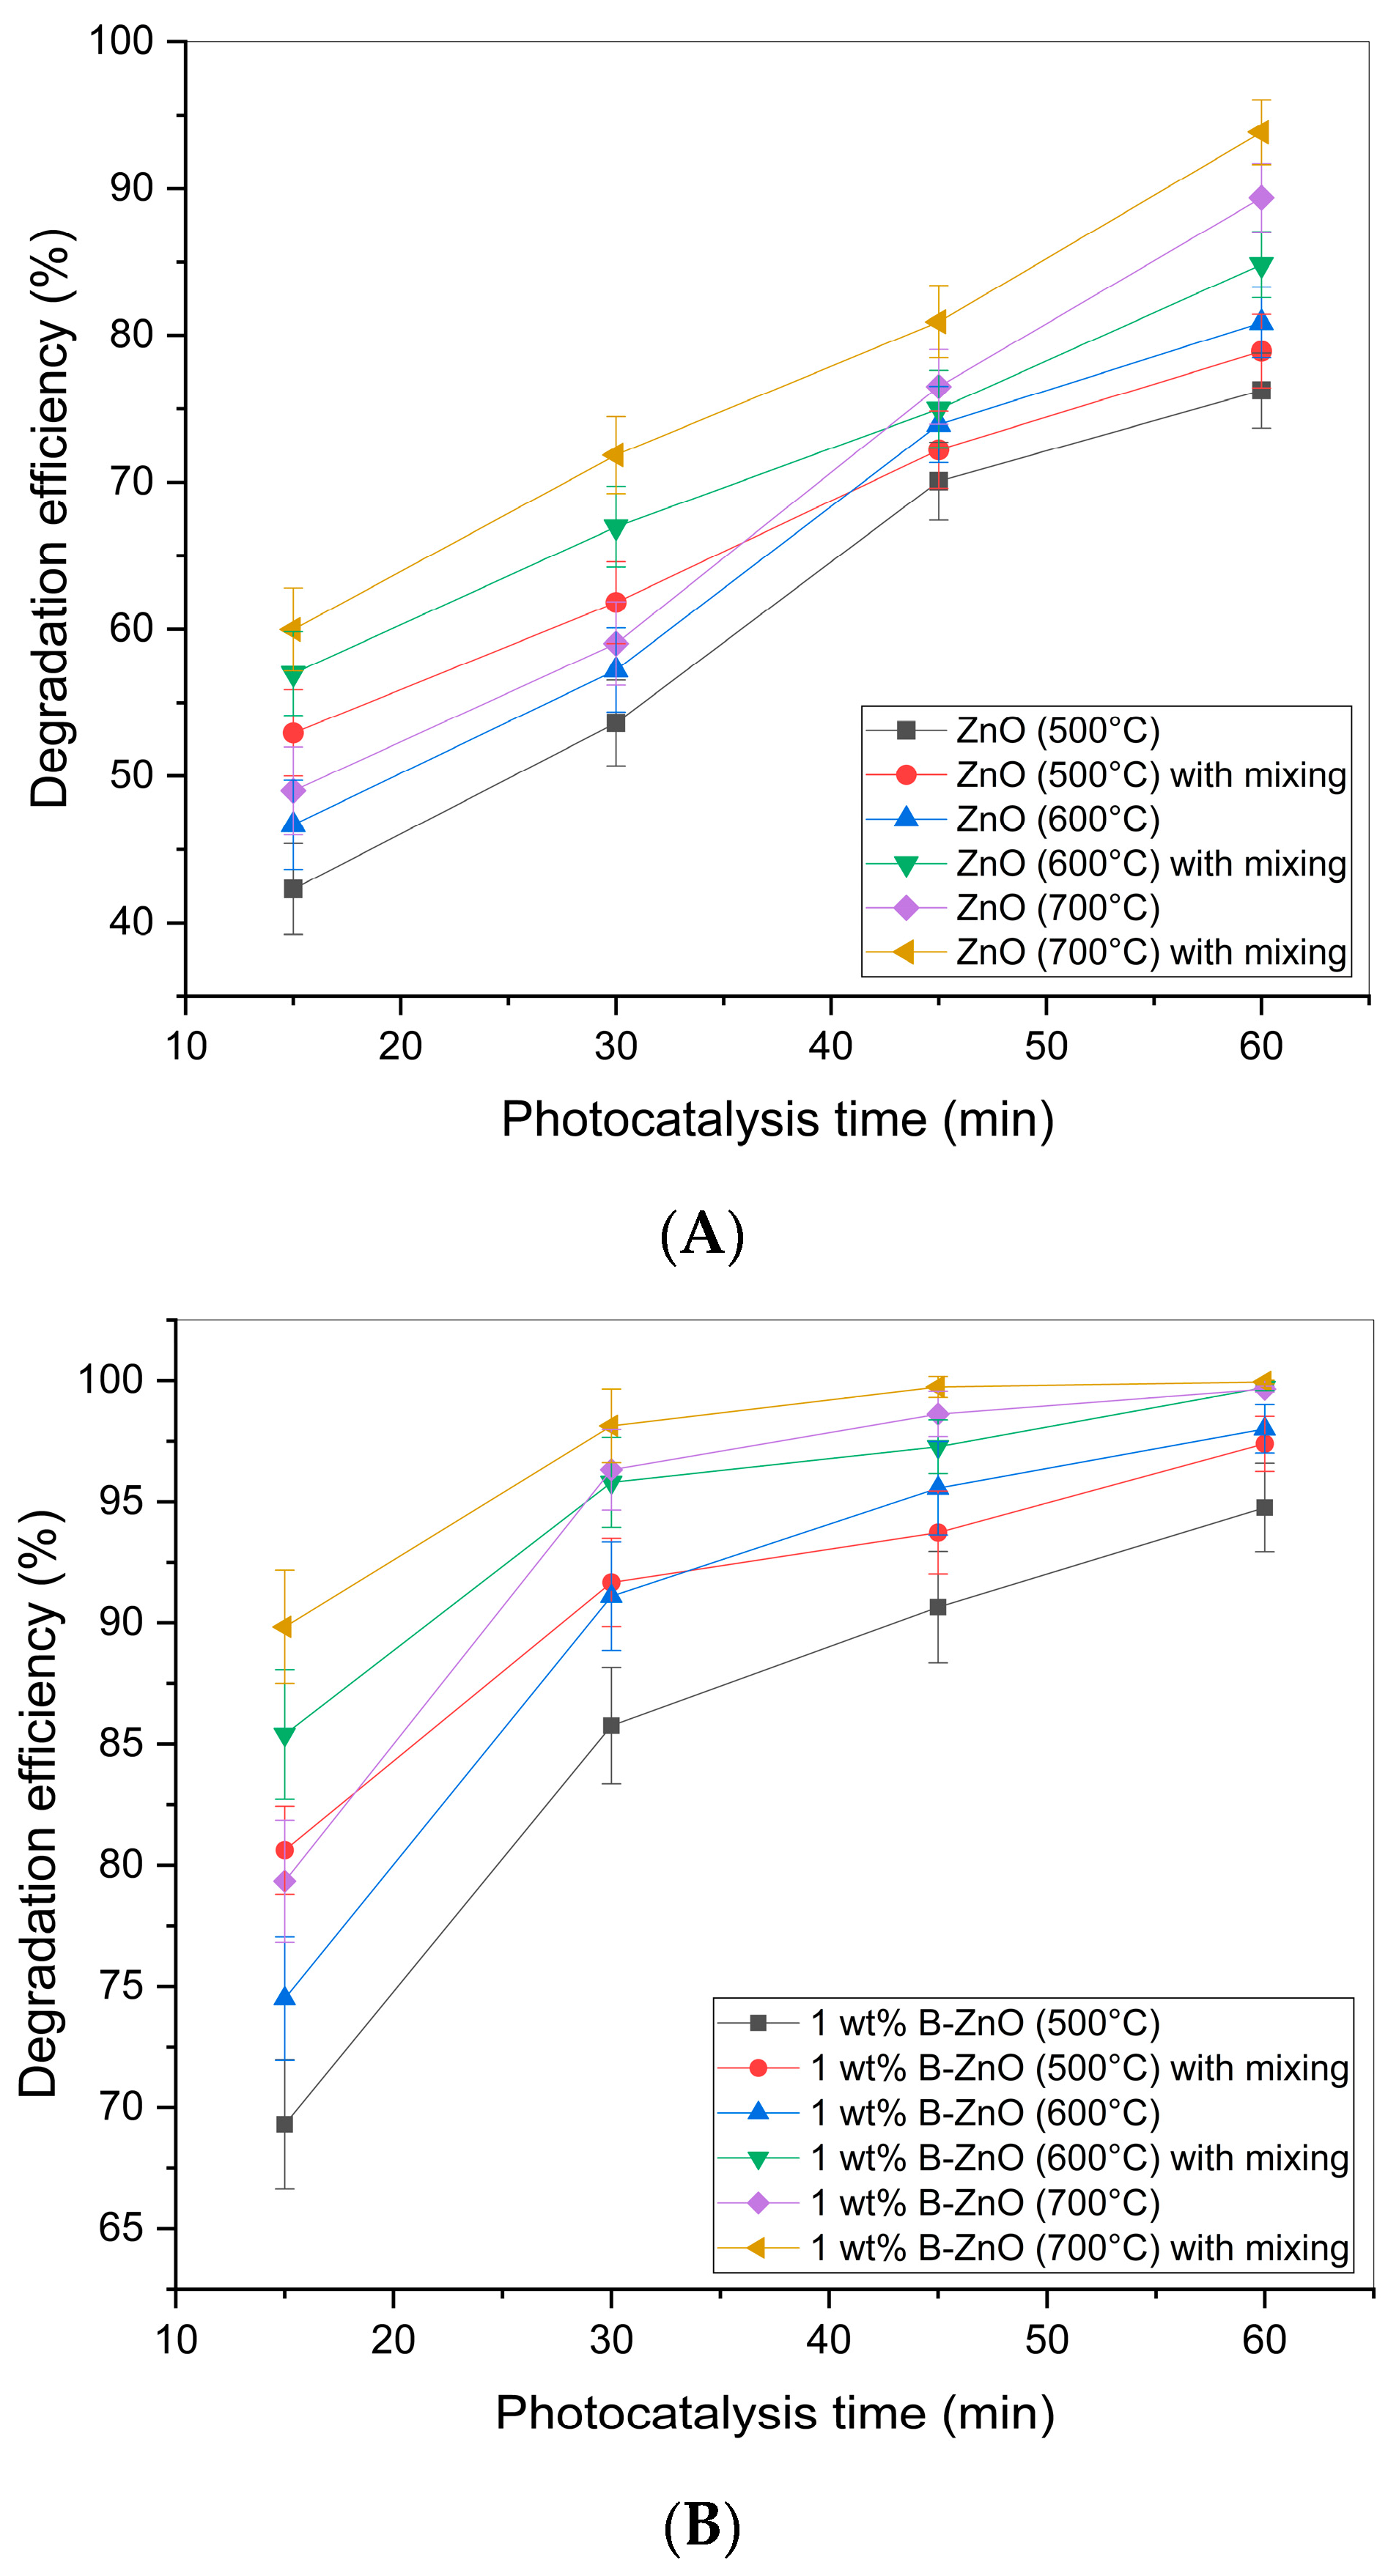
The photocatalytic activity of ZnO nanoparticles depends on many different parameters such as morphology and particle size of the ZnO, calcination temperature, photocatalytic time, amount of photocatalysts, amount of the compound being degraded (methyl-orange), light wavelength, light intensity, etc. [67,68]. Photocatalytic activity of undoped and boron-doped ZnO nanoparticles, at various temperatures, for the degradation of methyl-orange at various times of the photocatalysis, is shown in Figure 3.
It is apparent that the photocatalytic efficiency for the undoped and boron-doped ZnO increases with the calcination temperature and the duration of the photocatalysis. Specifically, ZnO samples calcined at 500 °C exhibit a lower degradation efficiency compared to those calcined at higher temperatures of 600 °C and 700 °C (Figure 3A). Considering the light source in the experiments being near visible in terms of wavelength, it has been previously established that the bandgap value of nanomaterials used would determine their photocatalytic activity. The experiments that were conducted without mixing in the dark resulted in lower efficiency compared to experiments with samples treated at lower temperatures and a step that includes mixing in the dark. This is related to adsorption equilibrium achieved by this step, prior to the UV-A exposure [69].
The superior photocatalytic efficiency observed in the undoped and the boron-doped nanoparticles calcinated at 700 °C under UVA light at 395 nm, shown in Figure 3A,B, can be attributed to the interplay between calcination temperature, bandgap energy (Eg), and crystallite size. Studies have reported a decreasing trend in bandgap value with increasing calcination temperature (as exemplified by values of 3.15 eV, 3.09 eV, and 3.05 eV at 400 °C, 500 °C, and 600 °C, respectively), which is associated with an increase in crystallite size [70]. Hence, a reduction in bandgap value at higher calcination temperatures likely facilitates enhanced photocatalytic activity by shifting the material’s photoresponse closer to the visible light (VIS) region. It is further assumed that material calcined at 700 °C exhibits the most favorable characteristics, as the combination of an optimized bandgap and increased crystallite size improves light absorption, charge carrier dynamics, and the overall degradation efficiency of methyl orange. With a sample with the boron content, synthesized at 700 °C, 99.94% efficiency was achieved (Figure 3B), possibly due to an optimal balance between crystallite size and surface defects. Boron as a dopant is expected to improve the charge carriers’ separation, reducing recombination and enabling greater generation of reactive oxidative species, while reducing the grain size and having more grain boundaries present inside a unitary area [66]. Complete methyl-orange degradation in the presence of this sample was achieved after 60 min of photocatalysis time (whereas with the undoped nanoparticles, a 93.80% degradation efficiency was reached). This observation is consistent with studies that have reported the temperature-dependent enhancement of photocatalytic activity in metal oxide nanoparticles. The increased photocatalytic activity at higher calcination temperatures could be due to improved charge carrier separation and reduced recombination rates, leading to more effective pollutant degradation [10,71].
Lower efficiency is confirmed for samples with higher boron content, such as 5% B-ZnO, as introducing dopants above the optimal level would therefore decrease the activity, which originates from increased charge carrier recombination rate [72,73]. Specifically, the recombination of the photogenerated electron–hole pairs can become easier with a high doping content, as it causes the space charge layer to become very narrow. Hence, the penetration depth of light into the catalyst greatly exceeds the space charge layer [74].
The photocatalysis time also plays a critical role, as extended exposure to the photocatalyst leads to higher degradation efficiencies. This trend is consistent across all calcination temperatures, which suggests that the photocatalytic process is time-dependent, likely due to the gradual adsorption and breakdown of the model compound on the surface of the photocatalyst [35].
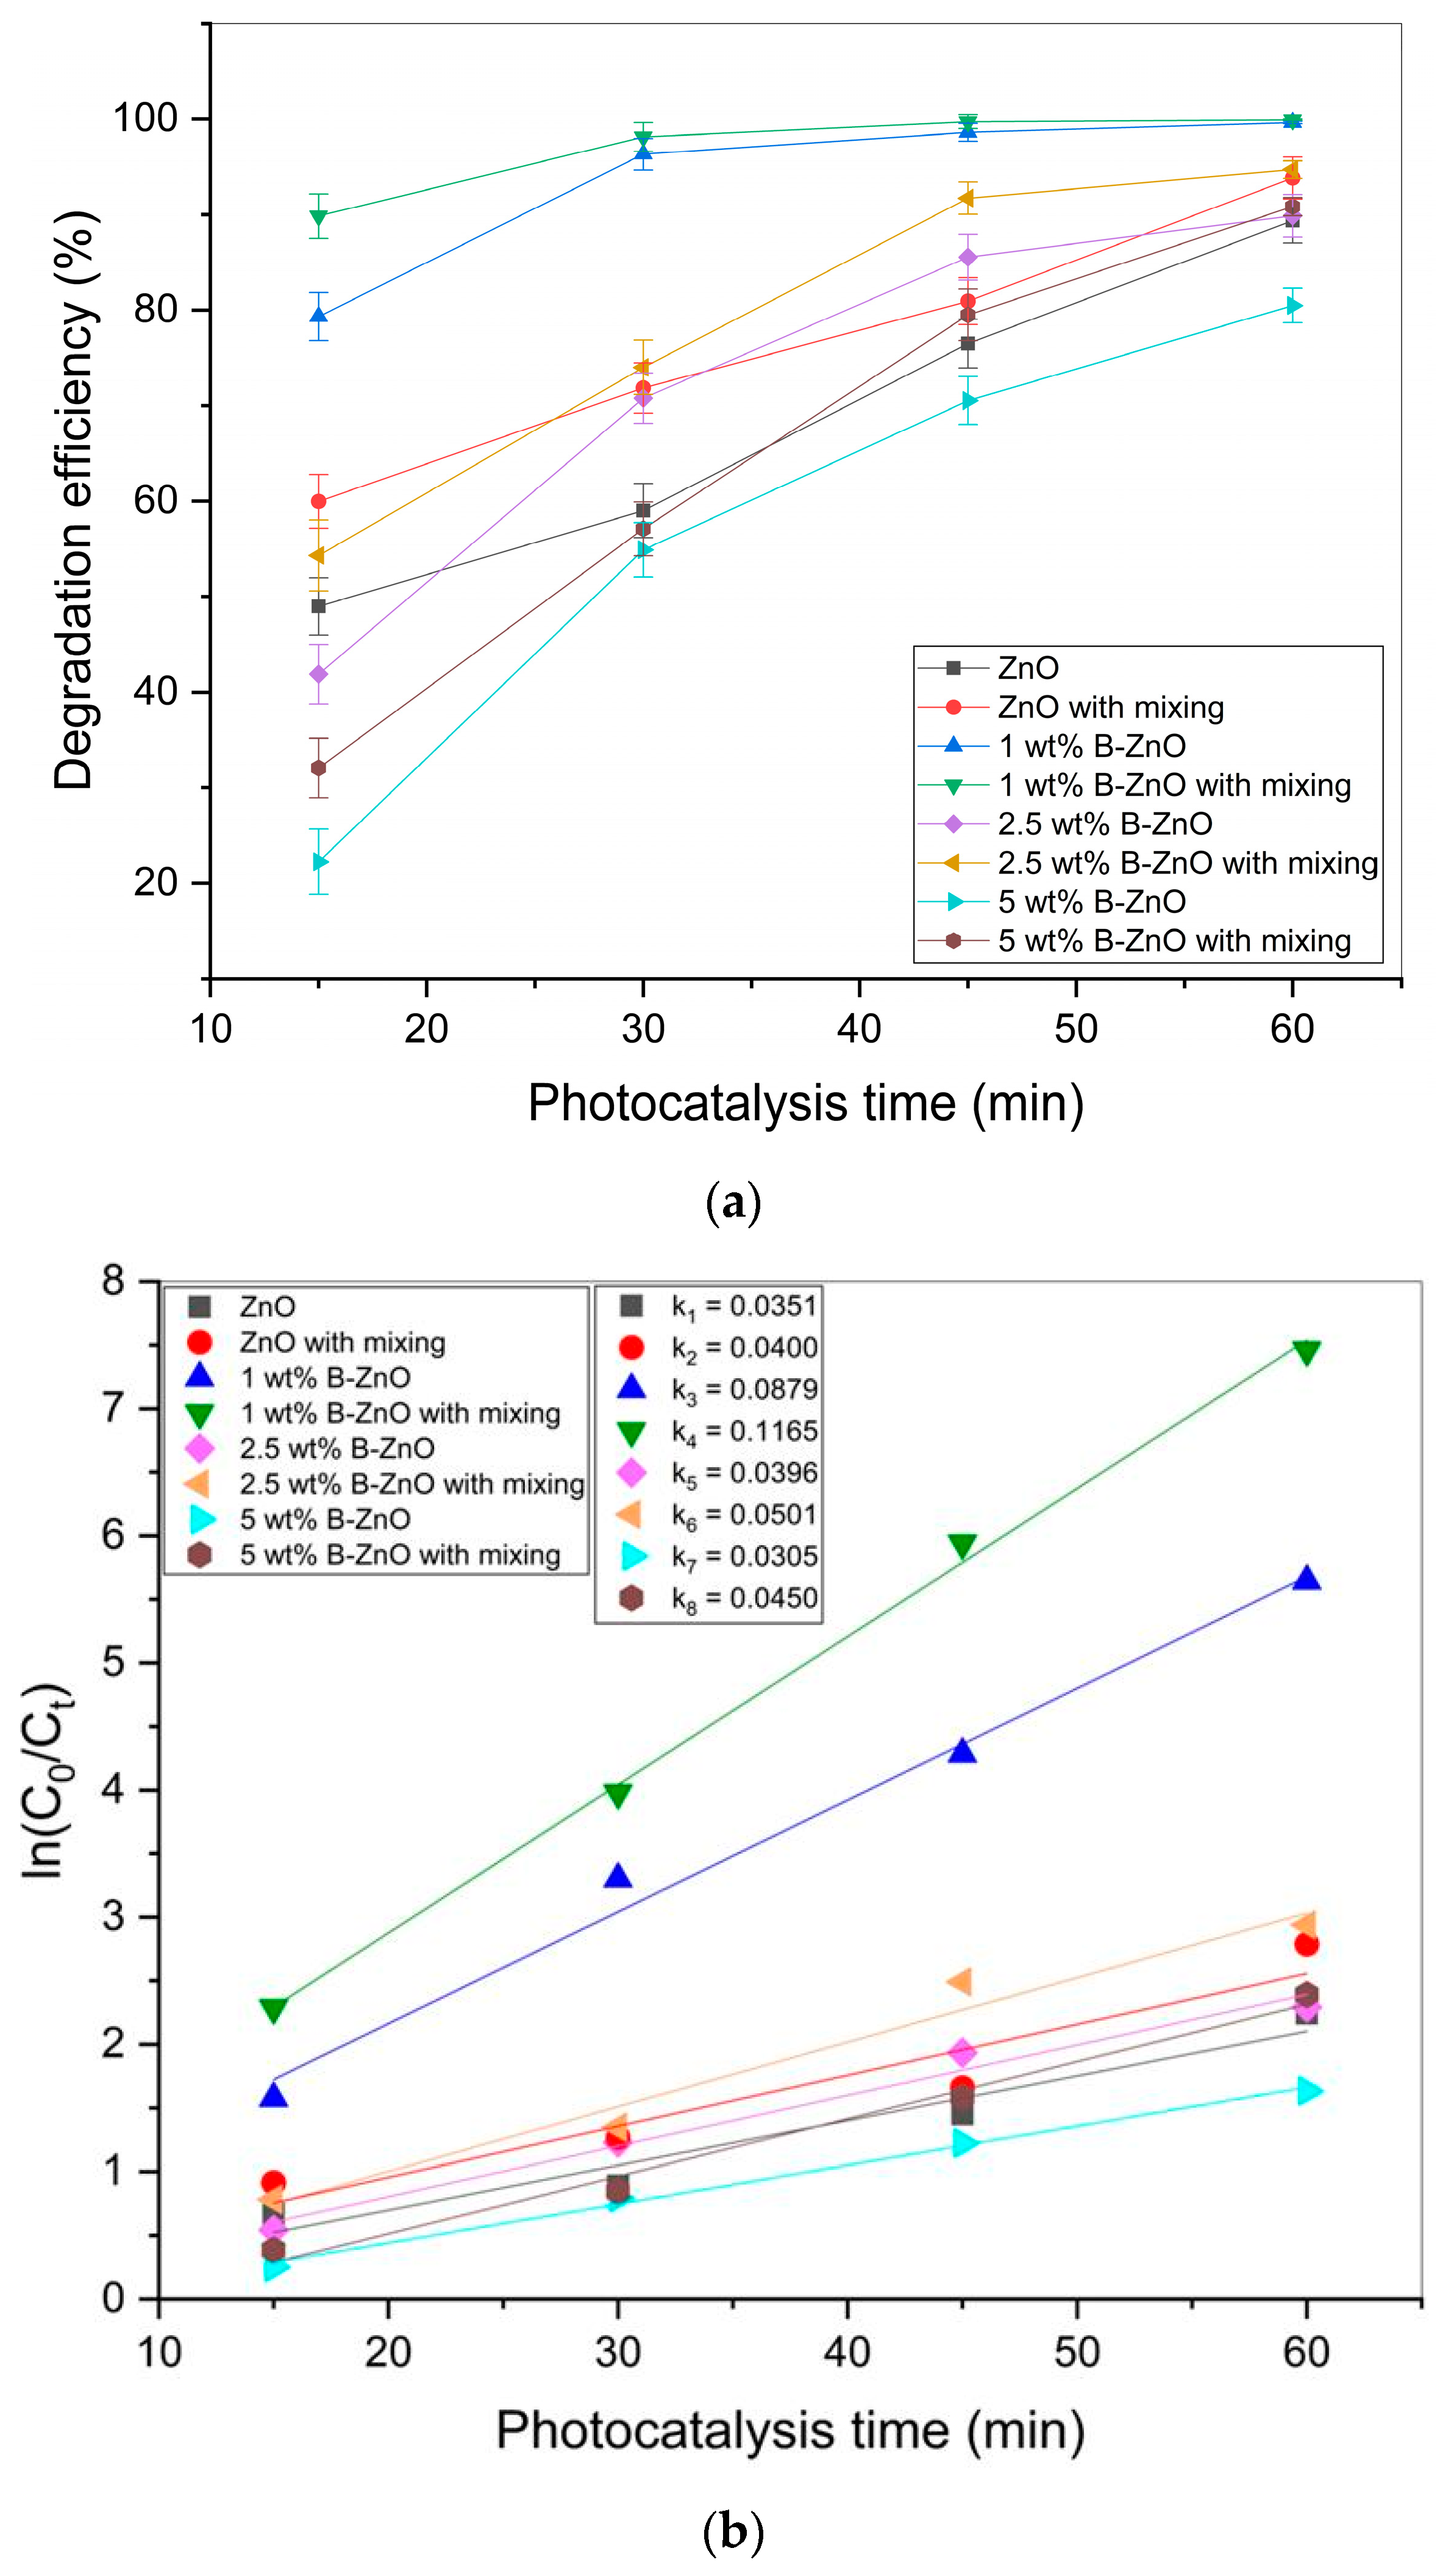
Figure 4a illustrates the impact of boron amount for doping on the photocatalytic efficiency of zinc oxide (ZnO) nanoparticles calcined at 700 °C. The photocatalytic action of undoped and doped ZnO nanoparticles was tested at various photocatalytic experiment times under UVA light irradiation using methyl orange as a test pollutant.
Undoped ZnO nanoparticles have shown a lower efficiency, starting at 48.89% and reaching approximately 89.36% by the end of the period. In contrast, the 1 wt% B-ZnO, particularly with previous mixing in the dark, reaches 99.94% degradation efficiency, indicating a significant enhancement due to boron doping. From the structural standpoint, his enhancement can be attributed to the alteration of electronic properties and bandgap modification in ZnO through boron doping, which improves the separation and migration efficiency of photo-generated electron–hole pairs, thus enhancing the photocatalytic activity [22]. These results also suggests that mixing in the dark previous to the UV-A exposure further improves the degradation efficiency across all doping levels and conditions, possibly due to better dispersion and access of the methyl orange molecules to active sites on the photocatalyst surface, as well as adsorption–desorption equilibrium on the photocatalyst [75].
Photocatalytic degradation efficiency increases with increasing photocatalysis time due to the continuous generation of reactive oxidative species over the duration of exposure to light. The kinetics of such photocatalytic processes often follow pseudo-first-order models, where the rate of degradation is directly proportional to the concentration of the remaining pollutant [76]. The pseudo-first-order kinetic model is commonly employed to describe the kinetics of photocatalytic degradation processes in heterogeneous catalysis systems [77,78,79]. This model assumes that the rate of degradation of a pollutant is directly proportional to the concentration of the reactant, typically following the Langmuir–Hinshelwood mechanism, where adsorption of the reactant on the catalyst surface is a prerequisite for reaction [80]. In this context, the degradation rate can be expressed as follows [77,81]:
ln C 0 C t = k t
where C0 is the initial concentration (ppm); Ct is the concentration at different reaction times (ppm), k is the apparent pseudo-first-order kinetic rate constant, and t is the reaction time (min). This model is utilized to analyze and interpret the degradation kinetics of methyl orange in the presence of selected synthesized samples under UVA light irradiation. Figure 4b presents the kinetic analysis of photocatalytic degradation using synthesized nanoparticles, where the slopes of the lines represent the rate constants (k), which are measures of photocatalytic activity.
Undoped ZnO shows the lowest rate constant (k1 = 0.0351), signifying the least efficient photocatalytic activity among the tested samples. However, for the sample with the lowest boron content, there is a noticeable improvement in photocatalytic efficiency. The graph clearly illustrates that boron doping, particularly at lower concentrations, coupled with mixing in the dark for adsorption/desorption equilibrium to be reached, substantially enhances the efficiency of ZnO nanoparticles in the photocatalytic degradation of organic pollutants. This suggests that boron-doped ZnO nanoparticles, particularly those processed under optimal conditions, are highly effective for wastewater treatment applications under natural sunlight. According to the literature data, undoped and doped ZnO nanomaterials and doped TiO2 nanoparticles have been investigated in various solutions as photocatalysts for the degradation of dyes with various efficiencies.
Bian et al. (2021) [82] tested a commercial P25 TiO2 for the photocatalytic degradation of methyl orange under UV irradiation. After 75 min of illumination, a degradation efficiency of approximately 76% was achieved [82]. Rashid Al-Mamun et al. (2022) [83] have reported that the synthesized TiO2 nanoparticles demonstrated higher photocatalytic activity compared to Degussa P25 due to their wider bandgap and lower absorption in the visible range. In the photocatalytic degradation experiments under UV irradiation for 300 min, degradation efficiency reached a maximum value of 85.90% at neutral pH. At lower pH, the degradation efficiency reached 96.38% [83]. Positive effect of doping, through enhanced efficiency, was reported by Girginov et al. (2012) [84] with comparison of pure and silver-doped TiO2 (Ag/TiO2). Under UV irradiation for 5 h, the Ag/TiO2 catalyst with 0.3% Ag achieved nearly complete degradation of methyl orange, compared to approximately 65% degradation by pure P25 TiO2 under identical conditions [84].
Wang et al. (2021) have reported an efficiency of the ZnO nanoparticles of 92% within 180 min, with a 1.5 g/L catalyst dose, 20 mg/L methyl orange concentration in a 50 mL solution, and UV exposure [85]. It has also been reported by Vargas et al. (2021) that ZnO doped with 2 mol% MgO achieved 73% degradation in 120 min and complete removal after 180 min [86]. Bhosale et al. (2023) [87] have reported that Ag-ZnO nanoparticles demonstrate a photocatalytic efficiency of 96.74% in the degradation of methyl orange under UV irradiation, over a period of 90 min, for 20 mg/dm3 methyl orange concentration, and neutral pH. Pure ZnO exhibited a 70.47% degradation efficiency. This improvement is attributed to the reduced band gap energy, increased specific surface area, and suppressed electron–hole recombination [87]. Ajil et al. (2023) [88] have also compared the photocatalytic degradation of methyl orange using undoped and 1 mol% Ce-doped ZnO nanoparticles. Under both UV and sunlight irradiation, Ce-doped ZnO achieved up to 95% degradation efficiency after annealing, compared to 90% for UV and lower efficiencies for undoped ZnO (89% sunlight, 85% UV). Enhanced activity was linked to improved crystallinity and reduced electron–hole recombination [88]. Oyewo et al. (2022) have achieved the optimal performance with the ZnO-Sn(10%)/GO (graphene oxide), with a 96.2% degradation efficiency within 120 min under visible light, at 50 mg/L of methyl orange [89].
The literature review shows that the results of the investigation of the doping of ZnO nanoparticles with boron for the photocatalytic degradation of dyes are lacking. The results obtained in this study and the comparison with the available literature data show that ZnO nanoparticles doped with boron have a higher photocatalytic efficiency compared to undoped ZnO, as well as doped ZnO and TiO2 nanomaterials.

3.4. Artificial Neural Network Modeling in Python

For optimization of photocatalytic experiments, it is essential to apply reliable mathematical models to predict their efficiency. In this context, artificial neural networks represent an effective approach for modeling complex nonlinear relationships between experimental parameters and photocatalytic activity.
Each network is composed of artificial neurons organized into layers, interconnected in parallel. The strength of these connections is defined by their weights. In every ANN, the initial layer is the input layer (independent variables), and the final layer is the output layer (dependent variables). Between these, there can be one or more hidden layers, functioning as feature detectors. Although multiple hidden layers are possible, the universal approximation theory suggests that a single hidden layer with enough neurons can model any input–output relationship. The number of neurons in the hidden layer, which influences the accuracy of neural predictions, is a key design parameter. In a feed-forward neural net, each neuron in a layer connects to every neuron in the adjacent layer [90,91]. The input layer is a distributor, directly relaying input to the hidden layer. Figure 5 shows an FFNN with one input layer containing four input neurons (parameters), one hidden layer with 14 neurons, and one output layer with a single neuron.
In the architecture shown in Figure 5, four neurons in the input layer represent the following variables: dopant content (%B) as input 1, mixing time (h) as input 2, calcination temperature (°C) as input 3, and photocatalysis time (min) as input 4. In the output layer, there is one neuron representing the efficiency of methyl orange removal (%). The ANN model was created using the programming language Python, version 3.10, using the IDLE development environment, version 3.10. For the creation of the Python script, the following libraries were used: keras, matplotlib, pandas, and sklearn.
Keras (version used: 2.15.0) is a high-level library for Python designed for deep learning. It simplifies the creation of neural networks and can be used for various real-time applications, including classification and regression models. Keras supports different backend systems such as TensorFlow, CNTK, and Theano [92,93]. Matplotlib (version used: 3.9.2) was used as a Python library for data visualization and results [94,95]. Pandas (version used: 2.0.0), as a Python library, simplifies working with datasets and provides basic options for implementing statistical models, and helps in normalizing collected data and preparing it for analysis [96,97]. Scikit-learn (sklearn, version used: 0.0.post1) is a Python library for machine learning that offers various tools for data mining and data analysis. It is widely used for creating machine learning models and includes algorithms for classification, regression, clustering, etc. Sklearn is known for its ease of use and flexibility in implementing complex machine-learning algorithms [98,99].
The model is structured as a sequential array of layers, a typical setup for feedforward neural networks where data flows in one direction from input to output. The first layer in this array is densely connected with 14 neurons, using the sigmoid activation function to introduce non-linearity, facilitating complex pattern recognition, which is crucial for this regression problem. The ANN model was trained on 96 experimental datasets, using 80% of the data for training, while 10% was used for validation, and 10% for testing. Python code for the ANN model discussed further is shown below, Scheme 1.
The input shape is dynamically set to match the number of features in the training dataset, x_train.shape [1]. Regularization is applied using L2 norms to prevent overfitting by penalizing large weights, with a regularization factor, in this case, of 0.01 [100]. The output layer consists of a single neuron with a linear activation function, suitable for regression tasks where the output is a continuous value, in this case, the photocatalytic efficiency.
The model employs the stochastic gradient descent (SGD) optimizer, a robust and straightforward method for iterative learning. The learning rate is a crucial hyperparameter in training neural networks, determining the step size at each iteration while moving toward a minimum loss function [101]. Here, it is set to 0.05, offering a balance between the speed of convergence and the risk of overshooting minimal points. During the compilation phase, the model is configured with the previously defined SGD optimizer. The loss function used is ‘mean squared error’, which is standard for regression models as it measures the average of the squares of the errors—that is, the average squared difference between the estimated values and the actual value. Additionally, ‘mean absolute error’ is tracked as a metric to provide a clear measure of model performance during the training and validation phases [102,103].
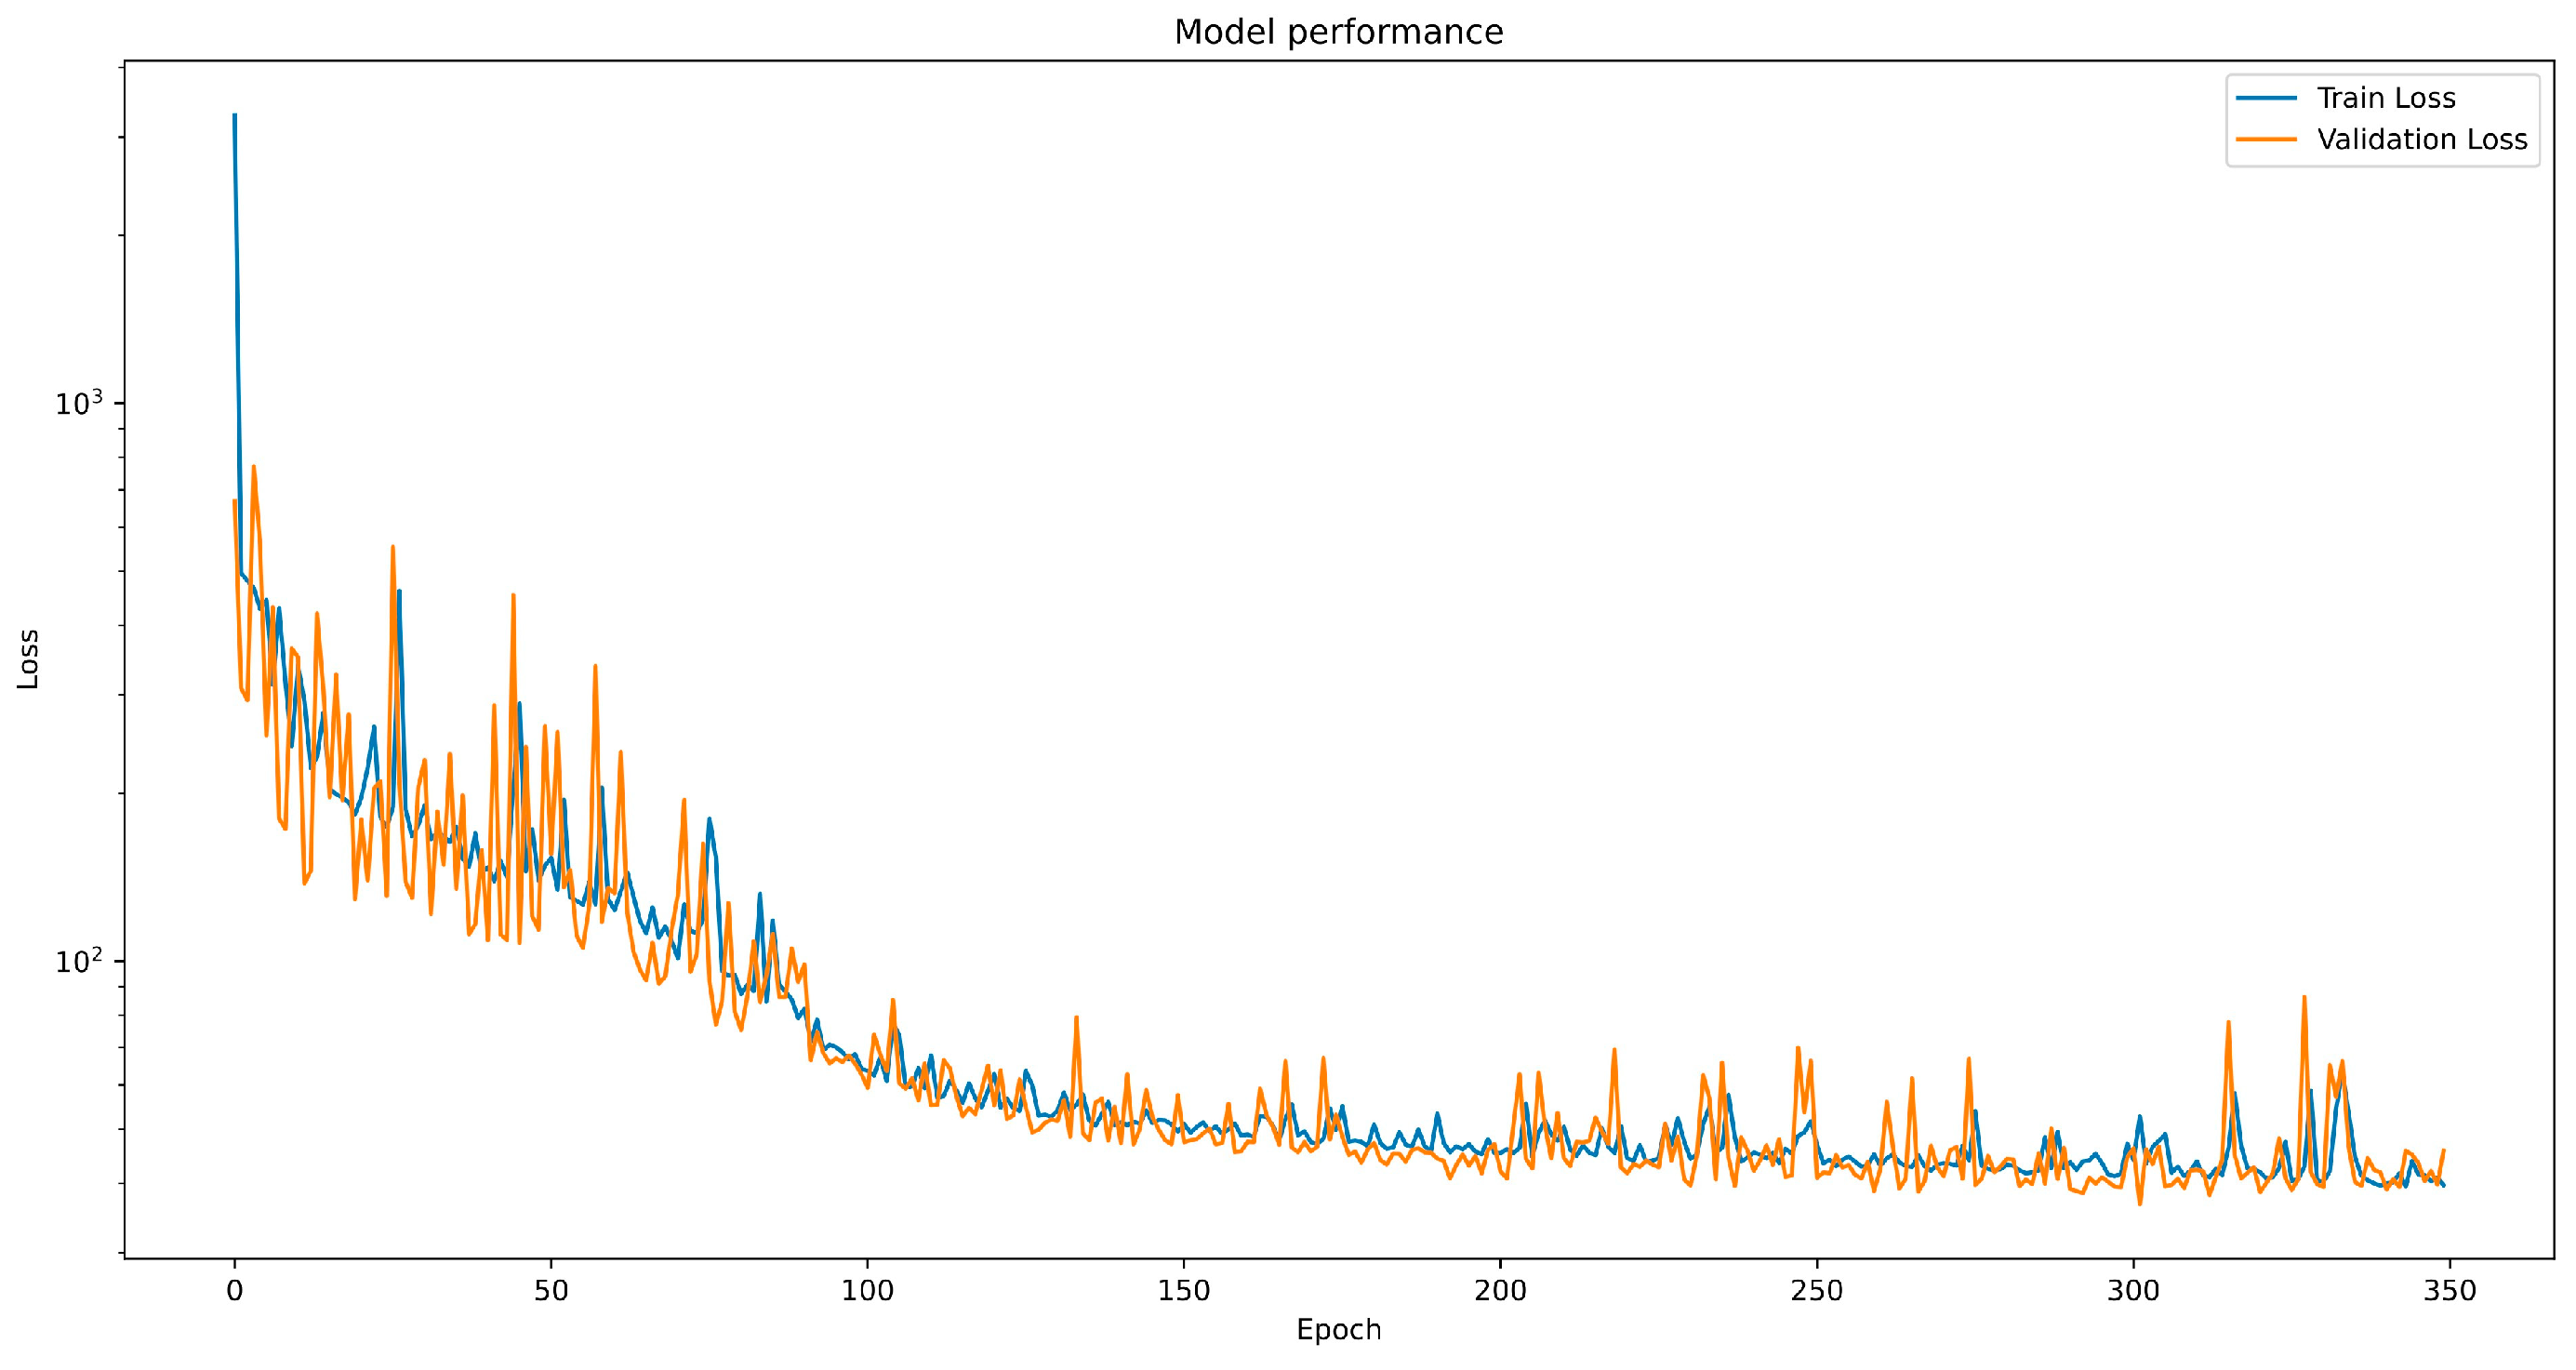
The model was tested at a learning speed set to 0.05, during 350 epochs. In Figure 6, the trend of the mean squared error (loss) for the training and validation datasets is shown.
In Figure 6, the mean squared error (loss) for both sets (“train” and “validation”) decreases relatively quickly through the epochs, which is typical when the model begins to learn from the data. The reduction in MSE for training indicates that the model is increasingly fitting the training data better. However, the trend of decreasing MSE for the test and validation datasets stabilizes and does not significantly decrease after the initial drop. The fact that the MSE for validation and testing are close to each other and relatively stable suggests that the model’s performance has stabilized and that the model generalizes well to new data. The absence of overfitting, which can occur due to the smaller volume of data used for training, as well as the stability of the mean squared error values, can be considered an indication of the model’s suitability in terms of generalizability and stability [104,105].
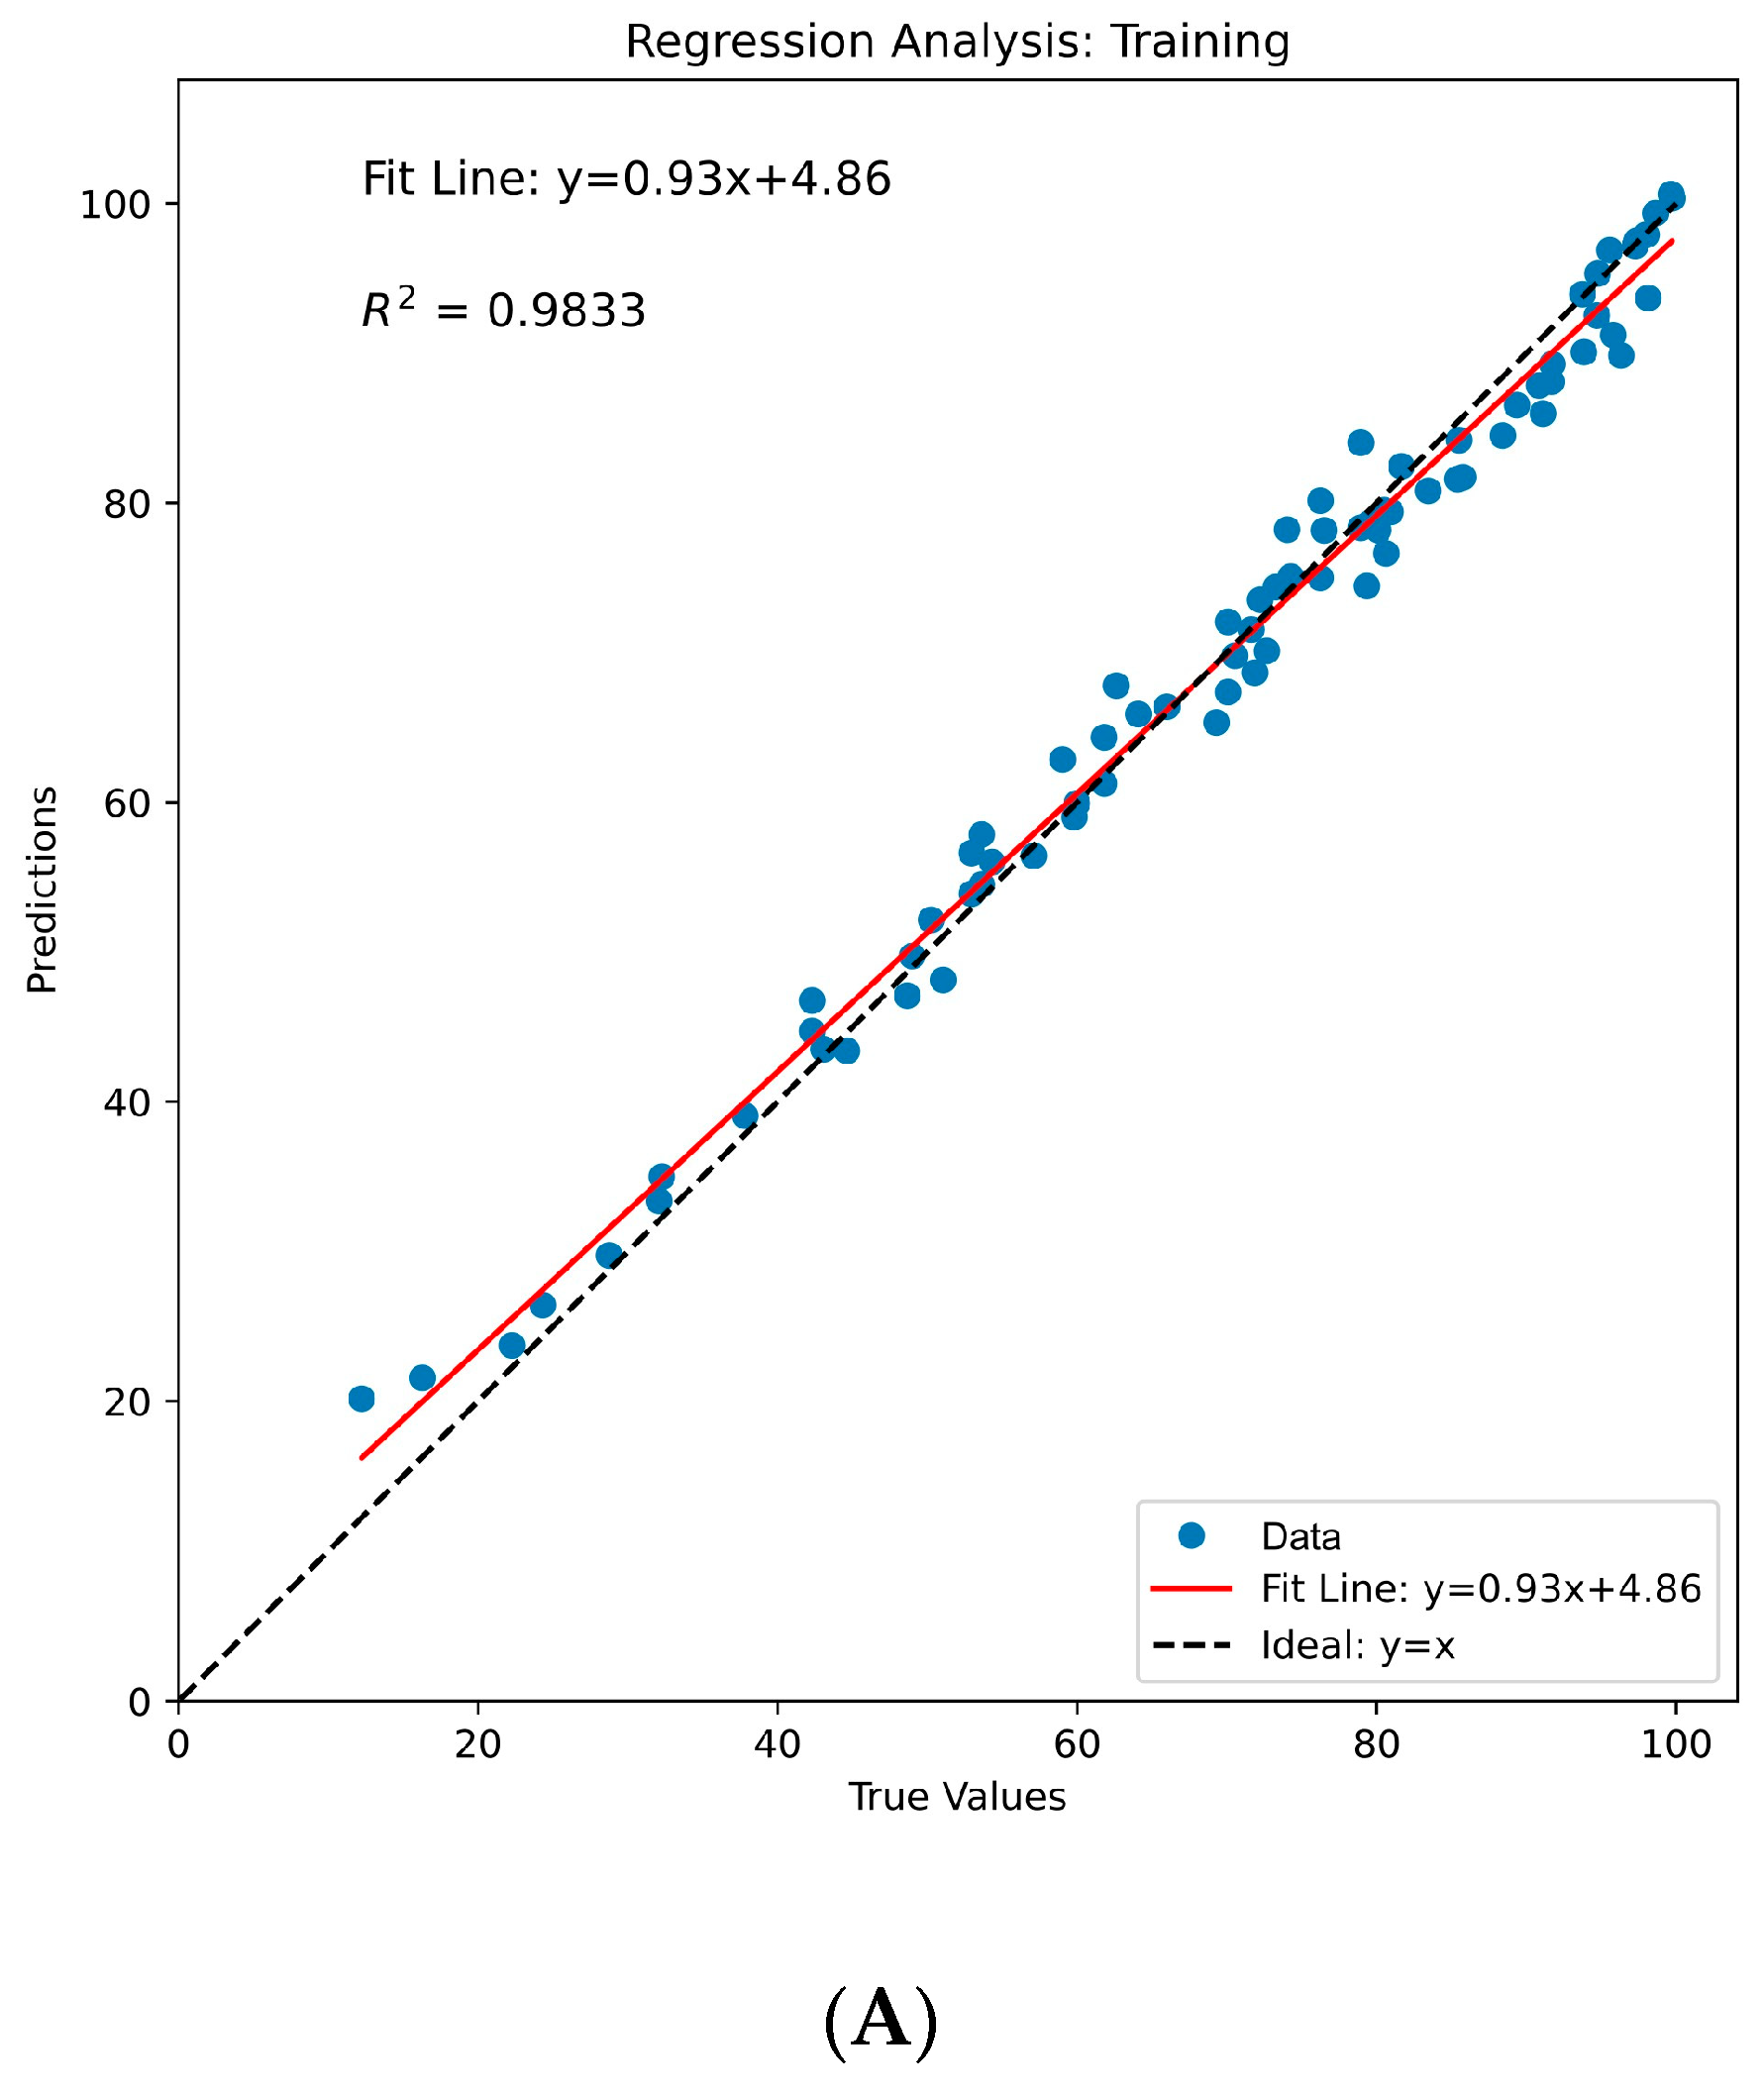
Based on the provided charts, several conclusions about the regression analysis that was performed for two datasets, training and testing, can be drawn. On the chart for the training set shown in Figure 7A, the best-fit line has the equation y = 0.93x + 4.86, which indicates that the predictions are very close to the true values but with a slight underestimation since the slope coefficient is less than 1. The ideal line, representing a perfect match between predictions and true values, is y = x and is shown with a dashed line. For the test set shown in Figure 7B, the best-fit line has the equation y = 0.92x + 5.62, indicating that the model provides relatively high prediction values compared to the actual ones, given that the coefficient is greater than 1. The coefficient value of 0.9810 for the test set shows that the model explains the variability of the actual values very well, which is an indicator of a good model fit [106]. Overall, the model seems quite reliable in predicting data, although there is a certain difference between the training and test sets that could be further explored for model optimization.
The created model was then tested for the prediction of new and unused data. Ten sets of data, obtained experimentally, were set aside for this step. In Table 2, the values of the output parameter, i.e., the efficiency of methyl orange degradation, are given.
Figure 8 presents a regression plot of the model prediction on new data.
The regression analysis plot presented in Figure 8 indicates that the ANN has been trained to predict the photocatalytic activity with high accuracy, as evidenced by the linear regression fit (y = a + b×x) R2 value being close to 1, with intercept and slope presented in the bracket. The square markers represent the observed (true) values of the dependent variable (y), while the regression metrics demonstrate strong model performance: R2 = 0.99099 indicates that 99.1% of the variance in y is explained by x, with Adj. R2 = 0.98986, accounting for model complexity adjustments, and Pearson’s r = 0.99548, confirming a strong positive linear correlation between the variables. This suggests that the ANNs can reliably predict the outcomes based on the input data they were trained on. In summary, the presented results illustrate a well-calibrated ANN model with high predictive accuracy and generalizability, supporting its application in modeling the photocatalytic degradation performance of B-doped ZnO nanoparticles. This predictive model could be useful for simulating different operational conditions, thus contributing to the development of efficient photocatalytic systems for environmental applications.

4. Conclusions

This research provides a comprehensive analysis of the photocatalytic performance of boron-doped zinc oxide (B-ZnO) nanoparticles synthesized via a mechanochemical route. The study successfully demonstrates that the incorporation of boron into ZnO nanoparticles significantly enhances their photocatalytic efficiency, primarily through alterations in their electronic structure and surface morphology. The highest photocatalytic performance was observed in nanoparticles with 1 wt% boron doping, calcined at 700 °C. These nanoparticles exhibited superior degradation capabilities for methyl orange under UVA light, which is attributed to the optimal alteration of the bandgap and increased charge carrier separation efficiency.
The adoption of the mechanochemical method in the synthesis of B-ZnO nanoparticles has shown several advantages over traditional methods, including environmental aspects, cost-effectiveness, and the ability to scale. These attributes make this synthesis route particularly appealing for industrial applications where large quantities of photocatalysts are required.
Additionally, the integration of artificial neural network modeling in this study represents a significant advancement in the predictive analysis of photocatalytic performances under various experimental conditions. The ANN model developed in Python provided accurate predictions of photocatalytic degradation, which is instrumental for optimizing the operational parameters without the need for extensive empirical testing.
The focus of future research will be on pilot-scale investigations with the aim of evaluating the scalability and effectiveness of the optimized photocatalytic process under real conditions. In addition, the possible integration of the tested photocatalytic system into wastewater treatment plants will be investigated, and the economic feasibility and energy efficiency will be evaluated. Further improvements of the photocatalyst and ANN optimization will also be the focus of further research, with the aim of achieving better stability and improved photocatalytic activity under broader operating conditions, as well as further optimization and comparison with different types of training algorithms and different software solutions.

Author Contributions

Conceptualization, V.N. and M.R.; writing—original draft preparation, V.N.; writing—review and editing, V.N., M.R., S.S., D.M. and D.T.; data curation, D.M., I.H. and D.T.; supervision, M.R., D.M. and M.A. All authors have read and agreed to the published version of the manuscript.

Funding

This research received no external funding.

Data Availability Statement

The original contributions presented in the study are included in the article. Further inquiries can be directed to the corresponding author.

Acknowledgments

The research presented in this paper was conducted with the financial support of the Ministry of Education, Science and Technological Development of the Republic of Serbia, within the funding of the scientific research work at the University of Belgrade, Technical Faculty in Bor (contract number 451-03-65/2025-03/200131).

Conflicts of Interest

The authors declare no conflicts of interest.

Abbreviations

The following abbreviations are used in this manuscript:
ANNArtificial neural network
EDSEnergy-dispersive spectroscopy
SEMScanning electron microscopy
XRDX-ray diffraction

References

  1. Maswanganyi, S.; Gusain, R.; Kumar, N.; Fosso-Kankeu, E.; Waanders, F.B.; Ray, S.S. Bismuth Molybdate Nanoplates Supported on Reduced Graphene Oxide: An Effective Nanocomposite for the Removal of Naphthalene via Adsorption–Photodegradation. ACS Omega 2021, 6, 16783–16794. [Google Scholar] [CrossRef] [PubMed]
  2. Ahmed, S.; Rasul, M.G.; Brown, R.; Hashib, M.A. Influence of Parameters on the Heterogeneous Photocatalytic Degradation of Pesticides and Phenolic Contaminants in Wastewater: A Short Review. J. Environ. Manag. 2011, 92, 311–330. [Google Scholar] [CrossRef] [PubMed]
  3. Khasawneh, O.; Palaniandy, P. Photocatalytic Degradation of Pharmaceuticals Using TiO2 Based Nanocomposite Catalyst—Review. Civ. Environ. Eng. Rep. 2019, 29, 1–33. [Google Scholar] [CrossRef]
  4. Mirzaeifard, Z.; Shariatinia, Z.; Jourshabani, M.; Rezaei Darvishi, S.M. ZnO Photocatalyst Revisited: Effective Photocatalytic Degradation of Emerging Contaminants Using S-Doped ZnO Nanoparticles under Visible Light Radiation. Ind. Eng. Chem. Res. 2020, 59, 15894–15911. [Google Scholar] [CrossRef]
  5. Abdullah, F.H.; Bakar, N.H.H.A.; Bakar, M.A. Current Advancements on the Fabrication, Modification, and Industrial Application of Zinc Oxide as Photocatalyst in the Removal of Organic and Inorganic Contaminants in Aquatic Systems. J. Hazard. Mater. 2022, 424, 127416. [Google Scholar] [CrossRef]
  6. Gaggero, E.; Calza, P.; Cerrato, E.; Paganini, M.C. Cerium-, Europium- and Erbium-Modified ZnO and ZrO2 for Photocatalytic Water Treatment Applications: A Review. Catalysts 2021, 11, 1520. [Google Scholar] [CrossRef]
  7. Ghrib, T.; Massoudi, I.; Al-Otaibi, A.L.; Al-Malki, A.; Kharma, A.; Al-Hashem, E.; Al-Ghamdi, R.A.; Al-Zuraie, R.A. Effects of Terbium Doping on Structural, Optical and Photocatalytic Properties of ZnO Nanopowder Prepared by Solid-State Reaction. J. Inorg. Organomet. Polym. Mater. 2021, 31, 239–250. [Google Scholar] [CrossRef]
  8. Ruszkiewicz, J.A.; Pinkas, A.; Ferrer, B.; Peres, T.V.; Tsatsakis, A.; Aschner, M. Neurotoxic Effect of Active Ingredients in Sunscreen Products, a Contemporary Review. Toxicol. Rep. 2017, 4, 245–259. [Google Scholar] [CrossRef]
  9. Bawazeer, T.M. Facile and Novel Route for the Preparation of ZnO Nanoparticles with Different Cr Loadings for Opto-Photocatalysis Applications. Catalysts 2022, 12, 1093. [Google Scholar] [CrossRef]
  10. Hassan, K.; Hossain, R.; Farzana, R.; Sahajwalla, V. Microrecycled Zinc Oxide Nanoparticles (ZnO NP) Recovered from Spent Zn-C Batteries for VOC Detection Using ZnO Sensor. Anal. Chim. Acta 2021, 1165, 338563. [Google Scholar] [CrossRef]
  11. Porrawatkul, P.; Pimsen, R.; Kuyyogsuy, A.; Teppaya, N.; Noypha, A.; Chanthai, S.; Nuengmatcha, P. Microwave-Assisted Synthesis of Ag/ZnO Nanoparticles Using Averrhoa carambola Fruit Extract as the Reducing Agent and Their Application in Cotton Fabrics with Antibacterial and UV-Protection Properties. RSC Adv. 2022, 12, 15008–15019. [Google Scholar] [CrossRef]
  12. Ayeb, K.; Moussa, N.; Nsib, M.F.; Leonardi, S.G.; Neri, G. NO2 Sensing Properties of N-, F- and NF Co-Doped ZnO Nanoparticles. Mater. Sci. Eng. B 2021, 263, 114870. [Google Scholar] [CrossRef]
  13. Que, M.; Lin, C.; Sun, J.; Chen, L.; Sun, X.; Sun, Y. Progress in ZnO Nanosensors. Sensors 2021, 21, 5502. [Google Scholar] [CrossRef]
  14. Tsuzuki, T. Mechanochemical Synthesis of Metal Oxide Nanoparticles. Commun. Chem. 2021, 4, 143. [Google Scholar] [CrossRef] [PubMed]
  15. Shen, L.; Bao, N.; Yanagisawa, K.; Domen, K.; Gupta, A.; Grimes, C.A. Direct Synthesis of ZnO Nanoparticles by a Solution-Free Mechanochemical Reaction. Nanotechnology 2006, 17, 5117–5123. [Google Scholar] [CrossRef]
  16. De Oliveira, P.F.M.; Torresi, R.M.; Emmerling, F.; Camargo, P. Challenges and Opportunities in the Bottom-Up Mechanochemical Synthesis of Noble Metal Nanoparticles. J. Mater. Chem. A 2020, 8, 16114–16141. [Google Scholar] [CrossRef]
  17. Taha, K.K.; Mustafa, M.M.; Ahmed, H.A.M.; Talab, S. Selenium Zinc Oxide (Se/ZnO) Nanoparticles: Synthesis, Characterization, and Photocatalytic Activity. Z. Naturforsch. A 2019, 74, 1043–1056. [Google Scholar] [CrossRef]
  18. Do, J.-L.; Friščić, T. Mechanochemistry: A Force of Synthesis. ACS Cent. Sci. 2016, 3, 13–19. [Google Scholar] [CrossRef]
  19. Amrute, A.P.; De Bellis, J.; Schüth, F.; Felderhoff, M. Mechanochemical Synthesis of Catalytic Materials. Chem. Eur. J. 2021, 27, 6819–6847. [Google Scholar] [CrossRef]
  20. Grube, M.; Zellmer, S.; Janek, J.; Schubert, J.; Kwade, A.; Hofer, M.; Zeier, W.G.; Witt, M. Solvent-free and scalable mechanochemical synthesis of high-performance sulfide solid electrolytes. J. Energy Storage 2025, 121, 116593. [Google Scholar] [CrossRef]
  21. Furka, D.; Furka, S.; Naftaly, M.; Rakovský, E.; Čaplovičová, M.; Janek, M. ZnO Nanoparticles as Photodegradation Agent Controlled by Morphology and Boron Doping. Catal. Sci. Technol. 2021, 11, 2167–2185. [Google Scholar] [CrossRef]
  22. Wang, W.; Ai, T.; Yu, Q. Electrical and Photocatalytic Properties of Boron-Doped ZnO Nanostructure Grown on PET–ITO Flexible Substrates by Hydrothermal Method. Sci. Rep. 2017, 7, 42615. [Google Scholar] [CrossRef] [PubMed]
  23. Wang, X.; Blackford, M.; Prince, K.; Caruso, R.A. Preparation of Boron-Doped Porous Titania Networks Containing Gold Nanoparticles with Enhanced Visible-Light Photocatalytic Activity. ACS Appl. Mater. Interfaces 2012, 4, 476–482. [Google Scholar] [CrossRef] [PubMed]
  24. Eskalen, H.; Kavun, Y.; Kerli, S.; Eken, S. An Investigation of Radiation Shielding Properties of Boron Doped ZnO Thin Films. Opt. Mater. 2020, 105, 109871. [Google Scholar] [CrossRef]
  25. Ahmad, A.A.; Alsaad, A.M.; Al-Bataineh, Q.M.; Al-Naafa, M.A. Optical and Structural Investigations of Dip-Synthesized Boron-Doped ZnO-Seeded Platforms for ZnO Nanostructures. Appl. Phys. A 2018, 124, 458. [Google Scholar] [CrossRef]
  26. Naik, E.I.; Naik, H.S.B.; Swamy, B.E.K.; Viswanath, R.; Gowda, I.K.S.; Prabhakara, M.C.; Chetankumar, K. Influence of Cu Doping on ZnO Nanoparticles for Improved Structural, Optical, Electrochemical Properties and Their Applications in Efficient Detection of Latent Fingerprints. Chem. Data Collect. 2021, 33, 100671. [Google Scholar] [CrossRef]
  27. Qi, K.; Cheng, B.; Yu, J.; Ho, W. Review on the Improvement of the Photocatalytic and Antibacterial Activities of ZnO. J. Alloys Compd. 2017, 727, 792–820. [Google Scholar] [CrossRef]
  28. Kumar, V.; Singh, R.; Purohit, L.; Mehra, R. Structural, Transport and Optical Properties of Boron-Doped Zinc Oxide Nanocrystalline. J. Mater. Sci. Technol. 2011, 27, 481–488. [Google Scholar] [CrossRef]
  29. Chen, X.; Xu, B.; Xue, J.; Zhao, Y.; Wei, C.; Sun, J.; Wang, Y.; Zhang, X.; Geng, X. Boron-Doped Zinc Oxide Thin Films for Large-Area Solar Cells Grown by Metal Organic Chemical Vapor Deposition. Thin Solid Films 2007, 515, 3753–3759. [Google Scholar] [CrossRef]
  30. Senol, S.D.; Ozturk, O.; Terzioğlu, C. Effect of Boron Doping on the Structural, Optical and Electrical Properties of ZnO Nanoparticles Produced by the Hydrothermal Method. Ceram. Int. 2015, 41, 11194–11201. [Google Scholar] [CrossRef]
  31. Zhang, J.; Que, W.; Yuan, Y.; Zhong, P.; Liao, Y. Preparation of Al-Doped ZnO Nanocrystalline Aggregates with Enhanced Performance for Dye Adsorption. Sci. China Phys. Mech. Astron. 2012, 55, 1198–1202. [Google Scholar] [CrossRef]
  32. Pardeshi, S.K.; Patil, A.B. Effect of Morphology and Crystallite Size on Solar Photocatalytic Activity of Zinc Oxide Synthesized by Solution-Free Mechanochemical Method. J. Mol. Catal. A Chem. 2009, 308, 32–40. [Google Scholar] [CrossRef]
  33. Ahmed, A.Z.; Islam, M.M.; ul Islam, M.M.; Masum, S.M.; Islam, R.; Molla, M.A.I. Fabrication and Characterization of B/Sn-Doped ZnO Nanoparticles via Mechanochemical Method for Photocatalytic Degradation of Rhodamine B. Inorg. Nano-Met. Chem. 2020, 51, 1369–1378. [Google Scholar] [CrossRef]
  34. Savitha, D.; Latha, H.K.E.; Lalithamba, H.S.; Mala, S.; Jeppu, Y.V. Structural, Optical and Electrical Properties of Undoped and Doped (Al, Al + Mn) ZnO Nanoparticles Synthesised by Green Combustion Method Using Terminalia catappa Seed Extract. Mater. Today Proc. 2022, 60, 988–997. [Google Scholar] [CrossRef]
  35. Caglar, Y.; Ilican, S.; Caglar, M. FESEM, XRD and DRS Studies of Electrochemically Deposited Boron Doped ZnO Films. Mater. Sci.-Pol. 2018, 36, 824–829. [Google Scholar] [CrossRef]
  36. Saadi, H.; Benzarti, Z.; Mourad, S.; Sanguino, P.; Hadouch, Y.; Mezzane, D.; Abdelmoula, N.; Khemakhem, H. Electrical Conductivity Improvement of (Fe + Al) Co-Doped ZnO Nanoparticles for Optoelectronic Applications. J. Mater. Sci. Mater. Electron. 2022, 33, 8065–8085. [Google Scholar] [CrossRef]
  37. Shannon, R.D. Revised Effective Ionic Radii and Systematic Studies of Interatomic Distances in Halides and Chalcogenides. Acta Crystallogr. Sect. A 1976, 32, 751–767. [Google Scholar] [CrossRef]
  38. Tsay, C.-Y.; Hsu, W.-T. Sol–Gel Derived Undoped and Boron-Doped ZnO Semiconductor Thin Films: Preparation and Characterization. Ceram. Int. 2013, 39, 7425–7432. [Google Scholar] [CrossRef]
  39. Gherab, K.; Al-Douri, Y.; Hashim, U.; Ameri, M.; Bouhemadou, A.; Batoo, K.M.; Adil, S.F.; Khan, M.; Raslan, E.H. Fabrication and characterizations of Al nanoparticles doped ZnO nanostructures-based integrated electrochemical biosensor. J. Mater. Res. Technol. 2019, 9, 857–867. [Google Scholar] [CrossRef]
  40. Patil, A.B.; Patil, K.R.; Pardeshi, S.K. Ecofriendly synthesis and solar photocatalytic activity of S-doped ZnO. J. Hazard. Mater. 2010, 183, 315–323. [Google Scholar] [CrossRef]
  41. Naik, E.I.; Naik, H.S.B.; Viswanath, R.; Kirthan, B.R.; Prabhakara, M.C. Effect of Zirconium Doping on the Structural, Optical, Electrochemical and Antibacterial Properties of ZnO Nanoparticles Prepared by Sol-Gel Method. Chem. Data Collect. 2020, 29, 100505. [Google Scholar] [CrossRef]
  42. Bomila, R.; Suresh, S.; Srinivasan, S. Synthesis, Characterization and Comparative Studies of Dual Doped ZnO Nanoparticles for Photocatalytic Applications. J. Mater. Sci. Mater. Electron. 2019, 30, 582–592. [Google Scholar] [CrossRef]
  43. Raji, P.; Kumar, K.B. Investigation of Ti Doping on the Structural, Optical, and Magnetic Properties of ZnO Nanoparticles. J. Mater. Sci. Mater. Electron. 2021, 32, 11751–11762. [Google Scholar] [CrossRef]
  44. Ahmed, S.A. Room-Temperature Ferromagnetism in Co-, Cr-, and V-Doped ZnO Diluted Magnetic Semiconductor. Appl. Phys. A 2017, 123, 440. [Google Scholar] [CrossRef]
  45. Naik, E.I.; Naik, H.S.B.; Sarvajith, M.S.; Pradeepa, E. Co-Precipitation Synthesis of Cobalt Doped ZnO Nanoparticles: Characterization and Their Applications for Biosensing and Antibacterial Studies. Inorg. Chem. Commun. 2021, 130, 108678. [Google Scholar] [CrossRef]
  46. Luque-Morales, P.A.; Lopez-Peraza, A.; Nava-Olivas, O.J.; Amaya-Parra, G.; Baez-Lopez, Y.A.; Orozco-Carmona, V.M.; Garrafa-Galvez, H.E.; Chinchillas-Chinchillas, M.d.J. ZnO Semiconductor Nanoparticles and Their Application in Photocatalytic Degradation of Various Organic Dyes. Materials 2021, 14, 7537. [Google Scholar] [CrossRef]
  47. Farhat, S.; Rekaby, M.; Awad, R. Synthesis and Characterization of Er-Doped Nano ZnO Samples. J. Supercond. Nov. Magn. 2018, 31, 3051–3061. [Google Scholar] [CrossRef]
  48. Zhao, D.; Yu, Y.; Cao, C.; Wang, J.; Wang, E.; Cao, Y. The Existing States of Doped B3+ Ions on the B Doped TiO2. Appl. Surf. Sci. 2015, 345, 67–71. [Google Scholar] [CrossRef]
  49. Naik, E.I.; Naik, H.S.B.; Viswanath, R.; Gowda, I.K.S.; Prabhakara, M.C. Bright Red Luminescence Emission of Macroporous Honeycomb-Like Eu3+ Ion-Doped ZnO Nanoparticles Developed by Gel-Combustion Technique. SN Appl. Sci. 2020, 2, 863. [Google Scholar] [CrossRef]
  50. Mesaros, A.; Perhaita, I.; Toloman, D.; Mos, R.B.; Nasui, M.; Vasile, B.S.; Biris, A.; Petrisor, T.; Pana, O.; Surdu, V.A.A. Valence States Approach for Luminescence Enhancement by Low Dopant Concentration in Eu-Doped ZnO Nanoparticles. J. Mater. Sci. 2015, 50, 6075–6086. [Google Scholar] [CrossRef]
  51. Okeke, I.S.; Agwu, K.K.; Ubachukwu, A.A.; Madiba, I.G.; Maaza, M.; Whyte, G.M.; Ezema, F.I. Impact of Particle Size and Surface Defects on Antibacterial and Photocatalytic Activities of Undoped and Mg-Doped ZnO Nanoparticles, Biosynthesized Using One-Step Simple Process. Vacuum 2021, 187, 110110. [Google Scholar] [CrossRef]
  52. Jaballah, S.; Dahman, H.; Ghiloufi, I.; Neri, G.; El Mir, L. Facile Synthesis of Al–Mg Co-Doped ZnO Nanoparticles and Their High Hydrogen Sensing Performances. Int. J. Hydrogen Energy 2020, 45, 34268–34280. [Google Scholar] [CrossRef]
  53. Kumar, S.; Asokan, K.; Chatterjee, S.; Ghosh, A.K.; Singh, R.K.; Kanjilal, D. Investigations on Structural and Optical Properties of ZnO and ZnO:Co Nanoparticles under Dense Electronic Excitations. RSC Adv. 2014, 4, 62123–62131. [Google Scholar] [CrossRef]
  54. Abdulrahman, N.A.; Haddad, N.I.A. Braggs, Scherre, Williamson–Hall and Ssp Analyses to Estimate the Variation of Crystallites Sizes and Lattice Constants for ZnO Nanoparticles Synthesized at Different Temperatures. NeuroQuantology 2020, 18, 53–63. [Google Scholar] [CrossRef]
  55. Vijayaprasath, G.; Murugan, R.; Asaithambi, S.; Sakthivel, P.; Mahalingam, T.; Hayakawa, Y.; Ravi, G. Structural and Magnetic Behavior of Ni/Mn Co-Doped ZnO Nanoparticles Prepared by Co-Precipitation Method. Ceram. Int. 2016, 42, 2836–2845. [Google Scholar] [CrossRef]
  56. Zhang, X.; Wang, L.; Qin, J.; Shen, X.; Yu, R.; Limpanart, S.; Ma, M.; Liu, R.; Hao, R. Carbon-Doped ZnO Nanostructures: Facile Synthesis and Visible Light Photocatalytic Applications. J. Phys. Chem. C 2015, 119, 20544–20554. [Google Scholar] [CrossRef]
  57. Devi, P.G.; Velu, A.S. Synthesis, Structural and Optical Properties of Pure ZnO and Co Doped ZnO Nanoparticles Prepared by the Co-Precipitation Method. J. Theor. Appl. Phys. 2016, 10, 233–240. [Google Scholar] [CrossRef]
  58. Ashok Kumawat, A.; Chattopadhyay, S.; Misra, K.P.; Misra, R.D.K.; Kumari, P. Micro-Strain Governed Photoluminescence Emission Intensity of Sol-Gel Spin Coated Eu Doped ZnO Thin Films. Thin Solid Films 2022, 761, 139521. [Google Scholar] [CrossRef]
  59. Bindu, P.; Thomas, S. Estimation of Lattice Strain in ZnO Nanoparticles: X-Ray Peak Profile Analysis. J. Theor. Appl. Phys. 2014, 8, 123–134. [Google Scholar] [CrossRef]
  60. Singh, J.; Singh, R.C. Enhancement of Optical, Dielectric and Transport Properties of (Sm, V) Co-Doped ZnO System and Structure-Property Correlations. Ceram. Int. 2021, 47, 10611–10627. [Google Scholar] [CrossRef]
  61. Saravanakumar, K.; Sakthivel, P.; Sankaranarayanan, R.K. Influence of Sn4+ Ion on Band Gap Tailoring, Optical, Structural and Dielectric Behaviors of ZnO Nanoparticles. Spectrochim. Acta Part A 2021, 267, 120487. [Google Scholar] [CrossRef] [PubMed]
  62. Moon, S.M.; Heo, J.E.; Jeon, J.; Eom, T.; Jang, D.; Her, K.; Shim, B.S. High Crystallinity of Tunicate Cellulose Nanofibers for High-Performance Engineering Films. Carbohydr. Polym. 2021, 254, 117470. [Google Scholar] [CrossRef]
  63. Liu, Y.; Zhang, Y.; Lim, K.H.; Ibáñez, M.; Ortega, S.; Li, M.; Cabot, A. High Thermoelectric Performance in Crystallographically Textured n-Type Bi2Te3−xSex Produced from Asymmetric Colloidal Nanocrystals. ACS Nano 2018, 12, 7174–7184. [Google Scholar] [CrossRef] [PubMed]
  64. Kumar, P.; Pandey, P.C.; Singh, B.K.; Pal, B.N. Correlation between Structural, Optical and Magnetic Properties of Mn-Doped ZnO. Appl. Phys. A 2016, 122, 740. [Google Scholar] [CrossRef]
  65. Kamble, V.S.; Desai, N.K.; Patil, V.B.; Navale, Y.H.; Salunkhe, S.T. Enhanced NO2 Gas Sensing Performance of Ni-Doped ZnO Nanostructures. J. Mater. Sci. Mater. Electron. 2021, 32, 2219–2233. [Google Scholar] [CrossRef]
  66. Addonizio, M.L.; Diletto, C. Doping Influence on Intrinsic Stress and Carrier Mobility of LP-MOCVD Deposited Zn0:B Thin Films. Sol. Energy Mater. Sol. Cells 2008, 92, 1488–1494. [Google Scholar] [CrossRef]
  67. Moulahi, A.; Sediri, F. Pencil-Like Zinc Oxide Micro/Nano-Scale Structures: Hydrothermal Synthesis, Optical and Photocatalytic Properties. Mater. Res. Bull. 2013, 48, 3723–3728. [Google Scholar] [CrossRef]
  68. Shabna, S.; Biju, C.S.; Singh, C.J.C.; Dhas, S.D.S.J.; Jeyakumar, S.C. An Overview of Prominent Factors Influencing the Photocatalytic Degradation of Cationic Crystal Violet Dye Employing Diverse Nanostructured Materials. J. Chem. Technol. Biotechnol. 2024, 99, 1027–1055. [Google Scholar] [CrossRef]
  69. Wang, S.; Zhang, X.; Li, S.; Fang, Y.; Pan, L.; Zou, J.-J. C-doped ZnO ball-in-ball hollow microspheres for efficient photocatalytic and photoelectrochemical applications. J. Hazard. Mater. 2017, 331, 235–245. [Google Scholar] [CrossRef]
  70. Sharma, V.; Sharma, J.K.; Kansay, V.; Sharma, V.D.; Sharma, A.; Kumar, S.; Sharma, A.K.; Bera, M.K. The Effect of Calcination Temperatures on the Structural and Optical Properties of Zinc Oxide Nanoparticles and Their Influence on the Photocatalytic Degradation of Leather Dye. Chem. Phys. Impact 2023, 6, 100196. [Google Scholar] [CrossRef]
  71. Ebrahimi, R.; Maleki, A.; Zandsalimi, Y.; Ghanbari, R.; Shahmoradi, B.; Rezaee, R.; Safari, M.; Joo, S.; Daraei, H.; Puttaiah, S.; et al. Photocatalytic Degradation of Organic Dyes Using WO3-Doped ZnO Nanoparticles Fixed on a Glass Surface in Aqueous Solution. J. Ind. Eng. Chem. 2019, 73, 297–305. [Google Scholar] [CrossRef]
  72. Jiang, L.; Ni, S.; Liu, G.; Xu, X. Photocatalytic hydrogen production over Aurivillius compound Bi3TiNbO9 and its modifications by Cr/Nb co-doping. Appl. Catal. B Environ. 2017, 217, 342–352. [Google Scholar] [CrossRef]
  73. Moafi, H.F.; Zanjanchi, M.A.; Shojaie, A.F. Tungsten-doped ZnO nanocomposite: Synthesis, characterization, and highly active photocatalyst toward dye photodegradation. Mater. Chem. Phys. 2013, 139, 856–864. [Google Scholar] [CrossRef]
  74. Agale, P.; Salve, V.; Mardikar, S.; Patange, S.; More, P. Synthesis and characterization of hierarchical Sr-doped ZnO hexagonal nanodisks as an efficient photocatalyst for the degradation of methylene blue dye under sunlight irradiation. Appl. Surf. Sci. 2024, 672, 160795. [Google Scholar] [CrossRef]
  75. Alshammari, A.S.; Bagabas, A.; Chen, X.; Kramer, D.; Chi, L.; Alromaeh, A.; Jiang, Z. Visible-light photocatalysis on C-doped ZnO derived from polymer-assisted pyrolysis. RSC Adv. 2015, 5, 27690–27698. [Google Scholar] [CrossRef]
  76. Al-Ghamdi, S.; Al-Qarni, M.; Al-Shehri, F.; Mbarki, A.; Al-Rashidi, M.; Abd-Elnaiem, A.; Rashad, M. Photocatalytic Degradation of Potassium Permanganate Using Zinc Oxide Nanoparticles. Dig. J. Nanomater. Biostruct. 2021, 16, 889–900. [Google Scholar] [CrossRef]
  77. Jongnavakit, P.; Amornpitoksuk, P.; Suwanboon, S.; Ndiege, N. Preparation and Photocatalytic Activity of Cu-Doped ZnO Thin Films Prepared by the Sol-Gel Method. Appl. Surf. Sci. 2012, 258, 8192–8198. [Google Scholar] [CrossRef]
  78. Roguai, S.; Djelloul, A. Structural, Microstructural and Photocatalytic Degradation of Methylene Blue of Zinc Oxide and Fe-Doped ZnO Nanoparticles Prepared by Simple Coprecipitation Method. Solid State Commun. 2021, 334–335, 114362. [Google Scholar] [CrossRef]
  79. Naz, F.; Saeed, K. Investigation of Photocatalytic Behavior of Undoped ZnO and Cr-Doped ZnO Nanoparticles for the Degradation of Dye. Inorg. Nano-Met. Chem. 2020, 51, 1–11. [Google Scholar] [CrossRef]
  80. Herrmann, J.-M. Heterogeneous Photocatalysis: Fundamentals and Applications to the Removal of Various Types of Aqueous Pollutants. Catal. Today 1999, 53, 115–129. [Google Scholar] [CrossRef]
  81. Domínguez, J.R.; González, T.; Correia, S. BDD Electrochemical Oxidation of Neonicotinoid Pesticides in Natural Surface Waters. Operational, Kinetic and Energetic Aspects. J. Environ. Manag. 2021, 298, 113538. [Google Scholar] [CrossRef]
  82. Bian, Y.; Sheng, Z.; Hu, L.; Zheng, G.; Ding, W. Magnetic field effect on the photocatalytic degradation of methyl orange by commercial TiO2 powder†. RSC Adv. 2021, 11, 6284–6291. [Google Scholar] [CrossRef] [PubMed]
  83. Rashid Al-Mamun, M.; Zaved Hossain Khan, D.M.; Hossain, K.T.; Mondal, S.; Afroza Khatun, M.; Shahinoor Islam, M. Synthesis, characterization, and photocatalytic performance of methyl orange in aqueous TiO2 suspension under UV and solar light irradiation. S. Afr. J. Chem. Eng. 2022, 40, 113–125. [Google Scholar] [CrossRef]
  84. Girginov, C.; Stefchev, P.; Vitanov, P.; Dikov, H. Silver Doped TiO2 Photocatalyst for Methyl Orange Degradation. J. Eng. Sci. Technol. Rev. 2012, 5, 14–17. [Google Scholar] [CrossRef]
  85. Wang, Y.; Liu, Y.; Fan, Y.; Dang, F.; Liu, Y.; Wang, W.; Yang, C.; Qiu, Y.; Zhou, H. Solvothermal Synthesis of ZnO Nanoparticles for Photocatalytic Degradation of Methyl Orange and p-Nitrophenol. Water 2021, 13, 3224. [Google Scholar] [CrossRef]
  86. Vargas, M.A.; Rivera-Muñoz, E.M.; Diosa, J.E.; Mosquera, E.E.; Rodríguez-Páez, J.E. Nanoparticles of ZnO and Mg-doped ZnO: Synthesis, characterization and efficient removal of methyl orange (MO) from aqueous solution. Ceram. Int. 2021, 47, 15668–15681. [Google Scholar] [CrossRef]
  87. Bhosale, A.; Kadam, J.; Gade, T.; Sonawane, K.; Garadkar, K. Efficient photodegradation of methyl orange and bactericidal activity of Ag doped ZnO nanoparticles. J. Indian Chem. Soc. 2023, 100, 100920. [Google Scholar] [CrossRef]
  88. Ajil, A.H.; Ibnaouf, K.H.; Cabrera, H.; Yam, F.K.; Wadi, I.A.; M Binzowaimil, A.; Zango, Z.U.; Ahmed, N.M.; Aldaghri, O. Enhancing Methyl Orange Degradation with Laser-Generated ZnO and Ce-Doped ZnO Nanoparticles. Appl. Sci. 2023, 13, 11857. [Google Scholar] [CrossRef]
  89. Oyewo, O.A.; Ramaila, S.; Mavuru, L.; Onwudiwe, D.C. Enhanced photocatalytic degradation of methyl orange using Sn-ZnO/GO nanocomposite. J. Photochem. Photobiol. 2022, 11, 100131. [Google Scholar] [CrossRef]
  90. Khataee, A.R.; Kasiri, M.B. Artificial Neural Networks Modeling of Contaminated Water Treatment Processes by Homogeneous and Heterogeneous Nanocatalysis. J. Mol. Catal. A Chem. 2010, 331, 86–100. [Google Scholar] [CrossRef]
  91. Zamouche, M.; Tahraoui, H.; Laggoun, Z.; Mechati, S.; Chemchmi, R.; Kanjal, M.I.; Amrane, A.; Hadadi, A.; Mouni, L. Optimization and Prediction of Stability of Emulsified Liquid Membrane (ELM): Artificial Neural Network. Processes 2023, 11, 364. [Google Scholar] [CrossRef]
  92. Manaswi, N. Understanding and Working with Keras. In Deep Learning with Applications Using Python; Apress: Berkeley, CA, USA, 2018; pp. 31–43. [Google Scholar] [CrossRef]
  93. Sumathi, D.; Alluri, K. Deploying Deep Learning Models for Various Real-Time Applications Using Keras. In Advanced Deep Learning for Engineers and Scientists; Springer: Cham, Switzerland, 2021. [Google Scholar] [CrossRef]
  94. Hunter, J.D. Matplotlib: A 2D Graphics Environment. Comput. Sci. Eng. 2007, 9, 90–95. [Google Scholar] [CrossRef]
  95. Hunt, J. Introduction to Matplotlib. In Advanced Guide to Python 3 Programming; Springer: Cham, Switzerland, 2019. [Google Scholar] [CrossRef]
  96. McKinney, W. Data Structures for Statistical Computing in Python. In Proceedings of the 9th Python in Science Conference, Austin, TX, USA, 28 June–3 July 2010; pp. 56–61. [Google Scholar] [CrossRef]
  97. Burns, H. Crowdsourced-Data Normalization with Python and Pandas. Program. Hist. 2021. [Google Scholar] [CrossRef]
  98. Feurer, M.; Eggensperger, K.; Falkner, S.; Lindauer, M.; Hutter, F. Auto-Sklearn 2.0: The Next Generation. arXiv 2020, arXiv:2007.04074. [Google Scholar] [CrossRef]
  99. Li, P. Research on Radar Signal Recognition Based on Automatic Machine Learning. Neural Comput. Appl. 2019, 32, 1959–1969. [Google Scholar] [CrossRef]
  100. Liu, Z.; Cui, Y.; Chan, A. Improve Generalization and Robustness of Neural Networks via Weight Scale Shifting Invariant Regularizations. arXiv 2020, arXiv:2008.02965. [Google Scholar] [CrossRef]
  101. Dubey, S.R.; Chakraborty, S.; Mukherjee, S.; Singh, S.K.; Chaudhuri, B.B.; Roy, S.K. diffGrad: An Optimization Method for Convolutional Neural Networks. IEEE Trans. Neural Netw. Learn. Syst. 2020, 31, 4500–4511. [Google Scholar] [CrossRef]
  102. Netrapalli, P. Stochastic Gradient Descent and Its Variants in Machine Learning. J. Indian Inst. Sci. 2019, 99, 201–213. [Google Scholar] [CrossRef]
  103. Ghojogh, B.; Crowley, M. The Theory Behind Overfitting, Cross Validation, Regularization, Bagging, and Boosting: Tutorial. arXiv 2019, arXiv:1905.12787. [Google Scholar] [CrossRef]
  104. Ying, X. An Overview of Overfitting and Its Solutions. J. Phys. Conf. Ser. 2019, 1168, 022022. [Google Scholar] [CrossRef]
  105. Fuentes, S.; Viejo, C.G.; Tongson, E.; Lipovetzky, N.; Dunshea, F.R. Biometric Physiological Responses from Dairy Cows Measured by Visible Remote Sensing Are Good Predictors of Milk Productivity and Quality Through Artificial Intelligence. Sensors 2021, 21, 6844. [Google Scholar] [CrossRef] [PubMed]
  106. Correndo, A.A.; Hefley, T.J.; Holzworth, D.P.; Ciampitti, I.A. Revisiting Linear Regression to Test Agreement in Continuous Predicted-Observed Datasets. Agric. Syst. 2021, 192, 103194. [Google Scholar] [CrossRef]
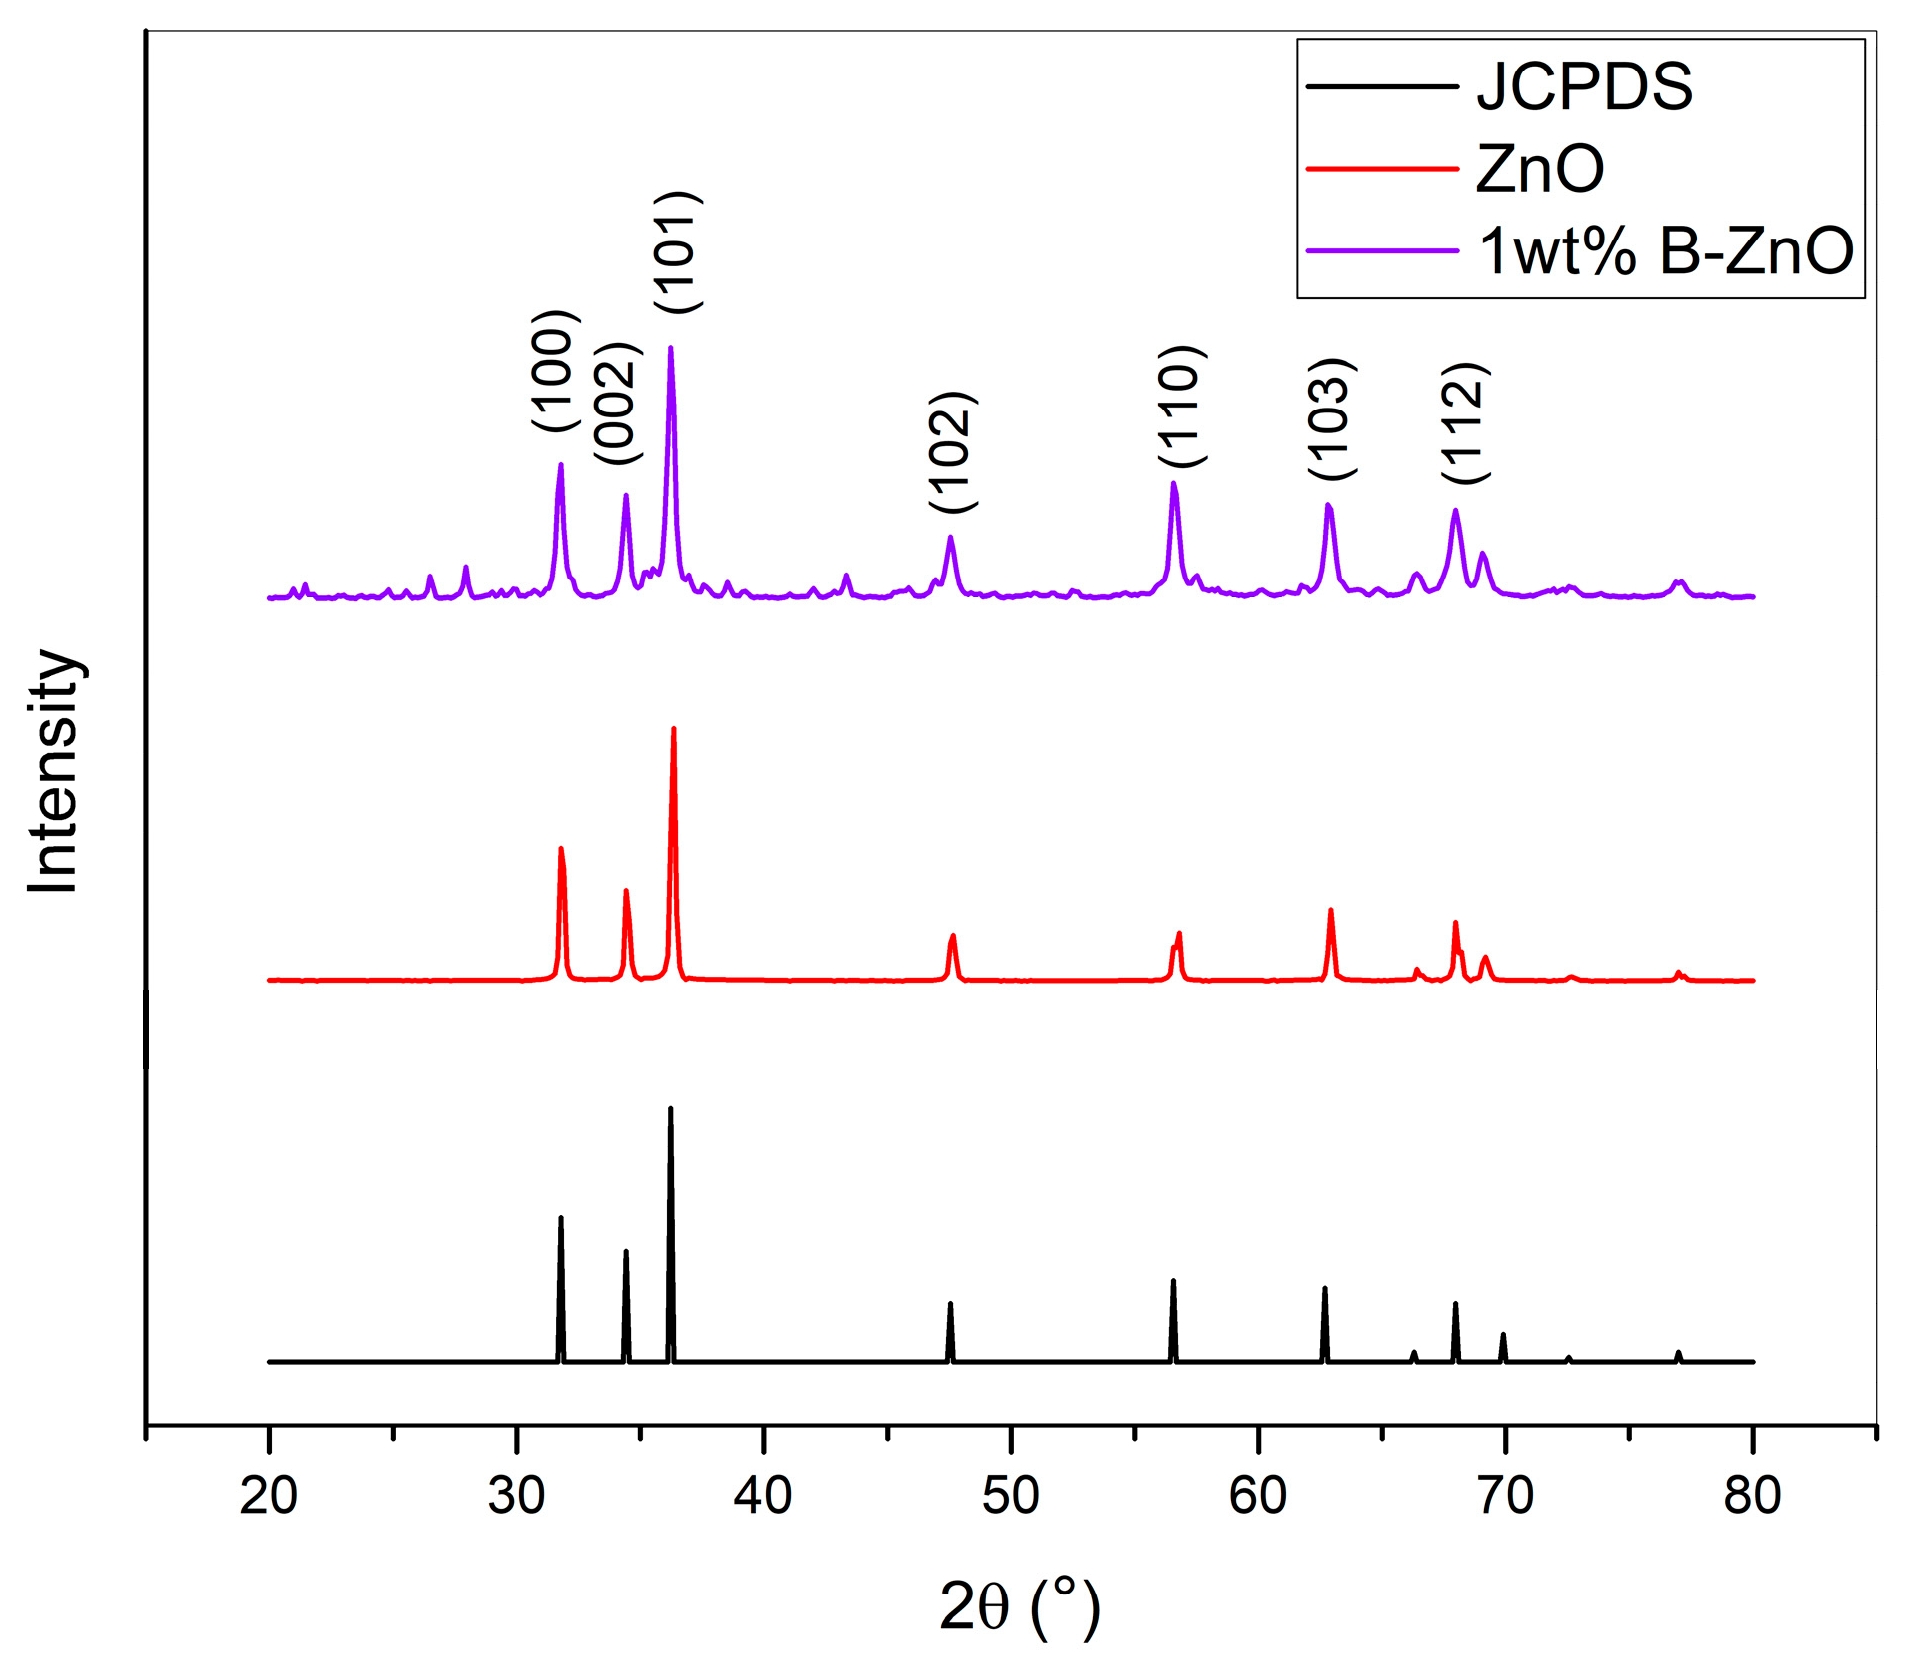
Figure 1. XRD patterns of pure ZnO and 1 wt% B-doped ZnO nanostructures alongside the standard JCPDS reference pattern.
Processes 13 02240 g001
Figure 2. SEM images of samples synthesized at 700 °C: (a) ZnO NP; (b) 1 wt% B-ZnO NP; EDX spectra of synthesized samples: (c) ZnO NP; (d) 1 wt% B-ZnO NP.
Processes 13 02240 g002
Figure 3. Photocatalytic degradation efficiency of undoped ZnO synthesized at variable calcination temperatures (A) and boron-doped ZnO nanoparticles synthesized at variable calcination temperatures (B) at various calcination temperatures and doping levels.
Processes 13 02240 g003
Figure 4. (a) Impact of increased boron doping on photocatalytic efficiency of ZnO nanoparticles calcined at 700 °C; (b) kinetic analysis of photocatalytic degradation using undoped and boron-doped ZnO nanoparticles calcined at 700 °C.
Processes 13 02240 g004
Figure 5. FFNN architecture chosen for the prediction of the results.
Processes 13 02240 g005
Scheme 1. Python code.
Processes 13 02240 sch001
Figure 6. Convergence of training and validation loss over epochs for neural network optimization.
Processes 13 02240 g006
Figure 7. Regression analysis for predictive modeling of photocatalytic degradation efficiency: (A) Training and (B) testing data comparison.
Processes 13 02240 g007aProcesses 13 02240 g007b
Figure 8. Regression plot of the model prediction on new data.
Processes 13 02240 g008
Table 1. Structural parameters of the analyzed NP samples synthesized at 700 °C.
Sampleα (Å)c (Å)c/αRD (nm)d (nm)V (Å3)
ZnO3.24275.19811.601.018745.050.285547.33
1 wt%B-ZnO3.25125.20771.601.019526.440.286047.67
SampleL (nm)uε∙10−3α*δ∙10−3 (nm−2)APF (%)
ZnO1.97380.37970.660.00070.492775.3945
1 wt%B-ZnO1.97850.37991.140.00131.430575.4528
Table 2. Values of the output parameter “Target” (degradation efficiency of methyl orange).
Experimental Data Used for Target Predictions
Input 1Input 2Input 3Input 4Target
(Experimental)
Target Predictions Estimated by Python Script
2.506004585.8083.44
2.506006087.0987.92
2.516001548.7550.42
2.516003070.3673.78
2.516004585.4486.83
2.516006093.2193.92
2.507001541.8845.56
2.507003070.7874.98
2.507004585.5486.60
2.507006089.8889.33
Disclaimer/Publisher’s Note: The statements, opinions and data contained in all publications are solely those of the individual author(s) and contributor(s) and not of MDPI and/or the editor(s). MDPI and/or the editor(s) disclaim responsibility for any injury to people or property resulting from any ideas, methods, instructions or products referred to in the content.