
A Novel Approach for Voltage Stability Assessment and Optimal Siting and Sizing of DGs in Radial Power Distribution Networks


Abstract
1. Introduction
- Introduction of the novel distribution voltage stability index (NDVSI): This paper presents a newly developed voltage stability index, NDVSI, specifically created to assess the voltage stability within radial distribution networks. The index is tested on three well-known IEEE benchmark systems (12-bus, 33-bus, and 69-bus) to validate its performance and effectiveness. For validation and benchmarking purposes, the proposed NDVSI is compared against several well-established stability indices reported in the literature, highlighting its improved sensitivity, accuracy, and ability to identify weak buses more effectively.
- Identification of Candidate Buses for DG Integration: The proposed NDVSI is utilized alongside a systematic search technique to identify the most suitable buses for integrating distributed generation units into the network. This approach focuses on locating weak buses with low stability margins and their neighboring nodes, ensuring that DG units are placed where they can provide the greatest support in enhancing voltage stability and lowering power losses.
- Comparative Evaluation of the Proposed DG Siting and Sizing Method: To verify the performance of the suggested method for identifying the most efficient placement and size of distributed generation units, its outcomes are evaluated against those obtained from several previously published techniques. This comparative analysis demonstrates the proposed method’s practical applicability, accuracy, and advantages in enhancing voltage stability and reducing power losses in radial distribution systems.
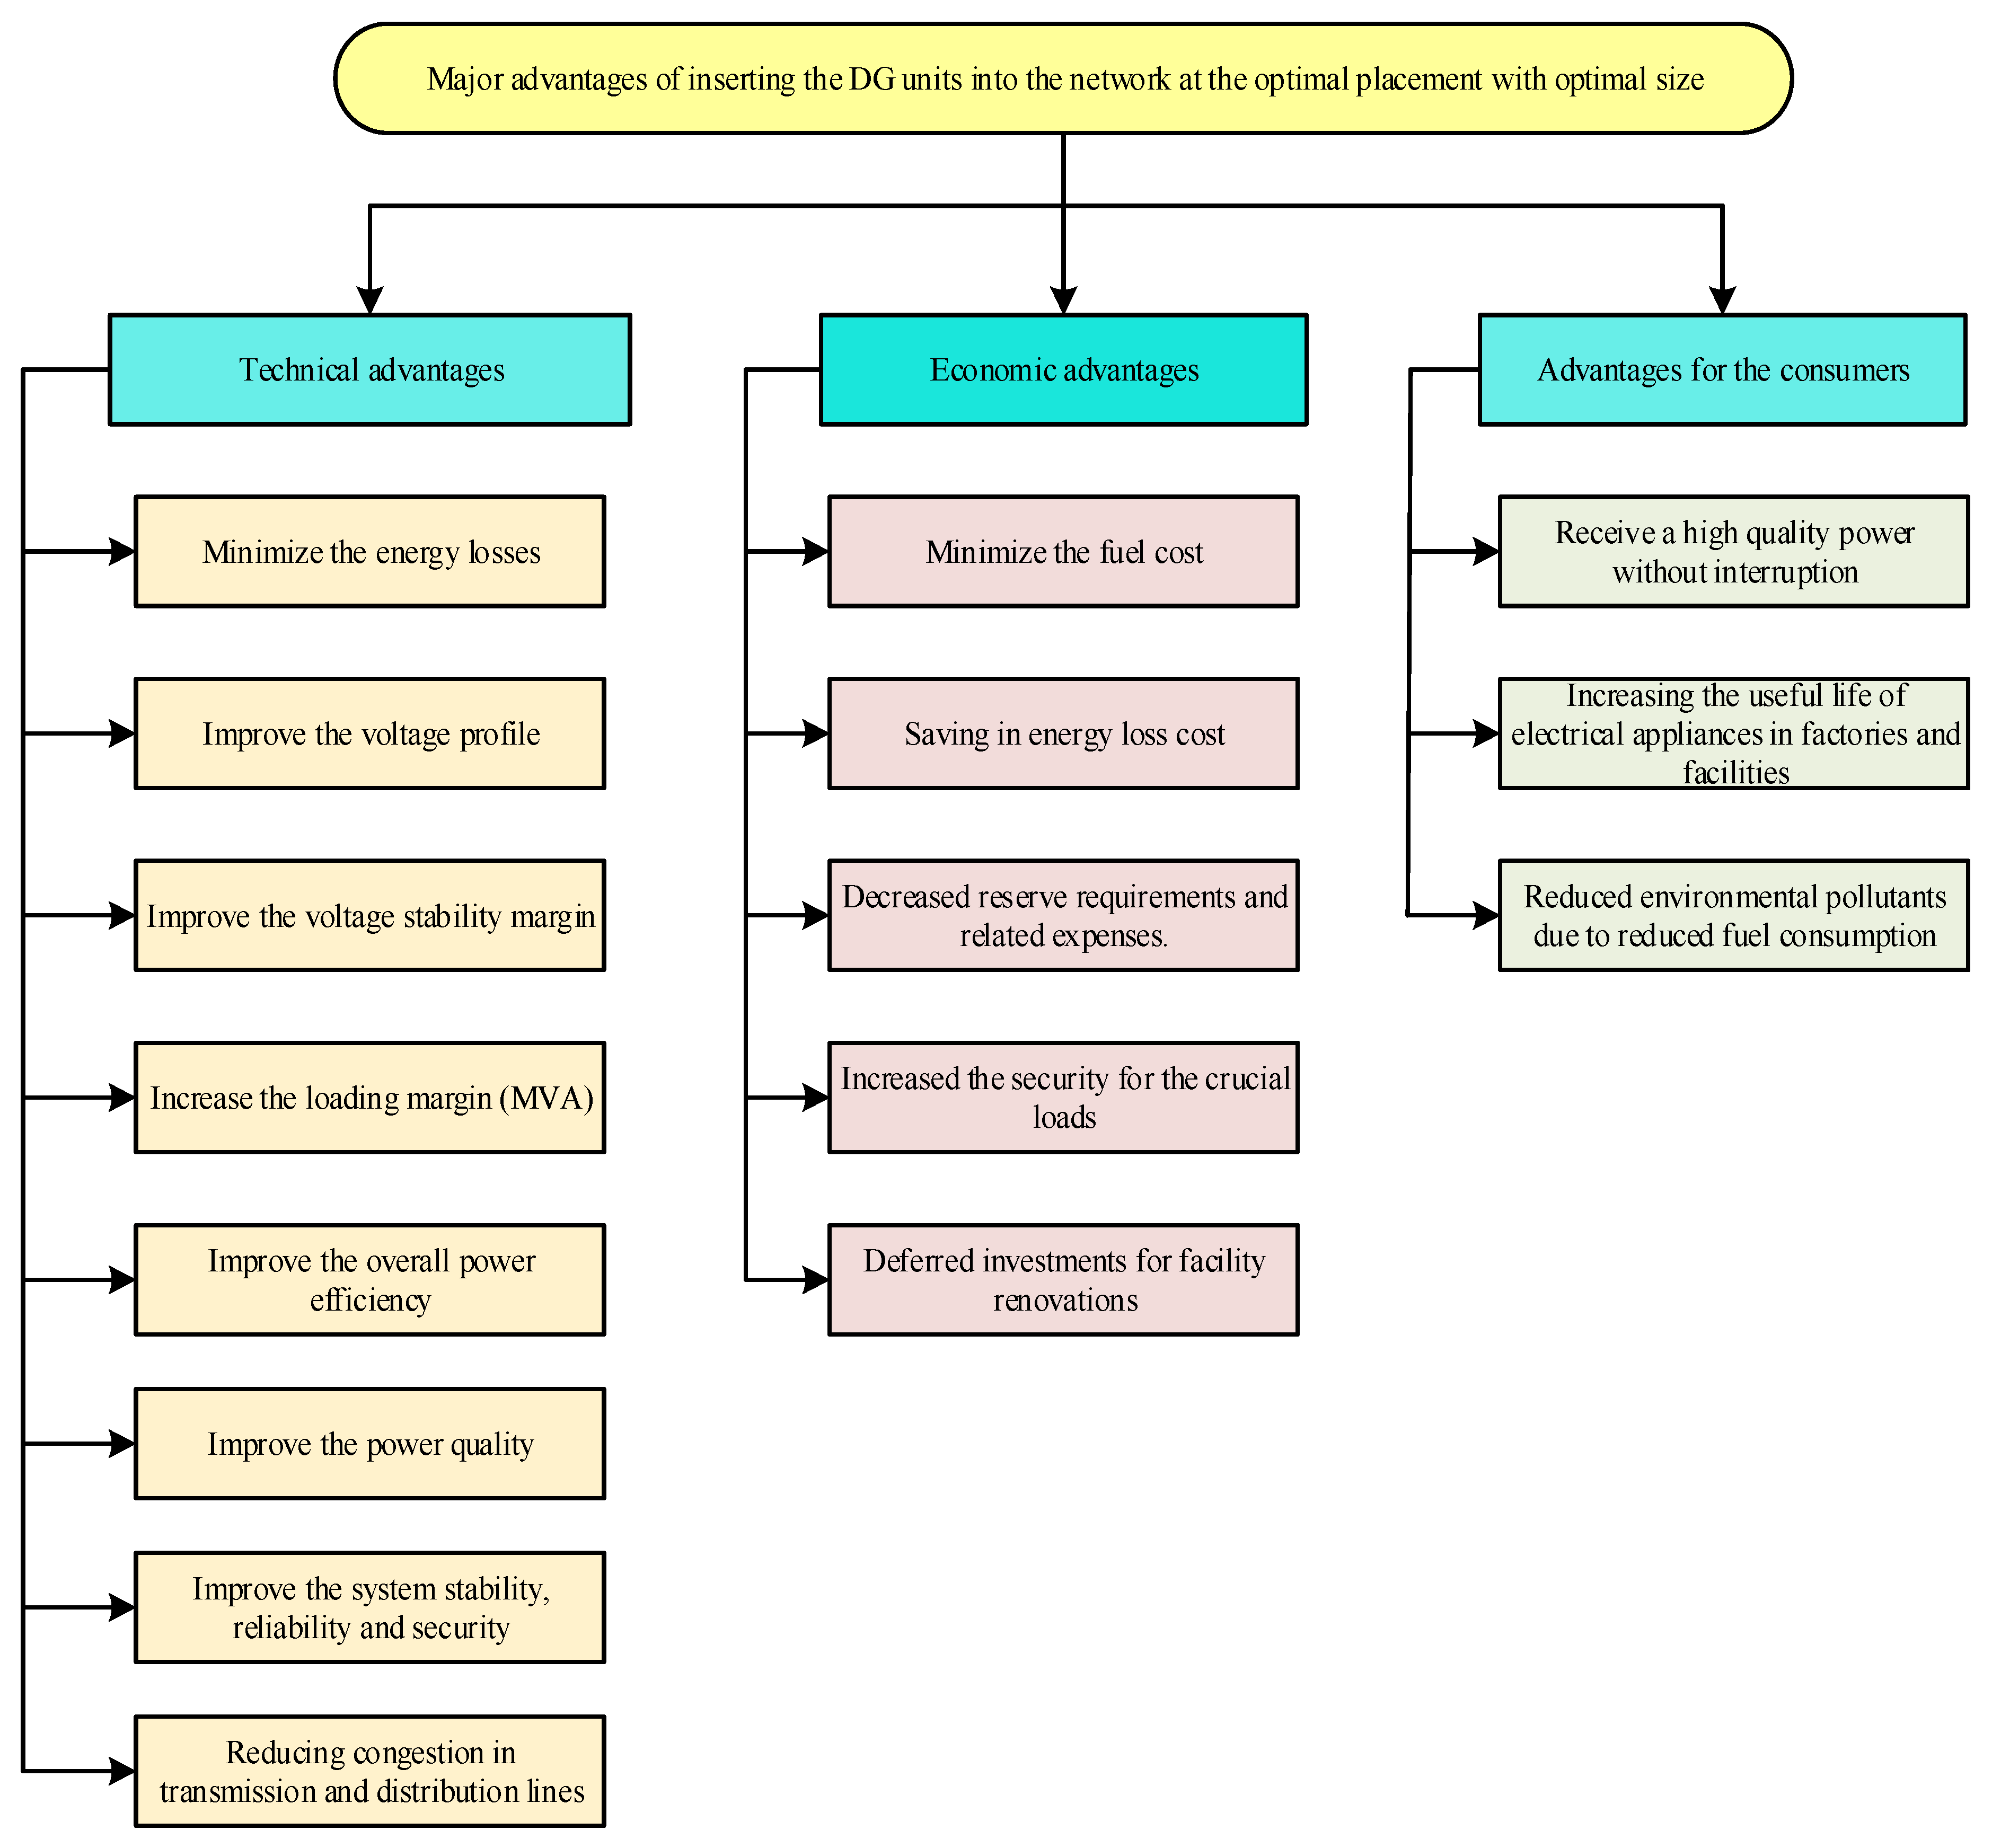
- The proposed method improves the distribution systems technically and economically.
2. Methodology for Voltage Stability Assessment and Optimal Placement and Sizing of DGs
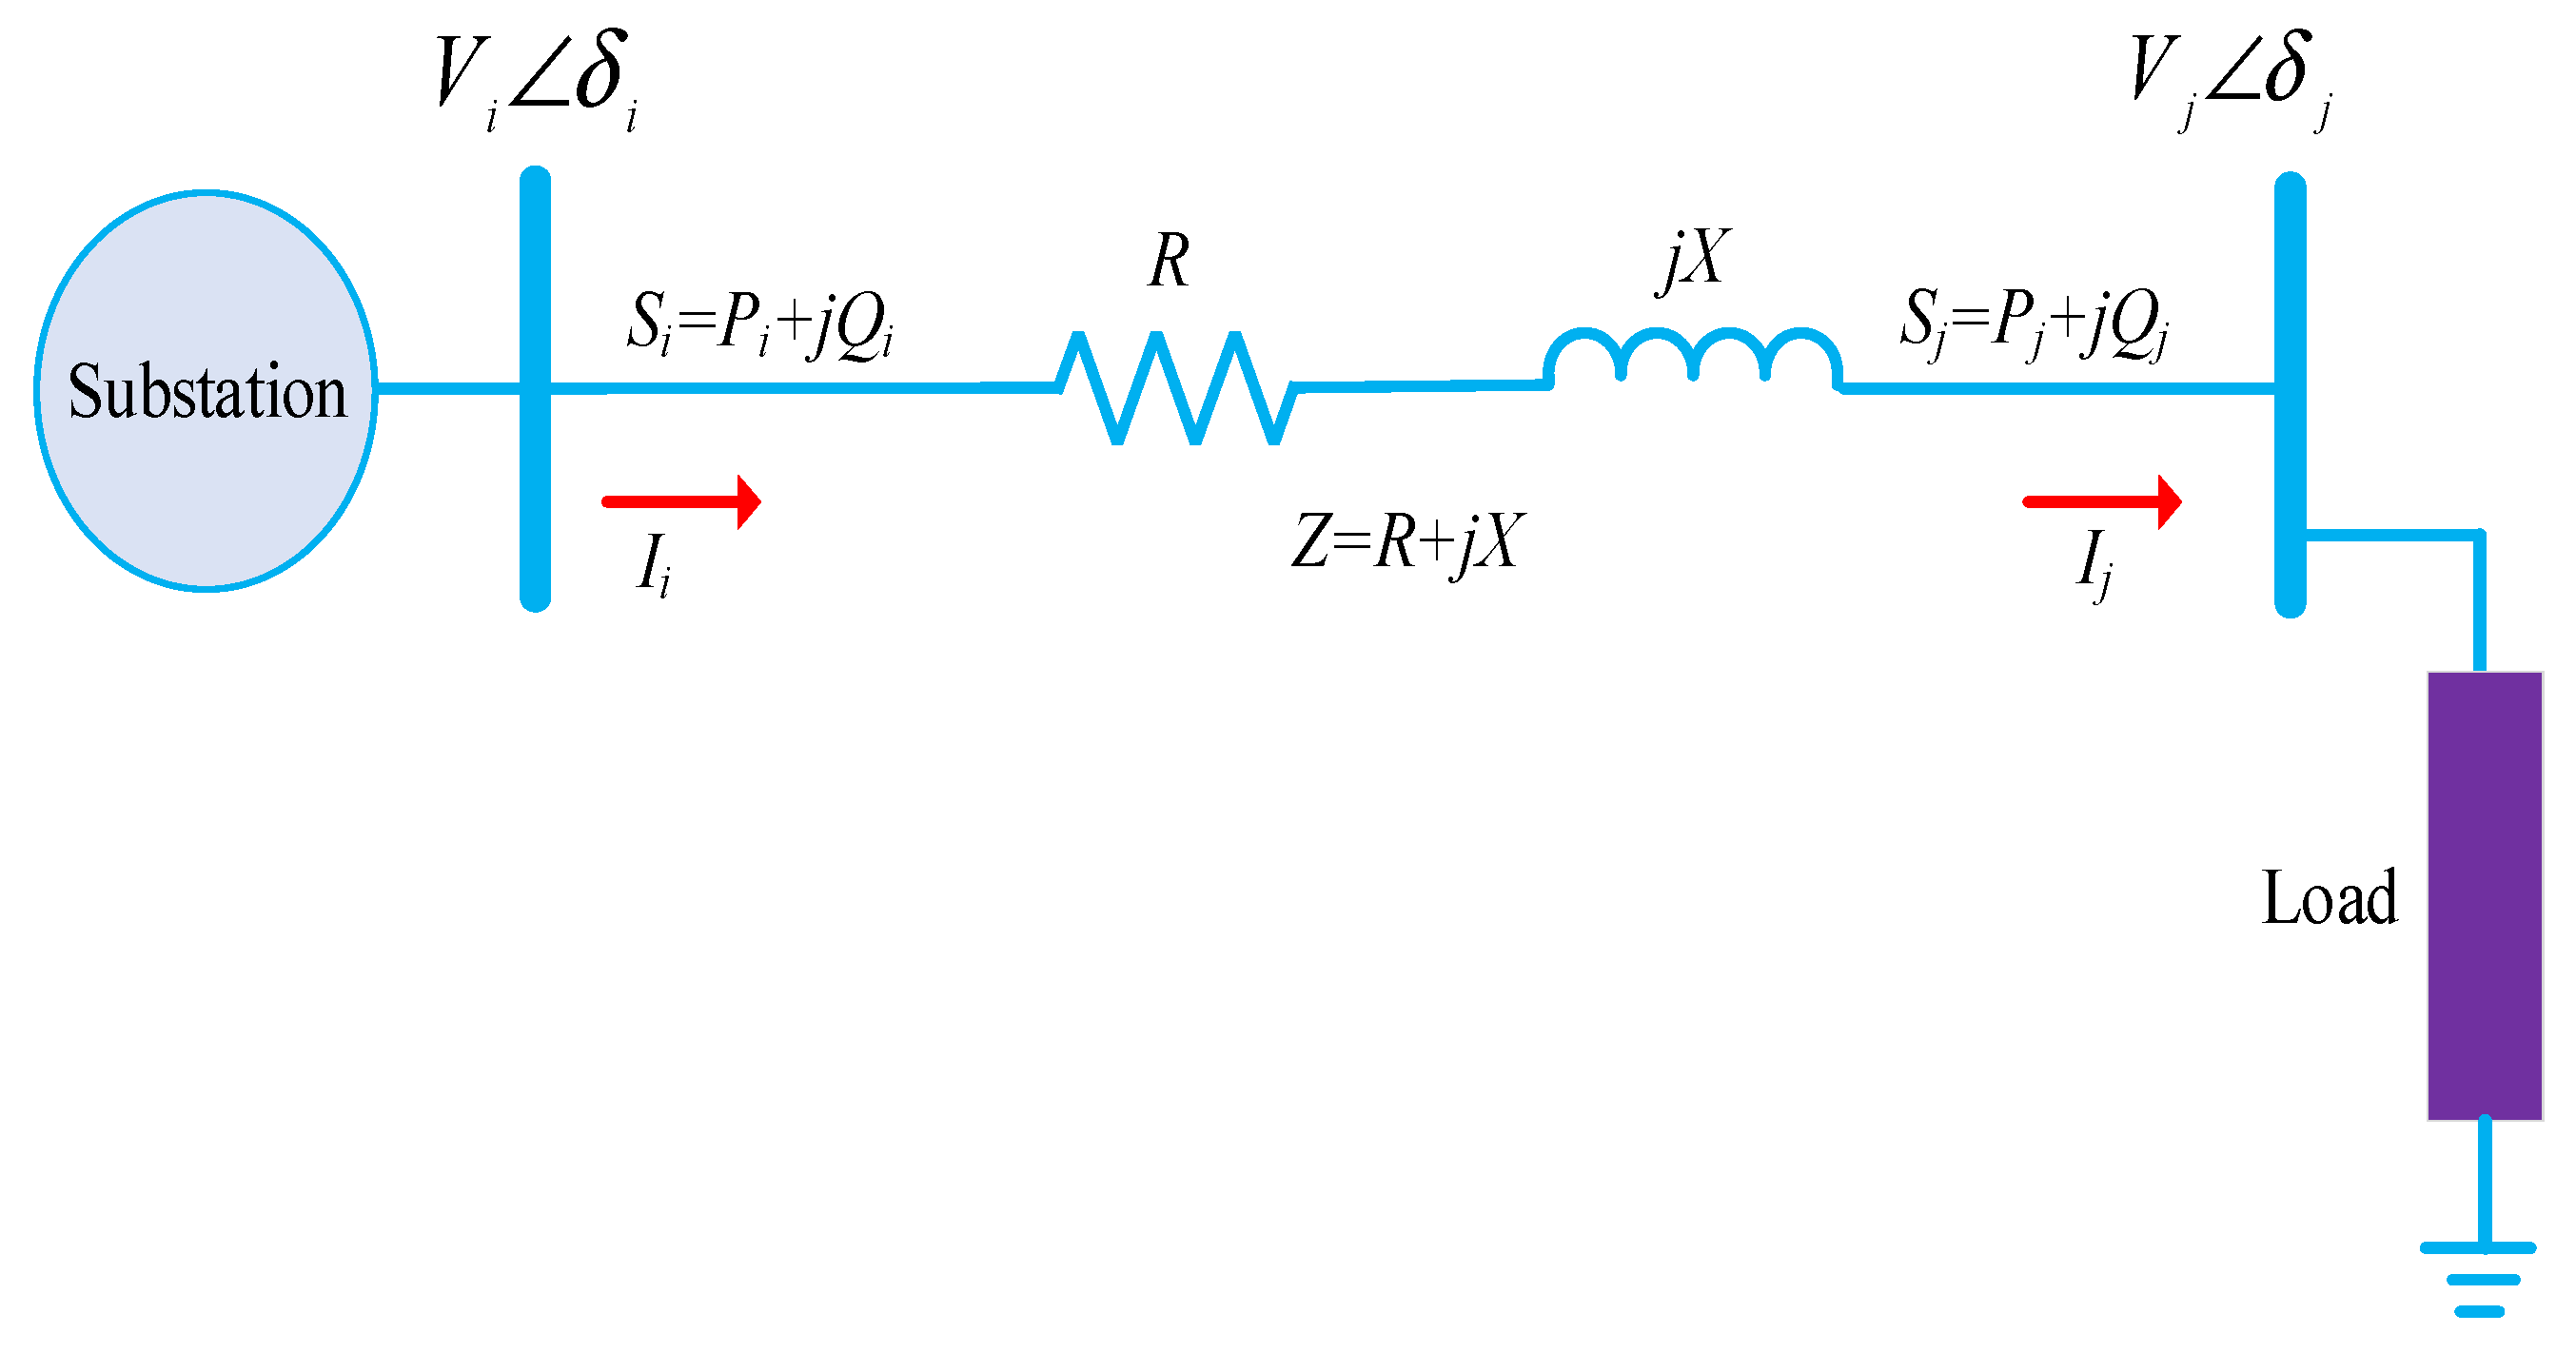
2.1. Comparison of Conventional and Proposed VSIs for Voltage Stability Assessment
2.2. Formulation of the Proposed Index (NDVSI)
2.3. Voltage Stability Assessment
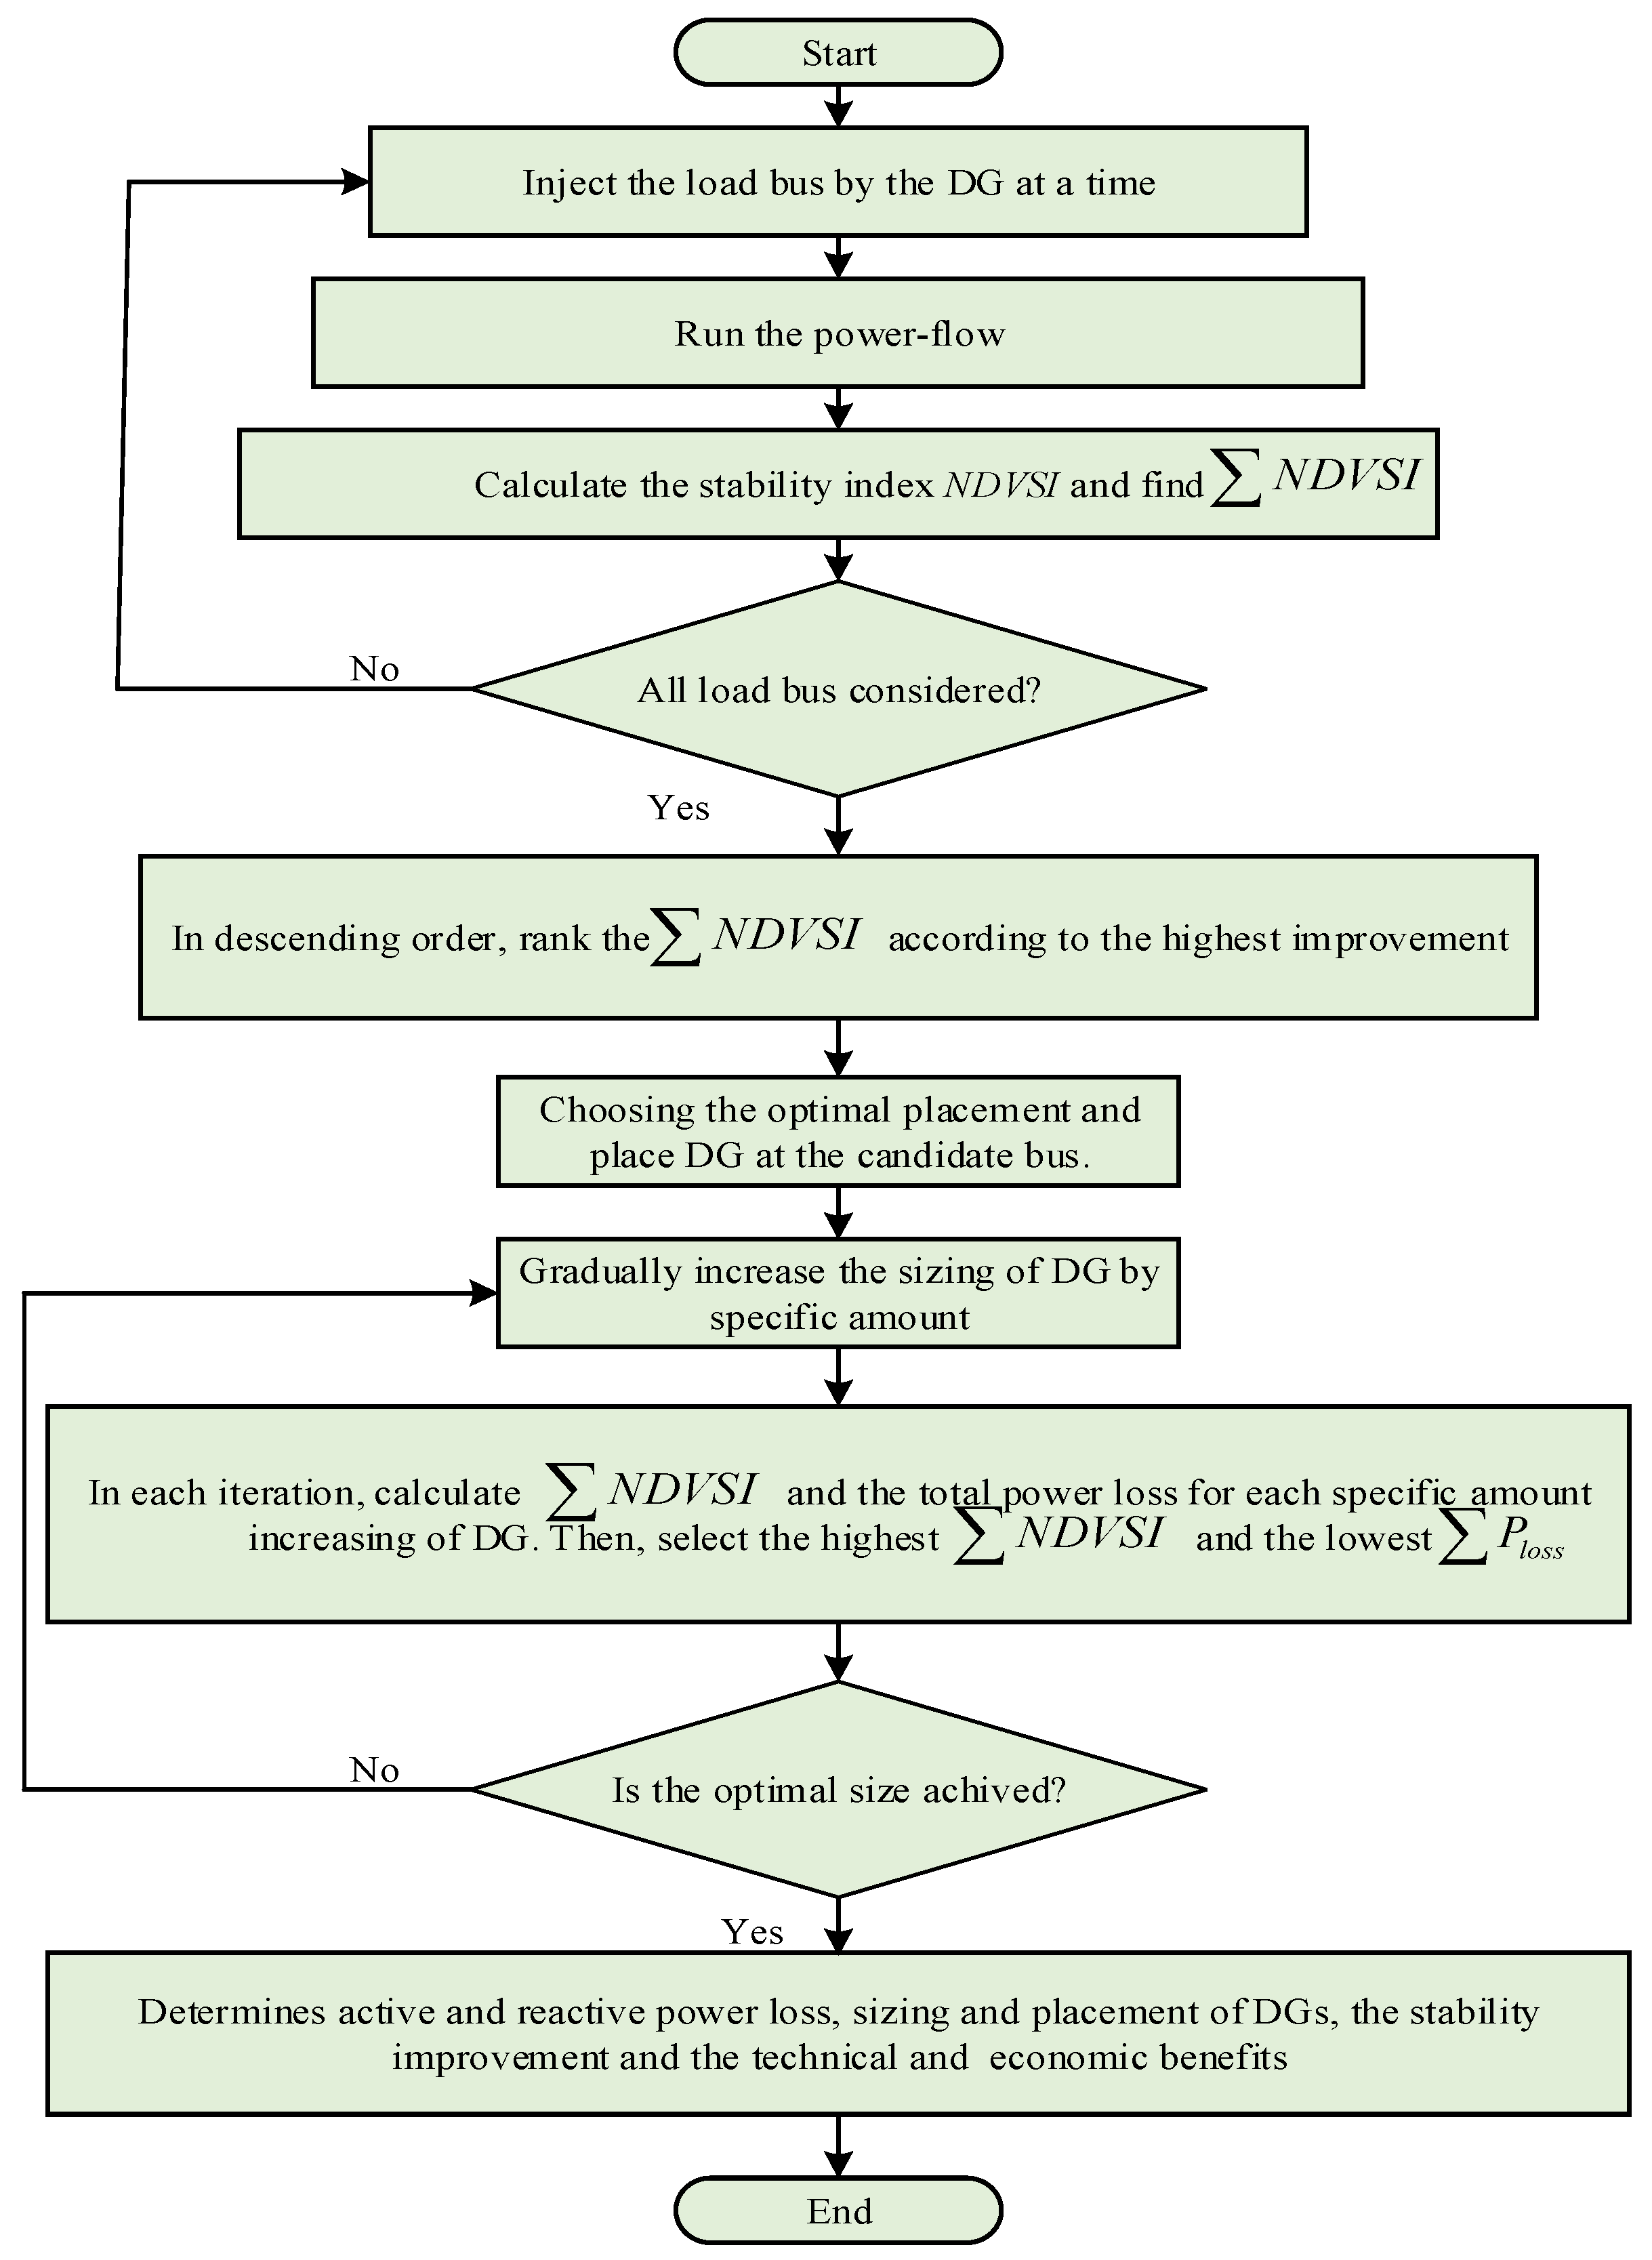
2.4. Indicating the Suitable Size and Siting of DGs
- Inject the load bus by the DG at a time.
- Execute load flow and analyze the obtained results.
- Compute the proposed index and find .
- Check all the load buses (PQ), excluding the slack bus.
- Rank the according to the highest improvement.
- Select the optimal placement and size of the DG at the candidate bus, taking into account the weak nodes and their neighboring buses in terms of voltage stability.
- Gradually increase the DG size, ensuring the voltage at the DG-installed bus does not exceed 1.05 p.u. Adjust and resize each unit accordingly using this approach for multiple DG units.
- The analytical method and search technique are utilized to obtain the maximum stability margin (max ) and minimum total energy loss (min ) for each DG size, i.e., choose the NDVSI with the highest value and the total loss with the lowest value.
- Modify the DG using different power factors.
- For validation, compare the findings obtained from the proposed approach with those from existing research in the literature.
- Record the placement and sizing of DG units, and assess the improvements resulting from their integration into the system, such as voltage profile, power loss reduction, energy cost savings, stability enhancement , DG power cost, the percentage decrease in power supplied to the system from the substation, the cost of power provided from DGs, and the percentage of decrease in power supplied to the system from the substation.
2.5. Cost of Energy Loss and Cost of Active and Reactive Power of DGs
- Energy loss cost (ELC)
- Cost of Active and Reactive Power Generation from DG
3. Case Studies and Simulation Analysis
3.1. Stability Assessment of IEEE 12-, 33-, and 69-Bus Under Different Load Conditions
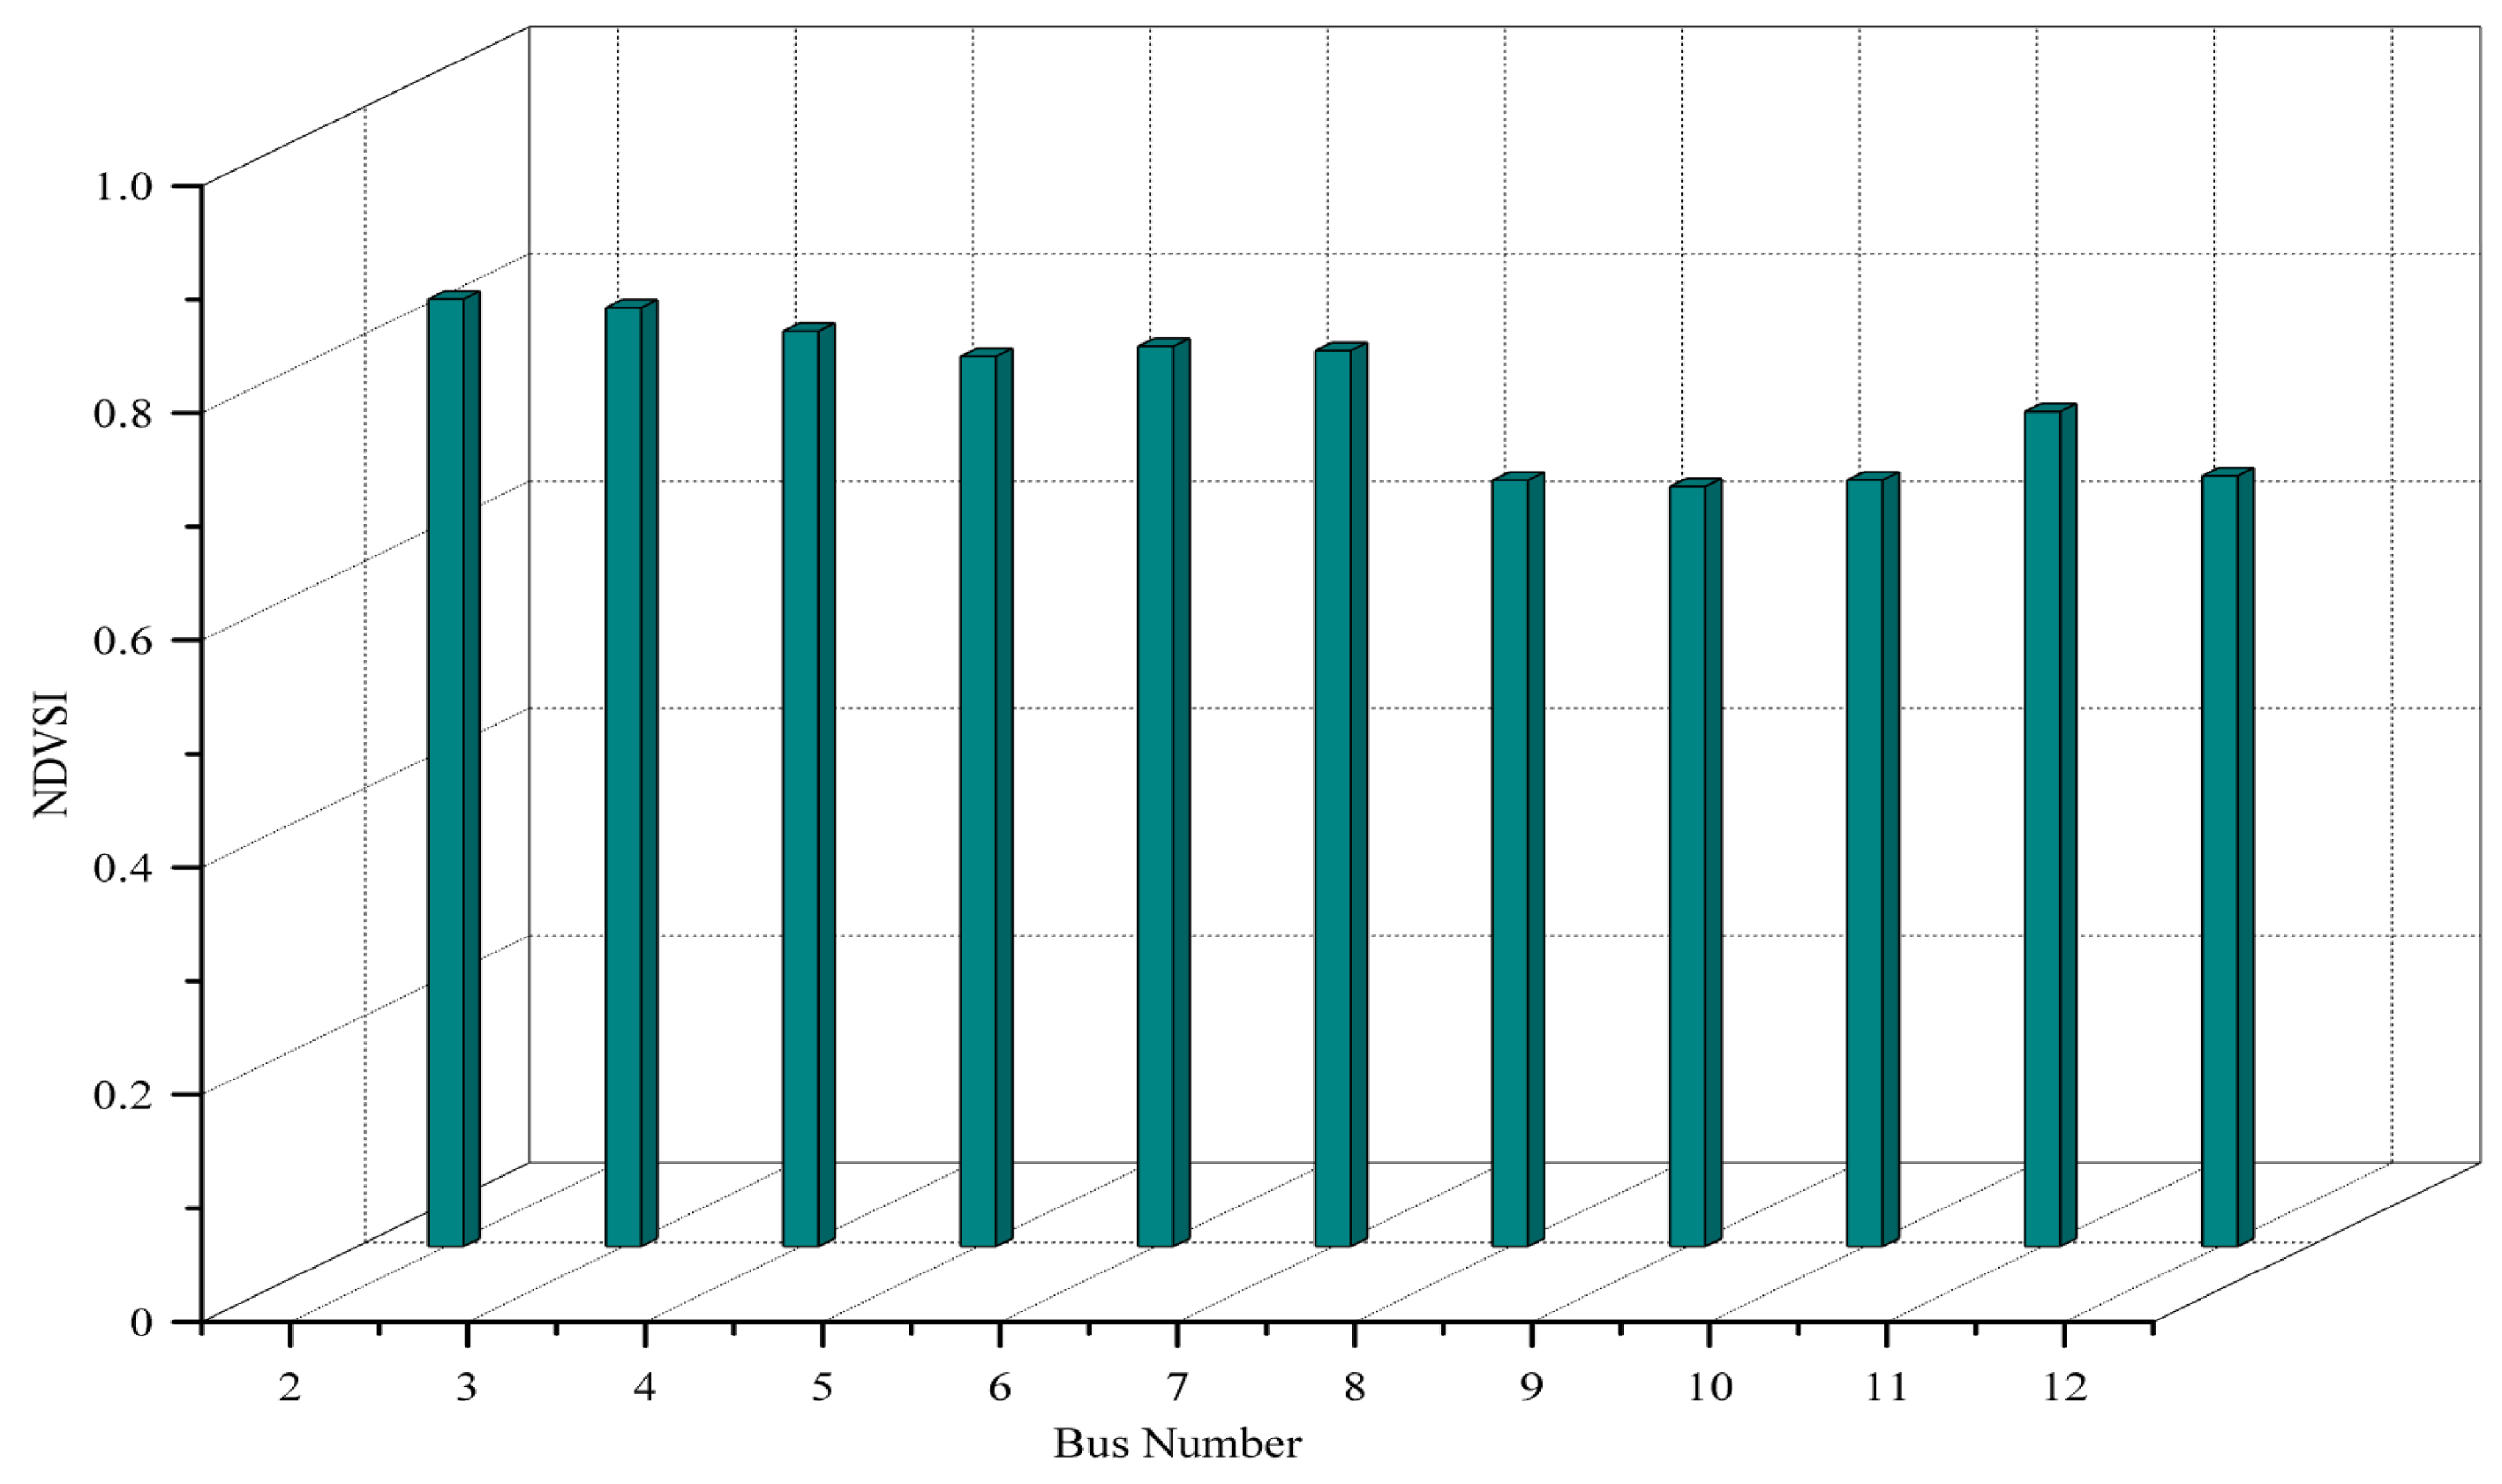
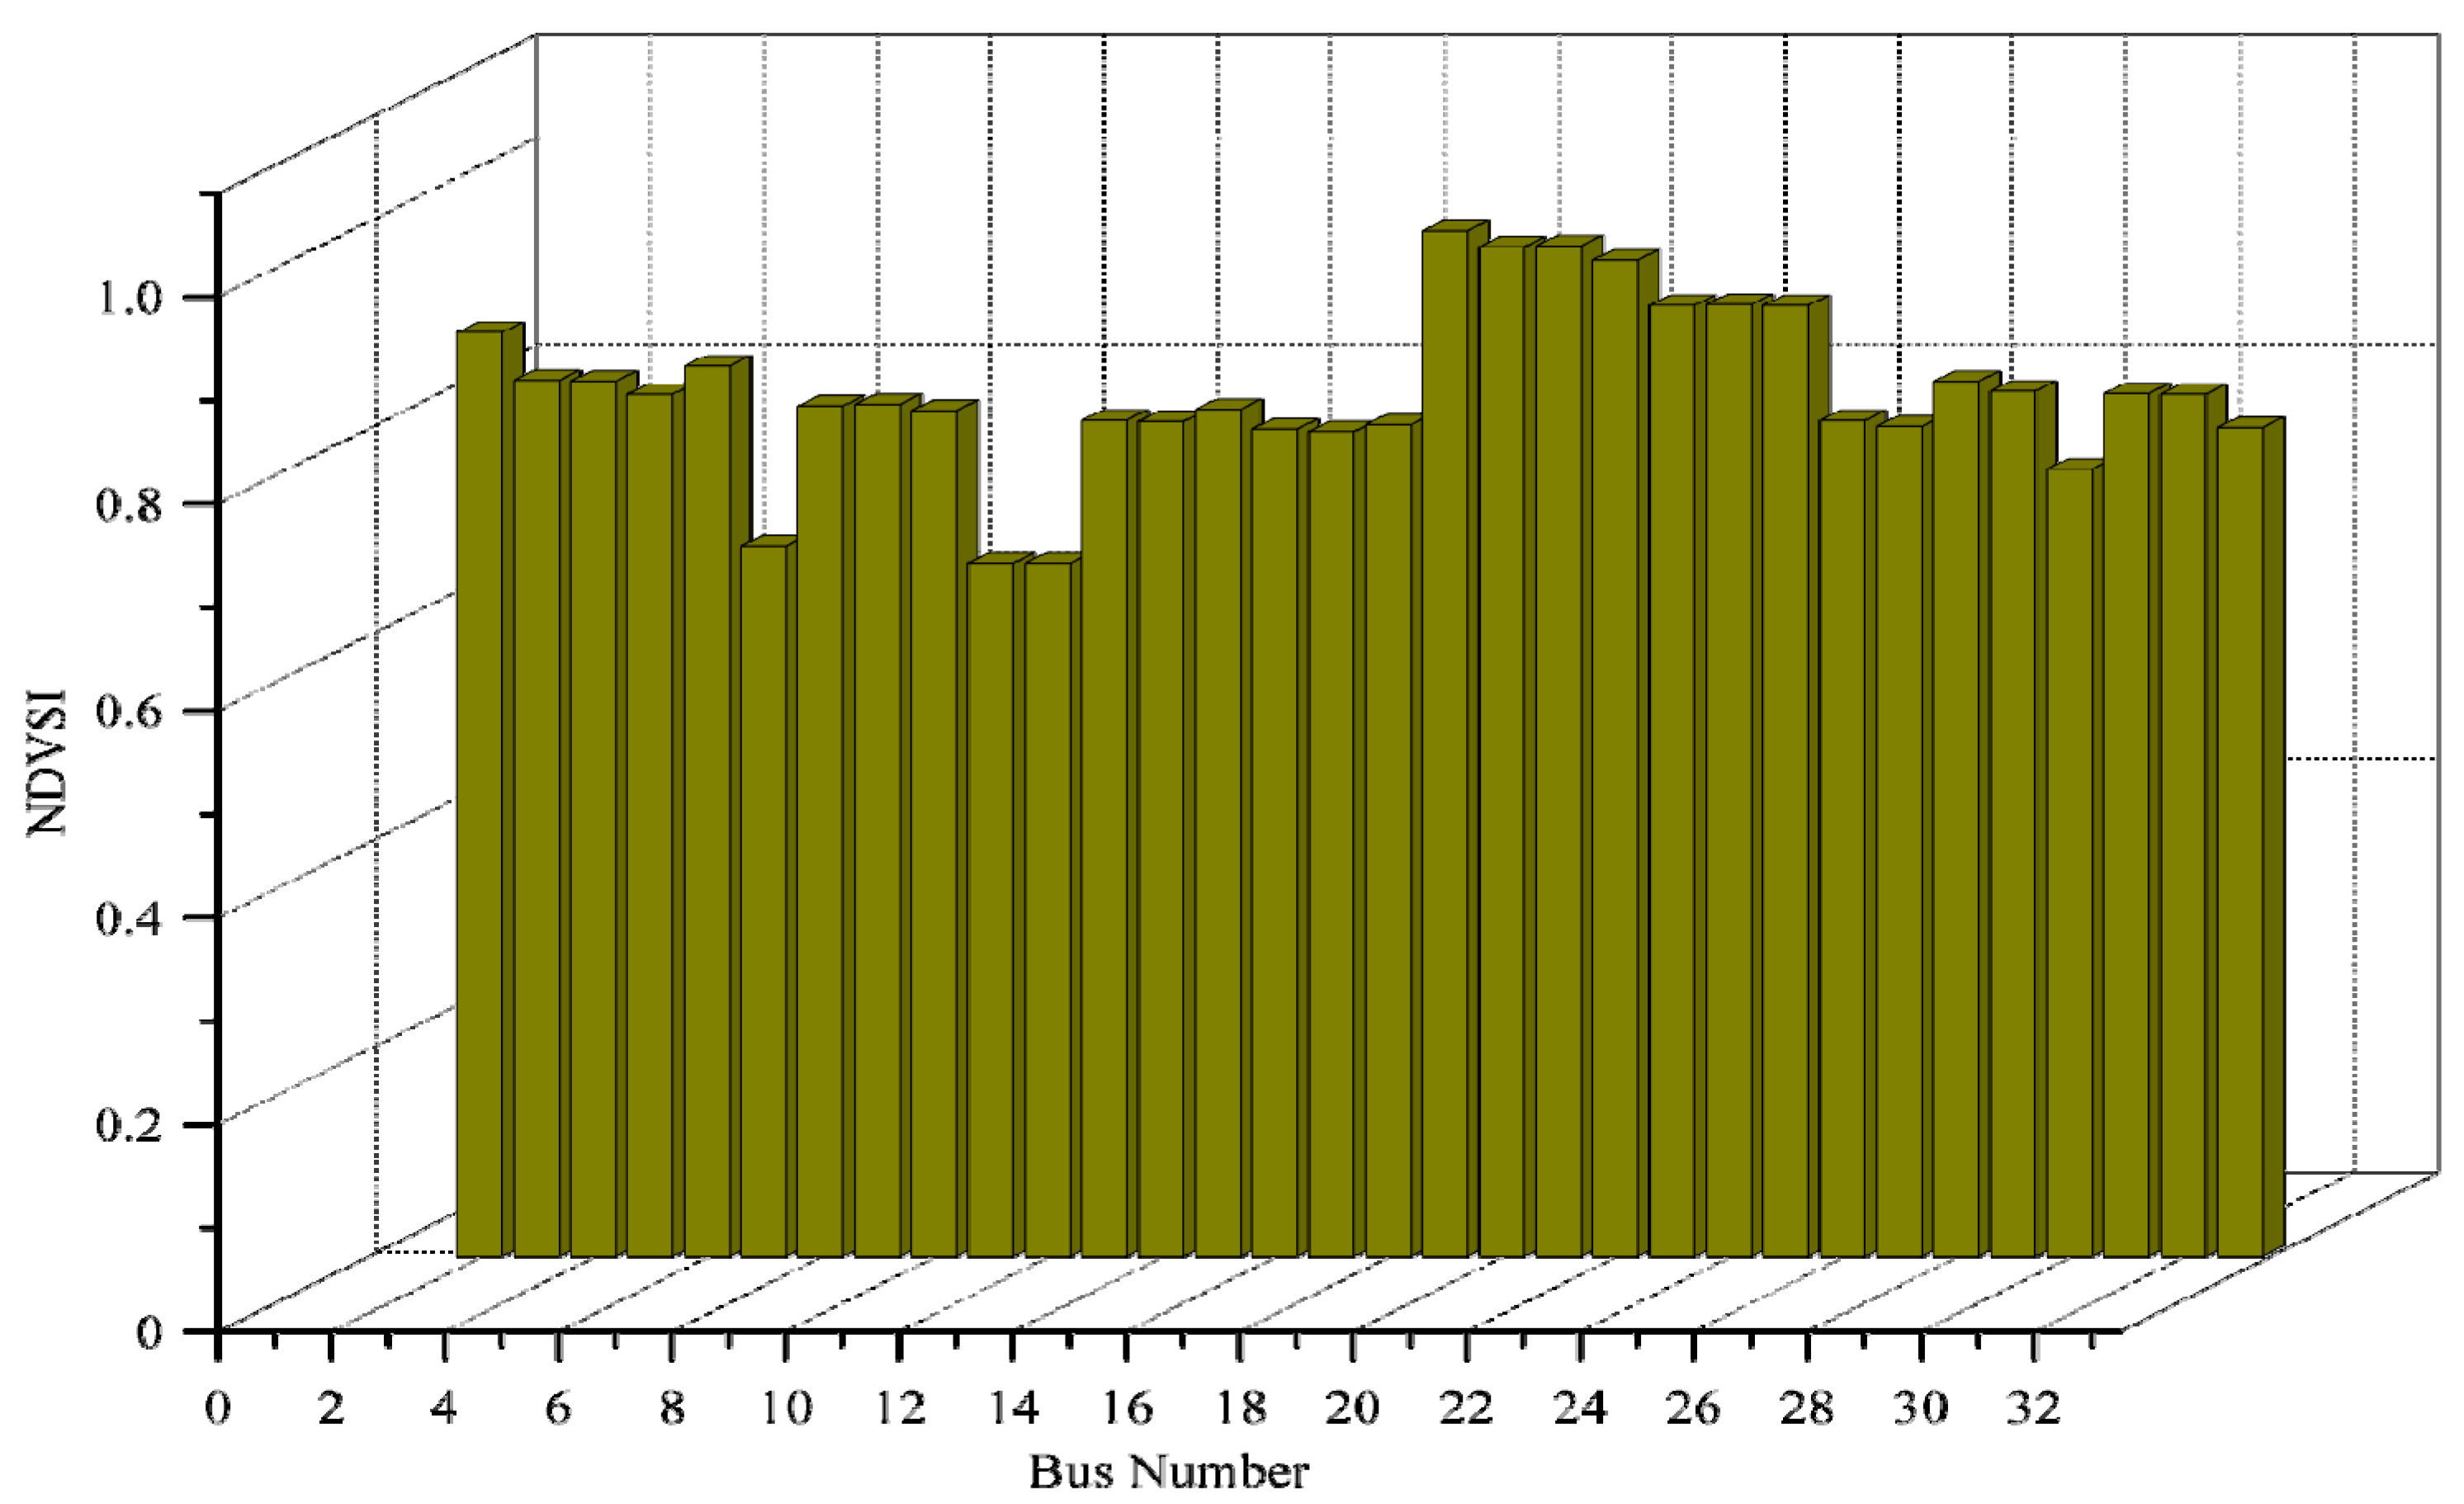
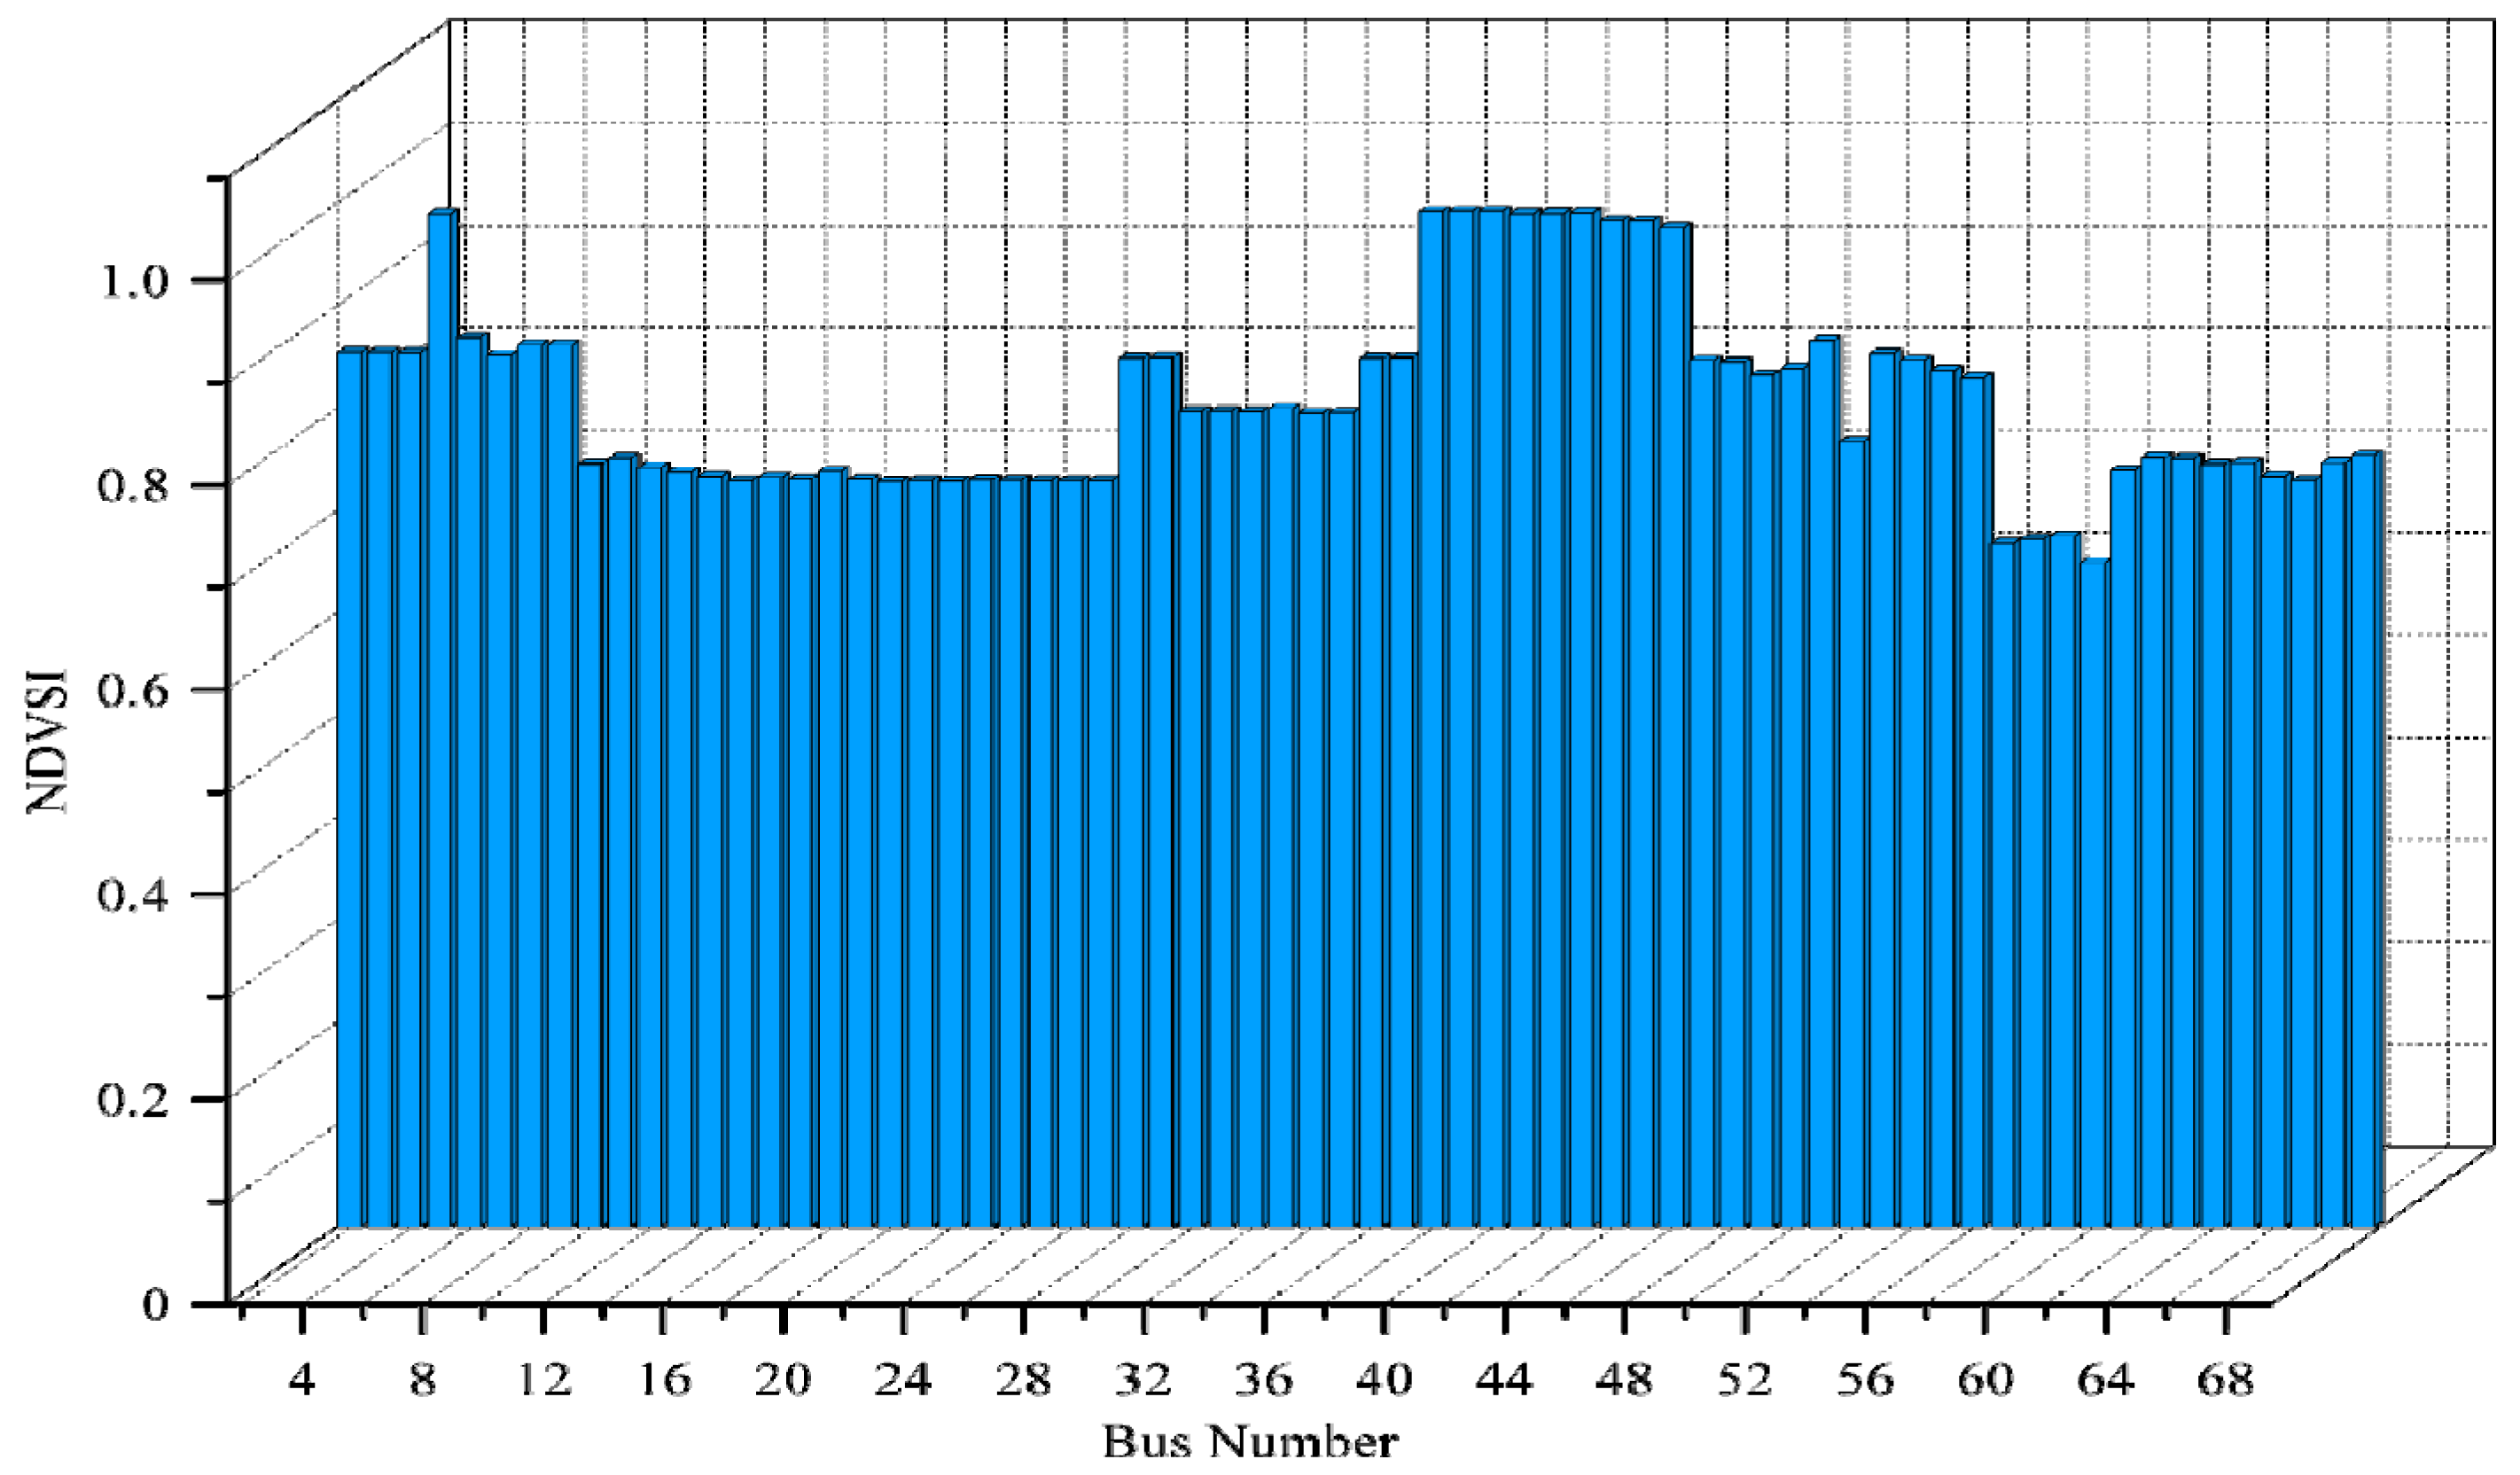
3.1.1. Stability Analysis of IEEE 12-, 33-, and 69-Bus Test Networks at Base Load Condition
3.1.2. Voltage Stability Evaluation of IEEE 12-, 33-, and 69-Bus Test Systems Under High Loading Conditions
3.1.3. IEEE 12-, 33-, and 69-Bus Test Systems at Multiple Power Loadings for Loading Margin (MVA) Identification
3.2. Integration of Optimal DG Placement and Sizing in Radial Power Grids
3.2.1. IEEE 12 Bus
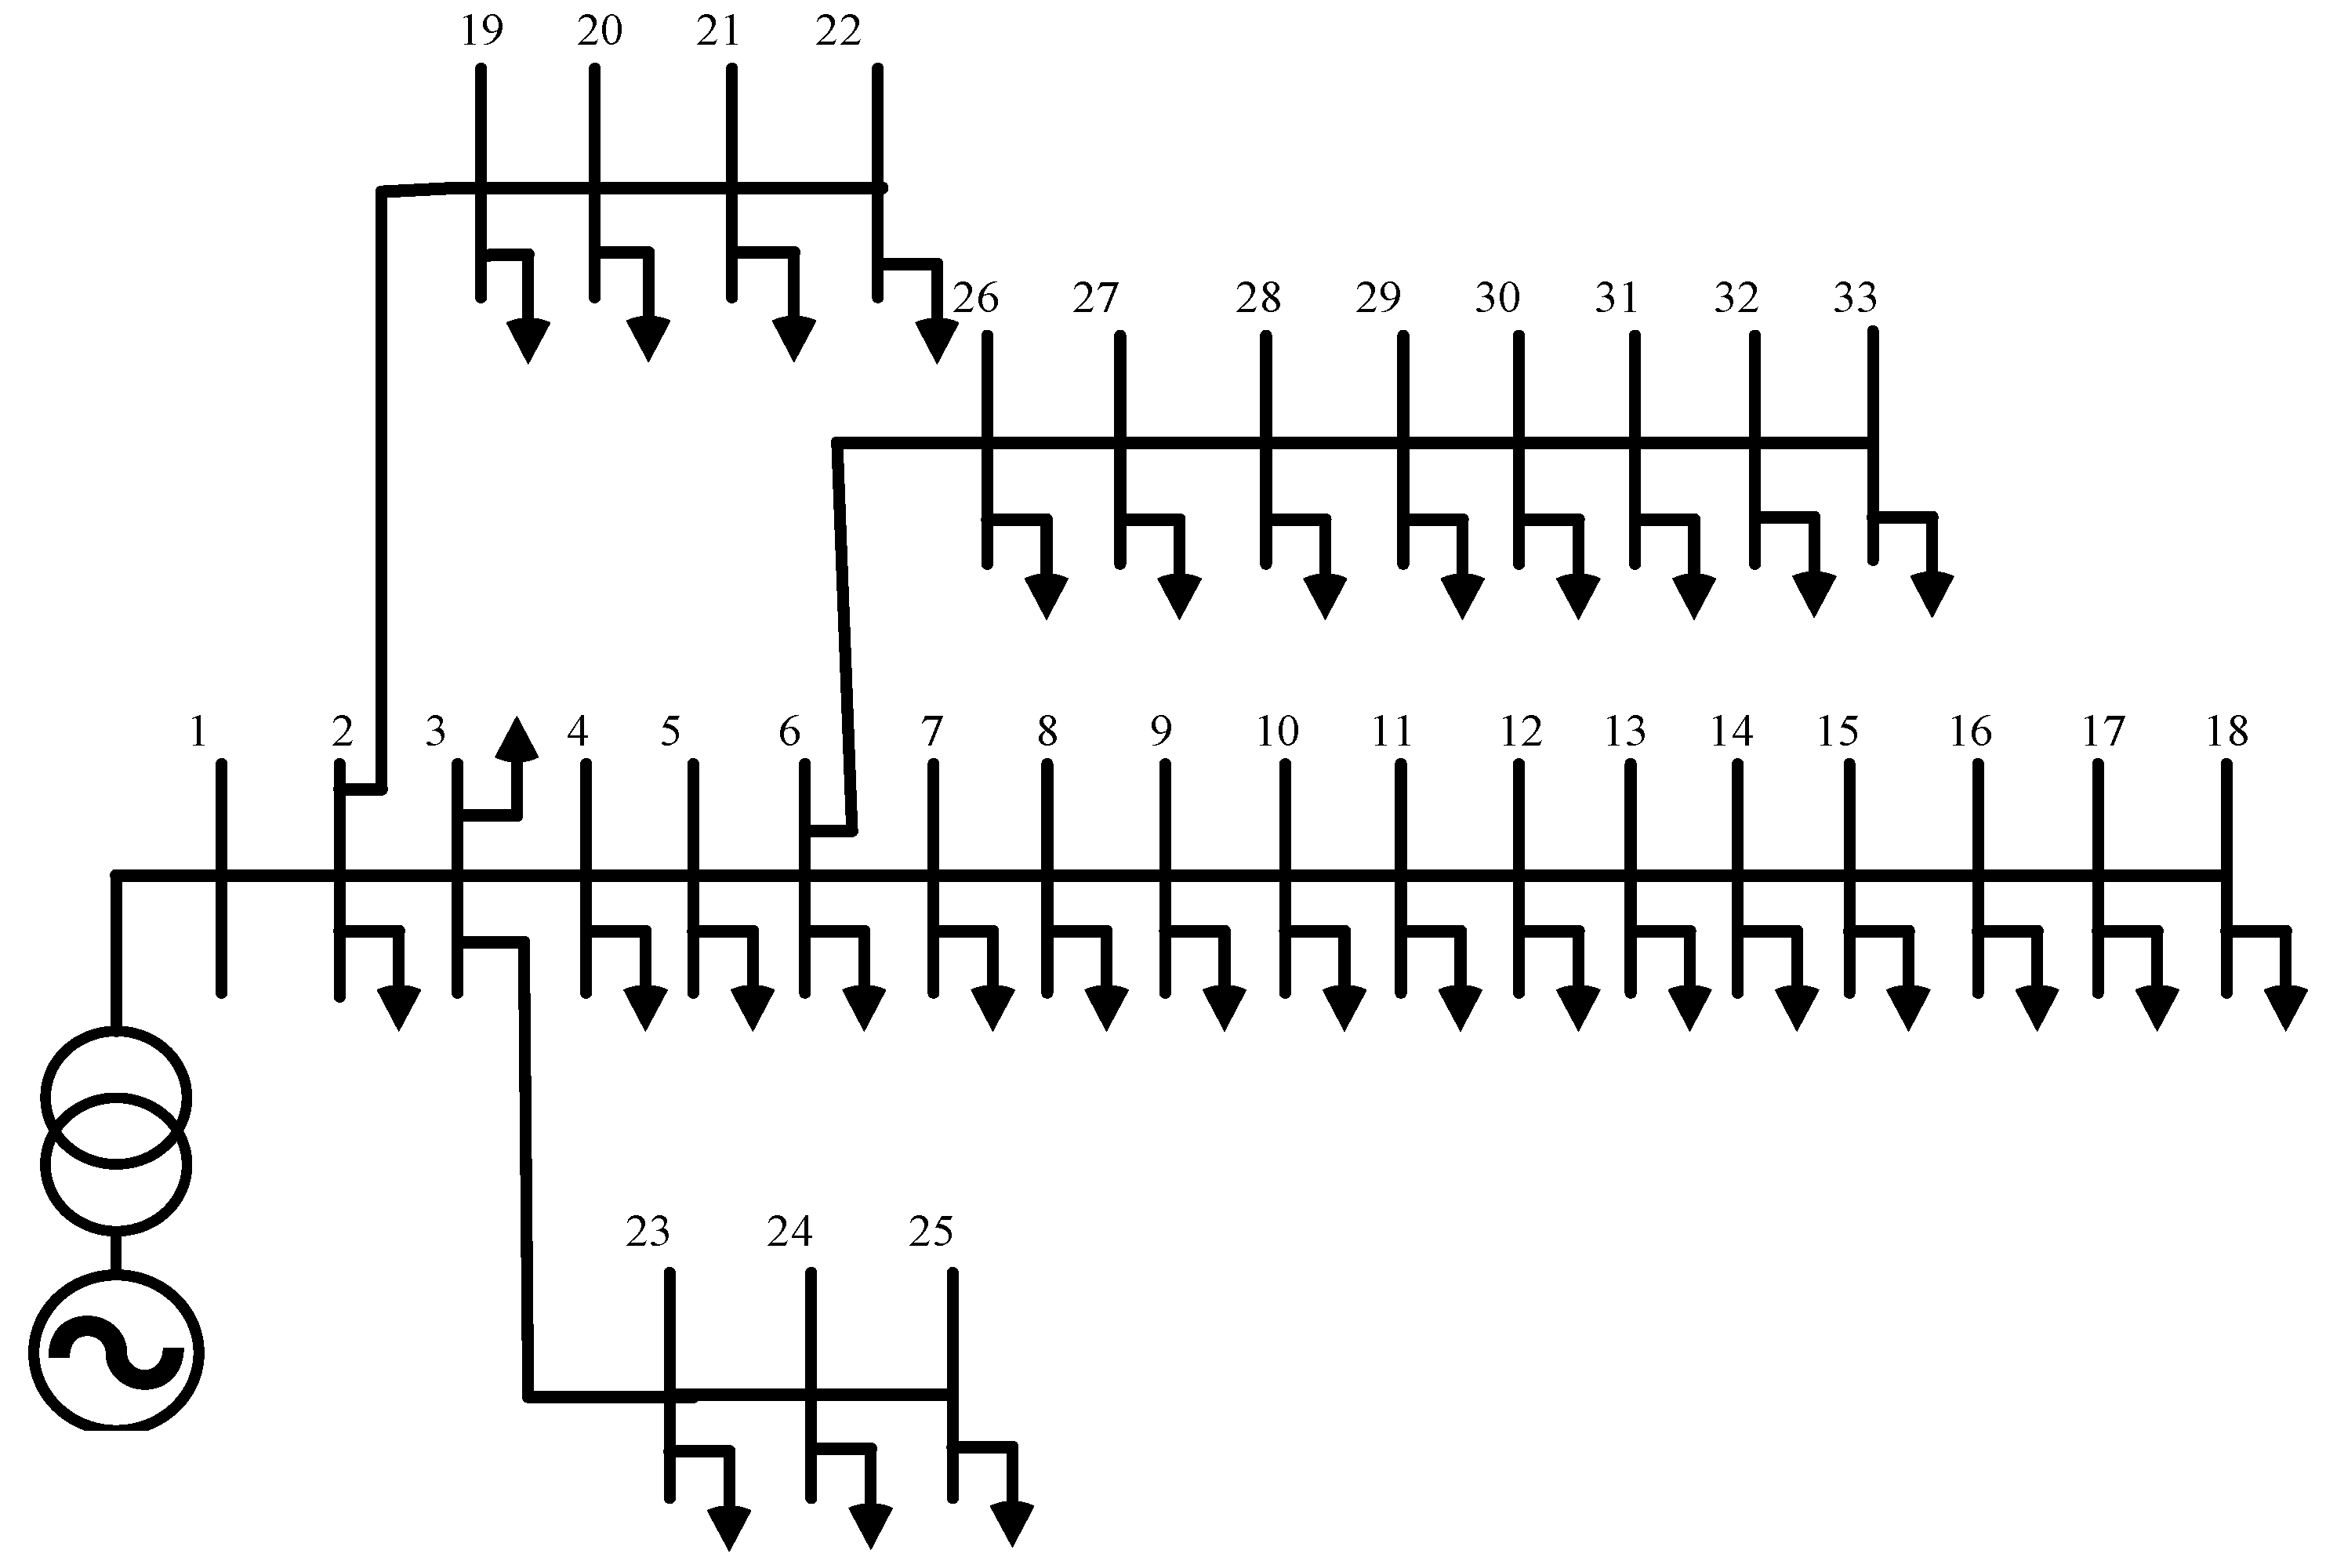
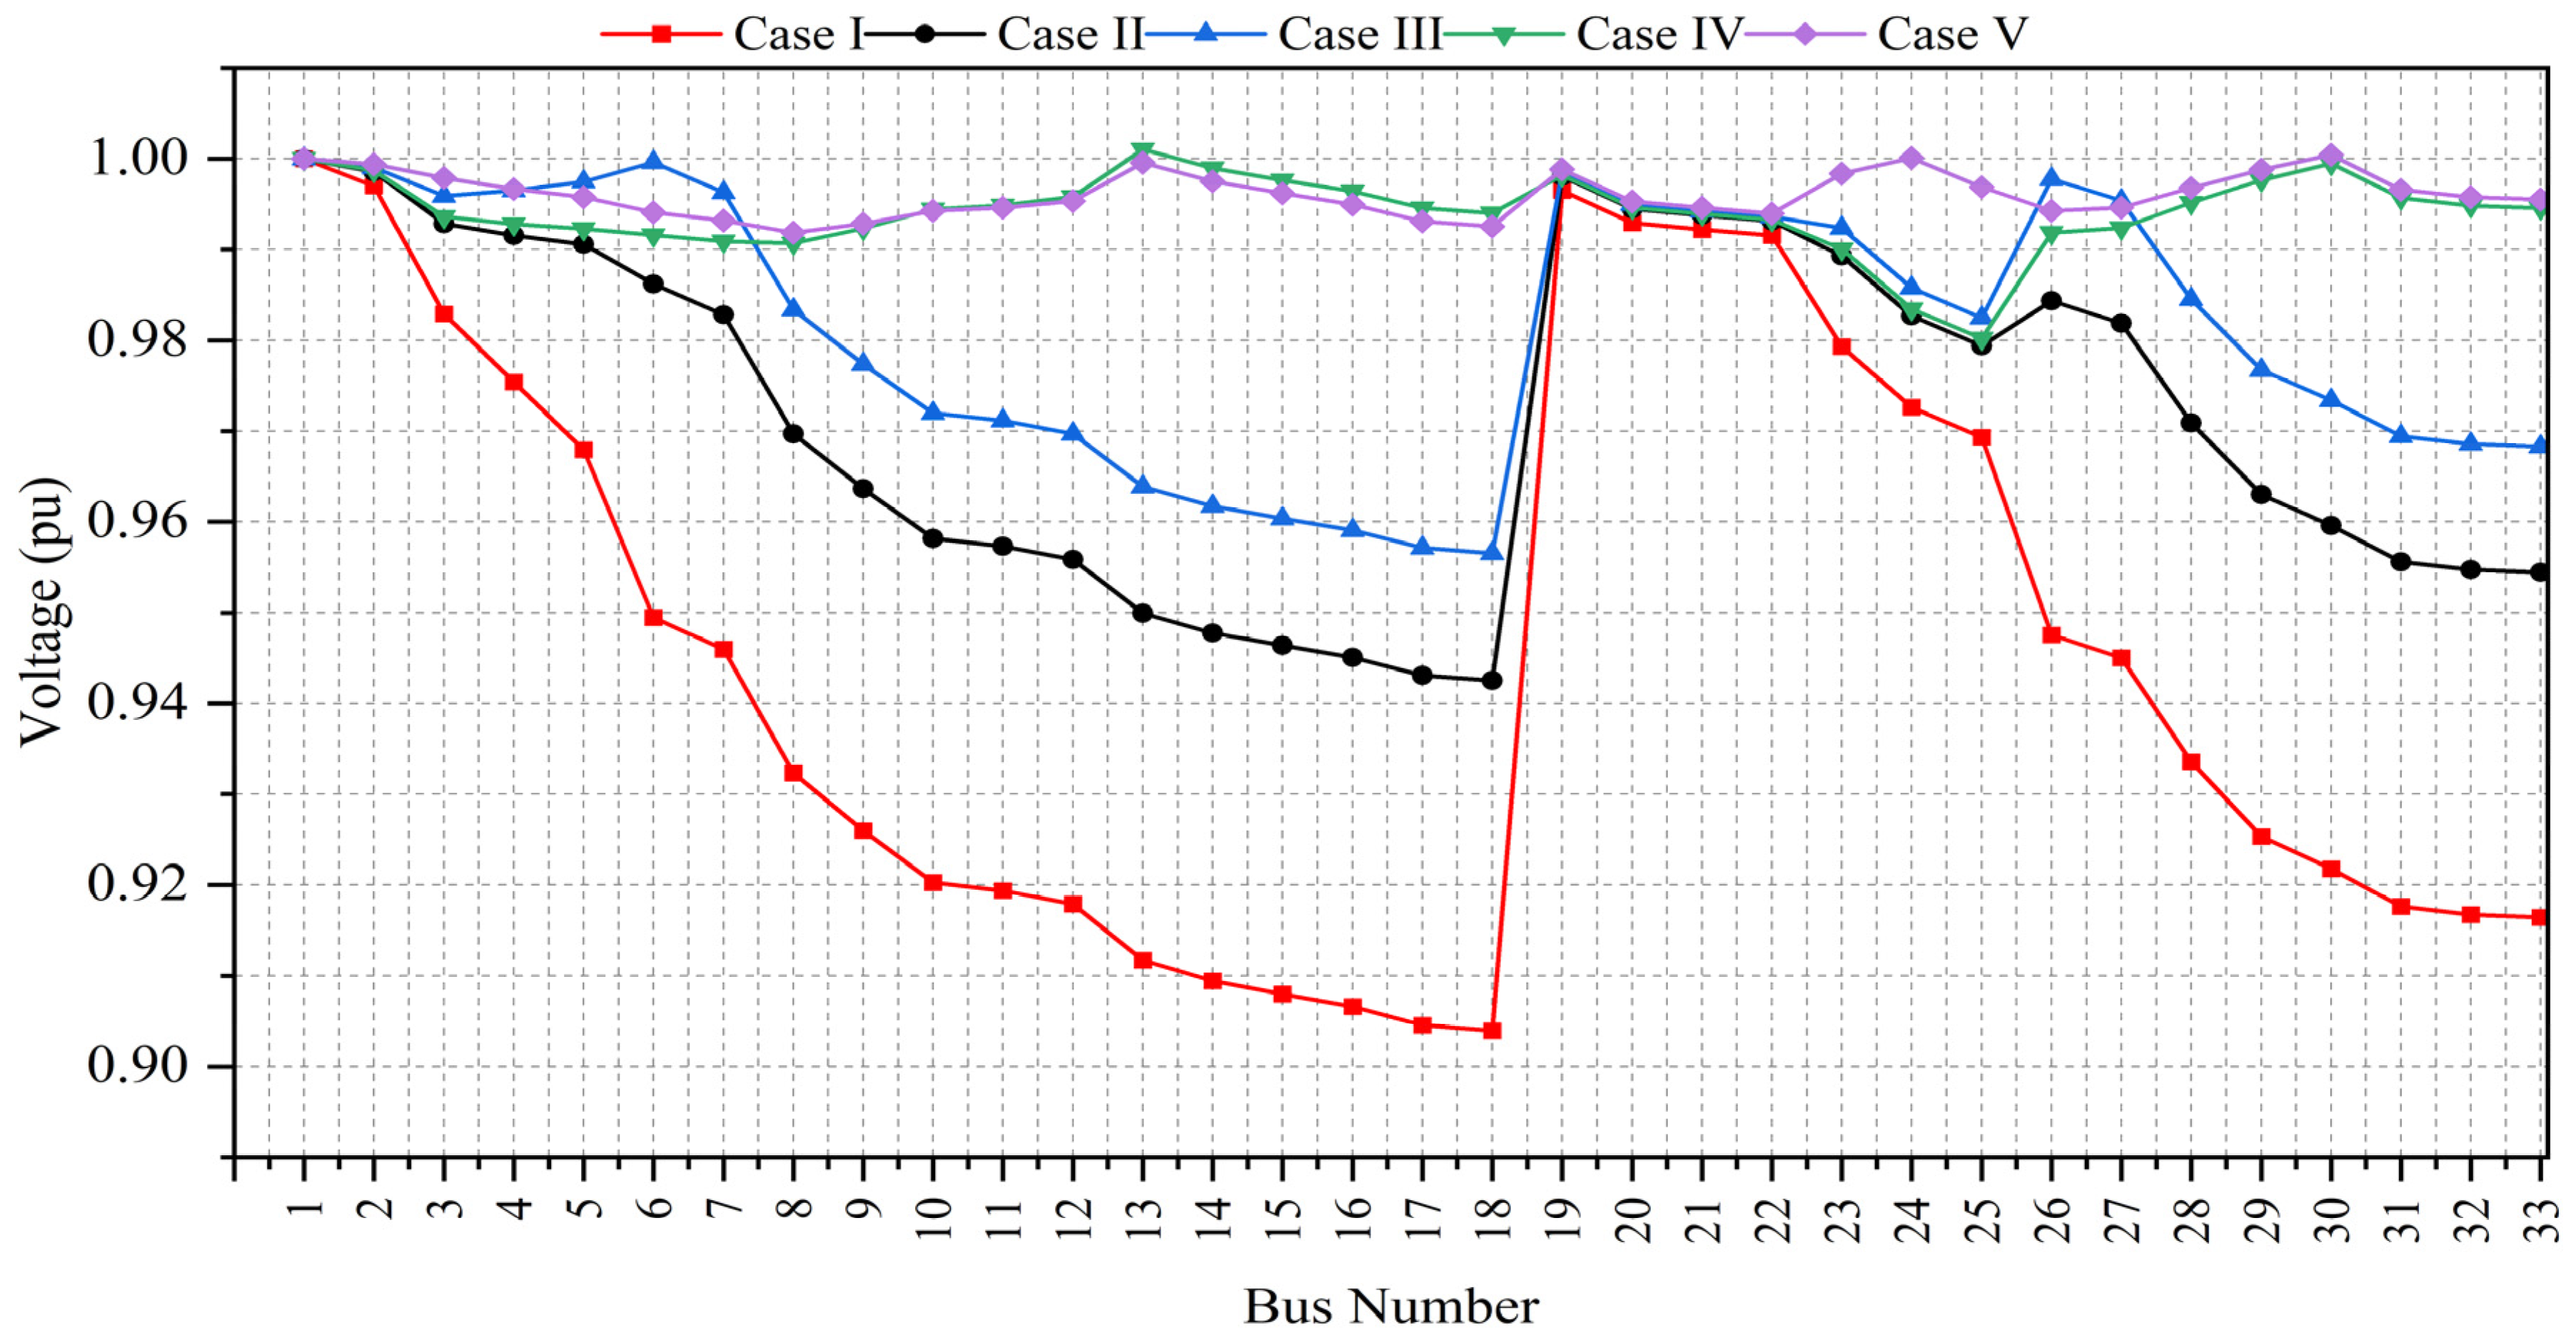
3.2.2. IEEE 33 Bus
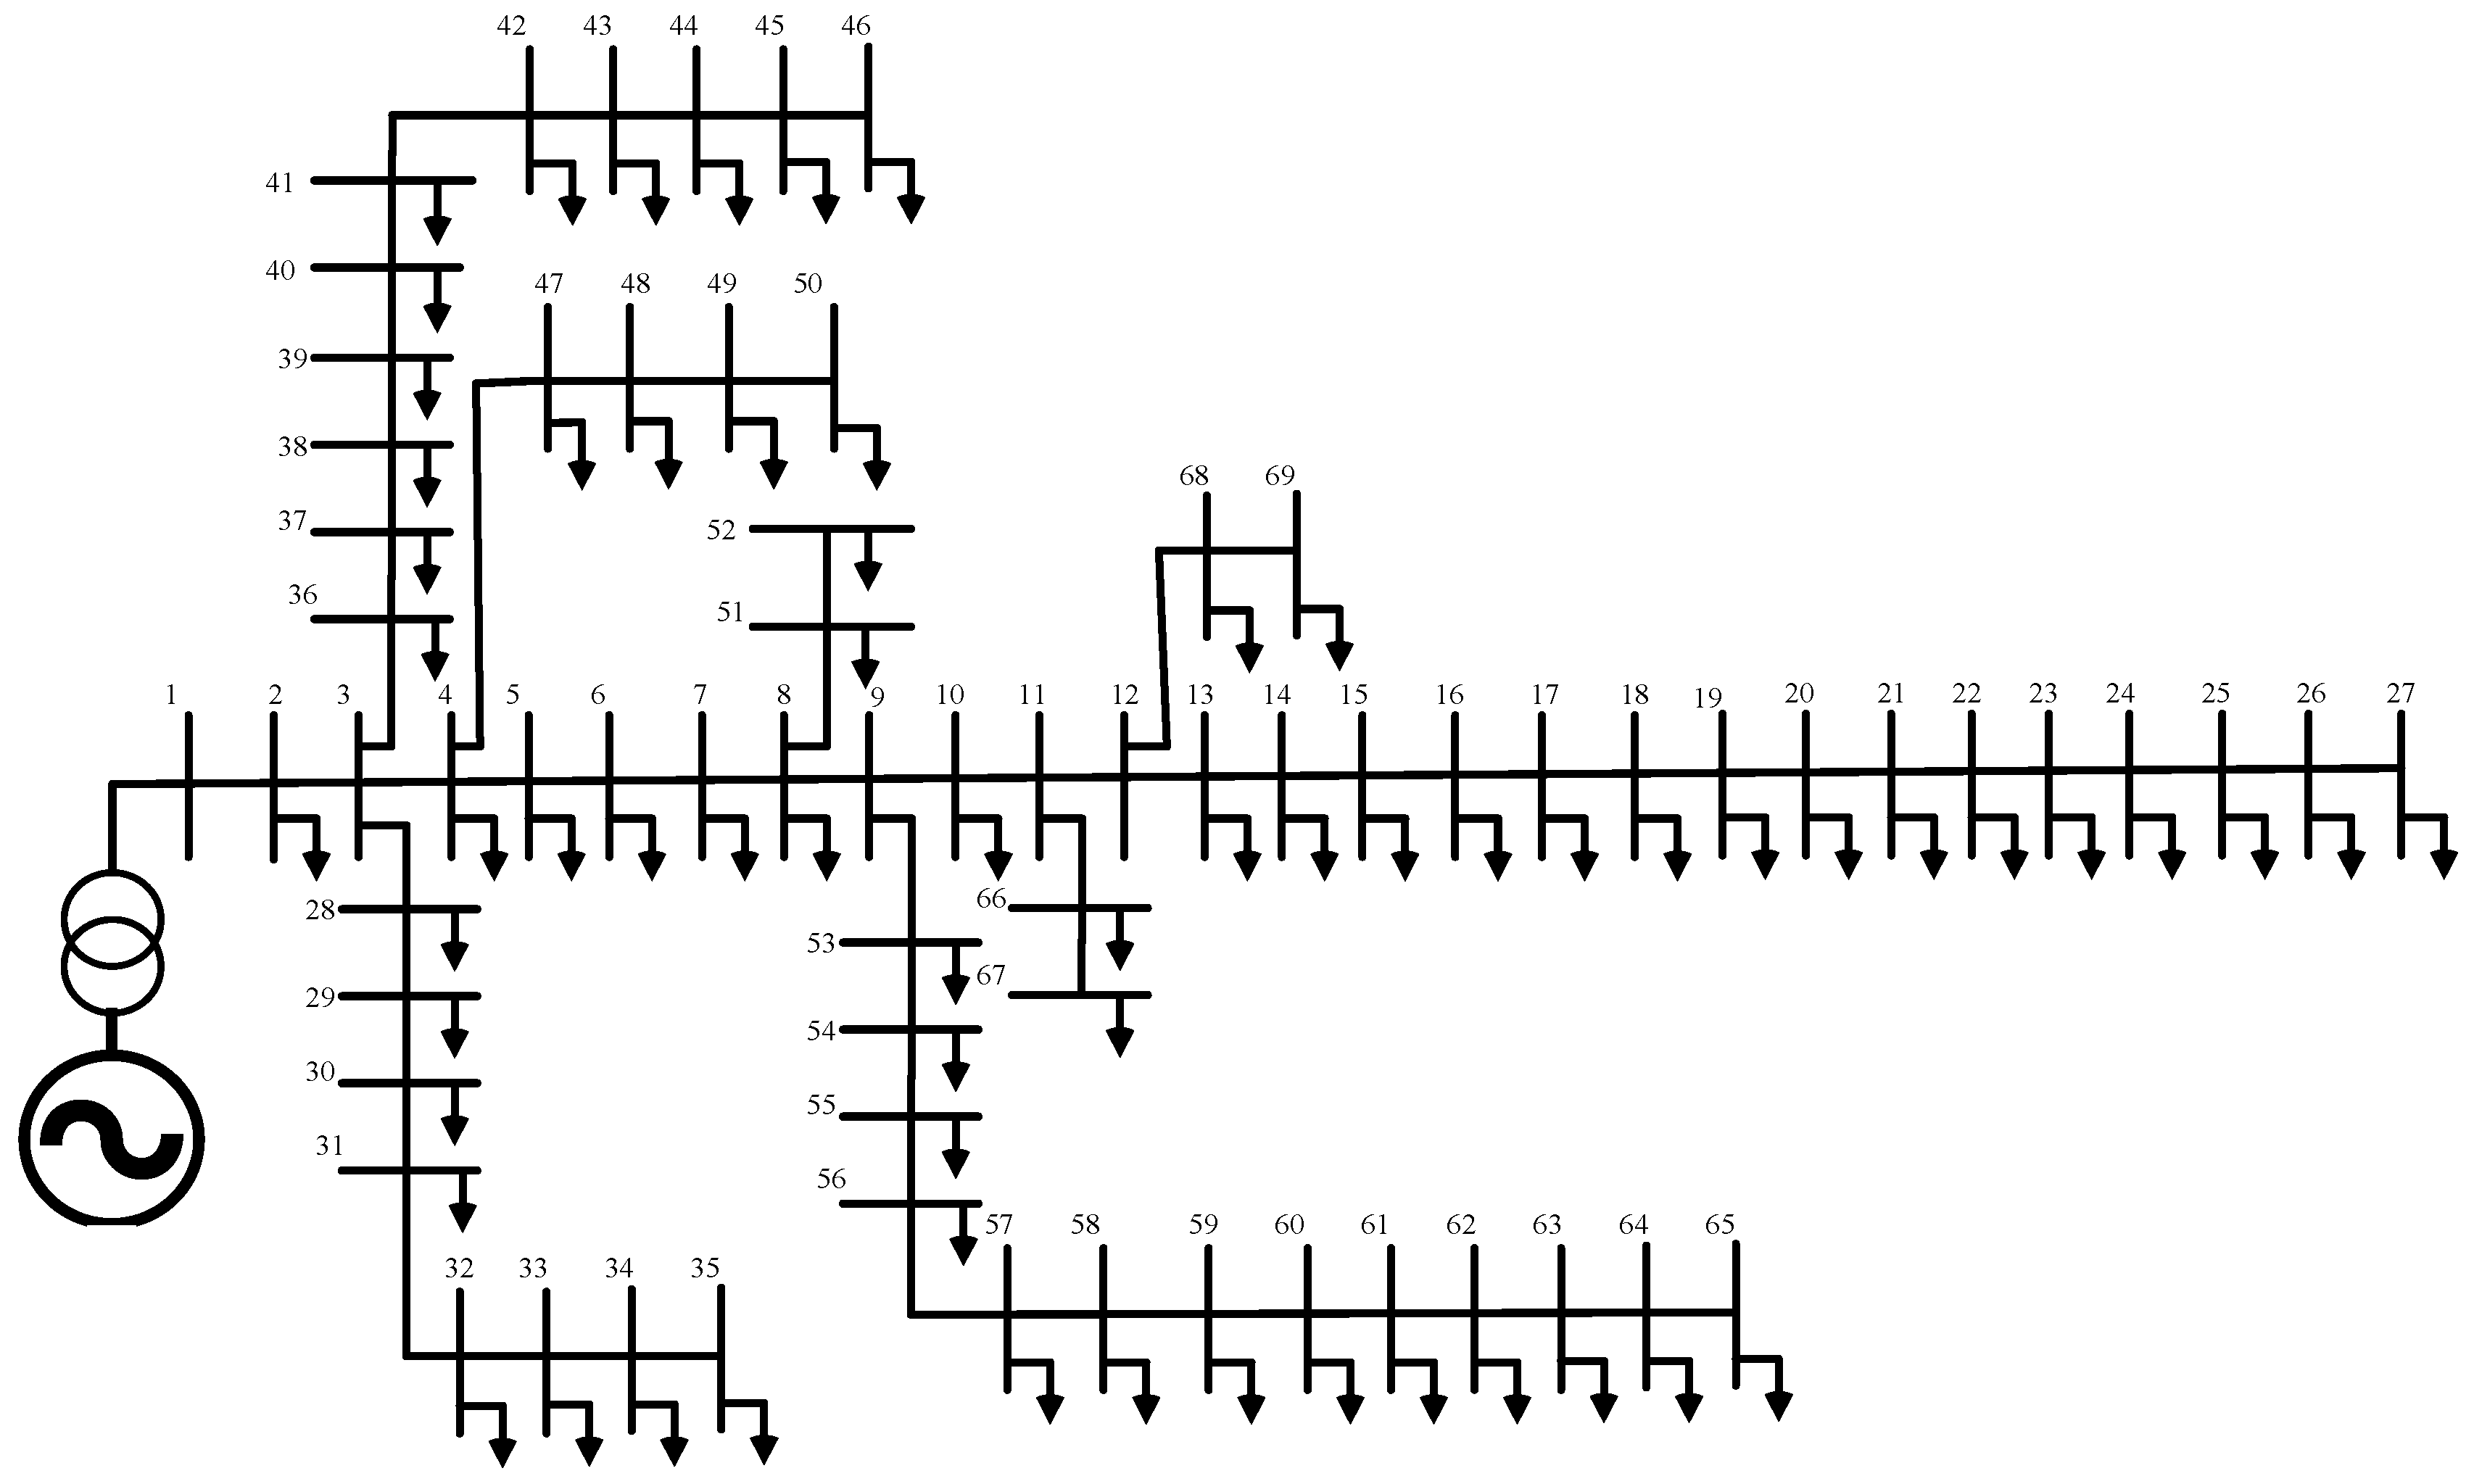
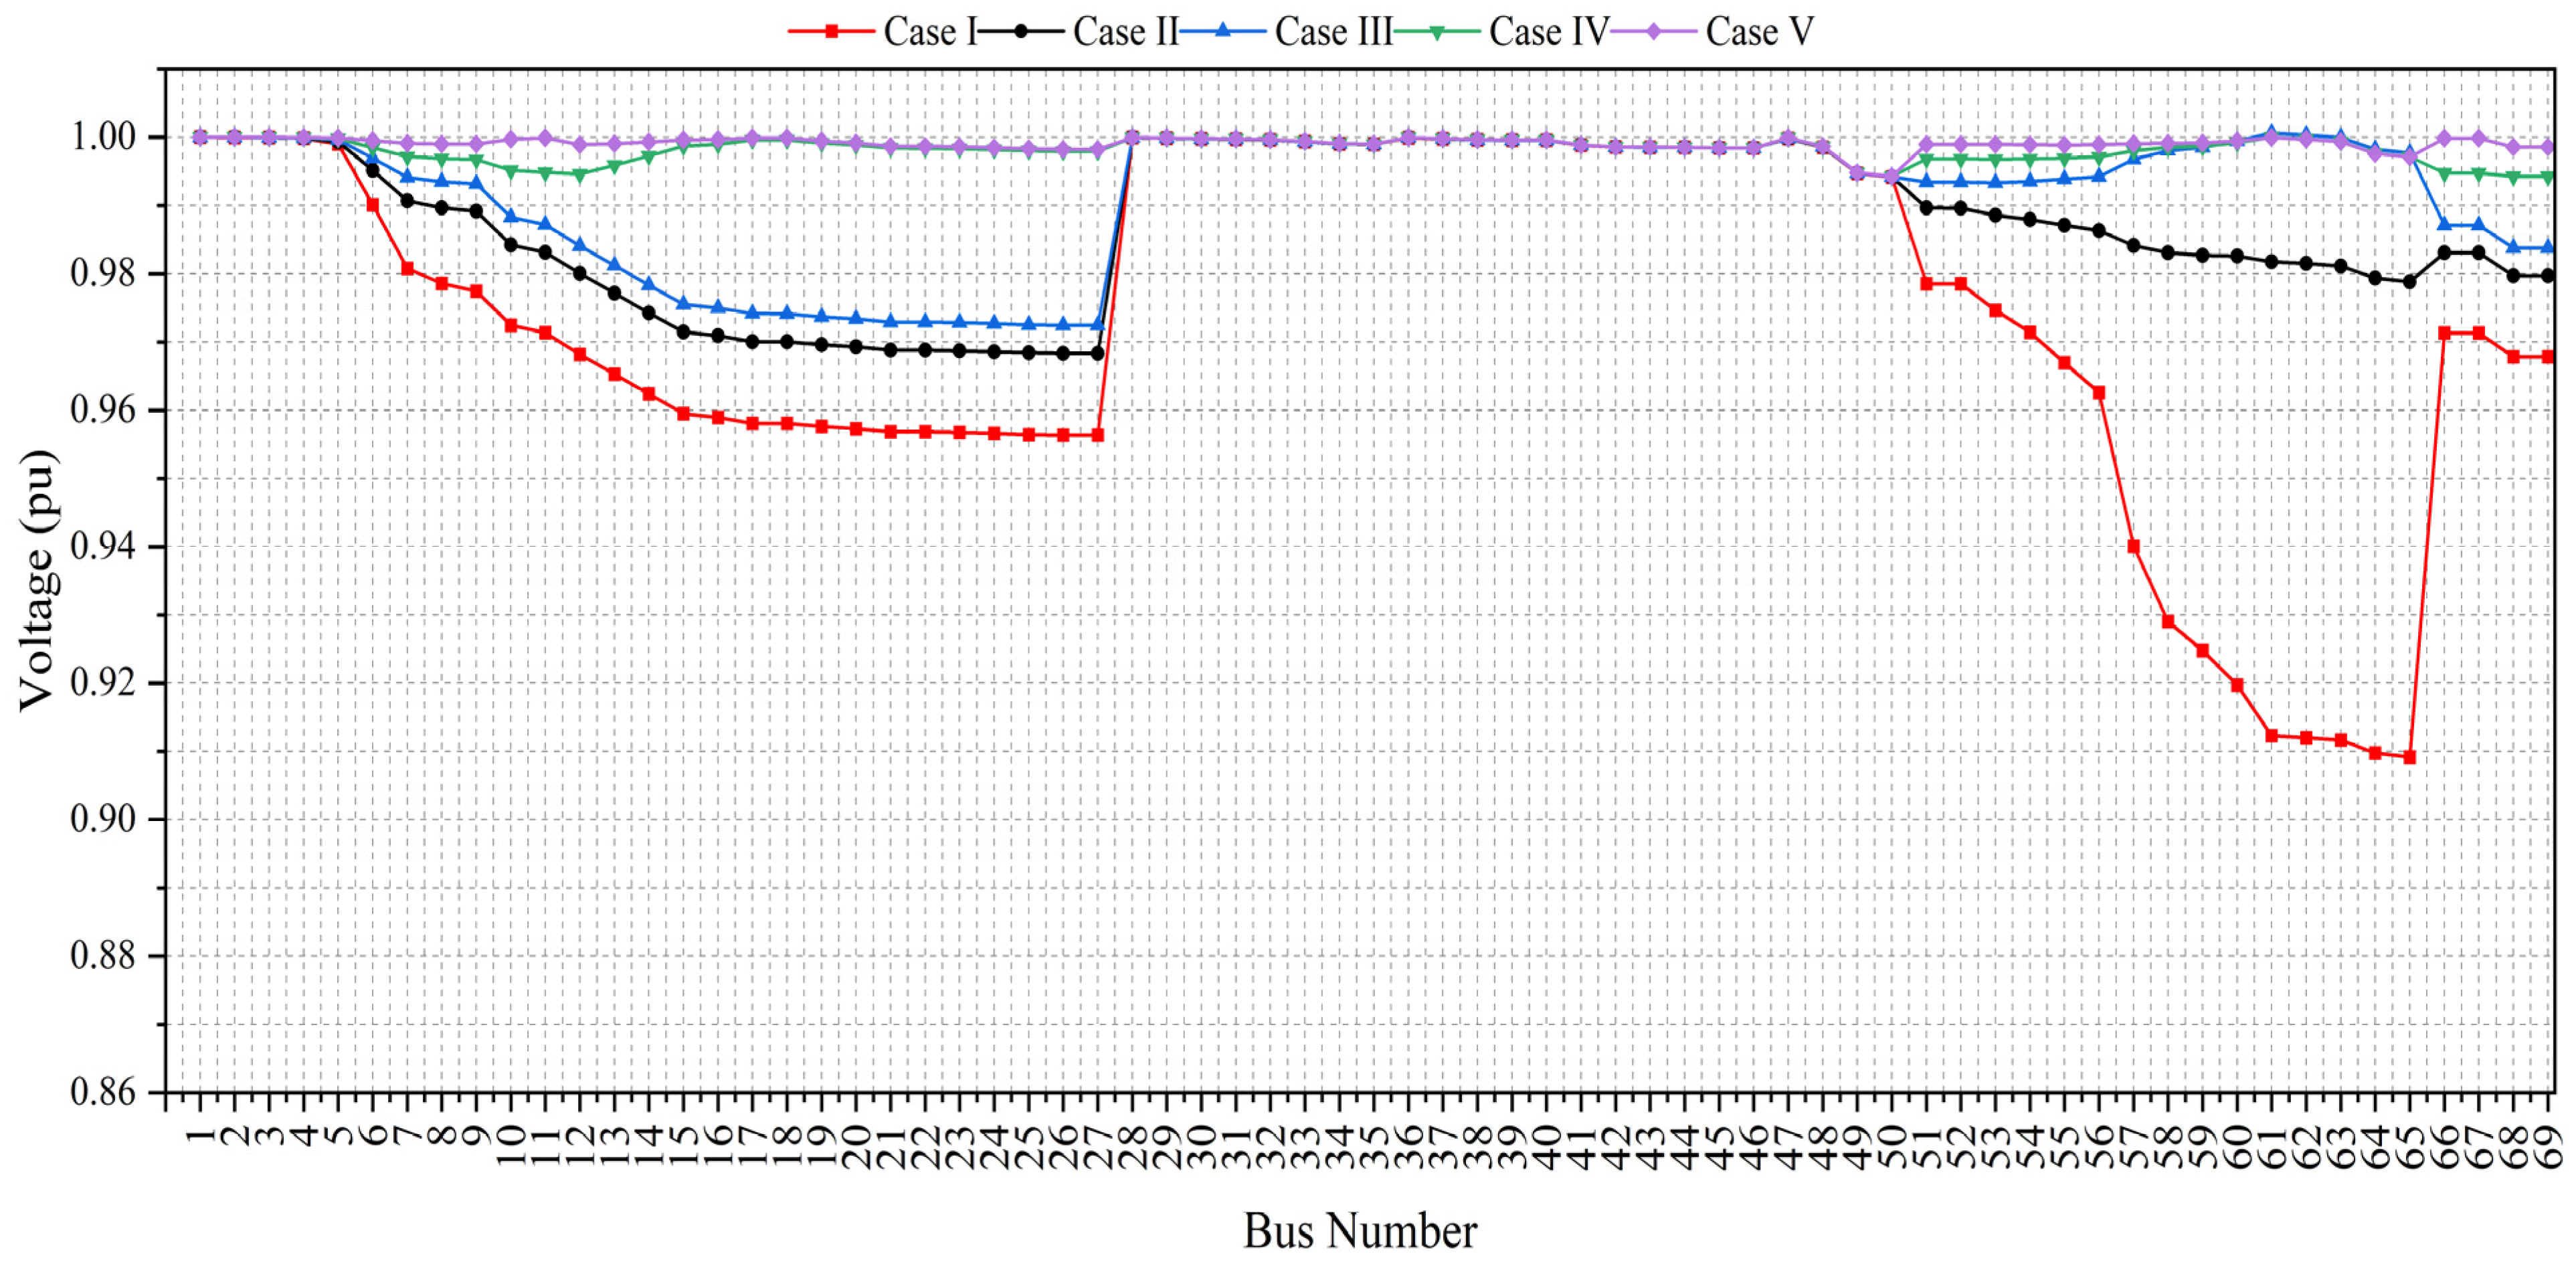
3.2.3. IEEE 69 Bus
4. Conclusions
5. Future Works
- In future work, Monte Carlo simulation can be applied alongside the proposed index to evaluate voltage stability in radial distribution systems over a 24-hour period. This approach would allow the assessment of the index’s capability to monitor vulnerable areas (critical buses and lines) and prevent voltage collapse under varying load conditions and uncertainties associated with renewable energy sources (RESs). While such approaches have been explored for transmission systems, such as in [45], using the critical eigenvalue index, their application in distribution systems remains largely unexplored.
- Continued progress in vehicle-to-grid (V2G) technology offers significant potential to enhance grid stability and optimize energy management. A study [46] proposed an optimized charging and discharging strategy based on a stability index. This approach can be further improved by incorporating the proposed NDVSI as an objective function within advanced optimization frameworks to reduce the risk of instability. As large-scale electric vehicle (EV) charging across multiple load buses can exacerbate voltage collapse, the NDVSI provides a meaningful stability signal. Its value remains close to unity under stable operating conditions and decreases toward zero as the system approaches voltage collapse. Therefore, maximizing the NDVSI, as formulated in Equation (14), enables the determination of optimal EV charging and discharging power ratings for maintaining voltage stability throughout both daytime and nighttime periods.
Author Contributions
Funding
Data Availability Statement
Acknowledgments
Conflicts of Interest
Abbreviations
| SI | Stability index |
| NDVSI | Novel distribution voltage stability index |
| CB | Critical bus |
| CL | Critical line |
| PSI | Power stability index |
| BFOA | Foraging optimization algorithm |
| HPSO | Hybrid practical swarm optimization |
| BSOA | Backtracking search optimization algorithm |
| SKHA | Stud krill herd algorithm |
| MOWOA | Multi-objective whale optimization algorithm |
| CSA | Crow search algorithm |
| OTCDE | Opposition-based tuned-chaotic differential evolution |
| BIBC | Bus injection to branch current |
| VSI | Voltage sensitivity index |
| DFA | Dragonfly algorithm |
| IPSO | Improved particle swarm optimization |
| N. A | Not analyzed |
| APSFS | Active power supplied from the substation |
| RPSFS | Reactive power supplied from the substation |
| AELC | Annual energy loss cost |
| ELCS | The energy loss cost saving |
| RRCEL | The reduction rate in the cost of energy losses |
| Nomenclature | |
| The parameters applied in this study are presented below to assist the reader. | |
| The impedance of the distribution line | |
| The resistance of the distribution line | |
| The reactance of the distribution line | |
| The impedance angle | |
| The shunt admittance of line | |
| The definitions of variables and terms used throughout this work are outlined as follows. | |
| The branch current at the sending bus | |
| The branch current at the receiving bus | |
| The voltage at the sending bus | |
| The voltage at the receiving bus | |
| The voltage angle at the sending bus | |
| The voltage angle at the receiving bus | |
| The apparent power at the sending bus | |
| The apparent power at the receiving bus | |
| pf | Power factor |
| The total load at the base loading case | |
| The maximum loading (critical load) | |
| The active power loss | |
| The reactive power loss | |
| The energy cost | |
| The time duration | |
| The cost of generated active power of distributed generator | |
| The cost of generated reactive power of distributed generator | |
| The maximum generated complex power from the distributed generator | |
References
- Yammani, C.; Maheswarapu, S.; Matam, S.K. A Multi-objective Shuffled Bat algorithm for optimal placement and sizing of multi distributed generations with different load models. Int. J. Electr. Power Energy Syst. 2016, 79, 120–131. [Google Scholar] [CrossRef]
- Mokred, S.; Wang, Y.; Chen, T. A novel collapse prediction index for voltage stability analysis and contingency ranking in power systems. Prot. Control Mod. Power Syst. 2023, 8, 1–27. [Google Scholar] [CrossRef]
- Christa, S.A.S.T.J.; Suresh, S. Enhancing grid resilience and efficiency with distributed generators through fuzzified firefly optimization. Electr. Eng. 2024, 106, 7803–7818. [Google Scholar] [CrossRef]
- Kalarathi, S.A.M.; Bhuvanesh, S.S.A. Multi-objective optimal distributed generators integration using firefly algorithm with Fuzzy decision making. Electr. Eng. 2024, 106, 6113–6130. [Google Scholar] [CrossRef]
- W. G. CIGRE and Working Group 37.23, “Impact of Increasing Contribution of Dispersed Generation on the Power System-Final Report,” Electra, Sept., no. February, 1998, [Online]. Available online: https://books.google.com/books?id=hGIvMwAACAAJ (accessed on 15 January 2025).
- Mostafa, M.H.; Elshahed, M.A.; Elmarsfawy, M.M. Power Flow Study and Voltage Stability Analysis for Radial System with Distributed Generation. Int. J. Comput. Appl. 2016, 137, 19–26. [Google Scholar] [CrossRef]
- Malik, S.; Modi, B.; Mangrolia, D. Grid Integration of Distributed Generation: Issues and Challenges. In Proceedings of the 2022 International Conference for Advancement in Technology (ICONAT), Goa, India, 21–22 January 2022; pp. 1–6. [Google Scholar] [CrossRef]
- Ehsan, A.; Yang, Q. Optimal integration and planning of renewable distributed generation in the power distribution networks: A review of analytical techniques. Appl. Energy 2018, 210, 44–59. [Google Scholar] [CrossRef]
- Reddy, P.D.P.; Reddy, V.C.V.; Manohar, T.G. Application of flower pollination algorithm for optimal placement and sizing of distributed generation in Distribution systems. J. Electr. Syst. Inf. Technol. 2016, 3, 14–22. [Google Scholar] [CrossRef]
- Avar, A.; Sheikh-El-Eslami, M.K. Optimal DG placement in power markets from DG Owners’ perspective considering the impact of transmission costs. Electr. Power Syst. Res. 2021, 196, 107218. [Google Scholar] [CrossRef]
- Türkoğlu, A.S.; Güldorum, H.C.; Sengor, I.; Çiçek, A.; Erdinç, O.; Hayes, B.P. Maximizing EV profit and grid stability through Virtual Power Plant Considering V2G. Energy Rep. 2024, 11, 3509–3520. [Google Scholar] [CrossRef]
- Werkie, Y.G.; Kefale, H.A. Optimal allocation of multiple distributed generation units in power distribution networks for voltage profile improvement and power losses minimization. Cogent Eng. 2022, 9, 1–23 2091668. [Google Scholar] [CrossRef]
- Devabalaji, K.R.; Ravi, K. Optimal size and siting of multiple DG and DSTATCOM in radial distribution system using Bacterial Foraging Optimization Algorithm. Ain Shams Eng. J. 2016, 7, 959–971. [Google Scholar] [CrossRef]
- Suresh, M.C.V.; Belwin, E.J. Optimal DG placement for benefit maximization in distribution networks by using Dragonfly algorithm. Renew. Wind Water Sol. 2018, 5, 4. [Google Scholar] [CrossRef]
- El-Fergany, A. Optimal allocation of multi-type distributed generators using backtracking search optimization algorithm. Int. J. Electr. Power Energy Syst. 2015, 64, 1197–1205. [Google Scholar] [CrossRef]
- Ali, E.S.; Abd Elazim, S.M.; Abdelaziz, A.Y. Ant Lion Optimization Algorithm for optimal location and sizing of renewable distributed generations. Renew. Energy 2017, 101, 1311–1324. [Google Scholar] [CrossRef]
- Wang, Z.; Chen, B.; Wang, J.; Kim, J.; Begovic, M.M. Robust optimization based optimal DG placement in microgrids. IEEE Trans. Smart Grid 2014, 5, 2173–2182. [Google Scholar] [CrossRef]
- Aman, M.M.; Jasmon, G.B.; Bakar, A.H.A.; Mokhlis, H. A new approach for optimum simultaneous multi-DG distributed generation Units placement and sizing based on maximization of system loadability using HPSO (hybrid particle swarm optimization) algorithm. Energy 2014, 66, 202–215. [Google Scholar] [CrossRef]
- ChithraDevi, S.A.; Lakshminarasimman, L.; Balamurugan, R. Stud Krill herd Algorithm for multiple DG placement and sizing in a radial distribution system. Eng. Sci. Technol. Int. J. 2017, 20, 748–759. [Google Scholar] [CrossRef]
- Hari Prasad, C.; Subbaramaiah, K.; Sujatha, P. Optimal DG unit placement in distribution networks by multi-objective whale optimization algorithm & its techno-economic analysis. Electr. Power Syst. Res. 2023, 214, 108869. [Google Scholar] [CrossRef]
- Ismael, S.M.; Aleem, S.H.E.A.; Abdelaziz, A.Y. Optimal sizing and placement of distributed generation in Egyptian radial distribution systems using crow search algorithm. In Proceedings of the 2018 International Conference on Innovative Trends in Computer Engineering (ITCE), Aswan, Egypt, 19–21 February 2018; pp. 332–337. [Google Scholar] [CrossRef]
- Manna, D.; Goswami, S.K. Optimum placement of distributed generation considering economics as well as operational issues. Int. Trans. Electr. Energy Syst. 2020, 30, 1–20. [Google Scholar] [CrossRef]
- Kumar, S.; Mandal, K.K.; Chakraborty, N. A novel opposition-based tuned-chaotic differential evolution technique for techno-economic analysis by optimal placement of distributed generation. Eng. Optim. 2020, 52, 303–324. [Google Scholar] [CrossRef]
- Acharya, N.; Mahat, P.; Mithulananthan, N. An analytical approach for DG allocation in primary distribution network. Int. J. Electr. Power Energy Syst. 2006, 28, 669–678. [Google Scholar] [CrossRef]
- Hung, D.Q.; Mithulananthan, N. Multiple distributed generator placement in primary distribution networks for loss reduction. IEEE Trans. Ind. Electron. 2013, 60, 1700–1708. [Google Scholar] [CrossRef]
- Murty, V.V.S.N.; Kumar, A. Optimal placement of DG in radial distribution systems based on new voltage stability index under load growth. Int. J. Electr. Power Energy Syst. 2015, 69, 246–256. [Google Scholar] [CrossRef]
- Elsaiah, S.; Benidris, M.; Mitra, J. Analytical approach for placement and sizing of distributed generation on distribution systems. IET Gener. Transm. Distrib. 2014, 8, 1039–1049. [Google Scholar] [CrossRef]
- Ettehadi, M.; Ghasemi, H.; Vaez-Zadeh, S. Voltage stability-based DG placement in distribution networks. IEEE Trans. Power Deliv. 2013, 28, 171–178. [Google Scholar] [CrossRef]
- Hung, D.Q.; Mithulananthan, N.; Lee, K.Y. Optimal placement of dispatchable and nondispatchable renewable DG units in distribution networks for minimizing energy loss. Int. J. Electr. Power Energy Syst. 2014, 55, 179–186. [Google Scholar] [CrossRef]
- Murthy, V.V.S.N.; Kumar, A. Comparison of optimal DG allocation methods in radial distribution systems based on sensitivity approaches. Int. J. Electr. Power Energy Syst. 2013, 53, 450–467. [Google Scholar] [CrossRef]
- Wang, C.; Nehrir, M.H. Analytical approaches for optimal placement of distributed generation sources in power systems. IEEE Trans. Power Syst. 2004, 19, 2068–2076. [Google Scholar] [CrossRef]
- Aman, M.M.; Jasmon, G.B.; Mokhlis, H.; Bakar, A.H.A. Optimal placement and sizing of a DG based on a new power stability index and line losses. Int. J. Electr. Power Energy Syst. 2012, 43, 1296–1304. [Google Scholar] [CrossRef]
- Alrashidi, M.R.; Alhajri, M.F. Optimal planning of multiple distributed generation sources in distribution networks: A new approach. Energy Convers. Manag. 2011, 52, 3301–3308. [Google Scholar] [CrossRef]
- Mokred, S.; Lijun, Q.; Kamara, G. Smart Design of Distribution Series Capacitor Bank Application for Improved Voltage Quality and Motor Start. In Proceedings of the 2020 IEEE/IAS Industrial and Commercial Power System Asia (I&CPS Asia), Weihai, China, 13–15 July 2020; pp. 454–459. [Google Scholar] [CrossRef]
- Mokred, S.; Lijun, Q.; Khan, T. Protection Performance during Application of an Intelligent and Fast Switch Series Capacitor to 25kV Radial Power Distribution Network. In Proceedings of the 2020 IEEE/IAS Industrial and Commercial Power System Asia (I&CPS Asia), Weihai, China, 13–15 July 2020; pp. 921–928. [Google Scholar] [CrossRef]
- Mokred, S.; Lijun, Q.; Kamara, G.; Khan, T. Comparison of the Effect of Series and Shunt Capacitor Application in 25kV Radial Power Distribution Network. In Proceedings of the 2020 IEEE/IAS Industrial and Commercial Power System Asia (I&CPS Asia), Weihai, China, 13–15 July 2020; pp. 822–830. [Google Scholar] [CrossRef]
- Chakravorty, M.; Das, D. Voltage stability analysis of radial distribution networks. Electr. Power Energy Syst. 2001, 23, 129–135. [Google Scholar] [CrossRef]
- Ranjan, R.; Venkatesh, B.; Das, D. Voltage stability analysis of radial distribution networks. Electr. Power Compon. Syst. 2003, 31, 501–511. [Google Scholar] [CrossRef]
- Eminoglu, U.; Hocaoglu, M.H. A Voltage stability index for radial distribution networks. In Proceedings of the 42nd International Universities Power Engineering Conference, Brighton, UK, 4–6 September 2007; pp. 408–413. [Google Scholar] [CrossRef]
- Abul’Wafa, A.R. A network-topology-based load flow for radial distribution networks with composite and exponential load. Electr. Power Syst. Res. 2012, 91, 37–43. [Google Scholar] [CrossRef]
- Gautam, D.; Mithulananthan, N. Optimal DG placement in deregulated electricity market. Electr. Power Syst. Res. 2007, 77, 1627–1636. [Google Scholar] [CrossRef]
- Gözel, T.; Eminoglu, U.; Hocaoglu, M.H. A tool for voltage stability and optimization (VS&OP) in radial distribution systems using matlab graphical user interface (GUI). Simul. Model. Pract. Theory 2008, 16, 505–518. [Google Scholar] [CrossRef]
- Muthukumar, K.; Jayalalitha, S. Optimal placement and sizing of distributed generators and shunt capacitors for power loss minimization in radial distribution networks using hybrid heuristic search optimization technique. Int. J. Electr. Power Energy Syst. 2016, 78, 299–319. [Google Scholar] [CrossRef]
- Kansal, S.; Kumar, V.; Tyagi, B. Hybrid approach for optimal placement of multiple DGs of multiple types in distribution networks. Int. J. Electr. Power Energy Syst. 2016, 75, 226–235. [Google Scholar] [CrossRef]
- Rahman, S.; Saha, S.; Haque, M.E.; Islam, S.N.; Arif, M.T.; Mosadeghy, M.; Oo, A.M.T. A framework to assess voltage stability of power grids with high penetration of solar PV systems. Int. J. Electr. Power Energy Syst. 2022, 139, 107815. [Google Scholar] [CrossRef]
- Kim, H.Y.; Shin, G.S.; Mahseredjian, J.; Kim, C.H. Voltage Stability Index (VSI)-Based Optimal Vehicle-to-Grid(V2G) Charging/Discharging Strategy in Radial Distribution System. J. Electr. Eng. Technol. 2024, 19, 3885–3890. [Google Scholar] [CrossRef]
- Das, D.; Nagi, H.S.; Kothari, D.P. Novel method for solving radial distribution networks. IEE Proc. Gener. Transm. Distrib. 1994, 141, 291–298. [Google Scholar] [CrossRef]
- Vita, V. Development of a decision-making algorithm for the optimum size and placement of distributed generation units in distribution networks. Energies 2017, 10, 1433. [Google Scholar] [CrossRef]
- Abdul kadir, A.F.; Mohamed, A.; Shareef, H.; Che Wanik, M.Z. Optimal placement and sizing of distributed generations in distribution systems for minimizing losses and THDv using evolutionary programming. Turk. J. Electr. Eng. Comput. Sci. 2013, 21, 2269–2282. [Google Scholar] [CrossRef]


| Index | Equation | Critical Value | Assumptions | Ref. |
|---|---|---|---|---|
| SI [37] | 0.00 | δ = 0 and Y = 0 | [37] | |
| SI [38] | 0.00 | δ = 0 and Y = 0 | [38] | |
| SI [39] | 0.00 | δ = 0 and Y = 0 | [39] | |
| Proposed index | 0.00 | Y = 0 | This paper |
| Model | Line | Bus | NDVSI | SI [37] | SI [38] | SI [39] |
|---|---|---|---|---|---|---|
| IEEE 12 bus | 3–4 | 4 | 0.8057 | 0.9241 | 0.4724 | 0.9404 |
| 6–7 | 7 | 0.7886 | 0.8626 | 0.4617 | 0.8677 | |
| 8–9 | 9 | 0.6690 | 0.8048 | 0.4410 | 0.8188 | |
| 10–11 | 11 | 0.7349 | 0.7933 | 0.4446 | 0.7945 | |
| 11–12 | 12 | 0.6784 | 0.7926 | 0.4449 | 0.7929 | |
| IEEE 33 bus | 4–5 | 5 | 0.8336 | 0.8775 | 0.4612 | 0.8913 |
| 6–7 | 7 | 0.6872 | 0.8006 | 0.4441 | 0.8067 | |
| 11–12 | 12 | 0.6700 | 0.7098 | 0.4199 | 0.7121 | |
| 19–20 | 20 | 0.9762 | 0.9719 | 0.4894 | 0.9790 | |
| 29–30 | 30 | 0.7616 | 0.7218 | 0.4215 | 0.7275 | |
| 32–33 | 33 | 0.8014 | 0.7053 | 0.4196 | 0.7057 | |
| IEEE 69 bus | 4–5 | 5 | 0.9902 | 0.9961 | 0.4982 | 0.9977 |
| 8–9 | 9 | 0.8619 | 0.9128 | 0.4766 | 0.9149 | |
| 26–27 | 27 | 0.7296 | 0.8365 | 0.4573 | 0.8365 | |
| 37–38 | 38 | 0.9929 | 0.9984 | 0.4994 | 0.9987 | |
| 53–54 | 54 | 0.8475 | 0.8904 | 0.4687 | 0.8964 | |
| 59–60 | 60 | 0.6495 | 0.7154 | 0.4183 | 0.7234 |
| Model | Load | Bus | CB | CL | NDVSI | SI [37] | SI [38] | SI [39] |
|---|---|---|---|---|---|---|---|---|
| IEEE 12 bus | P = 2.98 MW | 6 | 5 | 4–5 | 0.0354 | 0.0368 | 0.0376 | 0.1647 |
| Q = 1.874 MVAr | 9 | 9 | 8–9 | 0.0781 | 0.0682 | 0.1241 | 0.1424 | |
| S = 1.31 MVA and pf = 0.707 | 9 | 9 | 8–9 | 0.0420 | 0.0391 | 0.0550 | 0.0966 | |
| S = 1.25 MVA and pf = 0.93 | 9 | 9 | 8–9 | 0.0309 | 0.0361 | 0.0425 | 0.0891 | |
| IEEE 33 bus | P = 11.099 MW | 22 | 20 | 19–20 | 0.0003 | −0.0115 | 0.0477 | 0.4042 |
| Q = 13.67 MVAr | 25 | 25 | 24–25 | 0.0270 | −0.0125 | 0.0556 | 0.1122 | |
| S = 12.42 MVA and pf = 0.765 | 6 | 6 | 5–6 | 0.0004 | 0.0111 | 0.0229 | 0.1492 | |
| S = 12.646 MVA and pf = 0.95 | 6 | 6 | 5–6 | 0.0010 | −0.0008 | 0.0251 | 0.1441 | |
| IEEE 69 bus | P = 5.98 MW | 15 | 15 | 14–15 | 0.0491 | 0.0453 | 0.0722 | 0.0780 |
| Q = 21.4 MVAr | 43 | 41 | 40–41 | 0.0008 | −0.0333 | 0.0382 | 0.3277 | |
| S = 18.93 MVA and pf = 0.77 | 43 | 41 | 40–41 | 0.0000 | −0.0011 | 0.0350 | 0.3454 | |
| S = 19.914 MVA and pf = 0.93 | 43 | 41 | 40–41 | 0.0000 | −0.0013 | 0.0438 | 0.3550 |
| System | Loading Margin (MVA) | Critical Load | CB | CL | NDVSI | SI [37] | SI [38] | SI [39] |
|---|---|---|---|---|---|---|---|---|
| IEEE 12 bus | 2.567 | 9 | 8–9 | 0.0706 | 0.0619 | 0.0636 | 0.0710 | |
| IEEE 33 bus | 10.54 | 17 | 16–17 | 0.0243 | 0.0333 | 0.0847 | 0.0361 | |
| 18 | 17–18 | 0.0713 | 0.0322 | 0.0877 | 0.0329 | |||
| IEEE 69 bus | 10.31 | 57 | 56–57 | 0.0881 | 0.0704 | 0.0574 | 0.2027 |
| Technical and Economic Analyses | No DG | With a Single DG at 1.0 pf | With a Single DG at 0.9 pf lag | With a Single DG at 0.74 pf lag | GUI [42], Single DG at 1.0 pf |
|---|---|---|---|---|---|
| Case I | Case II | Case III | Case IV | ||
| DG Placement | - | 9 | 9 | 9 | 9 |
| DG size (kVA) | - | 235 | 304 | 315 | 234.9 |
| Total Ploss (kW) | 20.695 | 10.7587 | 4.4781 | 3.1400 | 10.774 |
| Total Qloss (kVAr) | 8.040 | 4.1261 | 1.6369 | 1.1071 | 4.1261 |
| 8.261 | 8.713 | 8.902 | 8.892 | - | |
| Vmin (pu)@bus | 0.9435@12 | 0.9835@7 | 0.9913@6 | 0.9908@6 | 0.9835@7 |
| APSFS (kW) | 455.7 | 210.80 | 165.9 | 205.0 | N. A |
| RPSFS (kVAr) | 413.0 | 409.10 | 274.1 | 194.2 | N. A |
| Cost of Pdg (USD/h) | - | 4.95 | 5.722 | 4.912 | 4.948 |
| Cost of Qdg (USD/h) | - | - | 0.0548 | 0.1446 | - |
| AELC (USD) | 10,877.24 | 5654.77 | 2353.7 | 1650.38 | 5662.8 |
| ELCS (USD) | - | 5222.47 | 8523.6 | 9226.86 | 5214.43 |
| RRCEL % | 0% | 48% | 78.36% | 84.83% | 47.93% |
| Technical and Economic Analyses | No DG | With a Single DG at 1.0 pf | With a Single DG at 0.9 pf lag | With Double DGs | With Triple DGs |
|---|---|---|---|---|---|
| Case I | Case II | Case III | Case IV | Case V | |
| DG Placement | - | 6 | 6 | 13 and 30 | 13, 24 and 30 |
| DG size (kVA), pf@bus | - | 2589 | 3011 | 957.55, 0.908@13 1514.7, 0.714@30 | 870.18, 0.905@13 1176.2, 0.897@24 1445.37, 0.713@30 |
| Total Ploss (kW) | 210.85 | 110.90 | 70.790 | 28.57 | 11.73 |
| Total Qloss (kVAr) | 143.02 | 81.67 | 56.716 | 20.33 | 9.76 |
| 26.80 | 28.44 | 29.05 | 29.967 | 30.11 | |
| Vmin (pu)@bus | 0.9039@18 | 0.9425@18 | 0.9566@18 | 0.9802@25 | 0.9919@8 |
| APSFS (kW) | 3925.8 | 1236.9 | 1075.9 | 1791.6 | 854.10 |
| RPSFS (kVAr) | 2443.0 | 2381.7 | 1044.2 | 860.3 | 405.80 |
| Cost of Pdg (USD/h) | - | 52.03 | 54.45 | 39.54 | 58.20 |
| Cost of Qdg (USD/h) | - | - | 0.5423 | 0.9200 | 1.0985 |
| AELC (USD) | 110,376 | 58,289 | 37,207.224 | 14,979.6 | 6165.3 |
| ELCS (USD) | - | 52,087 | 73,168.80 | 95,396.4 | 104,210.7 |
| RRCEL % | 0.0% | 47.2% | 66.3% | 86.43% | 94.42% |
| Technical and Economic Analyses | Single DG at 0.9 pf | Triple DGs with Different pf | ||||
|---|---|---|---|---|---|---|
| Proposed Method | SA [30] | DFA [14] | Proposed Method | PABC [43] | BSOA [15] | |
| DG Placement | 6 | 16 | 6 | 13, 24, and 30 | 12, 25, and 30 | 13, 29, and 31 |
| DG size (kVA), pf@bus | 3011 | 1200 | 3073.5 | 870.18, 0.905@13 1176.2, 0.897@24 1445.37, 0.713@30 | 1014, 0.85@12 960, 0.85@25 1363.5, 0.85@30 | 698, 0.86@13 402, 0.71@29 658, 0.70@31 |
| Total Ploss (kW) | 70.790 | 112.78 | 70.86 | 11.73 | 15.91 | 29.65 |
| Total Qloss (kVAr) | 56.716 | 77.45 | 56.77 | 9.76 | N. A | 21.23 |
| 29.05 | - | - | 30.11 | - | - | |
| Vmin (pu) | 0.9566 | 0.937 | 0.9566 | 0.9919 | 0.9889 | 0.979 |
| APSFS (kW) | 1075.9 | 2845.97 | N. A | 854.10 | N. A | N. A |
| RPSFS (kVAr) | 1044.2 | 1919.96 | N. A | 405.80 | N. A | N. A |
| Cost of Pdg (USD/h) | 54.45 | 21.85 | 55.57 | 58.20 | 57.50 | 27.176 |
| Cost of Qdg (USD/h) | 0.5423 | 0.2161 | 0.554 | 1.0985 | 1.5464 | 0.7284 |
| AELC (USD) | 37,207.224 | 59,277.17 | 37,244.02 | 6165.3 | 8362.3 | 15,584.04 |
| ELCS (USD) | 73,168.80 | 51,098.8 | 73,131.98 | 104,210.7 | 102,013.7 | 94,791.96 |
| RRCEL % | 66.3% | 46.30% | 66.25% | 94.42% | 92.42% | 85.88% |
| Technical and Economic Analyses | No DG | With a Single DG at 1.0 pf | With a Single DG at 0.9 pf lag | With Double DGs | With Triple DGs |
|---|---|---|---|---|---|
| Case I | Case II | Case III | Case IV | Case V | |
| DG Placement | - | 61 | 61 | 17 and 61 | 11, 17, and 61 |
| DG size (kVA), pf@bus | - | 1871 | 2217 | 635.14, 0.834@17 2136.63, 0.814@61 | 608.73, 0.812@11 454, 0.835@17 2057.6, 0.814@61 |
| Total Ploss (kW) | 224.978 | 83.20 | 27.943 | 7.200 | 4.20 |
| Total Qloss (kVAr) | 102.15 | 40.53 | 16.45 | 8.045 | 6.76 |
| 55.02 | 56.85 | 57.23 | 57.99 | 58.20 | |
| Vmin (pu)@bus | 0.9092@65 | 0.9683@27 | 0.9724@27 | 0.9942@50 | 0.9943@50 |
| APSFS (kW) | 4026.9 | 2014.1 | 1834.5 | 1549.1 | 1257.7 |
| RPSFS (kVAr) | 2796.7 | 2735.1 | 1744.4 | 1112.6 | 901.4 |
| Cost of Pdg (USD/h) | - | 37.67 | 40.156 | 45.87 | 51.72 |
| Cost of Qdg (USD/h) | - | - | 0.3994 | 0.8971 | 1.433 |
| AELC (USD) | 118,248.43 | 43,729.9 | 14,686.8 | 3784.32 | 2207.52 |
| ELCS (USD) | - | 74,518.51 | 103,561.6 | 114,464.11 | 116,040.91 |
| RRCEL % | 0% | 63.02% | 87.6% | 96.80% | 98.13% |
| Technical and Economic Analyses | Proposed Method | VSI [30] | Hybrid [44] | PSO [44] | |
|---|---|---|---|---|---|
| One DG at 0.9 pf lag | Triple DGs | One DG at 0.9 pf lag | Triple DGs | Triple DGs | |
| DG Placement | 61 | 11, 17, and 61 | 65 | 18, 61, and 66 | 11, 18, and 61 |
| DG size (kVA), pf@bus | 2217 | 608.73, 0.812@11 454, 0.835@17 2057.6, 0.814@61 | 1750 | 480, 0.77@18 2060,0.83@61 530, 0.82@66 | 600, 0.83@11 460, 0.81@18 2060, 0.81@61 |
| Total Ploss (kW) | 27.943 | 4.20 | 65.45 | 4.30 | 4.61 |
| Total Qloss (kVAr) | 16.45 | 6.76 | 35.625 | N. A | N. A |
| 57.23 | 58.10 | - | - | - | |
| Vmin (pu) | 0.9724 | 0.9943 | 0.9693 | N. A | N. A |
| APSFS (kW) | 1834.5 | 1257.7 | 2415.28 | N. A | N. A |
| RPSFS (kVAr) | 1744.4 | 901.4 | 2032.92 | N. A | N. A |
| Cost of Pdg (USD/h) | 40.156 | 51.72 | 31.75 | 51.03 | 51.534 |
| Cost of Qdg (USD/h) | 0.3994 | 1.433 | 0.3160 | 1.3840 | 1.0357 |
| AELC (USD) | 14,686.8 | 2207.52 | 34,400.5 | 2260.08 | 2423.02 |
| ELCS (USD) | 103,561.6 | 116,040.91 | 83,847.91 | 115,988.35 | 115,825.41 |
| RRCEL % | 87.6% | 98.13% | 70.9% | 98.08% | 97.95% |
Disclaimer/Publisher’s Note: The statements, opinions and data contained in all publications are solely those of the individual author(s) and contributor(s) and not of MDPI and/or the editor(s). MDPI and/or the editor(s) disclaim responsibility for any injury to people or property resulting from any ideas, methods, instructions or products referred to in the content. |
© 2025 by the authors. Licensee MDPI, Basel, Switzerland. This article is an open access article distributed under the terms and conditions of the Creative Commons Attribution (CC BY) license (https://creativecommons.org/licenses/by/4.0/).
Share and Cite
Mokred, S.; Wang, Y.; Alruwaili, M.; Ibrahim, M.A. A Novel Approach for Voltage Stability Assessment and Optimal Siting and Sizing of DGs in Radial Power Distribution Networks. Processes 2025, 13, 2239. https://doi.org/10.3390/pr13072239
Mokred S, Wang Y, Alruwaili M, Ibrahim MA. A Novel Approach for Voltage Stability Assessment and Optimal Siting and Sizing of DGs in Radial Power Distribution Networks. Processes. 2025; 13(7):2239. https://doi.org/10.3390/pr13072239
Chicago/Turabian StyleMokred, Salah, Yifei Wang, Mohammed Alruwaili, and Moustafa Ahmed Ibrahim. 2025. "A Novel Approach for Voltage Stability Assessment and Optimal Siting and Sizing of DGs in Radial Power Distribution Networks" Processes 13, no. 7: 2239. https://doi.org/10.3390/pr13072239
APA StyleMokred, S., Wang, Y., Alruwaili, M., & Ibrahim, M. A. (2025). A Novel Approach for Voltage Stability Assessment and Optimal Siting and Sizing of DGs in Radial Power Distribution Networks. Processes, 13(7), 2239. https://doi.org/10.3390/pr13072239