Abstract
As a core component in renewable energy systems for grid regulation, hydropower units are increasingly exposed to flow conditions that elevate the risk of cavitation and erosion, posing significant challenges to the safe operation of flow-passage components. In this study, model testing and computational fluid dynamics (CFD) simulations are employed to investigate the hydraulic performance and cavitation behavior of a bulb turbine operating under rated head conditions and varying cavitation numbers. The analysis focuses on how changes in cavitation intensity affect flow characteristics and efficiency within the runner region. The results show that as the cavitation number approaches its critical value, the generation, growth, and collapse of vapor cavities increasingly disturb the main flow, causing a marked drop in blade hydraulic performance and overall turbine efficiency. Cavitation predominantly occurs on the blade’s suction side near the trailing edge rim and in the clearance zone near the hub, with bubble coverage expanding as the cavitation number decreases. A periodic inverse correlation between surface pressure and the cavitation area is observed, reflecting the strongly unsteady nature of cavitating flows. Furthermore, lower cavitation numbers lead to intensified pressure pulsations, aggravating flow unsteadiness and raising the risk of vibration.
1. Introduction
Driven by the global shift in energy structure and carbon neutrality strategies, hydropower—one of the most mature and scalable renewable energy sources—plays a critical role in grid balancing, frequency regulation, and energy storage [1]. To accommodate the operational flexibility required by the integration of intermittent renewables, modern hydraulic turbines—particularly bulb turbines—are increasingly subjected to frequent start–stop cycles and off-design conditions, making their hydraulic performance and cavitation resistance under complex flow regimes a focus of recent research.
Cavitation is recognized as a key factor affecting the operational stability and lifespan of hydraulic turbines. It causes efficiency loss; flow instability; structural vibration; and in severe cases, material erosion [2,3,4,5]. These effects become particularly pronounced under low cavitation number conditions, where vapor bubbles form, grow, and collapse rapidly, disrupting the main flow and significantly reducing energy conversion efficiency. To accurately capture these cavitation phenomena and their impact on turbine performance, computational fluid dynamics (CFD) has emerged as a widely applied approach, providing a powerful complement to traditional model testing [6,7,8].
Recent studies have extended cavitation research beyond steady-state performance into areas such as unsteady flow behavior, vibration responses, and cavitation-induced flow instabilities. For example, Li et al. [9] investigated cavitation effects in a pump-turbine during hump region operations, revealing that the periodic oscillations of backflow and blade surface cavitation collapse are responsible for specific pressure fluctuation frequencies (1.344 fn and 2.88 fn), thereby deepening our understanding of cavitation-induced dynamic instability. Similarly, Laouari and Ghenaiet [10] conducted two-phase flow simulations in a small Francis turbine and found that under part-load and overload conditions, vortex rope formation and cavitation-induced flow disturbances lead to intensified pressure and torque fluctuations, posing more severe design challenges for small-scale turbines. In experimental research on bulb turbines, Feng et al. [11] observed that increasing cavitation severity significantly amplified runner vibration amplitudes and caused frequency migration toward the low-frequency region, highlighting the strong fluid–structure interaction effects induced by cavitation.
Furthermore, Dular et al. [12] examined Kelvin–Helmholtz instability in cavitating Venturi microchannel flows and identified it as a third cloud-shedding mechanism alongside re-entrant jet and condensation shock. This finding underscores the crucial role of interfacial instabilities in cavity dynamics. Podnar et al. [13] analyzed the cavitation behavior of bulb turbine hydrofoils and confirmed through visualization and regression models that modified blade profiles significantly delayed cavitation inception and reduced cavity length, highlighting the influence of geometric optimization. Meanwhile, Coutier-Delgosha et al. [14] used advanced DES turbulence models to simulate hydrodynamic cavitation in Venturi configurations, emphasizing the importance of 3D cavitation-turbulence interactions and identifying the limitations of conventional RANS in capturing cavity morphology and turbulence evolution.
While these studies have advanced our understanding of cavitation-induced instabilities across various turbine types, comprehensive investigations of the cavitation evolution, energy performance variations, and blade efficiency response in bulb turbines under rated flow and low cavitation number conditions remain limited. Existing research often focuses on steady-state flow fields or cavitation onset locations without quantifying their coupling with surface pressure evolution or capturing their unsteady characteristics [15].
To address this gap, the present study takes a bulb turbine as the research object, employing both model experiments and CFD two-phase flow simulations to systematically analyze the variation in energy performance, cavitation region evolution, and its correlation with blade surface pressure under rated head and varying cavitation numbers. The aim is to elucidate the mechanisms by which cavitation affects blade energy transfer and to provide theoretical support for anti-cavitation structural design and the operational reliability enhancement of bulb turbines.
2. Theoretical Analysis of Cavitating Flow
2.1. Cavitating Flow Theory and Model
Cavitation refers to the phenomenon in which vapor bubbles or cavities form in a liquid when the local pressure drops below the vapor pressure. In fluid machinery such as hydraulic turbines, cavitation can severely impair operating performance and even cause mechanical damage. The occurrence of cavitating flow requires certain conditions: when the local pressure of the fluid drops below its saturated vapor pressure, evaporation begins, and vapor cavities are formed. As the pressure recovers or increases, these cavities collapse rapidly, generating pressure fluctuations that further destabilize the flow field.
In liquids, the onset of cavitation is mainly influenced by several factors, including fluid velocity, pressure, external geometric boundaries, and critical pressure (Pcrit). When the difference between the reference pressure, P0, and the vapor pressure, Pv, is sufficiently large, cavitation is less likely to occur. Conversely, an increase in flow velocity, U0, tends to reduce the local pressure, thus promoting cavitation. Therefore, dynamic pressure, , is considered the primary driving factor for the initiation of cavitation. To quantify the balance between the forces suppressing and promoting cavitation, a dimensionless number called the cavitation number, σ, is defined, as shown in Equation (1).
This parameter serves as an important indicator of the fluid’s susceptibility to cavitation: lower values of σ indicate a higher likelihood of cavitation, while higher values suggest a more stable flow condition. Different stages of cavitation can be characterized using specific values of the cavitation number. The incipient cavitation number, σi, refers to the critical condition under which the first vapor bubbles form when the local pressure drops close to the vapor pressure, although large-scale cavitation has not yet developed. The disappearance cavitation number, σd, on the other hand, denotes the condition when cavitation has entirely vanished, and the flow returns to a non-cavitating state. Typically, σd > σi, indicating the hysteresis and partial irreversibility of the cavitation process.
Equations (2) and (3) represent the formulations of σi and σd, respectively, where P0i and P0d are the reference pressures at incipient and disappearing cavitation, and U0i and U0d are the corresponding characteristic velocities.
2.2. Cavitation Number and Its Calculation
To further determine the possibility of cavitation under various operating conditions, the sum of dynamic and static vacuum values can be used as a diagnostic criterion. During turbine operation, the fluid pressure on the blade surface varies with flow conditions. When the pressure at a certain location drops below the saturated vapor pressure at the given water temperature, cavitation is likely to occur.
In such cases, the cavitation number, σ, can be used to estimate the minimum pressure, pk, at a critical location on the runner blade surface, as shown in Equation (4):
where pk is the local pressure at the lowest point on the runner blades, pa is the external atmospheric pressure, Hs is the static pressure height at the position of the turbine, and σ is the cavitation number. In order to prevent cavitation at the lowest pressure point, k, it is necessary to ensure that the pressure at that point is higher than the saturated vapor pressure of the liquid, [16], which can be achieved by calculating the pressure margin, which is expressed as
The relative value of the pressure allowance can be expressed as Equation (6):
where σp is the cavitation coefficient, also known as the cavitation coefficient of the turbine unit, also known as the Thomas coefficient, which is the relative value of the pressure margin reserved for the feed turbine of the power station device [17].
3. Numerical Simulation Method
3.1. Computational Model Setup
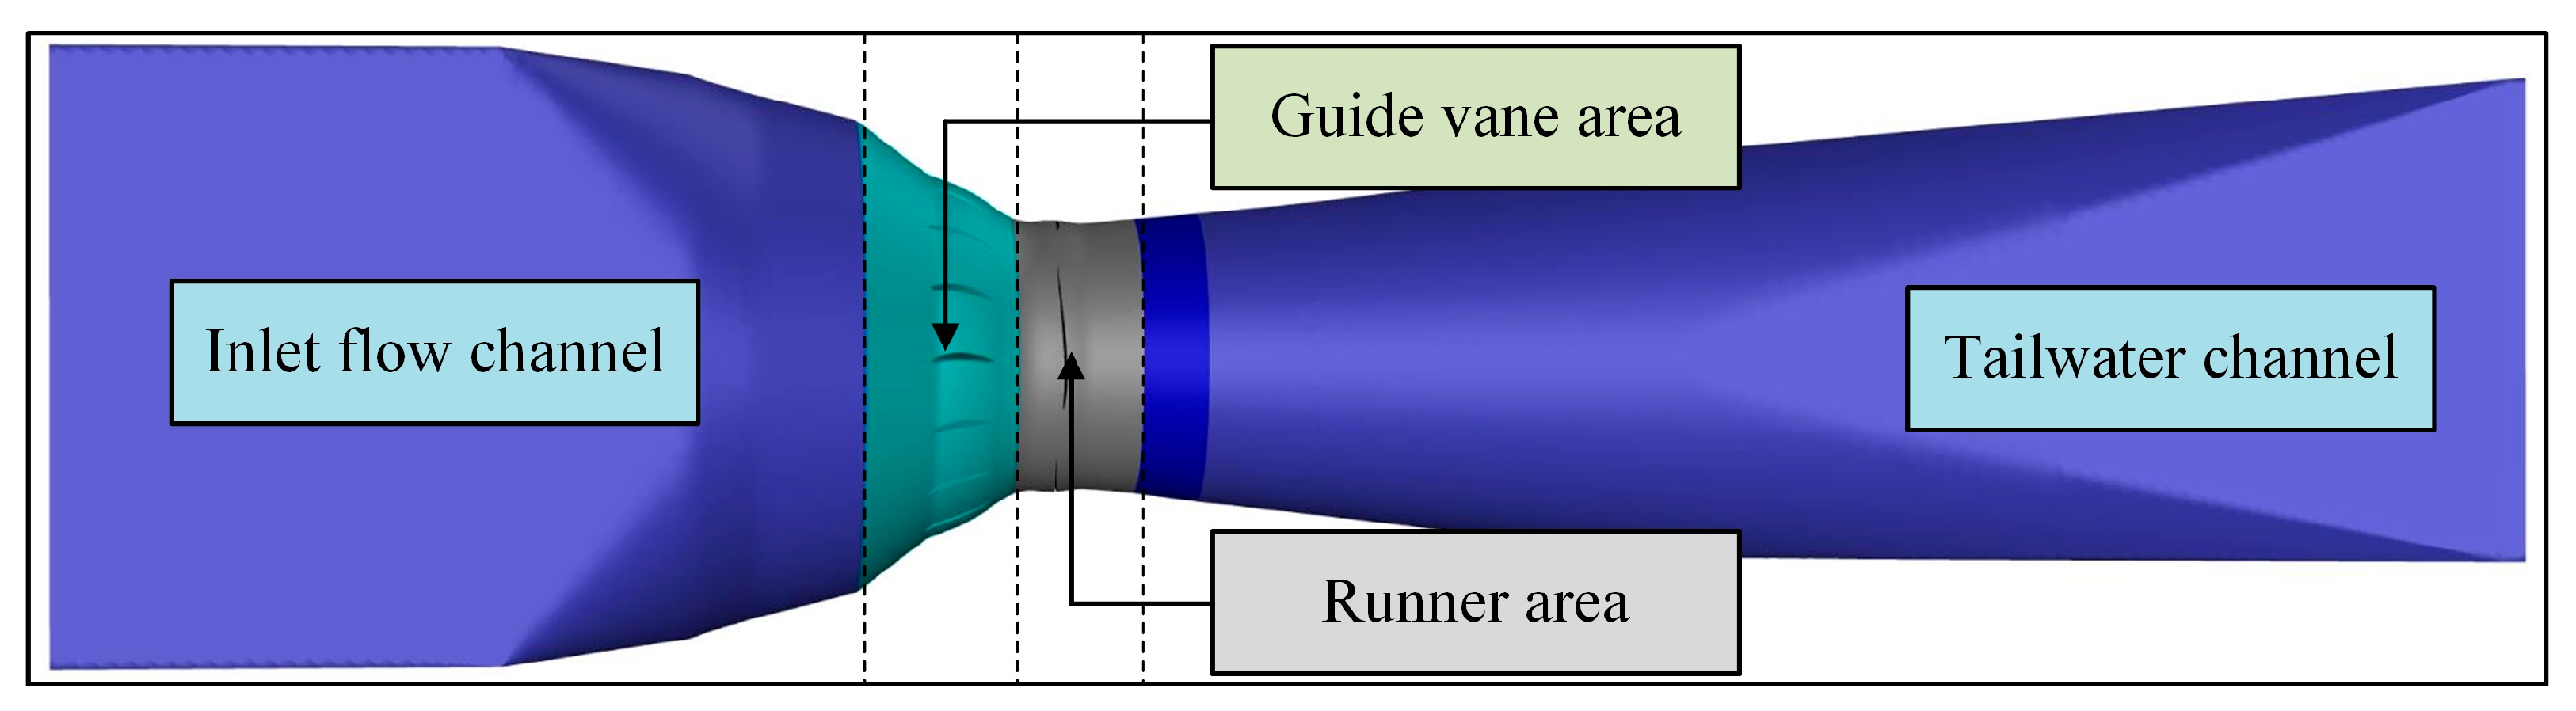
In this study, a 24 MW prototype bulb turbine unit from a hydropower station was selected as the research object. The total installed capacity of the station is 96 MW, with an annual average power generation of approximately 491 million kWh. The main design parameters are listed in Table 1. Based on these parameters, a computational domain and surface region for the unit’s internal flow field were constructed, as shown in Figure 1. The computational domain includes the intake passage, guide vane section, runner region, and draft tube. The surface boundaries are used for setting boundary conditions and visualizing computational results.

Table 1.
Geometrical parameters of a through-flow turbine.
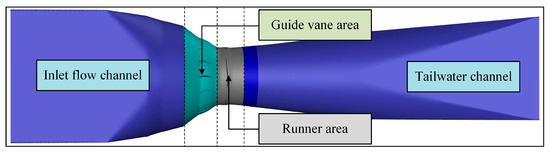
Figure 1.
Schematic diagram of the flow field structure of a hydro turbine.
In the numerical simulation of hydraulic turbine flow fields, water is generally treated as an incompressible fluid. Given the negligible thermal exchange during operation, the energy conservation equation is omitted. Under these assumptions, the flow behavior is described using the continuity equation and the Navier–Stokes equations for three-dimensional viscous flow [1,18,19]:
In the above equation, ρ denotes the density of the fluid; μ represents a velocity vector; u, v, and w represent the components of velocity in the x, y, and z directions, respectively; P is the pressure; Su, Sv, and Sw are conservation of momentum in different directions of the generalized source term; and ϕ is the dynamic viscosity coefficient. In view of the complex curved structure of the guide vane, impeller, and runner chamber walls and the need to capture the overall flow characteristics, a turbulence model using SST k-ε was used in this study.
In the simulation process, mesh generation plays a critical role in ensuring both computational accuracy and numerical stability. Depending on the geometric complexity of different regions, appropriate grid types were selected. The inlet passage, bulb body, and draft tube feature relatively regular geometries and were meshed using structured hexahedral grids, while the runner region—with its highly twisted and irregular surfaces—was discretized using unstructured tetrahedral meshes, which offer better adaptability to complex geometries.
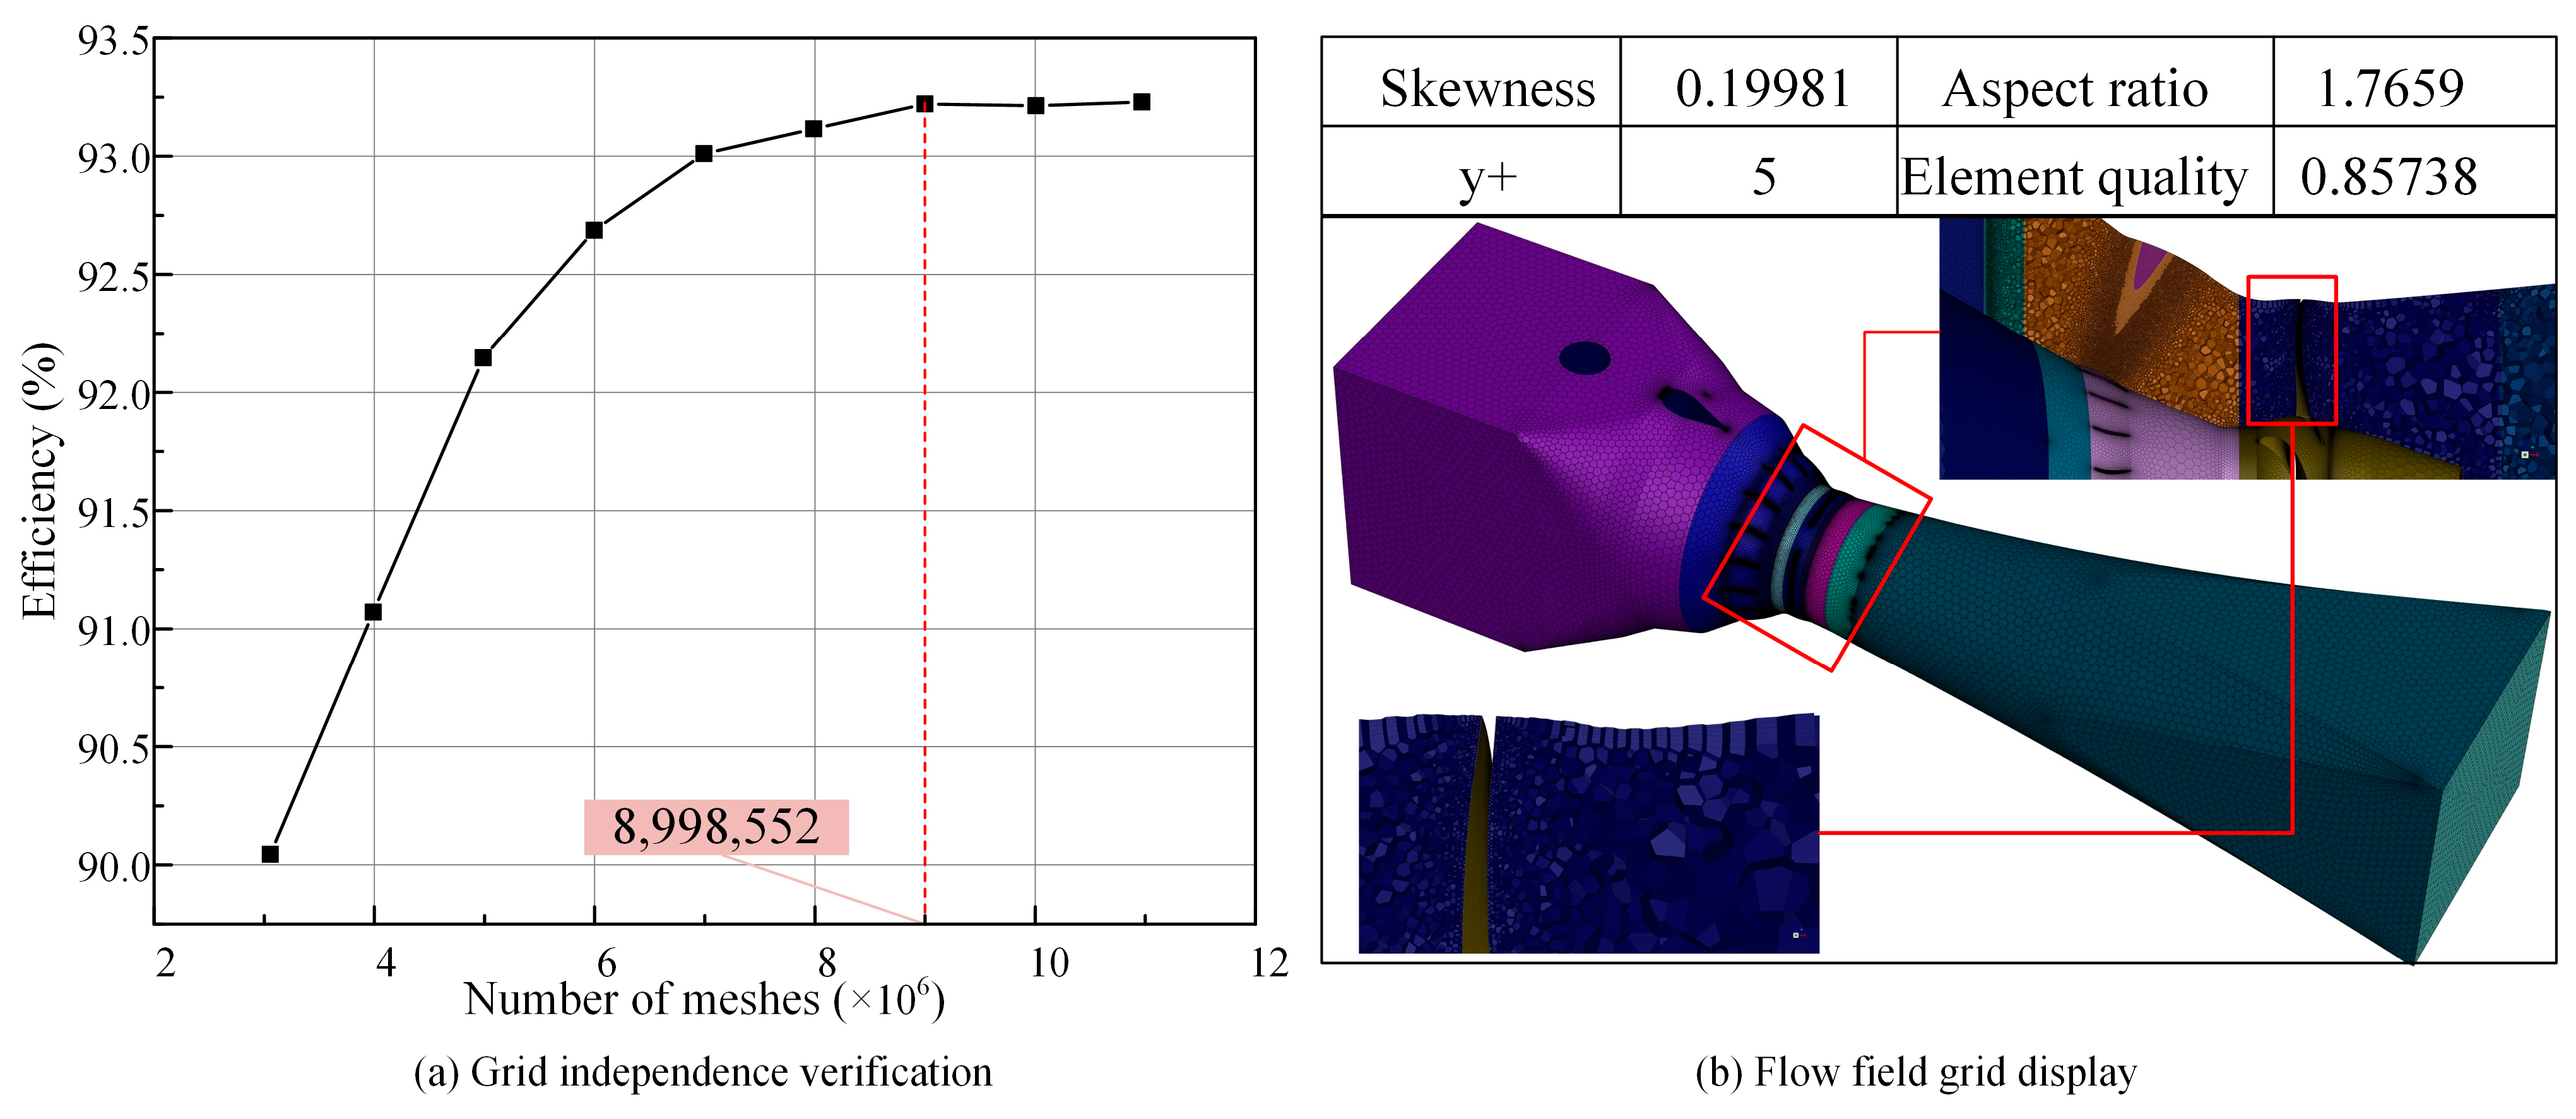
To validate the reliability and independence of the numerical results, grid independence verification was performed. Taking the representative operating condition ϕ = 25, n11 = 118.31 r/min, simulations were conducted using different node and element counts.
To ensure the accurate resolution of key flow structures and reliable cavitation prediction, a high-quality hybrid mesh was generated using ANSYS 2023R1 Fluent meshing tools. Structured hexahedral elements were applied to the upstream pipe, stay vanes, and draft tube, while unstructured tetrahedral elements were used in the runner domain to accommodate the complex blade geometry. Inflation layers were added along all solid walls to resolve the near-wall boundary layer, maintaining a dimensionless wall distance (y+) below 50.
A mesh independence study was conducted using nine levels of grid resolution. As shown in Figure 2a, when the mesh count exceeded approximately 10 million elements, the computed efficiency stabilized with negligible variation, indicating sufficient grid convergence. Based on this analysis, a final mesh containing 8,998,552 elements was adopted for all simulations, as illustrated in Figure 2b.
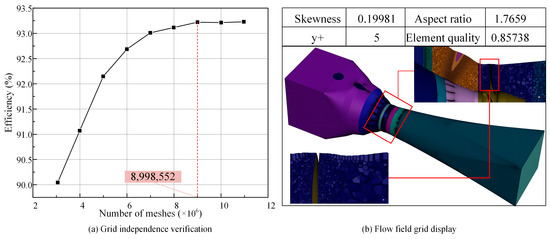
Figure 2.
Grid independence verification and grid display.
For turbulence modeling, the SST k-ε model was employed, which combines the advantages of the k-ε and k-ω models. The k-ω formulation was applied to near-wall regions to better resolve shear flows, while the k-ε model handled the free-stream region to improve global prediction accuracy. Turbulence model coefficients were set as Cμ = 0.0845, C1-ε = 1.42, and C2-ε = 1.68, based on prior validated studies. Additionally, the swirl-dominated flow option and differential viscosity model were activated to enhance vortex resolution and improve solution robustness in cavitating regions.
For transient cavitation simulations, the Zwart–Gerber–Belamri cavitation model was used due to its stability and broad applicability in engineering cavitation flows. A time step of 0.0024 s was chosen, corresponding to a 1° rotation of the runner per time step, ensuring a Courant–Friedrichs–Lewy (CFL) number below 1 throughout the domain. Simulation results were recorded every 10° of rotation to capture the unsteady development of vapor cavities. Each simulation was run for at least three full runner revolutions after initial stabilization to ensure the statistical convergence of transient behavior.
3.2. Validation of Numerical Method and Comparison with Experiment
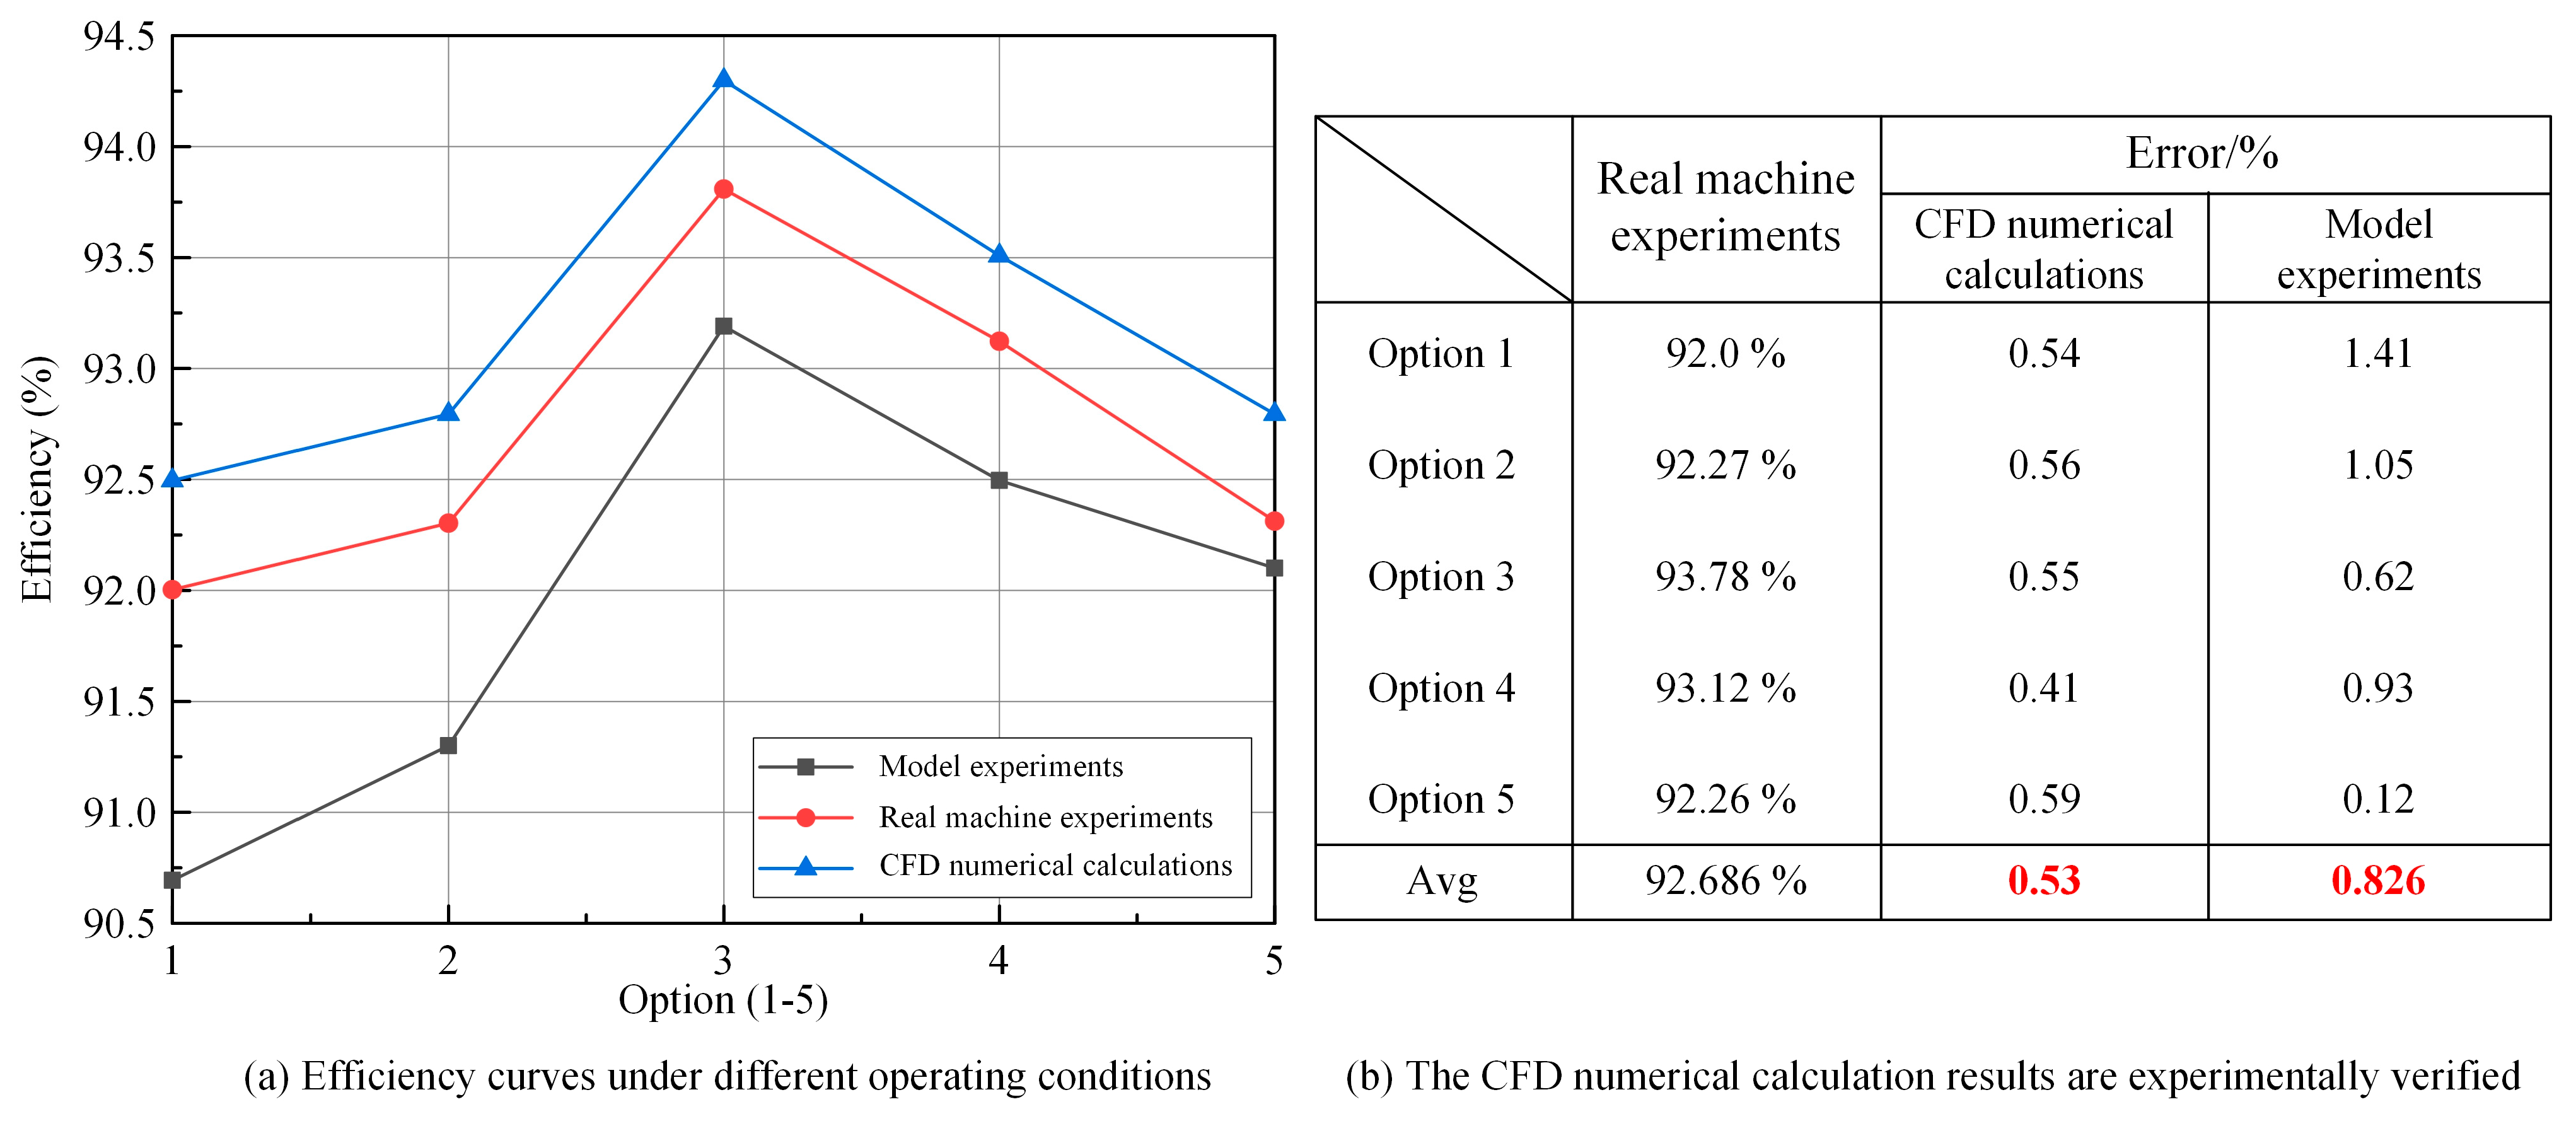
To evaluate the performance of the model turbine under various conditions, experiments were conducted at a fixed blade pitch angle by adjusting the guide vane openings to simulate different operating regimes. This approach enabled the coverage of a wide range of specific speeds and allowed for comprehensive comparison with experimental data collected across representative operating conditions. Table 2 presents the correspondence between unit speed and operating head, while Table 3 summarizes the energy performance data used as the foundation for subsequent cavitation analysis.
Table 2.
The correspondence between the unit speed and the running head.
Table 3.
Energy test data.
Under constant rotational speed, five representative operating conditions with different flow rates were selected for analysis. For each case, steady-state CFD simulations were conducted using a fixed runner length. The simulated efficiency values were then compared against both laboratory model test results and prototype performance data obtained from coordinated field testing of the actual unit. All experimental data used in this study were acquired directly by the authors during on-site and model test measurements and have not been published elsewhere, ensuring high engineering authenticity and traceability.
Figure 3a presents the efficiency curves derived from CFD simulations, model experiments, and full-scale prototype tests under rated head conditions. Across the selected flow range, the efficiency trends predicted by CFD closely align with both experimental datasets. It is observed that the model test results are consistently slightly lower than both the CFD and prototype efficiencies. This discrepancy is primarily due to two factors: the model tests report overall system efficiency including generator losses, whereas the CFD simulation focuses solely on hydraulic efficiency, leading to a relative underestimation; similarity transformation between the model and prototype introduces inevitable scale-related deviations, generally causing the prototype efficiency to appear higher.
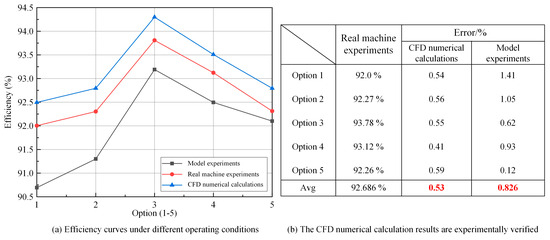
Figure 3.
Experimental comparison of numerical calculation results.
To quantitatively evaluate the prediction accuracy, the relative error between the CFD/model test results and prototype measurements is plotted in Figure 3b. The average deviation for CFD is 0.53%, while that of the model tests is 0.826% across all five operating conditions. These low deviations demonstrate that both CFD and model experiments reliably predict the turbine’s hydraulic performance, with CFD showing slightly better agreement with the real machine measurements.
In addition, the CFD-predicted efficiency curves replicate the expected performance pattern observed in the tests—i.e., lower efficiency under low flow and higher efficiency at full load—validating the accuracy of the geometric modeling and boundary condition settings. Overall, the close match across the CFD, model, and prototype data supports the credibility of the adopted numerical method in analyzing bulb turbine performance under cavitating and non-cavitating conditions.
4. Numerical Results and Analysis in the Runner Region
4.1. Pressure and Streamline Distribution on Runner Blades
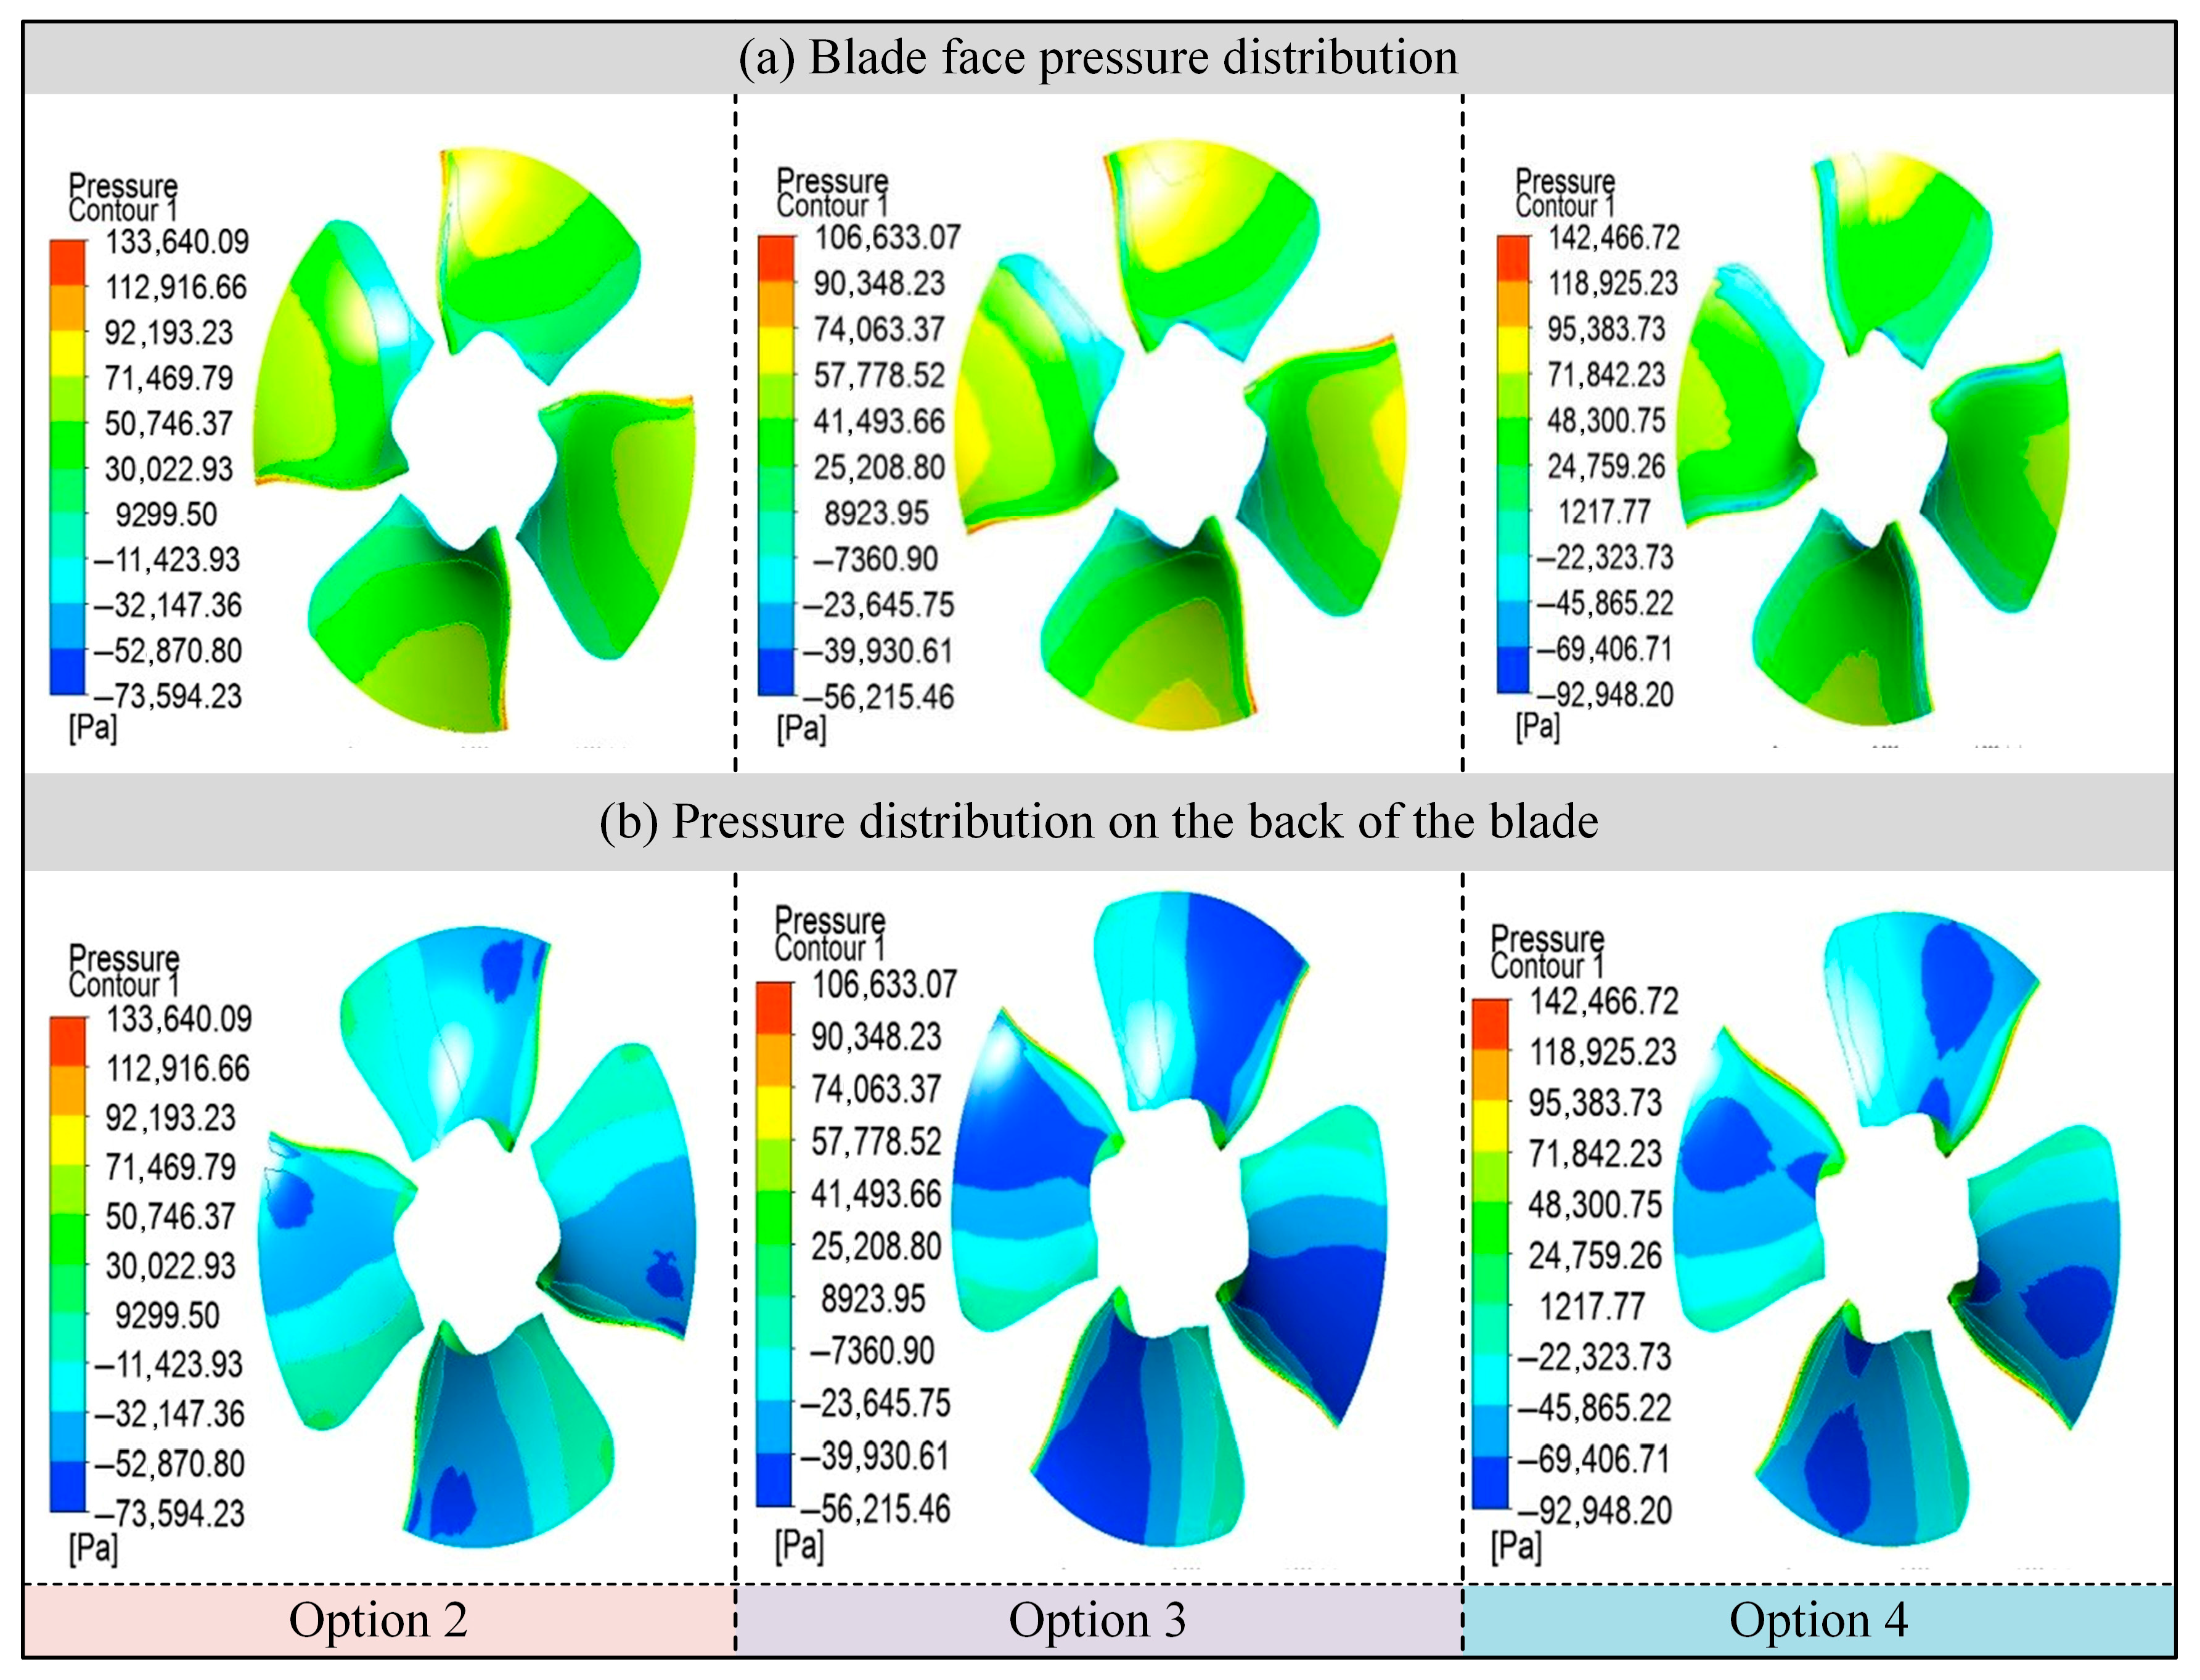
As the most critical hydraulic component of a turbine, the pressure distribution on the runner blade surface plays a crucial role in revealing the energy conversion characteristics of the runner. Figure 4 presents the pressure distribution patterns on both the pressure side and suction side of the blade under operating conditions 2, 3, and 4.

Figure 4.
Rotor blade pressure distribution.
As shown in Figure 4a, under condition 2, the pressure distribution on the pressure surface (i.e., the working surface) is relatively uniform. The pressure near the trailing edge is significantly higher than that near the hub. Along the radial direction, pressure increases gradually with blade radius, and a localized high-pressure band forms near the blade trailing edge. As the unit speed increases, this high-pressure zone gradually narrows, indicating that more of the fluid’s pressure energy is being efficiently converted into kinetic energy—consistent with the observed efficiency trends.
Figure 4b displays the pressure distribution on the suction side of the blade. Compared with the pressure side, the suction side generally exhibits lower pressure, especially near the hub and the trailing edge, where distinct low-pressure regions are observed. The significant pressure difference between the pressure and suction sides contributes to the energy conversion process. However, when the pressure on the suction side drops near the saturated vapor pressure, blade cavitation is likely to occur. With increasing unit speed, the low-pressure area on the suction side expands, and the pressure gradually increases from the root to the tip along the radial direction. A slight pressure buildup can also be observed near the blade tip.
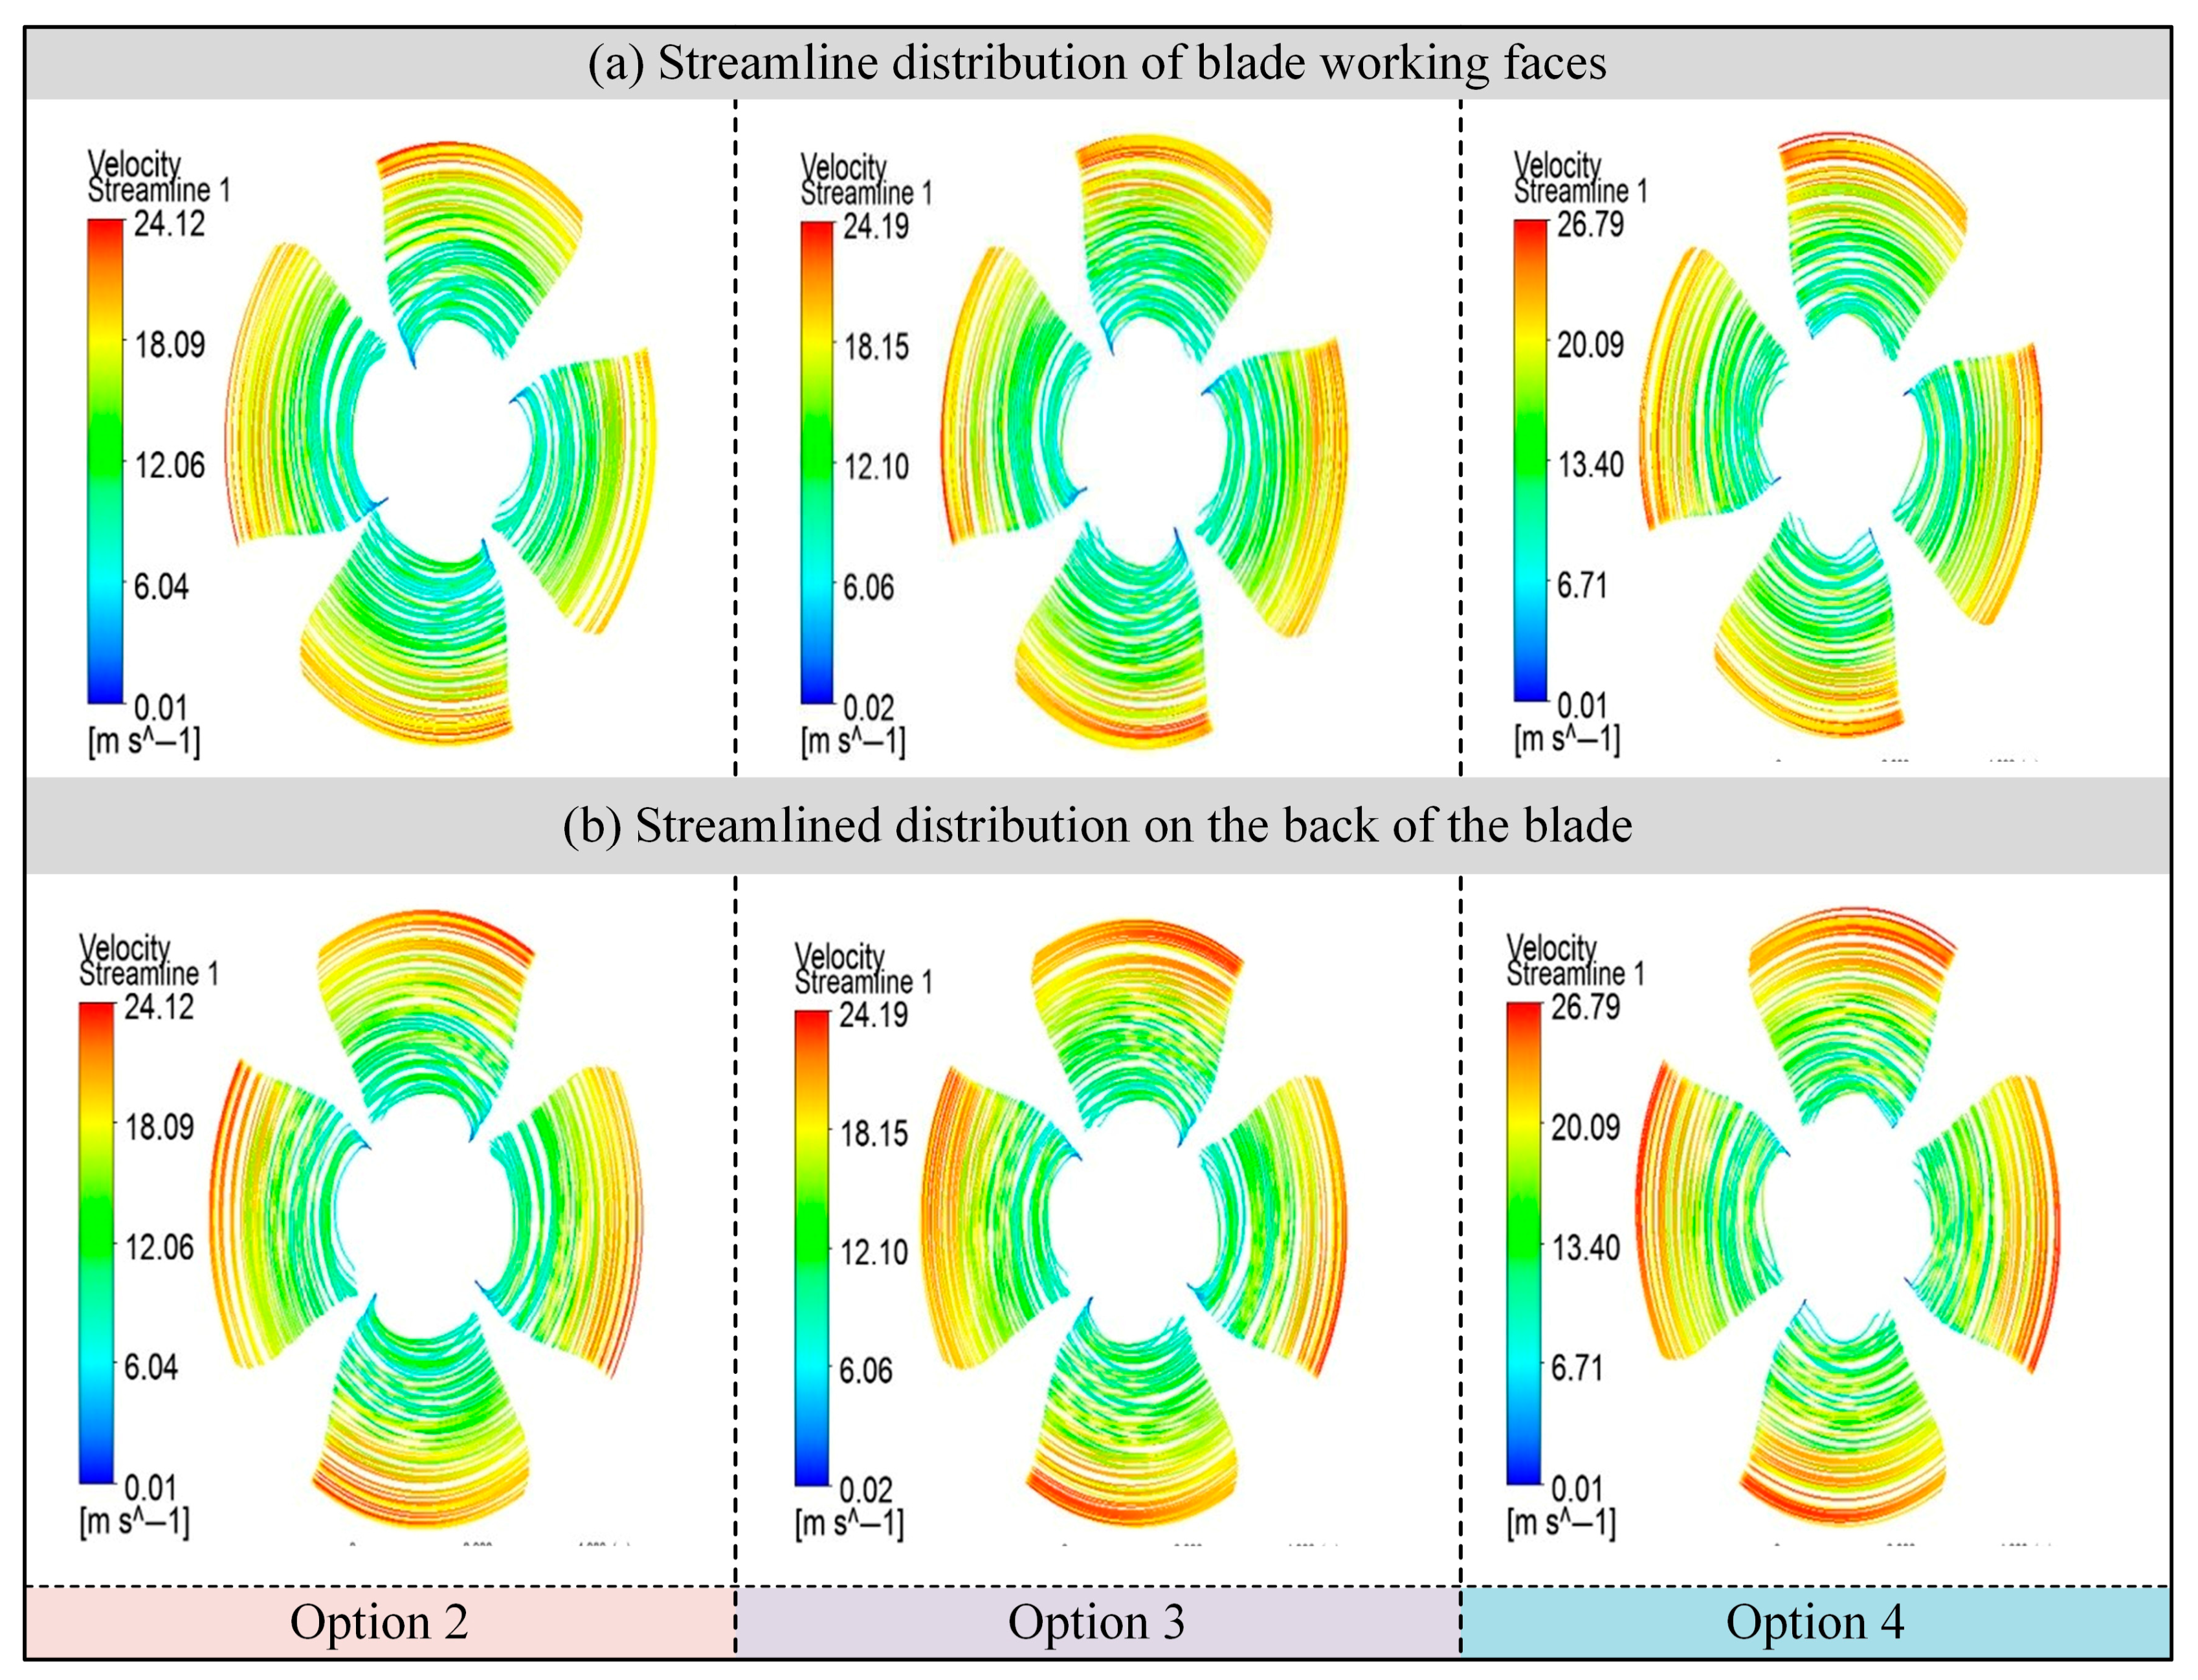
Figure 5 shows the streamline distribution on the blade surface under the same operating conditions. As seen in Figure 5a, with increasing unit speed, the streamline trajectories become more uniformly aligned and exhibit reduced curvature and deviation along the blade surface. This pattern indicates a smoother, more attached flow with minimal indications of boundary layer separation or secondary vortices. Such streamlined flow behavior contributes to lower hydraulic losses and more efficient energy conversion.
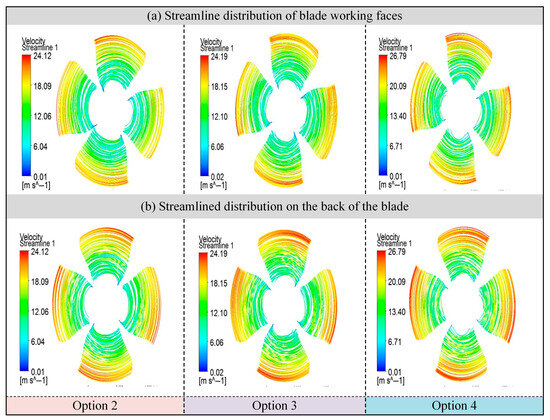
Figure 5.
Runner blade streamline distribution.
However, it is noteworthy that near the hub, streamline distributions become relatively disordered. This phenomenon becomes more pronounced at lower unit speeds and gradually extends toward the blade tip. The cause is primarily flowing separation due to the impact of the incoming flow at the blade root—especially significant under low-flow conditions. Moreover, on the suction side at the runner outlet, an increase in circumferential velocity leads to more turbulent flow patterns and the formation of recirculation zones and vortex structures, ultimately reducing the effective energy conversion of the blade.
4.2. Energy Characteristics Under Cavitating Conditions
Building upon the energy performance tests, further experiments were conducted to evaluate the cavitation resistance of the turbine under coordinated operating points with fixed blade pitch angles. These tests were performed within a unit speed range of n11 = 140~280 r/min. At each fixed unit speed, the pressure in the draft tube was adjusted to create different experimental cavitation numbers (σ), thereby inducing cavitation during gradual pressure reduction, while collecting relevant hydraulic performance data.
The experimental results show that under rated power output conditions, the critical cavitation number of the turbine is σs = 1.39, while the plant cavitation number is σp = 1.822. Accordingly, the calculated cavitation margin is expressed in Equation (8):
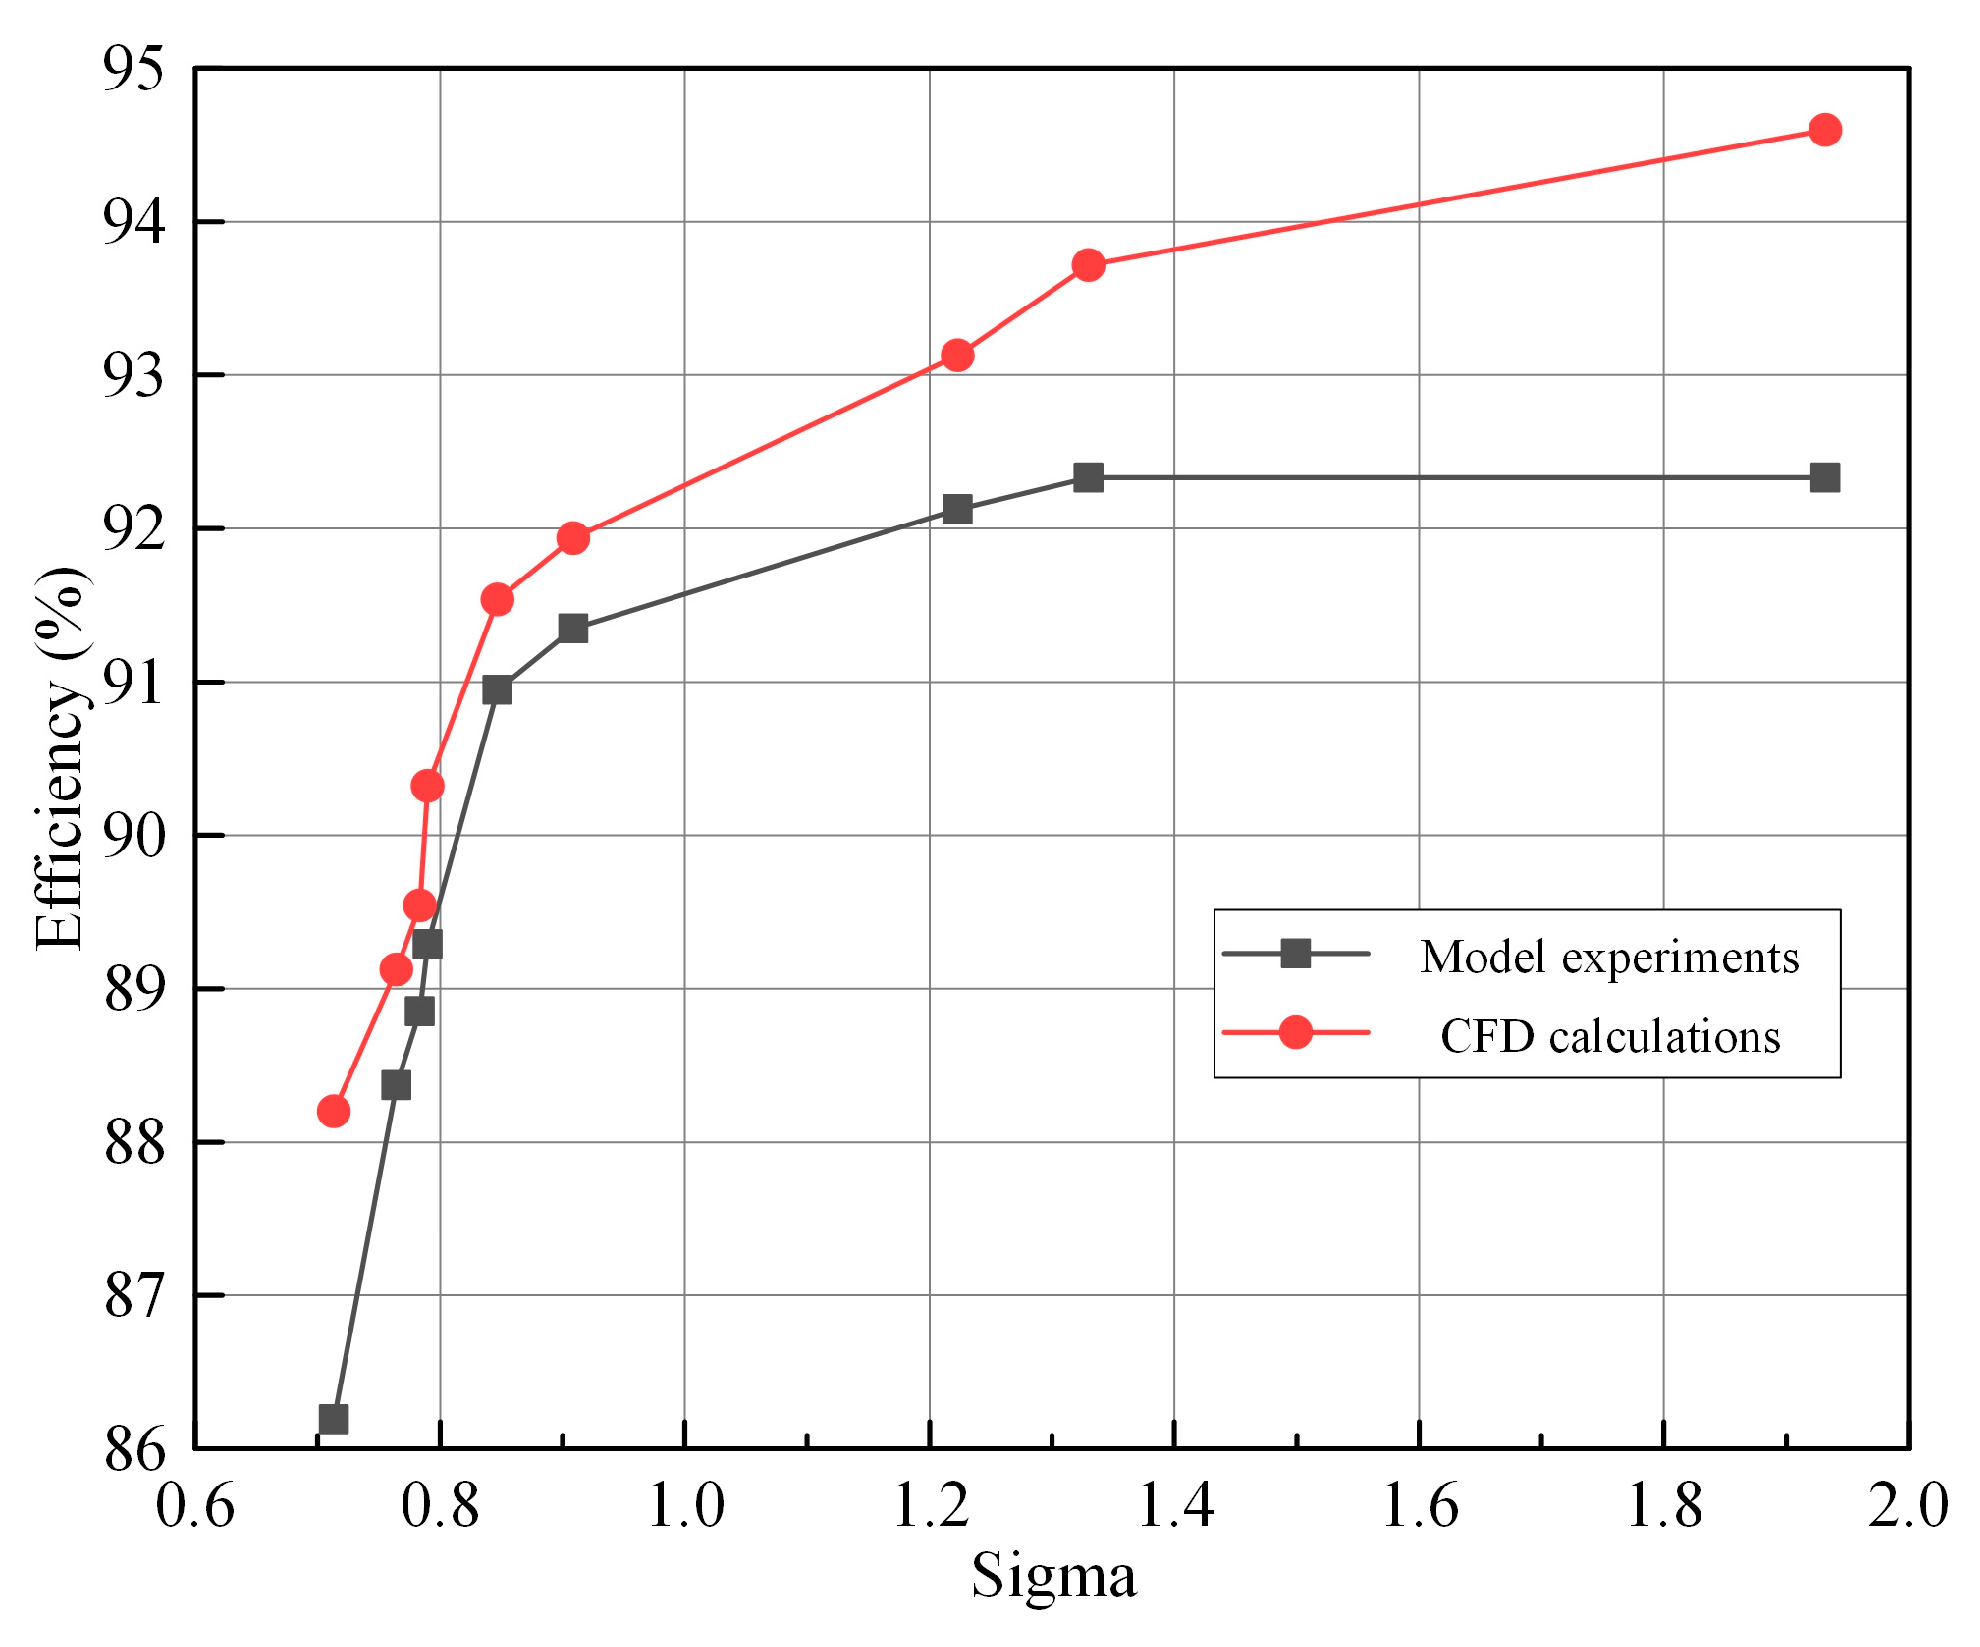
The cavitation margin is higher than the minimum requirement specified in the agreement (σs/σp ≥ 1.2), which indicates that the model turbine has a sufficient anti-cavitation ability within the operating range to meet the requirements of engineering applications. In terms of numerical simulation, working parameters and boundary conditions consistent with the physical test are used to set a constant inlet flow; the cavitation coefficient of the turbine is controlled by gradually reducing the outlet pressure to simulate the cavitation development process; and the efficiency of the turbine is calculated under each cavitation coefficient to obtain its change trend. Table 4 lists the key parameters used in cavitation tests. Figure 6 shows a comparison curve of the efficiency with the cavitation coefficient obtained by the CFD numerical simulation and the model test under the rated head condition.
Table 4.
Cavitation test parameters.

Figure 6.
Efficiency variation curve with cavitation number.
As shown in Figure 6, the efficiency trends from CFD simulations closely match those from model experiments, displaying distinct stage-wise variation. In the range of σ = 1.2~1.866, although some cavitation occurs, its impact on turbine hydraulic performance is minor, with efficiency decreasing by less than 1%. The slope of the efficiency curve remains nearly unchanged, indicating that cavitation at this stage does not significantly disturb the internal flow field, and the turbine maintains stable operation.
When the cavitation number drops further to approximately σ = 0.95, nearing the incipient cavitation number, a noticeable efficiency reduction exceeding 1% can be observed. Theoretically, this may result from localized cavitation bubbles forming near the blade trailing edge, which alters the direction of the exit flow, especially at the draft tube inlet where axial velocity increases. Though large-scale cavitation has not yet developed, these localized effects disrupt blade hydrodynamics, reflected as subtle curvature changes in the efficiency curve.
As the cavitation number approaches the critical value (around σ = 0.65), cavitation intensifies significantly. At this stage, the fluid pressure at the runner outlet continues to decrease, leading to large-scale cavitation zones forming near the runner blade exits and within the draft tube. The abundance of vapor cavities in the main flow passages reduces the effective flow area, lowers discharge and output power, and leads to a sharp drop in turbine efficiency—manifested as a steep decline in the efficiency curve. According to hydraulic machinery standards, the cavitation number at which efficiency drops by 1–5% is defined as the critical cavitation point.
It is worth noting that due to inherent limitations in CFD simulations—such as turbulence model selection, near-wall treatment, and mesh quality—the predicted cavitation number values tend to be slightly higher than experimental results. This conservative bias aligns with findings reported in the literature and underscores the importance of integrating experimental data to calibrate and validate numerical simulations for accurate cavitation prediction in engineering applications.
4.3. Vapor Bubble Volume Fraction on Blade Surface
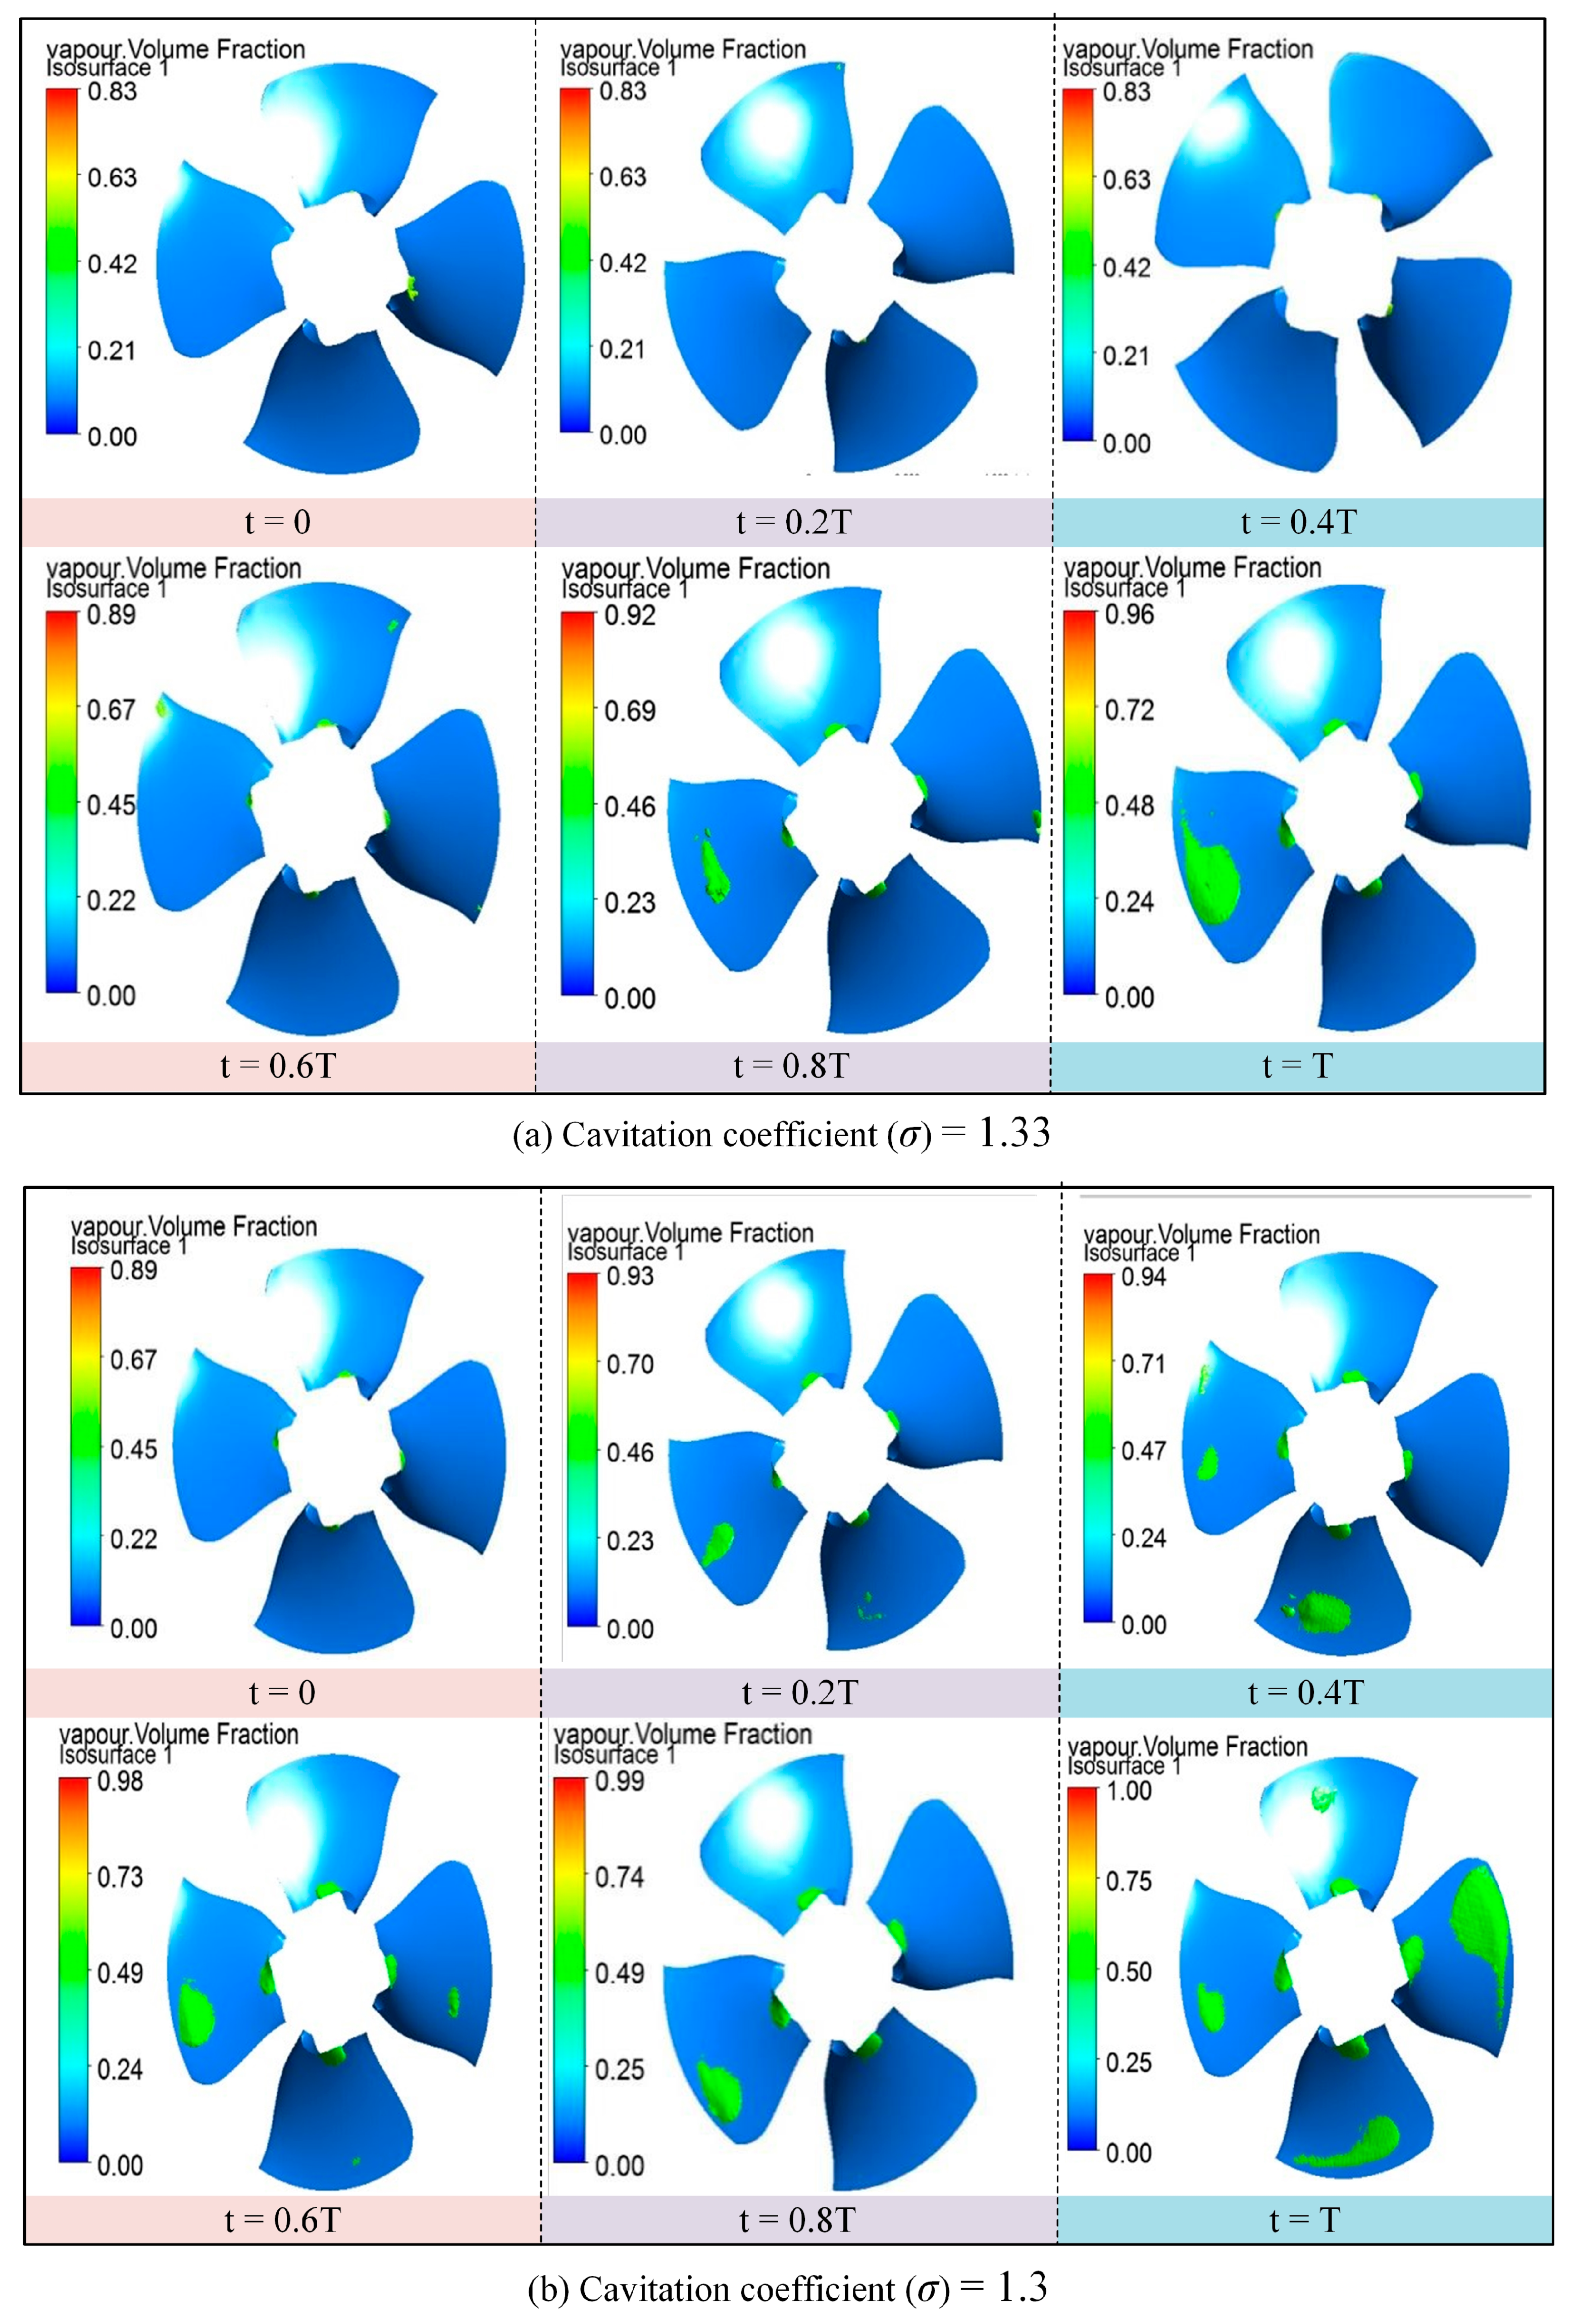
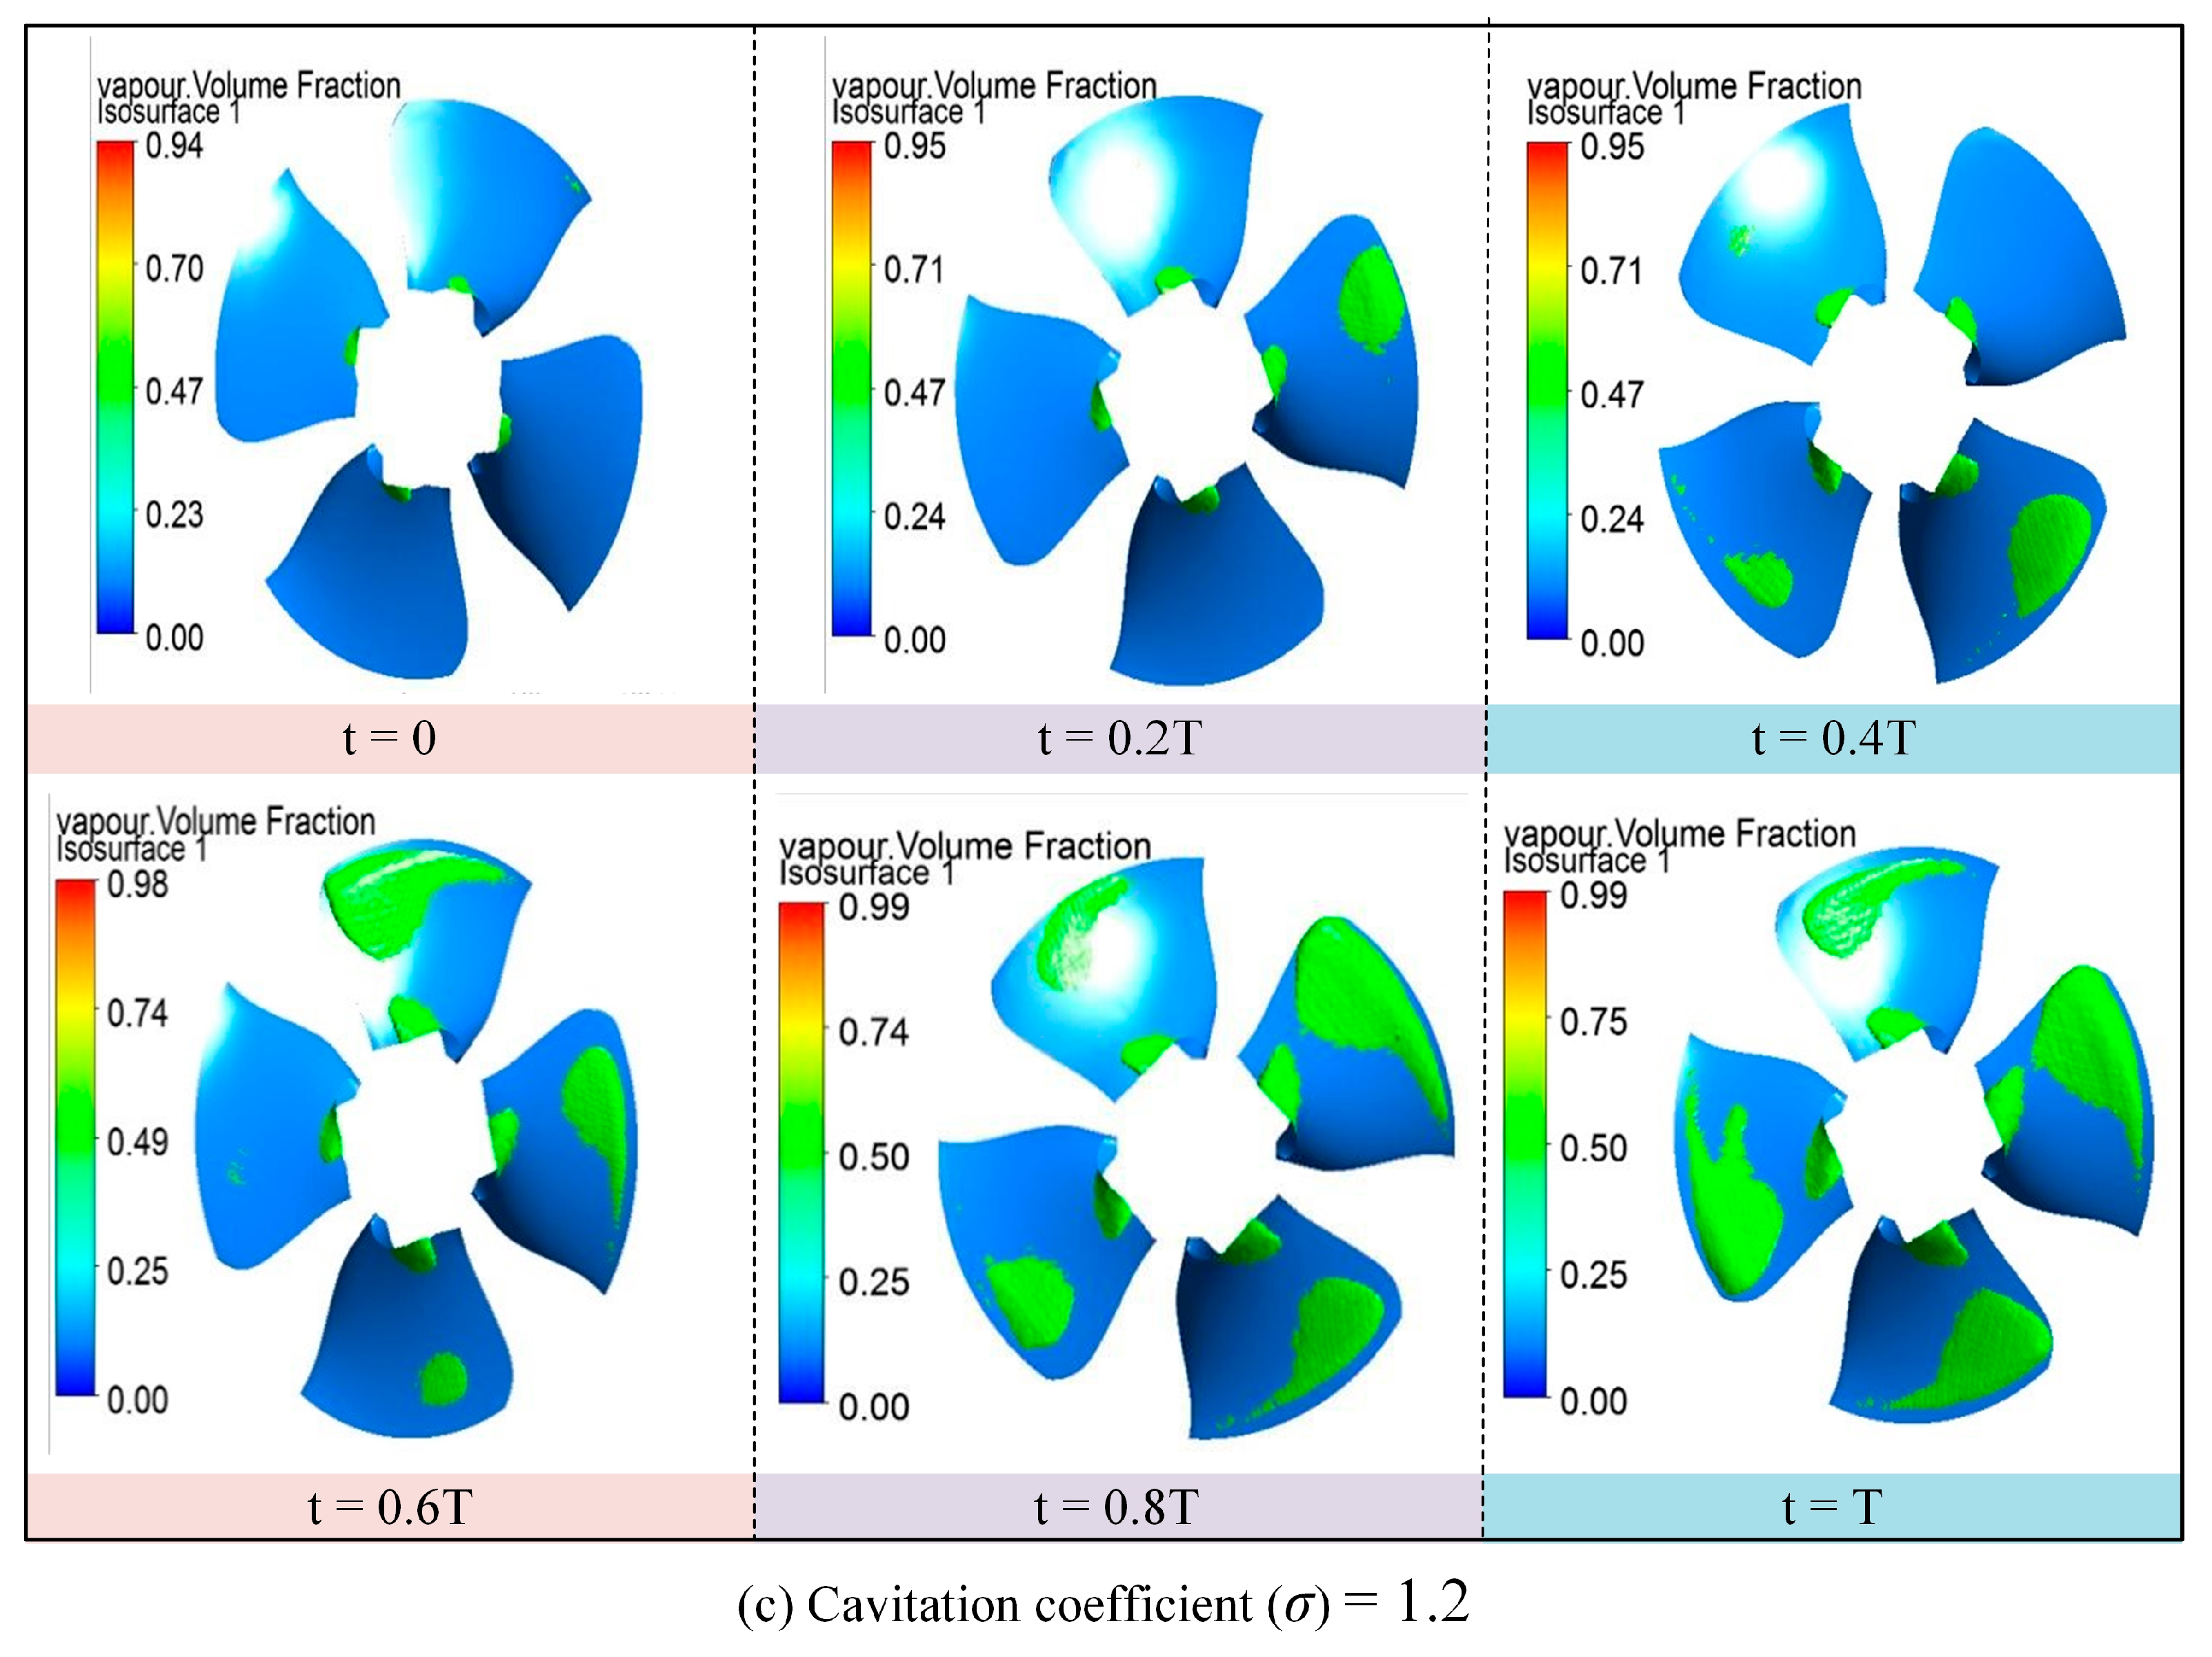
Figure 7 illustrates the time-domain evolution of vapor cavity regions on the runner blade surface under rated flow conditions for various cavitation numbers. Cavitation zones are identified based on regions where the vapor phase volume fraction exceeds a threshold of 0.1, indicating local pressure below the saturated vapor pressure [20,21,22]. This enables the intuitive tracking of cavitation intensity and spatial distribution.
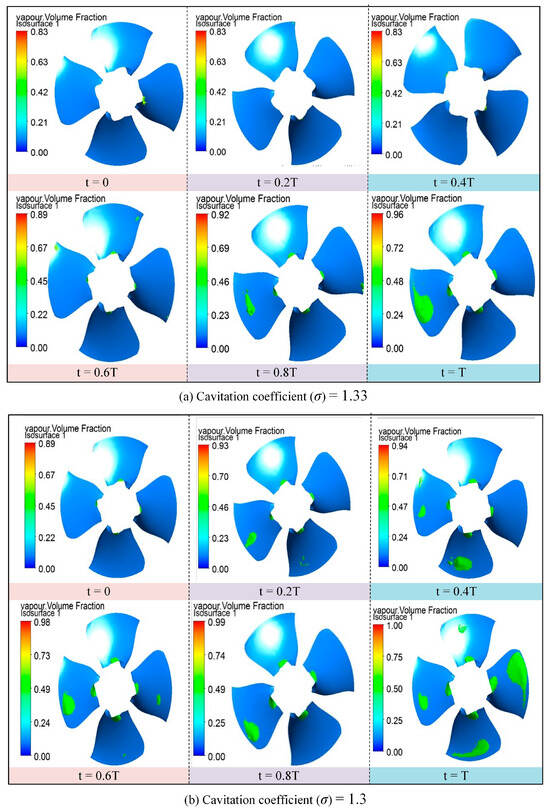

Figure 7.
Cavitation bubble area time-domain responses.
At the early stages of cavitation, vapor bubbles primarily appear near the trailing edge of the blade suction side, particularly around the rim and hub regions. The initial cavitation area remains spatially confined and limited to a localized region near the outlet, occupying only a small portion of the suction surface. As time progresses, these bubbles grow and propagate toward the mid-span of the blade, eventually forming a broader cavitation region that evolves dynamically with time.
With a decreasing cavitation number, cavitation intensity increases significantly, leading to the expansion of vapor cavities across the sensitive regions. This process can induce more extensive cavitation coverage, which disturbs the main flow structure, reduces energy conversion efficiency, and poses a threat to the long-term operational stability of the turbine.
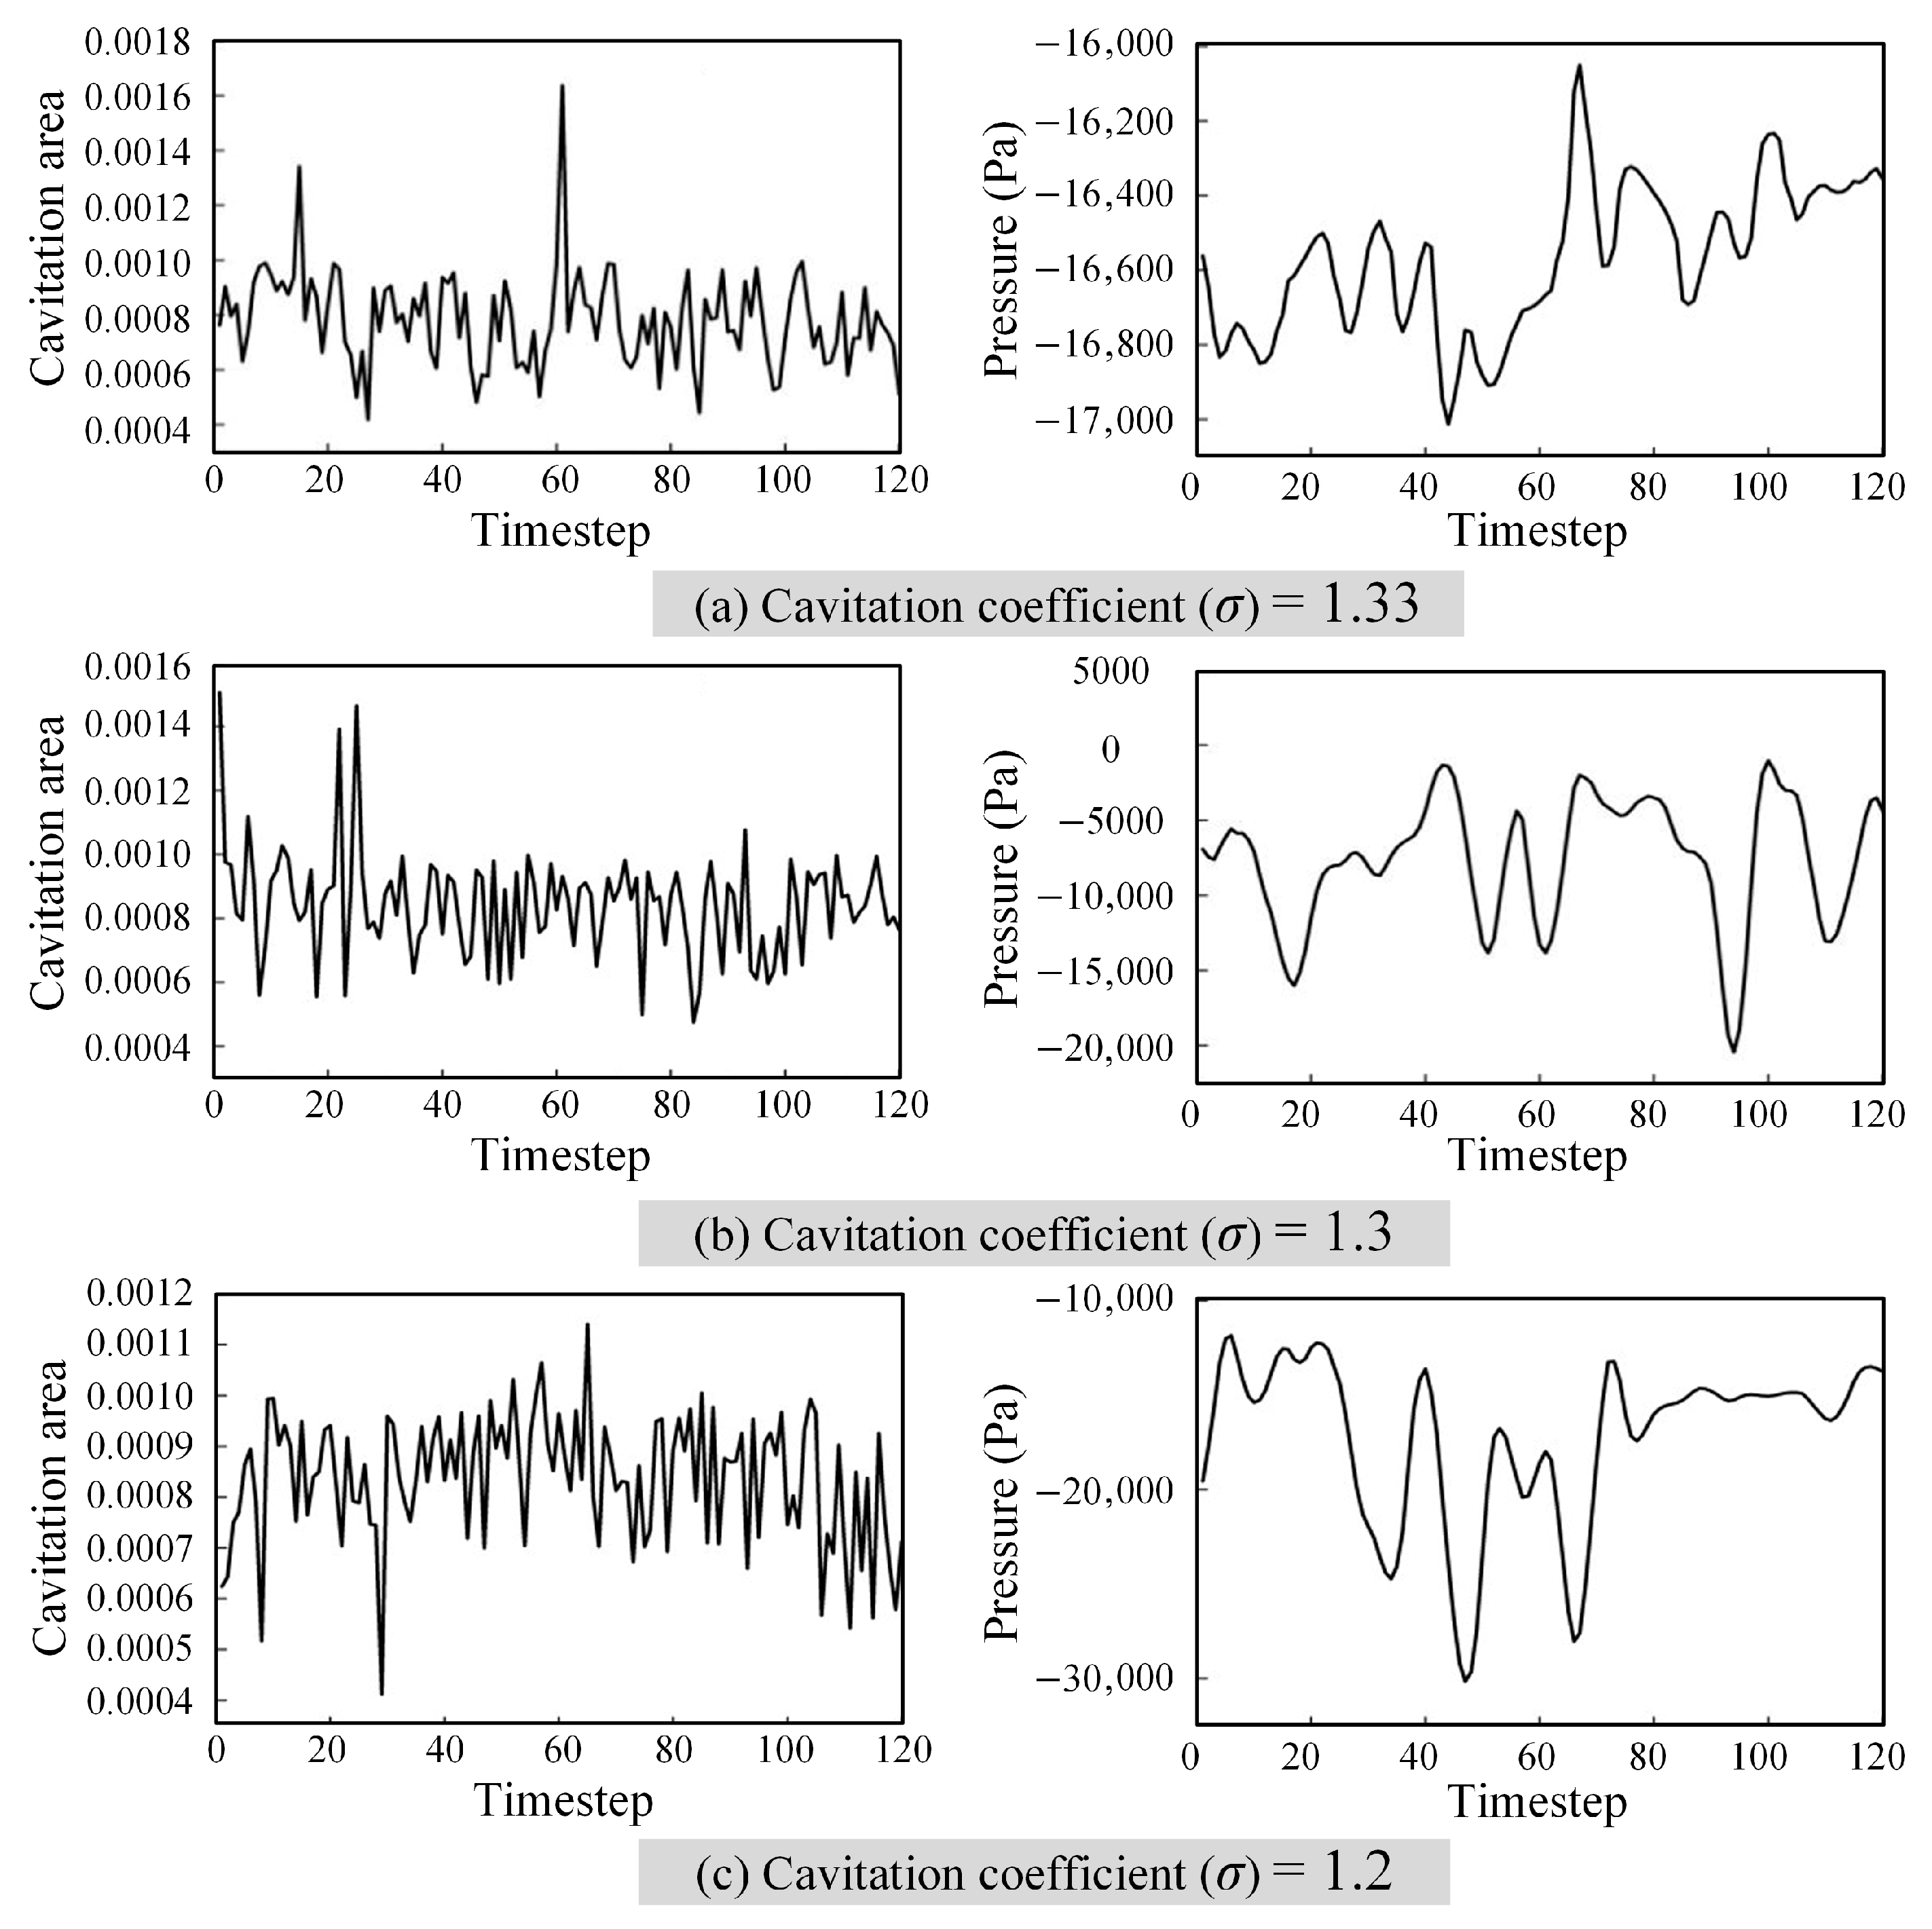
Figure 8 illustrates the temporal evolution of blade surface pressure and the cavitation area under three different cavitation number conditions. The results reveal an oscillatory relationship between pressure fluctuations and vapor cavity development. While a perfect inverse correlation is not consistently observed, a general trend emerges in which reductions in surface pressure are often followed by expansions in the cavitation area, albeit with varying phase delays across operating points. This time-lagged coupling reflects the inherent unsteady nature of cavitating flows.
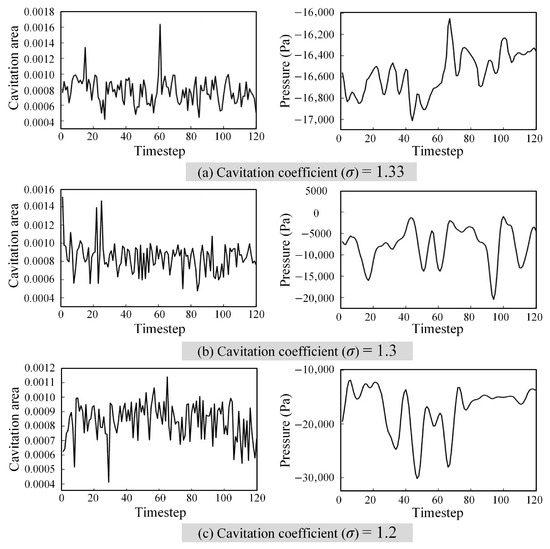
Figure 8.
Time-domain variations in cavitation area and pressure of blades.
Notably, under lower cavitation number conditions, pressure fluctuations become more pronounced, and the associated cavitation area variation also intensifies. This indicates that the blade surface experiences increasingly unstable flow dynamics, in which cavitation and pressure oscillations interact in a nonlinear and temporally asynchronous manner. Such behavior is consistent with known cavitation physics, where vapor bubble growth and collapse are not instantaneous with respect to pressure changes but occur over a finite response time due to inertia and phase transition delays.
These findings underscore the importance of considering transient phase-lag effects in cavitation modeling. The coupled evolution of pressure and cavity area is a key contributor to flow instability, energy losses, and potential erosion risk, offering valuable insights for the future design of anti-cavitation blade profiles.
4.4. Analysis of Cavitating Flow Characteristics in the Draft Tube
Vortical structures are among the primary sources of pressure fluctuations in hydraulic turbines. In particular, the vortex formation between the guide vanes and runner blades, as well as cavitation-induced vortex ropes in the draft tube, significantly influence flow field stability [23,24,25]. Notably, low-frequency vortex rope oscillations in the draft tube, triggered by cavitation, have attracted extensive scholarly attention in recent years.
When the turbine operates away from its optimal operating point, distinct cavitation vortex ropes frequently form within the draft tube. The morphology of these vortex structures is closely related to the operating load: under low-load conditions, helical eccentric vortex ropes are typically observed, while under high-load conditions, columnar vortex structures tend to develop. These differences in vortex morphology directly impact the flow characteristics and energy dissipation within the draft tube, thereby influencing the overall stability and vibration response of the turbine.
The fundamental governing equation for modeling hydraulic turbine operation is the Euler equation, which describes momentum conservation in fluid flow. Its general form is shown in Equation (9), serving as the theoretical basis for analyzing draft tube unsteady characteristics.
where U1 and U2 are the circumferential velocities of the inlet and outlet of the blade; V1 and V2 are the absolute velocities at which water flows into and out of the blades; α1 and α2 represent the angles between V1 and V2 and between U1 and U2, respectively. H and η represent the working head and efficiency of the water flow, respectively.
Table 5 lists the computational cases used in this study. Simulations were conducted under a unit speed of n11 = 188.3 r/min for various operating conditions to examine the unsteady cavitating flow fields and the time-evolving behavior of vortex ropes within the draft tube under different cavitation numbers.
Table 5.
Calculated load points.
A total of six cross-sections were selected from the guide vane region to the draft tube outlet. Section A is located at the guide vane outlet; Section B at the runner outlet; Section C at the runner hub end; Section D at the draft tube inlet; and Sections E and F at the mid- and rear portions of the draft tube. Four monitoring points were evenly distributed in each section, resulting in a total of 24 measurement points, as illustrated in Figure 9.

Figure 9.
Schematic diagram of the sampling surface and monitoring points of the unit.
To provide a visual reference for the spatial variations in pressure induced by different cavitation intensities, Figure 10 displays instantaneous pressure contour maps under three different cavitation numbers. These snapshots correspond to the same time instant and allow for a direct comparison of pressure distribution patterns throughout the flow passage. The exact spatial positions of all monitoring points, including Point 1, referenced in the time-domain analysis, are clearly shown in Figure 9 and are, therefore, not redundantly marked again here.

Figure 10.
Pressure pulsation time domain and tailpipe pressure distribution.
The results in Figure 10 reveal significant pressure differences across the flow path under varying cavitation numbers. At the guide vane outlet, where cavitation has not yet developed, the local pressure remains relatively high, and spatial fluctuations are minimal, reflecting a stable flow environment [26,27,28,29,30,31]. In contrast, at the runner outlet and near the hub region, strong cavitation development leads to a steep pressure drop and localized high-amplitude pressure gradients.
As the cavitation number decreases, a columnar cavitation vortex rope begins to form at the hub-end of the runner, extending symmetrically along the axial flow direction into the draft tube. This vortex structure exhibits an expanding tendency and introduces substantial instability into the downstream flow. In the midsection of the draft tube, the vortex rotation intensity weakens, and some structures dissipate, resulting in a gradual pressure recovery and reduced fluctuation intensity. The phase difference between monitoring Sections E and F becomes smaller under these conditions, indicating improved pressure uniformity and enhanced pressure recovery performance.
Furthermore, a lower cavitation number is clearly associated with an increase in both the spatial gradient and amplitude of pressure variations throughout the system. This behavior is due to intensified cavitation activity, which amplifies flow disturbances, promotes vortex development, and undermines hydraulic stability.
During steady operation of the turbine, the rotational frequency is fn = 1.1236 HZ. To quantitatively assess the effects of cavitation on flow field unsteadiness and potential excitation risks, a Fast Fourier Transform (FFT) was applied to the time-series pressure data collected at multiple monitoring points [12,13,14,32,33]. The FFT was performed using pressure signals sampled over a full rotation cycle with a temporal resolution corresponding to 1° of the runner rotation per time step, ensuring accurate frequency resolution.
Figure 11 displays the resulting pressure frequency spectra at Point 1 under three different cavitation number conditions. The spectral results reveal consistent trends across cases, with distinct dominant and secondary frequencies emerging in different flow regions. In the runner outlet and draft tube regions, a pronounced peak occurs at 4 fn, corresponding to the blade passing frequency (BPF). This high-frequency, low-amplitude component arises from periodic blade interactions and remains relatively stable, suggesting limited structural concern.
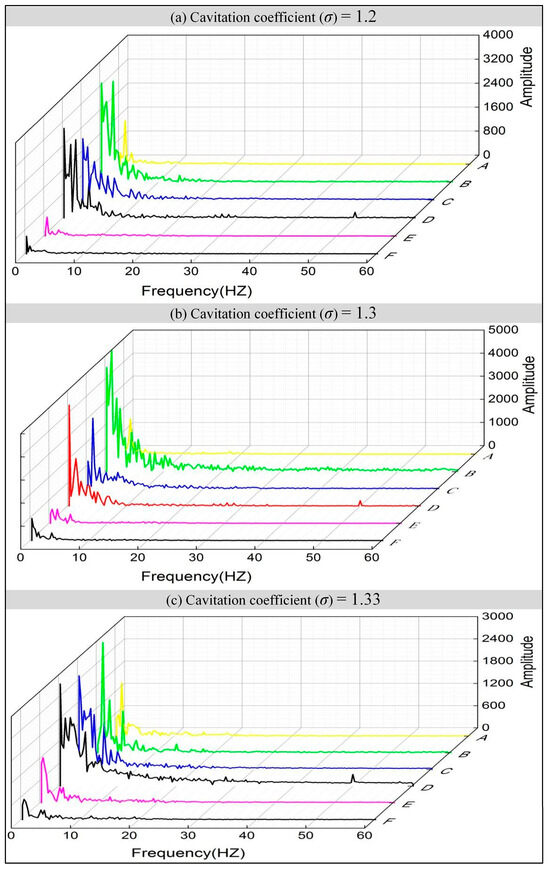
Figure 11.
Frequency domain distribution of pressure pulsation at Point 1.
In the runner hub end and draft tube inlet, a dominant low-frequency component near 0.8 fn can be observed. This mode exhibits significantly larger amplitudes and is linked to columnar cavitation vortex rope formation and annular hydraulic jump phenomena, where persistent bubble shedding and reformation cause strong, non-uniform flow structures. This low-frequency pressure fluctuation is considered a key contributor to cavitation-induced system instability. A secondary subharmonic peak at 5 fn is also evident, particularly in Sections B, C, and D. This frequency results from nonlinear coupling and the modulation of cavitation vortex rope oscillations, aligning with localized small-amplitude pressure pulsations observed in Figure 10, and reflects the multi-scale, unsteady behavior of cavitating flows.
At the guide vane–runner interface, the dominant spectral peak is located at 4.54 Hz, close to the BPF. This is due to a rotor–stator interaction (RSI) between the rotating runner blades and stationary guide vanes, producing high-frequency, low-amplitude pulsations due to jet–wake interference. Although relatively low in amplitude, the pressure pulsation peak reaches ΔH/H = 6.7%, which may approach or exceed the threshold of structural fatigue excitation in some turbine components.
Overall, the pressure spectra illustrate a clear trend: as the cavitation number decreases, low-frequency pulsation amplitudes increase, particularly in regions prone to vortex rope formation. This suggests an elevated risk of cavitation-induced structural resonance under severe cavitating conditions. The identified dominant frequencies and their physical origins provide important reference data for evaluating potential fatigue risks and guiding the design of vibration-resistant hydraulic components.
5. Discussion
By integrating model test results with CFD simulations, this study conducted a comprehensive analysis of the hydraulic performance and internal flow characteristics of a hydraulic turbine under different cavitating conditions. The main conclusions are summarized as follows:
- (1)
- Based on model test data and numerical simulations, the energy characteristics of a full-scale bulb turbine under rated head and various cavitation numbers were systematically analyzed. The experimental data verified the accuracy of the CFD model, with a maximum efficiency deviation of less than 1% across five operating conditions.
- (2)
- When the turbine operates at the critical cavitation number, a large number of vapor bubbles form, develop, and collapse within the flow passage. These bubbles attach to blade surfaces, disturbing the main flow and significantly altering the internal flow structure. This leads to reduced flow capacity and impaired energy transfer efficiency, resulting in a sharp efficiency drop—up to 5% in severe cases.
- (3)
- Both numerical and experimental results indicate that under variable load conditions, cavitation primarily occurs in two regions: (a) near the blade suction side close to the trailing edge rim and (b) the clearance zone adjacent to the hub. These can be identified as low-pressure zones prone to cavitation and are critical areas for potential erosion.
- (4)
- Pressure pulsations are highly sensitive to changes in the cavitation number. As the cavitation number decreases, pulsation intensity increases significantly, leading to enhanced flow field unsteadiness, reduced hydraulic stability, and increased risks of efficiency loss and structural vibration. Therefore, it is crucial to maintain the cavitation number within a safe and reasonable range during both the design and operational phases to ensure the long-term stability and reliability of the turbine unit.
Despite the insights obtained, this study also presents several limitations that offer opportunities for future research. First, the simulations adopted the SST k–ε turbulence model and the Zwart–Gerber–Belamri cavitation model, which, while widely used, may not fully capture the complexity of micro-scale cavitation and bubble dynamics. Additionally, structural responses and potential fluid–structure interaction (FSI) effects were not considered in the present work, although the observed pressure pulsations may have implications for fatigue and vibration risks. Future studies could incorporate more advanced modeling approaches, such as large eddy simulation (LES) and FSI coupling, to further improve predictive accuracy. Moreover, while this work focused on the rated head condition; a broader exploration of start–stop scenarios and off-design operating states would enhance the applicability of the findings to modern hydropower operations.
Author Contributions
F.Z., writing—original draft and methodology; Q.L., funding acquisition and writing—review and editing; L.X. and X.C., proofreading, supervision, and simulation; S.Z. and Y.Q. software and methodology. All authors have read and agreed to the published version of the manuscript.
Funding
National Natural Science Foundation of China (52066011); Jiuquan Vocational Technical College Doctoral Fund Project (2024XJBXM01).
Data Availability Statement
The original contributions presented in this study are included in the article, and further inquiries can be directed to the corresponding author.
Acknowledgments
The authors would like to thank the anonymous reviewers and the editor for their valuable and insightful suggestions.
Conflicts of Interest
The authors declare no conflicts of interest. Author Shiang Zhang was employed by the company Tianjin Tianfa Heavy Hydropower Equipment Manufacturing Co., Ltd. The remaining authors declare that the research was conducted in the absence of any commercial or financial relation-ships that could be construed as a potential conflict of interest.
References
- Song, H.; Xie, W.; Han, W.; Wang, S.; Huang, X.; Qiu, H.; Li, R. Study on Vibration and Failure of Transverse Flow Turbine Based on Fluid–Structure Interaction. Int. J. Struct. Stab. Dyn. 2024, 2550263. [Google Scholar] [CrossRef]
- Kumar, P.; Saini, R.P. Study of cavitation in hydro turbines—A review. Renew. Sustain. Energy Rev. 2010, 14, 374–383. [Google Scholar] [CrossRef]
- Khare, R.; Prasad, V. Prediction of cavitation and its mitigation techniques in hydraulic turbines—A review. Ocean Eng. 2021, 221, 108512. [Google Scholar]
- Kan, K.; Binama, M.; Chen, H.; Zheng, Y.; Zhou, D.; Su, W.; Muhirwa, A. Pump as turbine cavitation performance for both conventional and reverse operating modes: A review. Renew. Sustain. Energy Rev. 2022, 168, 112786. [Google Scholar] [CrossRef]
- He, X.; Yang, J.; Yang, J.; Hu, J.; Peng, T. Experimental study of cavitating vortex rope and water column separation in a pump turbine. Phys. Fluids 2022, 34, 044101. [Google Scholar] [CrossRef]
- Gao, Y.; Liu, H.; Guo, G.; Lin, Y.; Gu, Y.; Ni, Y. Effect of cavitation evolution on power characteristics of tidal current turbine. Phys. Fluids 2023, 35, 013307. [Google Scholar] [CrossRef]
- Li, D.; Song, Y.; Lin, S.; Wang, H.; Qin, Y.; Wei, X. Effect mechanism of cavitation on the hump characteristic of a pump-turbine. Renew. Energy 2021, 167, 369–383. [Google Scholar] [CrossRef]
- Gohil, P.P.; Saini, R.P. Effect of temperature, suction head and flow velocity on cavitation in a Francis turbine of small hydro power plant. Energy 2015, 93, 613–624. [Google Scholar] [CrossRef]
- Li, D.; Zhu, Y.; Lin, S.; Gong, R.; Wang, H.; Luo, X. Cavitation effects on pressure fluctuation in pump-turbine hump region. J. Energy Storage 2022, 47, 103936. [Google Scholar] [CrossRef]
- Laouari, A.; Ghenaiet, A. Investigation of steady and unsteady cavitating flows through a small Francis turbine. Renew. Energy 2021, 172, 841–861. [Google Scholar] [CrossRef]
- Feng, J.; Liu, B.; Luo, X.; Zhu, G.; Li, K.; Wu, G. Experimental investigation on characteristics of cavitation-induced vibration on the runner of a bulb turbine. Mech. Syst. Signal Process. 2023, 189, 110097. [Google Scholar] [CrossRef]
- Pipp, P.; Hočevar, M.; Dular, M. Numerical Insight into the Kelvin-Helmholtz Instability Appearance in Cavitating Flow. Appl. Sci. 2024, 11, 2644. [Google Scholar] [CrossRef]
- Podnar, A.; Hočevar, M.; Novak, L.; Dular, M. Analysis of Bulb Turbine Hydrofoil Cavitation. Appl. Sci. 2021, 11, 2639. [Google Scholar] [CrossRef]
- Apte, D.; Ge, M.; Zhang, G.; Coutier-Delgosha, O. Numerical investigation of three-dimensional effects of hydrodynamic cavitation in a Venturi tube. Ultrason. Sonochemistry 2024, 111, 107122. [Google Scholar] [CrossRef]
- Zhou, W.; Ma, J.; Ma, Z.; Yu, W.; Su, H.; Gao, B. Fluid–structure interaction on the rotor-dynamic characteristics of a low-specific-speed centrifugal pump considering multi-scale fluid excitation effects. Phys. Fluids 2024, 36, 117157. [Google Scholar] [CrossRef]
- Josˇt, D.; Lipej, A.; Meznar, P. Numerical prediction of efficiency, cavitation and unsteady phenomena in water turbines. Eng. Syst. Des. Anal. 2008, 48388, 157–166. [Google Scholar]
- Liu, L.; Li, J.; Feng, Z. A numerical method for simulation of attached cavitation flows. Int. J. Numer. Methods Fluids 2006, 52, 639–658. [Google Scholar] [CrossRef]
- Li, W.; Li, Z.; Han, W.; Li, Y.; Yan, S.; Zhao, Q.; Chen, F. Measured viscosity characteristics of Fe3O4 ferrofluid in magnetic and thermal fields. Phys. Fluids 2023, 35, 012002. [Google Scholar] [CrossRef]
- Qiu, N.; Xun, D.; Zhu, H.; Xu, P.; Che, B.; Li, M.; Zhou, W. Impact of re-entrant jet and shedding cloud cavity on the distribution of cavitation erosion. Ocean Eng. 2024, 307, 118111. [Google Scholar] [CrossRef]
- Usta, O.; Korkut, E. Prediction of cavitation development and cavitation erosion on hydrofoils and propellers by detached eddy simulation. Ocean Eng. 2019, 191, 106512. [Google Scholar] [CrossRef]
- Alavi, A.; Ghasemnezhad, M.; Roohi, E. Cavitation analysis of plunging hydrofoils using large eddy simulations. Ocean Eng. 2024, 311, 118836. [Google Scholar] [CrossRef]
- Ji, B.; Luo, X.-W.; Peng, X.-X.; Wu, Y.-L. Three-dimensional large eddy simulation and vorticity analysis of unsteady cavitating flow around a twisted hydrofoil. J. Hydrodyn. 2013, 25, 510–519. [Google Scholar] [CrossRef]
- Li, W.; Li, Z.; Deng, W.; Ji, L.; Qiu, Y.; Chen, H. Particle image velocimetry flowmeter for natural gas applications. Flow Meas. Instrum. 2021, 82, 102072. [Google Scholar]
- Yin, T.-Y.; Pavesi, G.; Pei, J.; Yuan, S.-Q.; Gan, X.-C. Large eddy simulation of cloud cavitation and wake vortex cavitation around a trailing-truncated hydrofoil. J. Hydrodyn. 2022, 34, 893–903. [Google Scholar] [CrossRef]
- Liu, M.; Tan, L.; Liu, Y.; Xu, Y.; Cao, S. Large eddy simulation of cavitation vortex interaction and pressure fluctuation around hydrofoil ALE 15. Ocean Eng. 2018, 163, 264–274. [Google Scholar] [CrossRef]
- Yu, A.; Li, L.; Zhou, D. Large eddy simulation of the cavity shedding characteristics of ventilated cavitation around the underwater vehicle. Ocean Eng. 2024, 301, 117546. [Google Scholar] [CrossRef]
- Wang, G.; Wu, Q.; Huang, B. Dynamics of cavitation–structure interaction. Acta Mech. Sin. 2017, 33, 685–708. [Google Scholar] [CrossRef]
- Li, W.; Li, Z.; Han, W.; Li, D.; Yan, S.; Zhou, J. Study of The Flow Characteristics of Pumped Media in The Confined Morphology of A Ferrofluid Pump with Annular Microscale Constraints. J. Fluids Eng. 2025, 147, 021201. [Google Scholar] [CrossRef]
- Zhou, W.; Yu, D.; Wang, Y.; Shi, J.; Gan, B. Research on the fluid-induced excitation characteristics of the centrifugal pump considering the compound whirl effect. Facta Univ. Ser. Mech. Eng. 2023, 21, 223–238. [Google Scholar] [CrossRef]
- Zhou, W.; Qiu, N.; Wang, L.; Gao, B.; Liu, D. Dynamic analysis of a planar multi-stage centrifugal pump rotor system based on a novel coupled model. J. Sound Vib. 2018, 434, 237–260. [Google Scholar] [CrossRef]
- Pan, S.; Zhao, Y.; Wang, J.; Wang, Z.; Ren, C.; Zhang, Z.; Wang, Z. Design and transient flow analysis of a novel gear-claw hydrogen circulating pump with new auxiliary working chamber. Appl. Therm. Eng. 2025, 272, 126430. [Google Scholar] [CrossRef]
- Li, W.; Li, Z.; Han, W.; Wang, Y.; Zhao, J.; Zhou, J. Morphologic transformation of ferrofluid during micropump driving under field control. Ann. N. Y. Acad. Sci. 2025, 1543, 194–203. [Google Scholar] [CrossRef] [PubMed]
- Li, W.; Li, Z.; Qin, Z.; Yan, S.; Wang, Z.; Peng, S. Influence of the solution pH on the design of a hydro-mechanical magneto-hydraulic sealing device. Eng. Fail. Anal. 2022, 135, 106091. [Google Scholar] [CrossRef]
Disclaimer/Publisher’s Note: The statements, opinions and data contained in all publications are solely those of the individual author(s) and contributor(s) and not of MDPI and/or the editor(s). MDPI and/or the editor(s) disclaim responsibility for any injury to people or property resulting from any ideas, methods, instructions or products referred to in the content. |
© 2025 by the authors. Licensee MDPI, Basel, Switzerland. This article is an open access article distributed under the terms and conditions of the Creative Commons Attribution (CC BY) license (https://creativecommons.org/licenses/by/4.0/).