Abstract
The microfractured tight reservoirs in Yongjin Oilfield have low permeability and a complex pore structure. The development of microfractures in reservoirs is crucial for their impact on productivity. To understand the impact of pore structure and microfracture development on permeability and productivity, research on the fractal dimension and classification evaluation of microfractured tight reservoirs is proposed. Micropore and microfracture parameter characteristics are determined via CT scanning and mercury intrusion experiments. Based on the fractal theory and box counting dimension methods, the fractal dimension of pores and fractures in microfractured tight reservoirs are calculated, which can be used as an evaluation index. Then, a comprehensive quantitative evaluation method (REI) is conducted on the microfractured tight reservoir of Yongjin Oilfield to determine the classification boundary of evaluation indicators and reservoir classification results. The research results show that the microfractured tight reservoirs in Yongjin Oilfield can be classified into three types based on their development effect from good to poor. The comprehensive evaluation index (REI) of type I reservoirs is greater than 0.7, and the fractal dimension of pores and fractures is less than 2.4. The comprehensive evaluation index (REI) of type II reservoirs ranges from 0.4 to 0.7, and the fractal dimension of pores and fractures ranges from 2.4 to 2.6. The comprehensive evaluation index (REI) of type III reservoirs is less than 0.4, and the fractal dimension of pores and fractures is greater than 2.6. The classification results are consistent with the dynamic data, and this achievement can provide a scientific basis for rapid reservoir evaluation and development strategy formulation.
1. Introduction
Yongjin Oilfield is located in the hinterland of Junggar Basin, under the jurisdiction of Shengli Oilfield, and the main target layer is the Middle–Late Jurassic formation with a burial depth of more than 5800 m, which is a typical ultra-deep tight sandstone oil and gas formation [1,2,3]. Most of the tight oil reservoirs in Shengli Oilfield are below 3000 m in depth, and the reservoir microfractures are generally not developed, while field coring in Yongjin Oilfield found that the reservoir microfractures are more developed and have a greater impact on the production capacity [4,5,6]. Therefore, the microstructure of the microfractured tight reservoirs in Yongjin Oilfield has a significant impact on the evaluation and development of oil and gas reservoirs, and the accurate evaluation of the microstructural characteristics of pores and microfractures in tight reservoirs is of great significance for the utilization of microfractured tight reservoirs and the evaluation of production capacity in Yongjin Oilfield.
Focusing on tight reservoirs, some scholars at home and abroad have carried out relevant research work on micropore structure characteristics, such as pore throat geometry, type, size distribution, and connectivity, and they have gained a certain understanding. For example, Ma Shizhong et al. [7,8,9,10] chose various methods such as high-pressure mercury intrusion and constant-velocity mercury injection combined with cast thin-section observation and scanning electron microscopy to quantitatively characterize the size of the pore structure of dense reservoirs, which was classified into five types. Wang Xu et al. [11,12,13] chose various methods such as cast thin section, scanning electron microscopy, physical analysis, and high-pressure mercury to classify reservoir types into four categories, i.e., extra-low-porosity and low-permeability dense reservoirs with micropores, fine throats, and high discharge and driving pressures, reservoirs with microfracture development, reservoirs with solvation pore development and good connectivity, and reservoirs with localized solvation pore development but surrounded and sealed off by dense reservoirs. Yin Daiyin et al. [14,15] quantitatively described the influence of microscopic pore parameters, such as pore radius, throat radius, and pore–throat ratio, on the permeability and development effect of extra-low-permeability reservoirs by using high-pressure mercury compression and constant-velocity mercury compression experimental methods. Most of the above studies were conducted to characterize the microscopic storage space and pore structure characteristics of tight reservoirs by indoor experimental methods, and relatively few studies have been conducted to characterize and comprehensively evaluate the microfracture structure of tight reservoirs [16,17]. Considering the important role of tight reservoir fracturing operations in reservoir transformation, it is necessary to deepen the understanding of the impact of reservoir modification on development effectiveness [18,19]. In addition, previous studies have found that besides permeability, the influence of the micropore structure cannot be ignored as the main factor affecting the development effect of tight reservoirs [20,21,22,23]. In order to quantitatively describe the microscopic composition of the pore size, a fractal dimension can be introduced to characterize the heterogeneity of the pore structure, but there are few reports on this parameter for reservoir evaluation [24,25,26]. To this end, based on extensive research on microstructure characterization methods, indoor experiments were conducted using environmental scanning electron microscopy, mercury intrusion porosimetry, CT scanning, and small-angle-scattering methods to determine the micropore and microfracture structure parameters of microfractured cores in ultra-deep tight sandstone reservoirs in Yongjin Oilfield. A fractal dimension calculation method for microfractured tight reservoirs was established to determine the comprehensive evaluation system, evaluation system boundaries, and evaluation classification results of microfractured tight reservoirs in Yongjin Oilfield, more accurately revealing the microstructure and permeability characteristics of the reservoir and providing a scientific basis for reservoir evaluation and efficient development.
2. Characteristics of Micro-Parameters of Tight Reservoirs in Yongjin Oilfield
Microfractures in the reservoirs of the tight reservoirs at about a 3000 m depth in Shengli Yongjin Oilfield generally did not develop in the early stage of development, but as the tight reservoirs of Yongjin Oilfield with a burial depth of about 4000 m were gradually put into development, it was found that microfractures in the reservoirs locally developed and had a significant impact on production capacity. In order to accurately grasp the classification and comprehensive evaluation results of this type of reservoir, it is necessary to study the characteristics of the microfracture tight reservoir matrix and microfracture microscopic parameters separately.
2.1. Microscopic Pore Structure Parameters
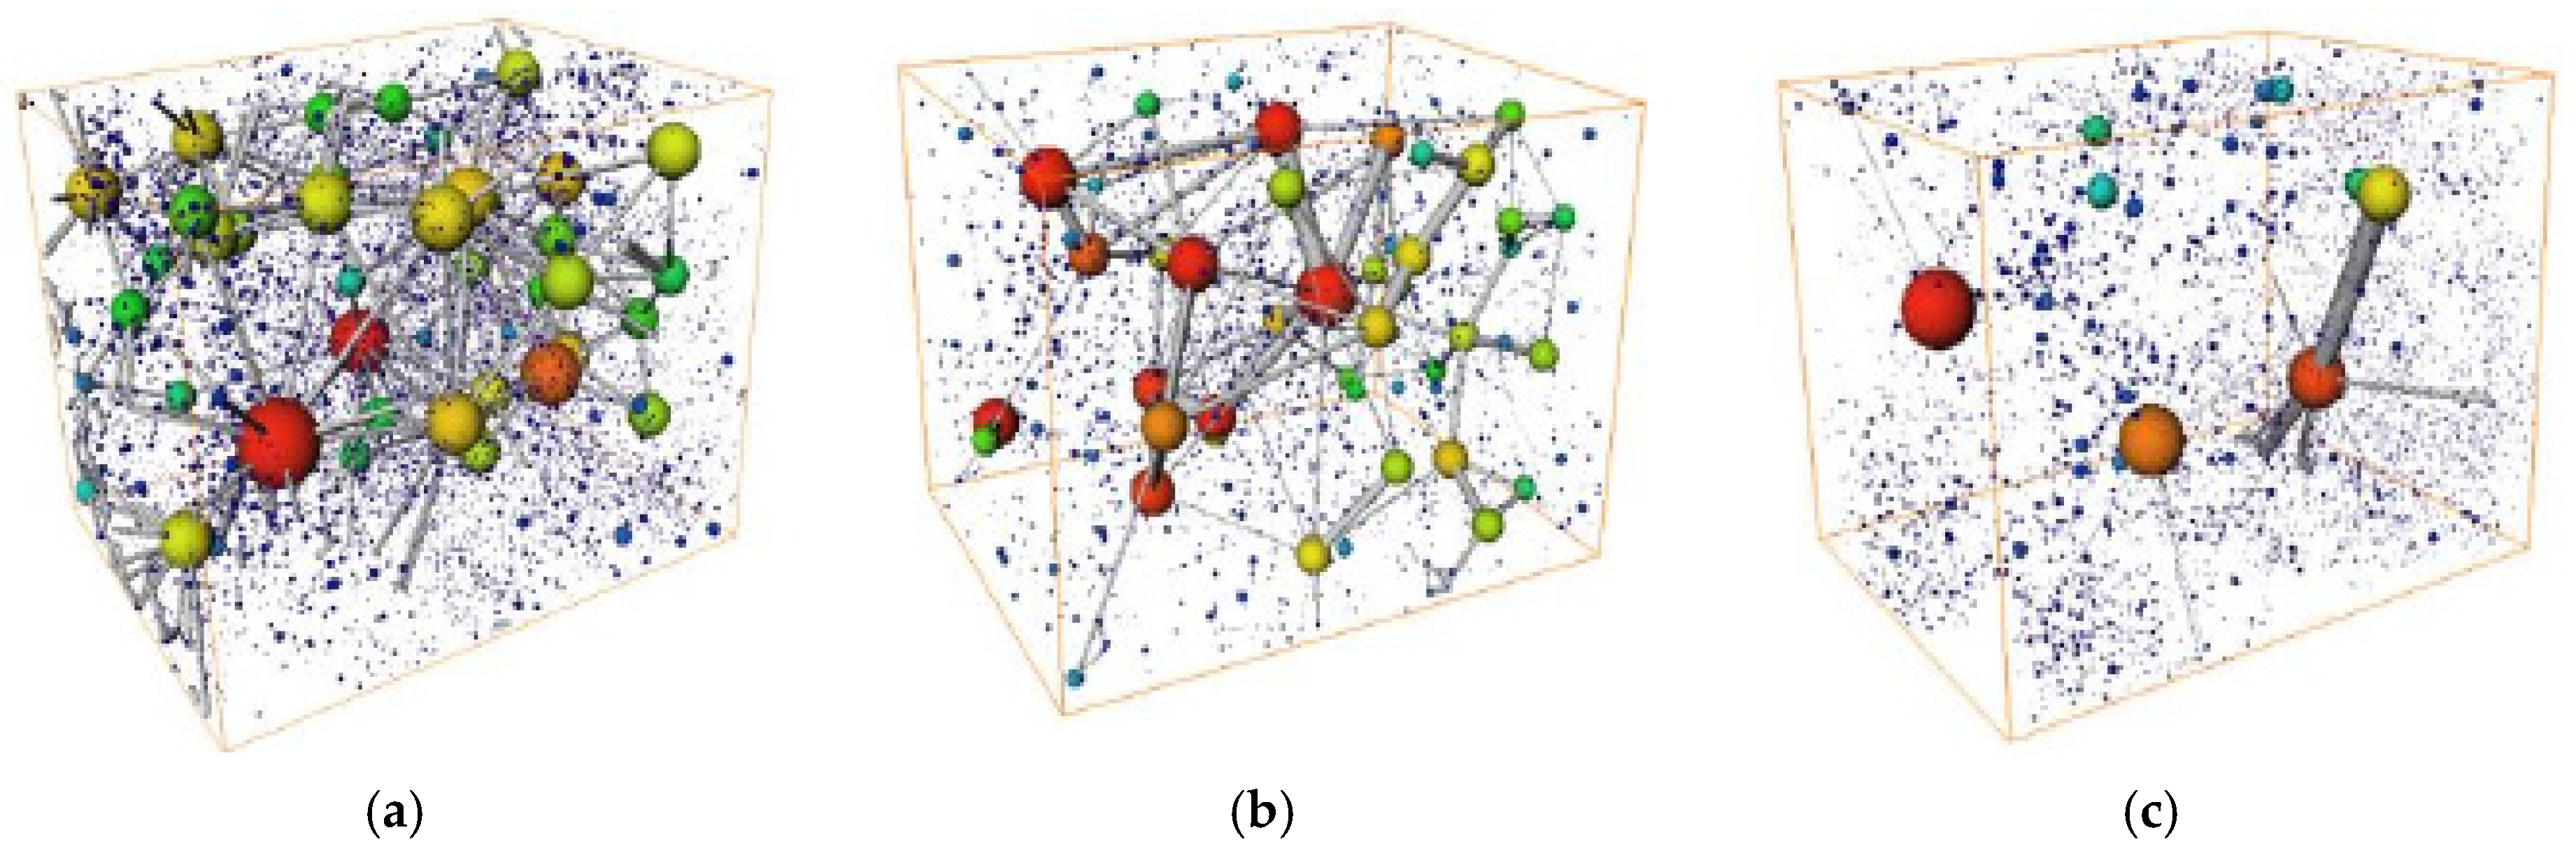
The pore–throat radius (pore radius, throat radius), pore–throat ratio, coordination number, tortuosity, shape factor, and so on, are the main parameters used to characterize the microscopic pore structure, and the pore structure parameters of the microfractured dense reservoir in Yongjin Oilfield can be obtained by experimental means such as constant-velocity mercury injection, high-pressure mercury intrusion, and CT scanning. Pore models of type I, II, and III cores are established respectively, and the pore models for each type of core are shown in Figure 1.

Figure 1.
Pore models of cores. (a) Type I (No. #55). (b) Type II (No. #45). (c)Type III (No. #126).
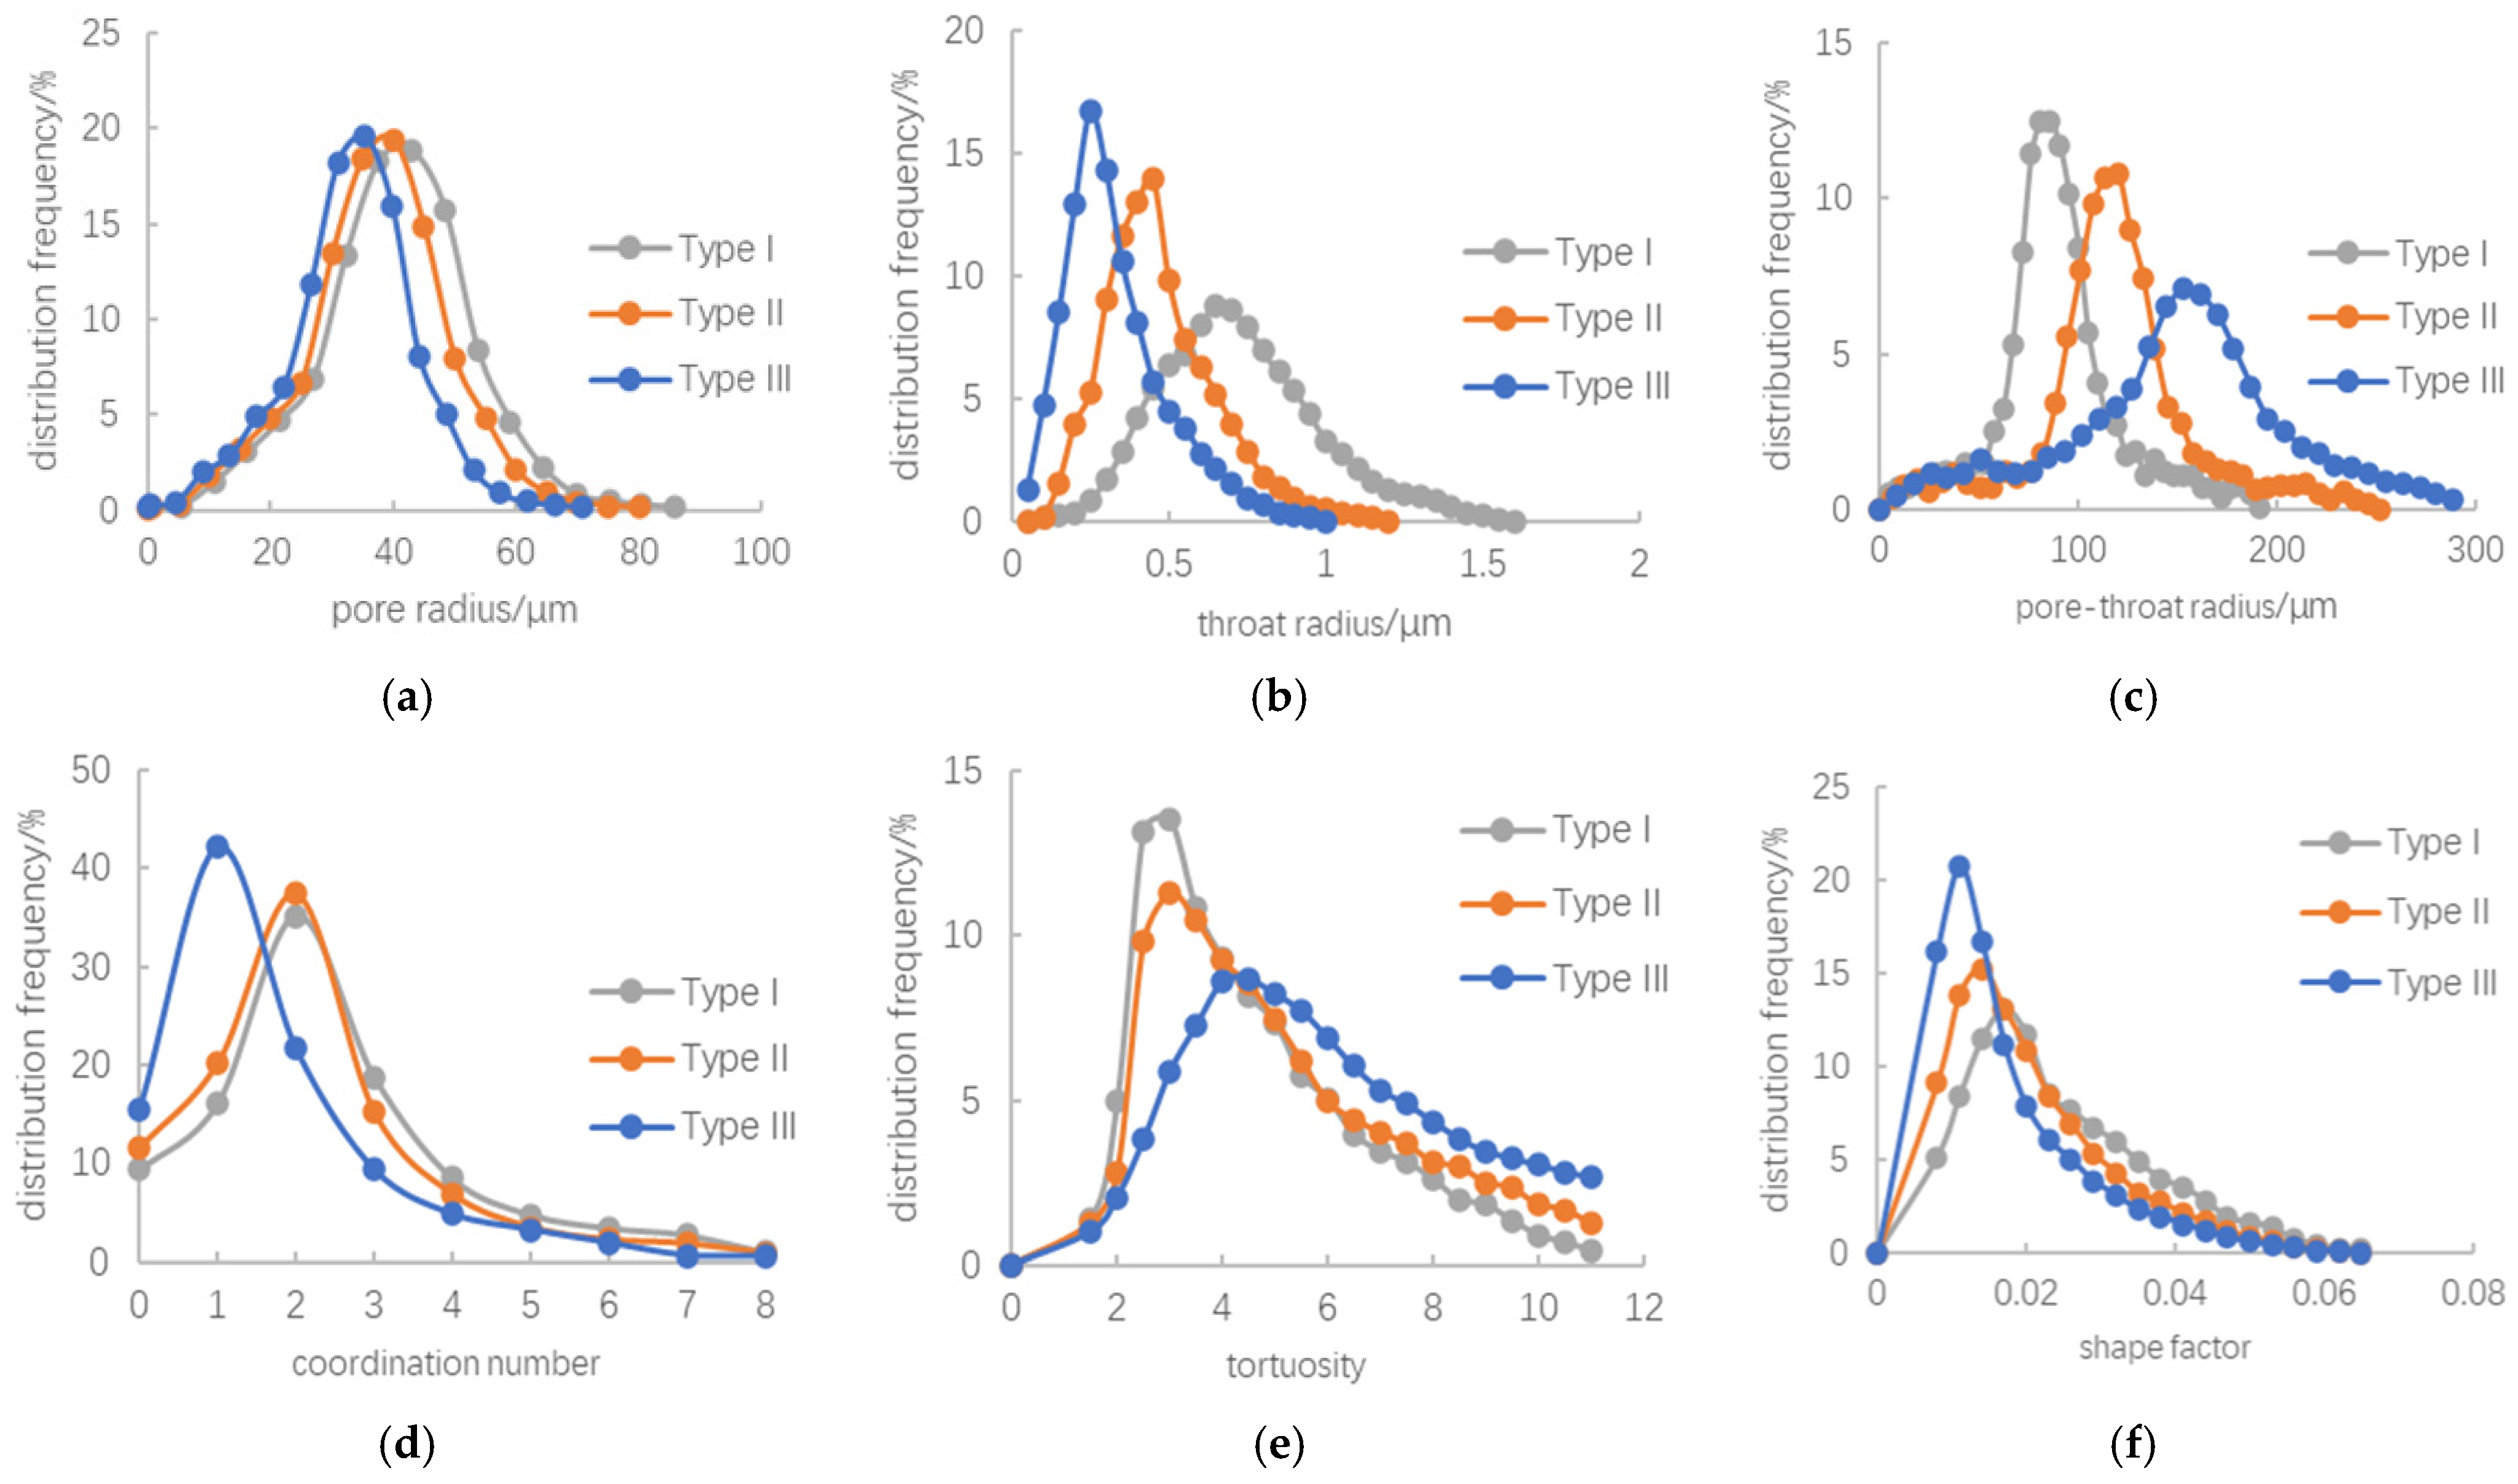
The distribution characteristics of each microscopic pore structure parameter of the microfractured cores of the tight reservoir were studied, as is shown in Figure 2 and Table 1.
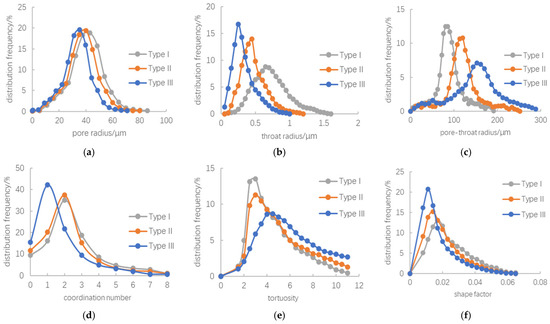
Figure 2.
Distribution characteristics of microscopic pore structure: (a) pore radius, (b) throat radius, (c) pore–throat ratio, (d) coordination number (e), Tortuosity, (f) shape factor.

Table 1.
Distribution characteristics of microscopic pore structure.
The pore radius of microfractured cores in the tight reservoirs is normally distributed, with a distribution range between 0.1–100 μm. The pore radii of cores of class I, II and III are not very different, with the peak value slightly shifted to the left; the mean value decreases from 40.46 μm to 33.25 μm, and the porosity decreases from 9.6% to 5.7%.
The tight reservoir microfractured core throat radius demonstrates a left-skewed normal distribution, the distribution range is mainly concentrated between 0.2–1.0 μm, the peak value is between 0.25–0.75 μm, the I, II, and III core throat radius distribution interval becomes smaller, the peak value is shifted to the left, and the value increases significantly, the average value is reduced from 0.73 μm to 0.32 μm, the permeability is reduced to 0.1 × 10⁻³ μm2 after the average throat radius decreases, and the proportion of micro-fine throats and micro-throats smaller than 0.5 μm exceeds 50%.
The pore–throat ratio of the microfractured cores in the tight reservoirs shows a normal distribution, with a wide span of the distribution range and a peak value ranging from 81 to 155. The distribution range of the pore–throat ratio of cores of class I, II, and III becomes wider, the peak value decreases, and the mean value increases sharply from 89.29 to 150.12.
The coordination number of the microfracture cores in the tight reservoirs shows a skewed normal distribution, and the distribution range is mainly concentrated between 2–4, with the peak coordination number of the type I, II, and III cores increasing, and the coordination number corresponds to a decreasing peak, with the mean value decreasing from 2.49 to 1.70.
The tortuosity of the microfractured cores of the dense reservoir conforms to a skewed normal distribution, the distribution range is between 0 and 10, and the mean value is concentrated between 2 and 8. The pore structure of type I, II, and III cores is more complex, the line through which the fluids flow is tortuous, the peak value is shifted to the left, and the mean value of the tortuosity increases from 4.58 to 5.89, with an increase of about 28%.
The shape factor of the microfracture cores in the tight reservoirs follows a normal distribution, with a distribution ranging from 0 to 0.06 and a peak value ranging from 0.008 to 0.020. The peak value of the shape factor curves of the class I, II, and III cores is shifted to the left, the value is increased, and the mean value is reduced from 0.024 to 0.018.
2.2. Microfracture Parameters
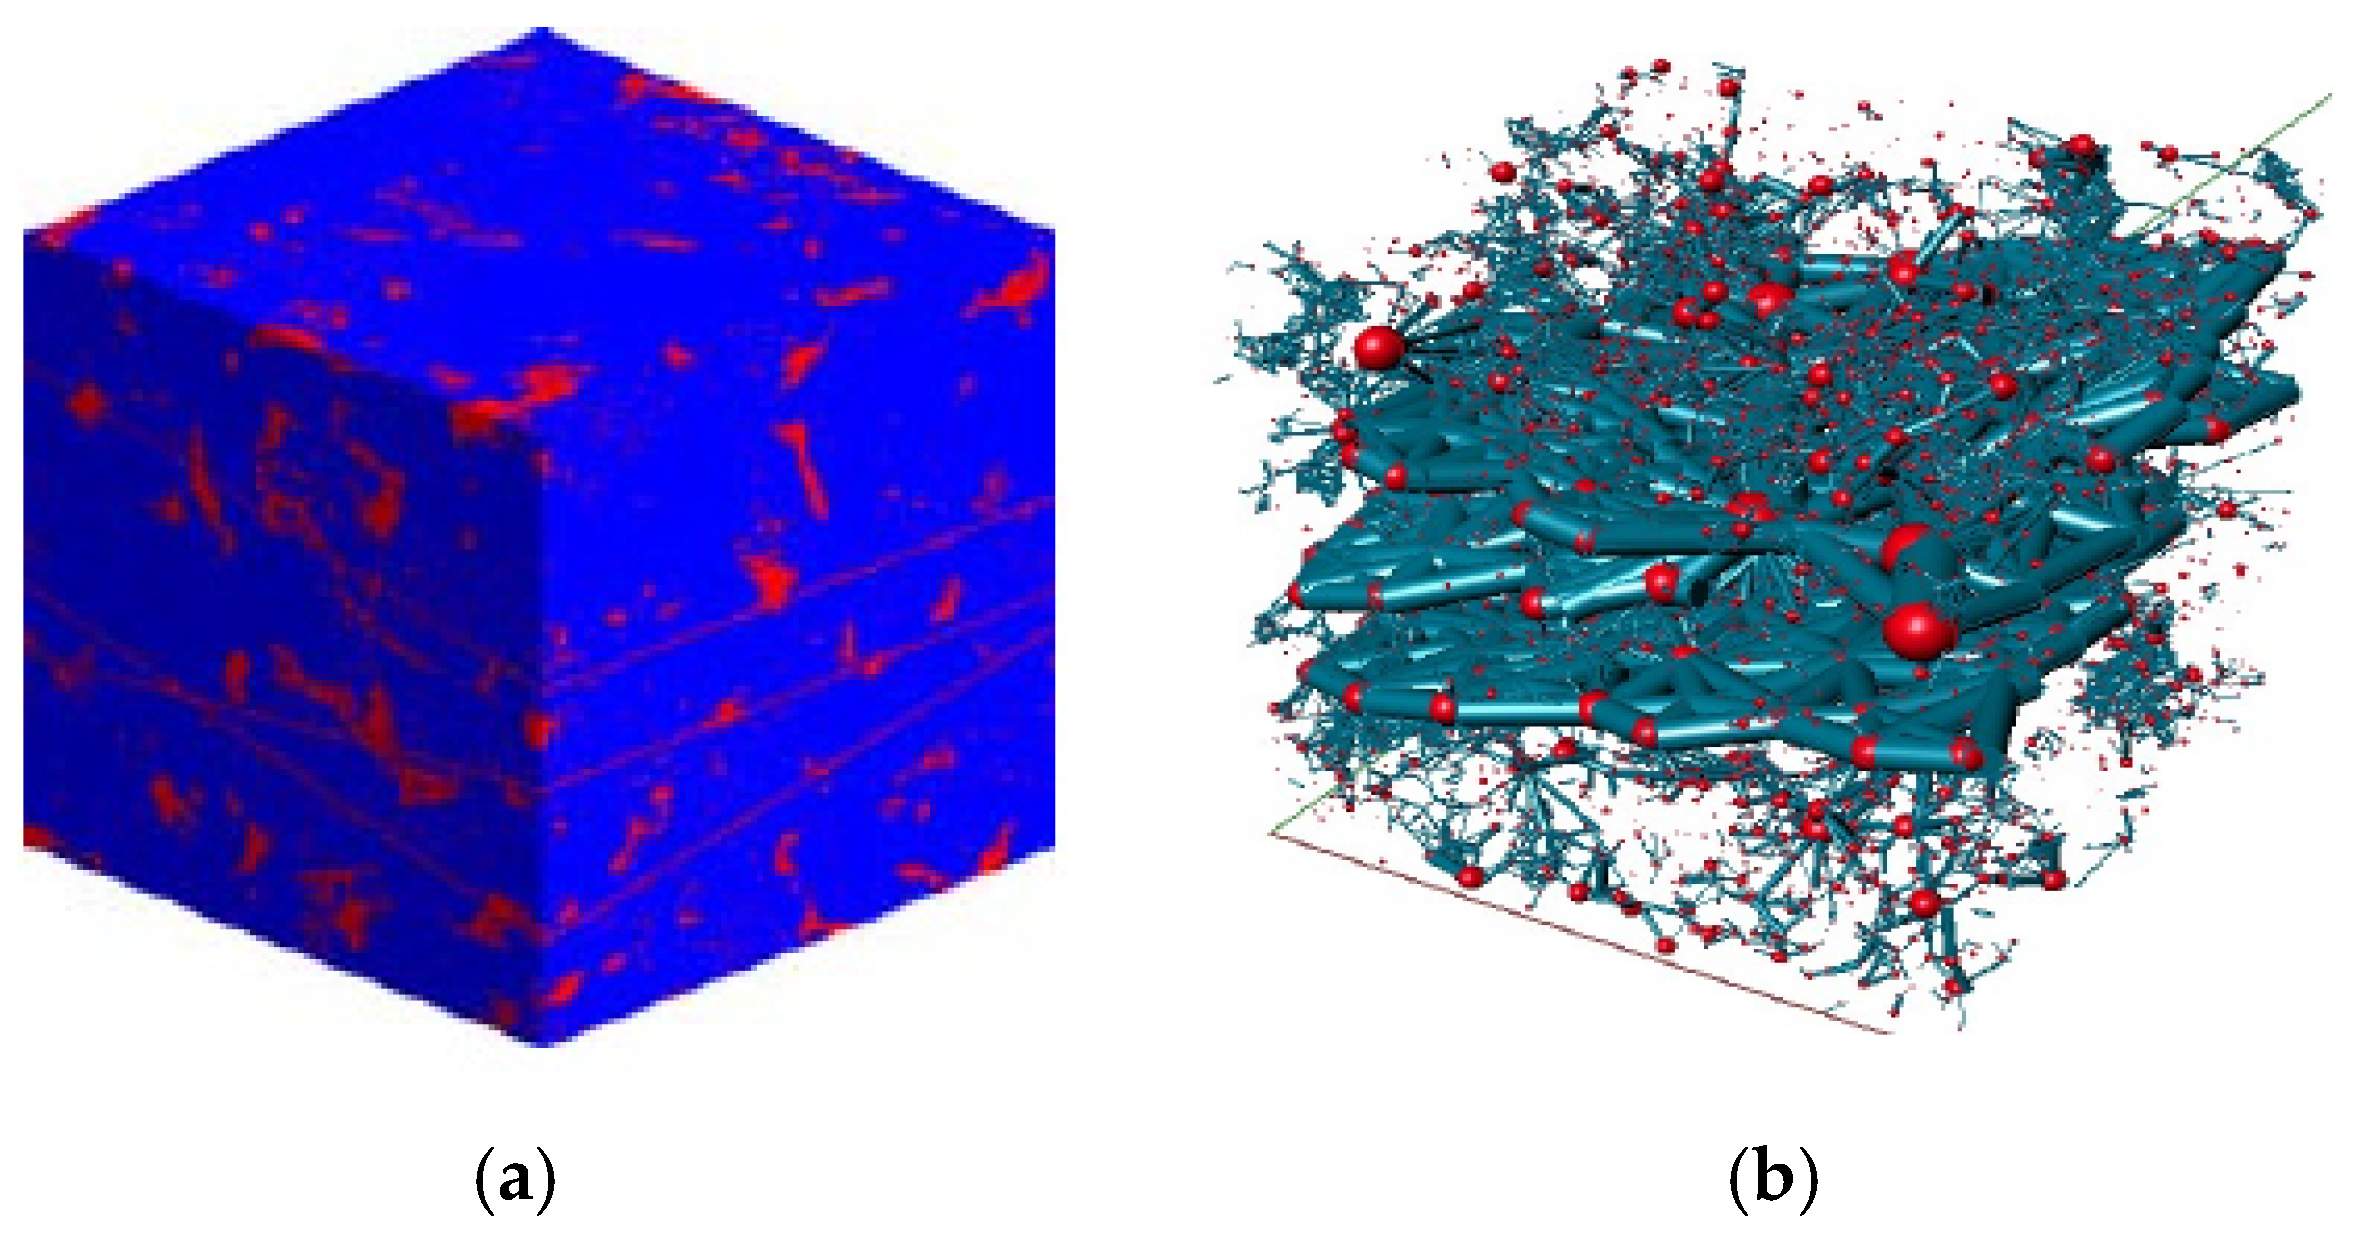
Fracture inclination, fracture length, fracture aperture, fracture density, fracture wall roughness, etc., are the main parameters used to characterize the microscopic fracture structure, and the microscopic fracture parameters of the microfractured tight reservoirs in the Yongjin Oilfield microfractures can be obtained by experimental means, such as CT scanning, casting thin-section observation, and small-angle neutron scattering, etc. The fracture distribution model of the cores was set up (Figure 3) to study the distribution characteristics of the various microfracture parameters of the microfractured cores of the tight reservoirs (Table 2).
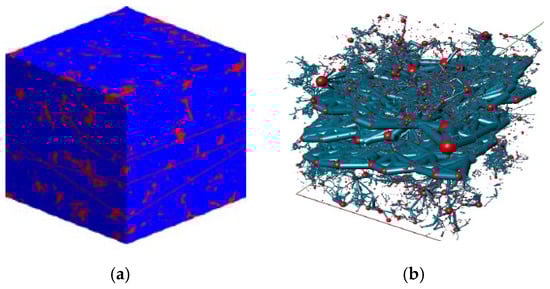
Figure 3.
Fracture model of core (No. #146). Red represents pores; others represent fractures. (a) Two aperture elements. (b) Fracture network.
Table 2.
Distribution characteristics of microfractures.
Microfractures in deep tight oil reservoirs mainly manifest as two types of laminated joints and tectonic joints, in which laminated joints are mainly horizontal joints or small-inclination joints with an inclination angle of less than 30°, and tectonic joints are mainly vertical fractures and high-inclination joints with an inclination angle of more than 60°. Since the CT-scanned cores were obtained after the processing of full-diameter cores, the direction of fracture development is no longer certain; therefore, the dip angle of the microfractures can only be determined by observing the development of dominant tectonic fractures in full-diameter cores, and the direction of tectonic micro-fractures is generally the same as the direction of tectonic dominant joints, i.e., the angle of the dominant tectonic joints is the angle of the micro-fractures.
The obtained thirty-eight cast thin sections from five coring wells in the tight reservoir of Yongjin Oilfield show that intra-grain and through-grain fractures are commonly developed. The microfracture type is dominated by transgranular fractures, accounting for 68% of the total number of microfractures, including intergranular fractures and through-grain fractures. Intergranular fractures develop between mineral particles, are distributed along the edges of the particles, do not cut through the mineral particles, their extension is irregular in shape, and their extension length is between 200 μm and 2000 μm. The fracture morphology of through-grain fractures is mostly flat and straight, their extension length is the longest, ranging from 500 to 6000 μm, the maximum degree of openness is between 10–50 μm, they can cut through mineral particles along the direction of seam extension, their connectivity is better, and the formation of fractures is closely related to geological structure and anomalous high pressure. Intragranular fractures are mainly quartz, feldspar, and calcite fractures and cleavage fractures, they only develop in mineral particles, their extension length is limited to between 100 and 500 μm, their degree of openness is small as the same size as the mineral particle, generally less than 20 μm, and they have poor connectivity between each other. The greywacke grain edge microfractures extend the oolitic grain development, the microfractures are curved, the level of development of microfractures is larger than at the scale of intragranular fractures, and the length of the seam is between 100 and 800 μm.
The microfracture aperture is quantitatively characterized by the distance between the two walls of the microfracture through the 3D visualization software Avizo 2019. Digital cores are imported into the software to complete the image processing, and 3D Length commands are applied to measure the length and openness of the fractures. The microfracture openness of the microfractured cores of the tight reservoirs ranges from 3.8 to 58.9 μm, and the average openness ranges from 6.3 to 49.4 μm, with a concentration of 10–40 μm and an average value of 26.2 μm.
The fracture density is expressed as the line density or surface density. According to the calculation of the surface density, the surface density of the intra-grain fractures is between 10 and 50 μm/cm2, that of the intergranular fractures is between 50 and 300 μm/cm2, and that of the through-grain fractures is between 200 and 800 μm/cm2, and their development degree is consistent with the development degree of the macroscopic fracture line density and bulk density. The intergranular joints and through-grain joints are formed by laminar action or tectonic stress, and the overall development degree of the microfractures is high. As calculated by the line density, the line density of the microfractures in the deep tight oil reservoirs ranges from 0.02 to 0.16 lines/cm, among which the line density of intra-grain joints ranges from 0.02 to 0.1 lines/cm, that of intragranular fractures ranges from 0.06 to 0.16 lines/cm, and that of penetrating-grain joints ranges from 0.08 to 0.14 lines/cm.
The fracture wall roughness reflects the smoothness of the fracture wall, and the shape of the fracture surface and the level of roughness have an important effect on the flow characteristics at the microscale. Through CT scanning and the small-angle neutron scattering image reconstruction method, the undulation state of different profiles of the fracture can be reproduced, and then the roughness of each profile can be obtained through a programming calculation. The roughness on each profile is averaged to be the roughness of the wall of the fracture, and according to the results of the calculations, the roughness of the microfractures of the dense core is between 7 and 10, with little fluctuation.
3. Pore-Fracture Fractal Dimension in Microfractured Tight Reservoirs
The most significant feature of a fractal object is that it has self-similarity. According to the similarity relationship between a line segment, a square, and a cube, the fractal dimension calculation method of a fractal body is refined, and the fractal dimension can measure the degree of regularity of a complex shape. When the fractal dimension is higher, the complexity of the fractal body is higher, and the fractal theory is more effective in quantitatively describing the complexity of the pore structure. Based on the micro-parameter characteristics of the tight reservoirs in Yongjin Oilfield mentioned above, the fractal dimensions of microcracks and pores were calculated using fractal theory and the box counting method, respectively. Then, a method for calculating the fractal dimension of the pores and fractures was established. Compared with simply calculating the fractal dimension of pores as was carried out in the past, the newly established pore fracture analysis dimension can reflect the influence of microfracture development in tight reservoirs on the fractal dimension.
3.1. Calculation Method of Pore-Fracture Fractal Dimension
According to the basic principle of fractal geometry, if the distribution of the pore throat radii of microfractured cores in a tight reservoir conforms to a fractal structure, the cumulative volume of the pore throat radius > r conforms to a power function relationship with the radius r:
In the equation, f(r) is the pore radius distribution density function;
rmax is the maximum pore radius;
a is the fractal coefficient;
D is the pore fractal dimension.
Taking the derivative of Equation (1) with respect to r gives:
Assuming that the pores are spherical, the spherical model is substituted into Formula (2), and the cumulative volume of the pores in the rock with a pore radius < r can be obtained as:
In the equation, rmin is the minimum pore radius;
b is the proportionality coefficient for the sphere. If the pores are cubic, b = 1; if they are spherical, b = 4π/3.
From Equation (3), the total pore throat volume of the reservoir is:
By comparing Equations (3) and (4), the cumulative volume fraction of pores with radius < r is obtained as:
In the equation, S is the wetting-phase saturation (condition: cumulative volume fraction of pores with radius < r).
Due to the complex microstructure of microfractured cores in tight reservoirs, the difference between the maximum pore throat radius and the minimum pore throat radius is obvious, i.e., the maximum pore throat radius is much larger than the minimum pore throat radius, with rmin << rmax, rmin << r, i.e., set rmin = 0, and Equation (5) can be simplified as:
Considering that the pore radius in the formula can be obtained from the mercury intrusion curve and the magnitude of the pressure during the mercury intrusion experiment reflects the difficulty of mercury entering the pore throat, i.e., based on the capillary model, the reservoir rock obeys the Laplace equation:
In the equation, Pc is the capillary pressure corresponding to any pore throat radius r;
σ is the interfacial tension of the fluid in the reservoir;
θ is the contact angle between the fluid and the rock.
Substituting Equation (7) into Equation (6) converts the ratio of pore throat radii into the ratio of capillary pressures, thereby enabling the analysis of the pore throat structure characteristics:
In the equation, Pmin is the capillary pressure corresponding to the maximum pore throat radius rmax, i.e., the mercury intrusion threshold pressure;
Taking the logarithm of both sides of Equation (8) gives:
It can be seen that the logarithm of the capillary pressure lg Pc and the corresponding logarithm of the wetting-phase saturation lg S in the microfractured core of the tight reservoir show a linear relationship, and lg Pc and lg S, corresponding to different pore radius r, are calculated based on high-pressure mercury pressure experiments, and the pore fractal dimension D is obtained by using a graphical method or regression analysis. If the pore radius r and the pore fractal dimension D are fixed, the larger the fractal coefficient a is, the larger the pore radius distribution density function f (r) is, the larger the pore volume is, and the better the physical properties of the reservoir, the physical significance of which reflects the degree of pore development, where the larger the value is, the more the pore is developed.
For microfractured cores in tight reservoirs, the fractal dimensions of the fractures can be calculated by the box-counting dimension method, which is a commonly used method for calculating geometric fractal dimensions and intuitively reflects the degree of the spatially extended distribution of microfractures. Based on the 3D CT scan dataset, the number of boxes covering all the study targets is counted, and then the box size is changed, the number of boxes N(r) is counted several times at different box sizes, and the fractal dimension of the microfracture is calculated according to the formula of the box counting dimension:
The main approach is to take a box with side length r, cover the fractal structure to see and count the number of non-empty boxes N(r), shorten the box side length r, count the number of non-empty boxes N(r), repeat the above process to record a series of side lengths r and the corresponding N(r), and generate a scatterplot in a double logarithmic coordinate system, where the slope of the fitted straight line is the microfracture fractal dimension FD.
If the pore fractal dimension D and the microfracture fractal dimension FD are known, porosity weighting can be applied to calculate the pore fractal dimension Dt with the following expression:
In the equation, , , and represent the total porosity, matrix porosity, and microfracture porosity, respectively.
3.2. Calculation Example of Pore Fracture Fractal Dimension
The principle of the constant-rate mercury penetration method is to ensure the occurrence of a quasi-static mercury penetration process at a very low speed (0.000001 mL/s). In this process, the interface tension and contact angle are constant. The shape of every pore in the front of the mercury inlet will change the shape of the meniscus, which will cause a change in the capillary pressure; a typical pressure fluctuation curve is shown in Figure 4a. Therefore, real information regarding the pore structure, such as the pore radius, throat radius, pore–throat ratio, etc., can be obtained by the constant-rate mercury penetration method.
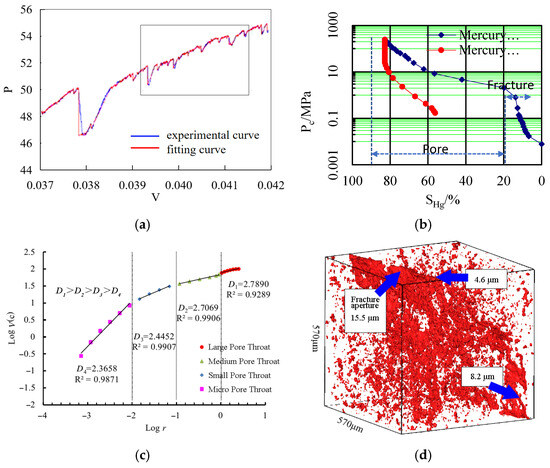
Figure 4.
Fractal dimension calculation of pores and fractures. (a) Typical pressure fluctuation curve. (b) Mercury intrusion curve. (c) lg (1 − SHg)~r. (d) Microfracture development.
As shown in Figure 4b, based on the mercury intrusion data of a microfracture core in Yongjin Oilfield (permeability: 0.87 × 10⁻³ μm2; porosity: 13.6%), the pore throats were classified into large, medium, small, microfractures were classified from large to small, and the fractal dimensions of the pores and microfractures were calculated according to Equations (9) and (10) respectively, and then pore fracture fractal dimension is calculated according to Equation (11). Figure 4c shows that the pore throat radius r and the wetting-phase saturation lg (1 − SHg) double logarithmic coordinates of the core are segmented. The fractal dimension of large pore throats, medium pore throats, small pore throats, and microfractures are all less than 3, with a distribution range between 2.36 and 2.79, and the mean value is 2.52, as is shown in Table 3. From an overall point of view, the pore fractal dimension is the highest, the microfracture fractal dimension is the smallest, and the pore fractal dimension is between the pore fractal dimension and the microfracture fractal dimension, and it is closer to the pore fractal dimension.
Table 3.
Fractal dimension calculation of pores and fractures.
4. Comprehensive Evaluation Method for Microfractured Tight Reservoirs
According to the production conditions of the wells in Yongjin Oilfield, two major categories of reservoir microscopic pore and seam structural parameters, macroscopic reservoir physical properties, and fluid parameters are selected as the comprehensive classification and evaluation parameters of the reservoirs, and due to the fact that there are more studies on the factors of macroscopic reservoir physical properties and fluid parameters, a discussion regarding this will not be presented here. However, there are fewer studies on the factors of microscopic pore and fracture structural parameters, and a focus needs to be placed on studying the classification boundaries. Specifically, the classification boundaries of macroparameters are determined by the inflection point identification method based on the relationship curve between the production capacity, physical parameters, and fluid parameters, and the classification boundaries of micro-parameters are determined by distinguishing the magnitude of change based on the relationship curve between the equivalent permeability and micro-parameters.
4.1. Classification and Evaluation Parameter Boundaries
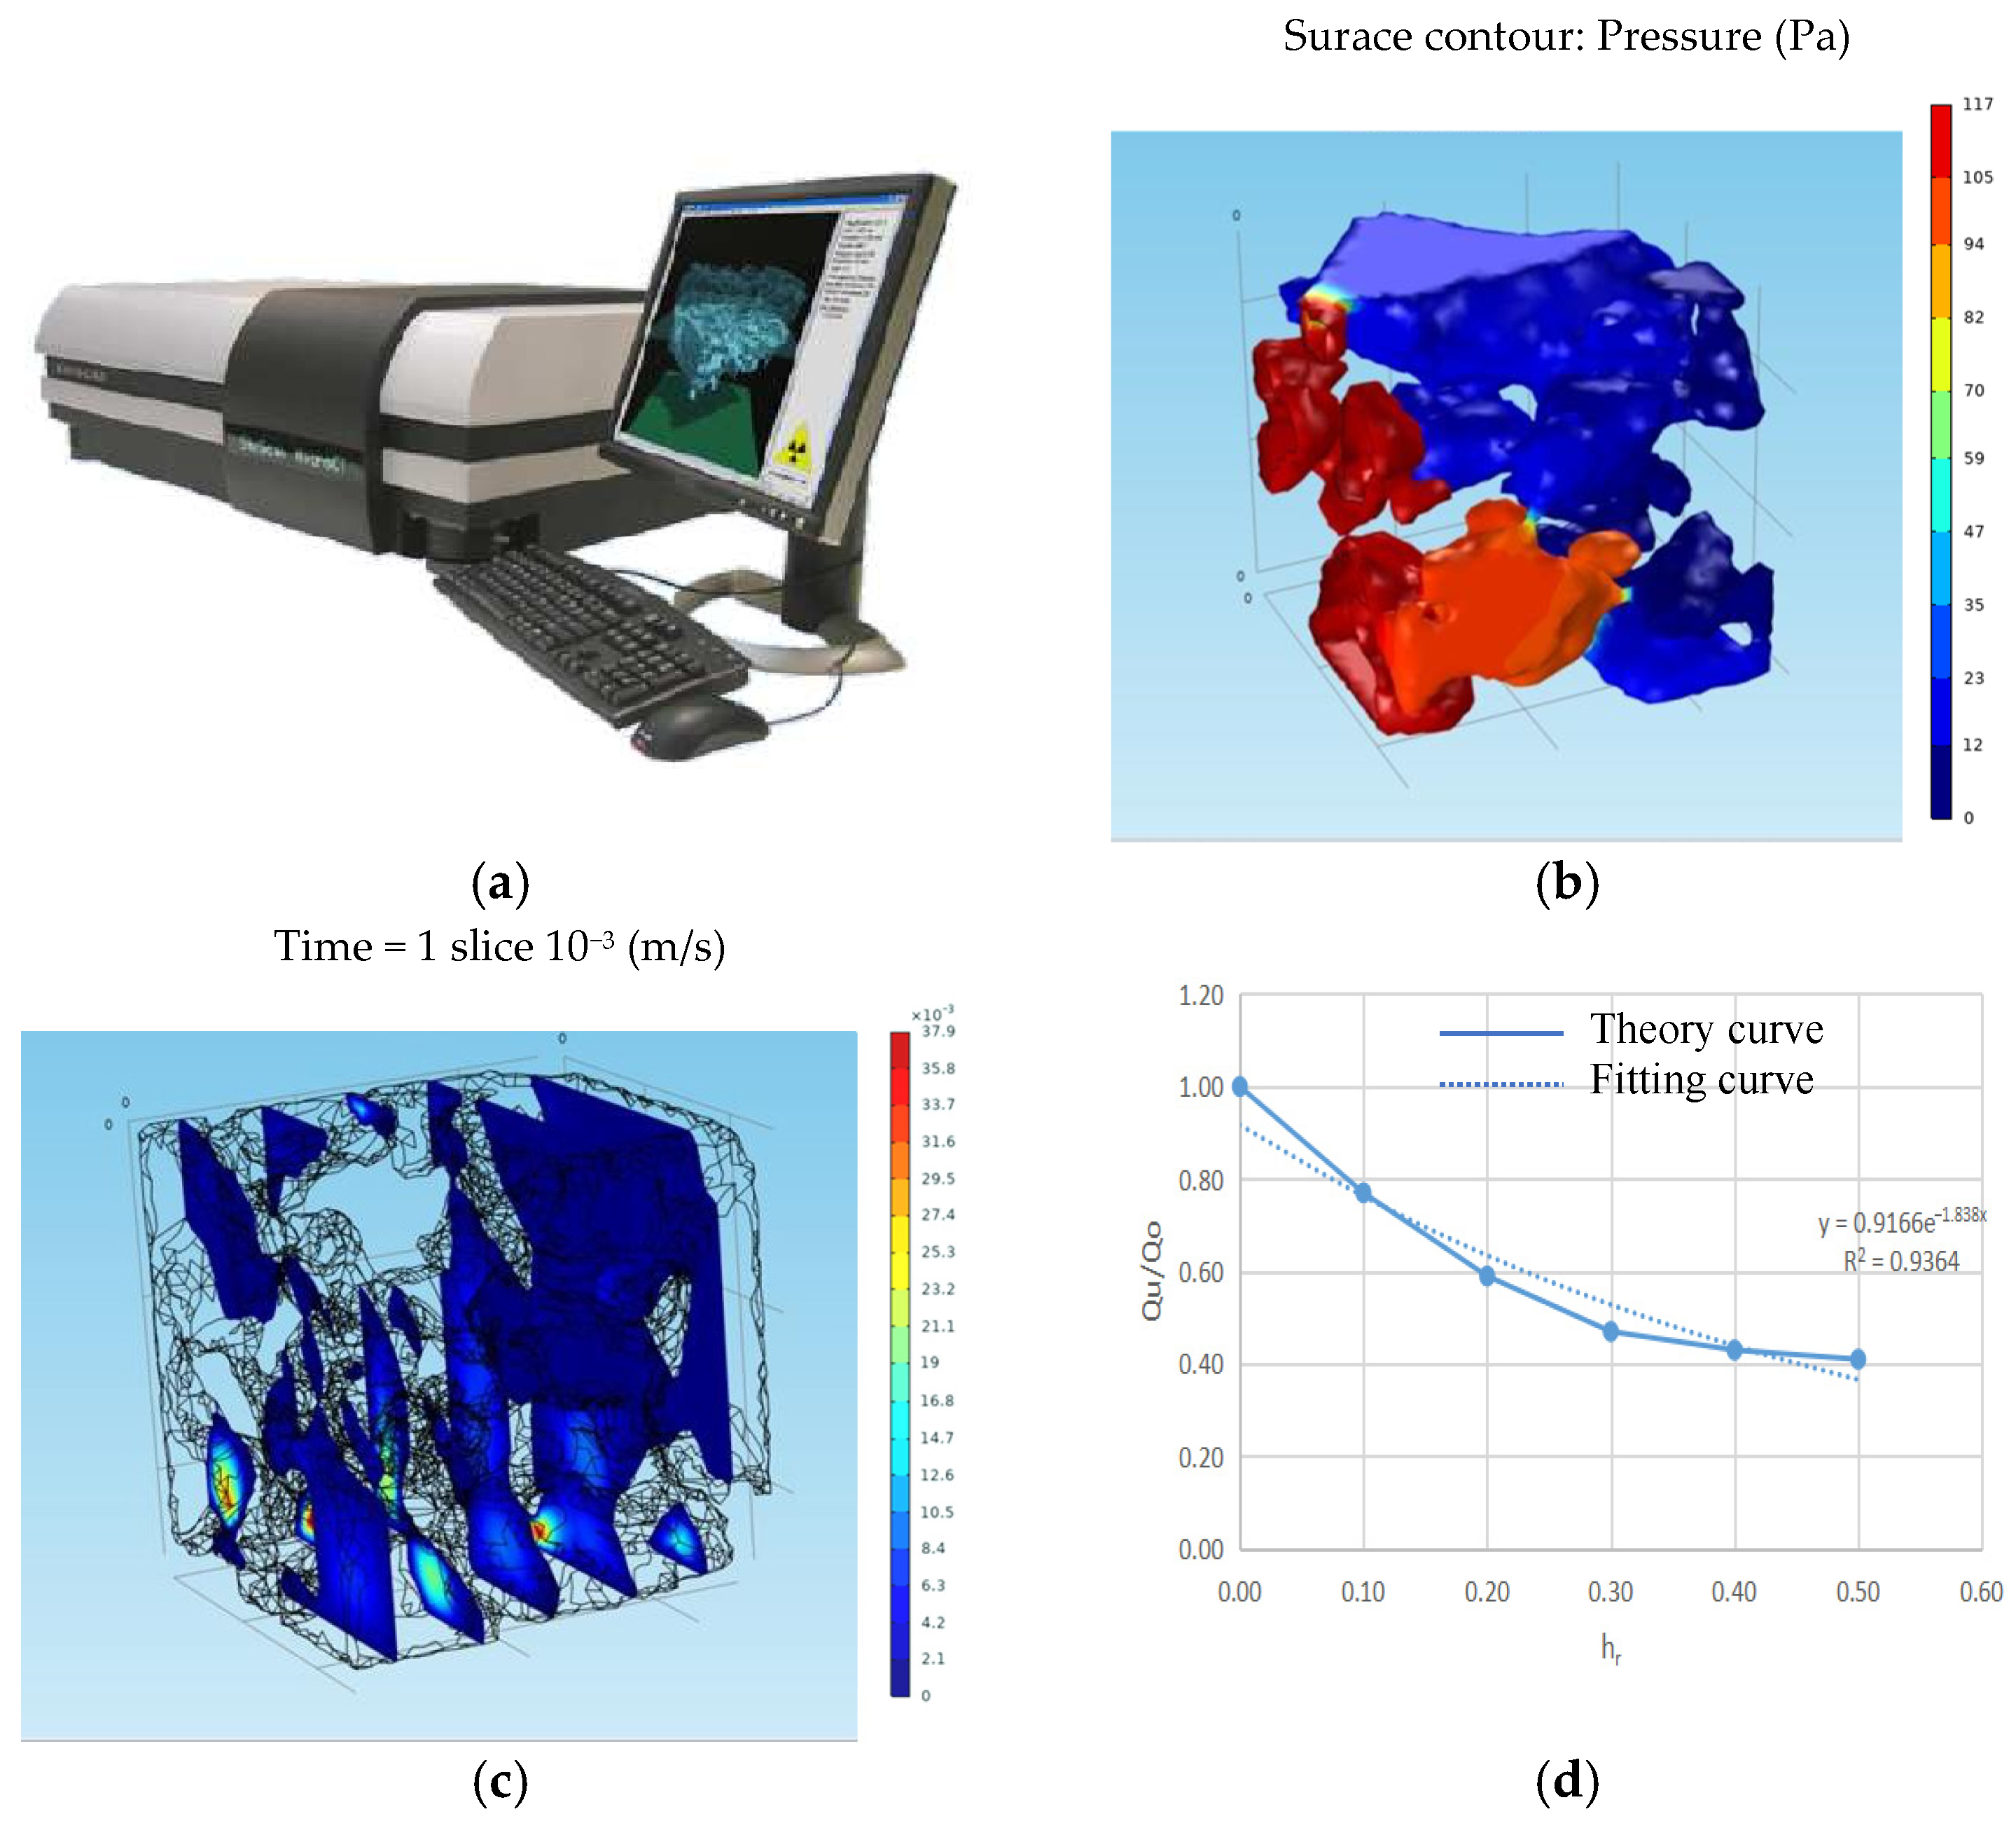
The microscopic parameters mainly include microscopic pore parameters and microscopic fracture parameters, and the throat radius, as one of the important microscopic pore parameters, has an important influence on the seepage capacity of microfractured cores in tight reservoirs. According to the CT scanning model, given the pressure difference, different boundary layer thicknesses and boundary layer viscosities are set to study the microscopic flow changes in the digital cores, as shown in Figure 5.
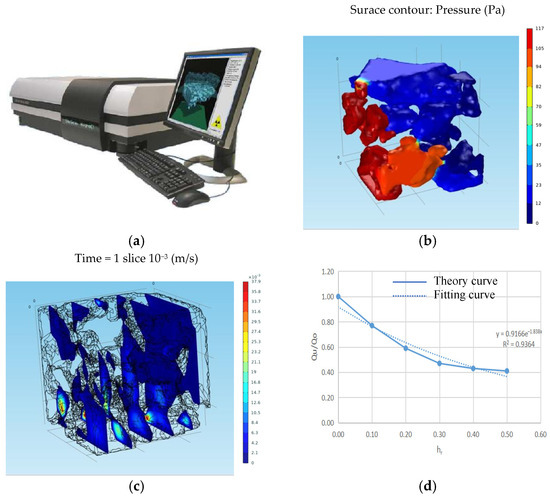
Figure 5.
Throat radius boundary. (a) CT scanning equipment. (b) Pressure field. (c)Velocity field. (d) The influence of the boundary layer thickness on seepage (μr = 3.0).
The experiment was conducted using a SkyScan1172 high-frequency CT scanner manufactured by SkyScan N.V. Vluchtenburgstraat 3C 2630 (Aartselaar, Belgium). The X-ray source operated at 20–100 kV with a rated power of 10 W and a resolution of 11 million pixels, providing a spatial resolution of 0.5 μm. The system was equipped with corresponding software, including image acquisition software, CT-AN v.1.18 for pore structure analysis, Nrecon v2 for 2D image reconstruction, ANT v1.10.14 for reconstruction, and Data Viewer v4.0.1 for 3D visualization. Fluid flow within the digital rock core was simulated using the COMSOL Multiphysics v6.0 software. The accuracy of the model was validated against experimental data. Due to the influence of the yield stress and boundary layer effects on fluid flow, the actual flow rate is typically lower than the theoretical flow rate. By simulating non-Newtonian fluids and the boundary layer thickness, the flow rate calculated by the model aligned with the experimental flow rate, thereby ensuring the model’s accuracy.
The digital core microflux decreases exponentially with the increase in the boundary layer thickness, and its effect on the microflux decreases significantly when the boundary layer thickness is greater than 0.2 μm. Taking the boundary layer thickness of 0.2 μm as the boundary, when the throat radius is 0.5 μm, the effective flow radius accounts for 60%; when the throat radius is 1.0 μm, the effective flow radius accounts for 80%, and effective flow radius of 60% and 80% are the boundaries to determine the threshold of the throat radius.
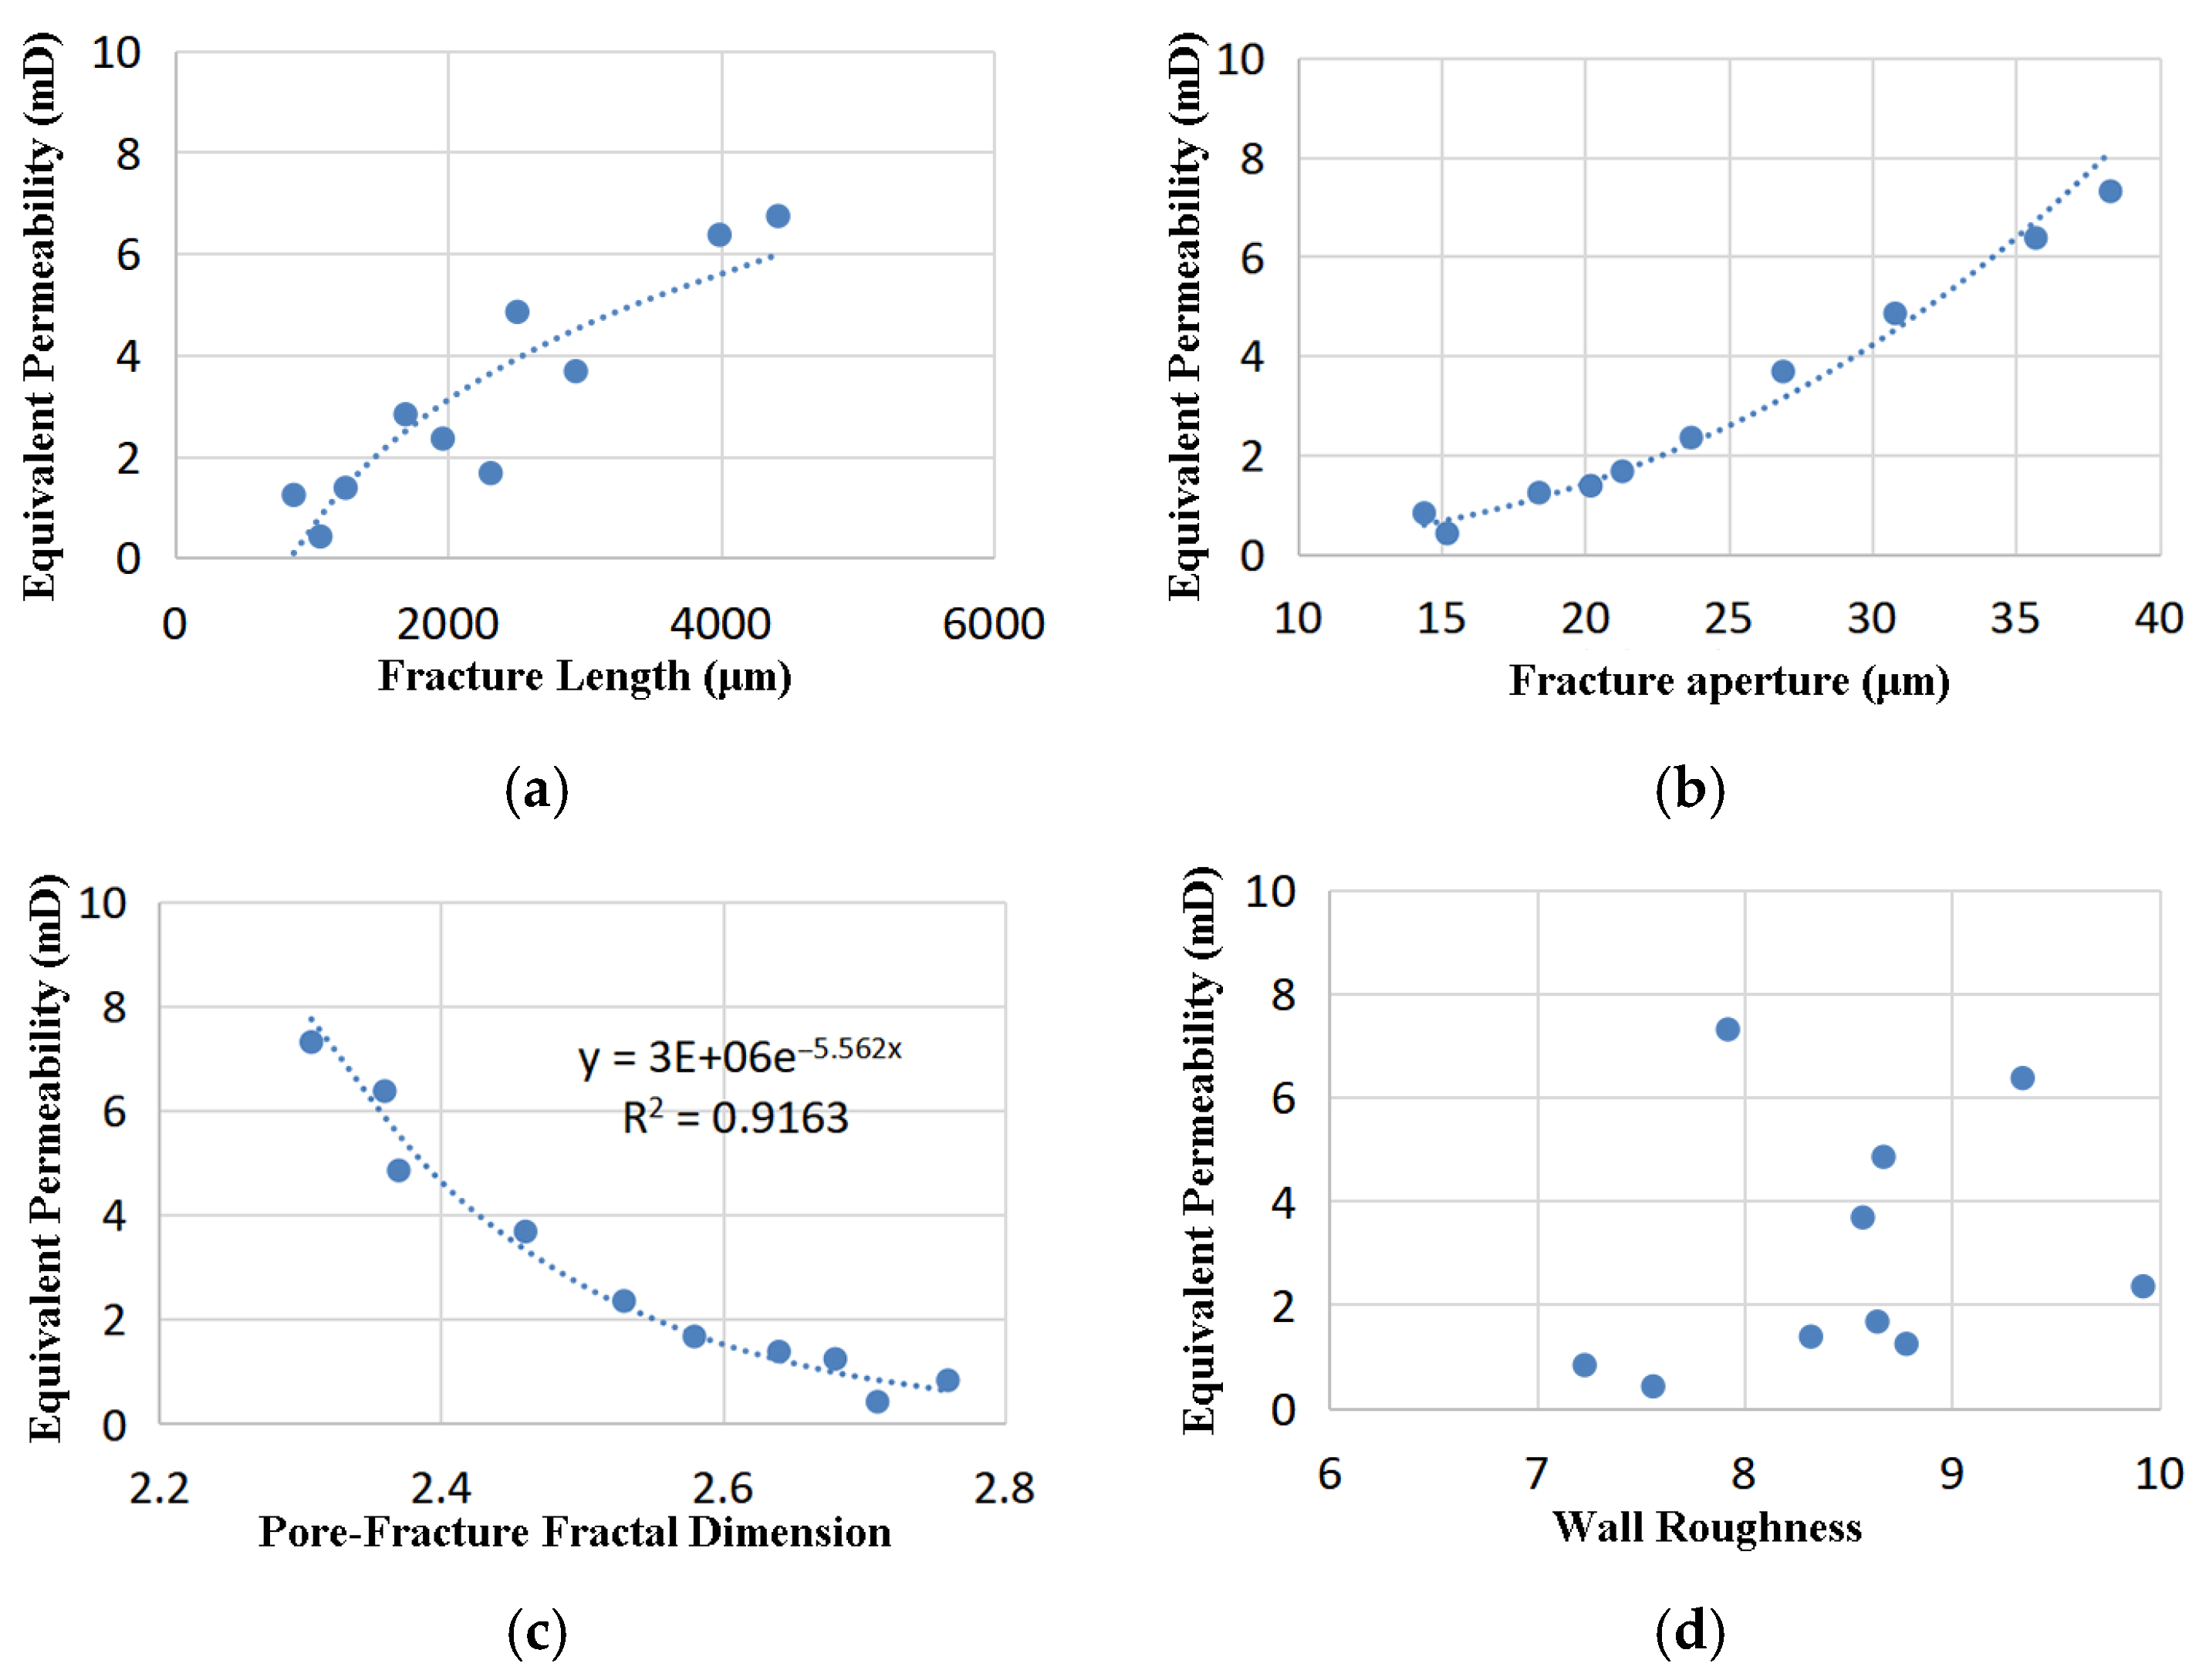
On this basis, the relationship between the equivalent permeability and the variation in the microscopic fracture parameters was further investigated to determine the limits of parameters such as the fracture length, fracture aperture, pore fracture fractal dimension, and wall roughness, as shown in Figure 6.
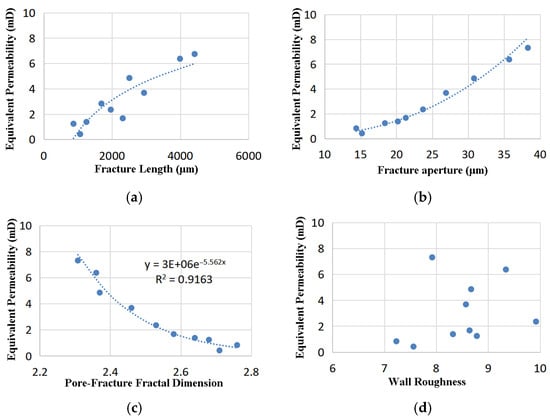
Figure 6.
Relationship between microfracture parameters and equivalent permeability. (a) Fracture length. (b) Fracture aperture. (c) Pore fracture fractal dimension. (d) Wall roughness.
The classification boundaries of the microfracture parameters are determined based on the speed of the change in the relationship between the microfracture parameters and the equivalent permeability, as is shown in Table 4. The equivalent permeability shows a logarithmic increasing trend with the increase in the fracture length. When the fracture length is less than 2000 μm, the increase grows rapidly. When the fracture length is greater than 2000 μm and less than 5000 μm, the increase grows slowly. When the fracture length is greater than 5000 μm and the fracture aperture is greater than 100 μm, it reaches the criterion of visible fractures (bedding fractures), and when the fracture length exceeds the visible fracture standard, the equivalent permeability does not increase significantly with the increase in the fracture length. Equivalent permeability shows a binomial increasing trend with increasing fracture aperture. When the fracture aperture is less than 25 μm, the increase grows slowly. When the fracture aperture is greater than 25 μm and less than 100 μm, the increase grows rapidly. It reaches the criterion of visible fractures when the fracture aperture is greater than 100 μm, the equivalent permeability increases significantly with the increase of the fracture aperture. The equivalent permeability shows a binomial increasing trend with the increase pore fracture fractal dimension. The equivalent permeability decreases exponentially with the increase in the fractal dimension, and the fractal dimension is divided into three intervals of <2.4, 2.4~2.6, and >2.6 according to the decrease in the equivalent permeability. The equivalent permeability and wall roughness have a scattering distribution, and the correlation is not large, and the above results provide the basis for the determination of the classification limit of the microfracture parameters and the comprehensive evaluation of the reservoir.
Table 4.
Classification and evaluation boundaries of microfractured tight reservoirs.
4.2. Classification Comprehensive Evaluation Index
According to the regression coefficient of each evaluation parameter in the equivalent permeability model, the weight coefficients of the microparameters are determined; the weights are determined according to the grey correlation analysis methods of production capacity and macro-parameters and fluid parameters and microparameters, as shown in Table 5, in which the porosity is given the lowest weight, and the thickness of the sand body is given the highest weight.
Table 5.
Classification and evaluation weights of microfractured tight reservoirs.
According to the correlation degree of each parameter, the comprehensive evaluation method is applied to give the formula of the comprehensive evaluation index applicable to the classification of the microfractured tight reservoirs in Yongjin Oilfield, which is shown in Equation (12):
In the equation, the positive correlation calculation formula is , and the negative correlation calculation formula is . The selection of the maximum and minimum values is determined based on the research object, i.e., taking the tight reservoir of Yongjin Oilfield as the research object. The reservoir includes several research blocks, and the evaluation parameters of each block are of different sizes. The maximum and minimum values of each parameter in all research blocks can be summarized.
Two major categories of the reservoir microscopic pore and fracture structure parameters, macroscopic reservoir physical properties, and fluid parameters are selected as the comprehensive classification evaluation parameters of the reservoirs, and the microfractured tight reservoirs in Yongjin Oilfield are classified into three major categories of good (class I), medium (class II), and poor (class III). The classification boundaries are substituted into the formula to judge the classification of the reservoirs according to the comprehensive evaluation indices, i.e., the REI of class I reservoirs is >0.7, that of class II reservoirs ranges from 0.4–0.7, and that of class III reservoirs is < 0.4.
5. Discussion
The important significance of using the fractal dimension of pores and fractures for reservoir classification and evaluation is to distinguish the characterization of different micropore and microfracture structures under the same permeability. A high fractal dimension (D→3) is a sign of a highly complex and irregular pore structure. This complexity directly leads to poor pore connectivity (more dead ends and isolated pores, higher tortuosity, smaller pore throat radius). The combined effect of decreased connectivity and structural irregularity significantly reduces the absolute permeability of the medium and strongly affects the multiphase flow behavior (higher capillary pressure, altered relative permeability curve, higher residual saturation). A low fractal dimension (D → 2) indicates a pore throat structure that is relatively simple, smooth, and uniform, with low flow resistance. The permeability of rock cores depends on the micropore structure, but there is a multiple solution relationship between the two. The permeability of rock cores with the same micropore structure is the same, but the micropore structure of rock cores with the same permeability has significant differences, which directly leads to significant differences in the effectiveness of water flooding oil development.
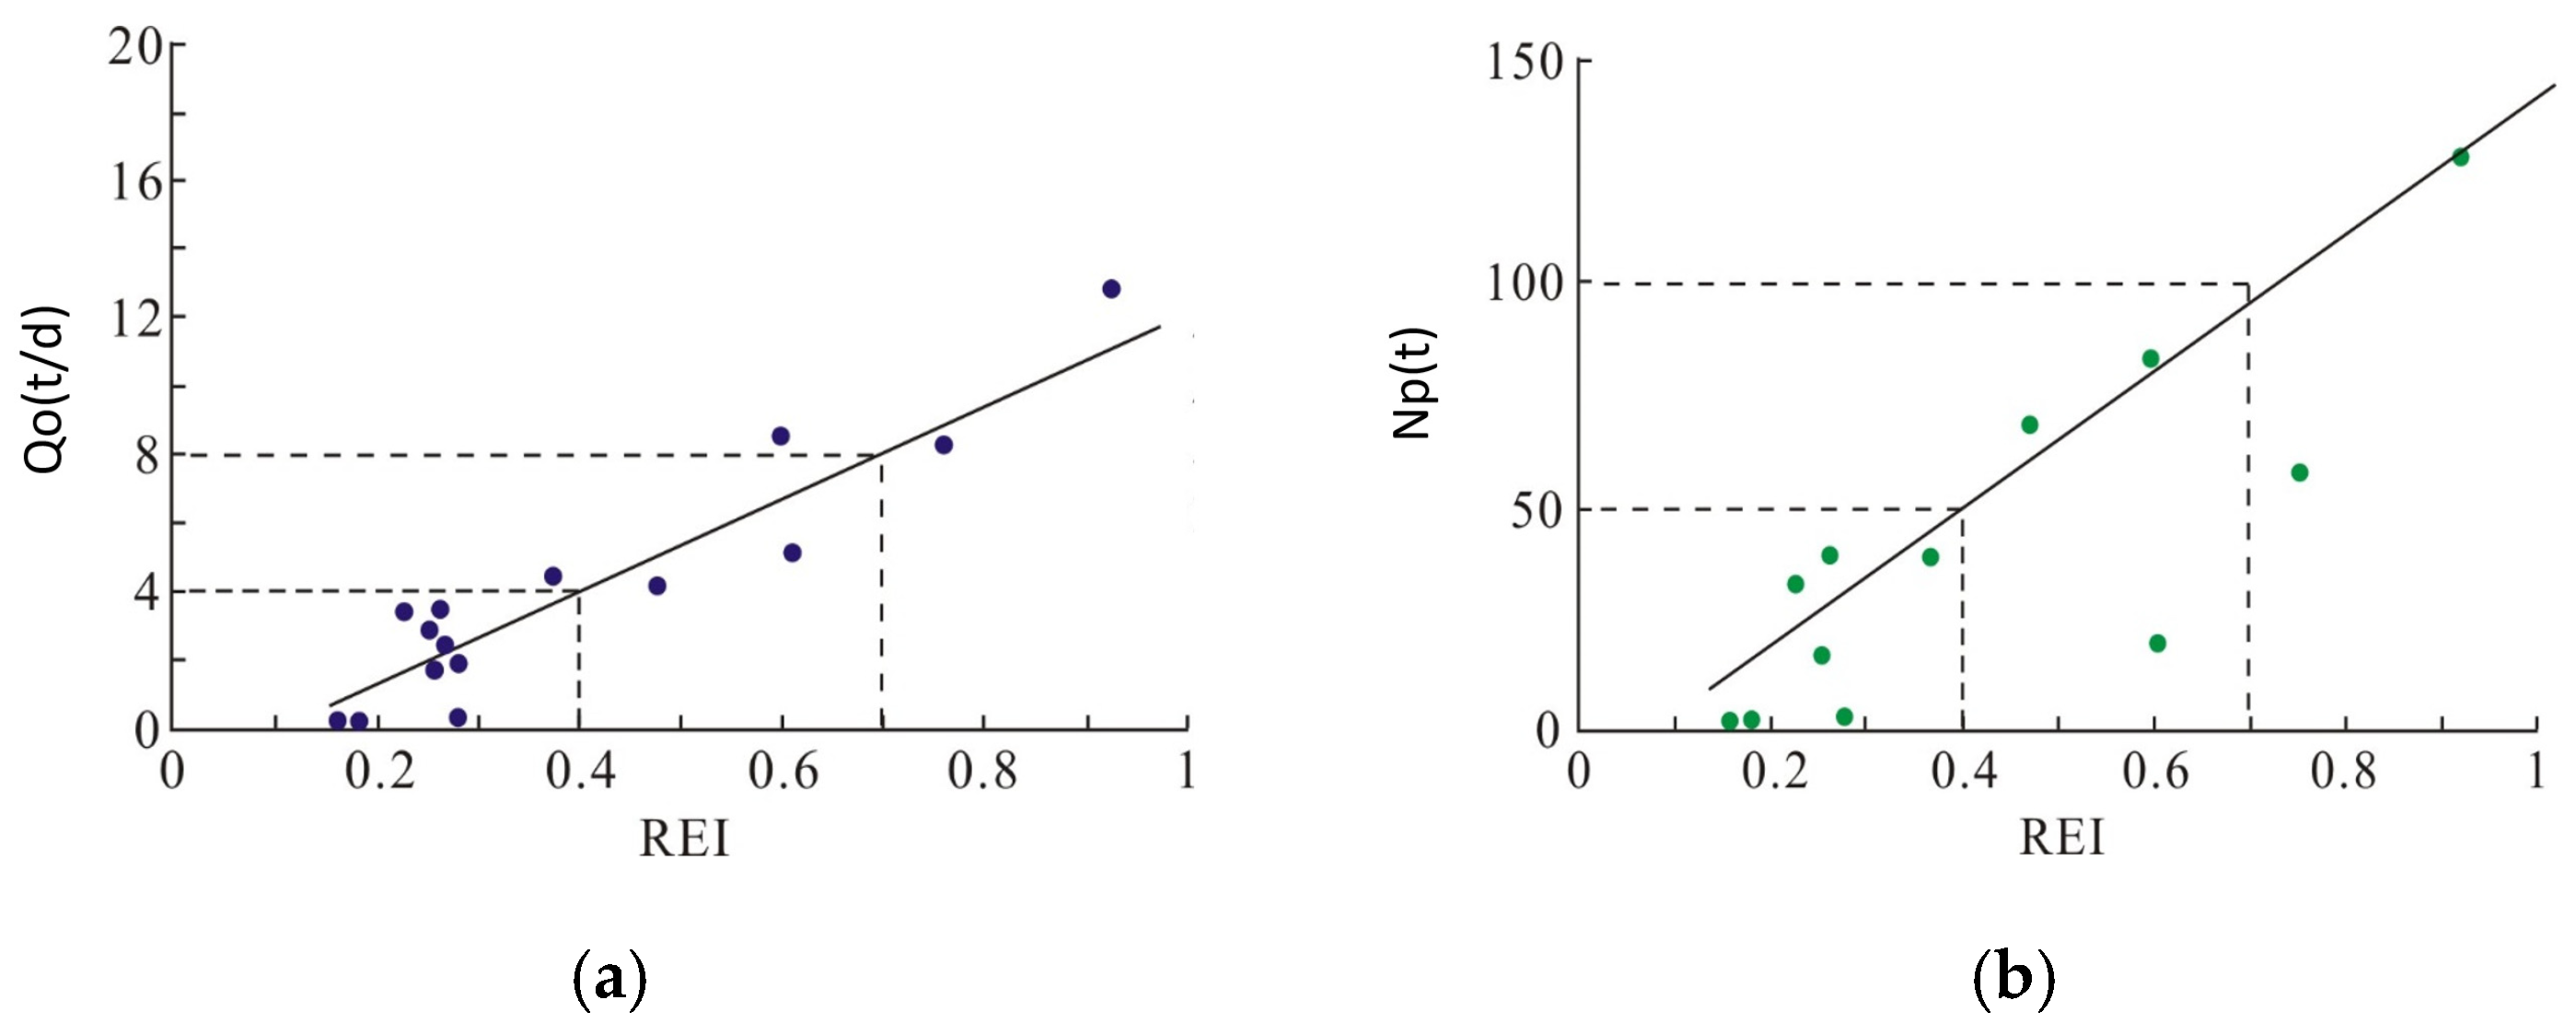
Introducing the fractal dimension of pores and fractures, a comprehensive quantitative index method was established to classify and evaluate reservoirs, and the classification results were verified with dynamic data. To ensure the accuracy of the classification evaluation results, sufficient representative samples should be included in the sample selection. According to the comprehensive evaluation formula REI for tight reservoirs, combined with the validation of the relationship between the initial daily oil production, cumulative oil production, and REI in developed blocks, it can be seen that the classification results are reliable, and class I oil reservoirs are high-quality reservoirs, class II oil reservoirs are average reservoirs, and class III reservoirs are poor reservoirs, as is shown in Figure 7.
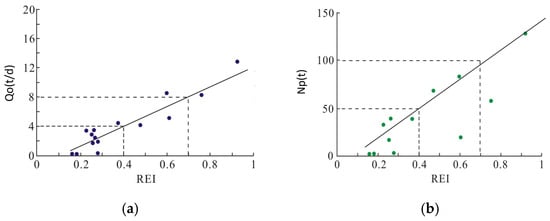
Figure 7.
Classification results and validation of dynamic data. (a) Relationship between Qo and REI. (b) Relationship between Np and REI. The blue scatter plot represents relationship between Qo and REI. The green scatter plot represents relationship between Np and REI.
The classification and evaluation of reservoirs have crucial practical significance for development decisions. By using the REI comprehensive evaluation index to classify reservoirs, on the one hand, it helps to classify reservoir types and reasonably combine layer systems, accurately quantify reservoir potential and development risks, and provide a scientific basis for decision-making. On the other hand, customized development methods can be developed for different types of reservoirs, prioritizing the development of high-yield and high-quality reservoirs to achieve rapid returns, providing a scientific basis for optimizing development strategies, avoiding inefficient investments, and guiding resource allocation.
6. Conclusions
- (1)
- The characteristics of pore seam parameters in microfractured tight reservoirs in Yongjin Oilfield were clarified, with the permeability of type I, II and III cores decreasing sequentially, the pore radius decreasing from 40.46 μm to 33.25 μm, the throat radius decreasing from 0.73 μm to 0.32 μm, the pore-to-throat ratio increasing dramatically from 89.29 to 150.12, the allometry decreasing from 2.49 to 1.70, the meandering degree decreasing from 4.58 to 5.89, and the shape factor decreasing from 0.024 to 0.018. The microfracture extension length varied from 50 μm to 6000 μm, thefracture aperture ranged from 10 to 40 μm, the microfracture line density ranged from 0.02 to 0.16 lines/cm, and the wall roughness ranged from 7 to 10.
- (2)
- The main factors affecting the development effect of microfractured tight reservoirs were identified and reduced in order of weight coefficients, including the fractal dimension of pores and fractures, permeability, throat radius, oil saturation, fracture aperture, reservoir thickness, crude oil viscosity, and fracture length. The weight coefficients are 0.1586, 0.1384, 0.1270, 0.1249, 0.1244, 0.1193, 0.1175, and 0.090, respectively. Combining the equivalent permeability and the trend of each factor, the classification boundary of the reservoir was clarified, providing a basis for calculating the classification boundary of the comprehensive evaluation index of the reservoir.
- (3)
- A method for calculating the fractal dimension of microfractured tight reservoirs and a comprehensive quantitative evaluation method were established. The microfractured tight reservoirs in Yongjin Oilfield can be classified into class I, II, and III according to their development effects. The comprehensive evaluation index (REI) of class I reservoirs is greater than 0.7, and the fractal dimension of pores and fractures is less than 2.4. The comprehensive evaluation index (REI) of class II reservoirs ranges from 0.4 to 0.7, and the fractal dimension of pores and fractures ranges from 2.4 to 2.6. The comprehensive evaluation index (REI) of class III reservoirs is less than 0.4, and the fractal dimension of pores and fractures is greater than 2.6. The classification results are consistent with the dynamic data of the mining site. This achievement can provide a scientific basis for the rapid evaluation of reservoirs and the formulation of development strategies.
Author Contributions
Methodology, D.Y.; Formal analysis, Y.S.; Writing—original draft, C.L.; Writing—review and editing, D.W. All authors have read and agreed to the published version of the manuscript.
Funding
This work was financially supported by the Open Fund of the Shaanxi Key Laboratory of Advanced Stimulation Technology for Oil & Gas Reservoirs (KFJJ-TZ-2023-2), the Heilongjiang Provincial Innovation and Entrepreneurship Training Programme for College Students (202110220070) and the Northeast Petroleum University Talent Introduction Scientific Research Start-Up Foundation Project: ‘Dynamic characterisation and prediction method of phase behaviour of microemulsion flooding’.
Data Availability Statement
The original contributions presented in this study are included in the article. Further inquiries can be directed to the corresponding author.
Acknowledgments
I would like to express my gratitude to all those who helped me during the writing of this thesis.
Conflicts of Interest
Author Chunguang Li was employed by Shengli Oilfield Branch, Sinopec. Author Yang Sun was employed by China National Petroleum Corporation Jilin Oilfield Branch. The remaining authors declare that the research was conducted in the absence of any commercial or financial relationships that could be construed as a potential conflict of interest.
References
- Liu, H.; Zhang, C.; Gai, S.; Yu, Z.; Li, J.; Yuan, H.; Zhang, L.; Liu, H. Diagenetic facies identification and distribution prediction of Jurassic ultra-deep tight sandstone reservoirs in Yongjin Oilfield, Junggar Basin. Pet. Geol. Recovery Effic. 2024, 31, 13–22. [Google Scholar]
- Dong, C. The Study on the Formation Mechanism of Xishanyao Reservoir in Yongjin Oilfield, Junggar Basin. Xinjiang Geol. 2014, 32, 92–95. [Google Scholar]
- Jiao, C.; Xia, D.; Wang, J.; Liu, L.; Sheng, W.; Cheng, P. The Study on Determining Petrophysical Property Cutoffs of Extra-Low Porosity and Permeability Sandstone Reservoirs—A Case Study from the Xishanyao Formation Reservoirs in Yongjin Oilfield, Junggar Basin. Oil Gas Geol. 2009, 30, 379–383. [Google Scholar]
- Pang, M.; Ba, J.; Carcione, J.; Vesnaver, A.; Ma, R.; Chen, T. Analysis of the Attenuation Rock Physics Template of Tight Sandstones: Reservoir Microcrack Prediction. Acta Geophys. Sin. 2020, 63, 4205–4219. [Google Scholar]
- Yin, S.; Ding, W.; Shan, Y.; Zhou, W.; Xie, R. A New Method for Quantitative Evaluation of Microcrack Stress Sensitivity in Tight Sandstone Reservoirs Based on Acoustic Data Inversion. Rock Soil Mech. 2017, 38, 409–418. [Google Scholar]
- Rui, H. Study on the Micro-Fracture Formation Rule During Shut-In Time in Tight Reservoir. Master’s Thesis, Northeast Petroleum University, Daqing, China, 2020. [Google Scholar]
- Ma, S.; Zhang, Y. Study on the pore structure of tight reservoir by using method of mercury injection-A case study of the Lucaogou Formation in Jimsar sag. Pet. Geol. Recovery Effic. 2017, 24, 26–33. [Google Scholar]
- Ma, S.; Niu, D.; Wen, H.; Zhang, Y.; Wang, H.; Zhang, J. Reservoir Classification and Evaluation Based on Rock Pore Structure. J. Heilongjiang Univ. Sci. Technol. 2016, 26, 414–421. [Google Scholar]
- Jiang, P.; Jia, H.; Ma, S. The Quantitative Characterization of the Multiple Fractal Features of the Pore Structure in Tight Sandstone Formation. J. Petrochem. Univ. 2018, 31, 69. [Google Scholar]
- Sun, Y.; Yu, H.; Ma, S.; Deng, M.; Xiang, Y.; Zhang, Y. Physical property of tight sandstone reservoir and its controlling factors: A case study of the fourth member of Cretaceous Quantou formation in Da’an area of Songliao basin. J. China Univ. Min. Technol. 2017, 46, 810–817. [Google Scholar]
- Wang, X.; Deng, L.; Zhang, J.; Yi, X. Characteristics of pore structure of lower Paleozoic reservoir in Fugu Area. Fault-Block Oil Gas Field 2010, 17, 49–51. [Google Scholar]
- Wang, X.; Yin, S.; Cao, M.; Xia, X.; Liu, D.; Zhang, J.; Wu, C.; Li, Q.; Wang, H.; Lu, R. Microscopic Pore of Sandstone in Longde Coal Mine Based on FHH Fractal Theory. Saf. Coal Mines 2024, 55, 179–189. [Google Scholar]
- Ying, S.; Ping, Z.; Cui, Y.; Wang, X. Carboniferous Reservoir Evaluation and Distribution Characteristics in Gaofengchang Gas Field, Eastern Sichuan Basin. Shandong Chem. Ind. 2018, 47, 184–186. [Google Scholar]
- Yin, D.; Wang, D.; Zhou, Y.; Zhang, C. Pore Structure Characteristics of Ultra-Low Permeability Reservoirs. Nat. Resour. Res. 2020, 30, 451–462. [Google Scholar] [CrossRef]
- Wang, D.; Yin, D.; Zhou, Y. Fine classification of ultra-low permeability reservoirs around the Placanticline of Daqing oilfield (PR of China). J. Pet. Sci. Eng. 2019, 174, 1042–1052. [Google Scholar]
- Liu, H.; Gai, S.; Yu, W.; Liu, H.; Zhang, C.; Zhang, L. Fracture Identification in Super-Deeply Buried Tight Sandstone Reservoirs in Yongjin Oilfield, Junggar Basin, China. Well Logging Technol. 2022, 46, 592–598. [Google Scholar]
- Sun, X. On Classification and Evaluation of Extra-low Porosity and Permeability Reservoir in Yongjin Oilfield, Dzungaria Basin. Well Logging Technol. 2012, 36, 479–484. [Google Scholar]
- Li, Q.; Li, Q.; Wang, F.; Xu, N.; Wang, Y.; Bai, B. Settling behavior and mechanism analysis of kaolinite as a fracture proppant of hydrocarbon reservoirs in CO2 fracturing fluid. Colloids Surf. A Physicochem. Eng. Asp. 2025, 724, 137463. [Google Scholar] [CrossRef]
- Qingchao, L.; Jingjuan, W.; Qiang, L.; Fuling, W.; Yuanfang, C. Sediment Instability Caused by Gas Production from Hydrate-Bearing Sediment in Northern South China Sea by Horizontal Wellbore: Sensitivity Analysis. Nat. Resour. Res. 2025, 34, 1667–1699. [Google Scholar] [CrossRef]
- Yu, C.; Qu, K.; Guo, Q.; Zhang, Y.; Shen, W.; Shao, J. Pore Fractal Structure Characteristics and Reservoir Comprehensive Evaluation of Tight Volcanic Rocks in Northern Songliao Basin. Mud. Logging Eng. 2024, 35, 113–120. [Google Scholar]
- Wang, K.; Yin, L.; Song, J.; Zhang, Q.; Pei, W.; Meng, Y.; Gao, W.; Zhang, X.; Qiu, Z. Reservoir Characteristics and Exploration Potential Evaluation of Zhaoxian Shale in Benxi Formation, Hengshan⁃Wupu Area, Ordos Basin. Nat. Gas Geosci. 2024, 35, 2196–2214. [Google Scholar]
- Xie, M.; Zhang, D.; Luo, H.; Zhai, G.; Wang, T.; Hu, J.; Ma, M.; Sun, W.; Jin, Z. Characterization of pore structure of Upper Paleozoic dense reservoir in Ordos Basin: Cases study of the Shanxi Formation and the Xiashihezi Formation in Yanchi area. Nat. Gas Geosci. 2023, 34, 1173–1186. [Google Scholar]
- Chen, S. Study on Fractal Structure and Reservoir Characteristics of Shale Pore from the Deep Wufeng Formation to Longmaxi Formation in South Sichuan. Master’s Thesis, Yangtze University, Jingzhou, China, 2023. [Google Scholar]
- Wei, K. Multi-Scale Digital Core Modeling of Typical Well Shale in QingshankouFormation in Songliao Basin. Master’s Thesis, Northeast Petroleum University, Daqing, China, 2023. [Google Scholar]
- Lin, T.; Ran, Q.; Wei, H.; Sun, X.; Wang, R. Pore-throat characteristics of tight sandstones and its influence on reservoirs in Dibei area of the Kuqa Depression. Pet. Geol. Exp. 2015, 37, 696–703. [Google Scholar]
- He, J.; Yang, Y.; Chen, W.; Xia, M.; Jia, S.; He, K.; Zhang, Y.; Liu, Y. Characteristics and main controlling factors for narrow channel tight sandstone reservoir: A case study of Shaximiao Formation in Jinhua Block of Tianfu Gas Field. Fault-Block Oil Gas Field 2024, 31, 1–10. [Google Scholar]

Disclaimer/Publisher’s Note: The statements, opinions and data contained in all publications are solely those of the individual author(s) and contributor(s) and not of MDPI and/or the editor(s). MDPI and/or the editor(s) disclaim responsibility for any injury to people or property resulting from any ideas, methods, instructions or products referred to in the content. |
© 2025 by the authors. Licensee MDPI, Basel, Switzerland. This article is an open access article distributed under the terms and conditions of the Creative Commons Attribution (CC BY) license (https://creativecommons.org/licenses/by/4.0/).