Article

A Fracture Extraction Method for Full-Diameter Core CT Images Based on Semantic Segmentation

1
Research Institute of Petroleum Exploration & Development, PetroChina, Beijing 100083, China
2
Artificial Intelligence Technology R&D Center for Exploration and Development, CNPC, Beijing 100083, China
3
State Key Laboratory of Petroleum Resources and Engineering, China University of Petroleum (Beijing), Beijing 102249, China
4
College of Petroleum Engineering, China University of Petroleum (Beijing), Beijing 102249, China
5
National Key Laboratory of Continental Shale Oil, Daqing 163000, China
6
Department of Automation, Tsinghua University, Beijing 100084, China
*
Author to whom correspondence should be addressed.
Processes 2025, 13(7), 2221; https://doi.org/10.3390/pr13072221
Submission received: 9 May 2025 / Revised: 1 July 2025 / Accepted: 9 July 2025 / Published: 11 July 2025
(This article belongs to the Topic Exploitation and Underground Storage of Oil and Gas)

Abstract

Fractures play a critical role in the storage and migration of hydrocarbons within subsurface reservoirs, and their characteristics can be effectively studied through core sample analysis. This study proposes an automated fracture extraction method for full-diameter core Computed Tomography (CT) images based on a deep learning framework. A semantic segmentation network called SCTNet is employed to perform high-precision semantic segmentation, while a sliding window strategy is introduced to address the challenges associated with large-scale image processing during training and inference. The proposed method achieves a mean Intersection over Union (mIoU) of 72.14% and a pixel-level segmentation accuracy of 97% on the test dataset, outperforming traditional thresholding techniques and several state-of-the-art deep learning models. Besides fracture detection, the method enables quantitative characterization of fracture-related parameters, including fracture proportion, dip angle, strike, and aperture. Experimental results indicate that the proposed approach provides a reliable and efficient solution for the interpretation of large-volume CT data. Compared to manual evaluation, the method significantly accelerates the analysis process—reducing time from hours to minutes—and demonstrates strong potential to enhance intelligent workflows for geological core fracture analysis.

1. Introduction

Fractures play a critical role in oil and gas reservoirs by controlling the accumulation, migration, and production of hydrocarbons. Accurately understanding their spatial distribution and structural attributes is essential for evaluating reservoir quality, estimating reserves, and designing effective development strategies [1]. As such, fracture characterization is a key factor in improving the efficiency and economic outcomes of oil and gas exploration.
Computed Tomography (CT) offers a non-destructive and rapid imaging approach for subsurface samples and can produce high-resolution images. Due to its significant advantages, CT technology has been widely and effectively applied in exploration and development. Full-diameter CT imaging allows for the macroscopic and rapid identification of fractures and enables the assessment of formation permeability. However, full-diameter CT images may contain not only fractures but also other structural features such as faults. Faults may result from large-scale tectonic movements or core extraction processes, whereas fractures are intrinsic features of the rock or formation itself [2]. As fine and densely distributed pathways, fractures significantly enhance the effective permeability of rocks, making them crucial for the design of development plans and for enhancing recovery factor [3].
Traditional CT image analysis methods mainly rely on manual interpretation or shallow visual feature-based computer segmentation. Manual interpretation is inefficient and lacks reproducibility, while computer methods based on shallow features often fail to effectively distinguish between faults and fractures, with fractures being easily overlooked.
To address this issue, this study proposes a full-diameter CT fracture recognition method for oil and gas reservoirs based on a semantic segmentation network. This method retains the efficiency of a lightweight single-branch convolutional neural network (CNN) while incorporating rich semantic representations through a semantic branch. By integrating a transformer-based self-attention mechanism, the neural network can focus attention on fractures, thereby enhancing its ability to distinguish fractures from faults.
Leveraging the inherent capability of deep learning to automatically extract image features, the model learns from expert-annotated data and thereby indirectly acquires the ability to recognize naturally occurring fractures in a data-driven manner. Furthermore, a large-scale image analysis approach based on a sliding window strategy is developed to quantify fracture metrics, enabling rapid assessment of fracture development and thus improving exploration and development efficiency.
In this study, to enhance the scientific rigor and consistency of fracture identification, we established explicit criteria for classifying fracture types. Fractures were defined based on their geometric characteristics and structural attributes. Specifically, any fracture exhibiting clear evidence of shear deformation in the image—regardless of whether measurable displacement is present—was classified as a fault during manual annotation. This approach aligns with the broadly accepted definition in structural geology, wherein a fault is considered a brittle fracture accommodating shear displacement, not necessarily requiring observable offset.
Furthermore, considering the resolution and field of view of the full-diameter CT images, a practical classification threshold based on fracture scale was adopted. Fractures with lengths less than 1 cm, narrow apertures, dense distribution, and spatially stable orientation were categorized as fractures, while those exceeding this threshold—characterized by larger dimensions, irregular morphologies, and potentially penetrating the entire core—were classified as faults.
By applying these classification standards, this study ensured a reliable distinction between different fracture types during both manual labeling and model training, thereby improving the structural consistency of fracture recognition and the accuracy of subsequent geological interpretation.

2. Related Studies

2.1. Application of Semantic Segmentation Techniques in Core CT Image Analysis

Since the introduction of CT technology in petroleum exploration and development, researchers both domestically and internationally have actively investigated methods for analyzing rock CT images. These efforts have primarily focused on two areas: pore structure analysis and image reconstruction, both of which have yielded substantial progress. The fracture characterization discussed in this study falls within the domain of pore structure analysis.
Traditional CT image analysis methods for pore detection are typically based on segmentation using shallow visual features. Numerous studies, both in China and abroad, have employed binary grayscale techniques for pore and pore-throat segmentation. For instance, Hou et al. [4] proposed a dual-threshold pore segmentation method based on Kriging interpolation, which helped reduce edge artifacts in segmentation results. However, binary segmentation methods are often sensitive to impurities within the rock and image noise, resulting in limited segmentation accuracy.
Commercial software such as Avizo2024 offers fracture identification tools, but these methods are largely based on traditional thresholding techniques, which struggle to effectively differentiate between natural fractures and faults, or between background noise and true fractures. The fundamental limitation of these methods arises from their inability to incorporate comprehensive semantic information from the image.
With advancements in computer science, deep learning techniques have emerged as robust tools capable of capturing rich semantic information from images. These methods have also been applied in CT image analysis, enabling more precise extraction of information from core samples.
In the application of deep learning methods to pore analysis, Convolutional Neural Networks (CNNs) remain one of the most widely employed methodologies. Wang et al. [5] proposed a CNN-based segmentation algorithm that integrates attention mechanisms to enhance feature extraction capabilities, thereby improving edge segmentation performance. Additional research has explored the combination of clustering algorithms with neural networks to achieve more effective pore segmentation.
Chawshin et al. [6] devised CNN models trained on 2D core CT scan images to facilitate automatic lithology prediction. Their methodology optimized rock type classification and demonstrated improved generalization capabilities, thereby providing an additional method and complementary information for lithological descriptions. Focusing on pore detection in sandstone CT images, Li et al. [7] enhanced the traditional Mask R-CNN (Mask Region-based CNN) framework through architectural improvements, effectively reducing the rates of missed and redundant detections in pore identification tasks. Pham et al. [8] proposed a two-stage segmentation method that combines Mask R-CNN and U-Net (a convolutional network for biomedical image segmentation), which demonstrated excellent performance in characterizing fractures in micro- and nano-CT images.
Meanwhile, the field of computer vision has witnessed rapid advancements in semantic segmentation. The Fully Convolutional Network (FCN) [9] pioneered the use of convolutional neural networks for semantic segmentation. U-Net [10] further advanced this area by introducing skip connections to fuse multi-scale features, establishing a widely adopted architecture in biomedical image segmentation.
Following these foundational models, a variety of semantic segmentation networks have emerged, each contributing significant improvements in segmentation performance. For example, the Segmentation Transformer (SETR) was the first representative model to apply the Vision Transformer (ViT) framework [11] to semantic segmentation tasks. The proposal of SegFormer [12] improved the model’s ability to simultaneously capture coarse features at high resolution and fine details at low resolution, while also enhancing inference efficiency. More recently, Fudan University and Tencent introduced SeaFormer [13], a lightweight semantic segmentation model based on ViT, which achieves efficient segmentation under resource-constrained environments.
Despite these advancements, research on full-diameter CT images still predominantly relies on traditional thresholding methods, resulting in suboptimal segmentation accuracy. There is a pressing need to explore deep learning-based methods for characterizing fractures in full-diameter CT scans. Experimental comparisons in this study demonstrate that deep learning-based fracture segmentation methods outperform traditional binarization techniques in both accuracy and speed and are less susceptible to interference from noise and other artifacts.

2.2. Challenges in Fracture Identification and Existing Solutions

In the industrial sector, the most prevalent method for fracture identification is threshold-based segmentation. This approach is simple and computationally efficient; however, it suffers from two major limitations. First, thresholding segmentation is generally incapable of distinguishing between fractures formed naturally within the rock and faults caused by mechanical damage during core sampling and transportation. The latter often has limited significance for exploration and reservoir evaluation. Second, threshold-based methods tend to incompletely extract fractures, particularly when the fractures are subtle or faint. The root cause of these issues lies in the inherent limitations of traditional image processing algorithms, which rely solely on pixel-level intensity features. These methods cannot capture and utilize the broader semantic context of the image. When the pixel-level features of the fractures are not significantly different from the surrounding background noise, such algorithms often fail to make accurate distinctions.
Figure 1 illustrates several typical issues associated with threshold-based extraction. Figure 1a shows an example where the contrast between fracture and background is too low, resulting in incomplete fracture extraction; Figure 1b demonstrates relatively comprehensive fracture extraction, but the method fails to distinguish fractures from background noise; Figure 1c highlights a case where the yellow-marked region is a mechanical break rather than a natural fracture, yet the threshold-based method erroneously identifies it as a fracture.
Full-diameter CT images often suffer from substantial background noise and relatively low image clarity, which pose significant challenges for accurate fracture characterization. Although recent advances in deep learning have achieved promising results in pore structure analysis of core images, their application to fracture segmentation still faces several obstacles, including limited data availability and the inherent geological diversity of core samples.
This study focuses on the segmentation of fractures in full-diameter CT images. By leveraging deep learning models capable of capturing comprehensive semantic information, the proposed method aims to address key challenges such as the minimal pixel intensity contrast between fractures and background, the presence of extensive image noise, and the interference of mechanically induced breaks that may be misidentified as natural fractures.

3. Framework and Methodology

3.1. Technical Overview

From the perspective of fracture characterization problem classification, fracture identification in full-diameter CT images can theoretically be approached using object detection methods. However, object detection [14] primarily identifies the general regions where fractures are located, providing only approximate bounding boxes instead of precise structural details. Additionally, for the analysis of fractures, it is not necessary to distinguish between individual adjacent fractures. Therefore, fracture characterization is more appropriately framed as a semantic segmentation task [15].
Semantic segmentation enables the precise delineation of fracture boundaries, resulting in it being suitable for subsequent quantitative analysis. As a fundamental problem in computer vision, semantic segmentation aims to assign a class label to each pixel in an image based on its semantic category. The output is typically a mask that retains the same spatial dimensions as the input image, where each pixel in the mask encodes the classification result of the corresponding pixel in the original image. Pixels that belong to the same object share an identical value in the mask.
For example, in Figure 2, the left panel shows the original image, while the right panel presents the corresponding segmentation mask. In the mask, black pixels denote the background, red pixels represent humans, and green pixels represent bicycles.
Building upon the semantic segmentation architecture SCTNet [17], this study proposes a fracture characterization model specifically designed for full-diameter CT images. The implementation process comprises several key stages: first, the construction of a dedicated dataset of full-diameter CT images for training purposes; second, the development of a fracture segmentation model based on the SCTNet architecture.
Subsequently, appropriate hyperparameters are selected for model training, with iterative adjustments made throughout the training process to optimize performance. Once a satisfactory segmentation result is achieved, computational methods are employed to automatically calculate fracture parameters, enabling quantitative characterization of fractures within the CT images.

3.2. Intelligent Fracture Characterization Model Based on SCTNet

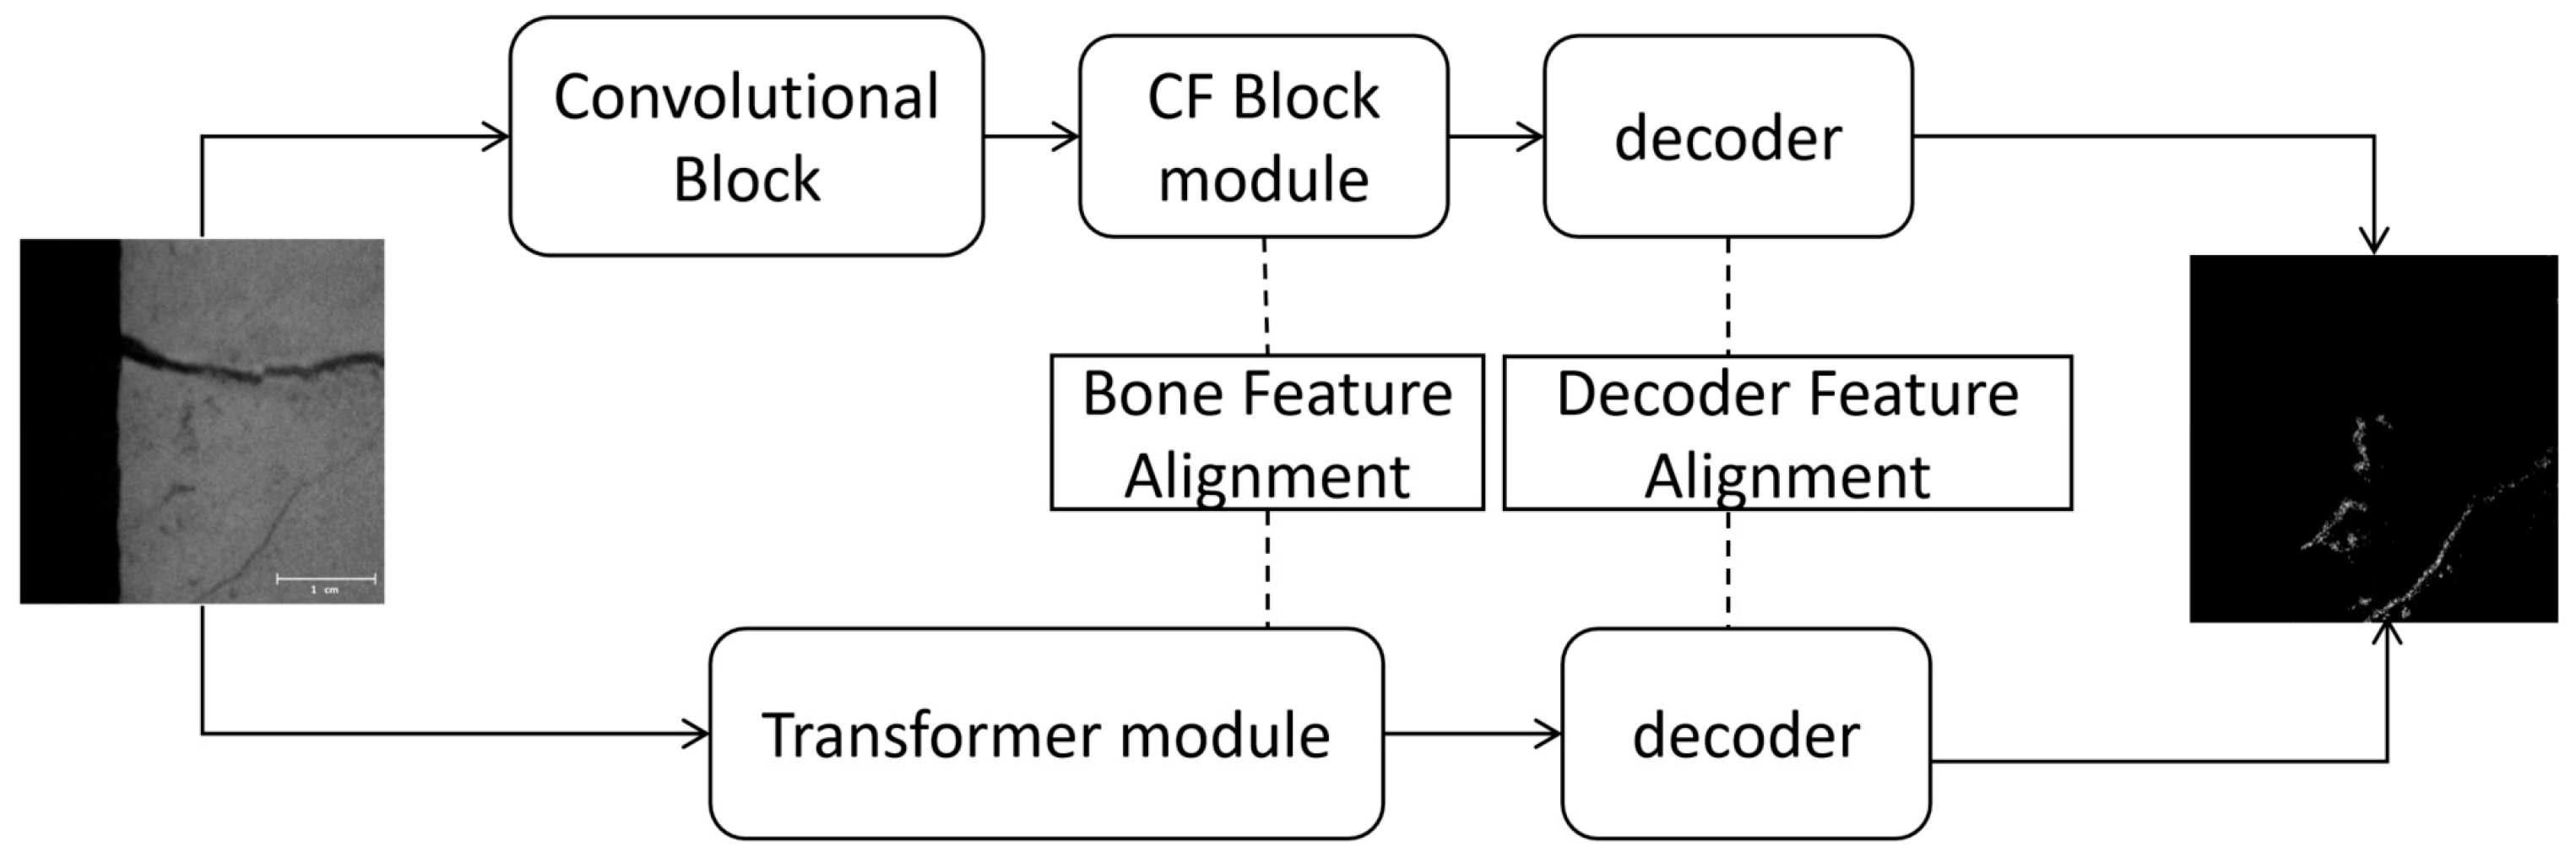
3.2.1. Model Architecture

After comparing several semantic segmentation models, this study adopts an improved version of SCTNet for fracture characterization. Comparative experiments demonstrate that SCTNet outperforms both Fully Convolutional Networks (FCNs) and SegFormer in this specific application scenario. Originally proposed by Xu et al. in 2024, SCTNet [17] retains the efficiency of a lightweight single-branch Convolutional Neural Network (CNN) while incorporating a semantic branch that provides rich semantic representation.
In the context of full-diameter CT imaging, the model effectively balances two critical aspects: global contextual information extraction and high inference efficiency. The CNN inference branch ensures computational speed suitable for industrial applications, while the Transformer-based semantic branch enhances segmentation accuracy.
Notably, full-diameter CT images often exhibit extreme aspect ratios (i.e., significant disparities between width and height), which do not conform to the fixed-size input requirements of deep learning networks. To address this, a sliding window-based large-scale image analysis method is proposed, enabling the model to process long images without distortion or loss of detail.
In addition, performance is further improved through data augmentation techniques and loss function optimization. Experimental results show that the improved SCTNet achieves state-of-the-art performance across multiple semantic segmentation datasets. The architecture of the deep learning model used in this study, based on the theoretical foundation of SCTNet, is illustrated in Figure 3.
To enrich semantic information while minimizing computational cost, the proposed model adopts a single convolutional branch for inference and a Transformer branch used exclusively during training. In full-diameter CT images, fractures often exhibit low contrast and sparse distribution, making them susceptible to omission or misclassification by traditional methods that rely heavily on local information. In contrast, the Transformer [18] employs a self-attention mechanism to perform global contextual modeling for each pixel, enabling more accurate localization and recognition of subtle fractures.
The backbone of the model adopts a hierarchical convolutional neural network architecture. It begins with two consecutive 3 × 3 convolutional blocks, followed by two additional stages composed of ConvFormer Blocks (CF Blocks)—transformer-like modules—and downsampling layers that consist of batch normalization and ReLU (Rectified Linear Unit) activation functions.
The decoder incorporates a Deep Aggregation Pyramid Pooling Module (DAPPM) [19] and a segmentation head, which includes a 3 × 3 convolutional layer followed by batch normalization, a ReLU activation function, and a final 1 × 1 convolutional classifier layer.
The specific computational mechanisms and functional roles of each module will be detailed in the subsequent subsections.

3.2.2. ConvFormer (CF) Block Module

In this model, the CF Block is designed to introduce global contextual modeling capabilities into the CNN branch. This module captures long-range dependencies and facilitates the extraction of high-quality semantic features by the convolutional neural network. Without the CF Block, directly aligning the features extracted by the CNN and Transformer branches without intermediate processing can complicate the learning process. It increases the likelihood of interference from redundant information and leads to limited performance improvement.
To address this issue, the CF Block is specifically designed to emulate the structural characteristics of a Transformer block. The operations within the CF Block can be described by Equation (1), as presented below:
f = N o r m x + C o n v A t t e n t i o n x y = N o r m f + F F N f
In this context, Norm denotes batch normalization. Here, x represents the input feature, f depicts the hidden feature, and y is the output feature of the CF Block.
An efficient convolutional operation is introduced to implement the attention mechanism, inspired by the GPU-Friendly Attention (GFA) proposed in RTFormer [20]. Unlike GFA, which relies on computationally intensive matrix multiplications, the CF Block replaces these operations with per-pixel convolution, making it more suitable for real-time applications and GPU acceleration.
Moreover, due to the inherent semantic gap between convolutional neural networks and Transformer architectures, simply computing the similarity between learnable vectors and individual pixels—followed by pixel-wise feature enhancement—is insufficient to capture the rich contextual dependencies present in CT images.
To better preserve spatial locality, the model expands the learnable vector into a convolutional kernel, enabling similarity computation between this kernel and localized image patches. This convolutional attention mechanism can be formally described in Equation (2), as follows.
X = θ X K K T
Here, X , K , K T denote the input feature map, the learnable query, and the key, respectively. The operator represents the convolution operation. The symbol θ denotes an activation function applied over the height–width dimensions of the feature map, where Softmax is used to generate attention weights. To prevent overfitting, L2 normalization is applied along the dimension of the learnable parameters.
However, extending the attention mechanism from vector-based similarity to convolutional kernel–based computation introduces increased computational cost. To balance information richness and efficiency, the model replaces standard convolutions with striped convolutions—a more lightweight operation that reduces computation by focusing on specific spatial directions. In addition, 1*k and k*1 convolution layers use sum convolution instead of traditional k*k convolution layers.

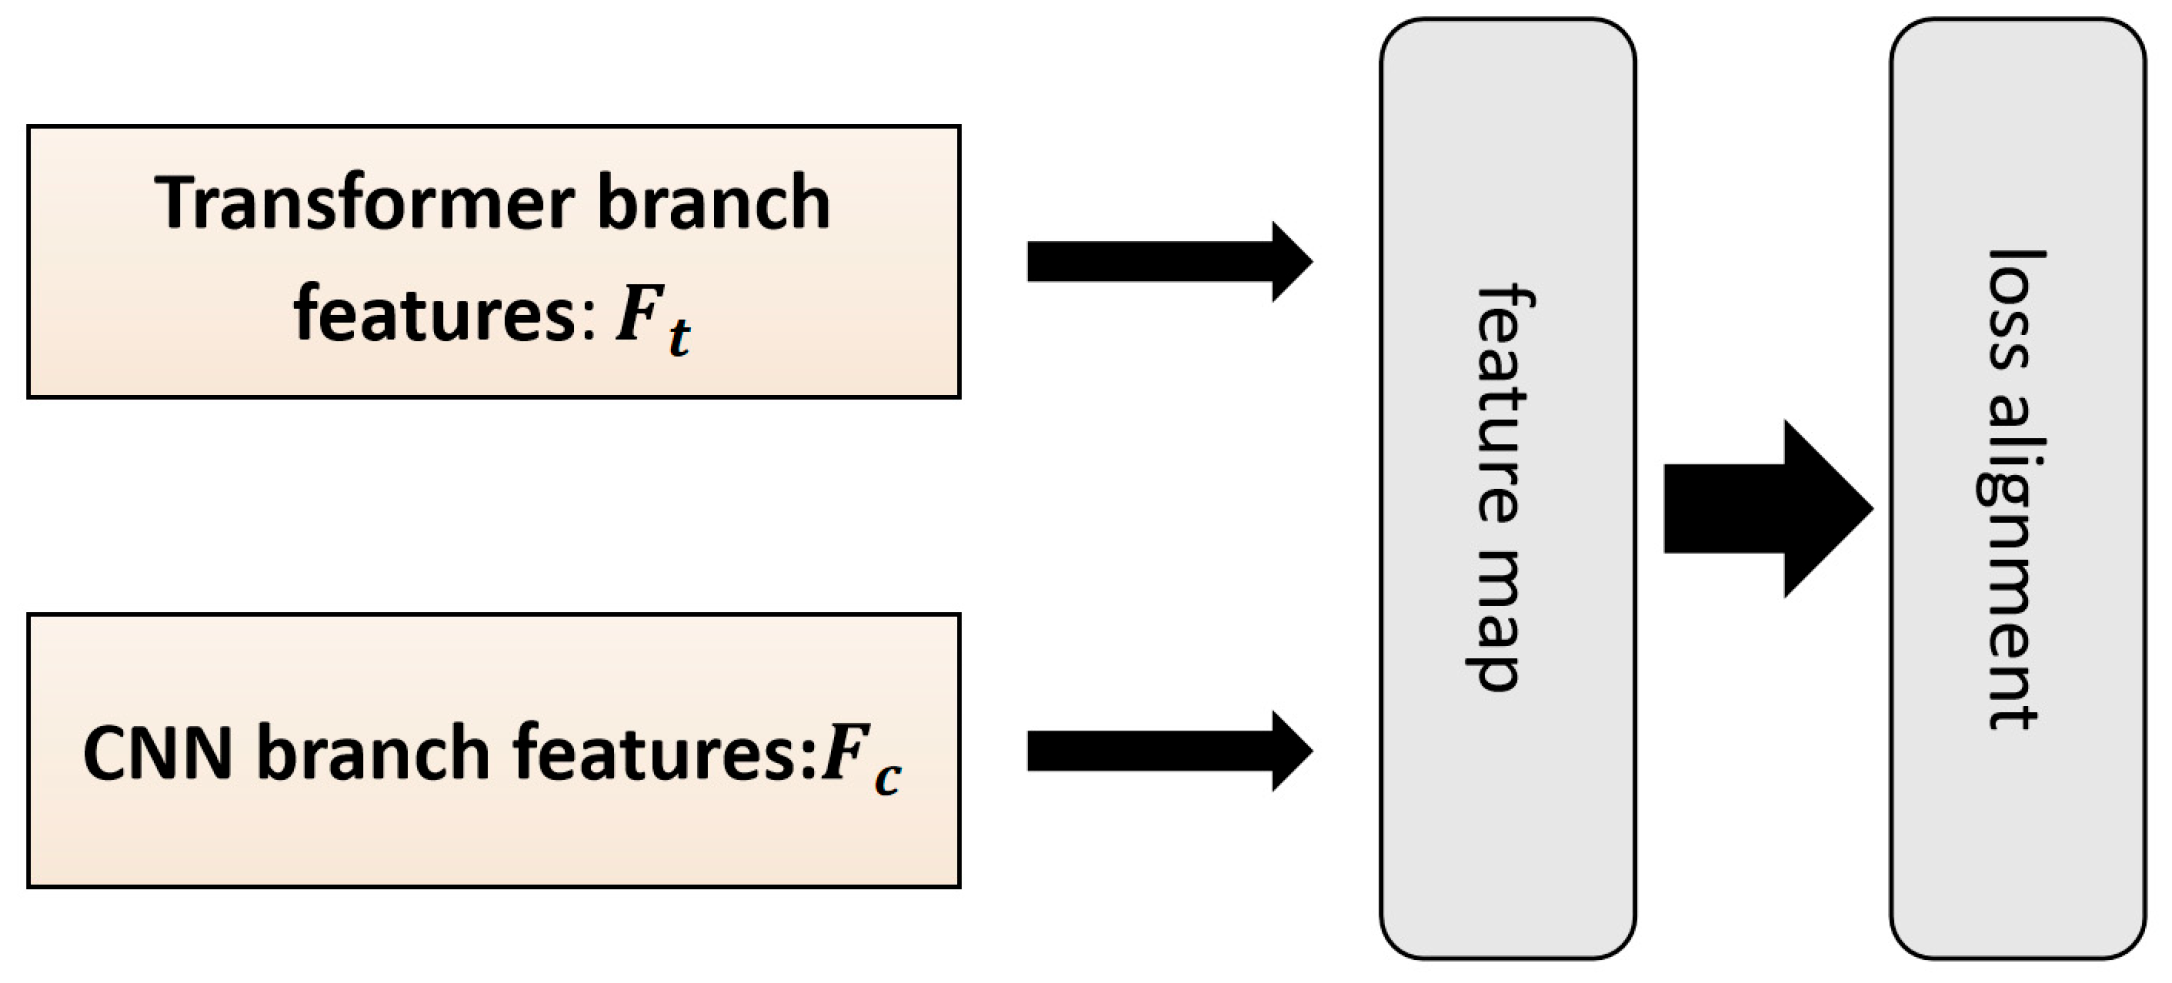
3.2.3. Alignment Module

The primary purpose of the alignment module is to transfer the semantic information learned by the Transformer branch during training to the CNN branch, thereby enhancing the semantic representation capability of the CNN. During inference, only the CNN branch is utilized, ensuring high efficiency without introducing additional computational overhead while still benefiting from the enriched semantic features learned during training.
The alignment module consists of two components, as illustrated in the model architecture diagram: Backbone Feature Alignment (BFA) and Shared Decoder Head Alignment (SDHA). The Backbone Feature Alignment (BFA) process is illustrated in Figure 4. In this component, the inputs are the intermediate feature maps from the Transformer and CNN branches. A lightweight convolutional layer is applied to project the Transformer features into the same feature space as the CNN branch, producing aligned features denoted as F t . The alignment loss is then computed using the L2 norm, as defined in Equation (3), to minimize the distance between F t and the CNN features F c . The alignment loss is calculated as the squared L2 norm, encouraging the two branches to learn similar semantic representations.
The simplicity of this alignment process is made possible by the CF Block introduced in Section 3.2.2, which has already enhanced the global contextual modeling capacity of the CNN branch. As a result, no complex transformation functions are needed within the alignment module, making it lightweight and efficient.
L B F A = F t F C 2 2
The process of Shared Decoder Head Alignment (SDHA) is similar to that of Backbone Feature Alignment (BFA). In this component, both the outputs from the Transformer branch and the CNN branch are first mapped into the same feature space through convolutional operations. After the mapping, the L2 norm is again used to compute the alignment loss between the two branches. Through this module, the semantic information from the Transformer branch is further aligned and transferred to the CNN branch. The overall alignment loss is calculated as the sum of the losses from both the Backbone Feature Alignment and Shared Decoder Head Alignment modules.

3.2.4. Loss Function and Evaluation Metrics Selection

Considering that fractures occupy a very small proportion of the target images, while the background area is relatively large, Focal Loss [21] is selected as the loss function for this study. Focal Loss addresses the issue of sample imbalance by focusing training on hard-to-classify examples.
Typically, sample imbalance causes classes with fewer samples—such as fractures in this scenario—to be more difficult to classify, potentially degrading the overall model performance. By applying Focal Loss, the training process emphasizes these minority classes, which helps to improve the model’s ability to learn fracture features and enhances overall performance.
The mathematical formulation of the Focal Loss is given in Equation (4), as follows.
L f l = 1 p ^ γ log p ^ p ^ γ log 1 p ^         i f   y = 1       i f   y = 0
In some cases, an additional weighting factor α is introduced at the beginning of the Focal Loss formulation to adjust the relative importance of different classes. Meanwhile, γ serves as a modulating factor to balance the influence of easy and hard examples. In this experiment, γ is initially set to 3.0. Within this loss function, for majority class samples, the term 1 p ^ γ approaches zero, thereby reducing their contribution to the overall loss. Conversely, for minority class samples, the contribution remains significant. As a result, Focal Loss effectively down-weights the loss assigned to abundant classes and increases the gradient contributions from rare classes, which is critical for improving fracture detection performance in highly imbalanced datasets.
For the optimizer, this study adopts AdamW [22], an improved variant of the traditional Adam optimizer [23].
The key difference between AdamW and Adam lies in how weight decay is applied. The specific update rules for both optimizers are provided below: Equation (5) represents the update rule for Adam, while Equation (6) corresponds to AdamW. Here, g t denotes the gradient at time step, θ t 1 denotes the model weights from the previous time step, λ is the regularization coefficient, and γ is the learning rate.
It can be observed that AdamW applies weight decay directly to the model weights rather than through the gradient, as in Adam. This decoupled approach results in faster convergence and often leads to better generalization performance.
g t = g t + λ θ t 1
θ t = θ t 1 γ λ θ t 1
Because fractures occupy a much smaller proportion of the dataset compared to the background regions, relying solely on Pixel Accuracy (PA) is insufficient to accurately assess the model’s performance. Therefore, this study adopts Mean Intersection over Union (MIoU) and Accuracy for Fracture Segmentation as the primary evaluation metrics [24].
The Intersection over Union (IoU) metric measures the ratio between the intersection and union of the predicted region and the ground truth region. Meanwhile, Accuracy is defined as the proportion of correctly predicted pixels over the total number of predictions.

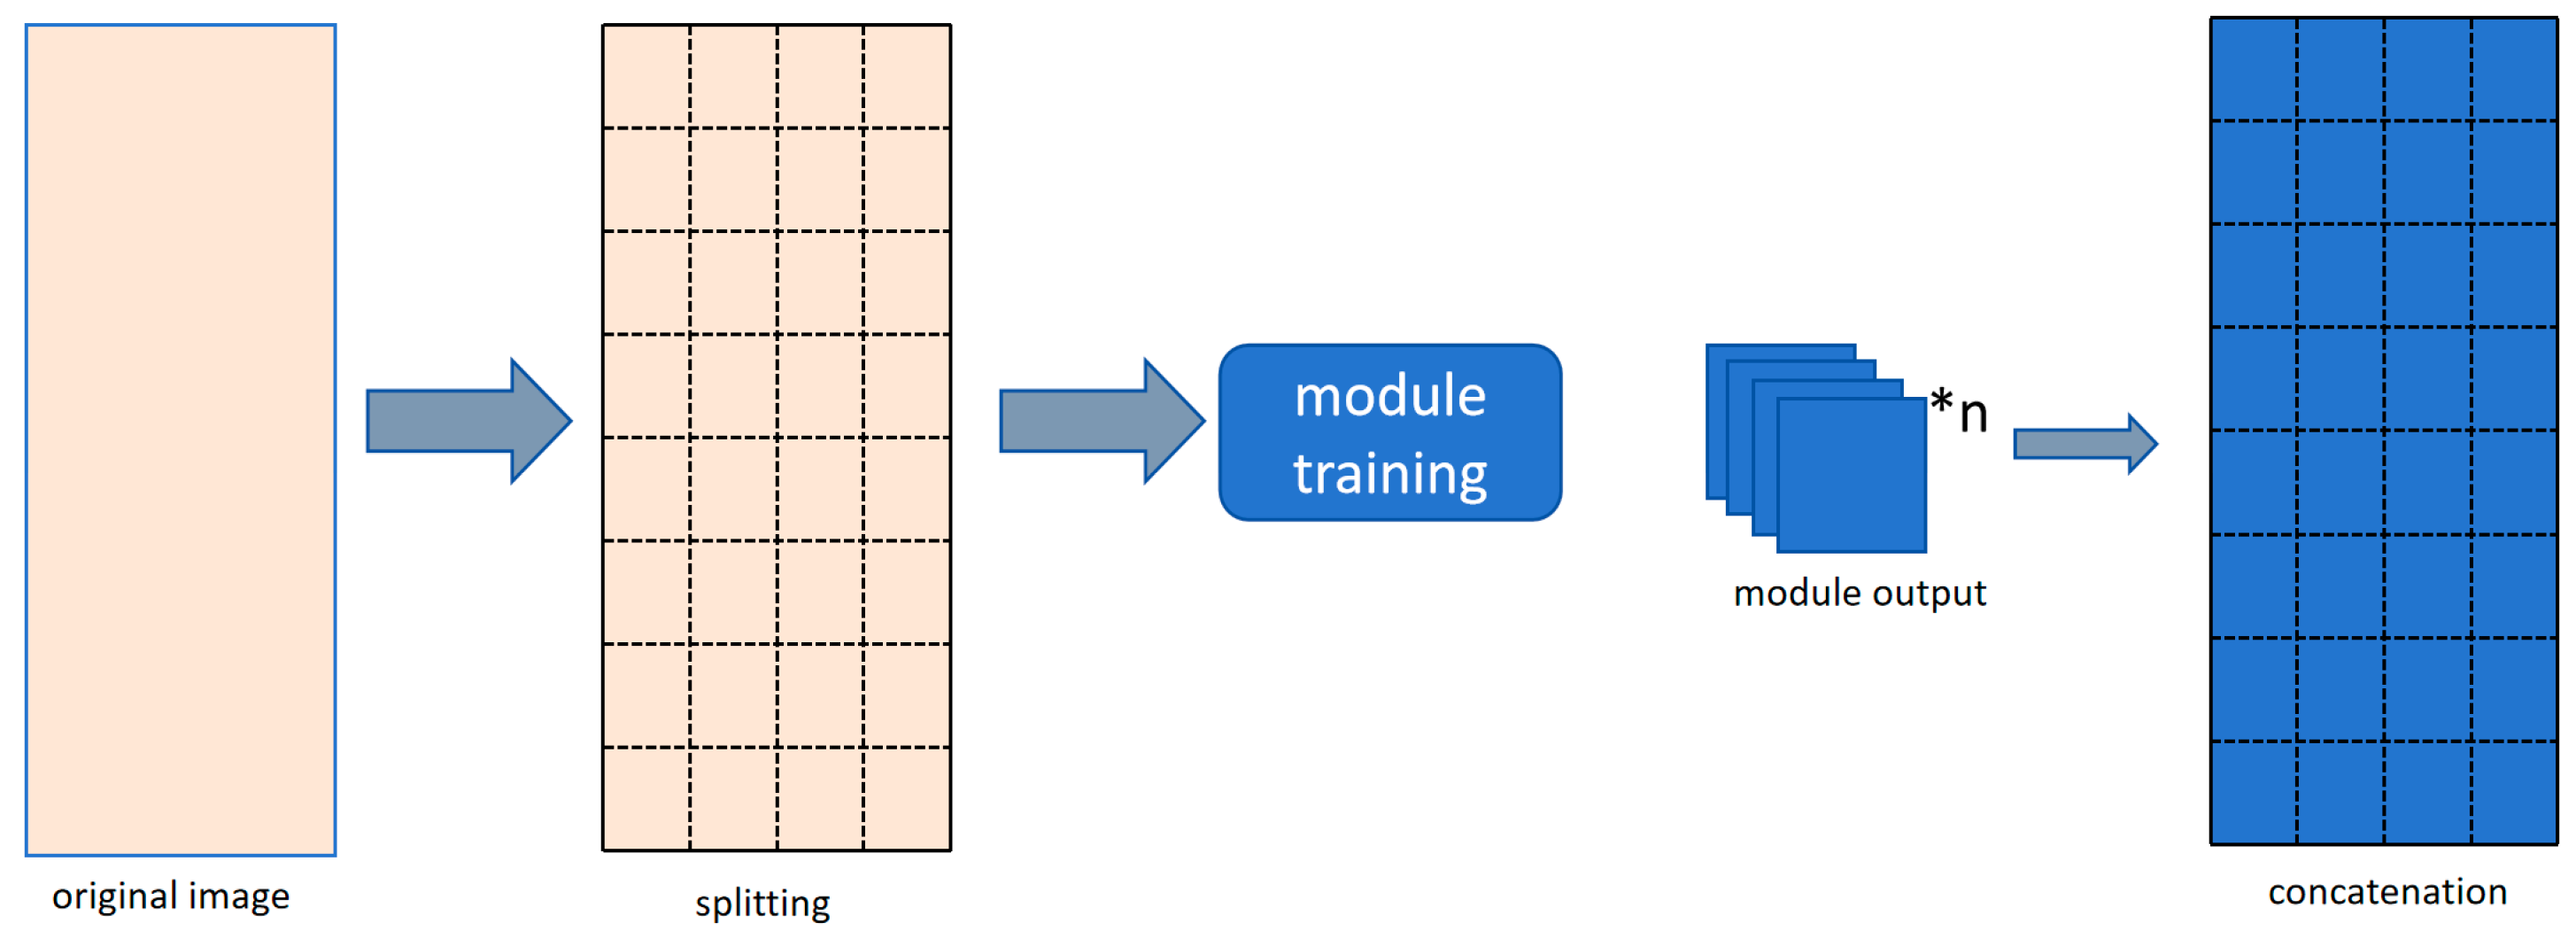
3.3. Sliding Window-Based Method for Large-Scale CT Image Processing

The characteristics of full-diameter CT scanning inherently produce large-scale images, with the number of vertical pixels typically exceeding 14,000. While large-scale images facilitate macroscopic observation of core structures, they also pose significant challenges when used as direct inputs for segmentation models.
The first challenge arises from the limited computational resources available in laboratory or field environments, which makes it impractical to feed large-scale images directly into deep learning models for training. Although resizing such images to a fixed input size can ensure faster training and reduce hardware requirements, this approach introduces notable drawbacks.
There are generally two resizing strategies: One approach is directly scaling the image to the target size. The other is preserving the original aspect ratio followed by zero-padding to meet size requirements, as illustrated in Figure 5.
Both strategies inevitably lead to information loss, either by distorting the image content or by introducing meaningless padding, ultimately degrading model performance during training. To address this, we adopt a cropping-based approach, where the original large-scale images are divided into smaller patches before being fed into the model.
At the same time, full-diameter CT images offer significant advantages for macroscopic observation of geological formations. Large-scale full-diameter CT scans enable detailed visualization of fracture development, fracture orientation, and fracture dip, providing a critical foundation for the design of field development plans. However, these advantages are largely lost when images are cropped into small patches, as localized views cannot fully capture the overall structural context.
To address this, this study proposes a large-scale image analysis method based on a sliding window strategy, as illustrated in Figure 6. In this approach, the large-scale full-diameter CT images are divided into non-overlapping local patches, which are then fed into the model for training and inference. Finally, the patch-wise outputs are stitched together to reconstruct the full-field segmentation result. This method not only facilitates model training but also preserves the macroscopic observational benefits of large-scale CT images, enabling the extraction and statistical analysis of geological-scale fracture information.

3.4. Fracture Annotation and Dataset Preparation

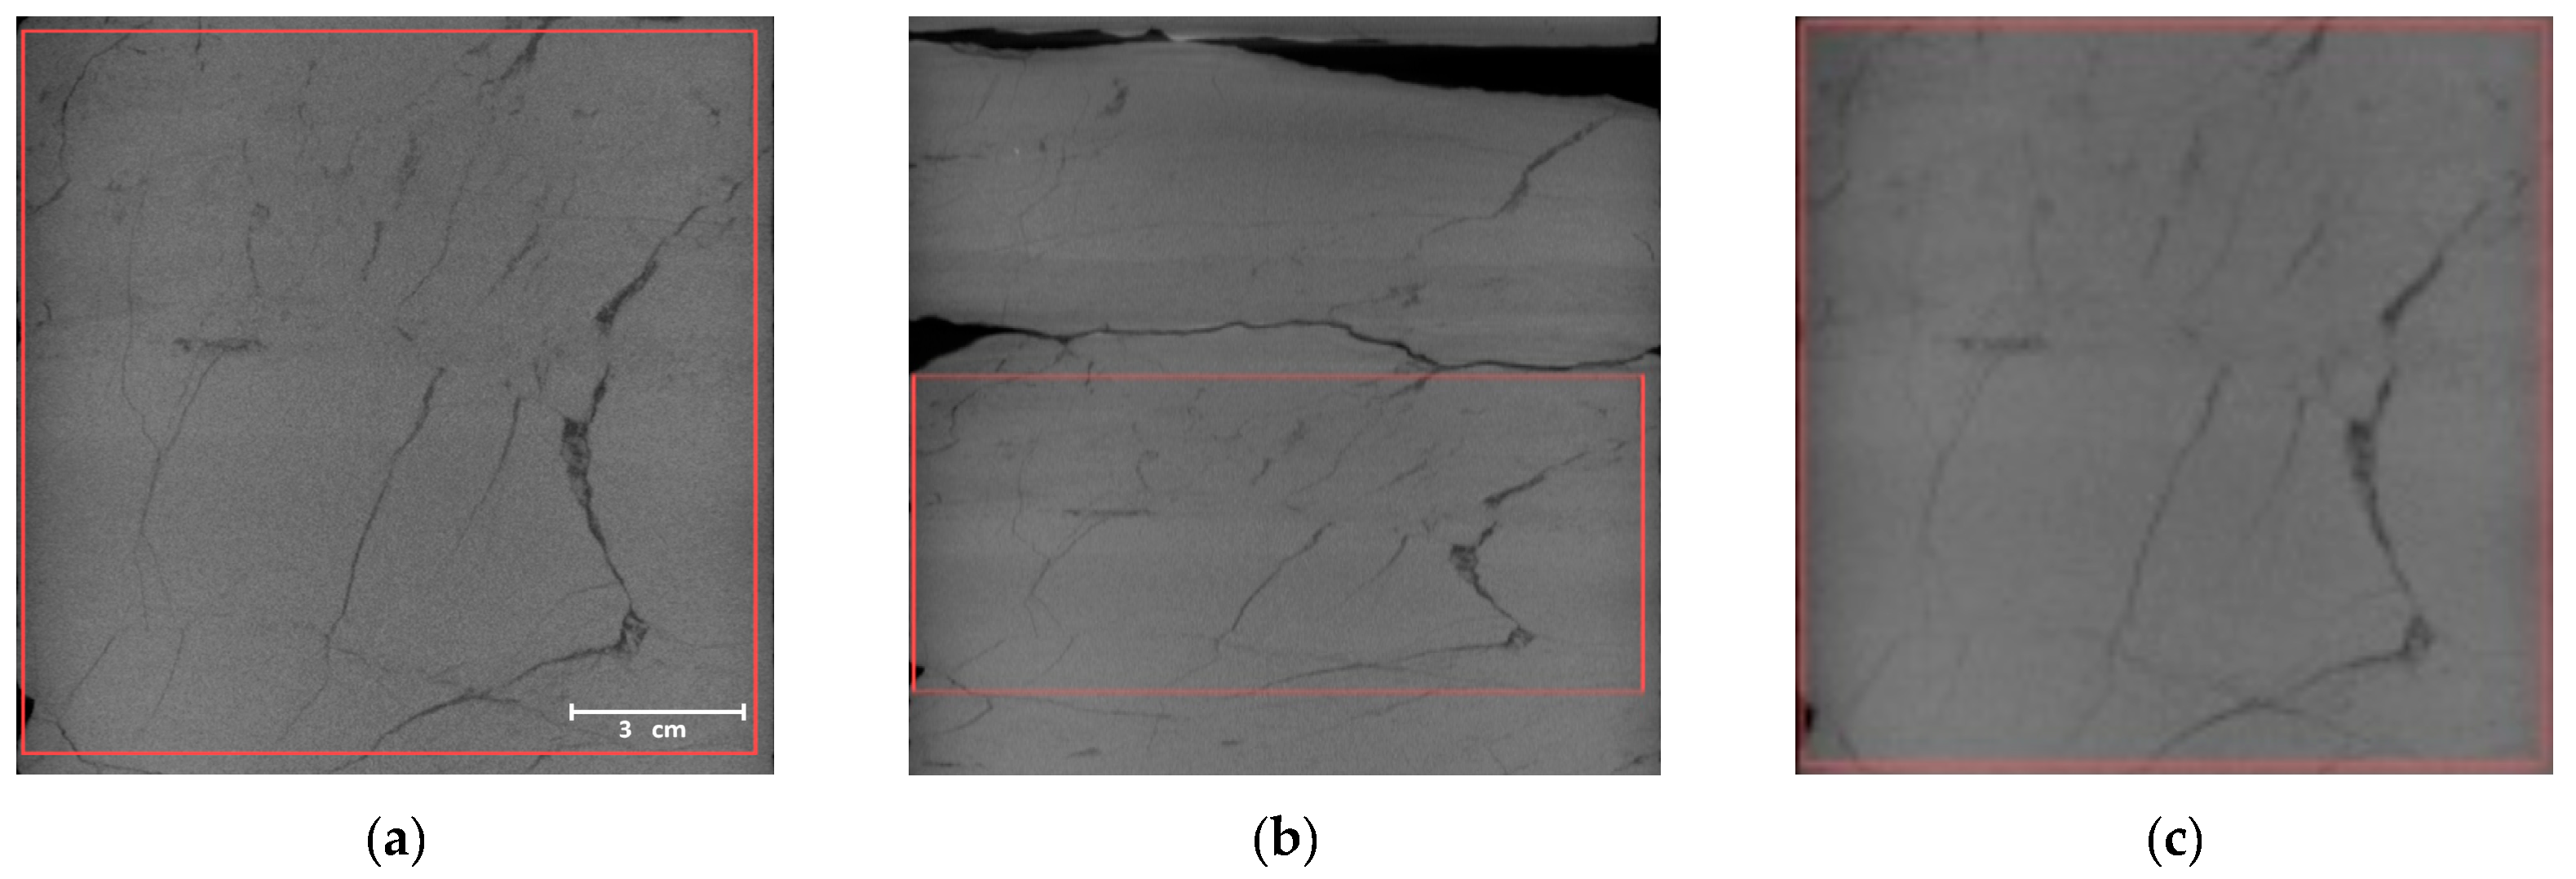
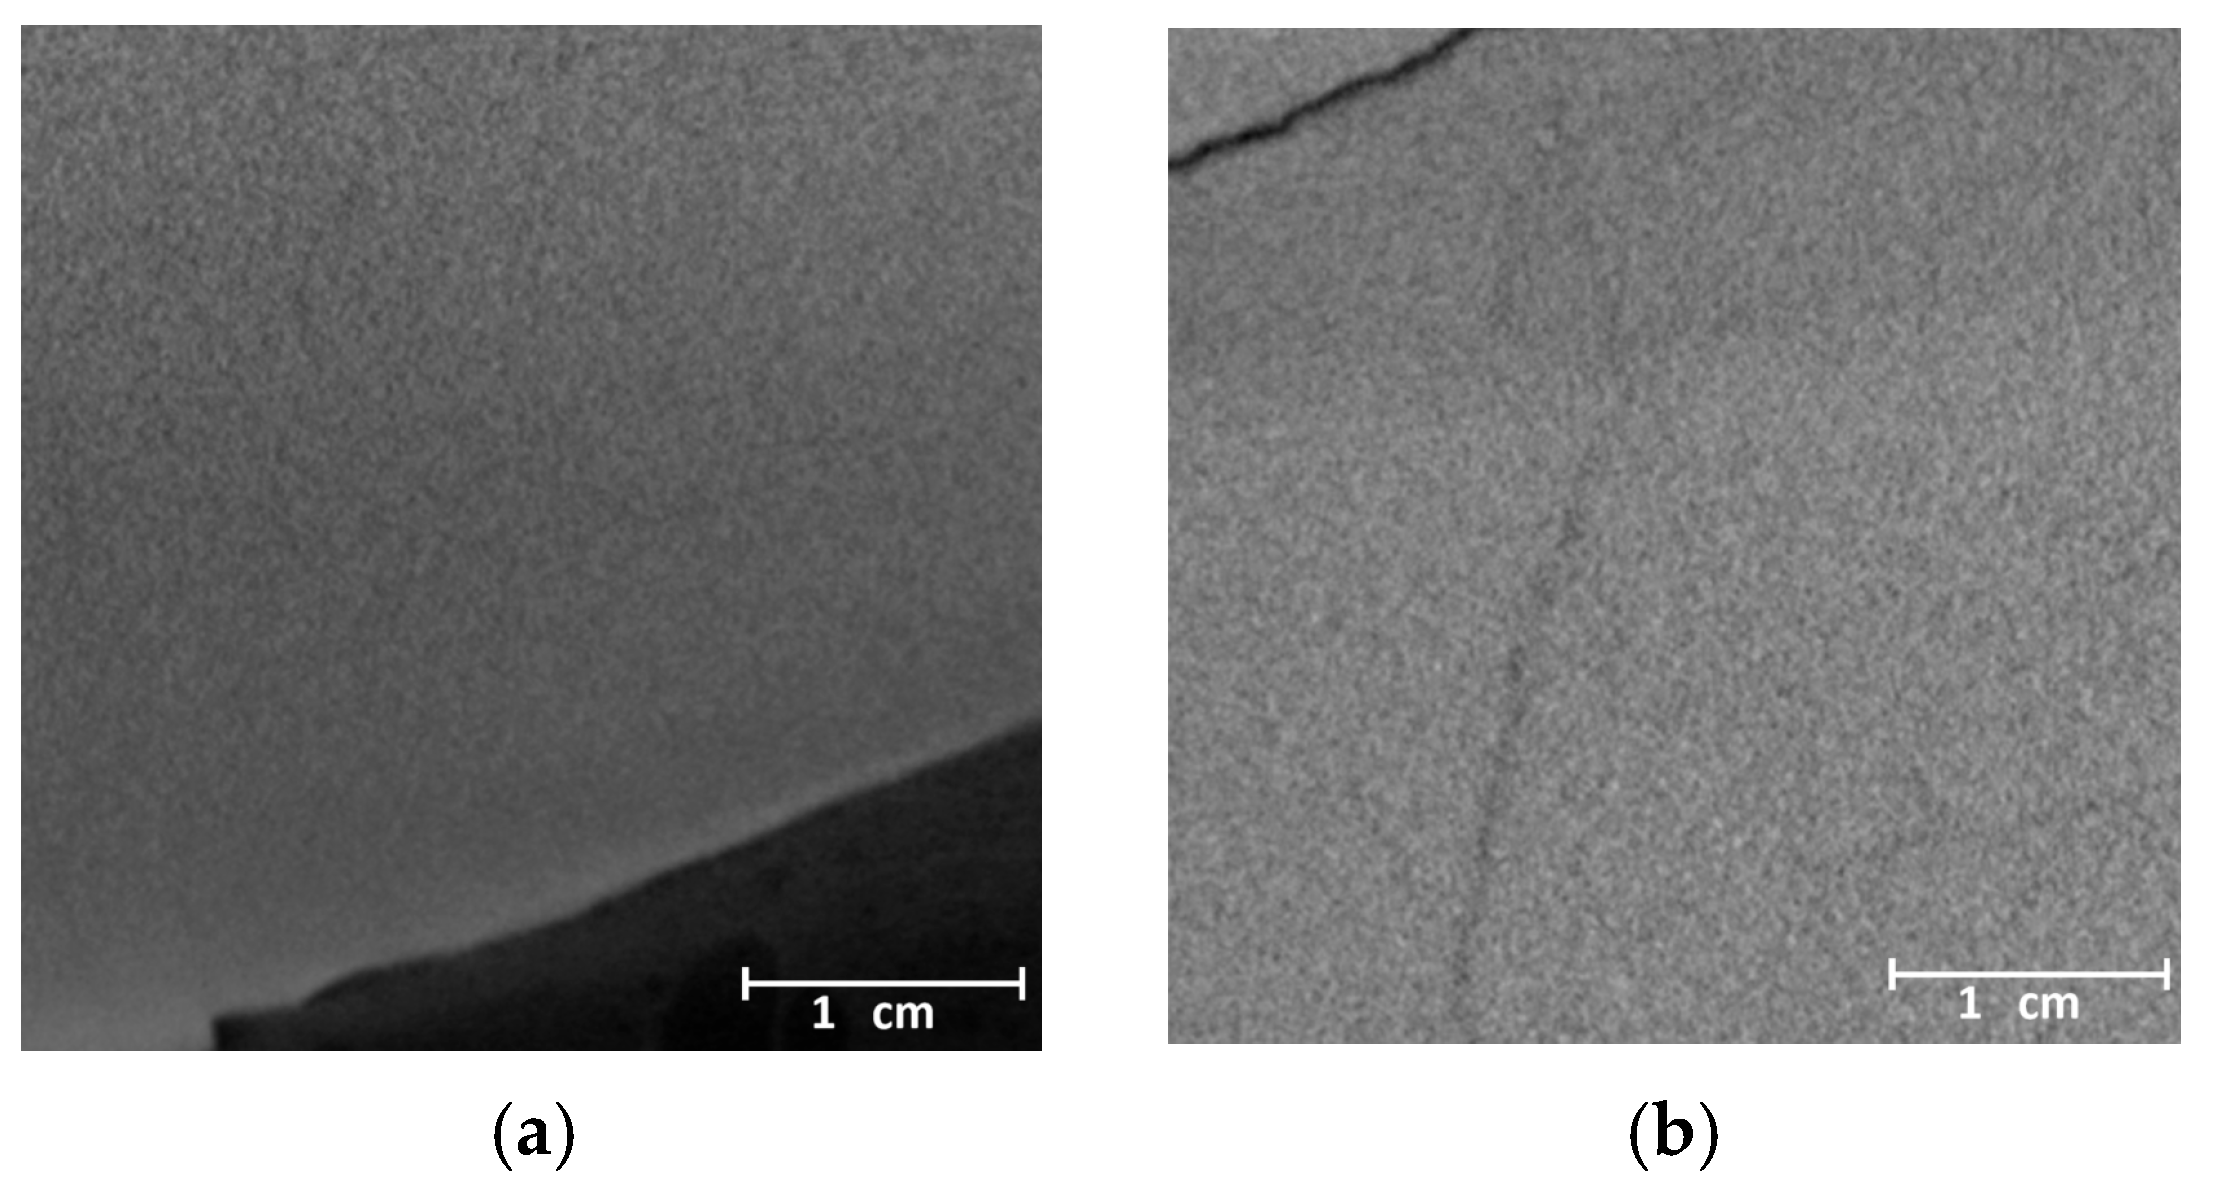
3.4.1. Experimental Data

In this study, a total of 39 rock core samples were collected. The CT images used as the raw data were acquired using the Cylindscan-2000 series scanners manufactured by China Tianjin Sanying Precision Instruments Co., Ltd. (Tianjin, China). The length of the core samples ranges from 0.8 m to 1 m. The lithology of all core samples is sandstone. To ensure lithological diversity and enhance the representativeness of the dataset, samples were selected from multiple exploration blocks. This strategy facilitated the construction of a heterogeneous dataset encompassing a wide range of sedimentary textures, fracture patterns, and diagenetic features, thereby supporting the robustness and applicability of the proposed method.
Following the large-scale image analysis method based on the sliding window proposed in Section 3.3, each core sample was divided into approximately 200 local patches, each with a pixel size of 512 × 512. As a result, a total of 7104 cropped images were obtained.
The dataset was then split into training, validation, and testing sets according to a ratio of 8:1:1.

3.4.2. Data Annotation

After obtaining the raw data, the initial annotation strategy was to first apply threshold-based extraction, followed by manual correction of the misidentified regions. However, due to the extremely small area occupied by fractures in core CT images and the presence of significant noise, it proved difficult to separate fractures from the background using a simple global thresholding approach.
Ultimately, we adopted a different workflow: manual annotation of fractures on the original images was performed prior to cropping. This decision was made because certain fractures, while continuous, may appear fragmented or unclear in CT scans. If annotation were conducted after image cropping, it would be easy to introduce errors, especially in cases where the continuity of fractures relies on contextual information across different parts of the core.
Losing such global contextual information during dataset preparation could adversely affect subsequent model training. By annotating the full images first, the interpretive experience of exploration and development personnel—who can recognize subtle fracture continuities—is preserved as global semantic knowledge within the labels, thereby integrating domain expertise into the modeling process.
Examples from the annotated dataset are shown in Figure 7. In Figure 7, the left panel shows a cropped training sample image, and the right panel displays the corresponding annotated mask image.
Since the actual lengths of the core samples varied, the corresponding CT image sizes were also inconsistent. To facilitate model training, the images were cropped into patches of fixed dimensions 512 × 512.
After cropping, a significant portion of the resulting patches did not contain any fractures. An excessive number of such non-fracture samples could negatively impact the model’s training effectiveness and convergence speed. Additionally, too much redundant information could interfere with the model’s ability to extract meaningful features. Therefore, after cropping, images without fractures were selectively removed from the training set, as illustrated in the left panel of Figure 8.
Ultimately, 3318 images were retained in the training set, with the proportion of fracture-containing and non-fracture samples maintained at approximately 1:1.
The validation and testing sets were left unchanged, and all validation samples were manually annotated.

3.5. Feature-Based Fracture Characterization

In addition to enabling rapid fracture segmentation, computer technology offers a significant advantage in the precise quantitative analysis of fracture parameters.
In this study, after reviewing various comprehensive reservoir fracture characterization methods [25,26] and referring to the petroleum industry standard SY/T 6103-2019; Determination of Rock Pore Structure Characteristics—Image Analysis Method. Beijing: China, 2019. (Determination of Rock Pore Structure Characteristics—Image Analysis Method), the following key parameters were selected for fracture characterization: fracture area ratio, fracture orientation and dip, and fracture aperture. The rationale, significance, and calculation methods for these parameters are outlined below.
The fracture area ratio refers to the proportion or density of fractures within the sampled formation. It is directly related to the permeability of the reservoir and the efficiency of hydrocarbon flow. A higher fracture area ratio typically indicates better permeability, which facilitates enhanced oil and gas recovery.
Fracture orientation describes the principal extension direction of fractures, while fracture dip refers to the angle between a fracture plane and the horizontal plane. Quantitative analysis of fracture orientation assists exploration and production engineers in optimally positioning production and injection wells, increasing wellbore–fracture intersections, and thereby improving flow efficiency and recovery factors. Additionally, accurate orientation data contributes to the development of more precise subsurface fluid flow models, enabling better optimization of production strategies.
Fracture dip and fracture aperture are crucial parameters in permeability assessment and hydraulic fracturing design. Fracture aperture serves as a key basis for optimizing development strategies, predicting production variations, evaluating project economics, and implementing effective reservoir management.
This study provides a statistical approach to estimate fracture orientation based on core samples. However, due to possible rotation and disturbance during drilling, core-based orientations may deviate from true in-situ fracture orientations. To improve accuracy, directional coring techniques are required for reliable orientation measurements.
Regarding specific calculations:
  • The fracture area ratio is determined by calculating the ratio of the number of pixels classified as fractures to the total number of pixels in the image.
  • To estimate fracture dip and orientation, a least squares fitting method is applied to fit a straight line through the fracture points, from which the dip angle and orientation of the fitted line are calculated.
  • For fracture aperture, the average distance between opposing sides of the fracture boundary within each segmented fracture contour is computed.

4. Experiments and Results Analysis

4.1. Analysis of Fracture Identification Results

The experimental environment used in this study includes an Intel Xeon 6132 CPU (2.60 GHz) processor, two NVIDIA V100 GPUs (32 GB memory), the Ubuntu 20.04 operating system, and the Python 3.9 programming language.
Following the training procedures outlined in this study, the proposed method was quantitatively compared with two baseline models: the Fully Convolutional Network (FCN), a fundamental architecture in the segmentation field, and SegFormer, a more recent model recognized for its strong performance and high efficiency.
The evaluation metrics selected were the commonly used mean Intersection over Union (mIoU), overall pixel accuracy (aAcc), and mean class accuracy (mAcc). Specifically, mIoU measures the overlap between the predicted labels and the ground truth labels and effectively reflects segmentation accuracy. Meanwhile, aAcc represents the overall pixel-wise accuracy across the entire dataset. mAcc is calculated as the mean of the individual accuracies for the background and fracture classes. The comparison results of mIoU, aAcc, and mAcc for each model on the validation set are summarized in Table 1.
The trained model was then applied to the cropped images from the dataset for testing. The resulting segmentation performance is illustrated in Figure 9.
Results Analysis. A comparative evaluation of the segmentation outputs presented in Figure 9 and the threshold-based results in Figure 2 demonstrates the clear advantages of the SCTNet-based approach in extracting fractures. Traditional thresholding methods frequently misidentify noise or image artifacts in CT scans as valid fractures, resulting in a high rate of false positives and diminished interpretability. In contrast, SCTNet, trained on annotated full-diameter core CT images, effectively learns expert-defined patterns for fracture identification. As illustrated in the right panel of Figure 9, the model is capable of accurately extracting fracture features while excluding irrelevant background interference. The retained fracture structures exhibit high geometric continuity and structural realism, consistent with the expected fracture patterns within the corresponding lithology.
From a quantitative perspective, although all three evaluated models achieve acceptable levels of overall segmentation accuracy, the central challenge in geological fracture characterization lies in the precise delineation of fracture zones. This task is particularly critical for downstream applications such as fracture network modeling, permeability estimation, and reservoir quality assessment. Compared to global accuracy, metrics such as mean Intersection over Union (mIoU) and mean Accuracy (mAcc) provide a more fracture-sensitive measure of performance. As shown in Table 1, the SCTNet-based method significantly outperforms both the thresholding and conventional CNN-based models in terms of mIoU and mAcc, confirming its capability in processing complex full-diameter CT data and underscoring its potential for automated core fracture interpretation. Unlike the studies reviewed in Section 2, which primarily focus on micro- and nano-scale CT imaging, the present study expands the application of intelligent fracture characterization to the macroscopic scale, thereby broadening the scope of core image analysis.
For narrower breaks—such as those depicted in Figure 1 of Section 2.2—the visual distinction from natural fractures is minimal, making accurate classification challenging. To address this issue, a post-inference fracture width threshold was applied. Based on the fracture characterization precision framework proposed by Liu et al. [23], and in accordance with the imaging resolution adopted in this study, fracture-like features with a width exceeding 1 cm were excluded from the segmentation results as likely representing mechanical breaks rather than geological fractures.
It is important to acknowledge certain inherent limitations of CT imaging. When the density of fracture-filling materials closely resembles that of the surrounding rock matrix, even experienced experts may encounter difficulties in accurately identifying such features. In this study, expert annotations were incorporated into the training data to embed domain-specific knowledge, enabling the model to learn representative patterns. However, for features that remain indistinguishable to human interpreters, CT-based analysis methods face fundamental limitations. Moreover, as the current approach relies solely on CT image data, its accuracy may be compromised in cases with weak lithological or density contrast. To address these challenges, future studies will incorporate additional geological validation methods—such as core logging, petrographic analysis, and borehole imaging—to enhance the interpretability and robustness of the results.

4.2. Quantitative Characterization of Fracture Information

In this study, a quantitative characterization of fracture structures was incorporated into the workflow. Based on the outputs from the testing phase, the segmented local patches were stitched together following the method described in Section 3.3, reconstructing the complete full-diameter core scan. Subsequently, the quantitative methods detailed in Section 3.5 were applied to the predicted fracture regions for parameter extraction and analysis.
For the sample illustrated in the previous results, the fracture area ratio was calculated to be 0.54%. Based on such quantifiable information, a fracture area threshold can be set for large-scale core datasets, enabling the system to automatically flag samples that exceed the threshold. This facilitates rapid targeting of zones or formations with enhanced fracture development.
Leveraging the macroscopic observation capabilities of full-diameter CT imaging, additional parameters such as fracture orientation, fracture dip, and fracture aperture were statistically analyzed. For the given sample, the following average values were obtained: Average fracture strike: 72.54 degrees, Average fracture dip: 34.67 degrees, and Average fracture aperture: 0.0031 m. Furthermore, detailed histograms of fracture orientation, dip, and aperture distributions were generated, as shown in Figure 10.
These quantitative fracture parameters are of significant relevance to exploration and development activities. Compared to manual interpretation, which is often subject to subjectivity and limited precision, image-based automated analysis enables more accurate and consistent results at the pixel level. More importantly, the proposed method reduces the time required to analyze a single full-diameter CT core image from hours in manual workflows to just a few minutes through intelligent processing, thereby substantially improving overall efficiency.

4.3. Application Analysis

In the past, the analysis of full-diameter CT images primarily relied on manual visual inspection, a labor-intensive process requiring specialists to examine each image and local region individually to identify and analyze fractures. This approach was extremely time-consuming and severely constrained research progress and operational efficiency.
Manual visual inspection methods are also ill-suited for handling large-scale datasets. In practical exploration and development activities, researchers often face the challenge of processing thousands of CT images from core samples to identify those with well-developed fractures, higher extractability potential, or special geological significance for further study. Manual analysis not only struggles to efficiently accomplish this task but also risks overlooking important samples.
Moreover, manual methods offer limited capabilities in providing quantitative fracture data. In contrast, computer-based intelligent analysis dramatically improves both the speed and accuracy of fracture identification. It enables the efficient management and deep mining of large datasets, providing strong technical support for comprehensively understanding reservoir fractures and optimizing exploration and development strategies.
By statistically analyzing fracture information from large-scale full-diameter CT images, quantitative fracture data can be obtained, aiding in the construction of reservoir models that more accurately reflect actual geological conditions, thereby providing a geological basis for development plan design [27].
Quantitative analysis also facilitates the early identification of risk factors, supporting safer field development. The distribution patterns and orientations of fractures have significant implications for well pattern optimization [28]. Ensuring that wellbores maximize intersection with fractures can significantly enhance single-well production rates.
Furthermore, when combined with numerical simulation methods, the optimal fracture spacing and fracturing sequences can be determined to further improve production efficiency [29].
In summary, the quantitative characterization of fracture information plays a vital role across multiple aspects of oil and gas exploration and development. It enhances the scientific and rational design of development strategies, optimizes fracturing effectiveness, reduces development risks, and promotes the efficient exploitation of hydrocarbon reservoirs.

5. Conclusions

This study proposes a deep learning-based semantic segmentation method for automated fracture extraction and characterization from full-diameter core CT images. A dataset of full-diameter core CT images was constructed, and specific training optimizations were introduced to address the challenge of the extremely small proportion of fracture features in the images. The main conclusions are as follows:
  • The integration of semantic segmentation techniques into full-diameter core CT fracture analysis significantly improves model performance. Compared to traditional threshold-based methods and other deep learning models, the SCTNet-based approach achieved a pixel-level segmentation accuracy of 97% and demonstrated superior fracture discrimination, as indicated by a mean Intersection over Union (mIoU) of 72.14%.
  • A full-size fracture segmentation strategy based on sliding window stitching was developed, enabling quantitative extraction of key fracture parameters, including area ratio, strike, dip, and aperture.
  • Compared to conventional manual interpretation—which often requires hours of expert analysis—the proposed method reduces processing time to just a few minutes, significantly improving the efficiency of fracture identification and description.
  • One limitation of the current method is its exclusive reliance on CT image data, which may reduce detection accuracy in cases with weak density contrast. At present, the model’s performance has been evaluated against expert geological interpretations, demonstrating a high level of agreement and thereby supporting the credibility of the proposed method. Future studies will incorporate additional geological validation techniques—such as core logging, petrographic analysis, and borehole imaging—to further enhance the reliability of the results.
  • Expanding the dataset to include a wider range of lithologies and fracture types is expected to further improve the model’s robustness and generalization capability.

Author Contributions

Formal analysis, R.H. and J.B.; Resources, Y.R.; Writing—original draft, R.H.; Writing—review & editing, D.Q. and G.H.; Supervision, Q.S., X.L. and W.W.; Funding acquisition, Y.R. All authors have read and agreed to the published version of the manuscript.

Funding

This research was funded by National Natural Science Foundation of China, grant number [42372175], CNPC Technology Project, grant number 2023DJ84, CNPC Key Core Technology Research Project, 2021ZC07.

Data Availability Statement

The data are not publicly available due to confidentiality agreements with project partners.

Conflicts of Interest

Author Ruiqi Huang, Dexin Qiao, Xi Liu, Qianxiao Su, Wenjie Wang, Jianzhong Bi and Yili Ren were employed by the Research Institute of Petroleum Exploration & Development, PetroChina. The remaining author declares that the research was conducted in the absence of any commercial or financial relationships that could be construed as a potential conflict of interest.

Abbreviations

AbbreviationDefinition
CNNConvolutional Neural Network
SCTNetSingle-Branch CNN with Transformer
CTComputed Tomography
IoUIntersection over Union
ReLURectified Linear Unit
Mask R-CNNMask Region-based Convolutional Neural Network
U-NetConvolutional Network for Biomedical Image Segmentation
FCNFully Convolutional Network
SETRSegmentation Transformer
ViTVision Transformer
SegFormerSegmentation Transformer-based Model
SeaFormerSqueeze-enhanced Axial Transformer for Semantic Segmentation
CF BlocksConvFormer Blocks
DAPPMDeep Aggregation Pyramid Pooling Module
BFABackbone Feature Alignment
SDHAShared Decoder Head Alignment

References

  1. Hui, G.; Chen, Z.; Schultz, R.; Chen, S.; Song, Z.; Zhang, Z.; Song, Y.; Wang, H.; Wang, M.; Gu, F. Intricate Unconventional Fracture Networks Provide Fluid Diffusion Pathways to Reactivate Pre-Existing Faults in Unconventional Reservoirs. Energy 2023, 282, 128803. [Google Scholar] [CrossRef]
  2. Torabi, A.; Alaei, B.; Ellingsen, T.S.S. Faults and fractures in basement rocks, their architecture, petrophysical and mechanical properties. J. Struct. Geol. 2018, 117, 256–263. [Google Scholar] [CrossRef]
  3. Kharrat, R.; Alalim, N.; Ott, H. Assessing the Influence of Fracture Networks on Gas-Based Enhanced Oil Recovery Methods. Energies 2023, 16, 6364. [Google Scholar] [CrossRef]
  4. Hou, J.; Qiu, M.; Lu, N.; Qu, Y.; Li, F.; Meng, X.; Shi, X. Characterization of residual oil microdistribution at pore scale using computerized tomography. Acta Pet. Sin. 2014, 35, 319–325. [Google Scholar] [CrossRef]
  5. Wang, R.; Li, B.; Teng, Q. Core FIB-SEM Image Segmentation Algorithm Based on Convolutional Neural Network. Comput. Eng. 2021, 47, 264–274. [Google Scholar] [CrossRef]
  6. Chawshin, K.; Berg, C.F.; Varagnolo, D.; Lopez, O. Lithology Classification of Whole Core CT Scans Using Convolutional Neural Networks. SN Appl. Sci. 2021, 3, 668. [Google Scholar] [CrossRef]
  7. Li, D. Research on Pore Detection of Sandstone CT Images Based on AT-Mask RCNN. Master’s Thesis, Northeast Petroleum University, Daqing, China, 2022. [Google Scholar]
  8. Pham, C.; Zhuang, L.; Yeom, S.; Shin, H.-S. Automatic Fracture Characterization in CT Images of Rocks Using an Ensemble Deep Learning Approach. Int. J. Rock Mech. Min. Sci. 2023, 170, 105531. [Google Scholar] [CrossRef]
  9. Long, J.; Shelhamer, E.; Darrell, T. Fully Convolutional Networks for Semantic Segmentation. In Proceedings of the IEEE Conference on Computer Vision and Pattern Recognition, Boston, MA, USA, 7–12 June 2015; pp. 3431–3440. [Google Scholar] [CrossRef]
  10. Ronneberger, O.; Fischer, P.; Brox, T. U-Net: Convolutional Networks for Biomedical Image Segmentation. In Medical Image Computing and Computer-Assisted Intervention—MICCAI 2015; Navab, N., Hornegger, J., Wells, W.M., Frangi, A.F., Eds.; Lecture Notes in Computer Science; Springer International Publishing: Cham, Switzerland, 2015; Volume 9351, pp. 234–241. ISBN 978-3-319-24573-7. [Google Scholar] [CrossRef]
  11. Dosovitskiy, A.; Beyer, L.; Kolesnikov, A.; Weissenborn, D.; Zhai, X.; Unterthiner, T.; Dehghani, M.; Minderer, M.; Heigold, G.; Gelly, S.; et al. An Image Is Worth 16×16 Words: Transformers for Image Recognition at Scale. In Proceedings of the 9th International Conference on Learning Representations (ICLR 2021), Virtual Event, 3–7 May 2021. [Google Scholar]
  12. Xie, E.; Wang, W.; Yu, Z.; Anandkumar, A.; Alvarez, J.M.; Luo, P. SegFormer: Simple and Efficient Design for Semantic Segmentation with Transformers. Adv. Neural Inf. Process. Syst. 2021, 34, 12077–12090. [Google Scholar]
  13. Wan, Q.; Huang, Z.; Lu, J.; Yu, G.; Zhang, L. Seaformer: Squeeze-Enhanced Axial Transformer for Mobile Semantic Segmentation. In Proceedings of the Eleventh International Conference on Learning Representations (ICLR), Kigali, Rwanda, 1–5 May 2023. [Google Scholar]
  14. Zaidi, S.S.A.; Ansari, M.S.; Aslam, A.; Kanwal, N.; Asghar, M.; Lee, B. A Survey of Modern Deep Learning Based Object Detection Models. arXiv 2021, arXiv:2104.11892. [Google Scholar] [CrossRef]
  15. Chen, H. Semantic Image Segmentation Based on Convolutional Neural Networks. Master’s Thesis, Zhejiang University, Hangzhou, China, 2016. [Google Scholar]
  16. Everingham, M.; Van Gool, L.; Williams, C.K.I.; Winn, J.; Zisserman, A. The Pascal Visual Object Classes (VOC) Challenge. Int. J. Comput. Vis. 2010, 88, 303–338. [Google Scholar] [CrossRef]
  17. Xu, Z.; Wu, D.; Yu, C.; Chu, X.; Sang, N.; Gao, C. SCTNet: Single-Branch CNN with Transformer Semantic Information for Real-Time Segmentation. Proc. AAAI Conf. Artif. Intell. 2024, 38, 6378–6386. [Google Scholar] [CrossRef]
  18. Vaswani, A.; Shazeer, N.; Parmar, N.; Uszkoreit, J.; Jones, L.; Gomez, A.N.; Kaiser, Ł.; Polosukhin, I. Attention Is All You Need. In Proceedings of the Neural Information Processing Systems 30: Annual Conference on Neural Information Processing Systems 2017, Long Beach, CA, USA, 4–9 December 2017. [Google Scholar]
  19. Hong, Y.; Pan, H.; Sun, W.; Jia, Y. Deep Dual-Resolution Networks for Real-Time and Accurate Semantic Segmentation of Road Scenes. IEEE Trans. Intell. Transp. Syst. 2022, 23, 1234–1245. [Google Scholar] [CrossRef]
  20. Wang, J.; Gou, C.; Wu, Q.; Feng, H.; Han, J.; Ding, E.; Wang, J. Rtformer: Efficient Design for Real-Time Semantic Segmentation with Transformer. Adv. Neural Inf. Process. Syst. 2022, 35, 7423–7436. [Google Scholar]
  21. Lin, T.-Y.; Goyal, P.; Girshick, R.; He, K.; Dollár, P. Focal Loss for Dense Object Detection. In Proceedings of the IEEE International Conference on Computer Vision, Venice, Italy, 22–29 October 2017; pp. 2980–2988. [Google Scholar] [CrossRef]
  22. Loshchilov, I.; Hutter, F. Decoupled Weight Decay Regularization. In Proceedings of the 7th International Conference on Learning Representations, ICLR 2019, New Orleans, LA, USA, 6–9 May 2019. [Google Scholar]
  23. Kingma, D.P.; Ba, J. Adam: A Method for Stochastic Optimization. In Proceedings of the 3rd International Conference on Learning Representations, ICLR 2015, San Diego, CA, USA, 7–9 May 2015. [Google Scholar]
  24. Huang, P.; Zheng, Q.; Liang, C. A Survey of Image Segmentation Methods. J. Wuhan Univ. (Nat. Sci. Ed.) 2020, 66, 519–531. [Google Scholar] [CrossRef]
  25. Liu, J.; Ding, W.; Xiao, Z.; Dai, J. Advances in Comprehensive Characterization and Prediction of Reservoir Fractures. Prog. Geophys. 2019, 34, 2283–2300. [Google Scholar] [CrossRef]
  26. Wang, X.; Li, J.; Zhang, S.; Tan, M. Quantitative Characterization and Calibration of Fracture Porosity Parameters and Analysis of Influencing Factors. Prog. Geophys. 2011, 26, 1393–1399. [Google Scholar] [CrossRef]
  27. Hui, G.; Chen, S.; Gu, F. Strike–Slip Fault Reactivation Triggered by Hydraulic-Natural Fracture Propagation during Fracturing Stimulations near Clark Lake, Alberta. Energy Fuels 2024, 38, 18547–18555. [Google Scholar] [CrossRef]
  28. Shao, S.; Tian, S.; Li, G.; He, Z. Optimization of Fracture Spacing in Horizontal Well Network Fracturing. Pet. Drill. Technol. 2014, 42, 92–96. [Google Scholar] [CrossRef]
  29. Gan, Y.; Zhang, S.; Liu, S.; Qi, T.; Cao, Y. A New Method for Well Pattern Optimization and Integral Fracturing Design. Acta Pet. Sin. 2011, 32, 290–294. [Google Scholar] [CrossRef]
Figure 1. An example in sandstone where the threshold fails to separate fractures from the background: (a) incomplete threshold extraction, (b) the thresholding method is susceptible to noise interference, and (c) inability to distinguish between cracks and fractures.
Processes 13 02221 g001
Figure 2. Semantic segmentation example image [16]. The (left) image is the corresponding original image, and the (right) image is a schematic of the semantic segmentation result.
Processes 13 02221 g002
Figure 3. Full-diameter CT fracture characterization model architecture.
Processes 13 02221 g003
Figure 4. Alignment module processing flow.
Processes 13 02221 g004
Figure 5. Comparison of image resizing schemes: (a) local view of fractures in the original image, (b) local view of fractures after direct resizing to a fixed size, and (c) local view of fractures after padding while preserving the original aspect ratio.
Processes 13 02221 g005
Figure 6. Large-scale image analysis process based on sliding window. * In the output section, stitch the n small subfigures to reconstruct the complete large image.
Processes 13 02221 g006
Figure 7. Image examples of the dataset construction process: (a) example of a cropped training sample image and (b) example of a corresponding annotated mask image.
Processes 13 02221 g007
Figure 8. Comparison examples of datasets with and without fractures: (a) example of an image without fractures and (b) example of an image with fractures.
Processes 13 02221 g008
Figure 9. Display images of segmentation results: (a) display of fracture segmentation results produced by the model and (b) demonstration of the model’s segmentation capability on images containing both fractures and breaks.
Processes 13 02221 g009
Figure 10. Quantitative statistical analysis of fracture information: (a) Fracture Dip Distribution Map, (b) Fracture Strike Distribution Map, and (c) Fracture Aperture Distribution Map.
Processes 13 02221 g010
Table 1. Quantitative comparison of results for different deep learning models.
aAccmIoUmAcc
FCN95.9961.0164.74
SegFormer96.1666.7567.05
SCTNet97.5372.1482.48
Disclaimer/Publisher’s Note: The statements, opinions and data contained in all publications are solely those of the individual author(s) and contributor(s) and not of MDPI and/or the editor(s). MDPI and/or the editor(s) disclaim responsibility for any injury to people or property resulting from any ideas, methods, instructions or products referred to in the content.

