Article

Technical, Economic, and Environmental Optimization of the Renewable Hydrogen Production Chain for Use in Ammonia Production: A Case Study

by
Halima Khalid
1,
Victor Fernandes Garcia
2,
Jorge Eduardo Infante Cuan
2,
Elias Horácio Zavala
1,
Tainara Mendes Ribeiro
1,
Dimas José Rua Orozco
1 and
Adriano Viana Ensinas
1,*
1
Department of Engineering, Federal University of Lavras, Lavras 37200-900, Brazil
2
Center of Engineering, Modeling and Social Science Applied, Federal University of ABC, Santo André 09210-580, Brazil
*
Author to whom correspondence should be addressed.
Processes 2025, 13(7), 2211; https://doi.org/10.3390/pr13072211
Submission received: 22 May 2025 / Revised: 26 June 2025 / Accepted: 1 July 2025 / Published: 10 July 2025
(This article belongs to the Section Chemical Processes and Systems)

Abstract

Conventional ammonia production uses fossil-based hydrogen, resulting in high greenhouse gas emissions. Given the growing demand for sustainable solutions, it is essential to replace fossil hydrogen with renewable alternatives. This study assessed the technical, economic, and environmental viability of renewable ammonia production in Minas Gerais. To this end, an optimization model based on mixed integer linear programming (MILP) was developed and implemented in LINGO 20® software. The model incorporated investment costs; raw materials; transportation; emissions; and indicators such as NPV, payback, and minimum sale price. Hydrogen production routes integrated into the Haber–Bosch process were analyzed: biomass gasification (GS_WGS), anaerobic digestion of vinasse (Vinasse_BD_SMR), ethanol reforming (Ethanol_ESR), and electrolysis (PEM_electrolysis). Vinasse_BD_SMR showed the lowest costs and the greatest economic viability, with a payback of just 2 years, due to the use of vinasse waste as a raw material. In contrast, the electrolysis-based route had the longest payback time (8 years), mainly due to the high cost of the electrolyzers. The substitution of conventional hydrogen made it possible to avoid 580,000 t CO2 eq/year for a plant capacity of 200,000 t NH3/year, which represents 13% of the Brazilian emissions from the nitrogenated fertilizer sector. It can be concluded that the viability of renewable ammonia depends on the choice of hydrogen source and logistical optimization and is essential for reducing emissions at large scale.

1. Introduction

Ammonia (NH3) is a colorless, volatile, and flammable chemical compound widely used in the production of fertilizers, explosives, cleaning products, and plastics. Recently, it has gained prominence as an energy vector due to its high hydrogen density and ease of storage and transport, surpassing hydrogen gas in logistical aspects [1].
Currently, global ammonia production is heavily dependent on fossil sources. The Haber–Bosch process, associated with steam reforming of natural gas, accounts for approximately 72% of the world’s production. Other sources include coal gasification (22%), fuel oil (4%), and naphtha (1%). Less than 1% of the ammonia used in the fertilizer industry comes from renewable hydrogen, such as that obtained by water electrolysis [2]. As a result, the ammonia production chain contributes about 1% to 2% of global CO2 emissions, which represents more than 400 million tonnes per year [3].
In view of climate commitments and the need for industrial decarbonization, it is essential to develop sustainable routes for the production of hydrogen, a key input in ammonia synthesis [4]. Among the renewable technologies with the greatest potential are water electrolysis, anaerobic digestion of organic waste with subsequent steam reforming of purified biogas, biomass gasification, and steam reforming of ethanol. These alternatives not only reduce greenhouse gas (GHG) emissions but also promote the energy use of waste and the valorization of biomass [5,6].
The state of Minas Gerais, in Brazil, has great potential for adopting these routes, given the wide availability of agricultural and industrial biomass such as sugarcane vinasse, forest residues, and second-generation ethanol. In addition, the state has a consolidated energy infrastructure and public policies aimed at energy transition, which reinforce its relevance as a study region for the implementation of renewable hydrogen production chains.
The analysis of the feasibility of these routes requires modeling and optimization tools. These techniques allow the simulation of complex scenarios, the evaluation of technical and economic performance, and the design of systems with less environmental impact [7]. Among the existing methods, mixed integer linear programming (MILP) stands out, capable of representing production chains with multiple objectives and constraints, incorporating technical, economic, and environmental variables [8]. When applied to the ammonia chain, this approach helps to identify more efficient hydrogen supply routes, with lower costs and a smaller carbon footprint [9].
Although there are studies on individual hydrogen production routes, there is still little research that integrates different renewable technologies based on multiple biomasses, considering regional variables such as resource availability, logistics, and environmental impacts. This gap justifies the present research, which proposes a comparative approach between routes such as ethanol reforming, biomass gasification, water electrolysis, and anaerobic digestion of vinasse, evaluating their potential to supply renewable hydrogen to the ammonia production chain.
Given this, the main objective of this study is to evaluate, through modeling and optimization, the technical, economic, and environmental feasibility of different renewable hydrogen production routes applied to ammonia synthesis in the Brazilian context.

2. Materials and Methods

The methodology of this study was developed based on the integration of three complementary models: physical, economic–environmental, and regional logistics, which form the basis for the formulation of the optimization model. The physical model represents the inflows and outflows of data from production processes. The economic–environmental model takes into account the total costs of the system, emissions, and revenues. The regional logistics model considers demand, resource availability, and distances. Based on these elements, an optimization model was developed to minimize emissions and the total cost of the hydrogen supply chain for ammonia synthesis, while respecting constraints and decision variables.

2.1. Optimization—MILP

Due to the variety of variables involved in this study and the multi-objective nature of the analysis, MILP was used as an optimization tool, allowing for accurate and efficient data modeling.
The multi-objective model in this study was developed according to the following process: Initially, the various components of the model were presented and described, followed by its formulation and development. Finally, the model was validated through application in a case study.
The formulation presented in this work focused on the objective function of the problem developed in the code, taking into account the inputs and outputs of mass, energy, and resource availability. LINGO 20® and Excel® software were used as the interface for the input and output data parameters. The equation formulation presented in this work was based on the methodology adopted by the authors [10], which used an MILP approach for process optimization. Four main categories composed the structure: resources (R), unit (U), place (P), and mode (Mo).

2.1.1. Objective Function

The optimization was geared toward minimizing the total annualized cost, including investments, transport, and resource acquisition and considering the revenue generated by the sale of ammonia. The objective was to identify the combinations that best met the defined criteria. As a result, the model provided input for decision-making, indicating the most viable locations, flows, capacities, and production and transport technologies. Equation (1) represents the objective function used in the model:
M I N   T A C = p u ( I n v u , p + C O P u , p ) + p r ( C P M r , p R E V r , p ) + p p ´ r m o C T R p , p ´ , r , m o
The description of the terms used in the equations are as follows: TAC, the total annual costs; I n v u , p , the annualized investment of unit u in location p; C O P u , p , the operating cost of unit u in location p; C P M r , p , the acquisition cost of resource r used in location p; R E V r , p , the sales revenue of product r in location p; and C T R p , p , r , m o , the transportation cost of resource r from location p to location p’ using modal mo.
The equations used to calculate the objective function terms (CPM, COP, CTR, and REV) are available in the Supplementary Material. CPM considers the type and purchase price of the resource (Equation (S1) in Supplementary Material S1); COP corresponds to operation and maintenance expenses, calculated as 25% of the annualized investment (Equation (S2) in Supplementary Material S1); REV considers the quantity sold and the sales price (Equation (S3) in Supplementary Material S1); CTR takes into account the resource transported, the distance, and the transport unit cost of the resource and the mode of transport (Equation (S4) in Supplementary Material S1); and INV considers the annualized installed investment cost for discount rate of 6% and 20 years of project life time (Equation (S18) in Supplementary Material S4).

2.1.2. Constraints

To meet the objective function conditions, the model imposes constraints related to mass balance, emissions, resource availability, and demand, as well as transport logistics.
The mass balance follows the law of conservation, ensuring that the inflows of purchased, transported, or produced resources are equivalent to the outflows, such as consumption, sale, or further transport (Equation (S5) in Supplementary Material S2). It is assumed that all resources acquired or generated in a region must be fully utilized or traded locally or regionally, avoiding accumulation or waste. The inflows and outflows of each resource are defined in Equations (S6) and (S7). The capacity of the units is adjustable by a capacity variable, applied per unit and location, which multiplies the flows to determine consumption and production according to the location and size of the plant.
As the model seeks to optimize hydrogen production for ammonia synthesis, it is essential to consider both the regional availability of resources and the demand for the final product. The availability constraint (Equation (S8) in Supplementary Material S2) ensures that all acquired resources are available in each region. The demand constraint (Equation (S9) in Supplementary Material S2) ensures that the demand is fully met.
For restrictions related to the production system’s CO2 emissions, the calculation considers both emissions generated in the acquisition of resources and the transport related emissions, as described in Equation (S10) (in Supplementary Material S2).
In transport constraints, Equations (S11)–(S13) (in Supplementary Material S2) represent the inflows and outflows in the transport of resources by a specific modal.
These conditions contribute to achieving optimal cost and emission solutions, respecting the technical and operational limitations of the system.

2.1.3. Decision Variables

The model’s decision variables include W, which represents the capacity of the production variable, and Y, a binary variable that indicates whether a plant or resource is activated or not. These variables are fundamental to achieving the optimal solution within the system constraints, as defined in Equations (S14)–(S16) in Supplementary Material S2. The operating limits of the units are given by CapMax (u, L) and CapMin (u, L), which represent the maximum and minimum capacities, respectively, allowed for each production unit.
In order to model and optimize the ammonia production processes in this work, physical, economic–environmental, and logistical models were developed and technologies were implemented for the production of low-carbon hydrogen, which was subsequently coupled to an air separation unit (ASU) plant and a Haber–Bosch (HB) process plant for the production of ammonia, as illustrated in Figure 1.

2.2. Physical Models

In the physical model we have the parameters that represent the input and output mass flows. For this study, the input and output flows were considered, without representing the intermediate processes that make up each production technology. This change was made due to the reading format of the model used in the optimization, which only identified inputs and outputs. The production of renewable hydrogen was based on the following technologies:
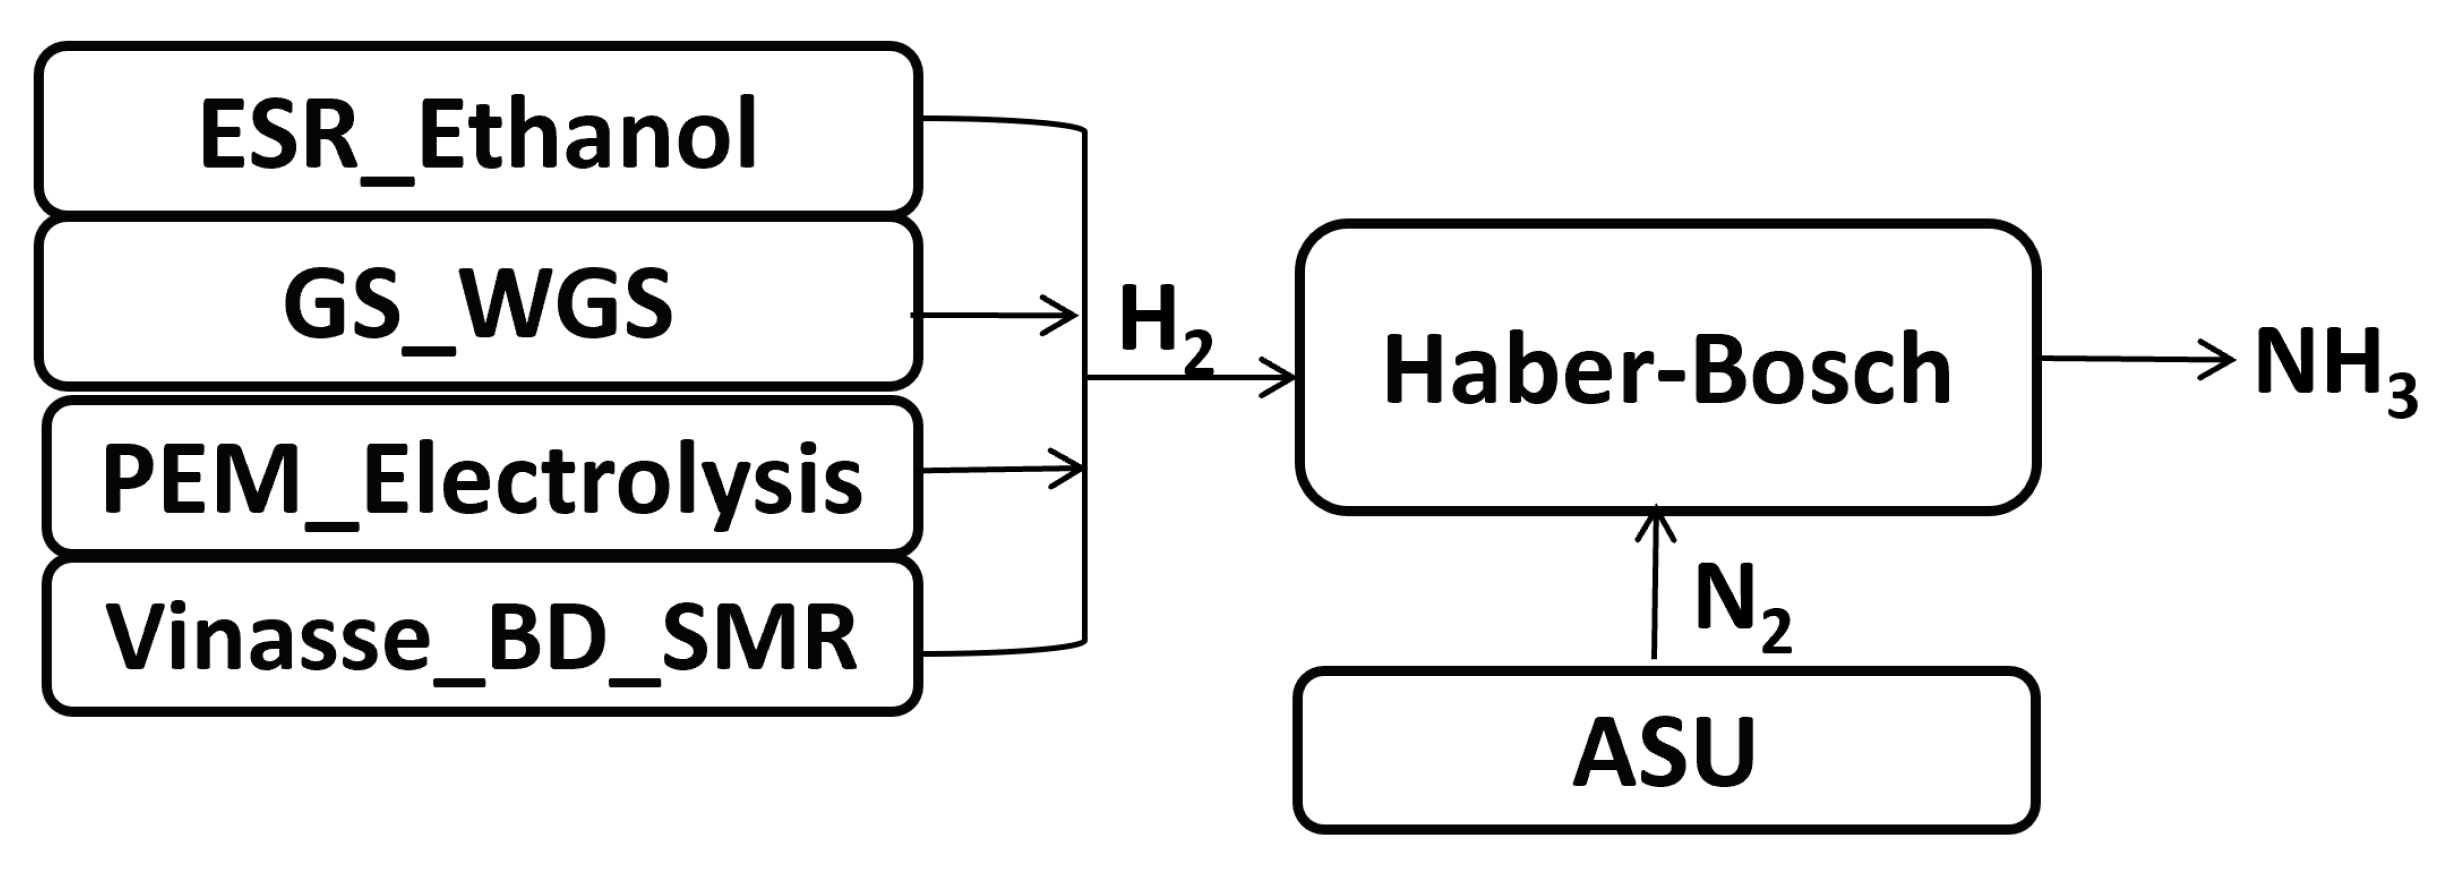
  • Ethanol reforming (Ethanol_ESR);
  • Biomass gasification (GS_WGS);
  • PEM water electrolyzer (PEM_electrolysis);
  • Anaerobic digestion of vinasse and steam reforming of biomethane (Vinasse_BD_SMR).
The subsystem technologies for the production of renewable hydrogen that were studied in this work were optimized and coupled to an ASU and HB plant to produce ammonia. Figure 1 shows the schematics of each hydrogen production technology and how they are coupled to the HB and ASU process.

2.2.1. Physical Model of Ethanol_ESR Technology

For modeling the ethanol steam reforming route (Ethanol_ESR), the technical data were based on studies by [11,12], who described the process in a fixed bed reactor with a Ni/Al2O3 catalyst. The generated hydrogen was purified using two water–gas shift reactors, one operating at high temperature (350 °C) and the other at low temperature (280 °C), modeled as equilibrium reactors. The data input and output flows are described in Supplementary Material S3, Figure S1.

2.2.2. Physical Model of GS_WGS Technology

The physical model of GS_WGS technology was developed based on input and output data from the study by [13], which considered a hydrogen production plant of 18.9 t/h from dry woody biomass. The characteristics of the biomass included 5.8% moisture, 1.5% ash, 10.3% fixed carbon, and 82.4% volatiles. Details of the process steps and the input and output flow can be found in the Supplementary Material (in Supplementary Material S3, Figure S2).

2.2.3. Physical Model of PEM Technology

The data used to optimize this technology (Figure S3) was taken from the article by [14], where they considered the efficiency of the electrolyzer to be 60% and the water conversion rate to be 100% (Supplementary Material S3).

2.2.4. Physical Model of the Vinasse Technology_BD_SMR

For these technologies, the flow data for the anaerobic digestion of vinasse was based on [15], which used information from a large-scale biorefinery with a processing capacity of 4 million tons of sugarcane per harvest. The plant has a capacity to process 438.48 t/h of vinasse (Figure S4 in Supplementary Material S3). The biomethane generated during anaerobic digestion will be reformed to produce hydrogen. The biomethane reforming data was obtained from [16], Figure S5 (in Supplementary Material S3).

2.2.5. Physical Model of the Air Separation Unit

The physical model for obtaining atmospheric nitrogen was constructed based on the study by [14]. In it, the process considered the intake of air and the consumption of electrical energy to produce 29.65 t/h of nitrogen through a cryogenic air separation unit (ASU). This technology performed the fractionation and purification of compressed air based on the differences in the boiling points of its main constituents, allowing for the efficient separation of high-purity nitrogen (Supplementary Material S3, Figure S6).

2.2.6. Physical Model of the Ammonia Synthesis Unit

The physical model for ammonia production was developed based on the study by [14], who proposed an integrated system consisting of three main stages: hydrogen production, nitrogen obtaining, and ammonia synthesis. The input and output flows considered for each stage are described in the Supplementary Material (Supplementary Material S3, Figure S7).

2.3. Economic and Environmental Model

In order to implement these models, one must take into account the data from the purchase and sale of the resources that will be used in the physical models, the emissions that are emitted in the purchase and in the intermediate products, and the avoided emissions of the final product, as well as their transportation and investment costs. The main objective of implementing these models in this study was to minimise costs and conduct an environmental analysis from the beginning to the end of the project implementation.
In order to obtain a more complete view of the system’s feasibility, it was also necessary to consider the impacts generated during the transport stages. These impacts, both economic and environmental, were included in the modelling by estimating emissions and costs associated with the movement of resources between regions. Specifically, emissions from transport logistics (t CO2 eq/t.100 km) were estimated based on the type of mode of transport used to move resources. In addition, the transport costs of hydrogen gas, ammonia, vinasse, ethanol, biomethane and woody biomass (USD/t.100 km) were considered.
For this study, it was decided to use road transportation by trucks due to operational practicality and the distribution infrastructure already consolidated in the state. Based on this choice, transportation costs were estimated for each resource, as detailed in Table 1.
The modal costs for the transportation of each resource were calculated using the ANTT freight calculator [17], taking into account the capacity of the truck and the minimum distance. The cost of transporting woody biomass was calculated based on a truck with a capacity of 40 m3 [18], hydrogen was calculated based on a truck with a capacity of 39.6 m3 at 200 bar [19], ethanol and vinasse were based on a truck with a capacity of 50,000 L [20], and biomethane was based on a truck with a capacity of 5.8 t [21]. Emissions were estimated based on an average diesel consumption of 3 km/L [22] and an emission factor of 0.00266 t CO2/L [23].
In addition to the environmental aspects, an economic evaluation of the system was also carried out, using data on the purchase of resources (water, electricity, ethanol, and biomass) and the revenues associated with the sale of renewable ammonia. The used cost values were obtained from the market prices practiced in Brazil (Table 2).
During resource processing, CO2 emissions occur at each stage of the process. However, as the system evolves and renewable ammonia is obtained as the final product, there is a significant reduction in total CO2 emissions (Table 3).
The costs of the PEM, ASU, and HB electrolyzer units were estimated based on the information in the article by [14]. For a 20-year horizon, the replacement of part of the electrolyzers (specifically the electrodes) at specific points in the project was considered. While the used reference article assumes replacement every 10 years, in this work it was decided to carry out the replacements in the 7th and 14th years, seeking to align maintenance planning with operating costs and the expected longevity of the components The investment costs for the different equipment used in this study were obtained from various sources. For the gasification unit, the data were taken from reference [13]. for the methane steam reformer, from reference [16]. For the ethanol steam reformer, from references [11,12], and for the anaerobic digestion of vinasse, from reference [15]. Based on these studies, the investment values for each piece of equipment were estimated and used to create the reference curve for subsequent linearization. A summary of these costs is shown in Table 4.
Equipment costs for 2017 and 2018 were updated and converted to values corresponding to 2025, using the chemical engineering plant cost index (CEPCI).
A scaling factor was applied to assess the effects of economies of scale, demonstrating that increased production capacity reduced the cost per unit produced. Using Equation (S17) (Supplementary Material S4), cost curves were generated based on the plant capacity index (W = 1 as a reference), considering their inlet and outlet flows. To incorporate these effects into a linear model, the exponential curves were segmented into linear sections, with a maximum deviation of 5%. Each segment represented an operating level, of which only one could be selected in the optimization. The linear coefficients generated (capcostA and capcostB) are represented in Equation (S20) in Supplementary Material S4. Finally, the capital costs were converted into annualized costs, according to Equation (S18) in Supplementary Material S4. The annualization factor (CAF) was calculated based on Equation (S19) in Supplementary Material S4.
Linearizations were performed in parts, segmenting the nonlinear function (Equation (S17) in Supplementary Material S4) into sections (L1, L2, L3, …) approximated by linear functions (Equation (S20) in Supplementary Material S4). For some technologies, such as electrolysis and GS_WGS (level L3) and SMR_ethanol, BD_vinasse, and SMR_CH4 (level L4), complete linearity was assumed to allow for a larger scale of the unit. Capacity limits (w.Min and w.Max) were defined for each level, considering modular plants and lower economies of scale. The choice of intervals was based on a maximum deviation of 5%, and the coefficients for each segment (capCostA and capCostB) are detailed in Supplementary Material S5.
It should be noted that the data was linearized to make it easier for the linear optimization algorithm to read and analyze the model, reducing the processing time and increasing the accuracy of the results.

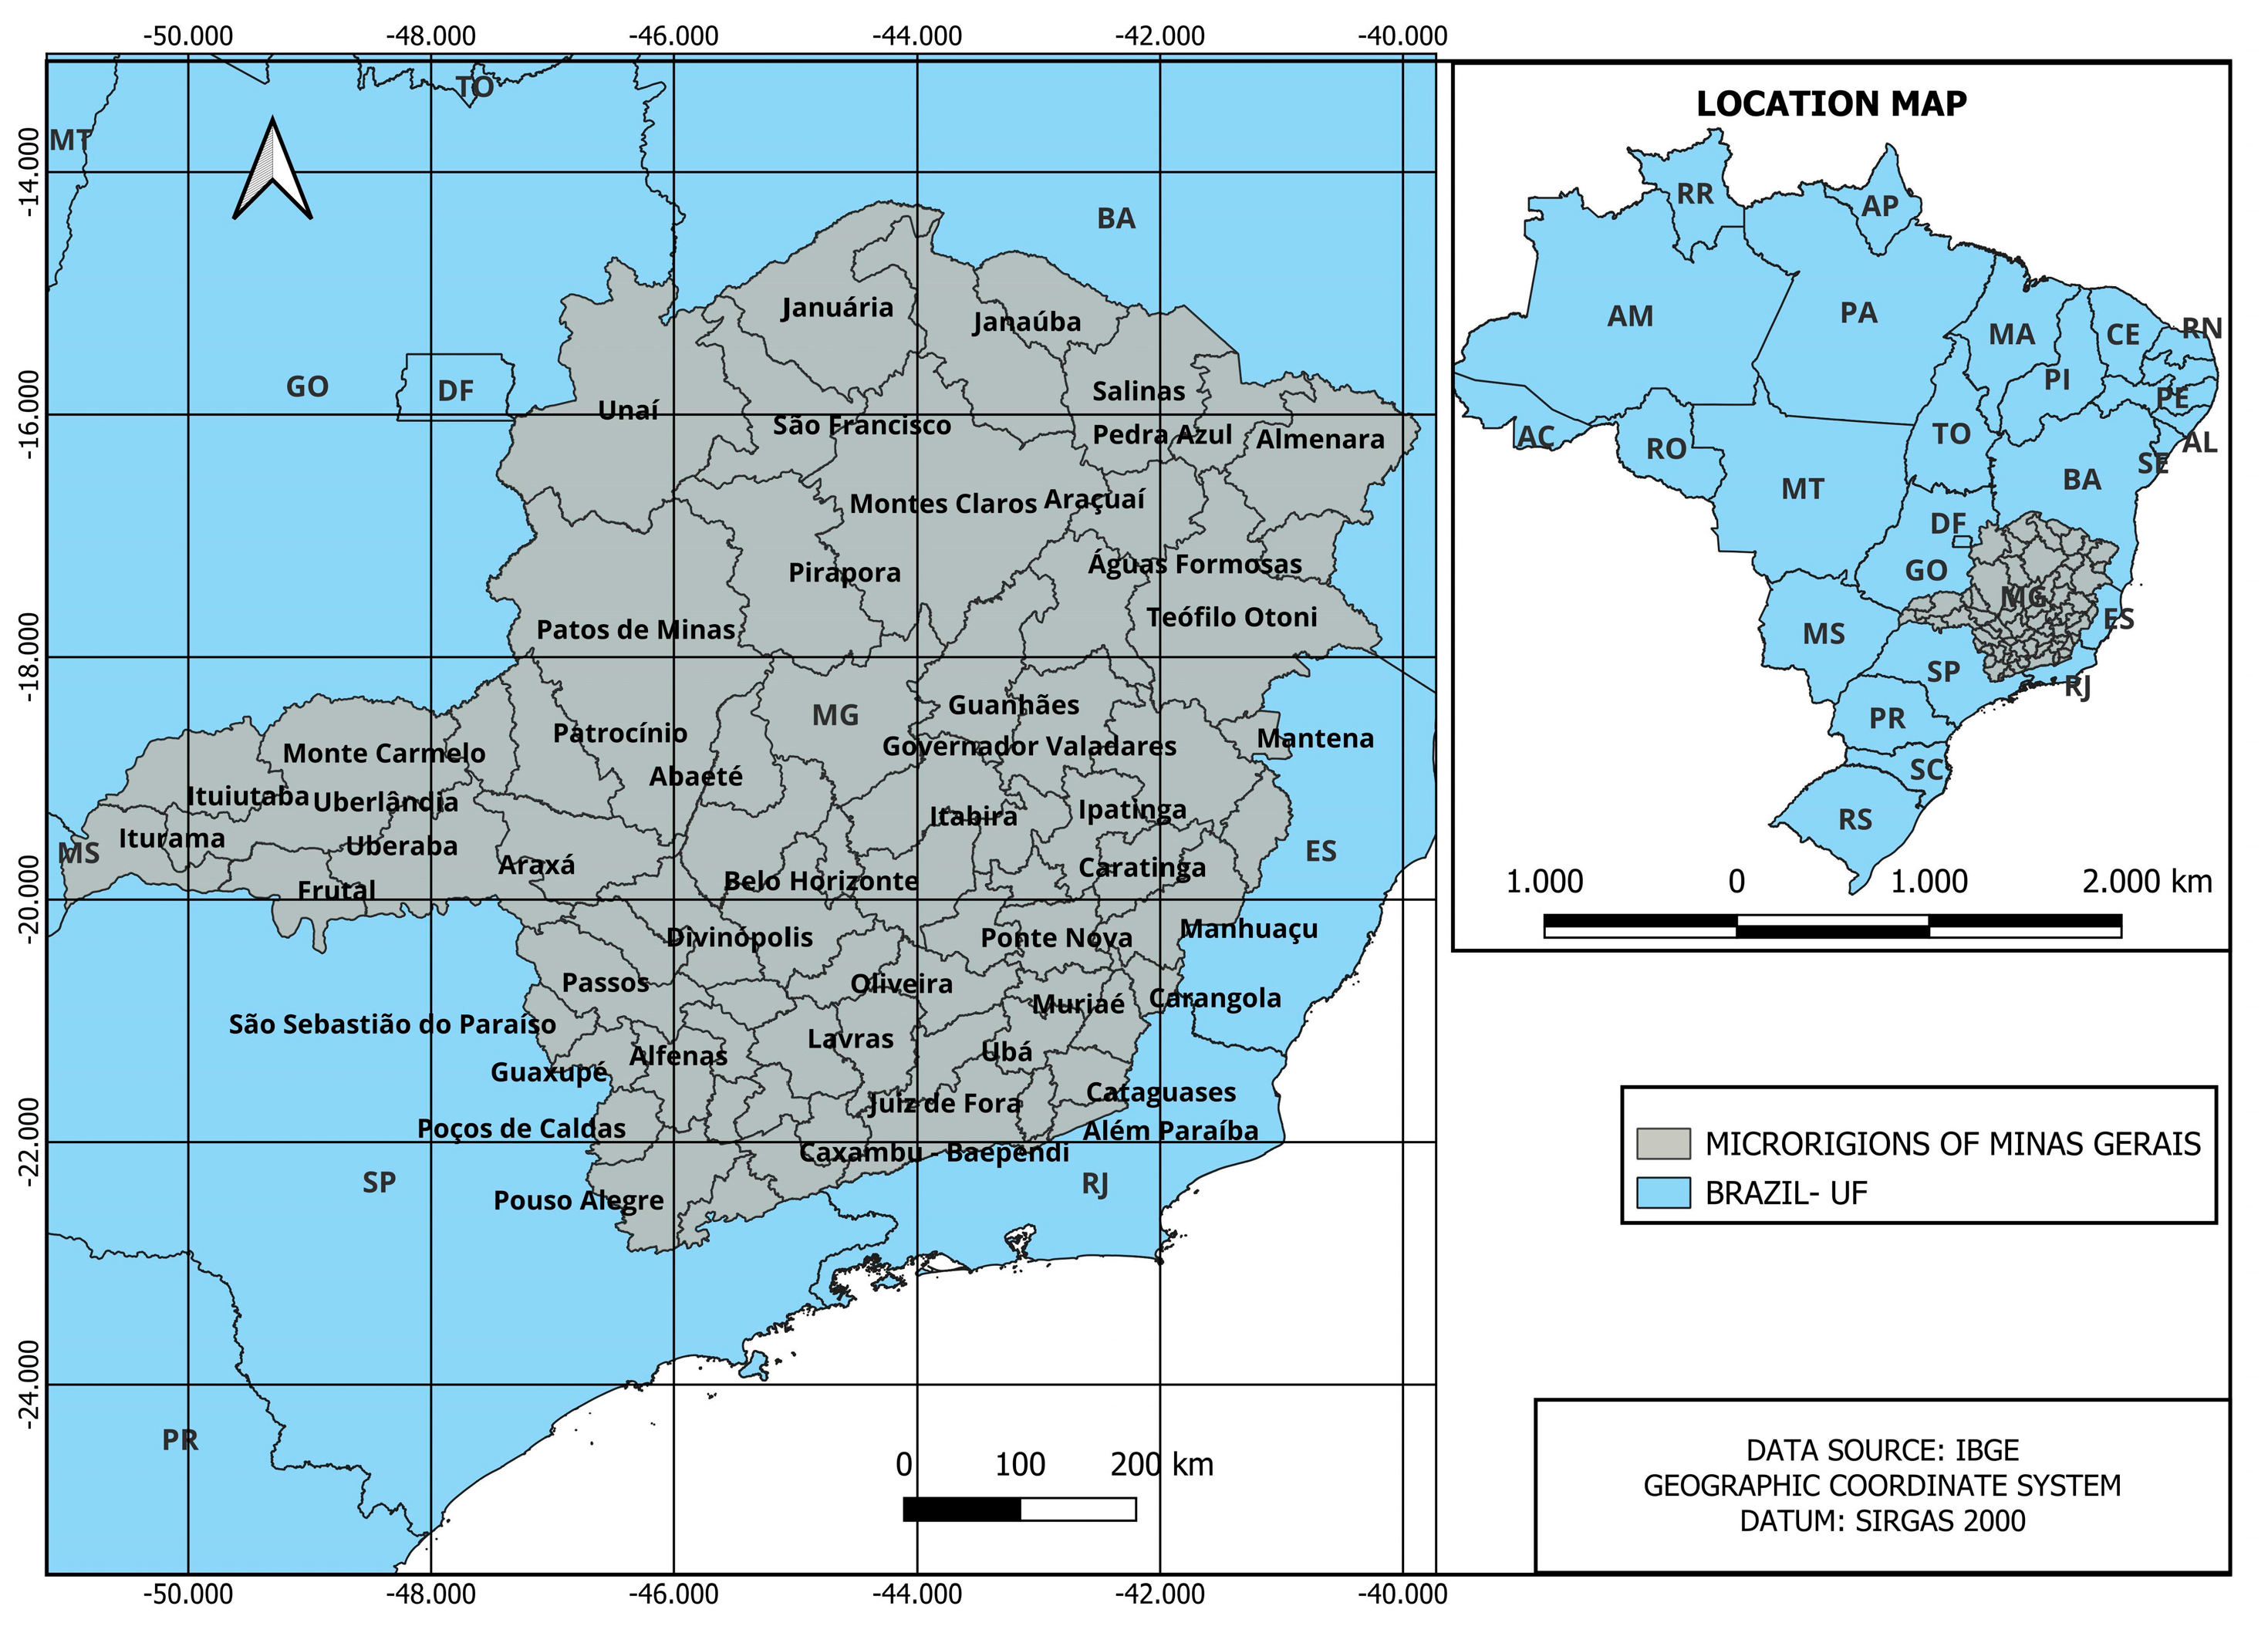
2.4. Regional Logistics Model

The regional logistics model aimed to optimize resource distribution routes, reducing the costs involved in transport and increasing the efficiency of the supply chain. For its implementation, this model took into account the demand for ammonia, the availability of resources in the micro-regions, and the distances between them, in order to guide both production and transport decisions in the optimized system. The optimizer was responsible for strategically selecting where to produce, where to carry out intermediate conversions, and where to transport the resources and final products, based on economic and logistical criteria.
In this work, transport logistics were optimized considering a reference route of 100 km [32], which correlated directly with diesel and energy consumption during the storage, transport, and distribution stages. The road distances between the micro-regions were obtained through a script developed in Python (https://www.python.org/) using the Google Maps platform, allowing the integrated circulation of resources between the micro-regions and supporting the model’s logistical analysis.
This logistical structure was essential to make the study feasible, which covered the state of Minas Gerais, taking into account the 66 micro-regions (Figure 2). The generated information was integrated into the optimization model, allowing the best combinations of ammonia production and distribution to be identified, in order to efficiently meet the expected demand throughout the area studied. Once these logistics had been defined, the demand and availability of the resources needed to run the optimization model were established.

Demand and Availability of Resources

A demand of 200,000 t/year of ammonia was adopted, based on Yara Internacional’s production capacity in Cubatão [33]. Brazil has an installed capacity of 1.406 million tons/year of ammonia [34] whose main production includes ammonia and urea. This production is distributed among three fertilizer plants: one in Bahia, one in Sergipe, and another operated by a subsidiary Araucária Nitrogenados S.A., in Paraná. Thus, the pre-established demand corresponds to 14% of the total production. In addition, a restriction was implemented in the code to ensure that the total production of the active plants did not exceed 200,000 t/year. Tests were carried out with the established demand to analyze the model’s behavior in terms of ammonia production efficiency with a fixed amount of estimated resources and transport. In terms of the availability of resources to meet demand, the estimates of the following resources were fundamental:
  • Water resources—It was assumed that all regions had enough water available for the hydrogen production process and in turn ammonia.
  • Electricity resources—The electricity needed for the processes would be supplied by the available electricity grid. This choice was justified by its practicality and the infrastructure already in place, avoiding the need for additional investment in on-site power generation systems.
  • Wood biomass resources—For the amount of wood that would be used in the gasifier, it was estimated that 25% of the wood biomass planted in each micro-region would be available for hydrogen production. The amount of wood produced by each micro-region (total roundwood, firewood, and charcoal) was taken from [35].
  • Ethanol—The amount of ethanol available was estimated based on the capacities of ethanol production plants located in Minas Gerais [36].
  • Vinasse—The estimate of vinasse was performed considering that the production of 1 L of ethanol generated, on average, 12 L of vinasse [37].
The optimizer included the transport of wood biomass, vinasse, biomethane, ethanol, hydrogen, and ammonia between micro-regions. The transportation of these resources allowed a region to produce a certain resource and then transport it to another region, which would be used for the local production of ammonia.

2.5. Economic Indicators

The analysis of economic indicators covered various quantitative aspects, such as the internal rate of return (IRR), the net present value (NPV), and the discounted payback, providing predictive modeling of the return on investment time.
The net present value (NPV) assessed the financial viability of a project by comparing the present value of future cash flows with the initial investment, using a discount rate (Equation (2)). A positive NPV indicated that the project was financially viable, with higher values representing greater economic benefits. This metric was widely used to estimate the financial return on investments [38].
N P V = d i s c o u n t e d   c a s h   f l o w c o s t   o f   i n v e s t m e n t
The discounted cash flow considered operating costs (including maintenance and raw materials), logistics expenses with transport, and project revenues, incorporating the discount rate to reflect the time value of money.
The internal rate of return (IRR), calculated when the NPV was equal to zero (Equation (3)), indicated the annual return on investment: the higher the IRR, the higher the expected profitability [39].
0 = Σ c a s h   f l o w y e a r 1 + I R R y e a r c o s t   o f   i n v e s t m e n t
The discounted payback indicated the time required to recover the initial investment, considering the time value of money. It was achieved when the accumulated discounted cash flows equaled or exceeded the invested amount. The shorter the payback, the faster the return on investment.
For the optimization process, an ammonia sales price of 1500 USD/t was adopted and set, taking into account that the annual maintenance and operating expenses represented 2.1% of total investment. An interest rate of 6% p.a. was adopted, based on Equation (S20) (in Supplementary Material S4), in 20 years.
The minimum sale price of ammonia was calculated, defined as the lowest value necessary for the NPV to be equal to zero, ensuring the financial balance of the project with a minimum IRR of 30% [40]. This value was obtained through an iterative process, adjusting the price until it met the profitability criteria. The analysis made it possible to assess the economic feasibility and return on investment time, considering all costs involved.

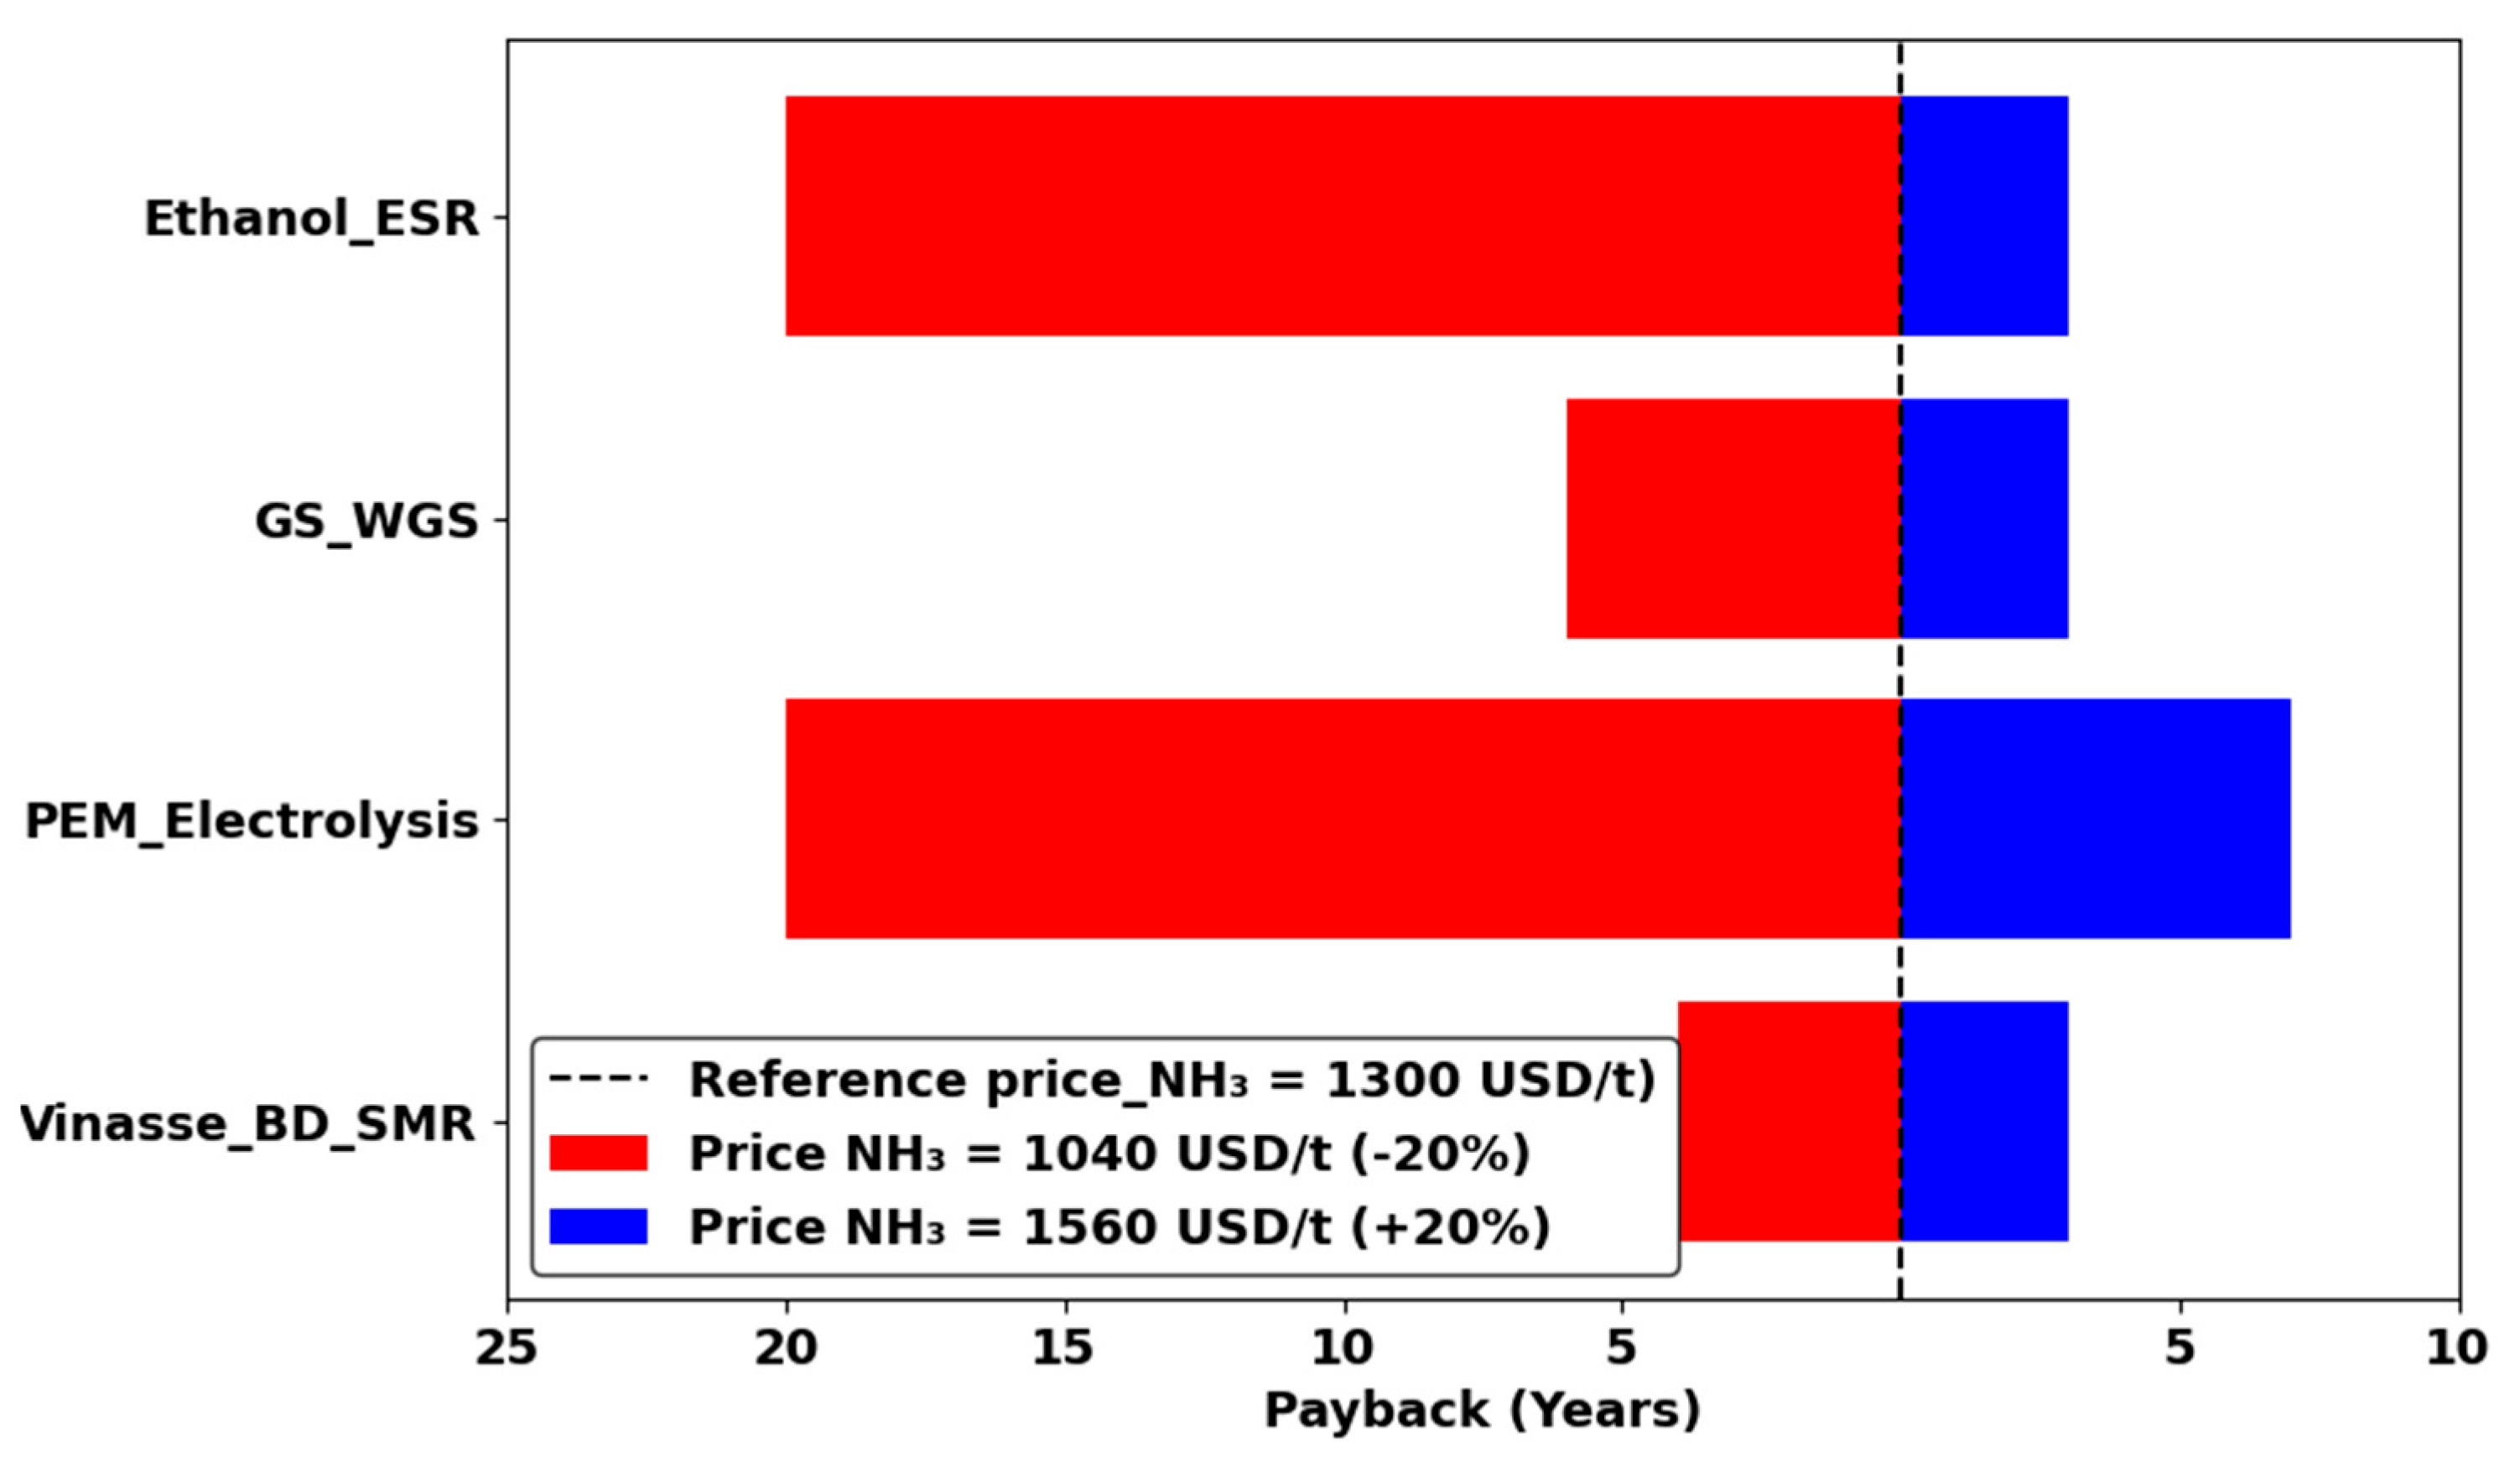
2.6. Sensitivity Analysis

A sensitivity analysis was performed considering variations in IRR and the sale price of ammonia. To assess the impact of the discount rate on economic viability, two scenarios were simulated: IRR of 20% (optimistic scenario, with lower return requirements) and IRR of 40% (conservative scenario, with higher requirements). The objective was to analyse how these variations influence the minimum sale price of ammonia.
The price of 1300 USD/t of NH3, used as a basis in the optimisation stage, was subjected to variations in the sensitivity analysis, with the aim of assessing the economic robustness of the model in different market scenarios. With a fixed IRR of 15%, established based on the Selic rate [41], the analysis sought to understand how these fluctuations impact the project’s return on investment time. This approach allows for the identification of critical feasibility limits and supports strategic decisions in contexts of economic uncertainty.

3. Results and Discussion

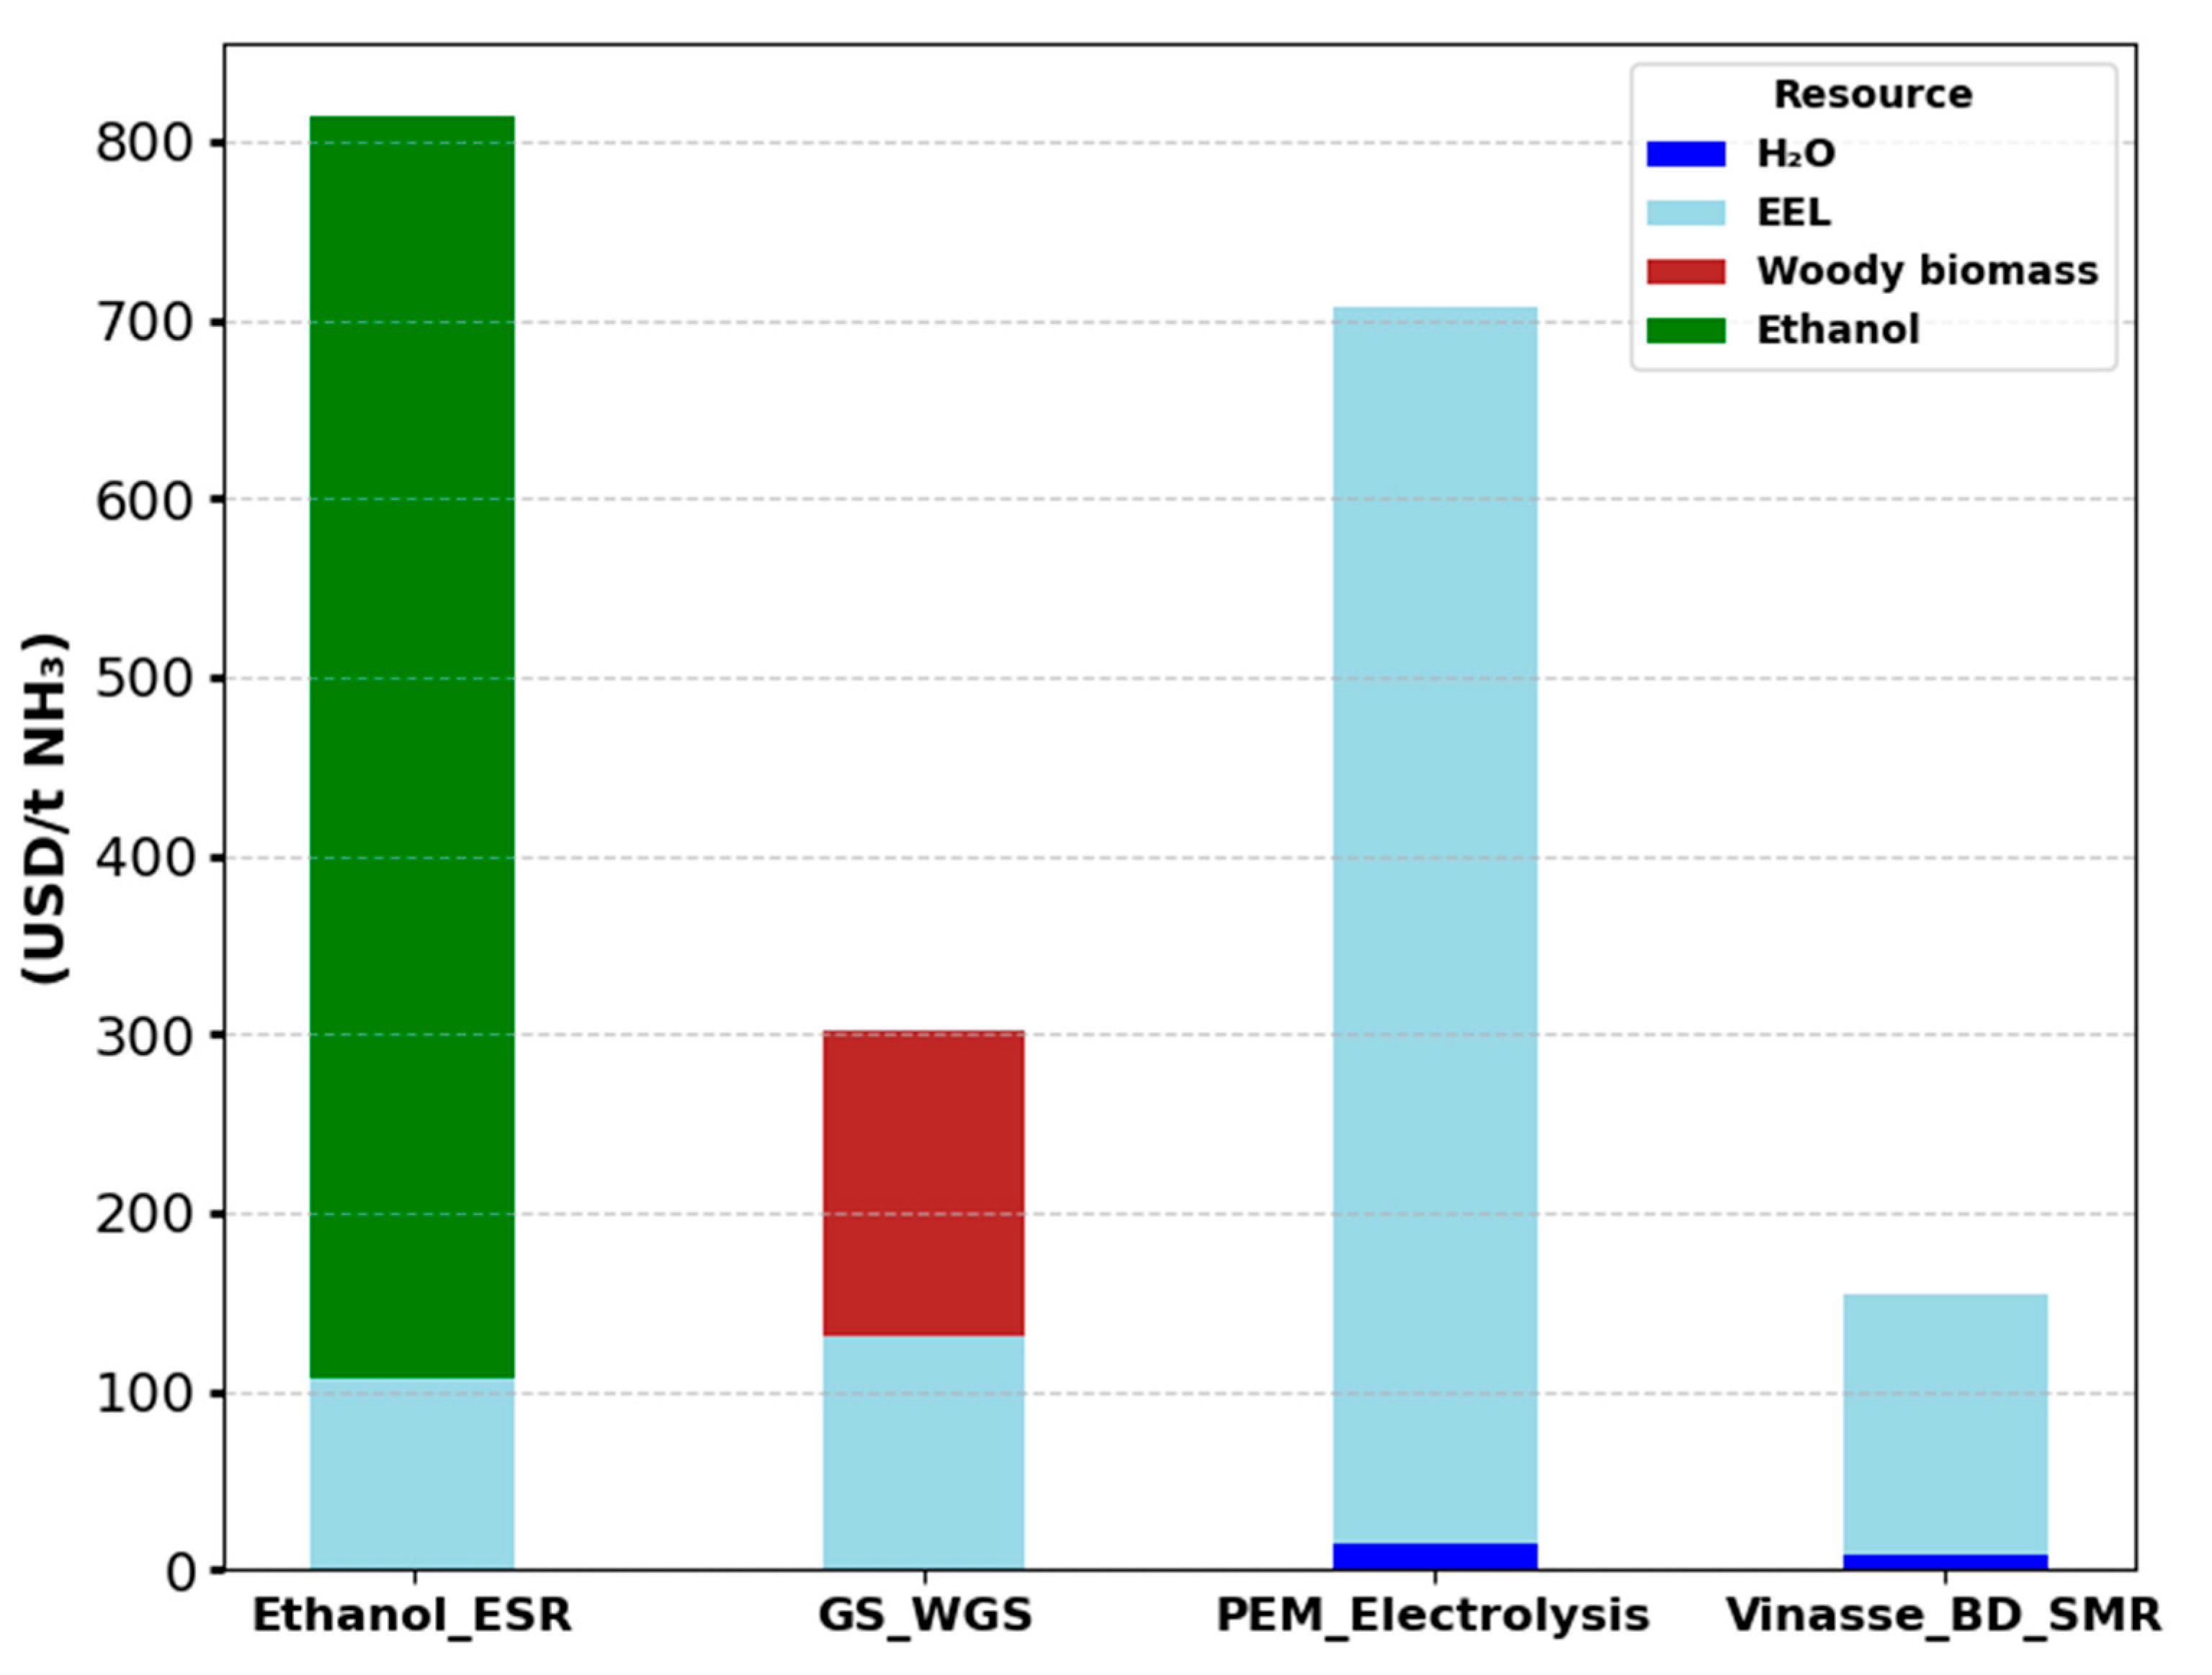
3.1. Results of the Case Study-Optimized Ammonia Production Routes

Based on the objective function aimed at minimizing annualized production costs and the parameters defined in the methodology, the optimization model identified all routes as viable, achieving optimal solutions. Key variables such as transport costs, investment, raw materials, and avoided emissions were then evaluated to understand their influence on the results and the selection of the most advantageous routes.

Economic Analysis

The analysis of the economic and technical results of the technologies analyzed depended on factors such as investment, resource costs and consumption, transport costs (Figure 3), and financial return. All technologies stood out for their competitiveness in consolidated industrial scenarios, mainly due to their relevance in strategies aimed at energy transition and low carbon.
The choice of micro-regions for the installation of ammonia plants was determined by the availability of resources. For technologies based on biomass or waste, such as Vinasse_BD_SMR and GS_WSG, the location was influenced by the proximity of resources. For the PEM_Electrolysis route, however, centralization in Conceição do Mato Dentro was not a determining factor, highlighting that other aspects, such as production efficiency, prevailed.
The PEM_Electrolysis route had the highest operating costs (68.3 USD/t NH3) and the highest annualized investment (278 USD/t NH3), as shown in Figure 3. These values reflected the high costs of infrastructure and specialized equipment. Although production was centralized, eliminating logistics costs, the route faced economic challenges that compromised its competitiveness.
For GS_WSG, the annualized investment was 213 USD/t NH3, due to the infrastructure for pre-processing and gasification of woody biomass. Logistics costs (25.5 USD/t NH3) arose from the transport of large volumes of biomass to the plant in Capelinha. Centralization promoted gains in scale and logistical control, but economic viability depended heavily on the price of biomass. This aspect was reinforced by [42], who identified biomass as the main financial determinant in gasification, with high sensitivity to the price of raw materials. Ref. [43] also highlighted forest residues as the largest contributor to operating costs, accounting for more than 30% of total production costs. These studies corroborate the conclusion that although technically feasible, the GS_WSG route has significant economic weaknesses depending on the price of biomass.
The Vinasse_BD_SMR route, centered in Uberaba, had reduced logistics costs (16.6 USD/t NH3), favored by the proximity of vinasse. However, operating and investment costs remained high due to the complexity of the process and the demand for maintenance and labor. Ref. [44] identified a similar scenario in their technical–economic and environmental assessment, with high investments, especially in the anaerobic digestion stage, and operating costs strongly impacted by electricity consumption, which represented 79% of utilities. Despite this, the use of low-cost waste, such as cattle manure, is pointed out as a competitive advantage, which is also verified in this study.
Finally, the Ethanol_ESR route stood out for its lower operating cost (30.3 USD/t NH3), benefiting from the ample supply of ethanol and existing infrastructure. Centralization in Uberlândia eliminated logistics costs between micro-regions. Ref. [10], when evaluating renewable hydrogen routes for ammonia production in São Paulo, also identified ethanol reforming as more efficient in logistical and structural terms than the biomethane-based route. These findings reinforced the technical and economic feasibility of the Ethanol_ESR route, positioning it as a competitive alternative to conventional ammonia production from fossil sources.
Each of these routes and their respective costs was influenced by resource consumption, a crucial factor in meeting demand and the economic viability of the system, as can be seen in Figure 4.
The Ethanol_ESR technology had the highest raw material cost (815 USD/t NH3), reflecting the intensive use of ethanol, a high-cost input. Only 4.1% of regional availability was consumed, indicating ample room for expansion. Despite the high demand for ethanol, our results differed from those of [45], where lower ethanol consumption was observed, which could be explained by the difference in considered cost, 0.431 USD/L in the cited study, compared with 0.77 USD/L adopted in this work.
The PEM_Electrolysis route had the second highest raw material cost (707 USD/t NH3), influenced by the high electricity consumption required by the electrolysis process. Ref. [46] analyzed the levelized cost of hydrogen (LCOH) in a plant with an integrated heat recovery system, demonstrating that the price of electricity strongly impacted the LCOH. When energy was cheap, as in wind sources, the recovery system became economically unviable. In scenarios with more expensive grid energy, however, the system proved to be advantageous. Similarly, Ref. [47] analyzed the economic viability of power-to-gas systems with PEM electrolysis in Japan and observed that the integration between solar photovoltaic energy and the spot energy market resulted in the lowest hydrogen production costs. These studies confirmed that the competitiveness of the electrolysis route depended not only on technological advances but also on falling equipment prices, component durability, and access to affordable renewable energy.
The Vinasse_BD_SMR route had the lowest raw material cost, using about 44% of regional availability. The use of an abundant industrial waste product, such as vinasse, significantly reduced costs and made the route attractive in regions with a strong sugar and alcohol industry presence. Ref. [44] also highlighted this advantage, even in the face of high initial investments, reinforcing its long-term economic viability.
The GS_WSG route consumed only 3.1% of the regional supply of woody biomass, demonstrating the viability of the supply. Ref. [48] estimated that about 20% of tree mass was composed of forest residues, which would allow demand to be met without resorting to primary biomass. In addition, the use of forest by-products was in line with the principles of the circular economy, contributing to the reduction in environmental impacts. Despite the logistical and operational advantages of the ethanol-based route, the data in Figure 4 indicate that vinasse technology offered the best balance between total cost and sustainability. Strategies such as expanding vinasse collection and optimizing biodigestion could further increase its competitiveness.
Figure 5 shows the distribution of total investment among the main units of the process, ASU, Haber–Bosch, and hydrogen production technologies, allowing us to identify which stages required the most financial resources.
The Ethanol_ESR route had the lowest total investment (149 million USD) due to the existing infrastructure and the technological maturity of ethanol reform. The consolidation of this technology in the market reduced the need for initial investments, making it more accessible. In contrast, PEM_Electrolysis technology required the highest investment (508 million USD), reflecting the complexity of proton exchange membrane electrolyzers and the associated infrastructure.
The GS_WSG route ranked second in terms of initial investment, requiring robust infrastructure for biomass transport, handling, and gasification, as well as auxiliary systems to ensure safety and efficiency. Its viability may depend on public policies and detailed financial planning.
Vinasse_BD_SMR presented a total investment of 308 million USD, distributed among anaerobic digestion (135 million USD), methane reforming (173 million USD), ASU (26 million USD), and Haber–Bosch (112 million USD). Despite the high investment cost associated with this technology, justified by the multiple processing stages and operational complexity resulting from monitoring the anaerobic digestion process and transport logistics, the use of agro-industrial waste makes this alternative advantageous from a sustainability perspective.

3.2. Economic Indicators and Minimum Ammonia Sales Price

Analysis of economic indicators showed that among the routes evaluated, PEM_Electrolysis had the highest initial investment, the lowest NPV (262 million USD), an IRR of 22%, and the longest payback period (8 years). Although less attractive, this technology may become competitive in markets that value high purity and a low carbon footprint. Ref. [49], when studying green ammonia production in Chile with electrolysis powered by renewable sources, identified similar results, an IRR of 17% and a payback of 7.6 years, confirming that the viability of this route depends on reducing both resource and equipment costs for its implementation.
In contrast, Vinasse_BD_SMR demonstrated the best performance, with an NPV of 1159 million USD, an IRR of 58%, a payback period of 2 years, and the lowest minimum sale price (891 USD/t NH3). The use of vinasse, a low-cost by-product, significantly reduced production costs and promoted the sustainability of the process.
The Ethanol_ESR and GS_WGS routes showed intermediate performance. Ethanol_ESR had a minimum price of 1278 USD/t NH3 and an NPV of 534 million USD, benefiting from the ample supply of inputs and existing infrastructure. GS_WGS reached 1129 USD/t NH3 and a NPV of 906 million USD, standing out for its use of woody biomass. Both had a payback period of about 3 years. Ref. [50], when evaluating biomass gasification for green ammonia in Portugal, reported a higher payback period (5.8 years), which reinforces the good results obtained in this study for GS_WGS.
Despite the economic advantages, biomass- and waste-based routes require attention to regional factors. Biomass demands sustainable forest management, and vinasse requires territorial concentration, which may limit its scalability. These aspects must be considered in regionalized implementation plans.
Table 5 presents the economic feasibility indicators for each technology, considering the NPV, discounted payback, production cost, initial investment, and minimum sale price of ammonia compatible with an IRR of 30%.
In terms of selling price, all the analyzed technologies had values within the gray ammonia cost range, which varied between 361 and 1300 USD/t [51], with the exception of the electrolysis_PEM technology, due to the high investment and operating costs. However, these technologies stood out for being low-carbon alternatives, in line with the growing demands for more sustainable solutions with less environmental impact. This makes them relevant in a global context that is seeking decarbonization and the transition to cleaner industrial practices, reinforcing their strategic importance from both an environmental and an economic point of view.

3.3. Results of Sensitivity Analysis

The sensitivity analysis in this study was conducted on two fronts, variation in IRR and ammonia sales price, with the aim of assessing their impacts on the minimum price required for economic viability and on the payback period (discounted payback). Despite the relevance of these parameters for investment decisions, there are few studies in the literature that directly address these effects. Most focus on the influence of input costs (electricity, biomass, and water) on the levelized cost of hydrogen (LCOH). Thus, this analysis represents an additional contribution to the debate, considering an investor-oriented perspective and financial risk scenarios.
Figure 6 shows that, with an IRR of 20%, the PEM_Electrolysis route had the highest minimum price (1439 USD/t NH3) due to its high operating and capital costs, especially for electricity and electrolyzers. Even so, it obtained the highest NPV (185 million USD), showing profitable potential in markets willing to pay for low-carbon ammonia.
The Ethanol_ESR route had an intermediate minimum price (1139 USD/t NH3), affected by the high cost of ethanol acquisition. The GS_WGS and Vinasse_BD_SMR routes obtained the lowest prices (890 USD/t and 677 USD/t NH3), due to the use of low-cost raw materials, with NPVs of 142 million USD and 128 million USD, respectively, demonstrating economic viability and lower sensitivity to IRR variation.
With the IRR raised to 40%, minimum prices increased across all routes. PEM_Electrolysis reached 2069 USD/t NH3, showing high sensitivity to capital costs. On the other hand, Vinasse_BD_SMR maintained the lowest price (1112 USD/t NH3), indicating greater economic resilience. The Ethanol_ESR and GS_WGS routes remained in intermediate ranges (1420 and 1374 USD/t NH3), maintaining competitiveness in regions with good availability of inputs.
These results show that the fixed and operating cost structure distinctly affected each route according to the required IRR, which was crucial for guiding investment decisions under different risk scenarios.
A sensitivity analysis was also performed considering the sale price of ammonia in two scenarios, a 20% reduction (1040 USD/t NH3) and a 20% increase (1560 USD/t NH3), assessing the impact on the payback period (Figure 7).
With the reduction, the PEM_Electrolysis and Ethanol_ESR technologies became unfeasible, with payback exceeding the project’s useful life (20 years) and negative NPV, highlighting the strong dependence of these routes on high prices for economic viability.
In contrast, the GS_WGS and Vinasse_BD_SMR routes remained viable even with the reduced price, with paybacks of 6 and 4 years, respectively. Although the payback period for GS_WGS is slightly above ideal (5 years), it can still be considered acceptable in larger projects.
In the optimistic scenario, with a 20% increase in the sale price (1560 $/t NH3), the Etanol_ESR, GS_WGS and Vinasse_BD_SMR technologies presented positive NPV and a payback period of 3 years, standing out as attractive alternatives. PEM_Electrolysis, although viable in this scenario, had the longest payback period (7 years) due to high operating and investment costs.
The analysis reinforces that the sale price of ammonia is a determining factor for the attractiveness of the projects. However, biomass-based routes show less sensitivity to these variations, offering greater economic stability in different market scenarios.

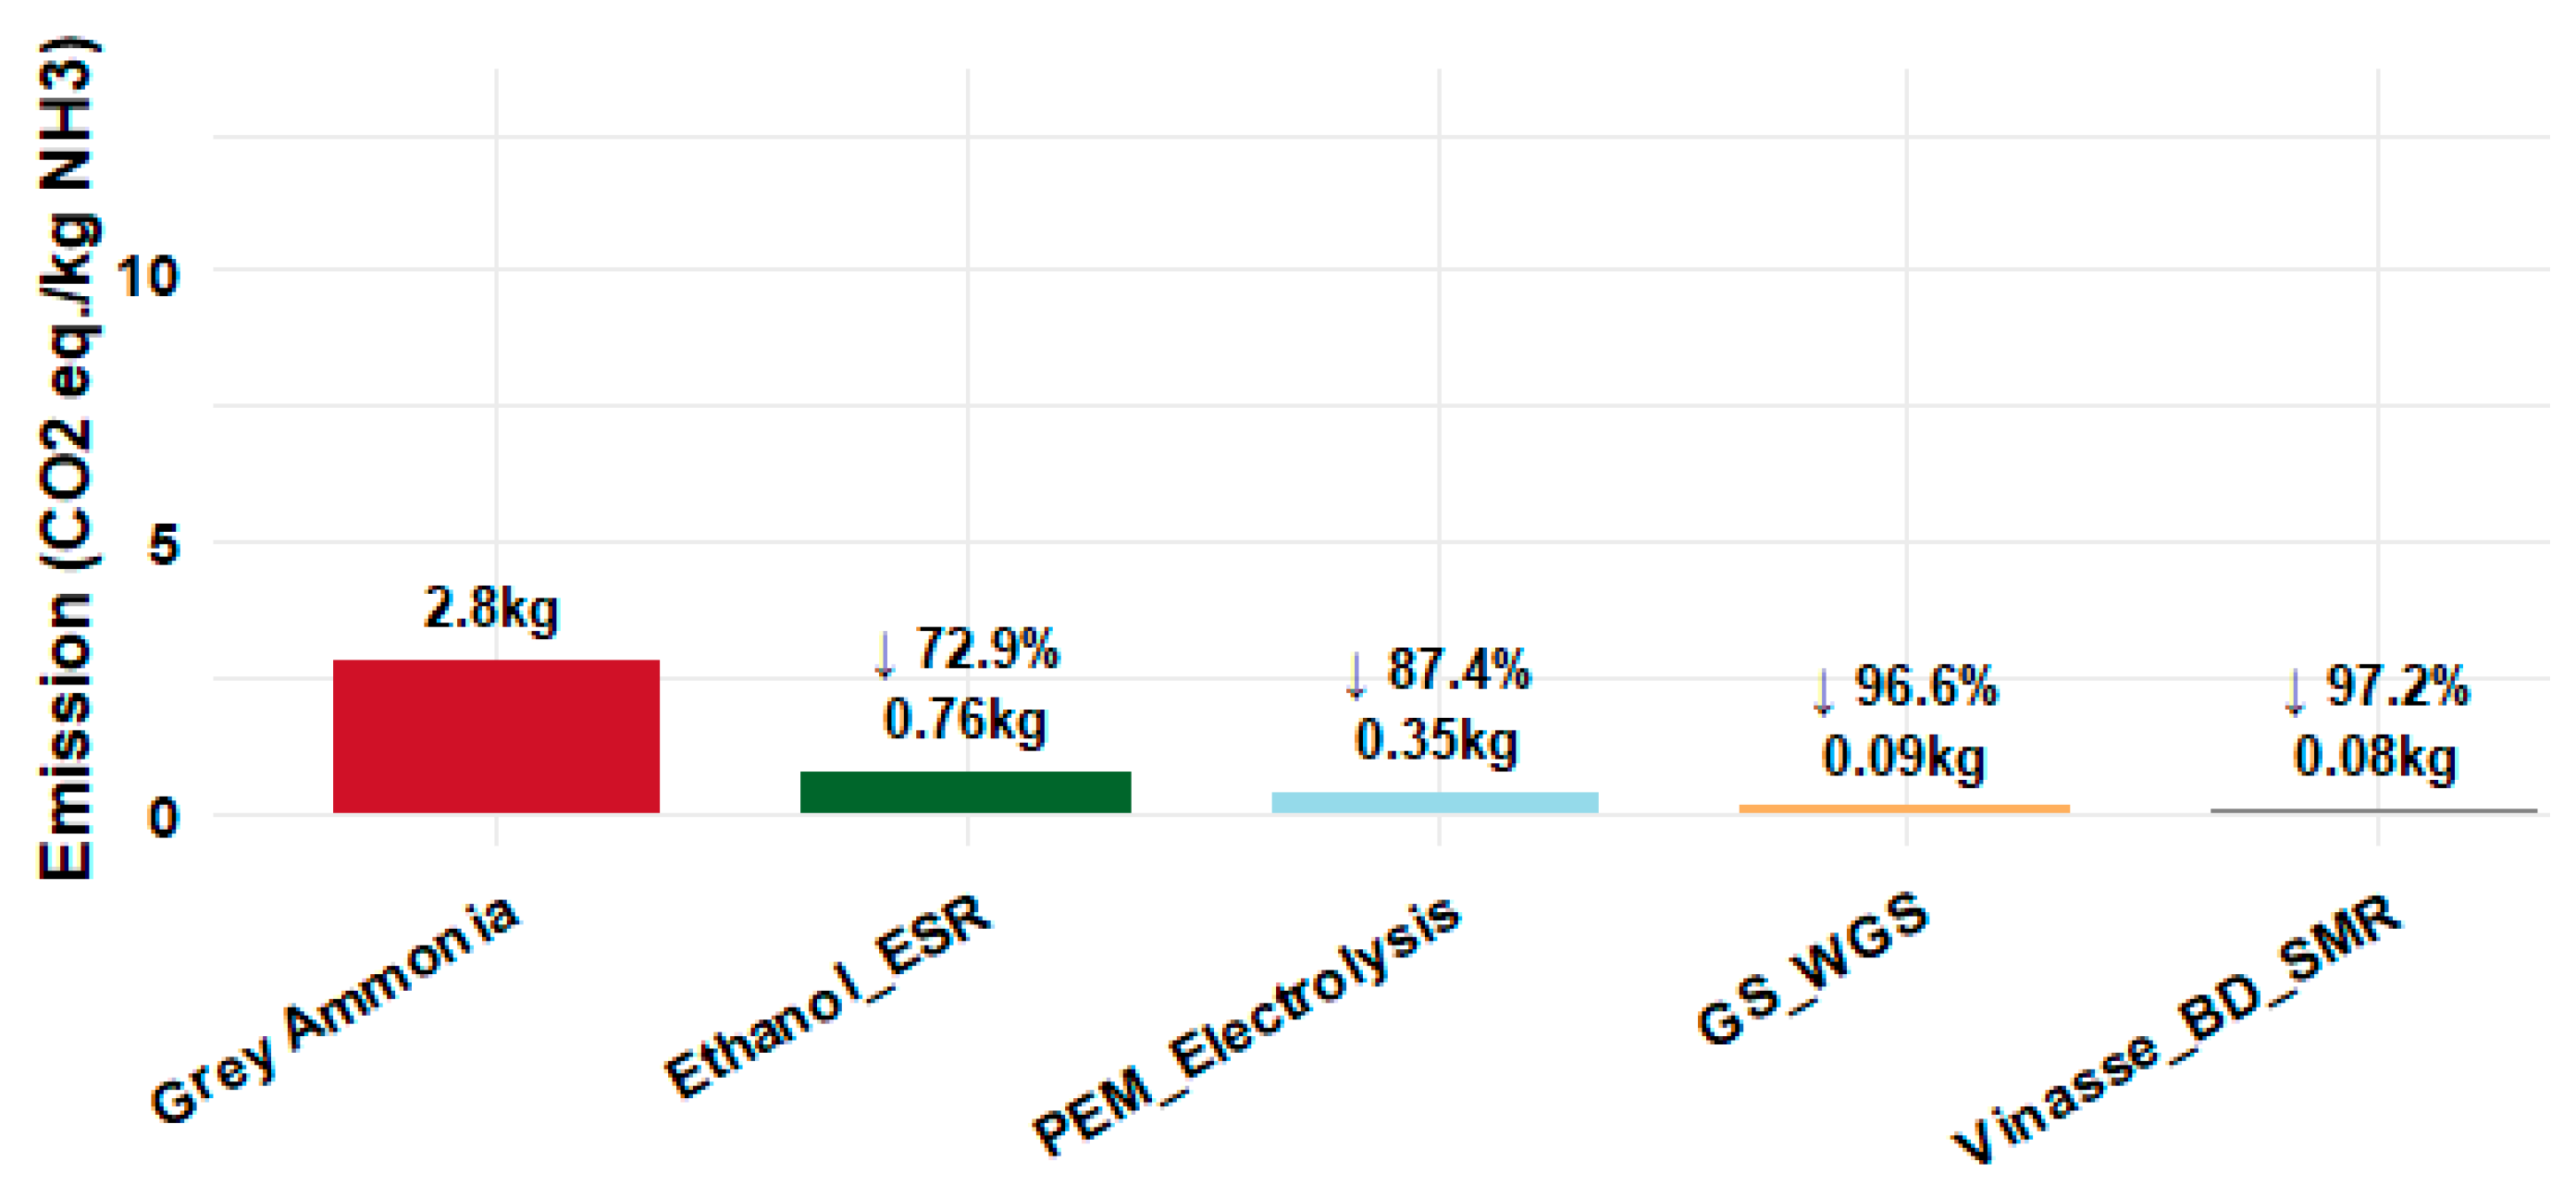
3.4. Environmental Analysis

Figure 8 shows the emissions generated and avoided by renewable hydrogen production technologies for ammonia synthesis.
The highest total emissions were observed in the Ethanol_ESR route, totaling 151,876 t CO2 eq/year, due to the ethanol production chain, which included agricultural cultivation, use of inputs, transport, and the steam reforming stage. Specifically, this was the most emissive technology per tonne of ammonia produced, with 0.759 kg CO2/kg NH3. Even so, this route represented a 73% reduction in emissions compared with conventional ammonia production from natural gas (2.8 kg CO2/kg NH3 [31]).
PEM_Electrolysis technology had the second highest emissions (70,642.5 t CO2 eq/year), mainly due to high energy consumption and the carbon footprint of the electricity matrix. Even when partially powered by renewable sources, this route still depended on electricity from mixed sources, impacting the emissions balance. In addition, the production of electrolyzers required critical metals such as platinum and iridium. Despite this, the technology emitted 0.353 kg CO2/kg NH3, a reduction of 87% compared with gray ammonia.
The Vinasse_BD_SMR and GS_WGS routes had the lowest emission levels: 15,921.5 and 18,835.7 t CO2 eq/year, respectively. The former benefited from low transport demand and the reuse of agro-industrial waste, while the latter used woody biomass. Both showed significant reductions of 75% for vinasse and up to 97% for GS_WGS compared with the conventional route.
In total, the analyzed technologies avoided approximately 580,000 t CO2 eq/year, representing a 13% reduction in emissions from the nitrogen fertilizer sector in Brazil [52]. This contribution was significant for industrial decarbonization.
In the context of Brazil’s targets in the Paris Agreement (43% reduction by 2030), the adoption of these green ammonia routes represented a viable strategy to reduce sectoral emissions and advance the energy transition, in accordance with the guidelines of the National Plan on Climate Change.

4. Conclusions

The availability of raw materials, especially woody biomass and vinasse residues, and the efficiency of transport logistics proved to be decisive factors for the economic viability of renewable ammonia production routes. The results indicated that each technology had specific advantages and limitations, and the choice of technology depended on the regional context and market conditions.
The PEM_Electrolysis route, although environmentally promising with emissions 87% lower than those of gray ammonia, required the highest investment and had the highest costs, with a slower financial return. Ethanol_ESR stood out for its lower initial investment and simplified process but with high input costs, making its viability sensitive to fluctuations in ethanol prices. Vinasse_BD_SMR was the most advantageous route in economic terms, with the lowest raw material cost, a payback period of only two years, and excellent use of agro-industrial waste. GS_WGS also performed well but required attention to biomass supply logistics.
The sensitivity analysis showed that variations in the internal rate of return (IRR) and the sale price of ammonia strongly affected the viability of the routes. Biomass-based technologies, however, showed greater economic stability, being less vulnerable to these factors.
From an environmental perspective, all analyzed routes showed avoided emissions greater than those generated, totaling 580,000 t CO2 eq/year, equivalent to 13% of the annual emissions of the nitrogen fertilizer sector in Brazil. This demonstrated the concrete potential of these technologies in industrial decarbonization.
Thus, the results reinforce the strategic role of low-carbon ammonia in Brazil’s energy transition. To expand its adoption, it is essential to integrate economic incentives, regional planning, and public policies aimed at industrial sustainability. The production of renewable ammonia not only contributes to the country’s climate goals but also represents a viable and scalable solution for decarbonizing an emission-intensive sector.

Supplementary Materials

The following supporting information can be downloaded at https://www.mdpi.com/article/10.3390/pr13072211/s1: Detailed information on the following aspects can be found in the Supplementary Material: Supplementary Material S1—Objective function variables; Supplementary Material S2—Constraints; Supplementary Material S3—Physical models; Supplementary Material S4—Investment equations; Supplementary Material S5—Linearization coefficients.

Author Contributions

Conceptualization, H.K., A.V.E., V.F.G., J.E.I.C., E.H.Z., D.J.R.O., and T.M.R.; methodology, H.K., A.V.E., and V.F.G.; software, A.V.E. and V.F.G.; validation, A.V.E., H.K., and V.F.G.; formal analysis, H.K., A.V.E., and E.H.Z.; research, H.K. and A.V.E.; resources, A.V.E.; data curation, A.V.E. and H.K.; preparation of the original draft, H.K., A.V.E., E.H.Z., V.F.G., J.E.I.C., D.J.R.O., and T.M.R.; proofreading and editing of the text, A.V.E. and H.K.; visualization, H.K. and E.H.Z.; supervision, A.V.E. and D.J.R.O.; project administration, A.V.E.; obtaining funding, A.V.E. All authors have read and agreed to the published version of the manuscript.

Funding

This research was funded by the Fundação de Amparo à Pesquisa do Estado de Minas Gerais (FAPEMIG), grant number RED-00090-21, and CNPq, grant numbers 405602/2023-5 and 442025/2023-8.

Data Availability Statement

The original contributions presented in this study are included in the article/Supplementary Material. Further inquiries can be directed to the corresponding author.

Acknowledgments

The authors gratefully acknowledge the financial support provided by CNPq and FAPEMIG, which was essential for funding graduate students and supporting the research projects that contributed to this study. The authors also extend their gratitude to the Laboratory of Energy Systems Modeling at the School of Engineering (EENG), Federal University of Lavras (UFLA), for providing the necessary infrastructure and technical assistance.

Conflicts of Interest

The authors declare no conflicts of interest.

Abbreviations

The following abbreviations are used in this manuscript:
BDBiodigestion
WGSWater–gas shift reaction
MILPMixed-integer linear programming
TMetric ton
NPVNet present value
DFBDual fluidized bed
PSAPressure swing adsorption
IRRInternal rate of return
SMRSteam methane reforming
CEPCIChemical engineering plant cost index
ASUAir separation unit
LCOHLevelized cost of hydrogen

References

  1. Chehade, G.; Dincer, I. Progress in Green Ammonia Production as Potential Carbon-Free Fuel. Fuel 2021, 299, 120845. [Google Scholar] [CrossRef]
  2. Lima, L.C.; Patrício, R.A.; Silva, C.D.N.; Batista, E.N.; De Oliveira, E.E.S.; Morais, F.H.B.D.L. Hidrogênio Solar-Eólico Para A Produção de Fertilizantes Nitrogenadosno Estado do Ceará. In Proceedings of the Congresso Brasileiro de Energia Solar, Fortaleza, Brazil, 1–5 June 2020. [Google Scholar]
  3. Liu, X.; Elgowainy, A.; Wang, M. Life Cycle Energy Use and Greenhouse Gas Emissions of Ammonia Production from Renewable Resources and Industrial By-Products. Green Chemistry 2020, 22, 5751–5761. [Google Scholar] [CrossRef]
  4. Ye, D.; Tsang, S.C.E. Prospects and Challenges of Green Ammonia Synthesis. Nat. Synth. 2023, 2, 612–623. [Google Scholar] [CrossRef]
  5. Matthew, C.; Spataru, C. What Drives the Viability of Waste-to-Energy? Modelling Techno-Economic Scenarios of Anaerobic Digestion and Energy Generation for the Scottish Islands. J. Clean. Prod. 2023, 410, 137306. [Google Scholar] [CrossRef]
  6. Kargbo, H.O.; Ng, K.S.; Phan, A.N. Evaluation of the Economic Feasibility of a Two-Stage Gasification System for Hydrogen, Liquid Fuels and Energy Production from Residues. Energy Convers. Manag. 2022, 253, 115126. [Google Scholar] [CrossRef]
  7. Riera, J.A.; Lima, R.M.; Knio, O.M. A Review of Hydrogen Production and Supply Chain Modeling and Optimization. Int. J. Hydrogen Energy 2023, 48, 13731–13755. [Google Scholar] [CrossRef]
  8. Gholizadeh-Roshanagh, R.; Zare, K.; Marzband, M. An A-Posteriori Multi-Objective Optimization Method for MILP-Based Distribution Expansion Planning. IEEE Access 2020, 8, 60279–60292. [Google Scholar] [CrossRef]
  9. Mohammed, A.; Ghaithan, A.M.; Al-Hanbali, A.; Attia, A.M. A Multi-Objective Optimization Model Based on Mixed Integer Linear Programming for Sizing a Hybrid PV-Hydrogen Storage System. Int. J. Hydrogen Energy 2023, 48, 9748–9761. [Google Scholar] [CrossRef]
  10. Garcia, V.F.; Palacios, R.; Ensinas, A. Optimisation of Ammonia Production and Supply Chain from Sugarcane Ethanol and Biomethane: A Robust Mixed-Integer Linear Programming Approach. Processes 2024, 12, 2204. [Google Scholar] [CrossRef]
  11. Compagnoni, M.; Mostafavi, E.; Tripodi, A.; Mahinpey, N.; Rossetti, I. Techno-Economic Analysis of a Bioethanol to Hydrogen Centralized Plant. Energy Fuels 2017, 31, 12988–12996. [Google Scholar] [CrossRef]
  12. Silva, M.E. Experimental Analysis of Ethanol Steam Reforming: Technical, Economic and Ecological Aspects. Ph.D. Thesis, Sao Paulo State University, São Paulo, Brazil, 2010. [Google Scholar] [CrossRef]
  13. Salkuyeh, Y.K.; Saville, B.A.; MacLean, H.L. Techno-Economic Analysis and Life Cycle Assessment of Hydrogen Production from Different Biomass Gasification Processes. Int. J. Hydrogen Energy 2018, 43, 9514–9528. [Google Scholar] [CrossRef]
  14. Jain, M.; Muthalathu, R.; Wu, X.Y. Electrified Ammonia Production as a Commodity and Energy Storage Medium to Connect the Food, Energy, and Trade Sectors. iScience 2022, 25, 104724. [Google Scholar] [CrossRef] [PubMed]
  15. Fuess, L.T.; de Araújo Júnior, M.M.; Garcia, M.L.; Zaiat, M. Designing Full-Scale Biodigestion Plants for the Treatment of Vinasse in Sugarcane Biorefineries: How Phase Separation and Alkalinization Impact Biogas and Electricity Production Costs? Chem. Eng. Res. Des. 2017, 119, 209–220. [Google Scholar] [CrossRef]
  16. Lewis, E.; McNaul, S.; Jamieson, M.; Henriksen, M.S.; Matthews, H.S.; Walsh, L.; Grove, J.; Shultz, T.; Skone, T.J.; Stevens, R. Comparison of Commercial, State-of-the-Art, Fossil-Based Hydrogen Production Technologies; Technical Report for USDOE Office of Fossil Energy: Washington, DC, USA, 2022. [CrossRef]
  17. ANTT Freight Calculator from the National Land Transport Agency-ANTT. Available online: https://calculadorafrete.antt.gov.br/?Length=4 (accessed on 16 September 2024).
  18. Howitt, C.; Ghaffariyan, M.R. Truck Configurations for Efficient Transportation of Forest Biomass: A Short Literature Review. Silva Balc. 2025, 26, 19–27. [Google Scholar] [CrossRef]
  19. Hunt, J.D.; Salgado, B. Aspectos Sobre o Armazenamento e Transporte de Hidrogênio; GIZ: Bonn and Eschborn, Germany, 2023. [Google Scholar]
  20. Gestran What Is a Tanker Truck and How Is It Regulated? Available online: https://www.gestran.com.br/blog/o-que-e-caminhao-tanque-e-como-e-sua-legislacao (accessed on 29 September 2024).
  21. Gasprom CNG Truck 2024: Maximum Capacity and Efficiency! Available online: https://gasprom.com.br/equipamentos-/carreta-de-gnc/ (accessed on 14 October 2024).
  22. Pimenta, É. Quanto Custa Encher o Tanque de Um Caminhão No Brasil? Available online: https://autopapo.com.br/noticia/quanto-custa-encher-o-tanque-de-um-caminhao-brasil/ (accessed on 16 September 2024).
  23. ECCC Fatores de Emissão e Valores de Referência-Canada.Ca. Available online: https://www.canada.ca/en/environment-climate-change/services/climate-change/pricing-pollution-how-it-will-work/output-based-pricing-system/federal-greenhouse-gas-offset-system/emission-factors-reference-values.html (accessed on 15 May 2025).
  24. DMAE Taxas-Tabela de Preço-DMAE. Available online: http://dmaepc.mg.gov.br/taxas-tabela-de-preco/ (accessed on 17 December 2024).
  25. Sinvespar Sinvespar. Available online: https://www.sinvespar.com.br/noticia/21/quanto-custa-a-energia-eletrica-para-as-industrias-do-brasil (accessed on 18 December 2024).
  26. SIRENE. Available online: https://www.gov.br/mcti/pt-br/acompanhe-o-mcti/sirene (accessed on 19 August 2024).
  27. Mfrural Cavaco de Madeira Biomassa Em Linhares ES à Venda. Compre Direto 756914. Available online: https://www.mfrural.com.br/detalhe/756914/cavaco-de-madeira-biomassa (accessed on 18 December 2024).
  28. ecoinvent Ecoinvent. Available online: https://ecoinvent.org/ (accessed on 19 August 2024).
  29. CEPEA Centro de Estudos Avançados Em Economia Aplicada. Available online: https://www.cepea.esalq.usp.br/br/indicador/etanol.aspx (accessed on 11 December 2024).
  30. Mekonnen, M.M.; Romanelli, T.L.; Ray, C.; Hoekstra, A.Y.; Liska, A.J.; Neale, C.M.U. Water, Energy, and Carbon Footprints of Bioethanol from the U.S. and Brazil. Environ. Sci. Technol. 2018, 52, 14508–14518. [Google Scholar] [CrossRef]
  31. Mayer, P.; Ramirez, A.; Pezzella, G.; Winter, B.; Sarathy, S.M.; Gascon, J.; Bardow, A. Blue and Green Ammonia Production: A Techno-Economic and Life Cycle Assessment Perspective. iScience 2023, 26, 107389. [Google Scholar] [CrossRef]
  32. d’Amore-Domenech, R.; Meca, V.L.; Pollet, B.G.; Leo, T.J. On the Bulk Transport of Green Hydrogen at Sea: Comparison between Submarine Pipeline and Compressed and Liquefied Transport by Ship. Energy 2023, 267, 126621. [Google Scholar] [CrossRef]
  33. Yara Grupo Yara Passa a Produzir Amônia Renovável Em Cubatão|BE News. Available online: https://portalbenews.com.br/grupo-yara-passa-a-produzir-amonia-renovavel-em-cubatao/ (accessed on 18 March 2025).
  34. Petrobras Petrobras Alcança Menor Taxa de Emissões de Gases de Efeito Estufa No Refino. Available online: https://agencia.petrobras.com.br/w/negocio/petrobras-alcanca-menor-taxa-de-emissoes-de-gases-de-efeito-estufa-no-refino (accessed on 20 April 2025).
  35. Produção Da Extração Vegetal e Da Silvicultura|IBGE. Available online: https://www.ibge.gov.br/estatisticas/economicas/agricultura-e-pecuaria/9105-producao-da-extracao-vegetal-e-da-silvicultura.html?=&t=resultados (accessed on 18 December 2024).
  36. ANP Dynamic Ethanol Producers Panel. Available online: https://app.powerbi.com/view?r=eyJrIjoiMmRhZWU2NDUtZWE2Yi00NzI5LWJjMGQtNjIwNjE0MjM0MjEzIiwidCI6IjQ0OTlmNGZmLTI0YTYtNGI0Mi1iN2VmLTEyNGFmY2FkYzkxMyJ9 (accessed on 11 December 2024).
  37. SERGOMEL Sugarcane Vinasse: What It Is and How It Can Be Used. Available online: https://www.sergomel.com.br/vinhaca-de-cana-de-acucar-o-que-e-e-qual-sua-aplicacao- (accessed on 11 December 2024).
  38. Liu, M. Research on Investment Project Evaluation: Comparative Analysis Based on NPV and IRR. Highlights Bus. Econ. Manag. 2024, 24, 1133–1138. [Google Scholar] [CrossRef]
  39. Guimarães, T.; de Carvalho Bittencourt, R.; Carvalho, A.M.M.L.; Valverde, S.R.; da Costa, M.M. Technical-Economic Assessment of 5-Hydroxymethylfurfural Production via Catalytic Hydrothermal Synthesis from Lignocellulosic Forest Residues. Food Bioprod. Process. 2024, 148, 341–352. [Google Scholar] [CrossRef]
  40. Neumann, N.C.; Baumstark, D.; López Martínez, P.; Monnerie, N.; Roeb, M. Exploiting Synergies between Sustainable Ammonia and Nitric Acid Production: A Techno-Economic Assessment. J. Clean. Prod. 2024, 438, 140740. [Google Scholar] [CrossRef]
  41. BCB Banco Central Do Brasil (BCB)-Taxa Selic. Available online: https://www.bcb.gov.br/controleinflacao/taxaselic (accessed on 3 February 2025).
  42. Cormos, C.C. Green Hydrogen Production from Decarbonized Biomass Gasification: An Integrated Techno-Economic and Environmental Analysis. Energy 2023, 270, 126926. [Google Scholar] [CrossRef]
  43. Wang, Y.; Li, G.; Liu, Z.; Cui, P.; Zhu, Z.; Yang, S. Techno-Economic Analysis of Biomass-to-Hydrogen Process in Comparison with Coal-to-Hydrogen Process. Energy 2019, 185, 1063–1075. [Google Scholar] [CrossRef]
  44. Etzold, H.; Röder, L.; Oehmichen, K.; Nitzsche, R. Technical Design, Economic and Environmental Assessment of a Biorefinery Concept for the Integration of Biomethane and Hydrogen into the Transport Sector. Bioresour. Technol. Rep. 2023, 22, 101476. [Google Scholar] [CrossRef]
  45. Khamhaeng, P.; Laosiripojana, N.; Assabumrungrat, S.; Kim-Lohsoontorn, P. Techno-Economic Analysis of Hydrogen Production from Dehydrogenation and Steam Reforming of Ethanol for Carbon Dioxide Conversion to Methanol. Int. J. Hydrogen Energy 2021, 46, 30891–30902. [Google Scholar] [CrossRef]
  46. María Villarreal Vives, A.; Wang, R.; Roy, S.; Smallbone, A. Techno-Economic Analysis of Large-Scale Green Hydrogen Production and Storage. Appl. Energy 2023, 346, 121333. [Google Scholar] [CrossRef]
  47. Yoshida, A.; Nakazawa, H.; Kenmotsu, N.; Amano, Y. Economic Analysis of a Proton Exchange Membrane Electrolyser Cell for Hydrogen Supply Scenarios in Japan. Energy 2022, 251, 123943. [Google Scholar] [CrossRef]
  48. de Meira, A.M.; Nolasco, A.M.; de Souza, E.C.; de Souza, M.P.; Pereira, A.K.S.; Ucella-Filho, J.G.M.; Dias Júnior, A.F. Integrated Municipal Management of Waste from Tree Pruning and Removal. Urban For. Urban Green. 2024, 94, 128238. [Google Scholar] [CrossRef]
  49. Fúnez Guerra, C.; Reyes-Bozo, L.; Vyhmeister, E.; Jaén Caparrós, M.; Salazar, J.L.; Clemente-Jul, C. Technical-Economic Analysis for a Green Ammonia Production Plant in Chile and Its Subsequent Transport to Japan. Renew. Energy 2020, 157, 404–414. [Google Scholar] [CrossRef]
  50. Cardoso, J.S.; Silva, V.; Chavando, J.A.M.; Eusébio, D.; Hall, M.J.; Costa, M. Small-Scale Biomass Gasification for Green Ammonia Production in Portugal: A Techno-Economic Study. Energy Fuels 2021, 35, 13847–13862. [Google Scholar] [CrossRef]
  51. Hein, H. Amônia Verde Já é Tão Competitiva Quanto Combustíveis Fósseis. Available online: https://canalsolar.com.br/producao-de-amonia-verde-ja-e-tao-competitiva-quanto-de-combustiveis-fosseis/ (accessed on 14 October 2024).
  52. SEEG SEEG-Sistema de Estimativa de Emissão de Gases. Available online: https://plataforma.seeg.eco.br/ (accessed on 4 May 2025).
Figure 1. Superstructure of the ammonia production process.
Processes 13 02211 g001
Figure 2. Study area.
Processes 13 02211 g002
Figure 3. Decomposition of costs associated with ammonia production for each hydrogen supply route, including annualized investment, operating costs, and transport costs, in USD/t NH3.
Processes 13 02211 g003
Figure 4. Cost of resources used by renewable hydrogen production technology for ammonia synthesis (USD/t NH3).
Processes 13 02211 g004
Figure 5. Total estimated investment per technology for green ammonia production, for the installation of hydrogen (H2), ammonia (NH3) and nitrogen (N2) production, in millions of USD.
Processes 13 02211 g005
Figure 6. Sensitivity analysis of the minimum sale price of ammonia (USD/t NH3) as a function of the variation in the internal rate of return (IRR) for different routes based on renewable hydrogen in ammonia synthesis.
Processes 13 02211 g006
Figure 7. Sensitivity analysis of payback (in years) for different ammonia production technologies, considering variations of ±20% in the price of ammonia relative to the reference value (1300 USD/t).
Processes 13 02211 g007
Figure 8. CO2 equivalent emissions (kg CO2 eq/kg NH3) in ammonia production by different routes based on renewable hydrogen, compared with the conventional route (gray ammonia); ↓ Indicates the percentage reduction in emissions compared to grey ammonia.
Processes 13 02211 g008
Table 1. Transportation costs and emissions.
ResourceCost (USD/t 100 km)Emissions
(t CO2/t. 100 km)
Hydrogen480.70.134
Ammonia23.80.0065
Biomass
Woody
32.90.011
Biomethane550.015
Vinasse5.30.0018
Ethanol6.70.0022
Table 2. Raw material purchase and issue prices.
ResourcePrice (2024)ReferenceSpecific EmissionReference
Water2.84 USD/t[24]--
Electric energy75.45 USD/MWh[25]0.0385 t CO2 eq /MWh[26]
Woody biomass59.77 USD/t[27]0.00669 t CO2 eq/t[28]
Ethanol612 USD/t[29]0.61 t CO2 eq/t[30]
Table 3. Emissions avoided by replacing fossil fuel products.
ResourceSpecific EmissionReference
Ammonia2.9 t CO2 eq/t[31]
Table 4. Data used in the technical economic evaluation modeling.
EquipmentReference CapacityReference Investment (Co) Million USD (2024)Scaling Factor (α)Reference
PEM1.88 t. H2/h186.650.7[14]
ASU29.63 t. N2/h29.780.6
Haber-Bosch36 t. NH3/h129.800.5
GS_WGS18.9 t H2/h810.440.7[13]
Ethanol_ESR0.0625 t H2/h5.780.7[11,12]
Vinasse_BD_SMR20.126 t H2/h355.690.7[16]
Table 5. Financial analysis of production technologies.
Production TechnologyEthanol_ESRGS_WGSPEM_ElectrolysisVinasse_BD_SMR
Total investment (million USD)286496645445
NPV (million USD)5349062621159
IRR (%)46452258
Discounted payback (years)3382
Production cost (USD/t.NH3)938541985363
Minimum selling price (USD/t.NH3)127811291749891
Disclaimer/Publisher’s Note: The statements, opinions and data contained in all publications are solely those of the individual author(s) and contributor(s) and not of MDPI and/or the editor(s). MDPI and/or the editor(s) disclaim responsibility for any injury to people or property resulting from any ideas, methods, instructions or products referred to in the content.

