Article

The Adsorptive Removal of Paracetamol as a Model Pollutant from an Aqueous Environment Using Activated Carbons Made from Selected Nutshells as Agricultural Waste

by
Beata Doczekalska
1,*,
Krzysztof Kuśmierek
2 and
Andrzej Świątkowski
2
1
Faculty of Forestry and Wood Technology, Department of Chemical Wood Technology, Poznań University of Life Sciences, 60-637 Poznan, Poland
2
Faculty of Advanced Technologies and Chemistry, Institute of Chemistry, Military University of Technology, 00-908 Warsaw, Poland
*
Author to whom correspondence should be addressed.
Processes 2025, 13(7), 2198; https://doi.org/10.3390/pr13072198
Submission received: 29 April 2025 / Revised: 2 July 2025 / Accepted: 3 July 2025 / Published: 9 July 2025

Abstract

In this study, carbon adsorbents obtained from agricultural waste, i.e., walnut, hazelnut, and pistachio nutshells, were investigated for the removal of paracetamol (acetaminophen, 4-hydroxyacetanilide) (PAR) from aqueous solutions. Activated carbons (ACs) were produced via a two-step procedure. In the first step, the carbonization of nutshells was carried out at 600 °C, and in the second step, the chemical activation was carried out at 750 °C using alkaline activators, i.e., NaOH and KOH. For all of the ACs obtained and characterized, PAR adsorption kinetics, the adsorption at equilibrium, and the effects of the solution pH were investigated. All results obtained for each nutshell depend on the type of activating agent used. However, in the case of a given activator, there are differences resulting from the type of raw material. Kinetic and isothermal studies revealed that PAR adsorption follows the pseudo-second-order and the Langmuir models, respectively. The adsorption capacities of the ACs were very high and ranged from 332.2 to 437.8 mg/g. This study highlights the remarkable potential of nutshells as valuable and cost-effective precursors for the production of ACs that can effectively remove paracetamol from water.

1. Introduction

In recent years, there has been increased interest in pharmaceuticals’ circulation (life cycle) and their metabolites in the environment. Numerous studies indicate that some of these compounds—due to their properties, i.e., their biological activity and low susceptibility to biological decomposition—are not removed in classic sewage treatment plants and can be easily transported into the environment along with purified sewage discharged into water and land or composted activated sludge [1,2]. Pharmaceuticals and their metabolites can affect human and animal health by disrupting the hormone function.
Paracetamol (acetaminophen, 4-hydroxyacetanilide) is widely used due to its analgesic and antipyretic properties. It is available by prescription and as an over-the-counter medicine. Paracetamol is only partially removed from polluted water in wastewater treatment plants because conventional wastewater processing techniques, such as biological processes, are not specifically designed for emerging contaminants [3]. Consequently, bioactive molecules in water for human consumption generate long-term toxicological risks, given that the drug can accumulate in adipose tissue to concentrations capable of generating biological activity [4]. For this reason, new research efforts are being made to find novel and efficient water treatment methods. Therefore, much attention is paid to the search for effective techniques for their separation, especially from sewage and other water environments.
Various advanced purification technologies are characterized by the high purification efficiency of selected drugs, and methods such as photocatalytic degradation [5], nanofiltration [6], reverse osmosis [6,7], electrochemical oxidation [8], etc., have been implied. However, these methods often require the selection of complex technological parameters and can be expensive. In addition, they can generate harmful byproducts and exhibit a lower efficiency. Prominent among these methods is the adsorption on activated carbons due to its efficiency, low cost, simplicity, and high performance. The adsorption capacity of pharmaceuticals on various adsorbents, such as activated carbon [9], silica [10], multi-walled carbon nanotubes [11], zeolite [12], clay [13], graphene oxide [14], and chitosan [15], was investigated. Among these materials, activated carbon has gained the most interest due to its widespread use and reported high efficiency under various conditions [16]. Activated carbons are among the most widely used adsorbents because of their versatility and favorable properties, such as their high surface area, porosity, and specific chemical properties, which allow interactions with different chemical compounds. Our research fits into this research trend.
Currently, the raw materials for the production of activated carbons are primarily fossil coals. In recent times, there has been a significant change in the perception of fossil raw materials; the use of which has begun to be negatively evaluated due to their nonrenewable nature, and exploiting these raw materials is now considered to pose a significant burden on the environment. At the same time, increasing attention is being paid to the secondary use of waste raw materials. This reduces costs but also allows for the efficient management of materials whose production has already consumed some resources. A separate and equally important aspect of these activities is to reduce the amount of waste generated. This has resulted in the development of the field of research and the production of activated carbons from agricultural residues, wood, and a range of biomass materials. The literature indicates that the lignocellulosic biomass of agricultural origins has an exceptionally high potential as a raw material for producing activated carbons. Mishra et al. [17] emphasize that the pyrolysis of plant biomass enables the formation of activated carbon with properties suitable for energy and environmental applications. Ukanwa et al. [18] highlight the importance of chemical activation methods in tailoring the pore structure and surface chemistry, depending on the choice of activating agents and process conditions. Gonzalez-García [19] provides a comprehensive overview of synthesis methods and characterization techniques for activated carbon derived from lignocellulosic materials, underlining their wide range of environmental applications, particularly in water and air purification. These reviews confirm that agricultural residues are a promising, sustainable, and low-cost alternative to fossil-based precursors for activated carbon production.
Lignocellulosic biomass is characterized by varying the contents of cellulose, hemicelluloses, and lignin. Each component has a different heat resistance, which can be ranked as lignin > cellulose > hemicelluloses. Typically, during carbonization and activation, the initial volatiles removed come from cellulose and hemicellulose [20,21]. Therefore, the important component, from the point of view of high-temperature processing, is lignin. Lignin is a natural, insoluble polymer that contains aldehydic and carbonyl groups, which make it highly polarized. Literature reports show that by using raw materials containing a large amount of lignin and with a significant content of aromatic components and a high density (nutshells or fruit seeds), it is possible to obtain coals with a strongly developed porous structure with a significant proportion of micro- and mesopores [22].
Considering the aspects described above justifies our choice of nutshells as precursors of activated carbons. This study aimed to develop and evaluate the properties of activated carbons obtained from agricultural waste—walnut, peanut, and pistachio shells—as low-cost and sustainable adsorbents for removing paracetamol from aqueous solutions. The effects of the type of raw material and the activating agent used (NaOH or KOH) on the carbons’ porous structure, adsorption capacity, kinetics, and adsorption isotherms were studied.

2. Materials and Methods

2.1. Reagents and Materials

The paracetamol (acetaminophen, 4-hydroxyacetanilide, commonly known as Tylenol in North America) with 98% purity was obtained from Acros Organics (Geel, Belgium). The structural formulas and key properties of the drug are presented in Table 1. All other high-purity chemicals and reagents were received from Chempur (Piekary Śląskie, Poland).
The shells of walnuts (Juglans regia), pistachios (Pistacia vera), and peanuts (Arachis hypogaea) were used in this study. The shells were dried at 105 °C to a constant weight and ground using an SM100 mill (Retsch GmbH, Haan, Germany) equipped with a 0.5 mm sieve and then carbonized. The shells prepared this way were stored at 20 ± 2 °C, with RH of 60 ± 5%.

2.2. Analysis of Biomass Composition

Particular components of biomass (dry matter) were assayed according to the TAPPI standards (Technical Association of the Pulp and Paper Industry), including (a) cellulose using the Seifert method using an acetylacetone–dioxane mixture [23]; (b) holocellulose using sodium chlorite (TAPPI—T 9 wd-75); (c) lignin by the TAPPI method using concentrated sulfuric acid (TAPPI—T 222 om-06); and (d) the theoretical content of hemicelluloses was calculated as the difference between holocellulose and cellulose.

2.3. Preparation of Activated Carbons

Activated carbons were obtained using a two-step method. In the first stage, the raw material was carbonized, followed by chemical activation. The shells were subjected to the carbonization process in an oxygen-free atmosphere in a muffle furnace (Czylok, Jastrzębie-Zdrój, Poland). The process was carried out under the following conditions: carbonization temperature 600 °C, furnace heating rate 3 °C/min, and holding the carbonizate at the final temperature for 1 h. The carbonizates obtained were activated in a tube furnace (Czylok, Jastrzębie-Zdrój, Poland) in an argon atmosphere (gas flow 20 dm3/h). Two hydroxides, KOH and NaOH, were used as chemical activators. The mass ratio of carbon to activator was 1:4. The activation processes were carried out at 750 °C for 15 min. After the activation process, the carbon products were extracted with an aqueous solution of 2% hydrochloric acid for 8 h, followed by distilled water for 16 h. After the extractions were complete, the activated carbons were dried to a constant weight in a laboratory dryer at 105 ± 2 °C.
Activated carbons obtained from walnut, pistachio, and peanut shells via activation with KOH were designated by the acronyms Wal-KOH, Pis-KOH, and Pea-KOH, respectively. Similarly, ACs obtained through NaOH activation were designated as Wal-NaOH, Pis-NaOH, and Pea-NaOH, respectively.

2.4. Adsorbents Characterization

The porous structure of activated carbons was determined on a Micromeritics ASAP 2020 sorptometer (ASAP 2020, Micromeritics, Norcross, GA, USA) by nitrogen adsorption/desorption at −196 °C. Samples were degassed at 300 °C for 12 h prior to measurement. The sorption data obtained allowed for the calculation of the following parameters.
From the sorption data collected, the specific surface area (SBET), total pore volume (VT), micro- (Vmi), and mesopore (Vme) volumes, as well as the average pore diameter (dh) of the ACs, were calculated. The specific surface area was calculated from the BET (Brunauer, Emmett, and Teller) equation to partial pressure of p/p0 ≈ 0.05–0.2. The total pore volume was determined from a single point on the N2 adsorption isotherm at a relative pressure of p/p0 ≈ 0.95. The volumes of micropores and mesopores were calculated using the Barrett–Joyner–Halenda and t-plot methods, respectively. The microporosity of the ACs (expressed in %) was estimated as a ratio of micropores volume (Vmi) to the total pore volume (VΤ). The mean pore diameter (nm) was calculated from the following formula:
dh = 4VΤ/SBET
The surface morphology of activated carbons derived from walnut shells was examined using a scanning electron microscope (SEM) (Zeiss EVO 10, Carl Zeiss Microscopy GmbH, Jena, Germany). The samples were mounted on SEM stubs coated with carbon tape and sputter-coated with gold using a Quorum Q150R Plus system (Quorum Technologies Ltd., Laughton, UK).
The quantitative determination of oxygen acid–base groups present on the surface of the obtained activated carbons was carried out by the titration method described by Boehm [24]. The acidic groups were neutralized with aqueous solutions: NaOH (neutralizes acid, carboxyl, lactone, and phenolic groups), Na2CO3 (neutralizes carboxyl and lactone acidic groups), and NaHCO3 (neutralizes carboxyl groups). On the other hand, the alkaline groups were neutralized with hydrochloric acid.
Four samples of activated carbon weighing 0.25 g (to the nearest 0.01) were weighed on an analytical balance and placed separately in 250 mL flasks. The samples were then flooded with 25 mL of 0.1 mol/L NaOH, 0.1 mol/L NaHCO3, 0.05 mol/L Na2CO3, or 0.1 mol/L HCl. The mixtures were shaken for 24 h (at approximately 120 rpm) and drained. The resulting filtrates were titrated against the Tashiro indicator using 0.1 mol/L HCl or 0.1 mol/L NaOH solutions, respectively. All determinations were repeated three times. To calculate the content of functional groups (Ax, mmol/g), the following equation was used:
A x = V 0 V x n z . 25 N x
where V0 and Vx are amounts of HCl or NaOH solution used for the titration of the carbon the supernatant (Vx), the blank (V0), nz is the concentration of HCl or NaOH (mol/L), and Nx is the weight of activated carbon (g).
The points of zero charge (pHPZC) of the nutshell-derived ACs were determined according to the following procedure [25]. To determine the point of zero charge, the pH of 20 mL of 0.01 mol/L NaCl in each flask was adjusted to values ranging from 2 to 11 using 0.1 mol/L NaOH and/or 0.1 mol/L HCl. Following this, 0.05 g of AC was introduced into each Erlenmeyer flask. The flasks were shaken for 24 h, after which the pH of the resulting solutions was measured. The final pH values were plotted against the initial pH values, and the point of intersection on the resulting curve was recognized as the point of zero charge (pHPZC).
Thermal testing of activated carbons was performed using the thermogravimetric (TG) method on a type STA 449 F5 Jupiter-QMS analyzer (NETZSCH, Burlington, MA, USA). The temperature increase rate was 5 °C/min, and the helium flow rate was 25 cm3/min. The sample mass was 10 mg ± 1 mg. Measurements were carried out in the temperature range of 35–1200 °C.

2.5. Batch Adsorption Studies

All adsorption tests were performed in batch mode according to the following procedure. A weight (5 mg) of activated carbon was added to Erlenmeyer flasks containing 20 mL of PAR solution of appropriate concentration (50–150 mg/L). The prepared mixtures were thus shaken at 23 °C at a constant speed of 200 rpm. After equilibrium was reached or after an appropriate time (kinetic studies), the mixtures were filtered through filter paper, and the filtrates obtained were analyzed for the adsorbate content. The amount of paracetamol adsorbed under equilibrium conditions (qe) and after an appropriate time t (qt) was determined from the following equations:
q t = ( C 0 C t ) V m
q e = ( C 0 C e ) V m
where C0, Ct, and Ce are the initial concentration of PAR, the concentration at time t, and the concentration at equilibrium (mg/L), respectively, and V is the volume of the solution (L), and m is the mass of AC (g).
Adsorption was also expressed as the percentage of drug removal (A%):
A d s o r p t i o n % = C 0 C e C 0 · 100
The adsorption isotherms of PAR on all ACs were prepared for adsorbate solutions with initial concentrations ranging from 50 to 150 mg/L. Adsorption kinetics, the effect of solution pH, and adsorbate regeneration studies were examined for PAR solutions with an initial concentration of 100 mg/L. All experiments were performed at a natural (original) pH of ~6.3. The exception, of course, was the study of the effect of the pH of the solution on adsorption. This experiment was carried out for PAR solutions with an initial pH in the range of 2.20 to 10.0. The required pH of the solution was achieved by adding small amounts of 0.01 mol/L NaOH or HCl.
These adsorption tests were duplicated, and the average values were taken for the calculations.
For a better interpretation of the obtained experimental data, two kinetic models were used—the pseudo-first-order (PFO) and the pseudo-second-order (PSO) [26], expressed by the following equations:
d q t d t = k 1 ( q e q t )
d q t d t = k 2 ( q e q t ) 2
where k1 is the PFO adsorption rate constant (1/min), and k2 is the PSO adsorption rate constant (g/mg∙min).
When converted to linear expressions, both formulas take the following form:
log ( q e q t ) = log q e k 1 2.303 t
t q t = 1 k 2 q e 2 + 1 q e   t
Therefore, the adsorption rate constants k1 and k2 can be calculated from the slope and intercept obtained for the linear plots of log(qeqt) vs. t and t/qt vs. t for the PFO and PSO models, respectively.
To identify the mechanism of PAR adsorption on ACs from nutshells and to identify the step that determines the rate of the overall adsorption process, the Weber–Morris model (intraparticle diffusion model) was used [26,27]. The following formula expresses this model:
q t = k i t 0.5 + C i
where ki is the intraparticle diffusion rate constant (mg/g⋅min−0.5), and Ci is the constant of the Weber–Morris equation.
The Langmuir, Freundlich, and Temkin isotherm models [28] were used to describe the experimental data.
The Langmuir isotherm model is based on the assumption that there are homogeneous active sites on the surface of the adsorbent, that there are no interactions between the adsorbed molecules, and that the adsorbate molecules are covered by a monolayer. The nonlinear form of the Langmuir isotherm model is given by Equation (11).
q e = q m K L C e 1 + K L C e
The following equation gives the linear form of the Langmuir equation:
C e q e = 1 q m C e + 1 q m K L
where qm is the monolayer coverage capacity (mg/g), and KL is the Langmuir constant (L/mg). These isotherm parameters were calculated from the slope and intercept of the linear plots of Ce/qe vs. Ce.
The Freundlich isotherm model assumes a heterogeneous adsorbent surface and multilayer coverage of adsorbate molecules. The Freundlich equation is expressed as follows:
q e = K F C e 1 / n
The equation can be rearranged in linear form as follows:
ln q e = l n K F + 1 n l n C e
where KF is the Freundlich relative adsorption capacity (mg/g)(L/mg1/n), and 1/n is the heterogeneity factor. Both constants were determined from the slope and intercept of the linear plot of lnqe vs. lnCe.
The Temkin isotherm model assumes that the heat of adsorption of surface molecules decreases linearly rather than logarithmically with coverage and that a uniform, infinite energy distribution of adsorption sites on the adsorbent surface characterizes the adsorption process. The Temkin equation can be expressed in the following form:
q e = R T b T l n ( A T C e )
The equation can be rearranged in linear form as follows:
q e = R T b T ln A T + R T b T ln C e
where AT is the Temkin equilibrium binding constant (L/g), bT is the constant related to the heat of adsorption (J/mol), T is the absolute temperature (K), and R is the gas constant (8.314 J/mol·K). The parameters AT and bT were calculated from the slope and the intercept of the plot of qe against lnCe.
The values of determination coefficients (R2) and the root-mean-square error (RMSE) were calculated using the following formulas [26]:
R 2 = i = 1 n ( q e c a l q e ( e x p ) ) ¯ 2 i = 1 n ( q e c a l q e ( e x p ) ) ¯ 2 + i = 1 n ( q e c a l q e ( e x p ) ) 2
R M S E = 1 n i = 1 n ( q e e x p q e c a l ) 2
where qe(exp) and qe(cal) are the adsorption capacities (mg/g) obtained experimentally and calculated from the theoretical models, and n is the number of data.
The dimensionless equilibrium constant RL [28] is expressed in the following form:
R L = 1 1 + K L C 0
The Gibbs free energy of change was calculated using the following formula [29]:
G o = R T   l n ( 55.5 K L )
where R is the universal gas constant (8.314 J/mol·K), T is the temperature in Kelvin (296.15), and KL is the Langmuir equation constant (L/mg).
ACs were regenerated when equilibrium adsorption was reached (PAR 100 mg/L and the solid/liquid ratio was 0.25 g/L). The loaded ACs were desorbed with methanol (20 mL) [30] according to the following procedure. A dozen AC samples were separated from the solution after the adsorption of PAR. The drug-loaded ACs were then agitated in a series of Erlenmeyer flasks containing 20 mL of methanol at 150 rpm for 8 h at 23 °C. The ACs were then filtered, dried at 120 °C for 4 h, reweighed, and 5 mg was added to Erlenmeyer flasks containing 20 mL of PAR (100 mg/L). The adsorption/desorption procedure was carried out in three successive cycles. The regeneration efficiency (R%) was calculated using the following equation:
R = q n q 0 × 100 %
where q0 is the initial adsorption capacity (mg/g), and qn is the reuse adsorption capacity (mg/g) after the n-th cycle.
The concentrations of paracetamol in the solution were determined by UV-vis spectrophotometry (Varian Carry 3E, Palo Alto, CA, USA). A linear relationship (R2 = 0.9991) was found between absorbance (measured at λ = 244 nm) and the concentration, which was described by the equation y = 0.0611x + 0.0393, in the range of 1 to 30 mg/L of PAR studied.

3. Results and Discussion

3.1. Chemical Analysis of Nutshells

The chemical composition of the agricultural wastes is presented in Table 2.
The chemical composition of nutshells is variable and depends on many factors, such as the plant species, climatic and habitat conditions, and the geographical origin of the raw material. In the analyzed samples, significant differences were observed in the content of major chemical components (Table 2). The highest lignin content and the lowest cellulose content characterized the walnut shells. In contrast, pistachio shells had the lowest lignin content (approximately 17%) and the highest holocellulose content (over 80%).
The obtained results are consistent with the literature data, although it should be noted that various sources report a wide range of values for a given type of nutshell. For example, the cellulose content reported in the literature ranges from 21.0 to 36.4% for walnut shells [31,32,33,34], 22.1–50.7% for peanut shells [35,36], and 30.0–57.5% for pistachio shells [35,37,38]. For hemicelluloses, the reported values are 18.8–30.2% (walnut) [31,32,33], 22.9–24.1% (peanut) [35,36], and 10.7–48.9% (pistachio) [35,37,38]. In general, nutshells are highly lignified: the lignin content in walnut shells ranges from 29.9 to 53.9% [31,32,33,34,36], in peanut shells from 26.4 to 39.9% [35,36], and in pistachio shells from 11.6 to 29.1% [35,37,38].

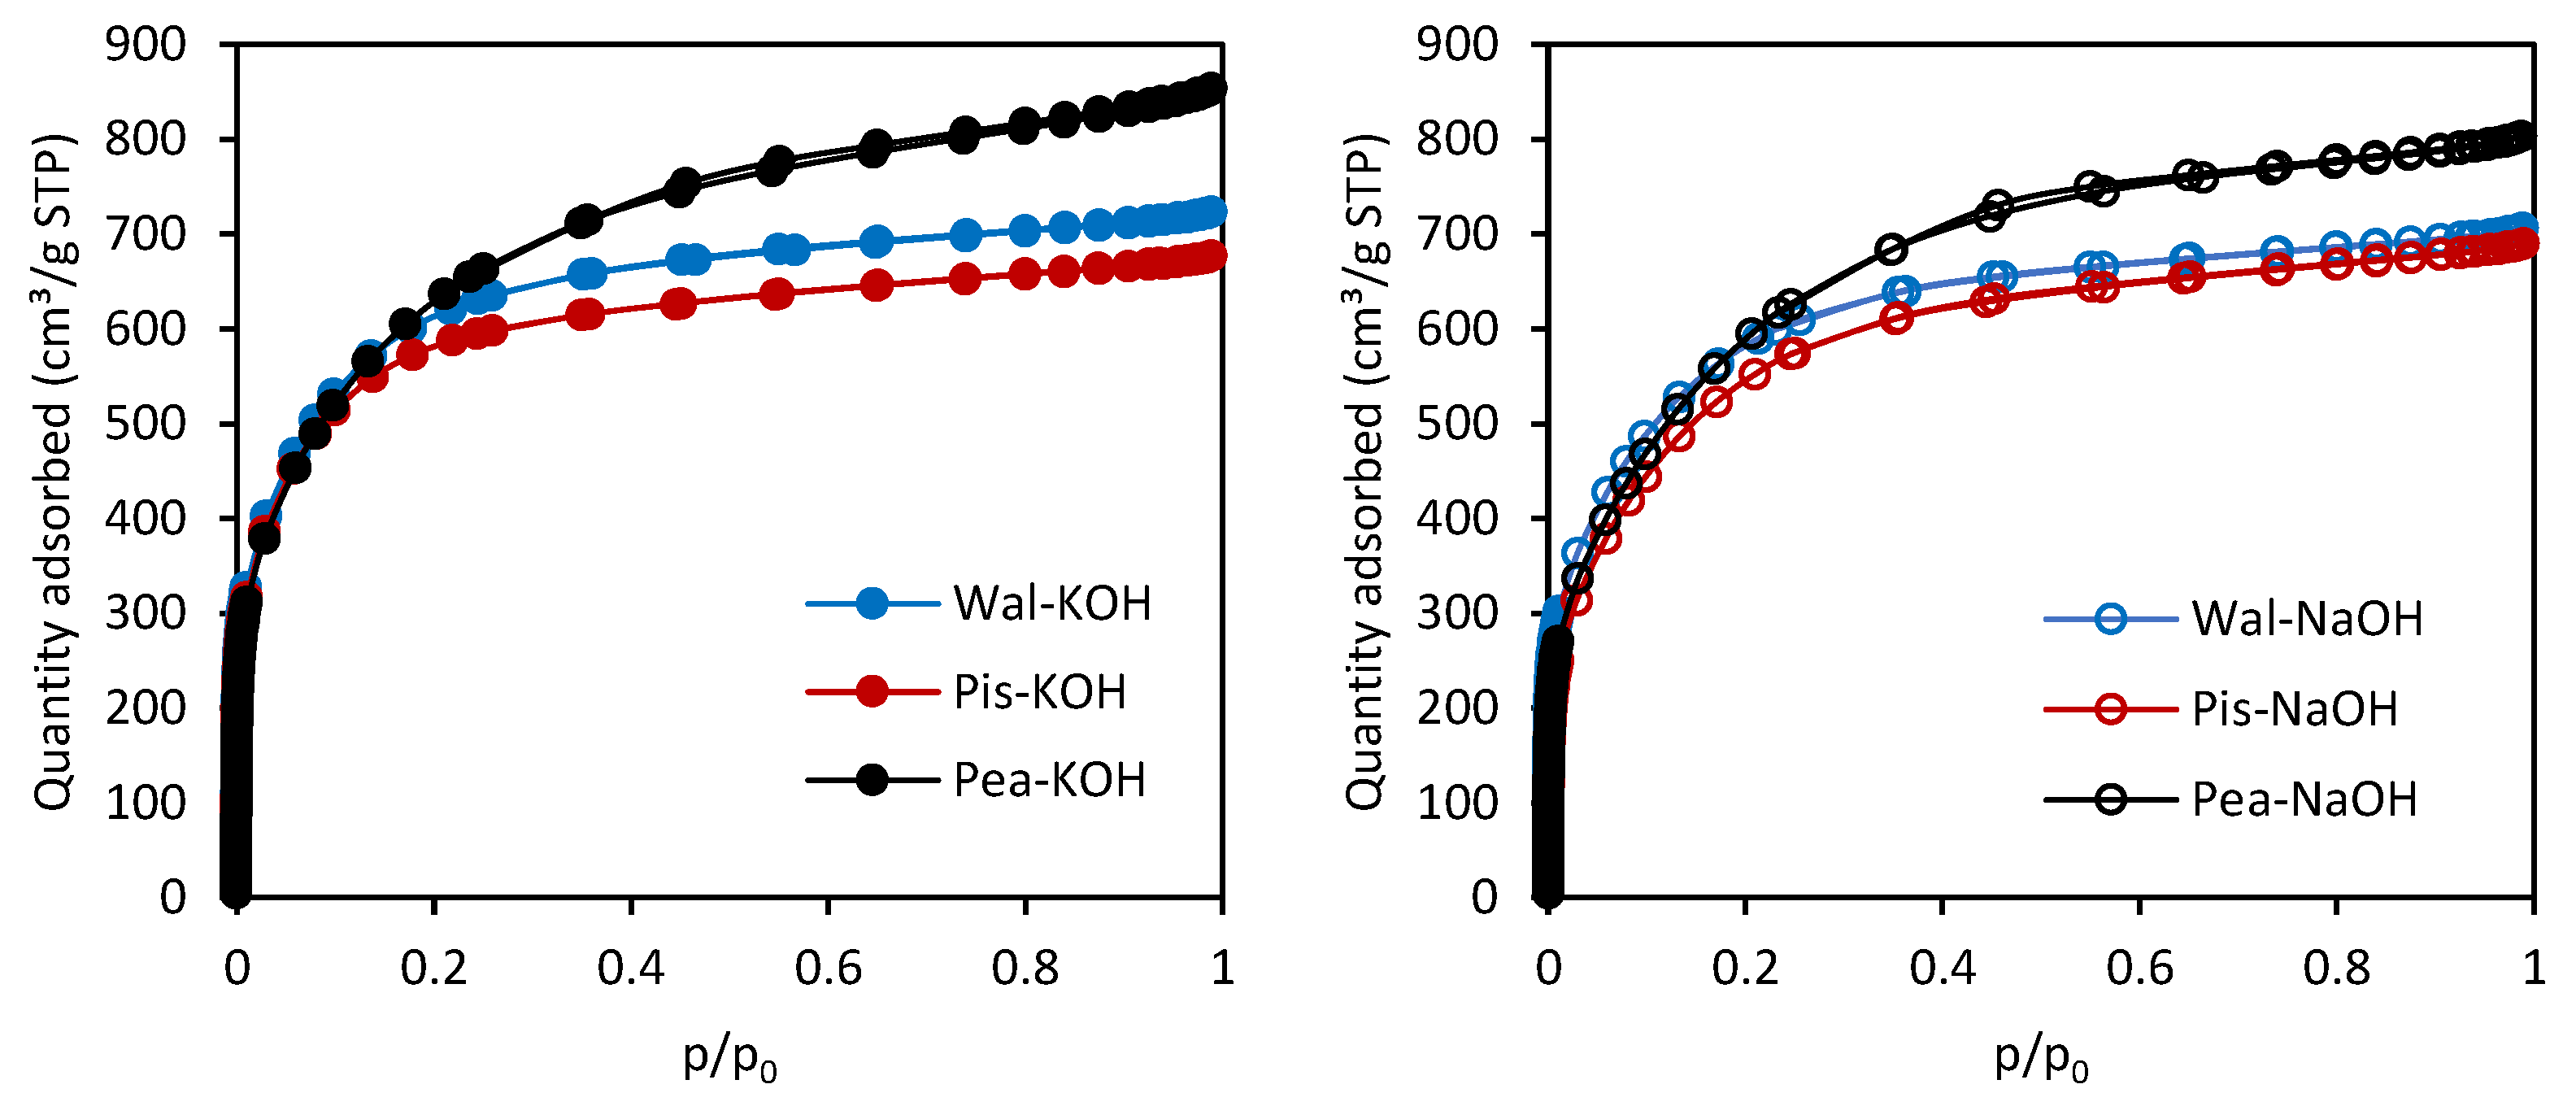
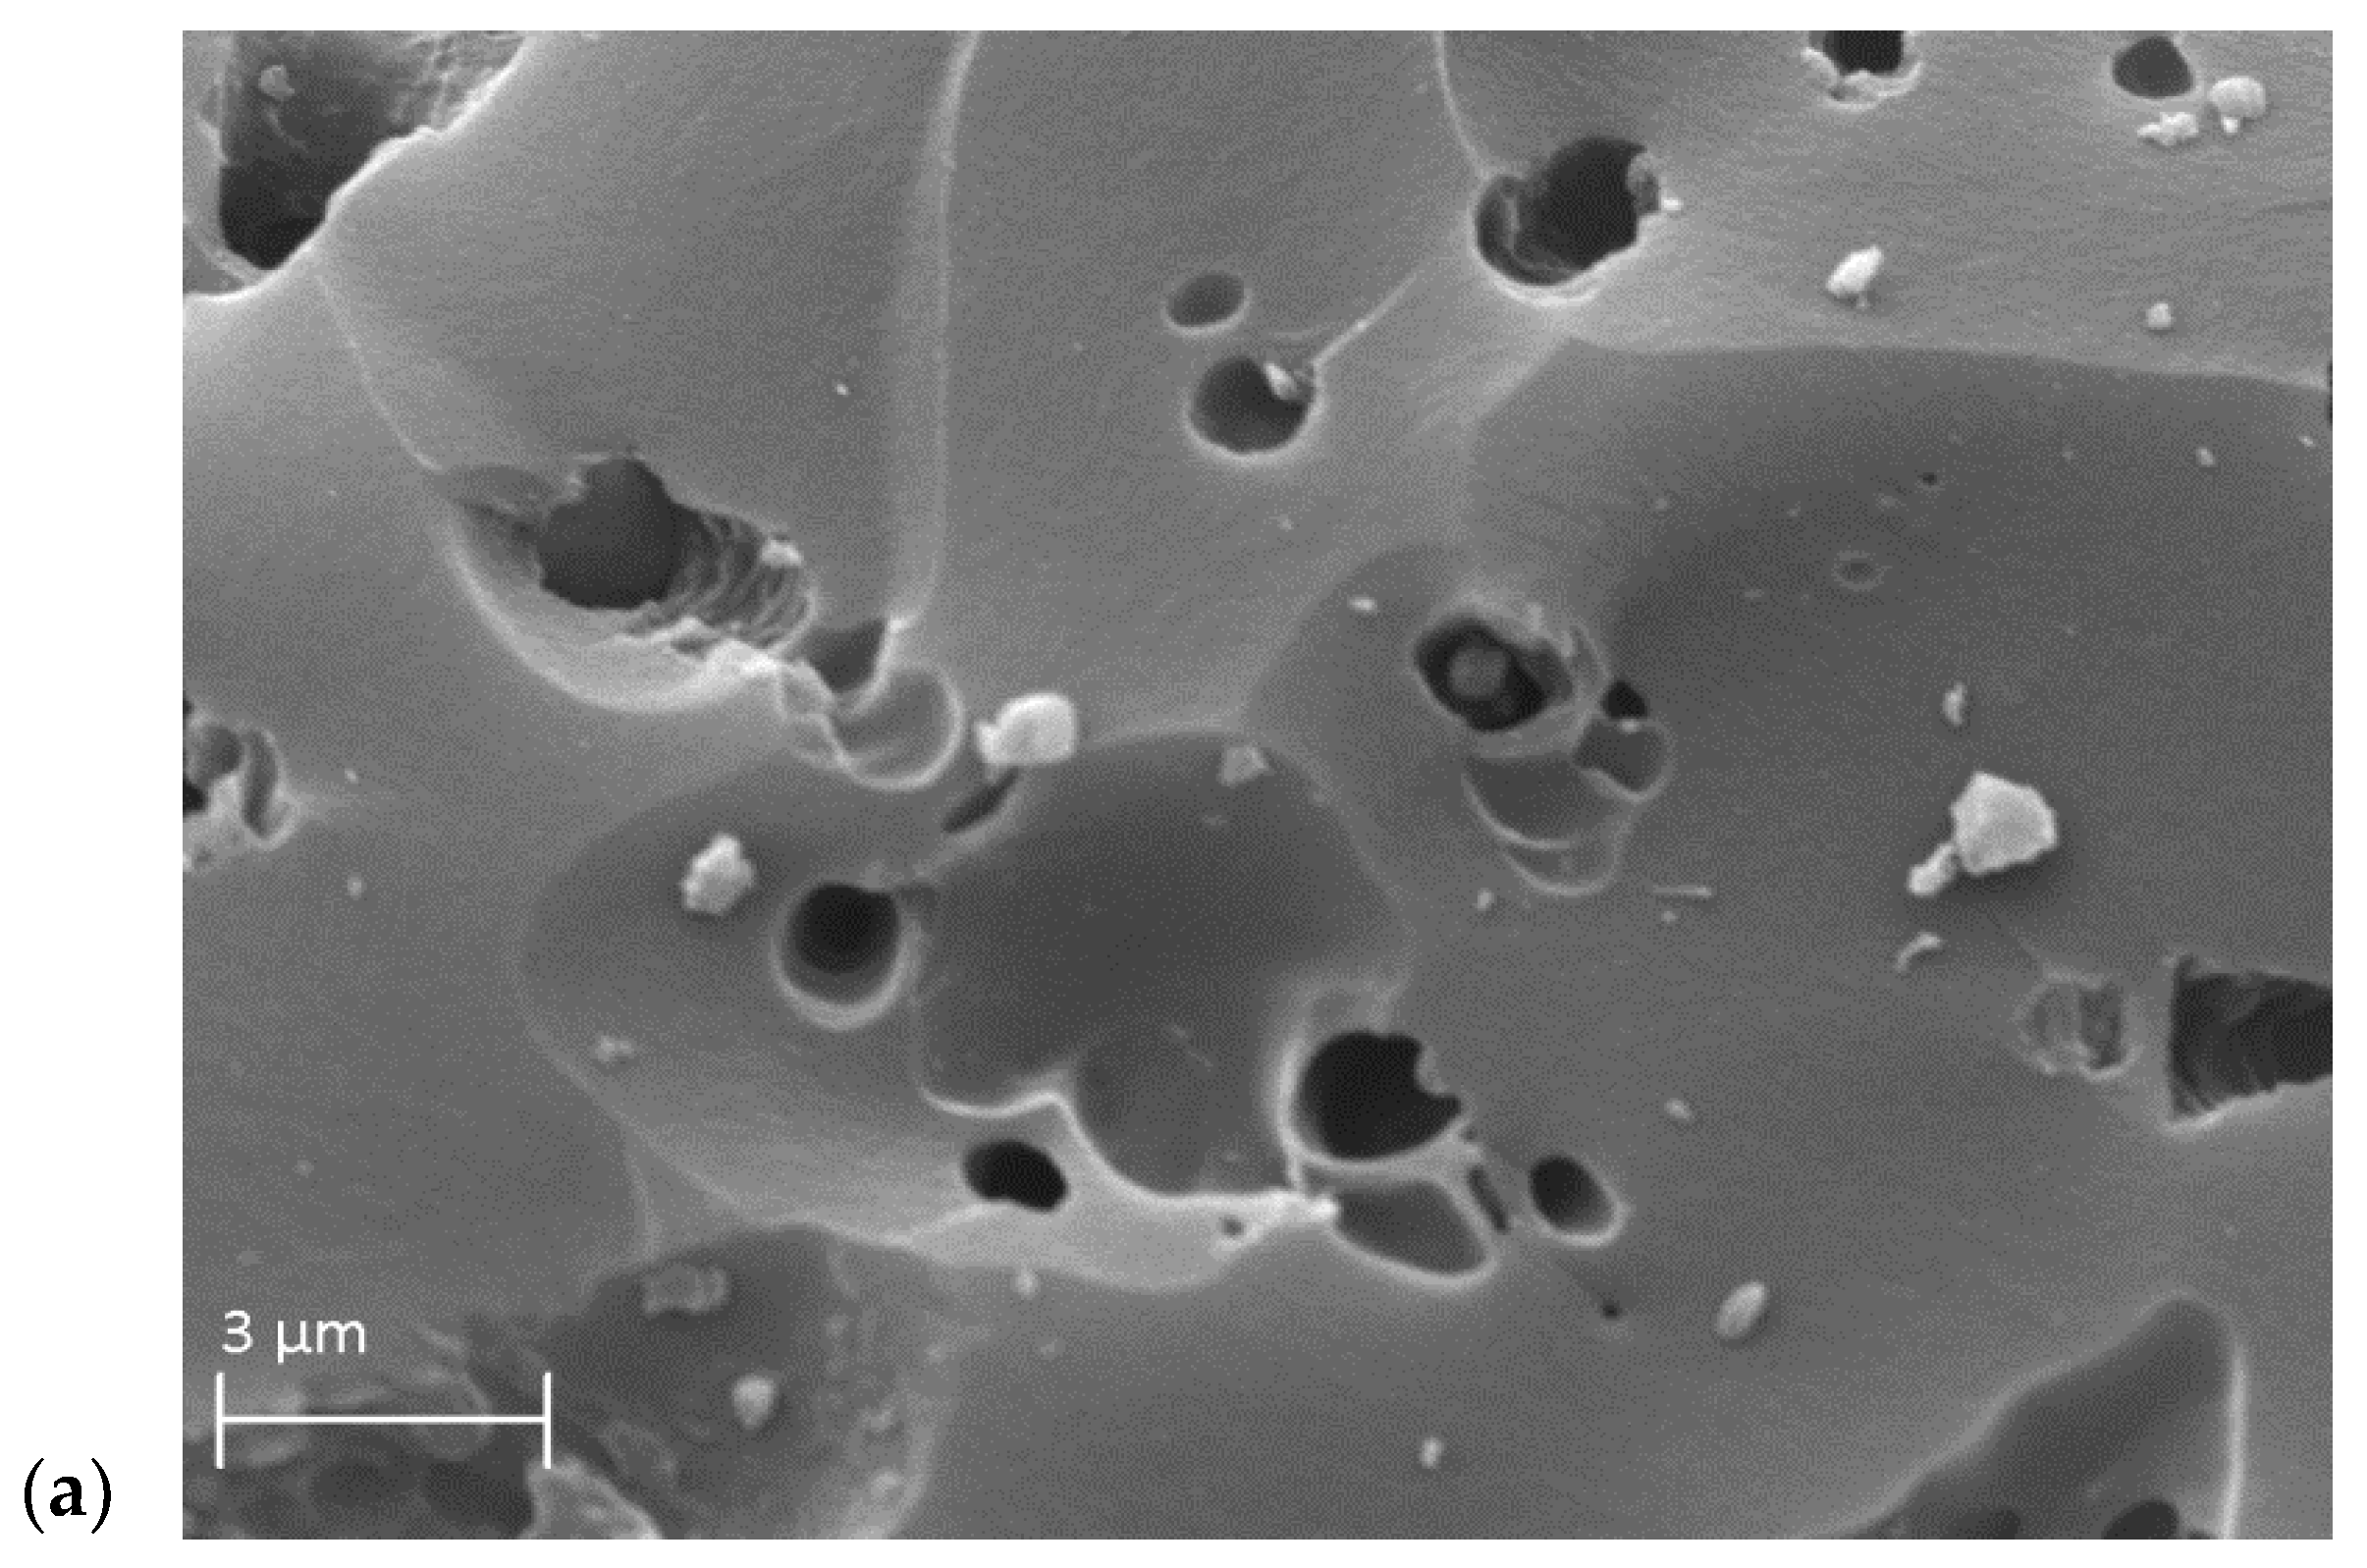
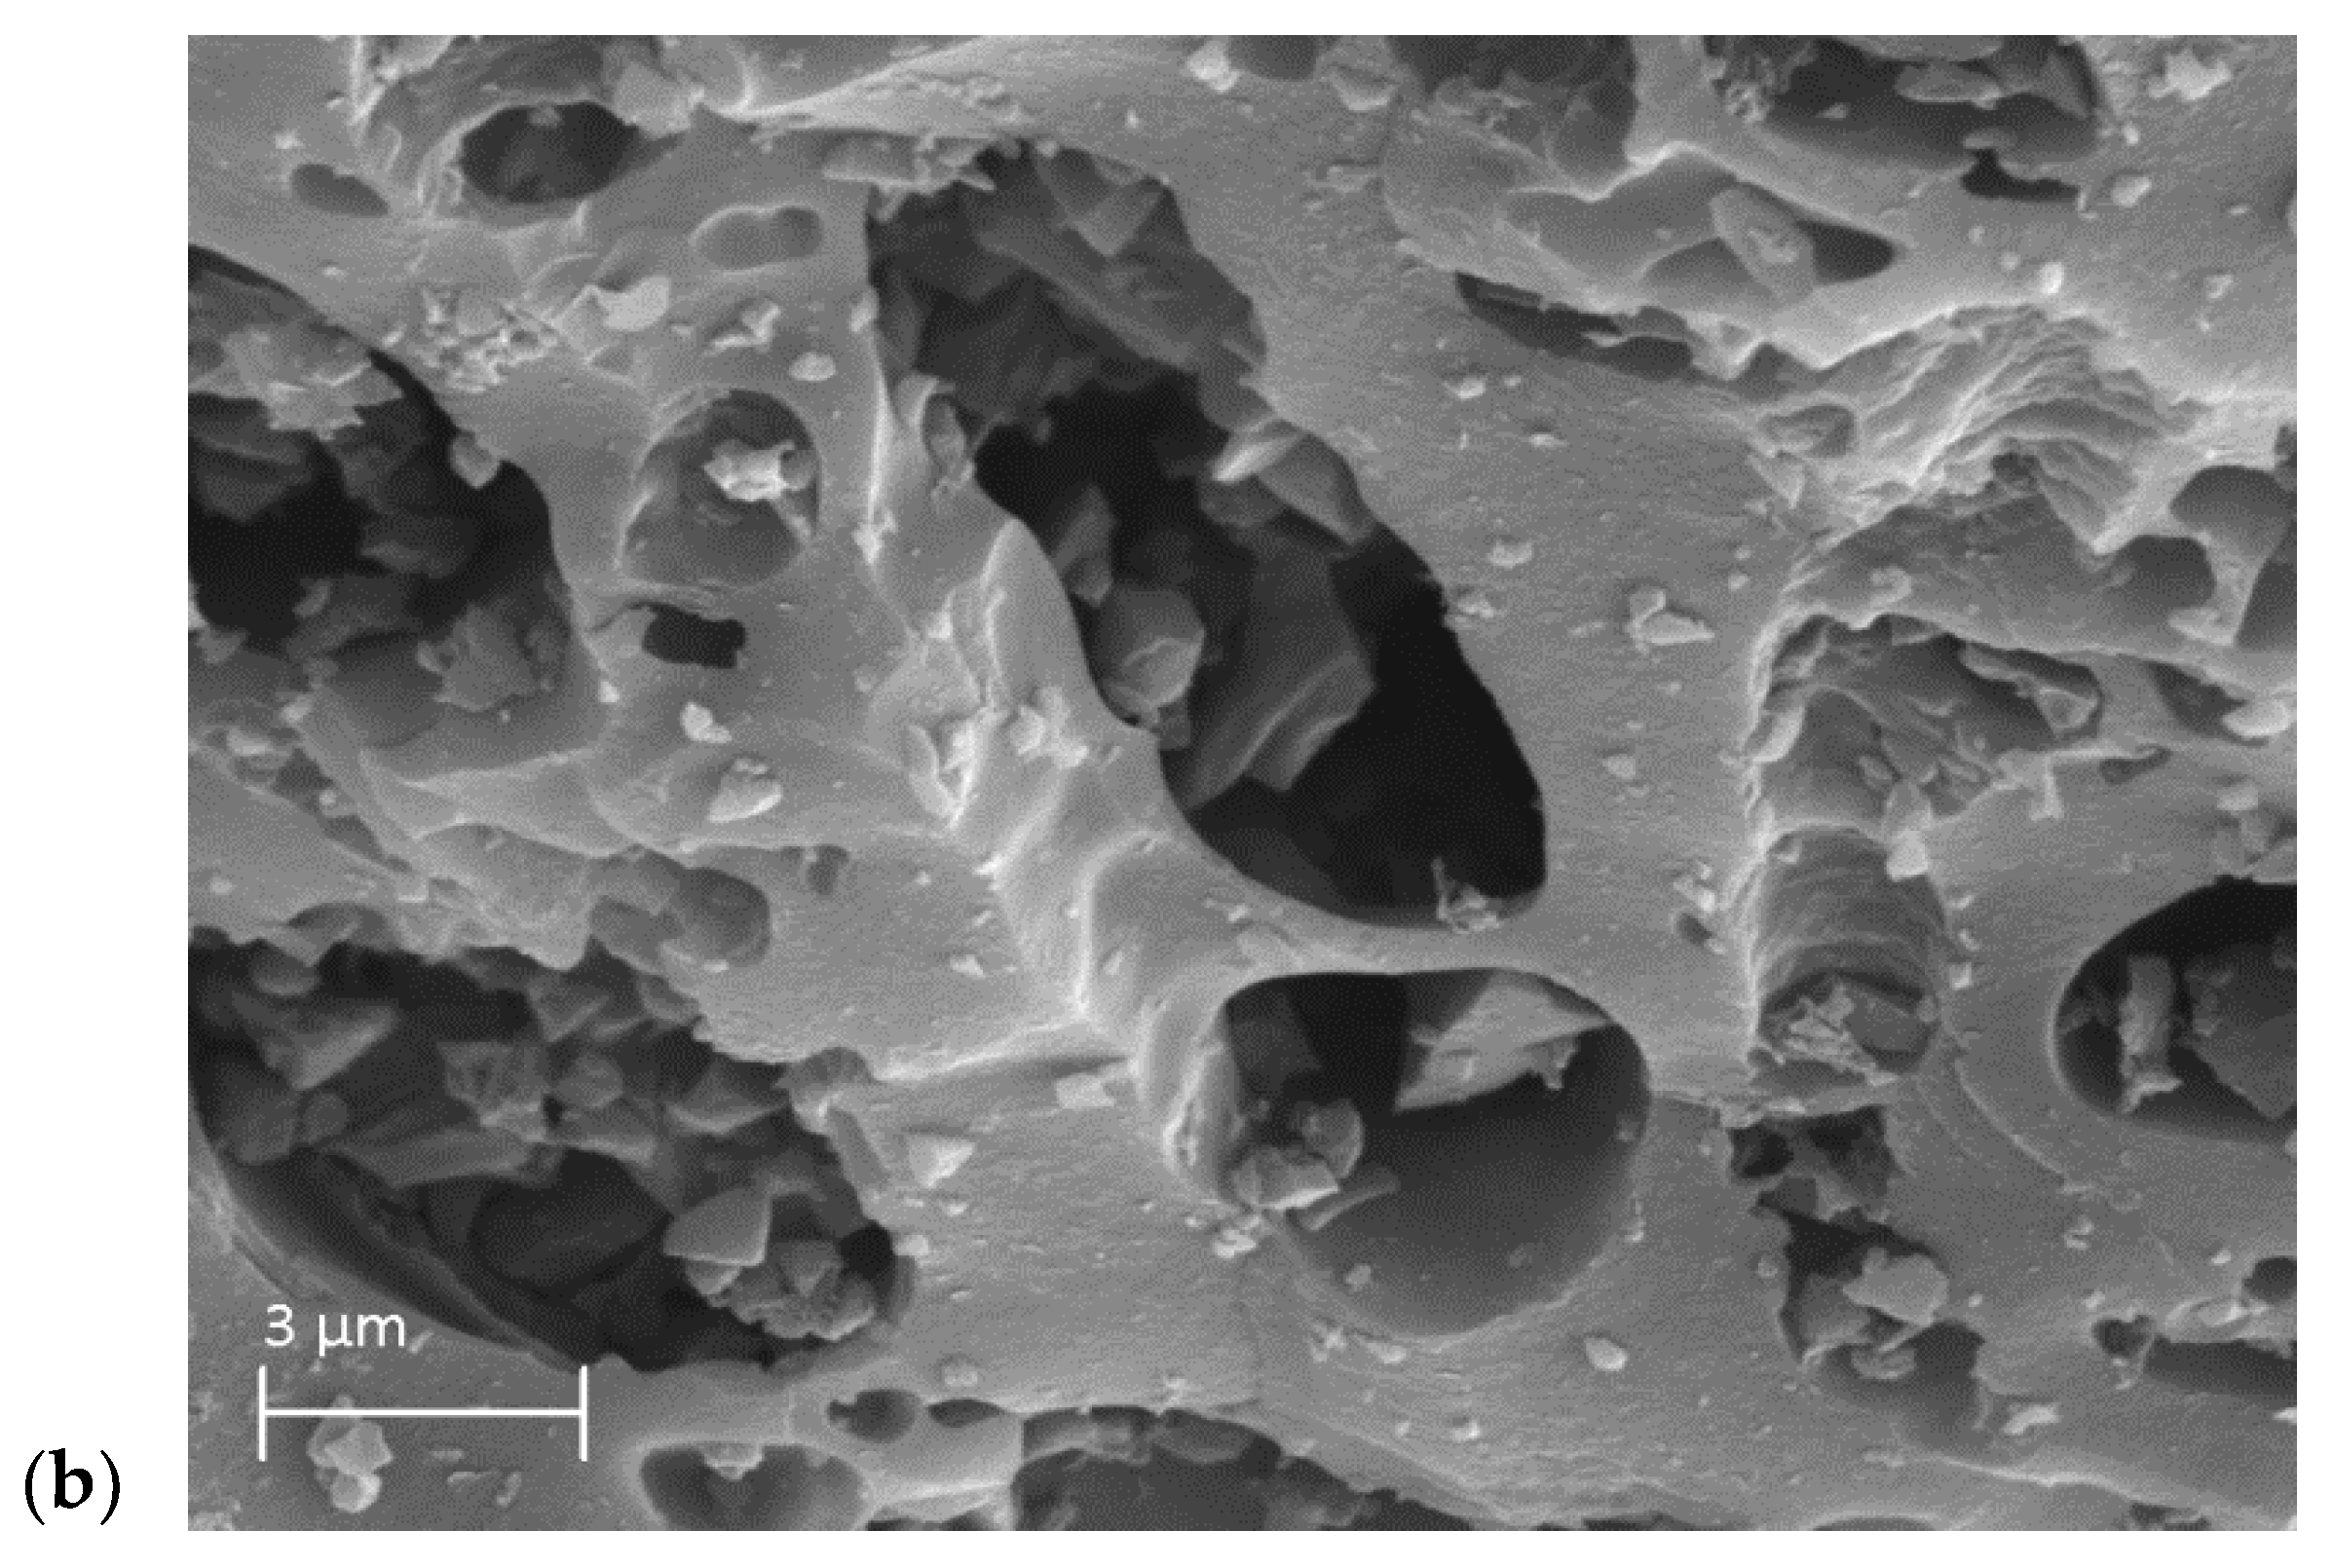
3.2. The Characterization of the Activated Carbons

The porous structure of activated carbons is one of the important parameters affecting their adsorption properties.
Figure 1 presents isotherms of the nitrogen adsorption–desorption at −196 °C for all obtained activated carbons. In the case of both activating agents, the highest curves are observed for peanut Acs, and the lowest is for pistachio nut ACs. All ACs have a large mean pore size, and the ACs prepared with NaOH present larger pores compared with KOH, which is confirmed by the data presented in Table 3.
The calculated pore structure parameters are given in Table 3. One can observe that in the case of the BET surface area as well as the micropore volume, higher values are present for activated carbons obtained with the use of KOH as an activating agent.
In addition, in order to illustrate the surface morphology of activated carbons obtained from nutshells as precursors, SEM images were selected and presented as an example for ACs obtained from walnut shells by the activation process using KOH and NaOH as activating agents. The above activated carbons were selected from all those produced in this work due to their intermediate development of porous structures. The total pore volume of these activated carbons has values between that of the carbons with the lowest and the highest VT value.
The comparison of SEM images for the AC Wal-KOH and Wal-NaOH samples (Figure 2) shows the morphological differences resulting from the type of activating agent used. For the ACs of Wal-KOH (Figure 2a) many macropores with diameters below 1 μm can be observed, whereas for Wal-NaOH (Figure 2b) many macropores have diameters above 3 μm.
The structural differences between ACs produced under the same conditions may be related to the differences in the chemical composition of the precursors (Table 2). The most developed specific surface area (SBET) was found for activated carbons obtained from walnut shells by the KOH activation. Walnut shells contained the most lignin. In contrast, activated carbons with the lowest SBET, VT, and Vmi were obtained from pistachio shells with an 80% holocellulose content. In comparison, activated carbons with the intermediate SBET value were obtained from peanut shells containing about 67% holocellulose and about 31% lignin.
The values of parameters characterizing the chemical properties of the activated carbon surface are listed in Table 4. For all tested activated carbons produced from nutshells used as precursors, higher amounts of acidic surface functional groups can be observed for ACs obtained using KOH as an activating agent compared to NaOH as an activator. This was mainly visible for lactone and hydroxyl groups. A similar relationship is observed for the calculated ratio of acidic to basic surface groups. Higher values are observed for activated carbons obtained as a result of the activation process using KOH as an activator. This observation correlates well with pHPZC values (higher for NaOH as an activating agent).
The additional information characterizing the surface chemistry of nutshell-derived ACs provides the results of the thermal analysis (Table 5). Mass losses observed in TG curves for temperature ranges of 200–400 °C, 400–700 °C, and 700–900 °C show higher values for ACs activated with the use of KOH as an activator. This is consistent with the overall acidity of the AC’s surface, as given in Table 4. The mass losses in the temperature ranges of 200–400 °C, 400–700 °C, and 700–900 °C apply to the thermal decomposition of functional groups, mainly carboxyl (in the first range); lactone, hydroxyl, anhydride, and carbonyl (mainly in the second range); and ether and quinine (mainly in the third mentioned range), respectively [39].
A good correlation between the mass loss values and oxygen surface groups content can be observed mainly in the temperature range of 400–700 °C, where the thermal decomposition of lactones and hydroxyl functional groups of the surface takes place, which is correlated with their content presented in Table 2. The lowest mass loss values occur in the temperature range of 200–400 °C, which is related to the thermal decomposition of carboxyl groups (the smallest amount in Table 2).

3.3. Adsorption Study

3.3.1. Effect of Solution pH

Adsorption is influenced not only by the properties of the adsorbent and adsorbate but also by the nature of the solution. The pH of the solution determines the form in which the adsorbate molecule exists (whether it is undissociated or dissociated) and the charge that accumulates on the surface of the adsorbent, which can enhance or reduce the adsorption depending on the situation. The effect of the pH of the initial solution on the PAR adsorption on nutshell-derived ACs is shown in Figure 3.
As can be seen, the adsorption is more or less constant in the pH range from 2 to about 8 and then decreases, reaching a minimum at pH = 10. Such a correlation was observed for each activated carbon tested. This is not surprising when looking at the surface chemistry of the ACs (Table 4 and Table 5). The surface chemistry of these ACs is comparable. For example, the point of zero charge (pHPZC) ranges from 6.70 to 7.20, which explains their similar behavior in response to changes in the solution pH. When comparing the adsorption at the lowest pH (2.2) and the highest pH (10), the most significant decrease was observed for Pis-NaOH (a change of 21.6%) and the least for Pea-NaOH (a change of 13.1%). The dependence of the PAR adsorption on ACs on the pH of the solution can be explained by the concept of the electrostatic interaction between the adsorbate and adsorbent. The paracetamol molecule can exist in different forms, depending on the pH. The pKa of PAR is 9.53, which means that at a pH below 9.53, it is in the undissociated (uncharged) form, and at pH above 9.53, it is in the dissociated (anionic) form. According to Aminul Islam et al. [40], at a pH = 9.53, almost 20% of PAR molecules are in anionic form. As the pH of the solution increases, more and more PAR molecules dissociate and become anions. As mentioned above, the pHPZC values of the individual ACs are similar, around 7 (6.70–7.20). This means that the surface charge of the ACs is mainly negative when the pH of the solution is higher than their pHPZC, and vice versa. Thus, at pH 10, at which the lowest adsorption efficiency is observed, there is a negatively charged adsorbent surface and adsorbate molecules, mainly in anionic form. Thus, these repulsive electrostatic interactions between the adsorbent and the adsorbate are the reason for the significant reduction in the PAR adsorption in alkaline media (Figure 3).
A similar effect of the solution pH on PAR adsorption and analogous conclusions was reported in the literature, e.g., for the adsorption of the drug on carbon nanotubes [25] and various activated carbons [30,41,42,43,44].

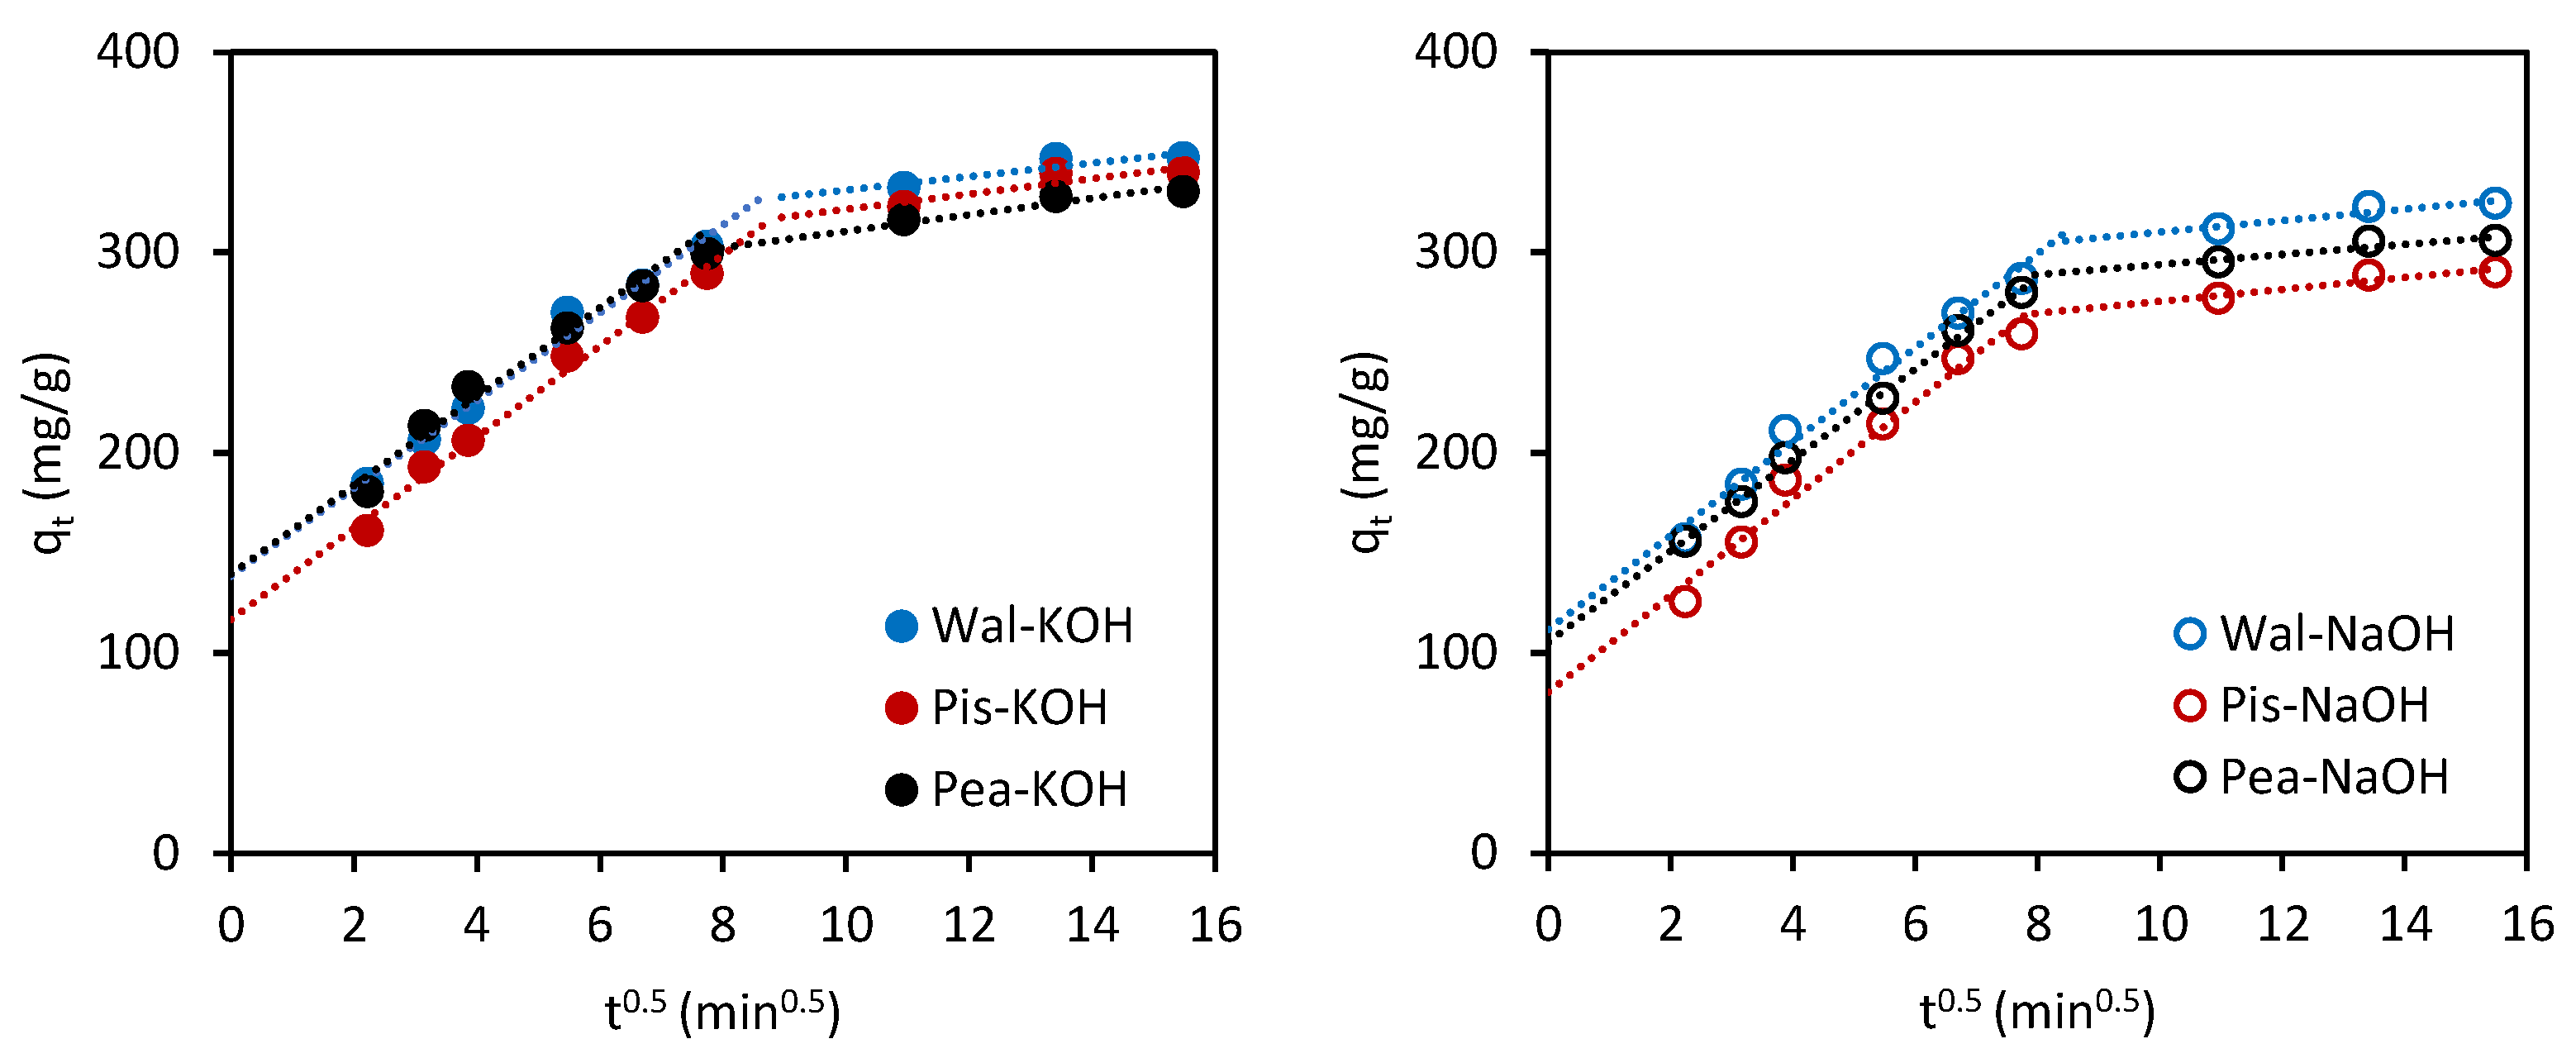
3.3.2. Adsorption Kinetics

The adsorption rate of PAR (100 mg/L) on all activated carbons (0.25 g/L) is shown in Figure 4. In all cases, the adsorption was initially rapid and then slowed down, reaching an equilibrium after about 2 h. The filling of AC micropores continues, but further changes are not clearly noticeable.
The experimental data were described using the pseudo-first-order (PFO) and the pseudo-second-order (PSO) [26] kinetics. The pseudo-first-order and pseudo-second-order kinetic models for the adsorption of PAR onto nutshell-derived activated carbons are presented in the Supplementary Materials in Figures S1 and S2, respectively. The PAR adsorption rate for both kinetic models is listed in Table 6. The experimental qe values and adsorption capacities obtained for the PFO (qe1(CAL)) and PSO (qe2(CAL)) models are also given. The determination coefficients (R2) and the root-mean-square error (RMSE) were used to compare the differences between the values of the experimental data and the values predicted by the theoretical models. Higher (closer to 1) values of the R2 and lower values of the RMSE indicate a better fit of the model used.
Higher values of R2 and lower values of the RMSE suggest that the PAR adsorption from water on all ACs tested follows the PSO model. This generally agrees with the results reported by other authors (see review [40]). For a comparison of PAR adsorption rates on ACs, the k2 values obtained for the PSO model are more appropriate. The lowest k2 value (2.570·10−4 g/mg∙min) was observed for Pis-KOH and the highest (k2 = 4.024·10−4 g/mg∙min) for Pea-KOH. This means that PAR was adsorbed most slowly on Pis-KOH, whereas it was adsorbed most rapidly on Pea-KOH. Considering the k2 values, the rates of the PAR adsorption on the tested ACs can be ordered as follows: Pis-KOH < Wal-KOH < Wal-NaOH < Pis-NaOH < Pea NaOH < Pea KOH. A certain regularity can be observed when analyzing the porous structure of each AC (Table 3). PAR was adsorbed the slowest on Pis-KOH, the AC with the lowest mesopore volume (0.128 cm3/g), and the fastest on Pea-KOH, the adsorbent characterized by the most developed mesopore structure (Vme = 0.311 cm3/g). The same phenomenon is observed for the other activated carbons. The order of the increase in the PAR adsorption rate coincides well with the increase in the mesopore volume of each AC. This suggests that the PAR adsorption depends on the porous structure of the ACs and is closely correlated with the volume of the mesopores.
It was found that the PSO model describes the obtained experimental data well. However, the model does not explain the adsorption mechanism. The adsorption process is complex and involves several steps [26,27]. These are in the following order: (1) the transport of the adsorbate from the bulk phase to the boundary layer, (2) film diffusion, (3) pore (intraparticle) diffusion, and (4) surface reaction (the localization of the adsorbate molecules on the active sites of the adsorbent). The slowest step determines the rate of the entire adsorption process. Steps (1) and (4) are very fast, so the rate of adsorption is determined by the film diffusion or intraparticle diffusion (or both simultaneously). To identify the mechanism of the PAR adsorption on ACs from nutshells and to identify the step that determines the rate of the overall adsorption process, the Weber–Morris model (intraparticle diffusion model) was used, and the plots of qt versus t0.5 for each AC are shown in Figure 5.
According to the assumptions of this model [27]
-
The adsorption rate is controlled by only one step (qt = f(t0.5) is a straight line);
-
The adsorption is complex; both stages, film diffusion and intraparticle diffusion, control the adsorption rate (qt = f(t0.5) is not linear over the whole range, and a broken line is observed);
-
Intra-particle diffusion is the primary rate-limiting step controlling the whole adsorption process (qt = f(t0.5) passes through the origin; intercept = 0);
-
Film diffusion is the primary rate-limiting step that determines the overall adsorption process (qt = f(t0.5) does not pass through the origin; intercept ≠ 0);
Figure 5 shows the results of the Weber–Morris model. The nonlinear plots of qt vs. t0.5, which do not pass through the origin, suggest multiple rate-controlling processes with dominant film diffusion. A similar phenomenon was also reported for PAR adsorption on various carbonaceous adsorbents [25,30,42,43].

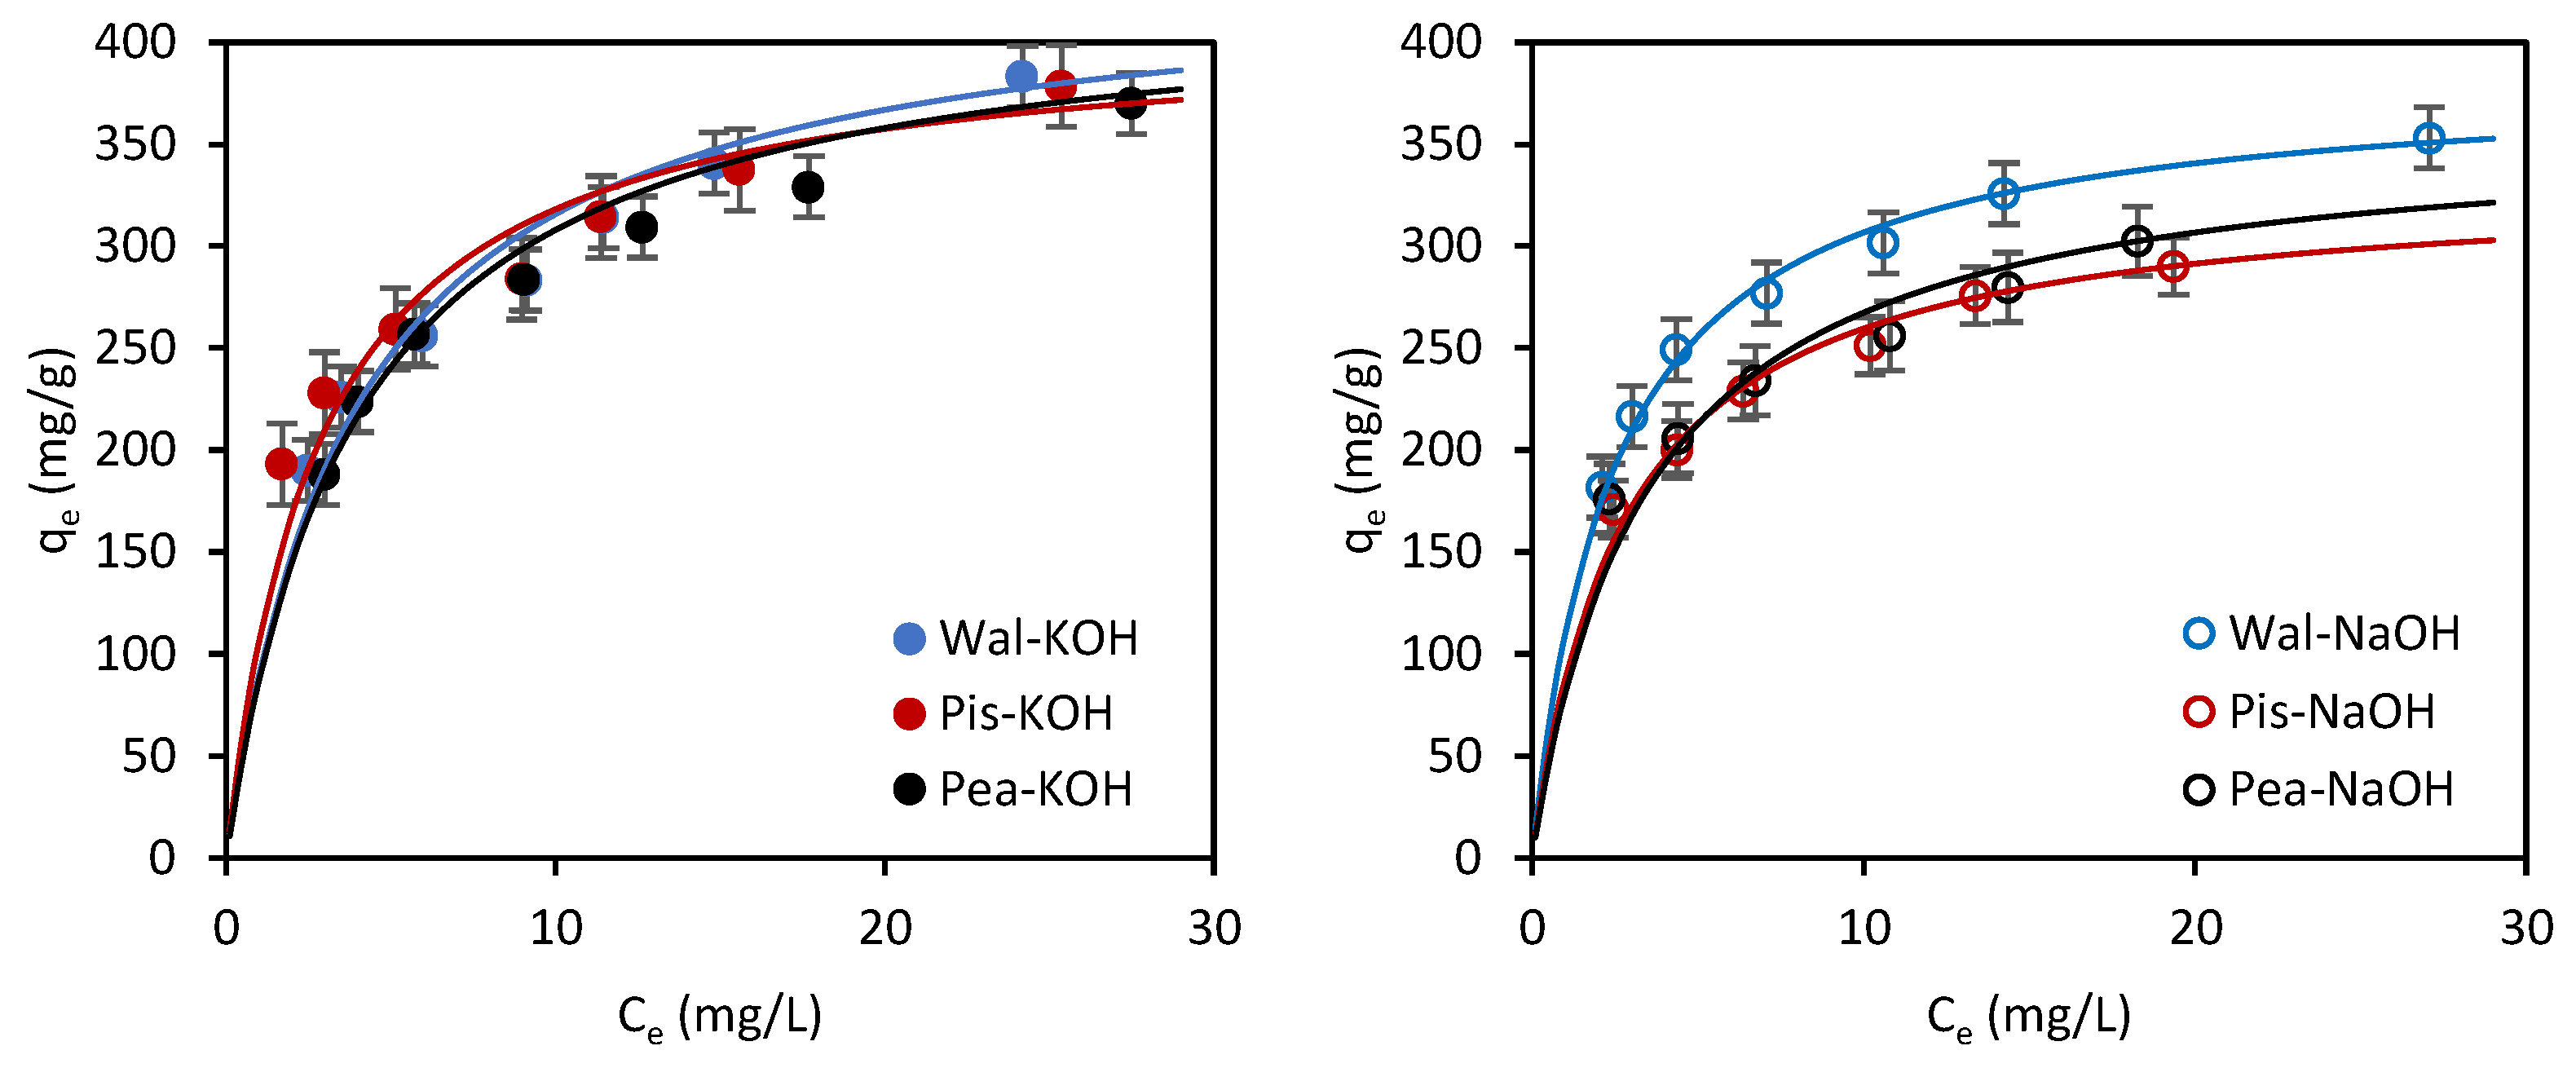
3.3.3. Adsorption Isotherms

Figure 6 shows the removal efficiency of the PAR for different initial adsorbate concentrations. For the lowest PAR concentration (50 mg/L), an efficiency of around 95% was observed. As the PAR concentration increased, the percentage of the drug removal decreased, reaching 70–80% for the highest concentration of 120 mg/L (ranging from 71.3% for Pis-NaOH to 79.8% for Wal-KOH).
The adsorption isotherm determines the amount of the substance adsorbed as a function of its concentration in the liquid phase at a given temperature. The adsorption isotherms of PAR from aqueous solutions on ACs prepared from nutshells are shown in Figure 7.
The Langmuir, Freundlich, and Temkin isotherm models [28] were used to describe the experimental data. The linear Langmuir, Freundlich, and Temkin isotherm models for the adsorption of PAR onto nutshell-derived activated carbons are presented in the Supplementary Materials in Figures S3, S4, and S5, respectively. The calculated adsorption parameters for these isotherm models are listed in Table 7.
Analyzing the R2 and RMSE values, it can be concluded that, in general, all the models used described the adsorption quite well. The best fits—that is, the highest values of R2 (≥0.993) and simultaneously the lowest values of RMSE (≤6.31)—were observed for the Langmuir equation, indicating that this is the best model to describe the adsorption of PAR on nutshell-derived ACs. The fact that adsorption follows the Langmuir model suggests the monolayer adsorption of PAR molecules on an energetically homogeneous adsorbent surface.
The Langmuir equation also allows for the determination of other parameters, such as the separation factor (RL) [28] and the Gibbs free energy of change (ΔG°) [29], which provide information on the favorability as well as the feasibility and spontaneity of the adsorption process.
The RL values for each AC are shown in Table 8. A minimum of zero and a maximum of one (1 > RL > 0) indicate the favorable adsorption process. In another scenario, an RL equal to 0 or 1 would indicate that the adsorption is irreversible or linear. On the other hand, an RL value greater than one would imply that the adsorption process is unfavorable [28].
The values of ΔG° are presented in Table 8. Negative values suggest that the adsorption process occurs spontaneously, while positive values imply that it is nonspontaneous. It can be observed that all the ΔG° values are negative, signifying the spontaneous character of the adsorption.
The values of qm determined from the Langmuir equation allow for a comparison of the adsorption capacities of individual ACs. The analysis of the data in Table 7 indicates that PAR was adsorbed most effectively on Wal-KOH (qm = 437.8 mg/g) and least effectively on Pis-NaOH (qm = 332.2 mg/g). Considering the adsorption capacities of the ACs, they can be ranked in the following order: Pis-NaOH < Pea-NaOH < Wal-NaOH < Pis-KOH < Pea-KOH < Wal-KOH. The observed order is consistent with the BET surface areas of these ACs (Table 3). PAR was preferentially adsorbed on the adsorbent (Wal-KOH) with the highest specific surface area (SBET = 2040 m2/g). The least effective adsorbent was Pis-NaOH, the AC with the lowest specific surface area (SBET = 1710 m2/g). Thus, the observed correlation between the adsorption capacity of ACs and their BET area allows for the conclusion that the PAR adsorption on nutshell ACs depends on the adsorbents’ porous structure.
However, adsorption depends not only on the textural properties of the adsorbent but also on its surface chemistry (type and amount of surface functional groups). Studies of the effect of the activated carbon surface chemistry on PAR adsorption [45,46,47] have shown that the greater presence of oxygenated surface functional groups decreases adsorption and that PAR adsorption is favored on alkaline activated carbons. Increasing the acidity of the AC surface decreases the capacity of the adsorbent toward PAR and vice versa; increasing the alkaline character improves the adsorption. Analyzing the pHPZC values and the ratio of acidic to basic groups (Table 4), it can be seen that the AC with the most acidic character is Pis-KOH. On the other hand, the surface of Wal-NaOH has the most alkaline character. The order of the acidity of the compounds, sorted from most acidic to most alkaline, is as follows: Pis-KOH < Pea-KOH < Wal-KOH < Pis-NaOH < Pea-NaOH < Wal-NaOH. If adsorption depended solely on the adsorbent surface chemistry, one would expect that the adsorption capacity should increase in precisely the same order. However, this is not the case. The observed increase in the adsorption capacity of ACs (an increase in qm but also KF) is closely correlated with their porosity and BET surface area rather than with an increase in the alkaline nature of their surface. This leads to the conclusion that the PAR adsorption on nutshell ACs depends on the porous structure of the adsorbents rather than on their surface chemistry. However, surface chemistry cannot be completely ignored. Surface functional groups, although they seem to play a secondary role here, also have an effect on adsorption (further increasing or decreasing it).
The adsorption mechanism of PAR on various adsorbents, including activated carbons, has been the subject of numerous publications, which have been summarized in a recently published review [40]. The adsorption mechanism of PAR on activated carbons (ACs) involves a combination of several interactions. These include pore filling, hydrogen bonding, van der Waals forces, hydrophobic interactions, n-π, π-π interactions, and electrostatic (attractive or repulsive) interactions [40,41,42]. In this work, all experiments were conducted at the natural (original) pH of ~6.3. As described in Section 3.3.1, the AC surface is positively charged under such conditions, and the PAR molecule is undissociated. Therefore, electrostatic attraction as a possible adsorption mechanism can be ignored in this study. Nguyen et al. [41] postulated that the pore filling was the most important mechanism of PAR adsorption on activated carbon. The order of the contribution of the mechanism in PAR adsorption, according to the authors of this paper [41], can be expressed as follows: pore-filling > n-π interaction > π-π interaction > H-bonding. These mechanisms can occur simultaneously, increasing the final adsorption efficiency. These mechanisms, i.e., mainly pore-filling but also n-π and π-π interactions and hydrogen bonding, are expected to be responsible for the adsorption of PAR on nutshell-derived ACs.
Table 9 compares the adsorption capacities of ACs derived from nutshells with other carbonaceous adsorbents documented in the literature. The qm values, calculated using the Langmuir model, were used for this comparison.
The activated carbons described in this paper have excellent adsorption capacities for PAR. Their adsorption capacities are significantly higher than most adsorbents in the table. This proves that walnut, peanut, and pistachio nutshells are excellent precursors for the production of activated carbons with a high specific surface area and adsorption capacity. A detailed comparison of the different adsorbents used for the removal of PAR from water is reported in a review paper [40].

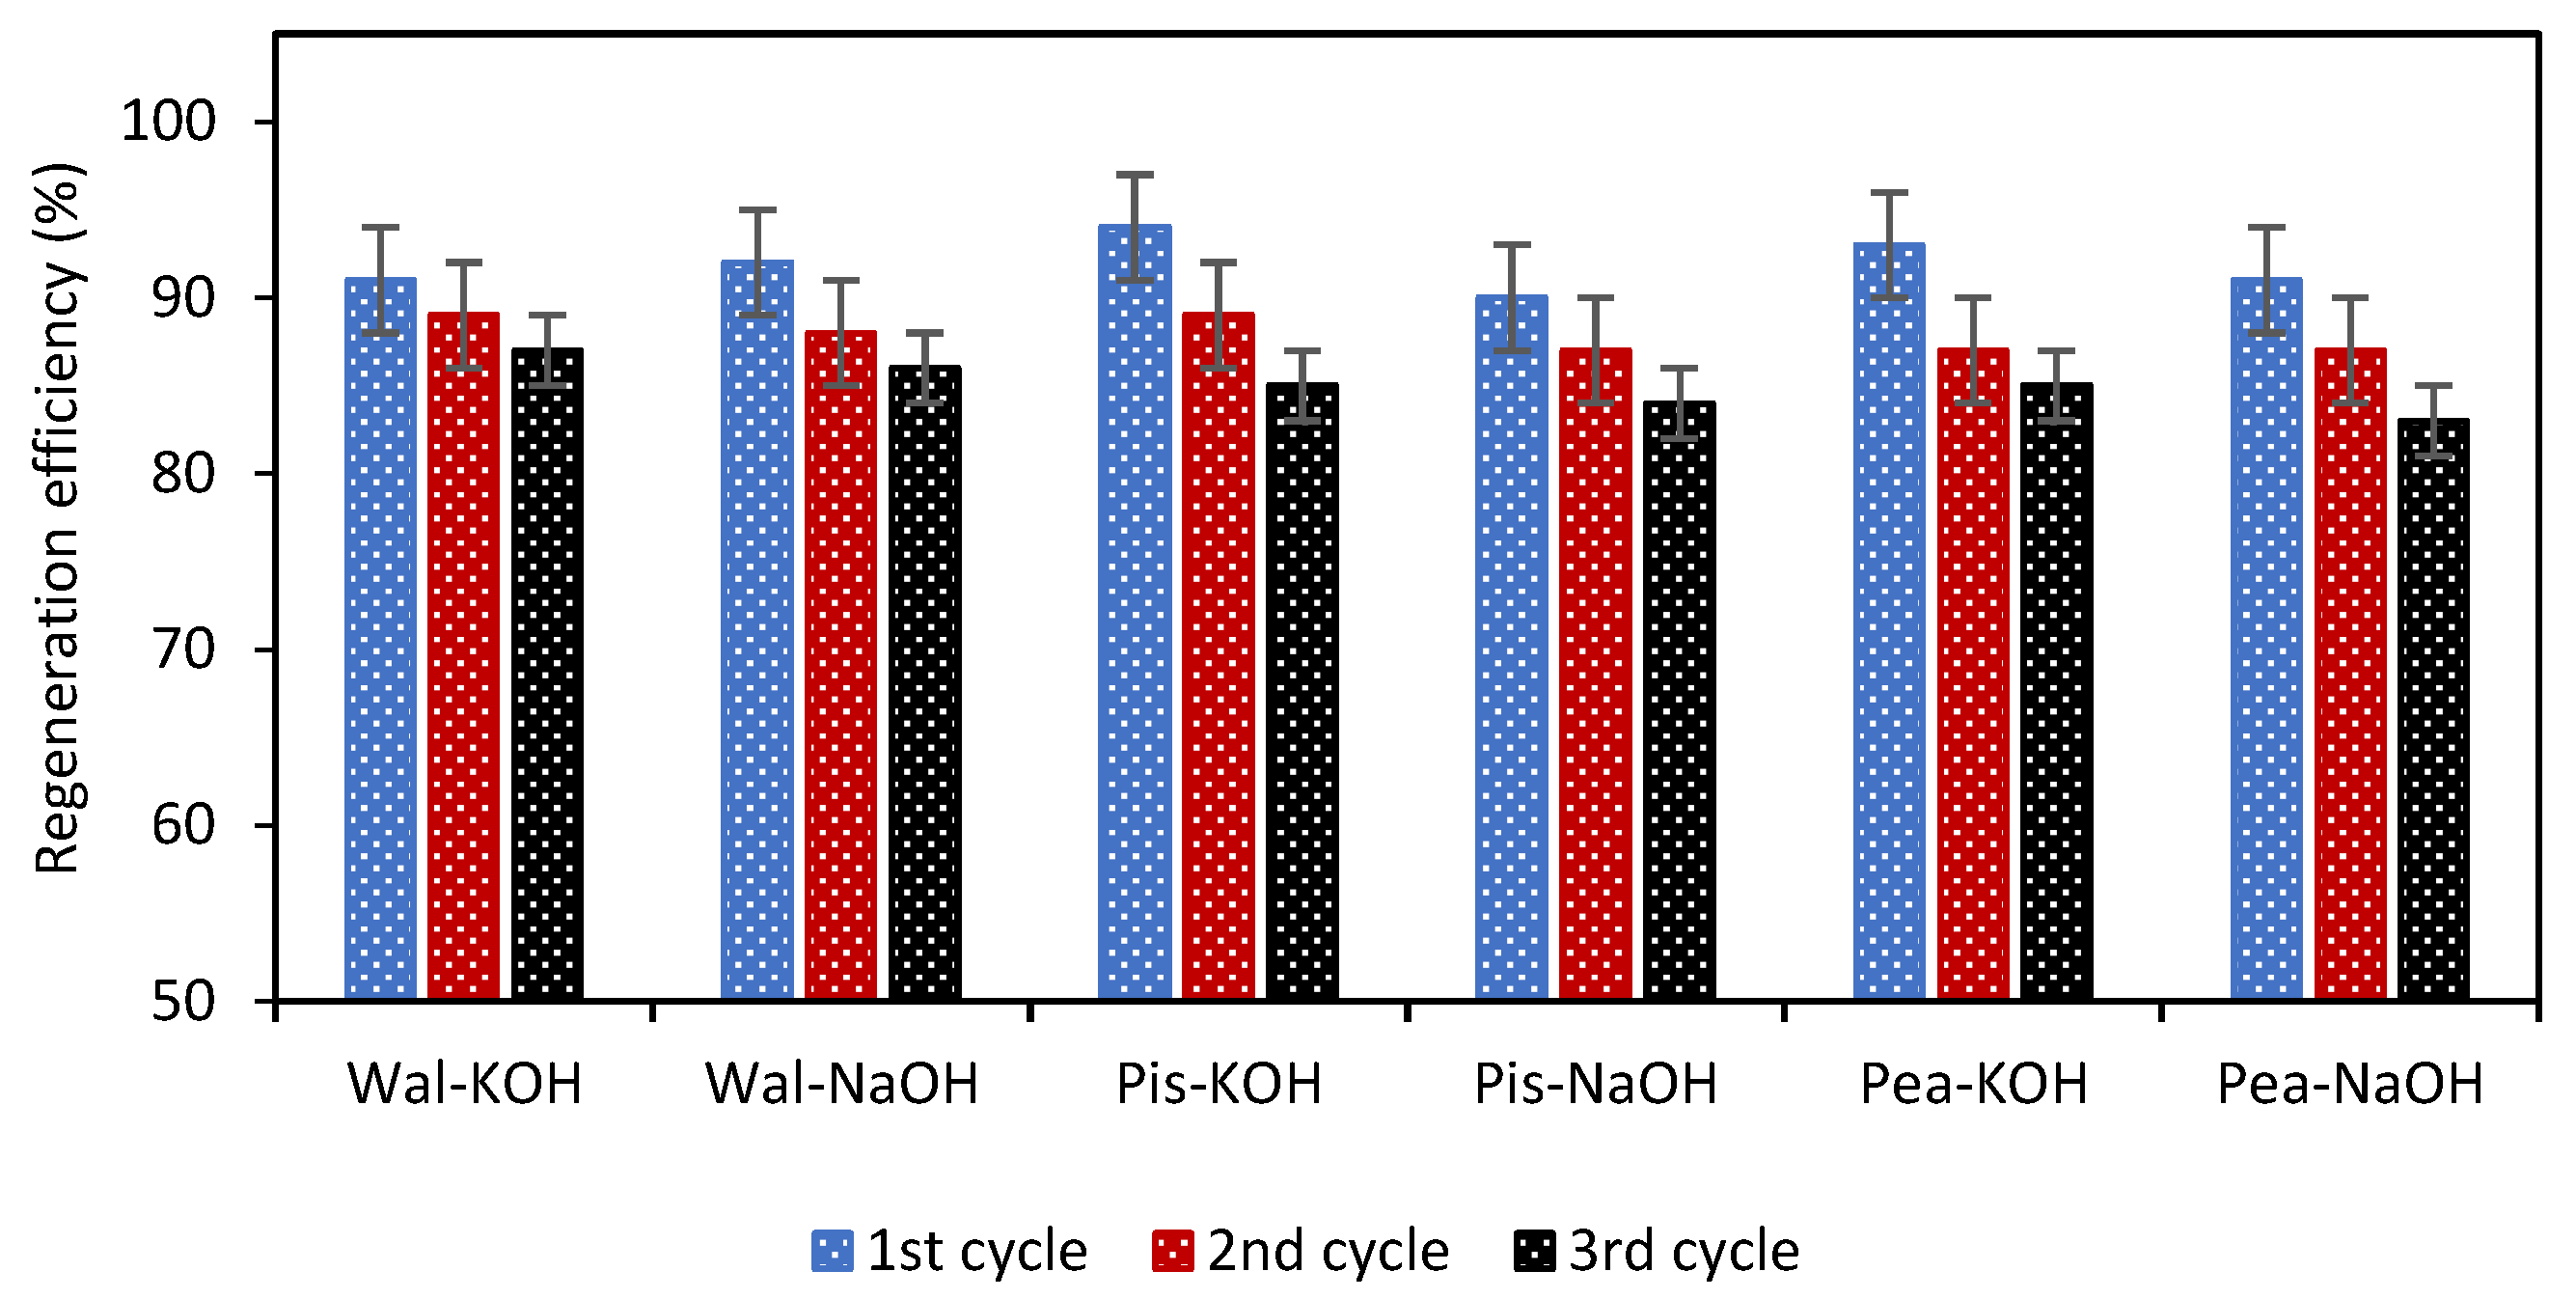
3.4. The Regeneration and Reuse of the Activated Carbons

From an economic and environmental point of view, an important aspect of adsorption is its reversibility and the regeneration of the adsorbent. Recovering the adsorbate and subsequently regenerating and reusing the adsorbent minimizes the need for a new adsorbent and reduces the disposal problems of the spent adsorbent. In this study, the regeneration and reusability of the ACs were ensured by using three consecutive adsorption–desorption cycles with methanol as the desorbing agent. The results are presented in Figure 8.
After the first regeneration, the adsorption capacities of these ACs decreased on average by approximately 8% and ranged from 90% for Pis-NaOH to 94% for Pis-KOH. After three subsequent cycles, the average adsorption capacity of all ACs remained at about 85% (from 83% for Pea-NaOH to 87% for Wal-KOH). These results confirm the high stability and usefulness of these materials. For comparison, the regeneration efficiency of three commercial ACs used for the adsorption of PAR after three adsorption–desorption cycles was more than 80% [30]. The adsorption capacity of citrus-waste-derived ACs was maintained at around 87% after six cycles [43], while the PAR adsorption by the regenerated AC from peanut shells [51] was around 71% after the fifth cycle. El Saied et al. [42] reported that after five adsorption–desorption cycles, the adsorption efficiency of PAR on the AC prepared from orange peels was reduced to 90.7%.

4. Conclusions

The activated carbons were synthesized from agricultural waste, such as walnut, peanut, and pistachio nutshells, by chemical activation at 750 °C. The use of alkaline activators (NaOH and KOH) resulted in highly porous activated carbons with a very high specific surface area (1710–2040 m2/g). The obtained ACs proved to be very effective adsorbents for the removal of paracetamol from water. Batch adsorption studies showed that the adsorption was pH-dependent and preferably occurred in an acidic environment. The kinetics were analyzed using the pseudo-first-order, pseudo-second-order, and diffusion kinetic models, while the equilibrium data were tested using the Langmuir, Freundlich, and Temkin isotherm equations. Kinetic studies revealed that PAR adsorption follows the pseudo-second-order, that the adsorption rate is affected by both the intraparticle and film diffusion steps, and that pore diffusion is not a rate-limiting step. The lowest k2 value (2.570·10−4 g/mg∙min) was observed for Pis-KOH and the highest (k2 = 4.024·10−4 g/mg∙min) for Pea-KOH. The adsorption at equilibrium follows the Langmuir model, suggesting the monolayer adsorption of PAR molecules on an energetically homogeneous adsorbent surface. The maximum adsorption capacities of ACs were very high, ranging from 332.2 mg/g (Pis-NaOH) to 437.8 mg/g (Wal-KOH), and were correlated with the BET surface areas of these ACs. The negative values of the Gibbs free energy change suggest that the adsorption process occurs spontaneously. Regeneration testing, conducted over three cycles, showed a more or less 15% reduction in the PAR adsorption capacity, which confirms the high stability and usefulness of these materials. This study demonstrated that the nutshells are useful, cost-effective, and sustainable precursors for the production of activated carbons, which can be used to efficiently remove paracetamol from water.

Supplementary Materials

The following supporting information can be downloaded at: https://www.mdpi.com/article/10.3390/pr13072198/s1, Figure S1: The pseudo-first-order kinetic model for the adsorption of PAR onto nutshell-derived ACs; Figure S2: The pseudo-second-order kinetic model for the adsorption of PAR onto nutshell-derived ACs; Figure S3: The linear Langmuir isotherm for the adsorption of PAR onto nutshell-derived ACs; Figure S4: The linear Freundlich isotherm model for the adsorption of PAR onto nutshell-derived ACs; Figure S5: The linear Temkin isotherm model for the adsorption of PAR onto nutshell-derived ACs.

Author Contributions

Conceptualization: B.D., K.K. and A.Ś.; methodology: B.D., K.K. and A.Ś.; formal analysis and investigation: B.D., K.K. and A.Ś.; preparation and characterization of activated carbons: B.D.; adsorption processes and their analysis: K.K. and A.Ś.; writing—original draft preparation: B.D., K.K. and A.Ś.; writing—review and editing: B.D.; visualization: K.K.; resources: B.D., K.K., and A.Ś.; supervision: A.Ś. All authors have read and agreed to the published version of the manuscript.

Funding

This research received no external funding.

Data Availability Statement

The datasets generated during and/or analyzed during the current study are available from the corresponding author on reasonable request.

Acknowledgments

The authors of this paper would like to thank all those who contributed to the realization of this work. Special thanks go to Monika Bartkowiak, who conducted thermogravimetric studies of activated carbons.

Conflicts of Interest

The authors declare no conflicts of interest.

References

  1. Khan, A.H.A.; Barros, R. Pharmaceuticals in Water: Risks to Aquatic Life and Remediation Strategies. Hydrobiology 2023, 2, 395–409. [Google Scholar] [CrossRef]
  2. Hejna, M.; Kapuścińska, D.; Aksmann, A. Pharmaceuticals in the Aquatic Environment: A Review on Eco-Toxicology and the Remediation Potential of Algae. Int. J. Environ. Res. Public Health 2022, 19, 7717. [Google Scholar] [CrossRef] [PubMed]
  3. Dolatimehr, A.; Mahyar, A.; Barough, S.P.H.; Mahmoodi, M. Insights into the efficiencies of different biological treatment systems for pharmaceuticals removal: A review. Water Environ. Res. 2024, 96, e11153. [Google Scholar] [CrossRef] [PubMed]
  4. Boroń, M.; Pawlas, K. Farmaceutyki w środowisku wodnym–przegląd literatury Pharmaceuticals in aquatic environment–literature review. Probl. Hig. Epidemiol. 2015, 96, 357–363. [Google Scholar]
  5. Umar, M.; Azis, H.A. Photocatalytic Degradation of Organic Pollutants in Water. In Organic Pollutants-Monitoring, Risk and Treatment; Rashed, M.N., Ed.; InTech: Rijeka, Croatia, 2013. [Google Scholar] [CrossRef]
  6. Abdel-Fatah, M.A. Nanofiltration systems and applications in wastewater treatment: Review article. Ain Shams Eng. J. 2018, 9, 3077–3092. [Google Scholar] [CrossRef]
  7. Yang, Z.; Zhou, Y.; Feng, Z.; Rui, X.; Zhang, T.; Zhang, Z.A. Review on Reverse Osmosis and Nanofiltration Membranes for Water Purification. Polymers 2019, 11, 1252. [Google Scholar] [CrossRef]
  8. Garcia-Segura, S.; Ocon, J.D.; Chong, M.N. Electrochemical oxidation remediation of real wastewater effluents—A review. Process Saf. Environ. Prot. 2018, 113, 48–67. [Google Scholar] [CrossRef]
  9. Finn, M.; Giampietro, G.; Mazyck, D.; Rodriguez, R. Activated Carbon for Pharmaceutical Removal at Point-of-Entry. Processes 2021, 9, 1091. [Google Scholar] [CrossRef]
  10. Brigante, M.; Avena, M. Biotemplated synthesis of mesoporous silica for doxycycline removal. Effect of pH, temperature, ionic strength and Ca2+ concentration on the adsorption behavior. Microporous Mesoporous Mater. 2016, 225, 534–542. [Google Scholar] [CrossRef]
  11. Zhou, Y.; He, Y.; Xiang, Y.; Meng, S.; Liu, X.; Yu, J.; Yang, J.; Zhang, J.; Qin, P.; Luo, L. Single and simultaneous adsorption of pefloxacin and Cu (II) ions from aqueous solutions by oxidized multiwalled carbon nanotube. Sci. Total Environ. 2019, 646, 29–36. [Google Scholar] [CrossRef]
  12. Wang, Y.; Wang, X.; Li, J.; Li, Y.; Xia, S.; Zhao, J.; Minale, T.M.; Gu, Z. Coadsorption of tetracycline and copper (II) onto struvite loaded zeolite—An environmentally friendly product recovered from swine biogas slurry. Chem. Eng. J. 2019, 371, 366–377. [Google Scholar] [CrossRef]
  13. Ghemit, R.; Makhloufi, A.; Djebri, N.; Flilissa, A.; Zerroual, L.; Boutahala, M. Adsorptive removal of diclofenac and ibuprofen from aqueous solution by organobentonites: Study in single and binary systems. Groundw. Sustain. Dev. 2019, 8, 520–529. [Google Scholar] [CrossRef]
  14. Yao, N.; Zhang, X.T.; Yang, Z.; Yang, W.B.; Tian, Z.Q.; Zhang, L.M. Norfloxacin and Bisphenol-A removal using temperature-switchable graphene oxide. ACS Appl. Mater. Interfaces 2018, 10, 29083–29091. [Google Scholar] [CrossRef]
  15. Zhou, X.; Dong, C.; Yang, Z.; Tian, Z.Q.; Lu, L.S.; Yang, W.B.; Wang, Y.P.; Zhang, L.M.; Li, A.M.; Chen, J.Q. Enhanced adsorption of pharmaceuticals onto core-brush shaped aromatic rings-functionalized chitosan magnetic composite particles: Effects of structural characteristics of both pharmaceuticals and brushes. J. Cleaner Prod. 2018, 172, 1025–1034. [Google Scholar] [CrossRef]
  16. Xiang, Y.; Xu, Z.; Wei, Y.; Zhou, Y.; Yang, X.; Yang, Y.; Yang, J.; Zhang, J.; Luo, L.; Zhou, Z. Carbon-based materials as adsorbent for antibiotics removal: Mechanisms and influencing factors. J. Environ. Manag. 2019, 237, 128–138. [Google Scholar] [CrossRef] [PubMed]
  17. Mishra, R.K.; Singh, B.; Bishnu, A. A comprehensive review on activated carbon from pyrolysis of lignocellulosic biomass: An application for energy and the environment. Carbon Resour. Convers. 2024, 7, 100228. [Google Scholar] [CrossRef]
  18. Ukanwa, K.S.; Patchigolla, K.; Sakrabani, R.; Anthony, E.; Mandavgane, S. A Review of Chemicals to Produce Activated Carbon from Agricultural Waste Biomass. Sustainability 2024, 11, 6204. [Google Scholar] [CrossRef]
  19. Gonzalez-García, P. Activated carbon from lignocellulosics precursors: A review of the synthesis methods, characterization techniques and applications. Renew. Sust. Energ. Rev. 2018, 82, 1393–1414. [Google Scholar] [CrossRef]
  20. Antal, M.J. Biomass Pyrolysis: A Review of the Literature Part 1. Carbohydrate Pyrolysis; Boer, K.W., Duffie, J.A., Eds.; Advances in Solar Energy; American Solar Energy Society: Boulder, CO, USA, 1982; pp. 61–111. [Google Scholar]
  21. Cagnon, B.; Py, X.; Guillot, A.; Stoeckli, F.; Chambat, G. Contributions of hemicellulose, cellulose and lignin to the mass and the porous properties of chars and steam activated carbons from various lignocellulosic precursors. Bioresource Technol. 2009, 100, 292–298. [Google Scholar] [CrossRef]
  22. Vinod, A.; Pulikkalparambil, H.; Jagadeesh, P.; Rangappa, S.M.; Siengchin, S. Recent advancements in lignocellulose biomass-based carbon fiber: Synthesis, properties, and applications. Heliyon 2023, 9, e13614. [Google Scholar] [CrossRef]
  23. Seifert, K. Zur Frage der Cellulose-Schnellbestimmung nach der Acetylaceton-Methode. Das Papier 1960, 14, 104–106. [Google Scholar]
  24. Boehm, H.P. Surface oxides on carbon and their analysis: A critical assessment. Carbon 2002, 40, 145–149. [Google Scholar] [CrossRef]
  25. Kuśmierek, K.; Dąbek, L.; Świątkowski, A. The use of modified multi-walled carbon nanotubes for the removal of selected pharmaceuticals from the aqueous environment. Desalin. Water Treat. 2023, 288, 60–71. [Google Scholar] [CrossRef]
  26. Tan, K.L.; Hameed, B.H. Insight into the adsorption kinetics models for the removal of contaminants from aqueous solutions. J. Taiwan Inst. Chem. 2017, 74, 25–48. [Google Scholar] [CrossRef]
  27. Nasser, S.M.; Abbas, M.; Trari, M. Understanding the rate-limiting step adsorption kinetics onto biomaterials for mechanism adsorption control. Prog. React. Kinet. Mec. 2024, 49, 1–26. [Google Scholar] [CrossRef]
  28. Hamdaoui, O.; Naffrechoux, E. Modeling of adsorption isotherms of phenol and chlorophenols onto granular activated carbon. Part I. Two-parameter models and equations allowing determination of thermodynamic parameters. J. Hazard. Mater. 2007, 147, 381–394. [Google Scholar] [CrossRef]
  29. Zhou, X.; Zhou, X.X. The unit problem in the thermodynamic calculation of adsorption using the Langmuir equation. Chem. Eng. Commun. 2014, 201, 1459–1467. [Google Scholar] [CrossRef]
  30. Kuśmierek, K.; Dąbek, L.; Świątkowski, A. The influence of the shape and grain size of commercial activated carbons on their sorption efficiency towards organic water pollutants. Desalin. Water Treat. 2025, 321, 100996. [Google Scholar] [CrossRef]
  31. Antal, M.J.; Allen, S.G.; Dai, X.; Shimizu, B.; Tam, M.S.; Grønli, M. Attainment of the Theoretical Yield of Carbon from Biomass. Ind. Eng. Chem. Res. 2000, 39, 4024–4031. [Google Scholar] [CrossRef]
  32. Yang, W.; Shimizu, I.; Ono, T.; Kimura, Y. Preparation of biodegradable foam from walnut shells treated by subcritical water. J. Chem. Technol. Biotechnol. 2014, 90, 44–49. [Google Scholar] [CrossRef]
  33. Li, X.; Liu, Y.; Hao, J.; Wang, W. Study of Almond Shell Characteristics. Materials 2018, 11, 1782. [Google Scholar] [CrossRef] [PubMed]
  34. Jovičič, N.; Antonovič, A.; Matin, A.; Antolovič, S.; Kalambura, S.; Krička, T. Biomass Valorization of Walnut Shell for Liquefaction Efficiency. Energies 2022, 15, 495. [Google Scholar] [CrossRef]
  35. Cho, C.H.; Hatsu, M.; Takamizawa, K. The production of D-xylose by enzymatic hydrolysis of agricultural wastes. Water Sci. Technol. 2002, 45, 97–102. [Google Scholar] [CrossRef] [PubMed]
  36. Queirós, C.S.G.P.; Cardoso, S.; Lourenço, A.; Ferreira, J.; Miranda, I.; Lourenço, M.J.V.; Pereira, H. Characterization of walnut, almond, and pine nut shells regarding chemical composition and extract composition. Biomass Convers. Biorefin. 2020, 10, 175–188. [Google Scholar] [CrossRef]
  37. Robles, E.; Izaguirre, N.; Martin, A.; Moschou, D.; Labidi, J. Assessment of Bleached and Unbleached Nanofibers from Pistachio Shells for Nanopaper Making. Molecules 2021, 26, 1371. [Google Scholar] [CrossRef]
  38. Jadhav, B.; Roy, R.; Rahman, M.S.; Raynie, D.E. Extraction and Depolymerization of Lignin from Pine Sawdust and Pistachio Shells. Biomass 2022, 2, 348–357. [Google Scholar] [CrossRef]
  39. Figueiredo, J.L.; Pereira, M.F.R.; Freitas, M.M.A.; Orfao, J.J.M. Modification of the surface chemistry of activated carbons. Carbon 1999, 37, 1379–1389. [Google Scholar] [CrossRef]
  40. Aminul Islam, M.; Nazal, M.K.; Sajid, M.; Suliman, M.A. Adsorptive removal of paracetamol from aqueous media: A review of adsorbent materials, adsorption mechanisms, advancements, and future perspectives. J. Mol. Liq. 2024, 396, 123976. [Google Scholar] [CrossRef]
  41. Nguyen, D.T.; Tran, H.N.; Juang, R.-S.; Dat, N.D.; Tomul, F.; Ivanets, A.; Woo, S.H.; Hosseini-Bandegharaei, A.; Nguyen, V.P.; Chao, H.-P. Adsorption process and mechanism of acetaminophen onto commercial activated carbon. J. Environ. Chem. Eng. 2020, 8, 104408. [Google Scholar] [CrossRef]
  42. El Saied, M.; Shaban, S.A.; Mostafa, M.S.; El Naga, A.O.A. Efficient adsorption of acetaminophen from the aqueous phase using low-cost and renewable adsorbent derived from orange peels. Biomass Convers. Biorefin. 2024, 14, 2155–2172. [Google Scholar] [CrossRef]
  43. Gatrouni, M.; Asses, N.; Bedia, J.; Belver, C.; Molina, C.B.; Mzoughi, N. Acetaminophen Adsorption on Carbon Materials from Citrus Waste. C 2024, 10, 53. [Google Scholar] [CrossRef]
  44. Al-Rub, F.A.A.; Fares, M.M.; Al-Banna, L.N. Toward Cleaner Ecosystems; Elimination of Paracetamol Drug via Mesoporous Activated Carbon Date Pits. Chem. Sci. Int. J. 2024, 33, 1–21. [Google Scholar] [CrossRef]
  45. Terzyk, A.P.; Rychlicki, G. The influence of activated carbon surface chemical composition on the adsorption of acetaminophen (paracetamol) in vitro: The temperature dependence of adsorption at the neutral pH. Colloids Surf. A Physicochem. Eng. Asp. 2000, 163, 135–150. [Google Scholar] [CrossRef]
  46. Terzyk, A.P. The influence of activated carbon surface chemical composition on the adsorption of acetaminophen (paracetamol) in vitro: Part II. TG, FTIR, and XPS analysis of carbons and the temperature dependence of adsorption kinetics at the neutral pH. Colloids Surf. A Physicochem. Eng. Asp. 2001, 177, 23–45. [Google Scholar] [CrossRef]
  47. Bernal, V.; Erto, A.; Giraldo, L.; Moreno-Piraján, J.C. Effect of Solution pH on the Adsorption of Paracetamol on Chemically Modified Activated Carbons. Molecules 2017, 22, 1032. [Google Scholar] [CrossRef]
  48. Lladó, J.; Lao-Luque, C.; Ruiz, B.; Fuente, E.; Solé-Sardans, M.; Dorado, A.D. Role of activated carbon properties in atrazine and paracetamol adsorption equilibrium and kinetics. Process Saf. Environ. Prot. 2015, 95, 51–59. [Google Scholar] [CrossRef]
  49. Hamadneh, I.; Abu-Zurayk, R.A.; Aqel, A.; Al-Mobydeen, A.; Hamadneh, L.; Al-Dalahmeh, Y.; Hannoon, F.; Albuqain, R.; Alsotari, S.; Al-Dujaili, A.H. Impact of H3PO4-activated carbon from pine fruit shells for paracetamol adsorption from aqueous solution. Desalin. Water Treat. 2022, 264, 293–306. [Google Scholar] [CrossRef]
  50. Bursztyn Fuentes, A.L.; Benito, D.E.; Montes, M.L.; Scian, A.N.; Lombardi, M.B. Paracetamol and Ibuprofen Removal from Aqueous Phase Using a Ceramic-Derived Activated Carbon. Arab. J. Sci. Eng. 2023, 48, 525–537. [Google Scholar] [CrossRef]
  51. Mandal, S.; Stephen, D.; Janardhanan, S.K. Activated carbon with composite pore structures made from peanut shell and areca nut fibers as sustainable adsorbent material for the efficient removal of active pharmaceuticals from aqueous media. RSC Sustain. 2024, 2, 3022–3035. [Google Scholar] [CrossRef]
  52. Wong, S.; Lim, Y.; Ngadi, N.; Mat, R.; Hassan, O.; Inuwa, I.M.; Mohamed, N.B.; Low, J.H. Removal of acetaminophen by activated carbon synthesized from spent tea leaves: Equilibrium, kinetics and thermodynamics studies. Powder Technol. 2018, 338, 878–886. [Google Scholar] [CrossRef]
  53. Haro, N.K.; Dávila, I.V.J.; Nunes, K.G.P.; de Franco, M.A.E.; Marcilio, N.R.; Féris, L.A. Kinetic, equilibrium and thermodynamic studies of the adsorption of paracetamol in activated carbon in batch model and fixed-bed column. Appl. Water Sci. 2021, 11, 38. [Google Scholar] [CrossRef]
  54. Ramli, M.R.M.; Shoparwe, N.F.; Ahmad, M.A.; Yusop, M.F.M. Acetaminophen removal using porous activated carbon derived from corn cob: Optimization and mass transfer modelling. J. Chem. Technol. Biotechnol. 2024, 99, 2088–2106. [Google Scholar] [CrossRef]
Figure 1. Nitrogen adsorption–desorption isotherms of the nutshell AC samples at −196 °C.
Processes 13 02198 g001
Figure 2. Example SEM images of activated carbons prepared from walnut shells: (a) Wal-KOH and (b) Wal-NaOH.
Processes 13 02198 g002aProcesses 13 02198 g002b
Figure 3. The effect of the solution pH on the adsorption of paracetamol on nutshell-derived activated carbons.
Processes 13 02198 g003
Figure 4. Adsorption kinetics of PAR on ACs produced from nutshells (line: fitting of the PSO kinetic model).
Processes 13 02198 g004
Figure 5. The Weber–Morris diffusion model plots for the adsorption of PAR on nutshell-derived ACs.
Processes 13 02198 g005
Figure 6. The removal efficiency of the PAR onto nutshell-derived ACs.
Processes 13 02198 g006
Figure 7. Adsorption isotherms of PAR from aqueous solutions on nutshells-derived ACs (line: fitting of the Langmuir isotherm).
Processes 13 02198 g007
Figure 8. Regeneration of ACs loaded with paracetamol by successive adsorption–desorption cycles.
Processes 13 02198 g008
Table 1. Physicochemical properties of paracetamol.
CAS No.103-90-2
Empirical formulaC8H9NO2
StructureProcesses 13 02198 i001
Molecular weight (g/mol)151.165
Water solubility (g/L)14
pKa9.53
Data in the table are from Acros Organics.
Table 2. Contents of the main components of the studied nutshells.
NutshellsContent (%)
CelluloseHolocelluloseLigninHemicelluloses
walnut27.2156.1639.2328.95
peanut44.8466.5731.4421.73
pistachio43.0580.3516.9137.30
Table 3. Textural properties of the nutshell-derived activated carbons.
SampleSBET
(m2/g)
VT
(cm3/g)
Vmi
(cm3/g)
Vme
(cm3/g)
Vmi/VT
(%)
dh
(nm)
Wal-KOH20401.1070.9580.14986.52.17
Wal-NaOH18651.0790.9100.16984.32.32
Pis-KOH19801.0360.9080.12887.62.10
Pis-NaOH17101.0540.8530.20180.92.47
Pea-KOH19951.2960.9850.31176.02.60
Pea-NaOH17951.2260.9200.30675.02.73
Table 4. Chemical properties of the surface of the activated carbons from nutshells.
AC SampleTypes of Acidic Groups [mmol/g]Overall Acidity [mmol/g]Overall Basicity [mmol/g]Acidic/Basic Groups RatiopHPZC
PhenolicLactonicCarboxylic
Wal-KOH0.510.400.040.950.791.206.90
Wal-NaOH0.630.200.030.860.990.877.20
Pis-KOH0.780.390.021.190.781.526.70
Pis-NaOH0.530.250.050.830.791.057.05
Pea-KOH0.890.390.031.310.991.326.85
Pea-NaOH0.630.170.020.820.890.927.15
Table 5. Mass loss for ACs samples obtained from TG analysis.
SampleMass Loss (%) in Temperature Range (°C)
200–400400–700700–900Σ 200–900
Wal-KOH2.858.995.8317.69
Wal-NaOH2.648.035.5116.18
Pis-KOH2.928.135.7816.83
Pis-NaOH2.787.865.7916.43
Pea-KOH2.518.615.8917.01
Pea-NaOH2.277.085.2714.62
Table 6. Kinetic parameters for adsorption of PAR from aqueous solutions on nutshell-derived ACs.
Kinetic ModelActivated Carbon
Wal-KOHWal-NaOHPis-KOHPis-NaOHPea-KOHPea-NaOH
qe(EXP) (mg/g)347.3324.3339.9290.3330.2306.1
PFO
qe1(CAL) (mg/g)309.6251.4369.9182.9259.2167.3
k1 (1/min)0.04120.02630.04140.02610.02210.0235
R20.9420.9760.9380.9620.9690.960
RMSE56.340.150.248.421.919.5
PSO
qe2(CAL) (mg/g)357.1333.3357.1303.0344.8322.6
k2 (g/mg∙min)3.16·10−43.33·10−42.57·10−43.41·10−44.02·10−43.55·10−4
R20.9990.9990.9980.9990.9990.998
RMSE10.513.820.19.081.241.3
Table 7. The isotherm parameters for the adsorption of PAR on ACs produced from nutshells.
Isotherm ModelActivated Carbon
Wal-KOHWal-NaOHPis-KOHPis-NaOHPea-KOHPea-NaOH
Langmuir
qm (mg/g)437.8383.1408.1332.2411.5359.7
KL (L/mg)0.2590.4020.3540.3580.2680.290
R20.9940.9980.9930.9990.9970.995
RMSE5.554.226.313.225.925.29
Freundlich
KF ((mg/g) (L/mg)1/n)172.0188.4160.5147.9162.6149.9
1/n0.2440.2470.2310.2850.2890.299
R20.9920.9910.9660.9680.9700.990
RMSE7.1412.820.922.115.68.21
Temkin
AT (L/g)4.0308.4709.8269.8554.3077.194
bT (kJ/mol)30.0735.2337.0440.8632.0237.77
R20.9870.9850.9840.9830.9900.991
RMSE15.414.67.5015.28.568.16
Table 8. The values of the separation factors (RL) and the Gibbs free energy change (ΔG°) for the adsorption of PAR on ACs from nutshells.
ACsΔG° (kJ/mol)Separation Factor (RL)
min.max.
Wal-KOH−23.60.0310.072
Wal-NaOH−24.70.0200.047
Pis-KOH−24.30.0230.053
Pis-NaOH−24.40.0220.052
Pea-KOH−23.70.0310.069
Pea-NaOH−23.80.0280.064
Table 9. Comparison of paracetamol adsorption on various carbonaceous adsorbents.
AdsorbentSurface Area
(m2/g)
Adsorption Capacity
(mg/g)
Ref.
Wal-KOH2041437.8This study
Wal-NaOH1864383.1This study
Pis-KOH1978408.1This study
Pis-NaOH1710332.2This study
Pea-KOH1995411.5This study
Pea-NaOH1794359.7This study
commercial WG12980277.3[30]
Filtrasorb-400 (F-400)1234261.1[48]
AC from pine fruit shells1022256.4[49]
GS50 AC (reduced)816245.7[47]
commercial AC1248221.0[41]
commercial L2S960208.3[30]
commercial F300995250.1[30]
AC from date pits838196.0[44]
commercial GS50 AC842183.4[47]
Norit PK 1-3 (NPK)782150.1[48]
commercial AC (Clarimex)1050146.2[50]
AC from orange peels1069118.0[42]
ceramic-derived AC895109.8[50]
GS50 AC (oxidized)876106.9[47]
AC from peanut shell (H3PO4)68967.57[51]
AC from spent tea leaves120359.19[52]
sludge-based AC (SBC)26053.75[48]
AC from citrus waste27349.00[43]
commercial AC (Exodus)54343.50[53]
carbon nanotubes17929.85[25]
corn cob-based AC97621.14[54]
Disclaimer/Publisher’s Note: The statements, opinions and data contained in all publications are solely those of the individual author(s) and contributor(s) and not of MDPI and/or the editor(s). MDPI and/or the editor(s) disclaim responsibility for any injury to people or property resulting from any ideas, methods, instructions or products referred to in the content.

