Article

Key Parameter Optimization Study of Composite Rod Drill in Gas Extraction Borehole Drilling in Soft, Medium, and Hard Coal Seams

1
China Coal Energy Research Institute Co., Ltd., Xi’an 710054, China
2
School of Safety Science and Engineering, Xi’an University of Science and Technology, Xi’an 710054, China
*
Author to whom correspondence should be addressed.
Processes 2025, 13(7), 2195; https://doi.org/10.3390/pr13072195
Submission received: 13 June 2025 / Revised: 4 July 2025 / Accepted: 7 July 2025 / Published: 9 July 2025
(This article belongs to the Section Energy Systems)

Abstract

To address the low drilling efficiency of the composite rod drill in gas extraction boreholes, key drilling parameters are optimized using coal-seam hardness grading tests and response surface methodology. By conducting mechanical tests on coal samples from the Sangshuping, Zhangcun, and Wangzhuang coal mines, the coal seams are classified into three categories: soft (Pus coefficient 0.87), medium–hard (2.16), and hard (3.47). Multi-factor and multi-level field tests were then performed at different working faces, using Design Expert software to analyze the response surface of three factors: pump pressure, flow rate, and feed pressure. The response surface method was used to determine the influence of drilling factors on drilling time under different coal-seam hardness conditions and the optimal drilling parameters. The results indicate that the technology is not suitable for soft coal seams due to frequent bit jamming. The optimal parameters for medium–hard coal seams are a pump pressure of 4 MPa, a flow rate of 180 L/min, and a feed pressure of 6 MPa (time per 100 m: 62 min 33 s). For hard coal seams, the optimal parameters are a pump pressure of 6 MPa, a flow rate of 200 L/min, and a feed pressure of 8 MPa (time per 100 m: 55 min 27 s). This study provides a theoretical basis for efficient coal seam drilling.

1. Introduction

At present, more than 70% of state-owned coal mines in China are classified as high-gas mines [1,2]. Gas-related natural hazards in coal mines severely affect and restrict mine safety and production [3,4,5]. Gas drainage is a critical aspect of ensuring safety in high-gas and outburst-prone coal mines in China [5,6,7]. The construction of gas drainage boreholes is the fundamental method for underground gas control. Through gas drainage boreholes, gas-related issues can be addressed directly and efficiently, reducing gas concentration in the working face to meet mining standards and resolving gas over-limit problems during extraction. Meanwhile, gas in the coal seams, as an associated resource, can be utilized following extraction [8,9,10]. However, the drilling efficiency of gas drainage boreholes is influenced by geological conditions, equipment performance, and process parameters.
The main drilling technology used in China is conventional rotary drilling technology. However, the improvement of coal mine safety production standards and safety awareness, along with the rapid advancement of drilling technology in mines, has led to the gradual inability of conventional rotary drilling technology to fully meet various mining drilling needs, with issues as follows: ① Poor cuttings discharge. When using conventional rotary drilling technology for coal-seam gas extraction drilling, the drilling efficiency is relatively low, especially during downhole drilling, where it is prone to poor cuttings discharge. ② Low drilling efficiency. Conventional rotary drilling technology for drilling along coal seams can only rely on the rotary power of the drilling machine to break the coal, and in deep-hole sections, the drilling machine cannot fully transmit torque and drilling speed to the drill bit through the drill rod, leading to low drilling efficiency [11,12]. To improve drilling efficiency, domestic coal mines have introduced screw drilling tools, which were first produced in the United States. In the 1990s, screw drilling tools achieved the drilling of a gas extraction well with a length of 1432.56 m [12]. Significant achievements have also been made in domestic screw drilling technology. For example, Shizhi Jun et al. [13] optimized the structure of screw drilling tools and adjusted drilling process parameters to achieve an adjustment of the borehole angle in a composite drilling state, further increasing the drilling depth ratio in composite drilling and significantly reducing system pressure. Bai Binzhen,[14] proposed a stratified drilling acceleration technology, which adopts large-torque rapid drilling in shallow layers and "crushing + releasing + shearing" drill bits in deep layers. Lu Zongyu et al. [15] established the relationship between wellhead load and drill-bit load, analyzed the output characteristics of screw drilling tools, and derived a mechanical energy model for composite drilling. Wang Guo et al. [16], based on the Teale model, comprehensively considered underground screw drilling tools and established a mechanical drilling speed-prediction model combining theory and data. Through case optimization analysis, this can significantly increase mechanical drilling speed and provide effective quantitative tools for speed-up tool selection. Zhang Xin et al. [17] addressed the problem that the combination of screw drilling tools and PDC drill bits does not perform well in abrasive formations, as the drill teeth often cannot effectively penetrate the formation, resulting in generally low mechanical drilling speeds. They developed a composite rotary impact drilling speed-up device, comparing the drilling speed of screw drilling tools combined with PDC drill bits and rotary impact, achieving a 113% increase in drilling speed. Kang Yuguo et al. [18], through the analysis of mining area geology and drilling process adaptability, optimized the design in five aspects: wellbore structure, PDC drill bits, drill tool combinations, drilling parameters, and trajectory control. They formed a key tool combination method of optimizing PDC drill bits and adding hydraulic single-bend screw tools, resulting in a rapid and precise drilling technology for large inclination, medium–soft, and water-rich complex strata. Existing research often focuses on single parameters and lacks multi-factor interaction analysis.
Based on this, this study focuses on three types of coal seams: soft, medium–hard, and hard. By combining coal mechanics tests and on-site drilling experiments, it uses the response surface method (RSM) to optimize composite screw drilling tool parameters, breaking through the limitations of traditional empirical methods.

2. Composite Screw Drill-Bit Technology

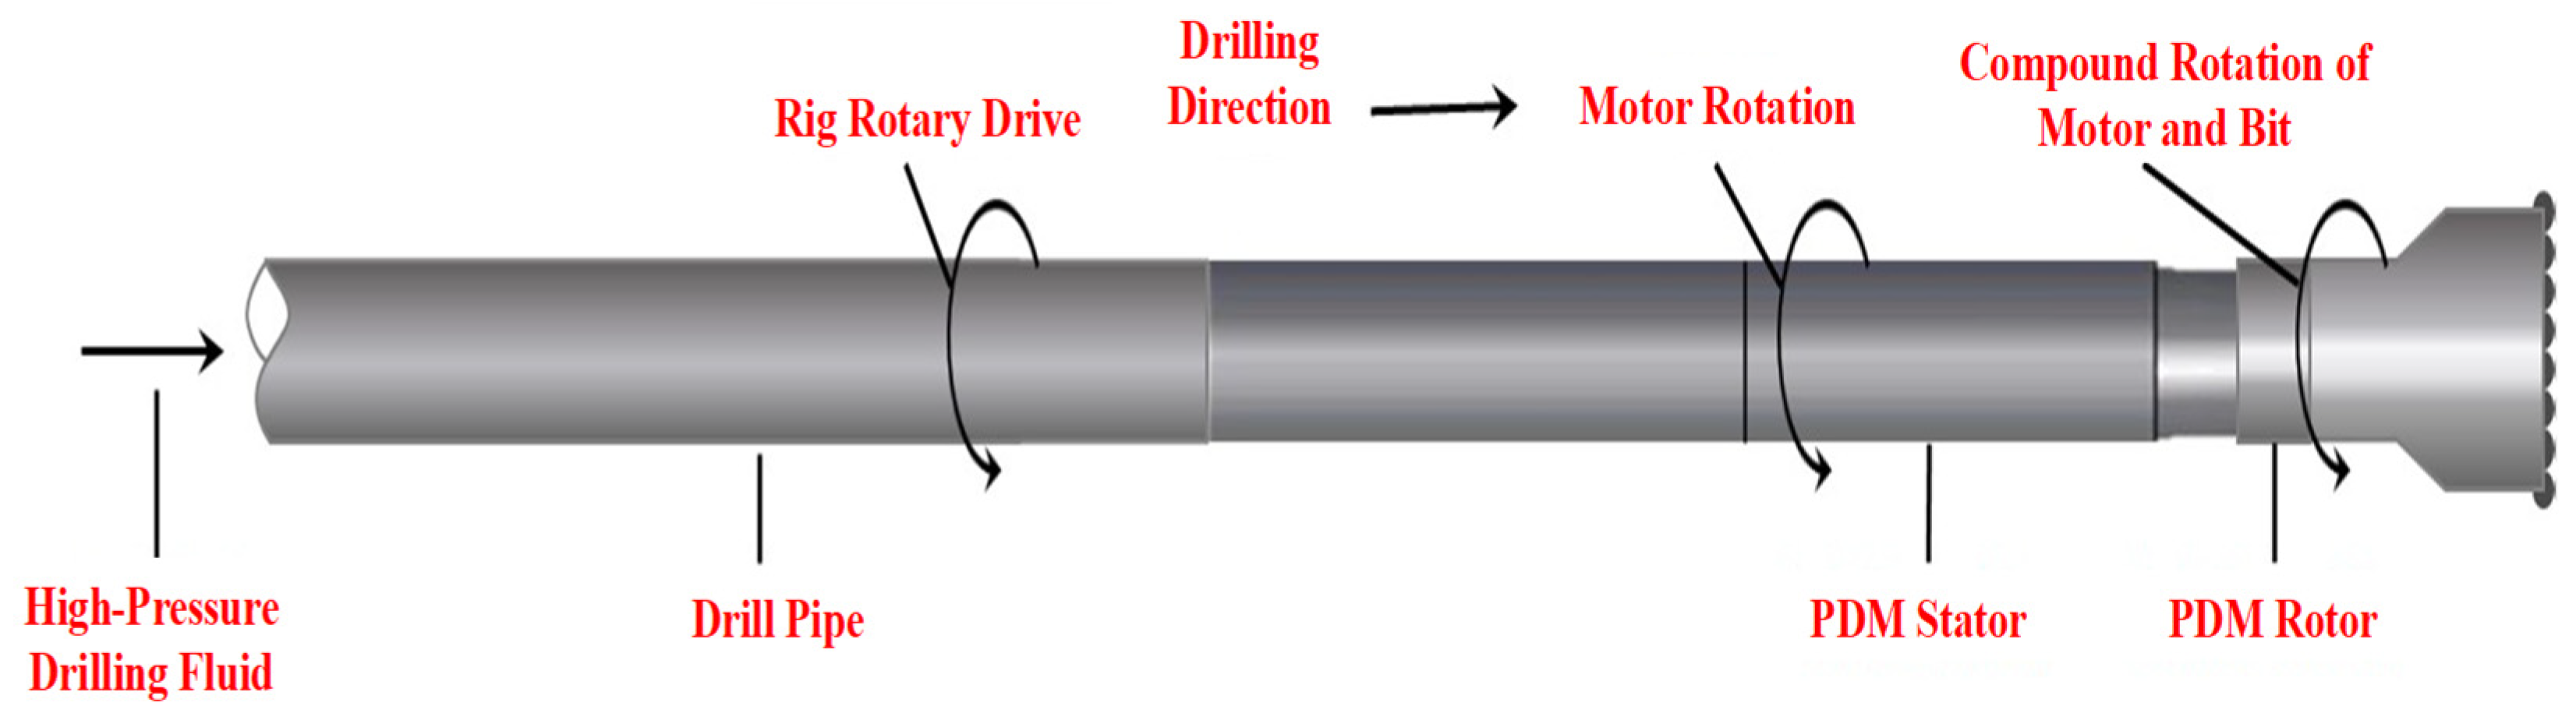
2.1. Structure Principle of the Screw Drill Bit

The screw drill bit, also known as a constant displacement motor [19], is a drilling acceleration device that converts the hydraulic energy of high-pressure drilling fluid pumped by a mud pump or high-pressure pump station into mechanical energy, which is transmitted to the drill bit via a drive shaft for drilling operations or hole-making tasks. It mainly consists of five parts: a bypass valve, a motor, a universal joint, a drive shaft, and an anti-fall device [20], as shown in Figure 1.
When the high-pressure drilling fluid pumped by the mud pump enters the screw drill bit, a sufficient pressure difference is generated at the inlet and outlet of the motor to drive the rotor inside the motor assembly to rotate at high speed under the restriction of the stator. The torque and rotational speed generated by the motor are transmitted to the drill bit via the universal joint, achieving the superimposed drilling speed and composite drilling effect.

2.2. Principle of Composite Screw Drill-Bit Drilling Technology

Composite screw drill-bit drilling technology is a drilling technique that combines the conventional rotary drilling of drilling rigs with screw drill-bit rotation, realizing the vector superposition of both drilling speed and torque. In this process, the rotation of the screw drill bit is driven by high-pressure drilling fluid injected through the drill rod pump from the high-pressure pump station or mud pump. This composite drilling combines the rotational breaking force of both the drilling rig and the screw drill bit during hole-making operations, optimizing the drilling performance. The principle of composite screw drill-bit drilling technology is shown in Figure 2.
Composite screw drill-bit drilling technology is similar to directional drilling technology [21,22]. The main difference between the two technologies is that directional drilling adjusts the tool face angle of the drill bit through a trajectory control system during drilling. In sections of the hole that require angling, axial load is applied to the drill bit using drilling thrust, and the drilling trajectory is controlled using sliding drilling and rotary drilling.
The composite screw drill-bit drilling technology proposed in this article is mainly applied to the horizontal drilling of coal seams. In the screw drill-bit structural principle, the universal joint with an angled shell is eliminated, so the tool face angle cannot be controlled during drilling. The entire drilling process relies on the vector superposition of the screw drill bit’s rotary power and the drilling rig’s rotary power, resulting in composite drilling and efficient coal breaking.
The application of composite screw drill-bit technology to the horizontal drilling of coal seams is primarily aimed at achieving the following objectives: ① The screw drill bit assists in drilling, providing sufficient coal fragmentation power to the drill bit at the bottom of the hole, improving mechanical efficiency and accelerating the drilling rate. ② The drilling trajectory is smooth, which helps to improve the discharge problems during drilling, prevents the formation of “coal-rock debris bridges,” and reduces the risk of stuck drilling. ③ It reduces the frictional resistance generated by the interaction between the drill bit and the borehole wall during drilling, ensuring that the drilling rig’s thrust force effectively acts on the drill bit, increasing the cutting area of the teeth on the coal–rock body.

3. Measurement of Coal Seam Mechanical Parameters and Hardness Classification

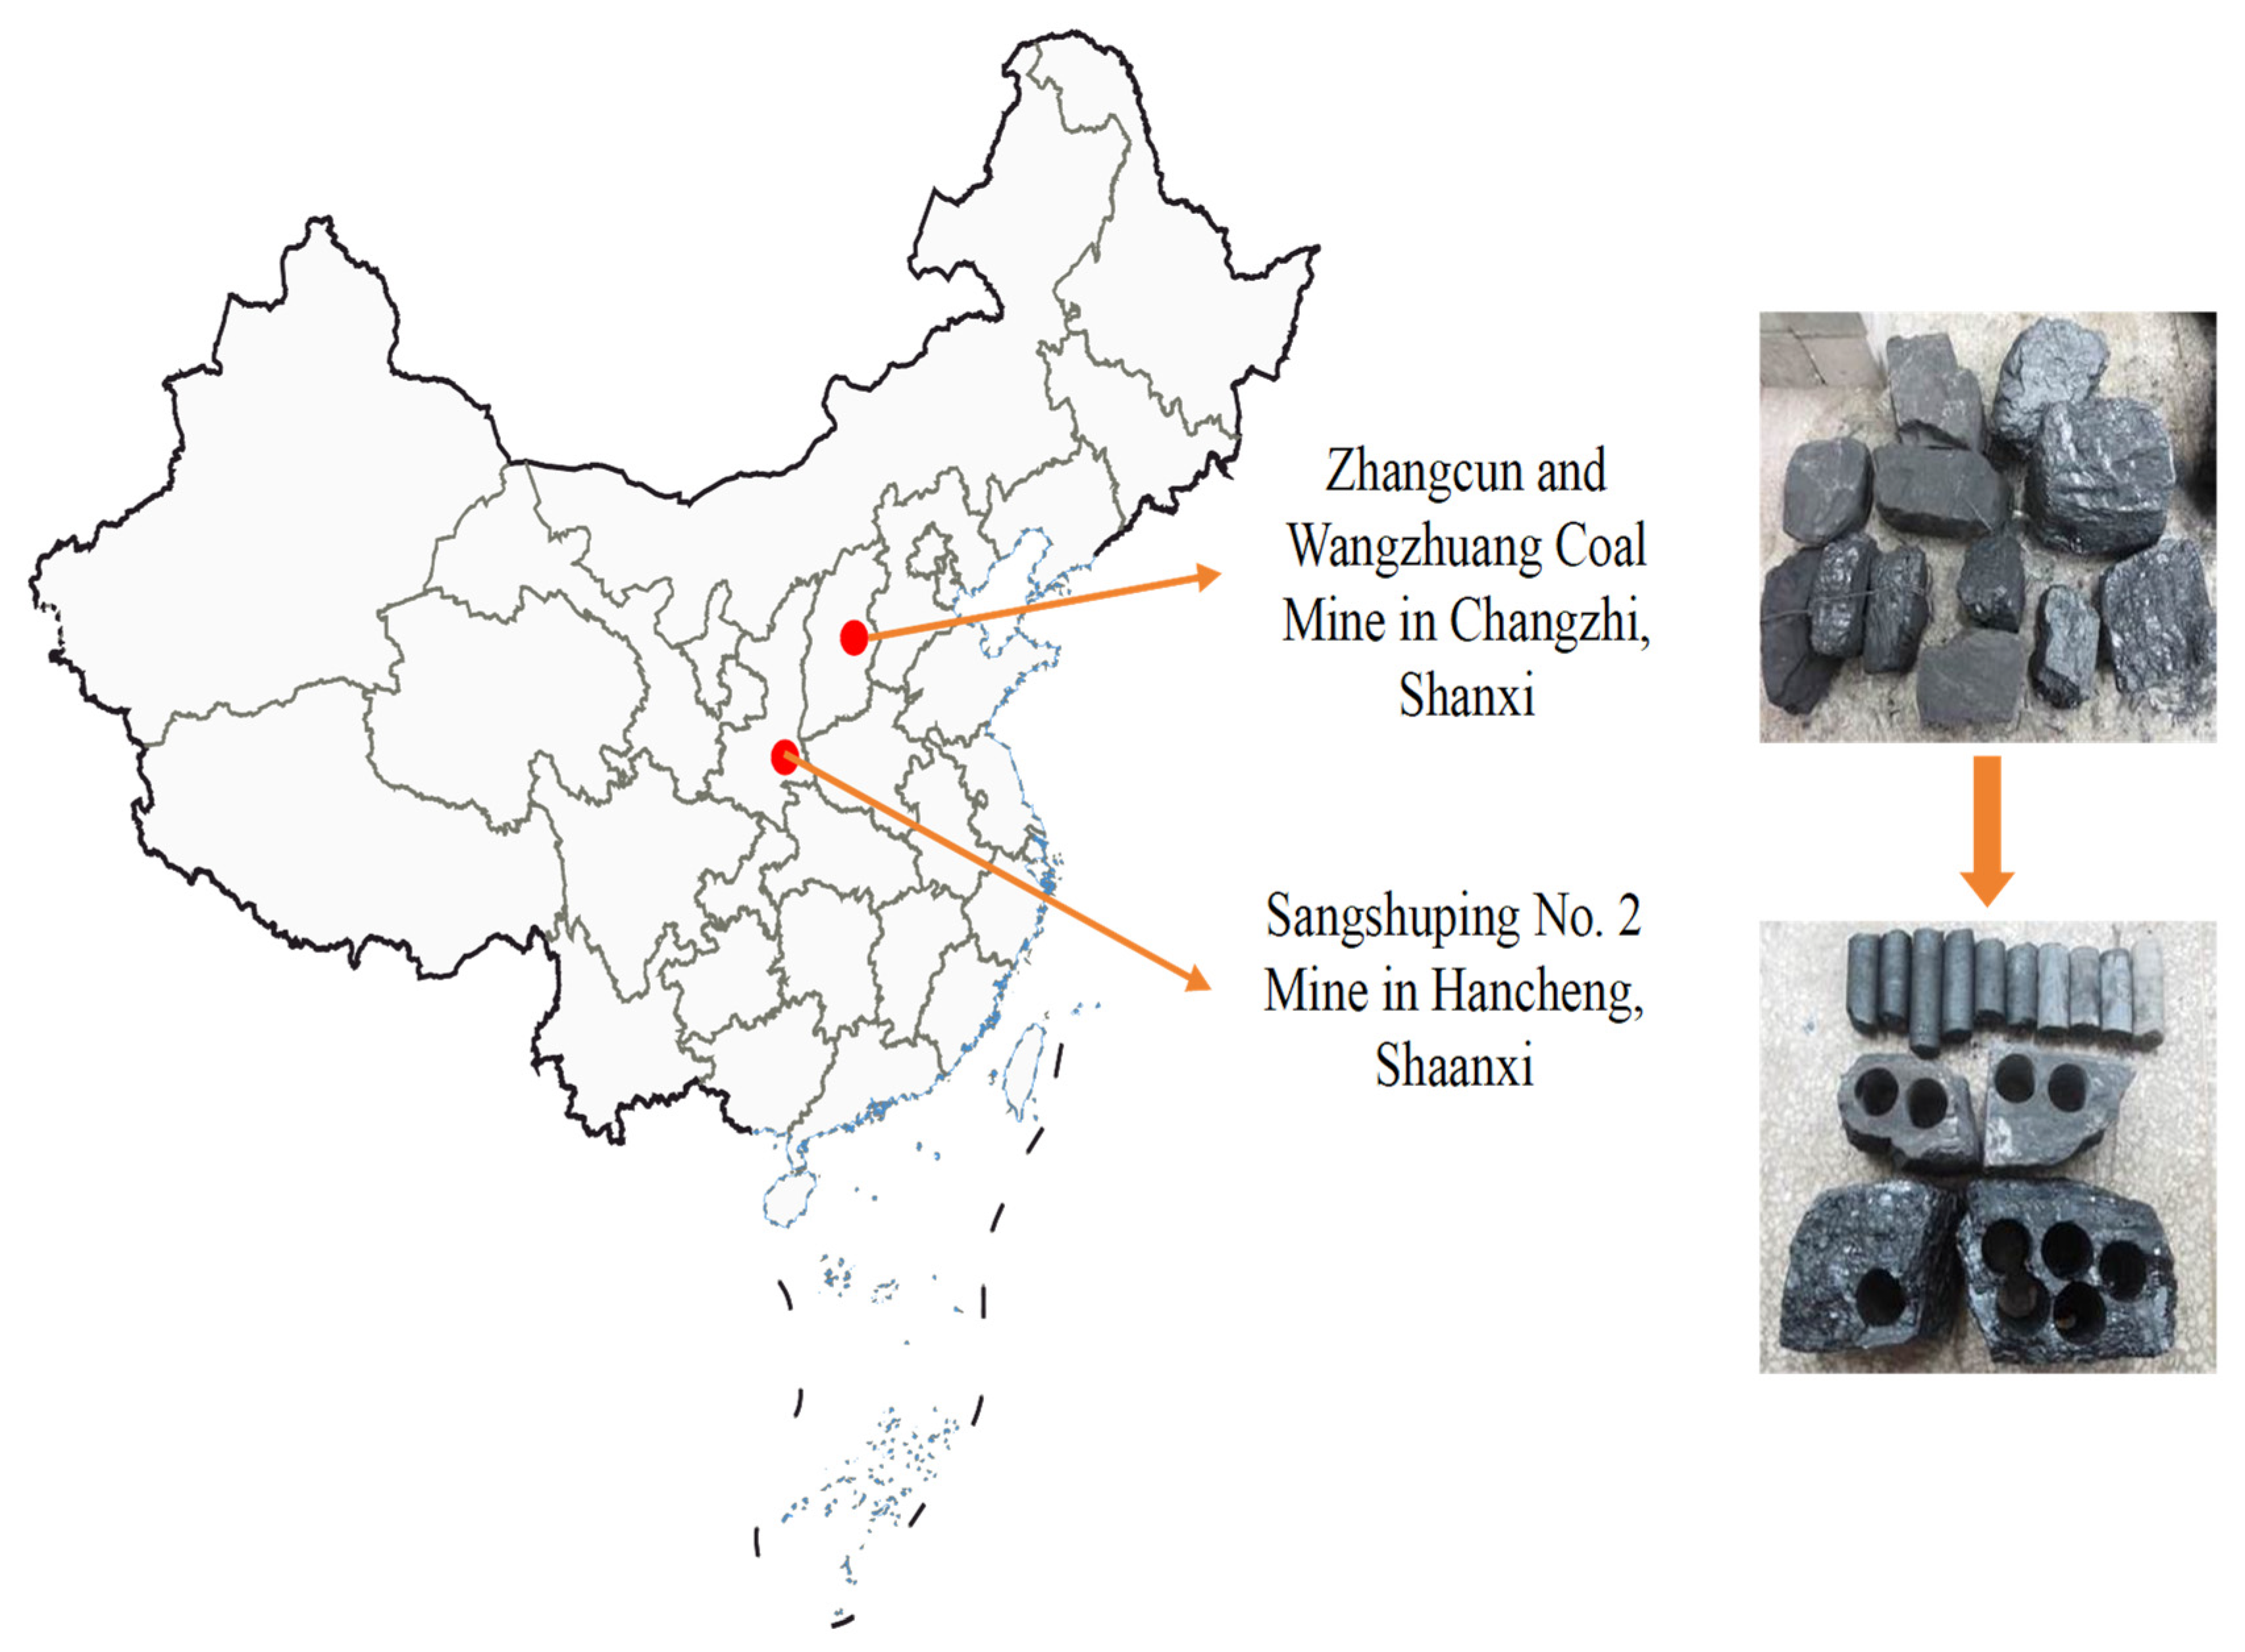
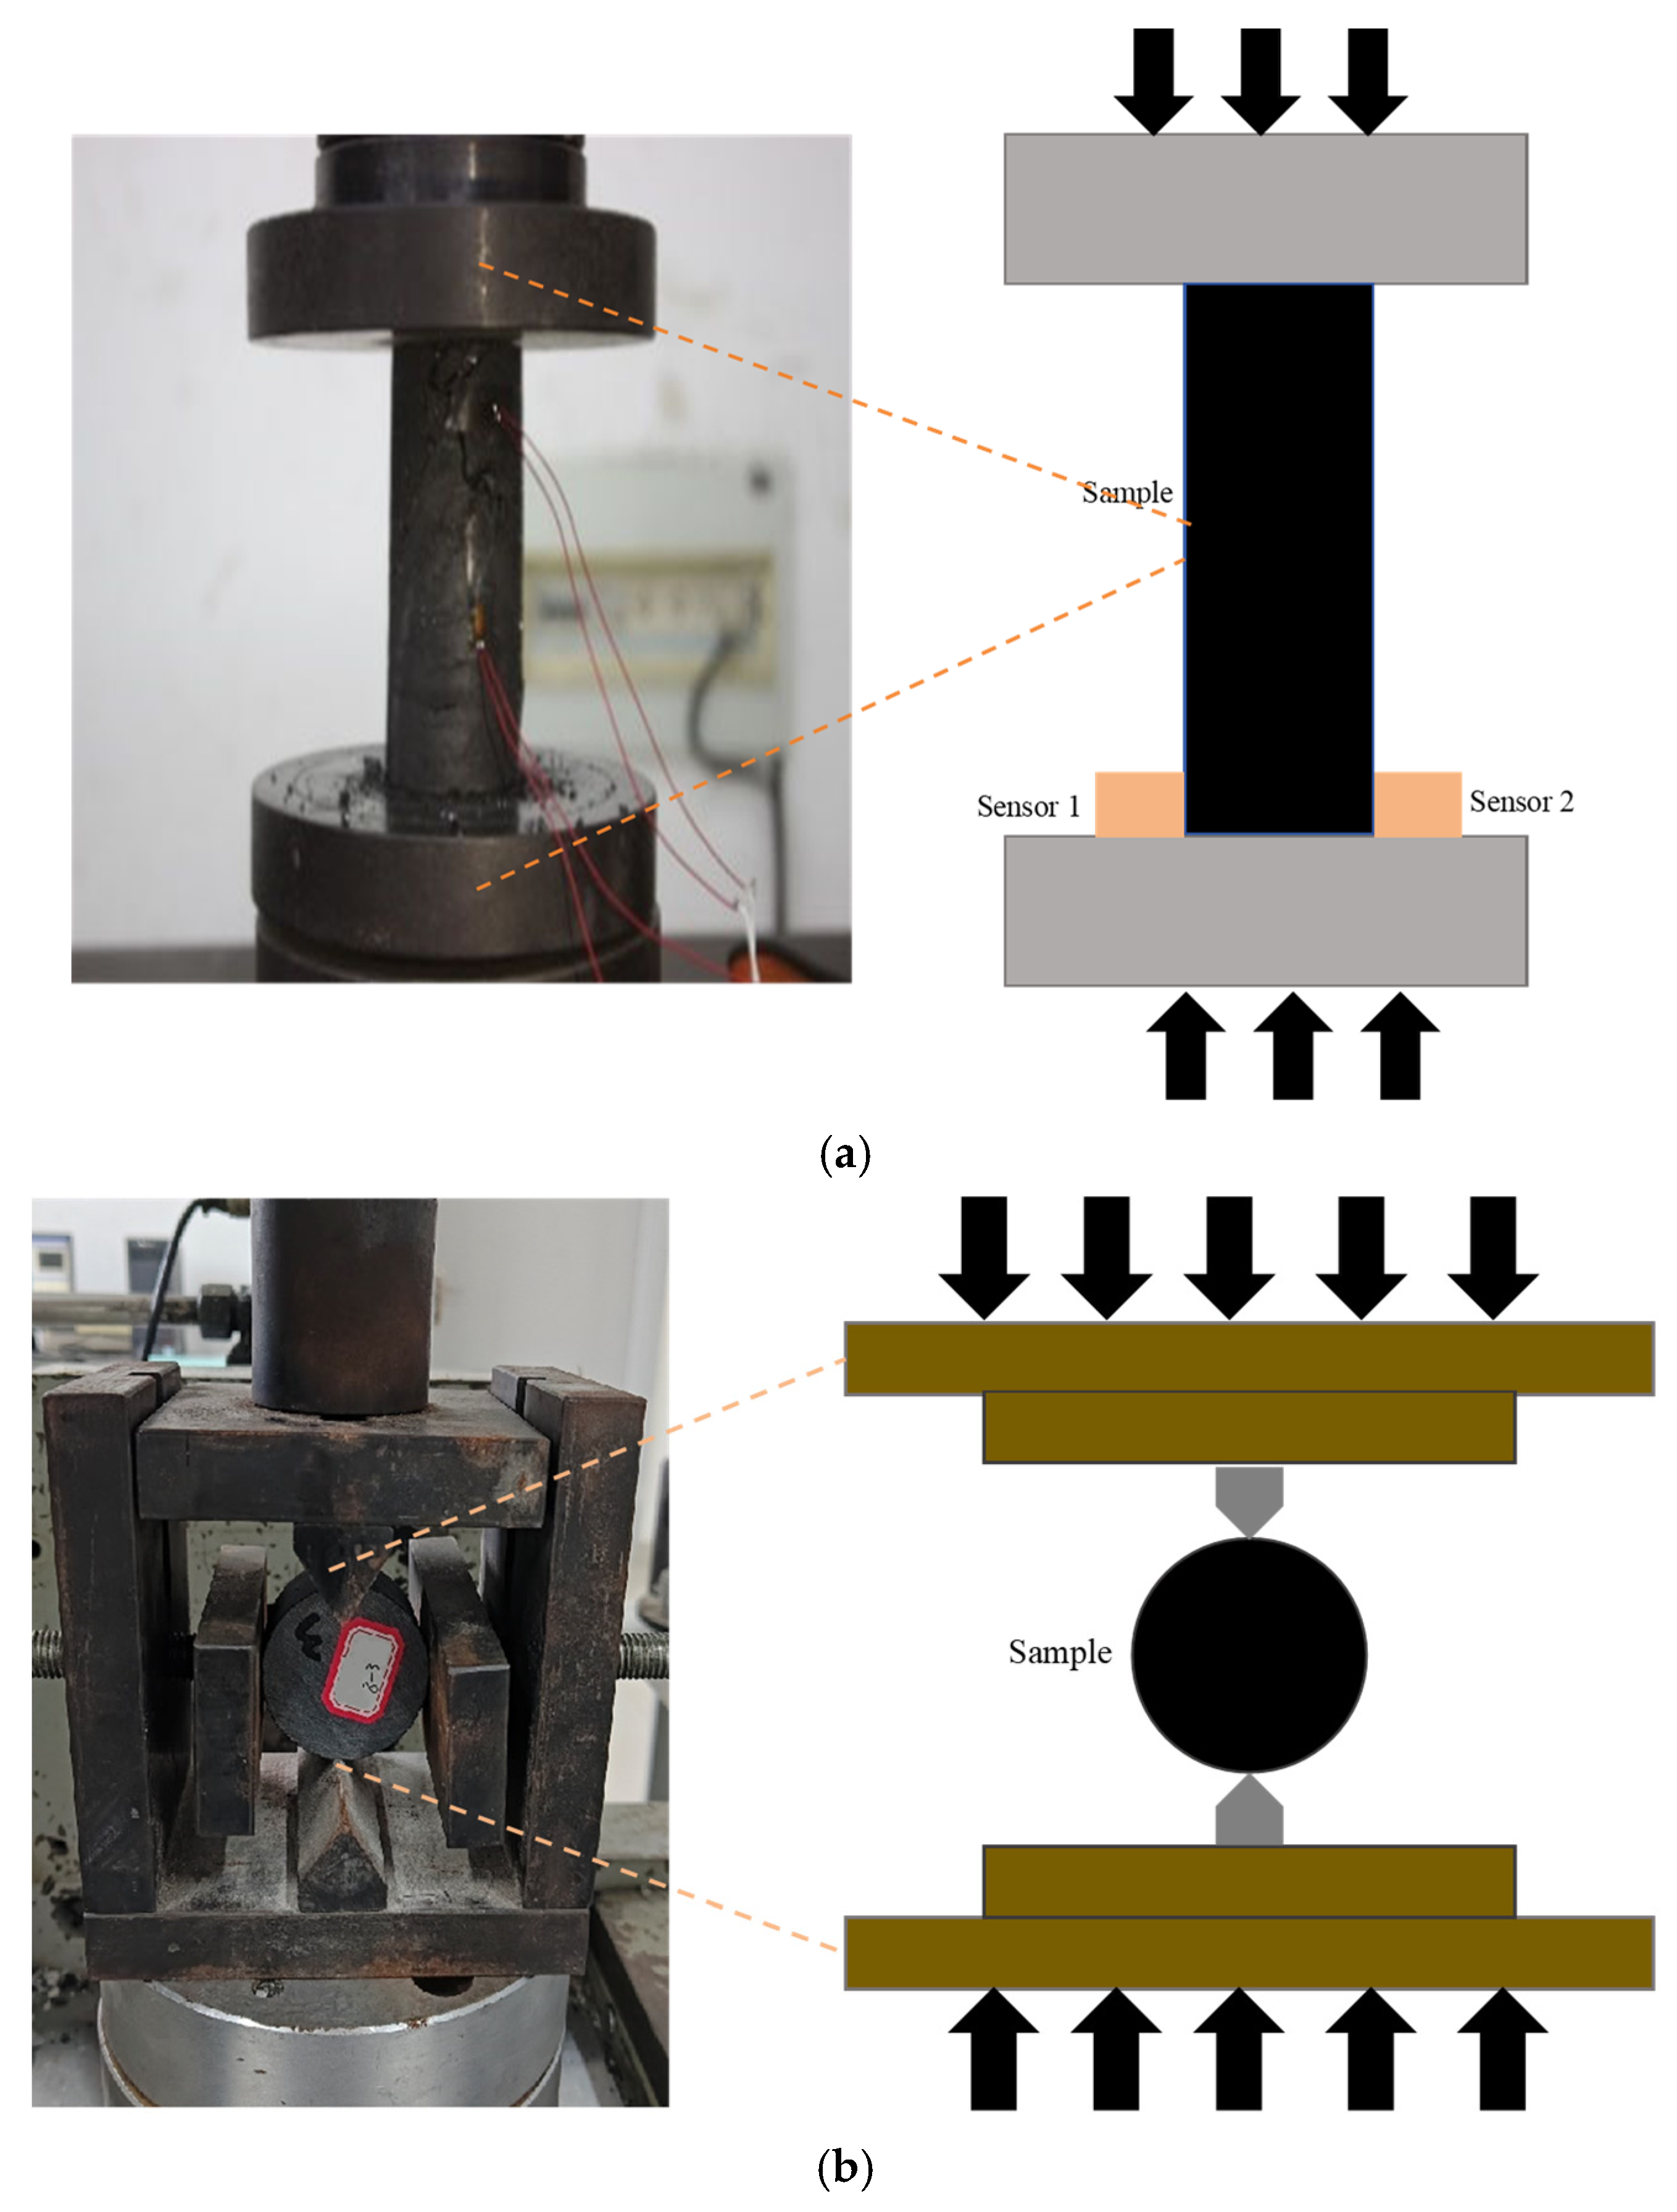
3.1. Measurement of Mechanical Parameters of Coal Samples

In order to determine the applicable conditions and optimal parameters for composite screw drill-bit drilling technology, mechanical tests need to be conducted.
The coal samples were selected from the northern boundary tunnel of No. 2 Shaanxi Hancheng Sangshuping Mine, the 2606 transport tunnel of Shanxi Changzhi Zhangcun Mine, and the 91–105 dedicated return air tunnel of Shanxi Changzhi Wangzhuang Mine for processing. For each working face, the coal samples were separately prepared into ten cylindrical standard specimens for uniaxial compression testing (100 × 50 mm) and ten disc-shaped Brazilian splitting specimens (50 × 50 mm).The basic data of the specimens are shown in Table 1 and Table 2. The selection of the three different types of coal samples is shown in Figure 3.
The coal samples were subjected to uniaxial compression and splitting tests separately, and the average values of the test results were taken as reference indicators for the coal seam conditions of the working face. As shown in Figure 4.The mechanical parameters of coal samples from different mines are shown in Table 3, Table 4 and Table 5 (U represents uniaxial compression test coal samples, B represents Brazilian splitting test coal samples, the first number (1, 2, 3) corresponds to the sampling locations of the northern boundary tunnel of No. 2 Sangshuping Mine, the 2606 transport tunnel of Zhangcun Mine, and the 91–105 dedicated return air tunnel of Wangzhuang Mine, and the second number indicates the sample number).
The average values of the above experimental results are taken to obtain the average mechanical parameters of coal samples from different mining area working faces, as shown in Table 6.

3.2. Calculation of the Pomeroy Hardness Coefficient

Hardness refers to the ability of coal to resist external mechanical forces, and the hardness coefficient indicates the ability of a solid surface to locally compress another object, which is more representative of the actual drilling process.
The Pomeroy hardness coefficient for rocks, proposed by Soviet scholar M.M. Protopchiyakonov, is still widely used in the mining industry, reflecting the ability of rocks to resist destruction under various external loads. The hardness of rocks reflects their ability to resist penetration by harder external objects (cutting teeth, picks, drills) into the rock [23]. The Pomeroy hardness coefficient of rocks is
f = σ c / 10
In the formula, f —Pomeroy hardness coefficient and σ c —Uniaxial compressive strength, MPa.
When applying Equation (1) to coal samples, it is important to consider the following assumptions:
Isotropy and Homogeneity: Equation (1) assumes that the material is isotropic and homogeneous. Although coal samples may not be perfectly isotropic and homogeneous due to their natural formation processes, those used in this study were carefully selected and prepared to minimize the effects of anisotropy and heterogeneity.
Linear Elastic Behavior: The equation assumes linear elastic behavior up to failure. While coal may exhibit some nonlinear behavior under certain conditions, the uniaxial compressive strength used in the equation is typically determined under conditions where linear elastic behavior is predominant.
Failure Mode: Equation (1) is based on the failure mode of rocks under uniaxial compression. For coal, it is assumed that the failure mode is similar under similar loading conditions. The uniaxial compressive strength test results (see Table 3, Table 4 and Table 5) provide a reasonable basis for estimating the Pomeroy hardness coefficient for coal.
Scale Effects: The equation is applicable to a specific scale of rock samples. The coal samples in this study were prepared with dimensions typical for such tests, minimizing scale effects and ensuring comparability with rock results.
Material Properties: The equation assumes consistent material properties across different types of rocks. While coal and rock have distinct material properties, the Pomeroy hardness coefficient offers a relative hardness measure that can be used to compare different coal samples.
By considering these assumptions, the applicability of Equation (1) to the coal samples in this study is justified. The Pomeroy hardness coefficients for coal seam strata from different working faces across three mining areas are presented in Table 7. This facilitates determining suitable conditions for drilling gas extraction boreholes using composite screw tools, as well as selecting the appropriate drilling pressure, feed force, and flow parameters. By integrating Formula (1) with the average uniaxial compressive strength values from Table 3, Table 4 and Table 5, the Pomeroy hardness coefficients for coal seam strata from different working faces in three mining areas are obtained, as shown in Table 7.
Based on the test results, we note the following: the coal body in the 91–105 dedicated return air tunnel of Wangzhuang Coal Mine has high compressive and tensile strengths, classifying it as hard coal; the coal body in the 2606 transport tunnel of Zhangcun Coal Mine is next, classifying it as medium–hard coal; and the coal body in the north boundary tunnel of Sangshuping No. 2 Shaft has the lowest Pomeroy hardness, classifying it as soft coal.

4. Experimental Design and Methods for Drilling Parameter Optimization

The coal seam hardness was determined through coal-body mechanical parameter testing. Drilling tests were then conducted on coal seams of different hardness levels from three research mining areas, identifying the most suitable coal quality conditions for the composite screw drill technology. Multi-factor response surface analysis was performed using Design Expert software to optimize various factors, and the optimal drilling parameters for the composite screw drill technology were determined.
This experiment uses response surface methodology (RSM), a design optimization and analysis method that is based on multiple factor functions and intuitively expresses the predictive function model in three-dimensional surfaces. It consists of a set of numerical analysis and statistical methods, which can precisely describe the relationship between factors and response values [24].
In this experiment, drilling time (Z) was selected as the target response for the response surface experiment (desired to be minimized). The effect of three factors—pump pressure (A), flow rate (B), and feed force (C)—on drilling time for the composite screw drill technology in soft, medium, and hard coal seams was examined at different levels. A three-factor, three-level orthogonal experimental design with 17 groups of tests was used.
Optimization contour lines and response surfaces for the variables were obtained through Design Expert 8.6.6 Tria. The color gradient in the contour map, transitioning from blue to green to red, represents an increase in drilling time from minimal to maximal values. A more rapid chromatic variation within this spectrum correlates with steeper slope gradients, which implies a more pronounced influence on experimental outcomes due to intensified geotechnical interaction dynamics. The faster the change, the steeper the slope, which means the more significant the impact on the test results.
The response surface, drawn based on the quadratic multiple regression equation, is a three-dimensional surface derived from the interaction results of each independent variable. It can be used to predict and optimize the response value, i.e., drilling time (Z).

5. Results Analysis

5.1. Validation of Soft Coal Seam Adaptability

The drilling time (Z) is selected as the objective response (desired to be minimal) for the response surface experiment, examining the impact of three factors—pump pressure (A), flow rate (B), and feed force (C)—at different levels on the drilling time using composite screw bit technology in soft coal seams. The levels of experimental factors are shown in Table 8.
The experimental plan for the response surface experiment is shown in Table 9.
A total of 17 drilling tests were conducted in the north boundary tunnel of the Sangshu Ping No. 2 Well, with five successful drilling trials. Due to the low coal-seam hardness coefficient and the excessively soft coal in the north boundary tunnel, the composite screw bit technology requires at least 1.5 MPa of hydraulic pressure to operate normally. This leads to frequent drilling accidents such as bit jamming, sticking, and seizing, resulting in a low hole completion rate.
Therefore, composite screw bit technology is not suitable for soft coal seams.

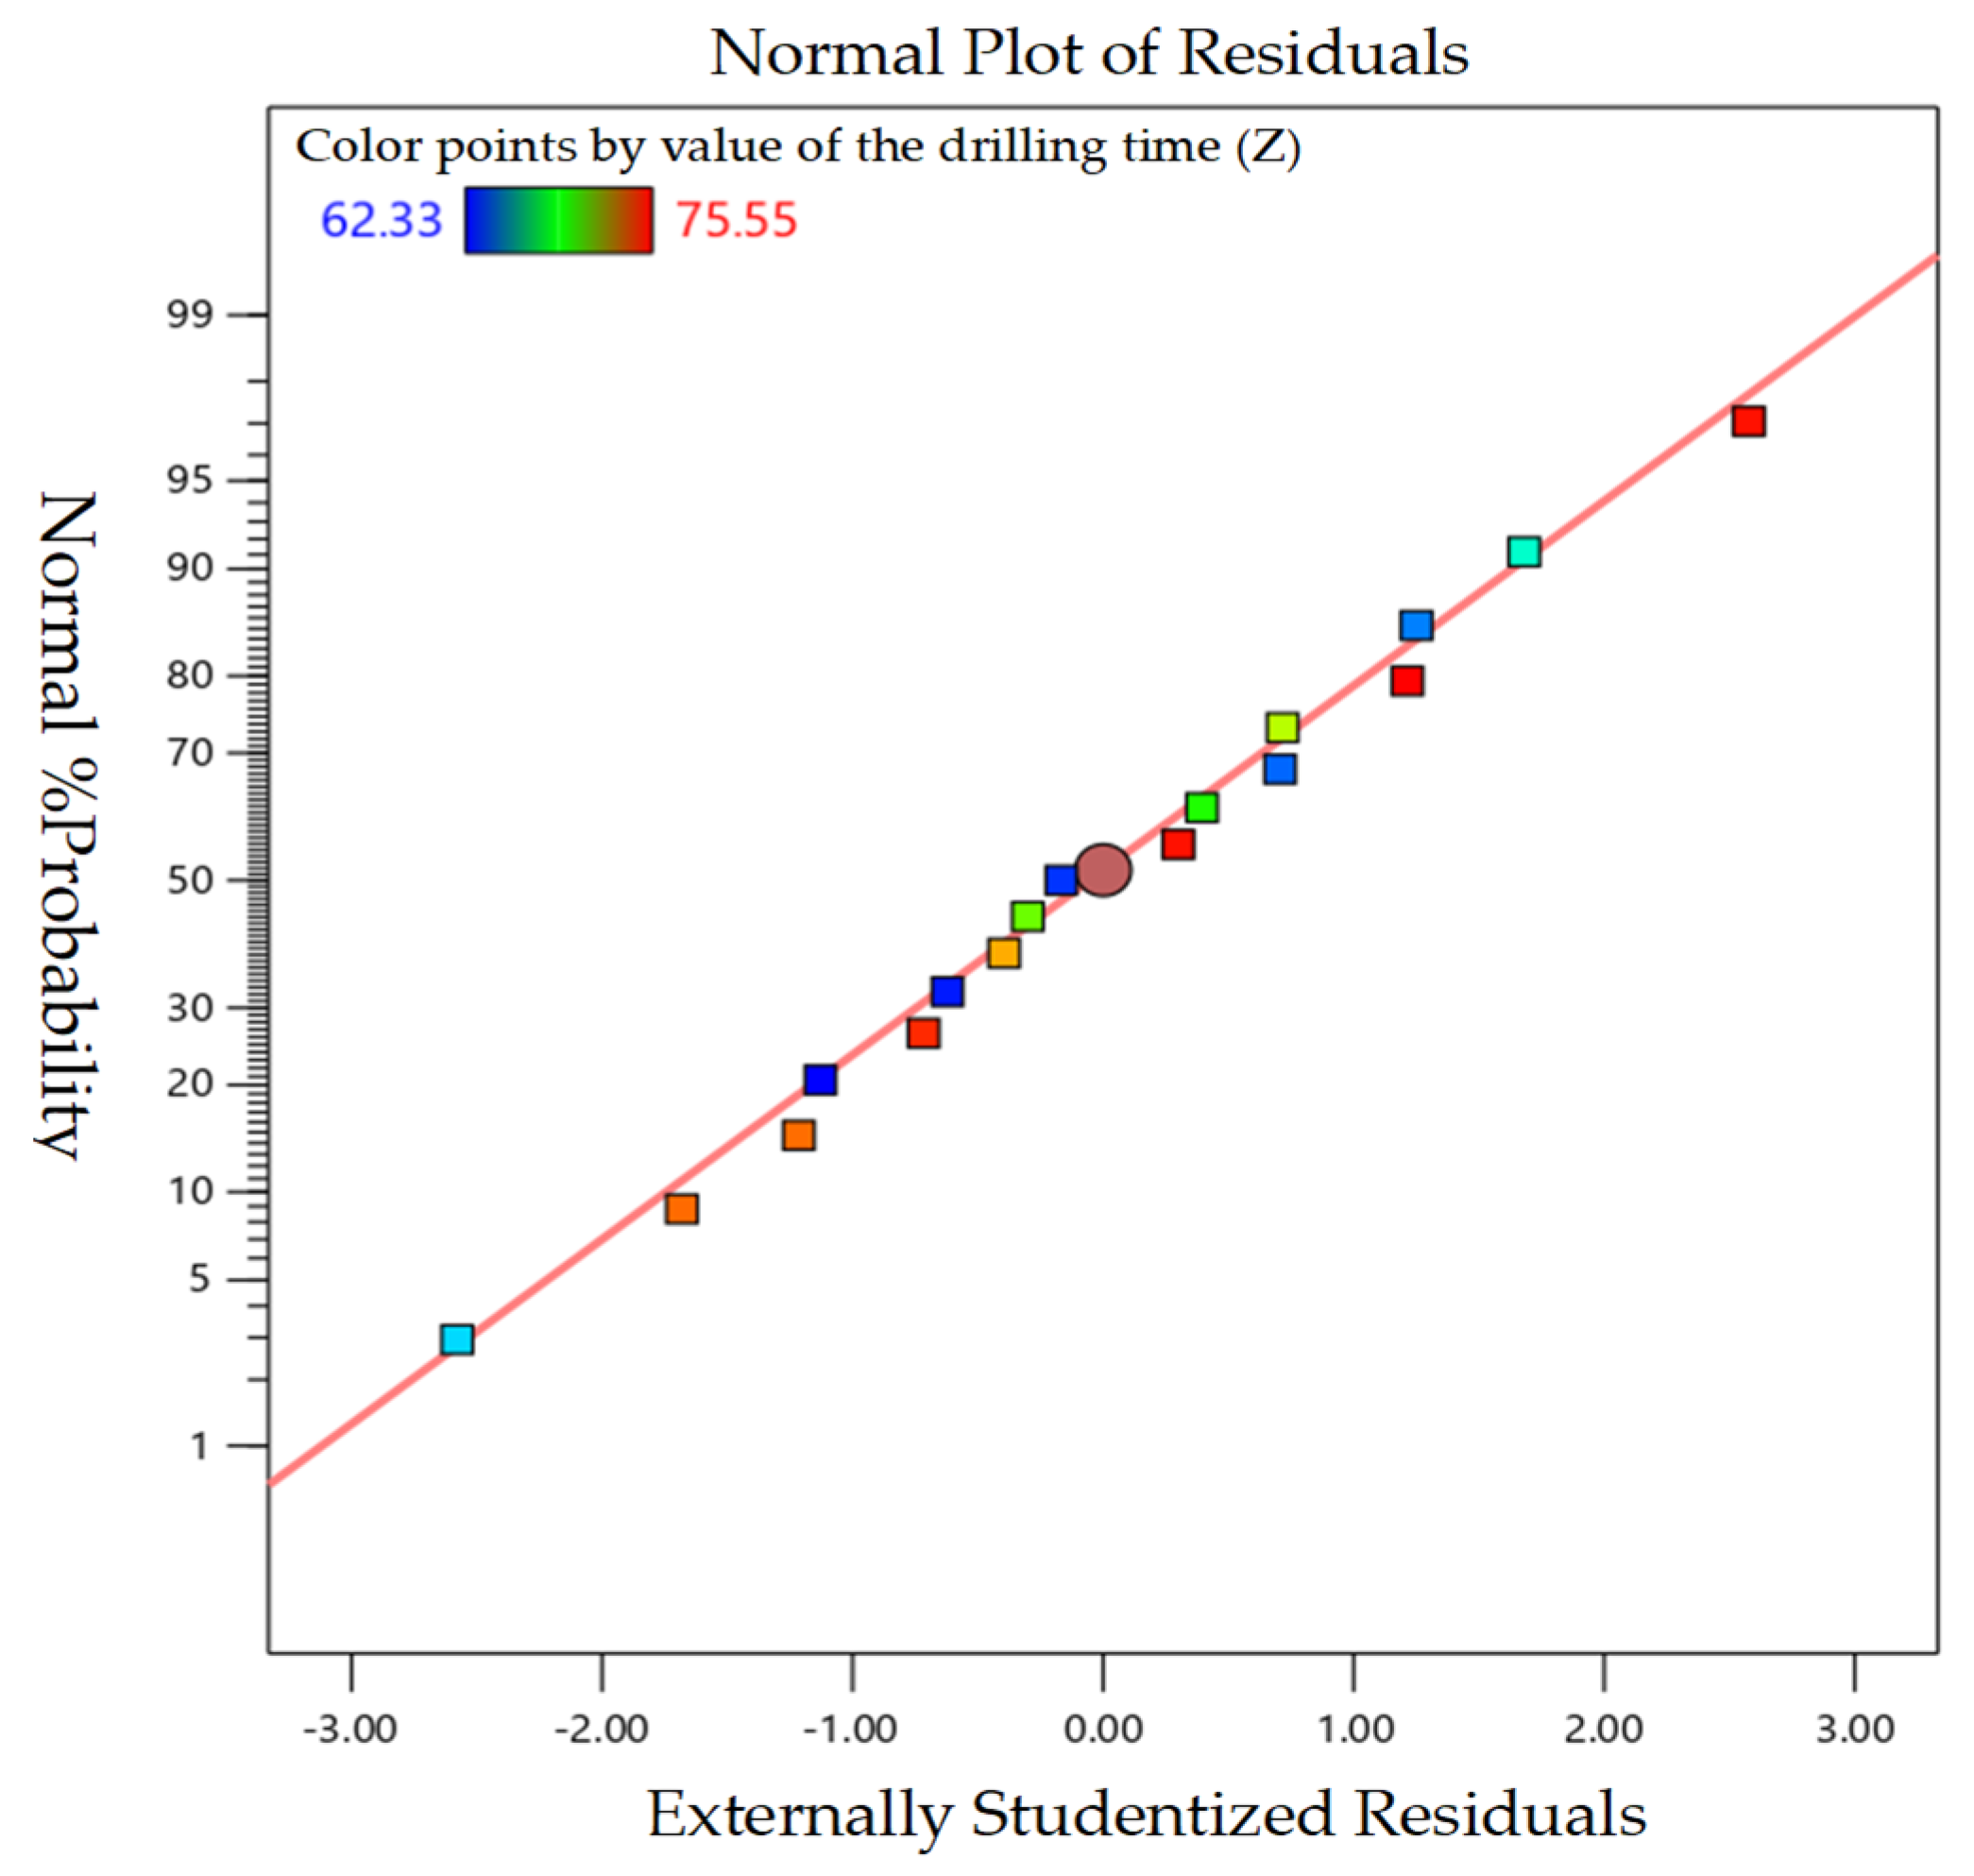
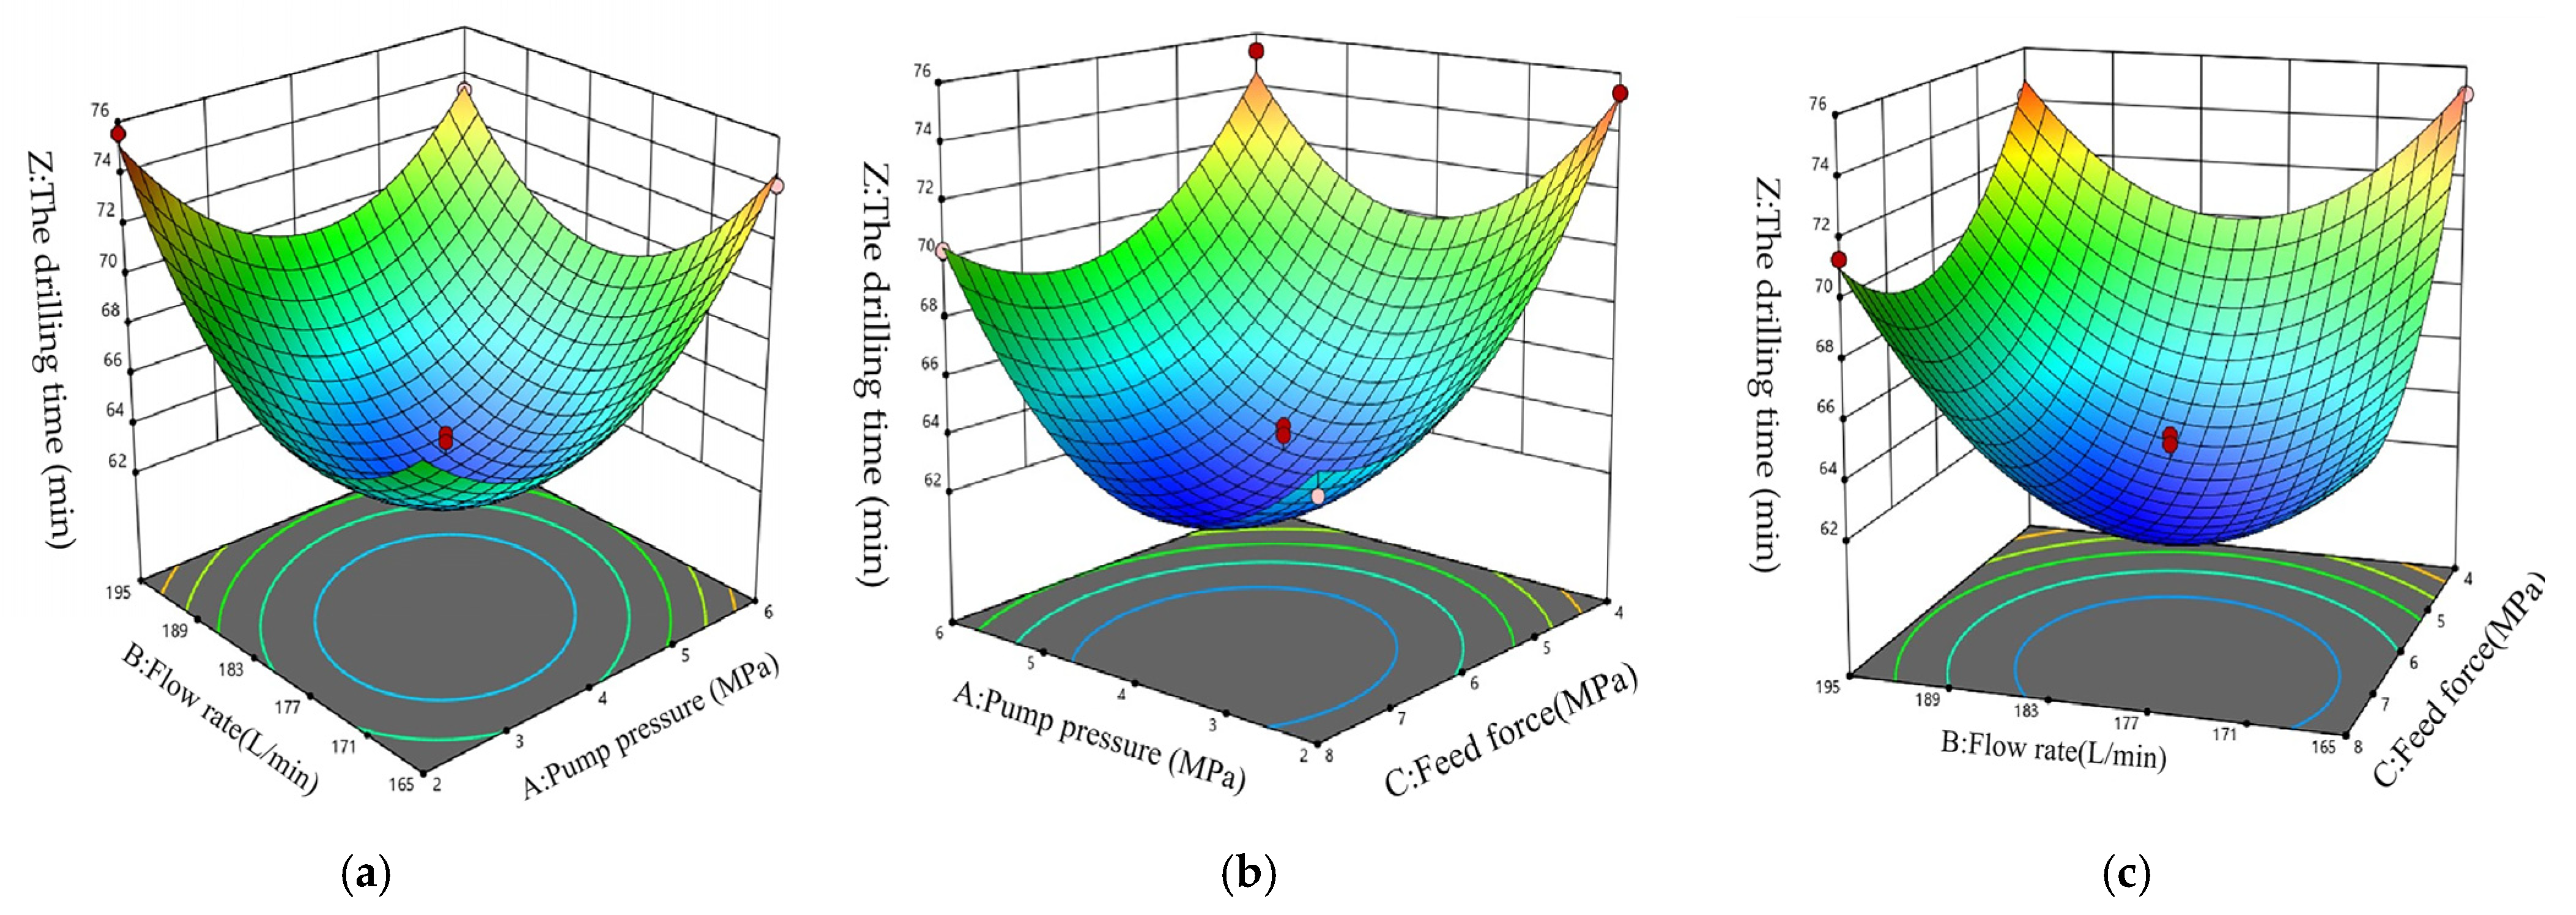
5.2. Optimal Drilling Parameters for Medium–Hard Coal Seams

The experimental factor levels are shown in Table 10, and the experimental plan for the response surface experiment is shown in Table 11.
The field drilling operations are carried out according to the experimental plan, and the results are imported into Design Expert to establish a multiple regression model. The quadratic multiple regression equation for drilling time with the three factors at different levels in the composite screw bit technology for gas drainage boreholes is
Z = +63.13 + 0.97A + 1.20B − 3.34C − 1.76AB + 1.29AC + 1.46BC + 4.89A2 + 5.07B2 + 3.51C2
To optimize the drilling time under different levels of pump pressure, flow rate, and feed force, the experimental data were imported into Design Expert. After fitting the results to four models, the results are shown in Table 12.
The p-values of the other three models are all greater than 0.05, and only the quadratic model has a p-value < 0.0001, indicating that this model has the greatest significance. The quadratic model is recommended as the response surface fitting model for this study, with a corrected R2 value of 0.9758. This demonstrates a significant relationship between pump pressure, flow rate, feed force, and drilling time, with the quadratic multiple regression equation matching the corresponding drilling time to 97.58%. Furthermore, from the normal probability distribution graph of studentized residuals in Figure 5, it can be seen that the residual points are almost evenly distributed on both sides of the line, with no obvious outliers, further indicating a good fit of the quadratic model.
The significant effects of pump pressure, flow rate, and feed force on drilling time are shown in Table 13. The F-value of 75.58 and p < 0.0001 in the table indicate a significant model difference. The p-values for A (pump pressure), B (flow rate), and C (feed force) are all less than 0.05, indicating that these three factors significantly affect the response Z (drilling time). Additionally, from the p-test, it is found that PA = 0.0114, PB = 0.0041, and PC = 0.0001. The significance of their effects is ranked as C > B > A, meaning feed force > flow rate > pump pressure, with feed force and flow rate having the greatest impact on drilling time. The first-order p-values are PAB = 0.0033, PAC = 0.0150, and PBC = 0.0084, with the significance of interactions ranked as AB > BC > AC, with the AB interaction being the most significant. The second-order p-values PA2, PB2, and PC2 are all less than 0.0001, indicating that all three have a highly significant impact on drilling time.
The optimization contour lines between the variables and the response surfaces between the variables were plotted based on the second-order polynomial regression equation, as shown in Figure 6 and Figure 7.
From Figure 6 and Figure 7 and the fitting results, it can be seen that the interaction between A (pump pressure) and B (flow rate) is the most significant, indicating that the fragmentation effect on the coal body during drilling is mainly the result of the combined action of drilling speed and torque. Overall, the response surface curves fitted between the various factors are relatively steep, and the interaction between A (pump pressure), B (flow rate), and C (feed force) is more pronounced, having a significant impact on the drilling time for this coal seam.
Therefore, optimizing the levels of these factors is of great significance for improving the drilling time.
Using the Box–Behnken design method, 17 drilling tests were conducted, and the fitted response surface results for three factors and three levels are shown in Figure 7. The goal of this fitting is to minimize the response, i.e., to obtain the minimum response value Z (drilling time) under different factors and levels. The response surface fitting analysis shows that the optimal drilling parameters for composite screw bit technology in medium–hard coal seams are pump pressure of 4 MPa, a flow rate of 180 L/min, and a feed force of 6 MPa. Under these drilling parameters, the theoretical drilling time for 100 m is 62 min and 33 s.

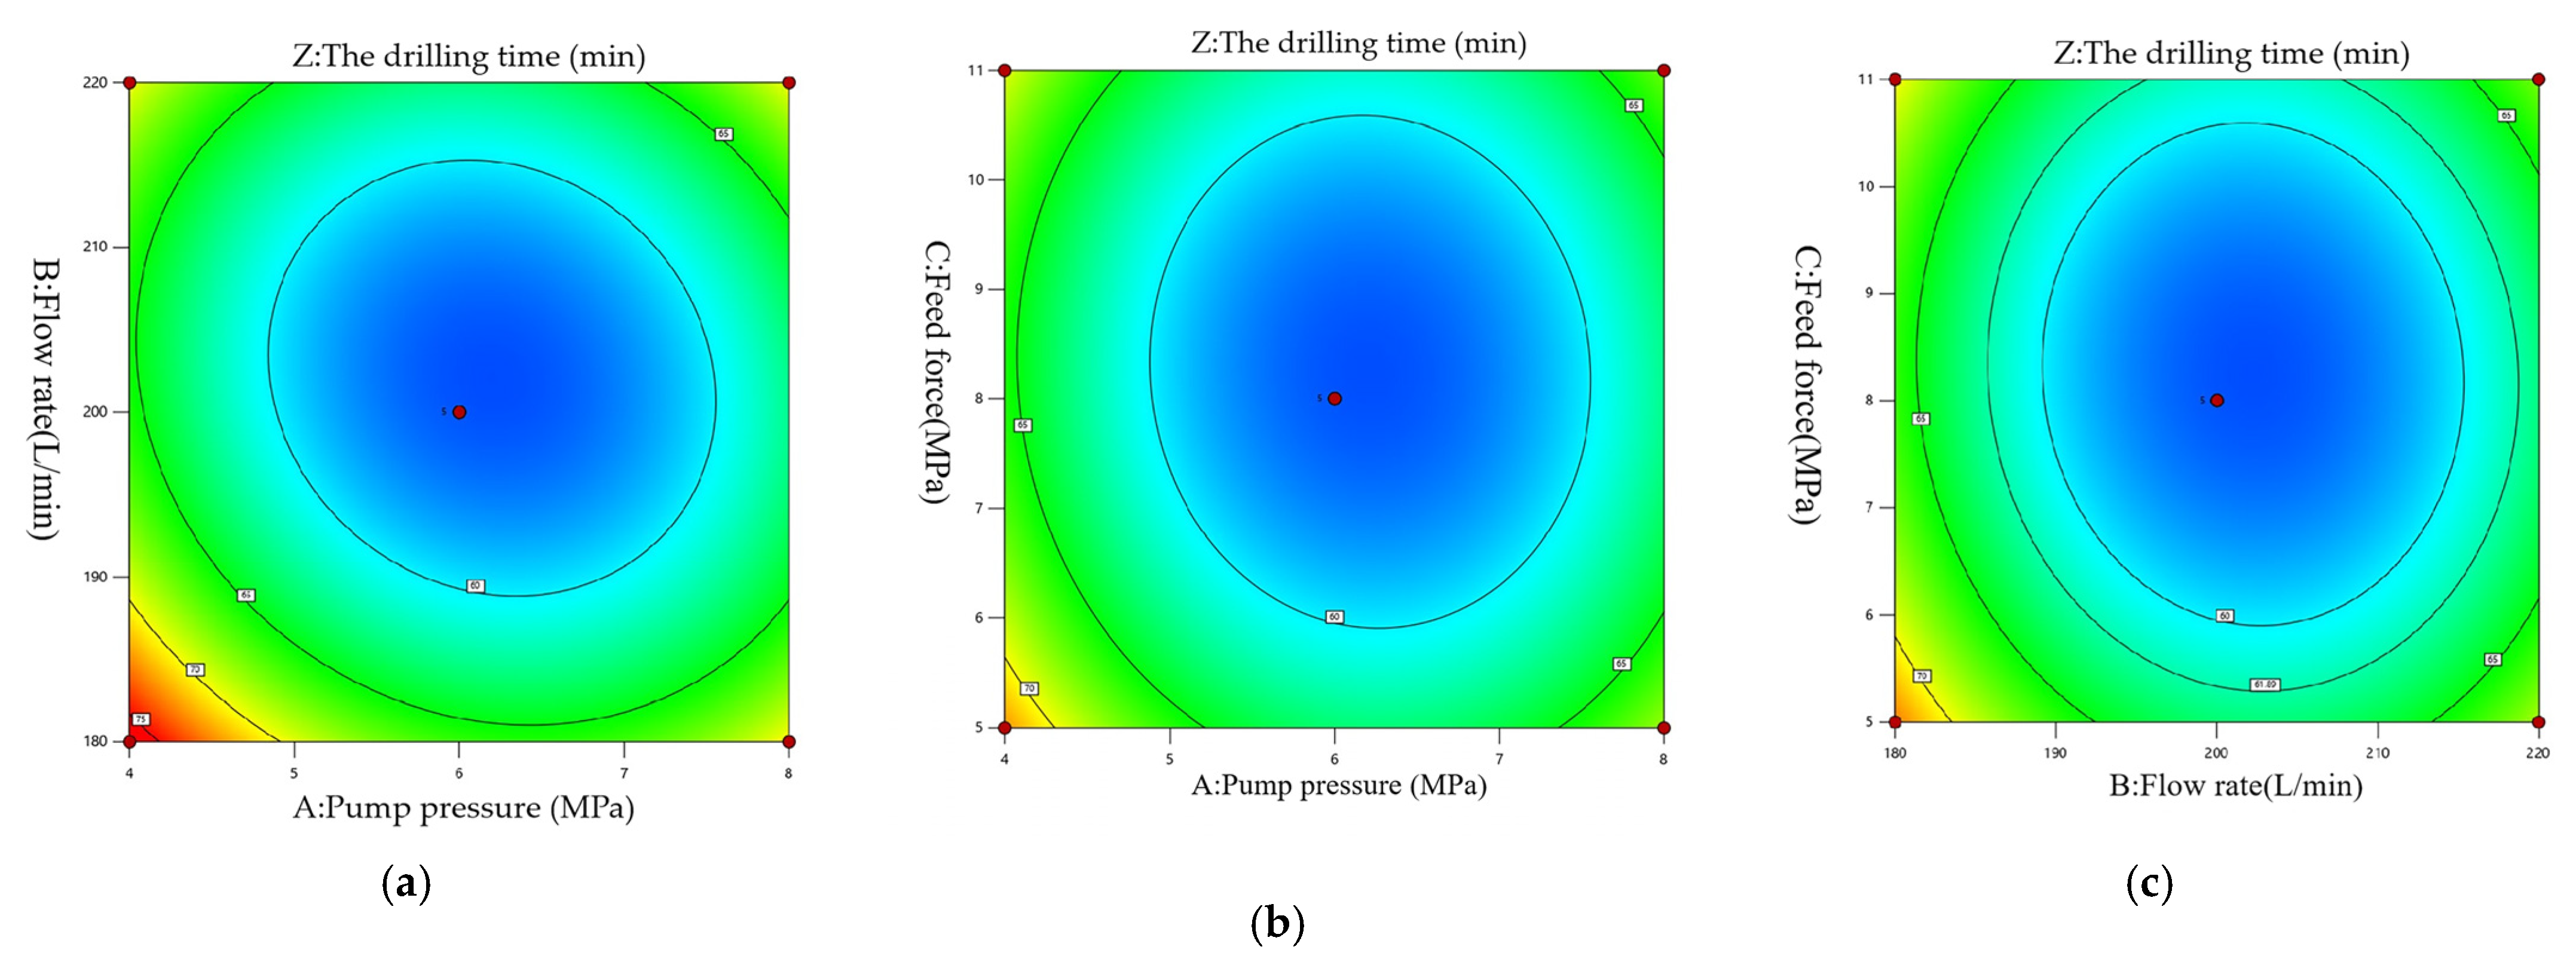
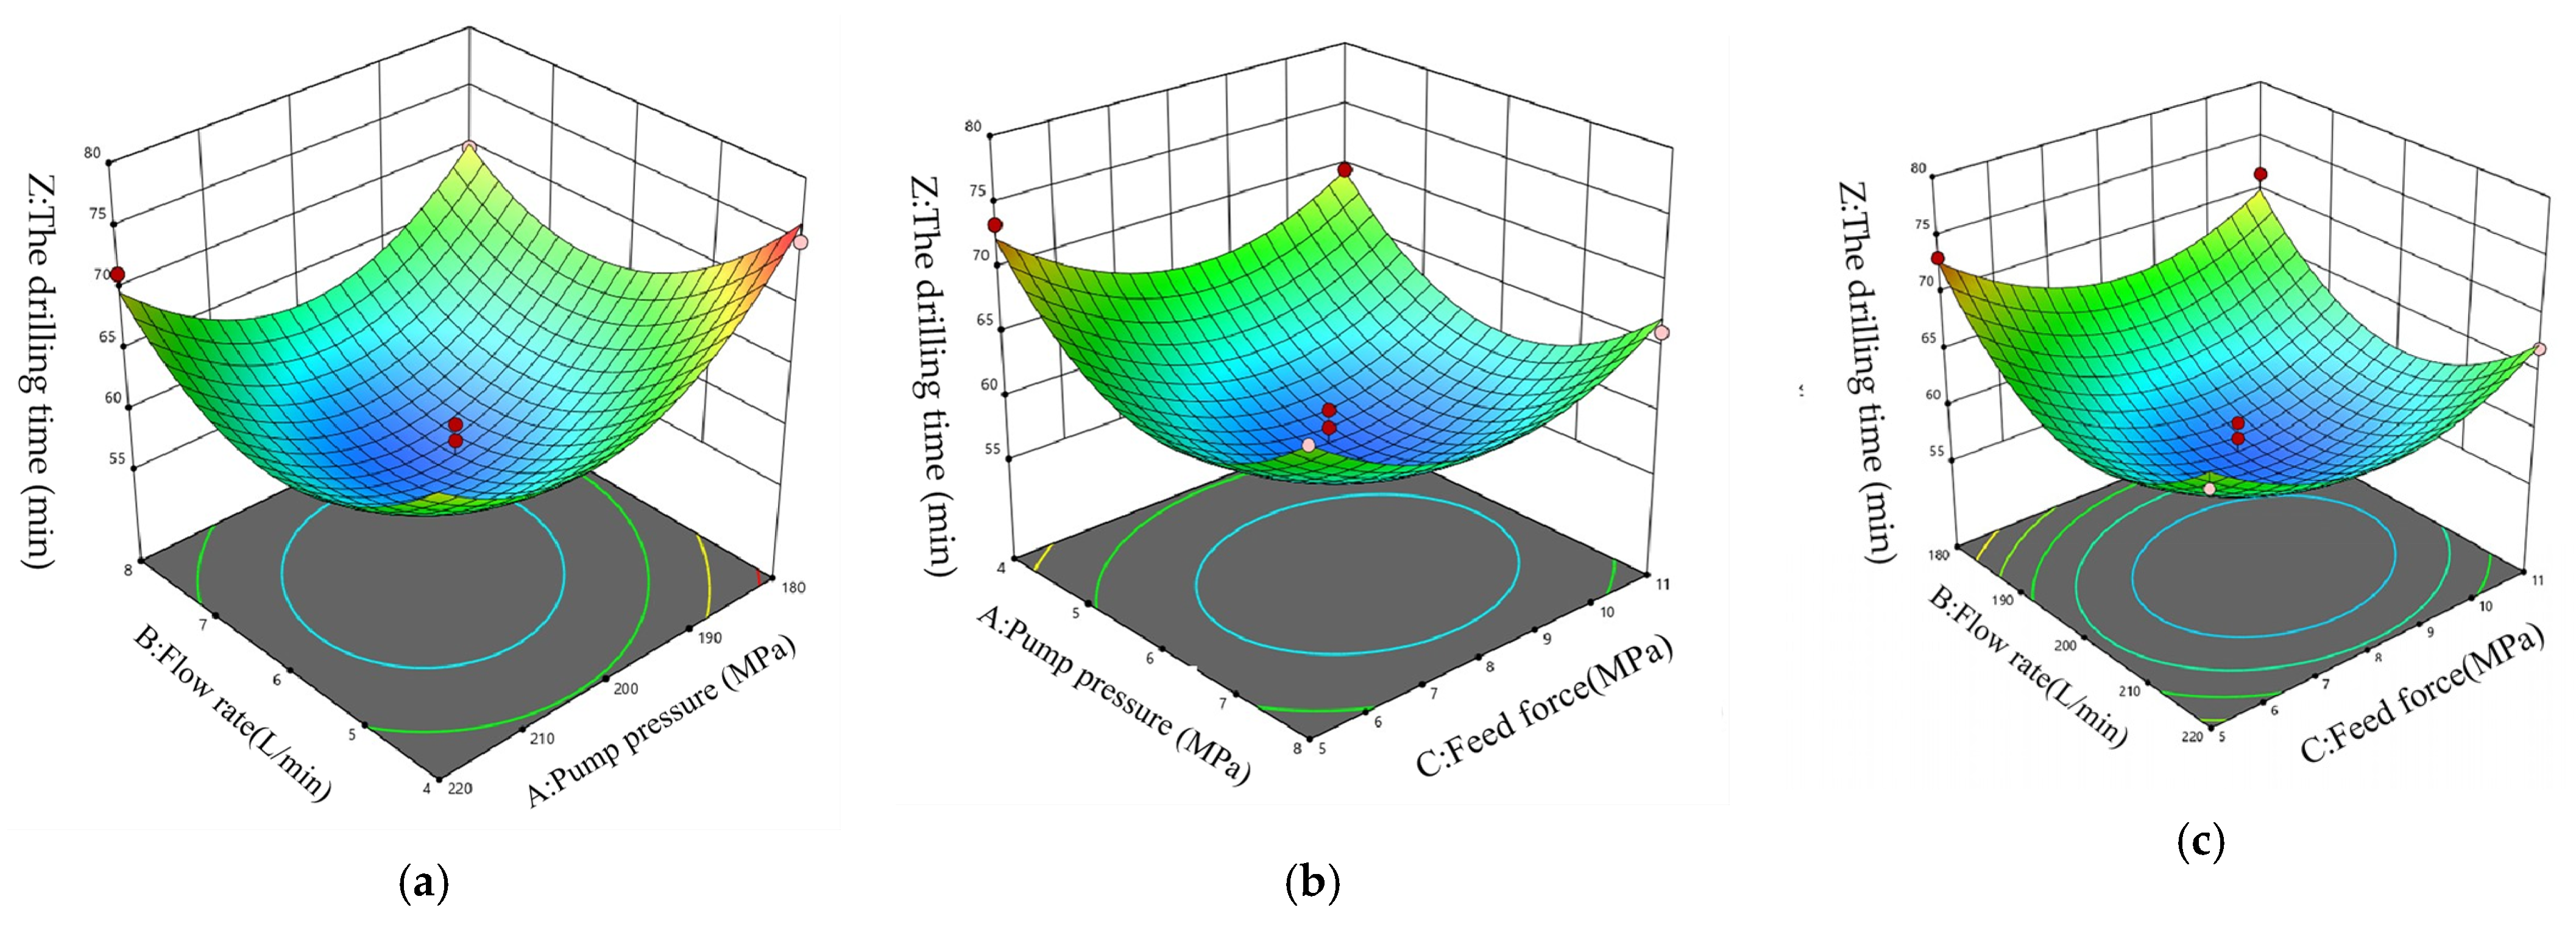
5.3. Optimal Drilling Parameters for Hard Coal Seams

The influence of the composite auger drilling technique on drilling time in hard coal seams is shown in Table 14, and the experimental design for response surface experiments is provided in Table 15.
Field drilling operations were conducted according to the experimental design, and the results were imported into Design Expert for the second-order regression analysis of the response surface. The quadratic regression equation for drilling time with the three factors at different levels during gas extraction drilling with composite auger technology is
Z = +56.91 − 1.59A − 1.72B − 0.92C + 1.58AB + 0.47AC + 0.45BC + 7.17A2 + 7.53B2 + 5.27C2
To optimize the drilling time under different levels of pump pressure, flow rate, and feed force, the experimental data were imported into Design-Expert.After fitting the results with four types of models, the analysis of variance for the goodness of fit of different models is shown in Table 16. The p-values of the other three models are all greater than 0.05, Only the quadratic model has a p-value less than 0.0001, indicating the highest level of significance. The quadratic model is therefore recommended as the response surface fitting model for this study. Moreover, the adjusted R2 value under this model is 0.9222,which proves a significant relationship between pump pressure, flow rate, feed force, and drilling time.
Additionally, from the normal probability distribution graph of studentized residuals in Figure 8, it can be seen that the residuals are almost evenly distributed on both sides of the line, with no significant outliers, indicating that the quadratic model fits well.
The significance of the influence of pump pressure, flow rate, and feed force on drilling time is shown in Table 17.
From the table, it can be seen that the p-values for A (pump pressure), B (flow rate), and C (feed force) are all less than 0.05, indicating that these three factors significantly affect the response Z (drilling time). The significance of each factor is B > C > A, i.e., flow rate > feed force > pump pressure, with flow rate and feed force having the greatest impact on drilling time. For the linear terms, PAB = 0.0350, PAC = 0.6354, PBC = 0.6461, with AB showing the most significant interaction. For the quadratic terms, PA2 = 0.0001, PB2 < 0.0001, PC2 = 0.0007, with B2 and C2 having the most significant interaction on drilling time.
The optimization contour lines between the variables and the response surfaces between the variables were plotted based on the second-order polynomial regression equation, as shown in Figure 9 and Figure 10.
From Figure 9 and Figure 10 and the fitting results, it can be seen that the interaction between A (pump pressure) and B (flow rate) is the most significant. Overall, the response surface curves fitted from the factors are relatively steep, with a clear interaction between A (pump pressure), B (flow rate), and C (feed force), which significantly impacts the drilling time for the coal seam. Therefore, optimizing the levels of these factors is crucial for improving drilling time.
The objective of this fitting is to minimize the response, i.e., to obtain the minimum response value Z (drilling time) under different levels of various factors. The optimal drilling parameters for the composite auger drilling technique in hard coal seams are a pump pressure of 6 MPa, a flow rate of 200 L/min, and a feed force of 8 MPa. With these parameters, the theoretical time to drill 100 m is 55 min and 27 s.

6. Conclusions

(1)
The compressive strength of the coal seam in the north boundary tunnel of the No. 2 shaft at Sangshu Ping is 8.74 MPa, the tensile strength is 0.85 MPa, and the hardness coefficient is 0.87, which belongs to a soft coal seam. The compressive strength of the 2606 transport tunnel at Zhangcun Coal Mine is 21.6 MPa, the tensile strength is 1.63 MPa, and the hardness coefficient is 2.16, which belongs to a medium–hard coal seam. The compressive strength of the 91–105 dedicated return air tunnel at Wangzhuang Coal Mine is 34.7 MPa, the tensile strength is 2.42 MPa, and the hardness coefficient is 3.47, which belongs to a soft coal seam.
(2)
Using response surface methodology (RSM), it was concluded that the composite screw drill-bit technology is not suitable for soft coal seams but can be used in medium–hard and hard coal seams. The ranking of the impact degree of each key parameter on drilling time in medium–hard coal seams is feed force > flow rate > pump pressure; in hard coal seams, the ranking is flow rate > feed force > pump pressure.
(3)
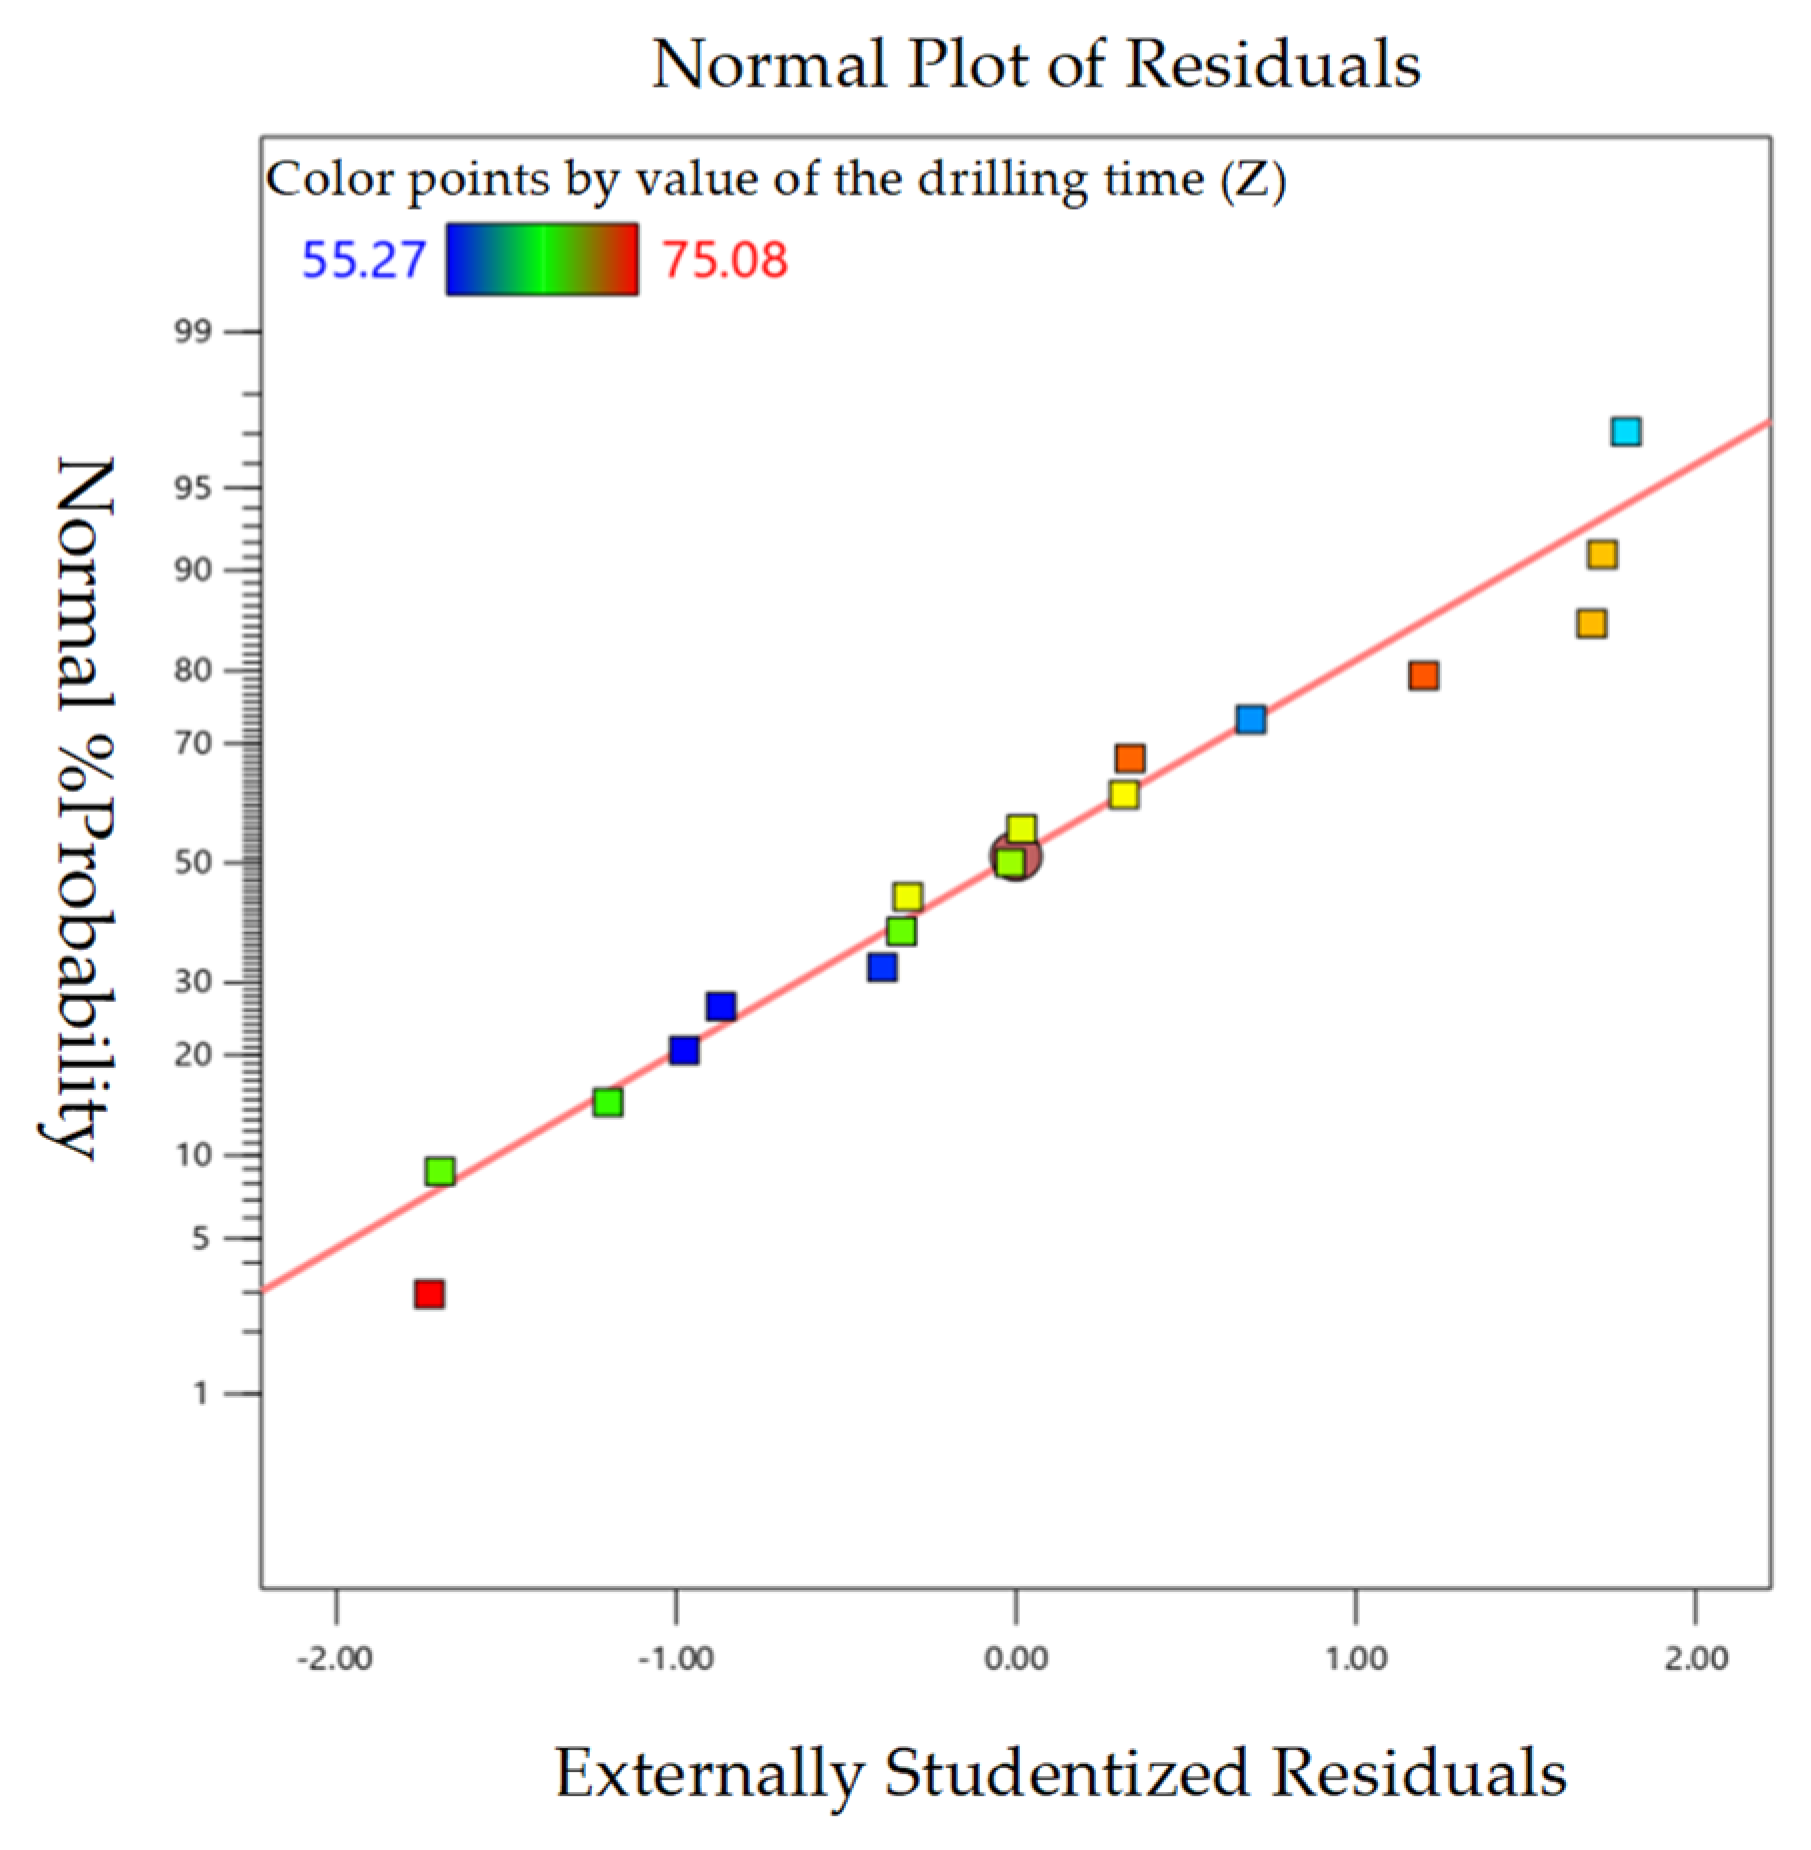
According to the Design Expert software, under medium–hard coal seam conditions, the optimal drilling parameters for the composite screw drill-bit technology are a pump pressure of 4 MPa, a flow rate of 180 L/min, and a feed force of 6 MPa. Under these drilling parameters, the theoretical time to drill 100 m is 62 min and 33 s. Under hard coal seam conditions, the optimal drilling parameters are a pump pressure of 6 MPa, a flow rate of 200 L/min, and a feed force of 8 MPa. Under these parameters, the theoretical time to drill 100 m is 55 min and 27 s.

Author Contributions

Conceptualization, B.S. and X.G.; methodology, B.S., X.M. and X.F.; software, X.Z.; validation, B.S., X.M. and X.F.; formal analysis, B.S., X.M. and X.Z.; investigation, B.S. and X.F.; resources, B.S. and X.Z.; data curation, B.S. and X.M.; writing—original draft preparation, B.S. and X.Z.; writing—review and editing, B.S.; supervision, X.G. All authors have read and agreed to the published version of the manuscript.

Funding

This research is funded by the China Coal Major Science and Technology Project (20221BY001).

Data Availability Statement

The original contributions presented in the study are included in the article, further inquiries can be directed to the corresponding author.

Conflicts of Interest

Author Baoqiang Sun, Xuanping Gong, Xiaogang Fan, Xingying Ma were employed by the company China Coal Energy Research Institute Co., Ltd. The remaining authors declare that the research was conducted in the absence of any commercial or financial relationships that could be construed as potential conflicts of interest.

References

  1. Fu, J.H.; Cheng, Y.P. Current situation and prevention countermeasures of coal and gas outburst in Chinese coal mines. J. Min. Saf. Eng. 2007, 24, 7. [Google Scholar] [CrossRef]
  2. Cheng, J.; Ran, D.; Ju, Y. Plugging effects by GPM based two-phase flow in gas drainage fracture: A simulation study. Int. J. Rock Mech. Min. Sci. 2024, 174, 105639. [Google Scholar] [CrossRef]
  3. Zhang, Z.G.; Zhang, Q.H.; Liu, J. Research progress and prospect of early warning systems for coal and gas outburst and compound dynamic disasters in China. J. China Coal Soc. 2025, 49, 911–923. [Google Scholar] [CrossRef]
  4. Yuan, A.Y.; Yang, X.L.; Hou, J.L. Comprehensive characterization of pore structure of coal seams with abnormal gas emission in deep close-distance coal seam groups. Coal Sci. Technol. 2024, 52, 116–126. [Google Scholar] [CrossRef]
  5. Cao, K.; Li, Z.H.; Yu, D.S. Study on the Predecessor Characteristics and Comprehensive Early Warning of Coal and Gas Outburst in Excavation Face. Coal Sci. Technol. 2020, 48, 147–152. [Google Scholar] [CrossRef]
  6. Zhao, H.C.; Wang, Q.S. Research on gas control in the un-protected layer area of high-outburst mines. Min. Saf. Environ. Prot. 2024, 51, 56–64. [Google Scholar] [CrossRef]
  7. Liang, Y.P.; Li, Z.Y.; Zhu, S.C. Research Status and Emission Reduction Countermeasures of Methane Emissions from Closed/Abandoned Coal Mines. J. China Coal Soc. 2023, 48, 1645–1660. [Google Scholar] [CrossRef]
  8. Cheng, J.; Ran, D.; Fu, Q. Solid–liquid particle flow sealing mucus (PFSM) in enhancing coalbed methane (CBM) recovery: Multiple-perspectives analysis and mechanism insights. Constr. Build. Mater. 2024, 435, 136670. [Google Scholar] [CrossRef]
  9. Ran, D.; Cheng, J.; Sheng, S. A two-phase particle flow method based on SCLB for enhancing CBM recovery: Experimental testing and engineering applications. Powder Technol. 2024, 440, 119754. [Google Scholar] [CrossRef]
  10. Ran, D.; Cheng, J.; Liu, Y. Experimental validation and mechanistic elucidation of crack division and two-phase flow-mediated sealing in coalbed methane extraction boreholes. Int. J. Rock Mech. Min. Sci. 2025, 186, 106021. [Google Scholar] [CrossRef]
  11. Zhao, Y.Z. Research on the Controlled Mechanism of Screw Drill Tool Drilling in Near-Horizontal Directional Holes in Coal Mines. Ph.D. Thesis, China Coal Research Institute, Beijing, China, 2008. [Google Scholar]
  12. Peng, X. Research on the High-Efficiency Rock-Breaking Mechanism of Composite Impact Screw Drill Tools in Coal Mines. Ph.D. Thesis, China Coal Research Institute, Beijing, China, 2021. [Google Scholar] [CrossRef]
  13. Shi, Z.J.; Xu, C.; Li, Q.X. Key technologies for efficient hole formation of 2570 m in-seam ultra-deep directional holes in coal mines. Coal Sci. Technol. 2020, 48, 196–201. [Google Scholar] [CrossRef]
  14. Bai, B.Z. Research on Drilling Acceleration Technology in the Paleozoic Formation of Shunbei Oilfield. Ph.D. Thesis, China University of Petroleum, Beijing, China, 2023. [Google Scholar] [CrossRef]
  15. Lu, Z.Y.; Xu, S.J.; Jiang, Z.X. Mechanical specific energy analysis and drilling parameter optimization for deep wells in the southern margin of Junggar Basin. J. Southwest Pet. Univ. 2021, 43, 51–61. [Google Scholar] [CrossRef]
  16. Wang, G.; Xu, B.Y. A method for predicting the drilling speed of PDC bits by integrating theoretical models and machine learning. Pet. Drill. Tech. 2024, 52, 117. [Google Scholar] [CrossRef]
  17. Zhang, X.; Qiao, D.Y.; Wang, X. Development and application of rotary impact drilling speed-up device. Drill. Prod. Technol. 2022, 45, 106–111. [Google Scholar] [CrossRef]
  18. Kang, Y.G.; Zhang, B.; Zhang, M. Key technologies and applications of the surface life-support hole project test in Meihuajing Mine. Saf. Coal Mines 2022, 6, 53. [Google Scholar] [CrossRef]
  19. Zhang, C. Application status and future development suggestions of screw drill tools. China Pet. Chem. Stand. Qual. 2016, 7, 2. [Google Scholar] [CrossRef]
  20. Qiang, Z.; Zhi, C.; Pengfei, Z. Hydraulic Circulation Test of Bypass Valve of Positive Displacement Motor with Uniform Wall Thickness. China Pet. Mach. 2015, 43, 13–16. [Google Scholar] [CrossRef]
  21. Shi, C.S.; Li, J.P.; Deng, J. Study on multi-roller rotary feed forming mechanism of spiral tube with uniform wall thickness. Int. J. Adv. Manuf. Technol. 2020, 106, 18. [Google Scholar] [CrossRef]
  22. Li, Q.X. Research and Application of Composite Directional Drilling Technology in Broken Soft Coal Seams. Coal Sci. Technol. 2018, 46, 101–106. [Google Scholar] [CrossRef]
  23. Luo, X. Research on the safety thickness of layered roof based on the improved Prandtl’s equilibrium arch theory. Coal Sci. Technol. 2021, 49, 8. [Google Scholar] [CrossRef]
  24. Bezerra, M.A.; Santelli, R.E.; Oliveira, E.P. Response surface methodology (RSM) as a tool for optimization in analytical chemistry. Talanta 2008, 76, 965–977. [Google Scholar] [CrossRef] [PubMed]
Figure 1. Overall structure of the screw drill bit.
Processes 13 02195 g001
Figure 2. Principle of composite screw drill-bit drilling technology.
Processes 13 02195 g002
Figure 3. The selection of the three different types of coal samples.
Processes 13 02195 g003
Figure 4. Test photo, (a) Uniaxial compression test; (b) Brazilian splitting test/Brazilian disc test.
Processes 13 02195 g004
Figure 5. Normal probability distribution of studentized residuals.
Processes 13 02195 g005
Figure 6. Contour plots of optimization between variables, (a) Contour plot of optimization for A and B; (b) Contour plot of optimization for A and C; (c) Contour plot of optimization for B and C.
Processes 13 02195 g006
Figure 7. Response surfaces between variables, (a) Response surface of A and B; (b) Response surface of A and C; (c) Response surface of B and C.
Processes 13 02195 g007
Figure 8. Normal probability distribution of studentized residuals.
Processes 13 02195 g008
Figure 9. Contour plots for optimization between variables, (a) Contour plot for optimization of A and B; (b) Contour plot for optimizatio n of A and C; (c) Contour plot for optimization of B and C.
Processes 13 02195 g009
Figure 10. Response surfaces between variables, (a) Response surface for A and B; (b) Response surface for A and C; (c) Response surface for B and C.
Processes 13 02195 g010
Table 1. Basic data of uniaxial compression samples.
NumberMass (g)Diameter (mm)Height (mm)NumberMass (g)Diameter (mm)Height (mm)NumberMass (g)Diameter (mm)Height (mm)
U1-1271.149.42 100.35 U2-1268.349.49 100.24 U3-1254.349.49 100.10
U1-2272.449.48 100.27 U2-2266.649.44 100.50 U3-2258.749.44 99.15
U1-3261.549.44 100.11 U2-3274.149.46 100.81 U3-3252.349.49 100.06
U1-4266.849.43 100.01 U2-4262.349.49 100.11 U3-4260.149.46 101.08
U1-5259.449.47 99.95 U2-5265.049.42 100.13 U3-5254.449.50 100.22
U1-6268.849.45 101.02 U2-6266.449.44 100.15 U3-6255.849.45 100.41
U1-7267.149.47 100.82 U2-7258.749.45 100.48 U3-7244.449.50 100.19
U1-8266.249.48 100.27 U2-8252.949.49 100.37 U3-8247.849.44 100.76
U1-9265.449.46 100.34 U2-9253.149.50 100.06 U3-9249.949.45 100.44
U1-10265.549.44 100.43 U2-10255.849.46 100.48 U3-10248.849.47 100.85
Table 2. Basic data of Brazilian splitting test specimens.
NumberMass (g)Diameter (mm)Height (mm)NumberMass (g)Diameter (mm)Height (mm)NumberMass (g)Diameter (mm)Height (mm)
B1-1128.649.6450.18B2-1129.249.66 50.27 B3-1127.249.59 50.15
B1-2130.749.84 50.14B2-2131.349.73 50.71 B3-2128.449.43 50.44
B1-3129.849.48 50.16B2-3127.149.84 50.68 B3-3126.249.46 50.38
B1-4132.449.77 50.01B2-4124.249.88 50.44B3-4130.149.48 50.14
B1-5128.749.26 49.98B2-5130.549.90 50.35B3-5127.249.66 50.26
B1-6133.449.59 50.50B2-6129.249.79 50.14B3-6127.949.63 50.04
B1-7132.649.81 50.47B2-7129.449.75 50.50B3-7122.249.57 50.49
B1-8132.149.92 50.14B2-8126.549.48 50.59B3-8123.949.55 50.69
B1-9131.749.94 50.17B2-9124.449.69 50.41B3-9125.049.64 50.41
B1-10130.849.66 50.22B2-10127.949.81 50.44B3-10124.449.58 50.34
Table 3. Mechanical parameters of coal body in the north boundary tunnel.
No.Elastic Modulus (GPa)Uniaxial Compressive Strength (MPa)No.Tensile Strength (MPa)
U1-11.367.38B1-10.89
U1-21.499.14B1-20.76
U1-31.268.29B1-30.79
U1-41.389.48B1-40.84
U1-51.4810.21B1-50.81
U1-61.448.99B1-60.84
U1-71.388.61B1-70.94
U1-81.509.49B1-80.99
U1-91.487.29B1-90.82
U1-101.398.55B1-100.81
Table 4. Mechanical parameters of coal body in the 2606 transport tunnel.
No.Elastic Modulus (GPa)Uniaxial Compressive Strength (MPa)No.Tensile Strength (MPa)
U2-12.6420.36B2-11.54
U2-22.3922.31B2-11.78
U2-32.5221.68B2-11.66
U2-42.2419.87B2-11.49
U2-52.4824.44B2-11.61
U2-62.1521.48B2-11.58
U2-72.4422.29B2-11.69
U2-82.8122.59B2-11.74
U2-92.4520.54B2-11.62
U2-102.3819.94B2-101.57
Table 5. Mechanical parameters of coal body in the 91-105 dedicated return air tunnel.
No.Elastic Modulus (GPa)Uniaxial Compressive Strength (MPa)No.Tensile Strength (MPa)
U3-13.4631.4B3-12.55
U3-23.4439.8B3-12.42
U3-33.4937.4B3-12.38
U3-43.4332.6B3-12.61
U3-53.4039.2B3-12.14
U3-63.4929.9B3-12.48
U3-73.4336.6B3-12.41
U3-83.4835.4B3-12.94
U3-93.4030.1B3-12.18
U3-103.4434.3B3-102.11
Table 6. Mechanical parameters of coal bodies in different working faces.
Sampling LocationElastic Modulus (GPa)Uniaxial Compressive Strength (MPa)Poisson’s Ratio (v)Tensile Strength (MPa)
North Boundary Tunnel1.42 ± 0.078.74 ± 0.930.230.85 ± 0.07
2606 Transport Tunnel2.45 ± 0.1821.6 ± 1.430.161.63 ± 0.09
91–105 Dedicated Return Air Tunnel3.45 ± 0.0334.7 ± 3.610.132.42 ± 0.24
Table 7. Pomeroy hardness coefficients of coal seams from three mining areas.
No.Coal MineSampling Location Coal   Seam   Pomeroy   Hardness   Coefficient   f Classification
1Sangshuping No. 2 ShaftNorth Boundary Tunnel0.87Soft Coal
2Zhangcun Coal Mine2606 Transport Tunnel2.16Medium Hard Coal
3Wangzhuang Coal Mine91–105 Dedicated Return Air Tunnel3.47Hard Coal
Table 8. Factors and Levels of Optimization Experiments for Drilling Parameters in Soft Coal.
FactorUnitLevel
Pump PressureMPa234
Flow RateL/min150160170
Feed PressureMPa1.522.5
Table 9. Optimization Experiment Plan and Results for Drilling Parameters in Soft Coal.
Number of GroupsABCZ
141601.5/
221602.5/
331602/
431702.583 min 16 s
53160289 min 34 s
641602.5/
731602/
831502.5/
94170283 min 51 s
1021502/
1131602/
1231501.579 min 52 s
1331701.5/
1441502/
1521702/
163160286 min 01 s
1721601.5/
Table 10. Factors and Levels of Optimization Experiments for Drilling Parameters in Medium-Hard Coal Seam.
FactorUnitLevel
Pump PressureMPa246
Flow RateL/min165180195
Feed PressureMPa468
Table 11. Optimization Experiment Plan and Results for Drilling Parameters in Medium-Hard Coal Seam.
Number of GroupsABCZ
12180865 min 15 s
24180664 min 37 s
32195675 min 18 s
46180870 min 33 s
54180663 min 03 s
62180475 min 47 s
76165674 min 15 s
84180662 min 66 s
94165475 min 02 s
104195474 min 18 s
116180475 min 03 s
126195673 min 53 s
132165669 min 37 s
144165866 min 18 s
154195871 min 20 s
164180662 min 19 s
174180663 min 18 s
Table 12. Variance analysis of model fit for different models.
SourceSequential p-ValueLack of Fit p-ValueAdjusted R2
Linear0.27230.0787−0.1132
2FI0.8159−0.0950−0.6298
Quadratic<0.00010.97580.8945Suggested
Cubic Model0.2788
Table 13. Variance analysis of experimental results for the quadratic model.
SourceSum of SquaresDegrees of FreedomMean SquareF-Valuep-Value
Model426.62947.4072.58<0.0001
A7.5717.5711.580.0114
B11.47111.4717.570.0041
C89.38189.38136.85<0.0001
AB12.39112.3918.970.0033
AC6.7116.7110.270.0150
BC8.5818.5813.140.0084
A2100.791100.79154.32<0.0001
B2108.121108.12165.55<0.0001
C251.95151.9579.54<0.0001
Residual4.5770.6531
Lack of Fit2.6630.88541.85
Pure Error1.9240.4789
Total Deviation431.1916
Table 14. Factors and Levels of Optimization Experiments for Drilling Parameters in Hard Coal Seam.
FactorUnitLevel
Pump PressureMPa468
Flow RateL/min180200220
Feed PressureMPa6810
Table 15. Optimization Experiment Plan and Results for Drilling Parameters in Hard Coal Seam.
Number of GroupsABCZ
16220567 min 04 s
24200573 min 41 s
361801171 min 48 s
48200568 min 19 s
56180573 min 14 s
662201167 min 18 s
78180869 min 84 s
88220871 min 31 s
94220870 min 21 s
1082001166 min 21 s
116200855 min 43 s
126200858 min 12 s
134180875 min 08 s
146200859 min 54 s
1542001169 min 57 s
166200856 min 21 s
176200855 min 27 s
Table 16. Variance analysis of different model fit degrees.
SourceSequential p-ValueLack of Fit p-ValueAdjusted R2
Linear0.8061−0.1445−0.3405
2FI0.9801−0.4619−1.1752
Quadratic<0.00010.92220.7294Suggested
Cubic Model0.4599
Table 17. Variance analysis of experimental results for the quadratic model.
SourceSum of SquaresDegrees of FreedomMean SquareF-Valuep-Value
Model699.36977.7122.070.0002
A20.22120.225.740.0477
B23.80123.806.760.0054
C6.7316.731.910.0092
AB10.05110.052.850.0350
AC0.864910.86490.24560.6354
BC0.810010.81000.23000.6461
A2216.191216.1961.390.0001
B2238.771238.7767.80<0.0001
C2116.741116.7433.150.0007
Residual24.6573.52
Lack of Fit10.9033.63
Pure Error13.7543.441.06
Total Deviation724.0116
Disclaimer/Publisher’s Note: The statements, opinions and data contained in all publications are solely those of the individual author(s) and contributor(s) and not of MDPI and/or the editor(s). MDPI and/or the editor(s) disclaim responsibility for any injury to people or property resulting from any ideas, methods, instructions or products referred to in the content.

