Abstract
In the development of deep coalbed methane (CBM) resources, the adsorption behavior of supercritical methane is a key factor restricting reserve evaluation and development efficiency. This study integrates scanning electron microscopy (SEM), low-temperature CO2 adsorption (LTCO2A), mercury intrusion porosimetry (MIP), high-temperature and high-pressure CH4 adsorption experiments (HTHP-CH4A), and theoretical models to reveal the pore–fracture structure of deep coal seams and the adsorption characteristics of supercritical methane. Based on a predictive model for supercritical methane adsorption capacity, the adsorption capacity of deep methane was predicted. Results show that micro-pores are well-developed in deep coal rocks, but pore connectivity is generally poor, predominantly consisting of fine bottleneck pores and semi-closed pores, with a certain proportion of open pores. The fractal dimension (Dm) of micro-pore structures in deep coal samples ranges from 2.0447 to 2.2439, indicating high micro-pore surface roughness and a large specific surface area, which provide favorable sites for methane adsorption. Pores larger than 100 nm exhibit fractal values between 2.6459 and 2.8833, suggesting that the pore surfaces in deep coal seams approach a three-dimensional pore space with rough surfaces and complex pore structures. As temperature and pressure enter the supercritical region, the adsorption capacity shows an abnormal trend of “first increasing and then decreasing” with increasing pressure. The deep coal rock–supercritical methane adsorption system exhibits two scenarios in low-pressure and high-pressure regions, corresponding to self-adsorption driven by strong methane adsorption potential and external force adsorption or overpressure micro-pore adsorption, respectively. The supercritical adsorption prediction model considering temperature and methane adsorption phase density has extremely low deviation (1.11–1.25%) and high accuracy. The average dispersion between predicted and actual values ranges from 0.44 cm3/g to 0.48 cm3/g, with small error fluctuations and no significant deviation. This study provides theoretical support for the recoverability evaluation and efficient development of deep CBM resources.
1. Introduction
Deep coalbed methane (CBM), as a vital component of unconventional natural gas resources, holds significant importance for alleviating energy pressure and optimizing the energy structure through its efficient development [1,2,3]. With breakthroughs in exploration and development technologies for deep CBM in China, it has become a critical research field for increasing natural gas reserves and production [4,5]. However, as coal seam burial depth increases, geothermal and geopressure gradients rise significantly, causing methane molecules in CBM reservoirs to gradually cross the critical conditions (critical temperature: 190.56 K, critical pressure: 4.60 MPa) and enter the supercritical fluid state. This physical property transition fundamentally alters the interaction mechanism between the methane and coal matrix. Traditional adsorption models based on ideal gas assumptions (such as the Langmuir model) can no longer accurately describe the adsorption behavior of supercritical methane in deep coal seams, directly restricting the reliability of reserve evaluation and the optimized design of development plans [6,7,8]. Therefore, revealing the adsorption characteristics of supercritical methane in deep coal seams and establishing a precise adsorption capacity prediction model have become key scientific issues urgently requiring resolution in the field of CBM geology.
The adsorption capacity of coal seams for methane is a core parameter for evaluating their resource potential. In the development of shallow CBM, methane typically exists in a gaseous or near-liquid state, and its adsorption behavior can be well described by classical adsorption theories (such as the Langmuir monolayer adsorption model) [4,9]. However, the high-temperature and high-pressure environment in deep coal seams significantly increases the kinetic energy of methane molecules and strengthens intermolecular forces, causing their phase behavior to deviate from ideal gas laws [10,11]. When reservoir temperature and pressure cross the critical point, the association between methane molecules intensifies, the adsorption potential field on the coal matrix surface is reconstructed, and the adsorption potential energy distribution exhibits non-uniform characteristics [12]. This phenomenon directly leads to an “abnormal trend” in the variation in adsorption capacity with pressure; in the early stage of the supercritical region, adsorption capacity increases with increasing pressure, but when the pressure exceeds a certain threshold the adsorption capacity instead shows a downward trend. This non-linear “first increase then decrease” characteristic contradicts the linear assumption of traditional models. If the Langmuir model is used for extrapolation and prediction, significant deviations will occur in reserve evaluation results [13,14].
Current research still has numerous limitations in understanding the adsorption characteristics of supercritical methane. Early studies mostly focused on macroscopic isothermal adsorption experiments, but due to experimental constraints they struggled to systematically reveal the complex adsorption mechanisms in the supercritical region [15,16]. In recent years, with the application of high-temperature and high-pressure adsorption experiments (HTHP-CH4A) and microscopic characterization techniques (e.g., scanning electron microscopy (SEM), low-temperature N2/CO2 adsorption (LT-N2A/LT-CO2A), mercury intrusion porosimetry (MIP), and nuclear magnetic resonance (NMR)) in coal reservoir physical property testing [17,18,19,20], scholars have gradually recognized the coupled effects of pore structure (multiscale distribution of micro-pores, meso-pores, and macro-pores), surface chemical properties (oxygen-containing functional groups, mineral content), and in situ stress conditions on supercritical methane adsorption in deep coal seams [21,22,23]. Molecular simulation has been applied to construct coal molecular models, characterize the adsorption and occurrence of fluids (e.g., gas and water) in coal from molecular to micro-scales, and analyze the effects of new nanomaterials on coal pore structure and wettability [24,25]. However, most models still fail to break through the single-factor analysis framework and lack consideration of the synergistic effects of geological factors such as coal rank evolution, pore heterogeneity, moisture occurrence, and dynamic changes in in situ stress [26,27,28]. For example, high-rank coals with high aromatization degrees and low surface energy may exhibit weaker adsorption capacity for supercritical methane than low-rank coals; increased in situ stress can compress pore space, alter the distribution of adsorption potential fields, and thus affect adsorption capacity [29,30]. The interactive effects of these factors make supercritical adsorption prediction a complex geological problem involving multi-parameter coupling.
This study aims to investigate the adsorption characteristics of supercritical methane in deep coal seams and predict the adsorption capacity. Through the combination of high-pressure isothermal adsorption (HTHP-CH4A) experiments and pore characterization techniques (SEM, LTCO2A, and MIP), the evolution law of pore structure and methane adsorption characteristics in deep coal were systematically analyzed. A supercritical methane adsorption prediction model coupling temperature, pressure, and adsorption phase density was constructed. The research results not only provide key parameter support for the recoverability evaluation of deep CBM (burial depth less than 3900 m) but also offer theoretical references for the application of supercritical fluids in geological sequestration, enhanced recovery, and other fields, possessing important scientific value and engineering significance.
2. Experiments and Methods
The evolution of pore–fracture structures in deep coal seams was investigated using pore structure characterization techniques and fractal theory. Supercritical methane adsorption capacities were obtained through high-temperature and high-pressure methane isothermal adsorption tests to establish a supercritical adsorption model for deep coal seams, with model accuracy analyzed based on experimental results.
2.1. Samples and Experiments
2.1.1. Sample Collection and Experimental Design
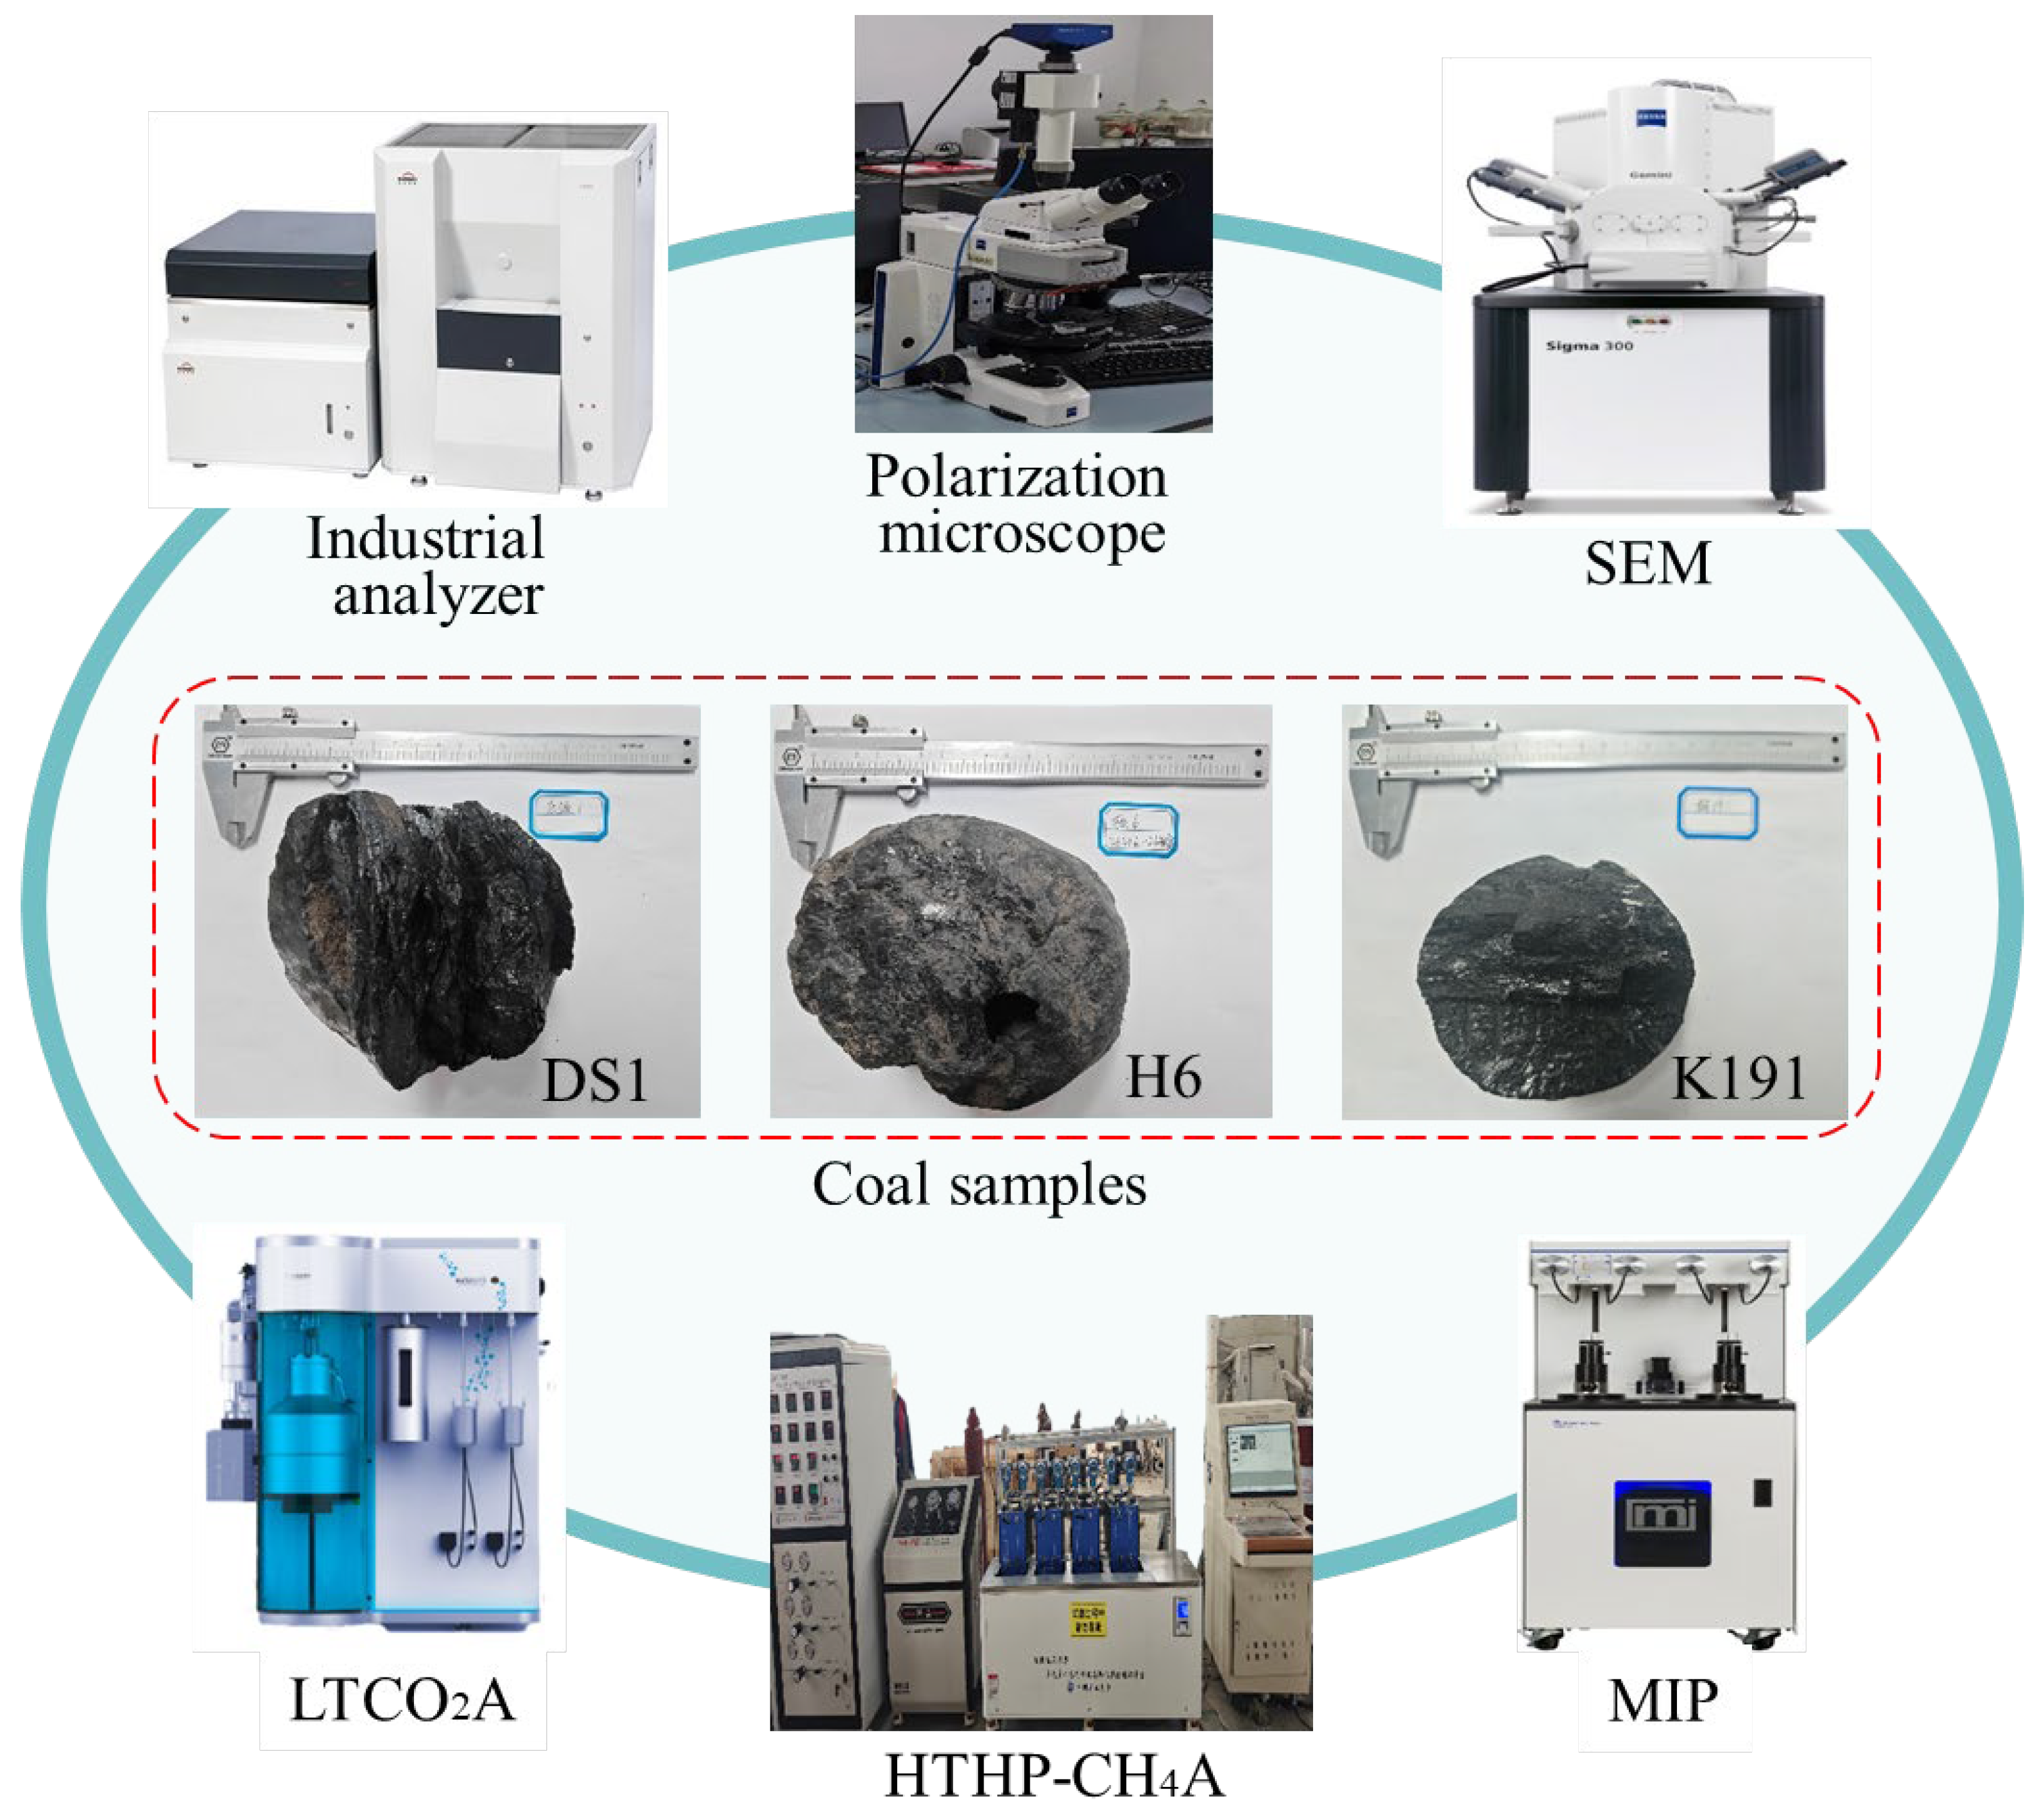
Samples were collected from the Dongshen 1 well (DS1, Xishanyao Formation, buried depth 3874.6–3879.4 m), the He 6 well (Badaowan Formation, buried depth 2642.86–2644.94 m) and the Ke 191 well (K191, Badaowan Formation, buried depth 3350–3356 m) in Tuha Basin in the east of the Xinjiang Uygur Autonomous Region. The samples were made into block samples with a side length of 5–10 mm and a thickness of ≤5 mm for SEM-EDS tests. The powder particle size was 0.18–0.25 mm (60–80 mesh sieve) for the LTCO2A and HTHP-CH4A tests, and the block samples with a side length of 3–5 mm were used for the MIP test (as shown in Figure 1). At the same time, the coal samples were ground to ≤0.2 mm and 1 to ensure uniform composition and carry out industrial analysis and maceral analysis, as shown in Table 1, of the basic parameters of coal samples. The moisture content of the samples is between 0.42 and 1.37%, the ash yield is between 10.28 and 37.63%, the volatile matter is between 29.99 and 45.47%, and the average vitrinite reflectance is between 0.64 and 1.04%. Generally speaking, the samples belong to medium-ash to high-ash bituminous coal. The content of inertinite is 5.2–62.6%, and the content of exinite is 0.5–10.9%. Among them, for vitrinite matrix vitrinite (cemented semifusinite, silk debris, clastic inertinite, chitin, etc.) is the main one, followed by homogeneous vitrinite, with a small amount of clastic vitrinite, and occasionally structural vitrinite 2 (cavity deformation and hollowness) and lump vitrinite. For the inertite group, occasionally, oxidized filars and coarse-grained bodies are found. For crust formation cutinite is the main component followed by microspores, and occasionally resin bodies are found. The sample contains clay minerals and silicates (calcite massive cemented organic matter), in which K191 calcite is veined to fill fractures, and DS1 contains a small amount of sulfide (pyrite).

Figure 1.
Sample and test equipment.

Table 1.
Basic parameters of samples.
2.1.2. Pore Structure Test
The scanning electron microscopy (SEM) experiment (ZEISS Sigma 300 SEM, ZEISS, Oberkochen, Germany) is an important method commonly used to observe the morphological characteristics of pore–fissure structures on the surface of coal samples, and its observation of the surface morphology of each sample can reach the nanometer scale [31,32,33]. In this study, vacuum drying was carried out at 60 °C for 12–24 h to remove moisture. The coal samples were first polished by argon ions and subjected to gold spraying treatment, and then SEM tests were conducted under vacuum conditions. The pore structures (open pores, semi-closed pores, and fractures) were observed at magnifications of 30,000 and 100,000 times. The EDS (Energy Dispersive Spectrometer) configured in the equipment was used to detect the elements on the surface of coal samples at a magnification of 30,000 times, so as to analyze the occurrence states of minerals (such as clay minerals, pyrite, etc.).
The Low-Temperature CO2 Adsorption (LTCO2A) experiment (Micromeritics, ASAP2460, Malvern Panalytical Ltd., Westborough, MA, USA) exhibits higher detection sensitivity for micro-pores (<2 nm) in coal than N2 adsorption, making it particularly suitable for analyzing ultra-micro-porous materials such as coal rocks, shales, and activated carbons. Representative coal samples (with a particle size of 60–80 mesh, approximately 0.1–0.3 g) were selected. Vacuum drying was performed at 105 °C for 12–24 h to thoroughly remove moisture and free gases. Vacuum degassing was conducted at 120 °C for 6–12 h. Adsorption–desorption isotherms were collected (test temperature: 273 K, pressure range: 0–1 atm, and relative pressure: 0.0001–0.03), and the DFT (Density Functional Theory) or DA (Dubinin–Astakhov) models were used to calculate the specific surface area and volume of micro-pores [1].
The high-performance fully automated mercury intrusion porosimeter used in the Mercury Intrusion Porosimetry (MIP) experiment (Micromeritics AutoPore Iv 9510, Micromeritics Instrument Corp, Norcross, GA, USA) can rapidly determine macro-pores (>50 nm) and partial meso-pores (3.6–50 nm) in coal samples. However, it may underestimate the true pore size of narrow pore throats with restricted openings (such as inkbottle pores), necessitating the combination of LTN2A or LTCO2A to observe the micro-porous structure of coal [21]. The MIP experiment uses block-shaped samples with a diameter <1 cm. After drying, mercury intrusion–extrusion curves are obtained under pressures ranging from 0.1 to 33,000 psia, and the Washburn equation is applied to calculate pore size distribution and parameters.
2.1.3. Methane Adsorption Test
The high-temperature and high-pressure methane adsorption (HTHP-CH4A) experiment was conducted using an independently developed high-temperature and high-pressure methane adsorption instrument. Fresh representative coal samples were crushed to 60–80 mesh (0.2–0.3 mm), dried at 40 °C to constant weight, and degassed for 6–12 h according to the temperature (90–100 °C) and pressure (22–36 MPa) of the coal reservoir of the test coal sample in the Turpan-Hami Basin. At the same time, some abnormal low temperature and low-pressure conditions and the experimental equilibrium pressure conditions of methane injection are considered. The temperature and pressure of the methane adsorption experiment should be set as close as possible to the reservoir temperature and pressure. The experiment set different test temperatures (50 °C, 70 °C, 90 °C, and 100 °C) with equilibrium pressures ranging from 2 to 22 MPa. Residual methane adsorption capacities were recorded to plot isothermal adsorption curves, analyze methane adsorption characteristics of coal under high-temperature and high-pressure conditions, and validate the prediction model for supercritical methane adsorption capacity in deep coal seams using experimental data.
2.2. Methods
2.2.1. Fractal Calculation of Pore Structure
Based on LTCO2A and MIP experiments, the pore structure distributions of coal samples at different scales were jointly characterized. According to the fractal theory, the fractal characteristics of coal pore structures were calculated [28,34], thereby revealing the pore heterogeneity of deep coal seams. The fractal theory model commonly used for LTCO2A data is the model proposed by Wang et al. [35], which is shown in Equation (1) below:
where Dm is the fractal dimension of the micro-porous surface and C is the constant term. The following equations are also used:
where Nmax is the adsorption capacity at the maximum relative pressure, cm3/g; CO2 covers different pore spaces at different pressure stages; and the functional relationship between the average pore diameter r and the relative pressure can be characterized by the following Kelvin equation:
where σ is the surface tension; ν is the molar volume, 22.4 L/mol; R is the gas constant, 8.314 J/(mol·K); and T is the absolute temperature, K.
The fractal characteristics of coal pore structures from MIP test data can be calculated using the Menger model [36], with the expression as follows:
where D is the fractal dimension; V is the pore volume measured by the MIP test, mL/g; and P is the mercury injection pressure, MPa.
The pore size range measured by the mercury porosimetry in this study is 5 nm to 300 μm. Taking 100 nm as the boundary, the pores measured by mercury porosimetry are divided into diffusion pores and seepage pores, and their fractal dimensions D1 and D2 are calculated, respectively.
2.2.2. Calculation Model of Supercritical Methane Adsorption Capacity
The calculation of adsorption potential and surface free energy can measure the role of molecular forces during the methane adsorption process in coal and reflect the energy changes in the adsorption process. Polanyi defined the adsorption potential as the work performed when the adsorbate per unit mass is transformed from the non-adsorbed phase to the adsorbed phase, with the following expression:
where ε represents the adsorption potential, J/mol; p is the adsorption equilibrium pressure of the gas at the test temperature, MPa; p0 is the saturated vapor pressure, MPa; T is the absolute temperature, K; and R is the gas constant, 8.314 J/(mol·K). Under supercritical conditions, the saturated vapor pressure is meaningless, so the following calculation formula for virtual saturated vapor pressure was proposed:
where pc is the critical pressure of adsorbate gas, MPa; and Tc is the critical temperature of adsorbate gas, K.
In the adsorption potential theory, another variable expressed is the adsorption space occupied by the adsorbed gas. The adsorption space is a function of the adsorption amount and the density of the adsorption phase, with the empirical calculation formula as follows:
where ω is the adsorption space volume, cm3/g; Va is the absolute gas adsorption amount, mol/g; M is the relative molecular mass of the gas, g/mol; V0 is the molar volume of the gas under standard conditions, taken as 22.4 L/mol; and ρad is the adsorption phase density, g/cm3. The adsorption phase density is an approximate value and is independent of pressure. The empirical formula for adsorption phase density proposed by OZAWA et al. [37] is as follows:
where ρb is the boiling point density of methane, taken as 0.424 cm3/g; and Tb is the boiling point temperature of methane at one atmosphere, taken as 111.7 K.
To clarify the relationship between the calculation of adsorption potential energy and adsorption space, mathematical fitting can be performed based on their correlation, with the expression as follows:
where a, b, c, and d are fitting parameters.
Combining Equations (6)–(10), a supercritical methane adsorption model considering temperature, pressure, and methane adsorption phase density is obtained:
3. Results and Discussion
To investigate the influence of pore–fracture development characteristics in deep coal seams on supercritical methane adsorption, pore size distribution and pore parameters (pore volume, specific surface area, fractal dimension, etc.) were obtained through SEM-EDS, LTCO2A, and MIP experiments. Methane adsorption capacity was measured using HTHP-CH4A. Based on the established supercritical methane adsorption model, the methane adsorption capacity in deep coal seams was predicted. The evolution of pore–fracture structures and adsorption characteristics in deep coal rocks was revealed by combining pore parameters, and the accuracy of the model was verified.
3.1. Analysis of Pore Structure Characteristics of Coal
3.1.1. Analysis of Surface Morphology and Mineral Elements of Coal
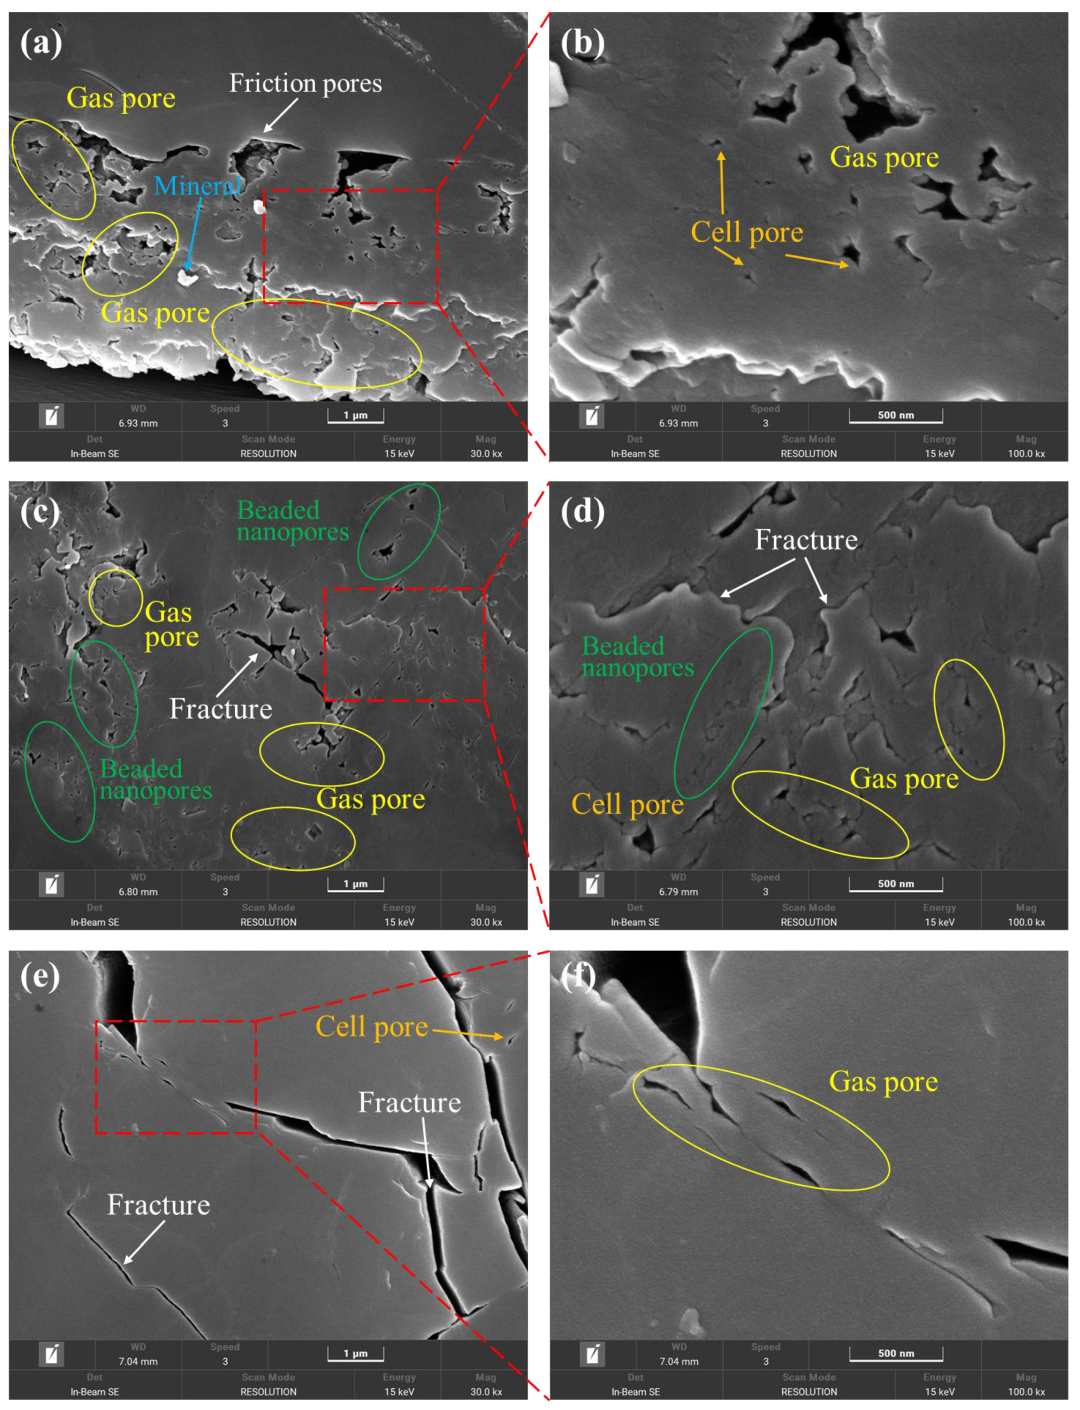
SEM testing was conducted at magnifications of 30,000× and 100,000×, revealing clear contours of pores with diameters of 1 μm and 500 nm (Figure 2). The pore structure integrity of the coal in the sample was relatively good, with the following four types of pores developed in the coal: beaded nanopores, gas pores, cell pores, and friction pores. Additionally, a small number of microfractures were present (more prominent in sample K191). Among these, beaded nanopores exist in the coal matrix, with non-uniform connectivity of the pores. The small pores are distributed in a bead-like pattern and can be interconnected by microfractures, but this is relatively rare, with a small, interconnected range (Figure 2c). The pore size is typically less than 1 μm. Gas pores are widely distributed in the DS1 and H6 coal samples. They were formed during the coalification stage by gasification and gas accumulation. The pores are subcircular, elliptical, and irregular in shape, distributed relatively densely, with diameters generally less than 2 μm and varying in size. The cell pores are essentially disconnected from one another, formed by the cellular structures of coal-forming plants. They exist in an isolated form, with a subcircular shape, although some are elliptical or irregular due to damage. The pore diameter is generally less than 1 μm. During the late stages of coal formation, friction between coal bodies under tectonic stress created complex-shaped pores, mostly flattened and linear in shape, with a small amount of debris visible in the pores and a diameter generally less than 5 μm. In addition, some minerals were found to fill the pores in sample DS1, while the presence of minerals in the other samples was not particularly noticeable.
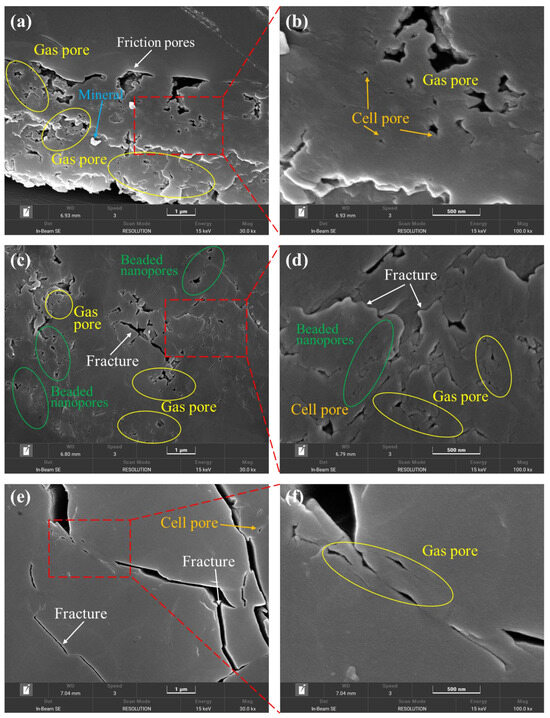
Figure 2.
Morphological characteristics of surface pores under SEM of samples: (a,b) DS1 magnified 30,000 and 100,000 times; (c,d) H6 magnified 30,000 and 100,000 times; and (e,f) K191 magnified 30,000 and 100,000 times.
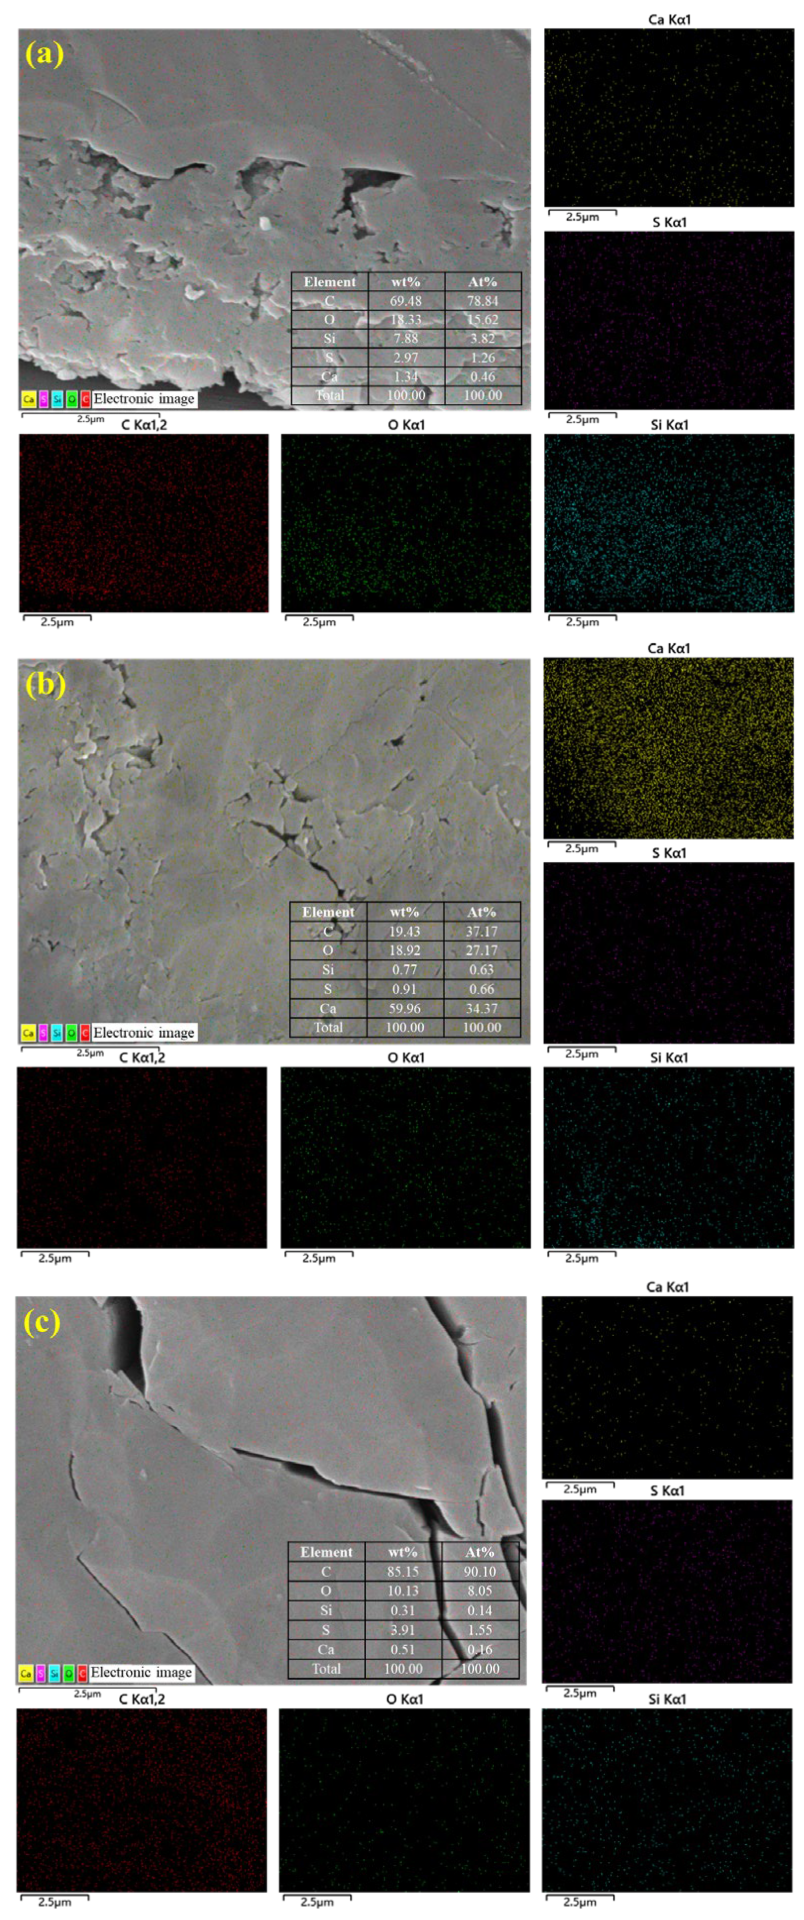
To further clarify the composition of the sample surface and pores, EDS energy spectrum analysis was conducted simultaneously with SEM testing of the sample at 10,000× magnification to observe pore characteristics. The element distribution is shown in Figure 3. EDS observation of the element distribution on the sample surface shows that the sample has high C, O, Si, S, and Ca content. Among them, the H6 sample has relatively low C content and relatively high Ca content, suggesting that the coal in this sample may naturally contain calcium minerals (such as calcite CaCO3) or that deep groundwater or hydrothermal activity may have caused calcium minerals to precipitate in the coal fractures or pores. Additionally, the sample may also contain sulfides (such as pyrite), clay minerals (such as kaolinite), and quartz filling the pores and fractures.
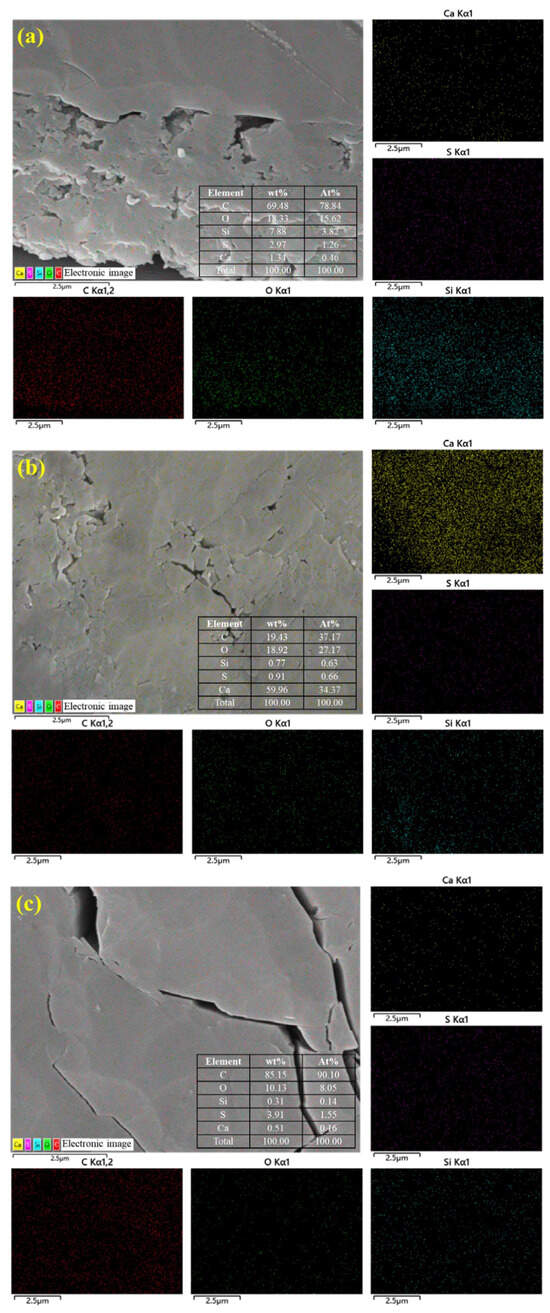
Figure 3.
Surface element distribution of coal samples based on EDS: (a) DS1; (b) H6; and (c) K191.
3.1.2. Pore Size Distribution and Fractal Characteristics of Coal
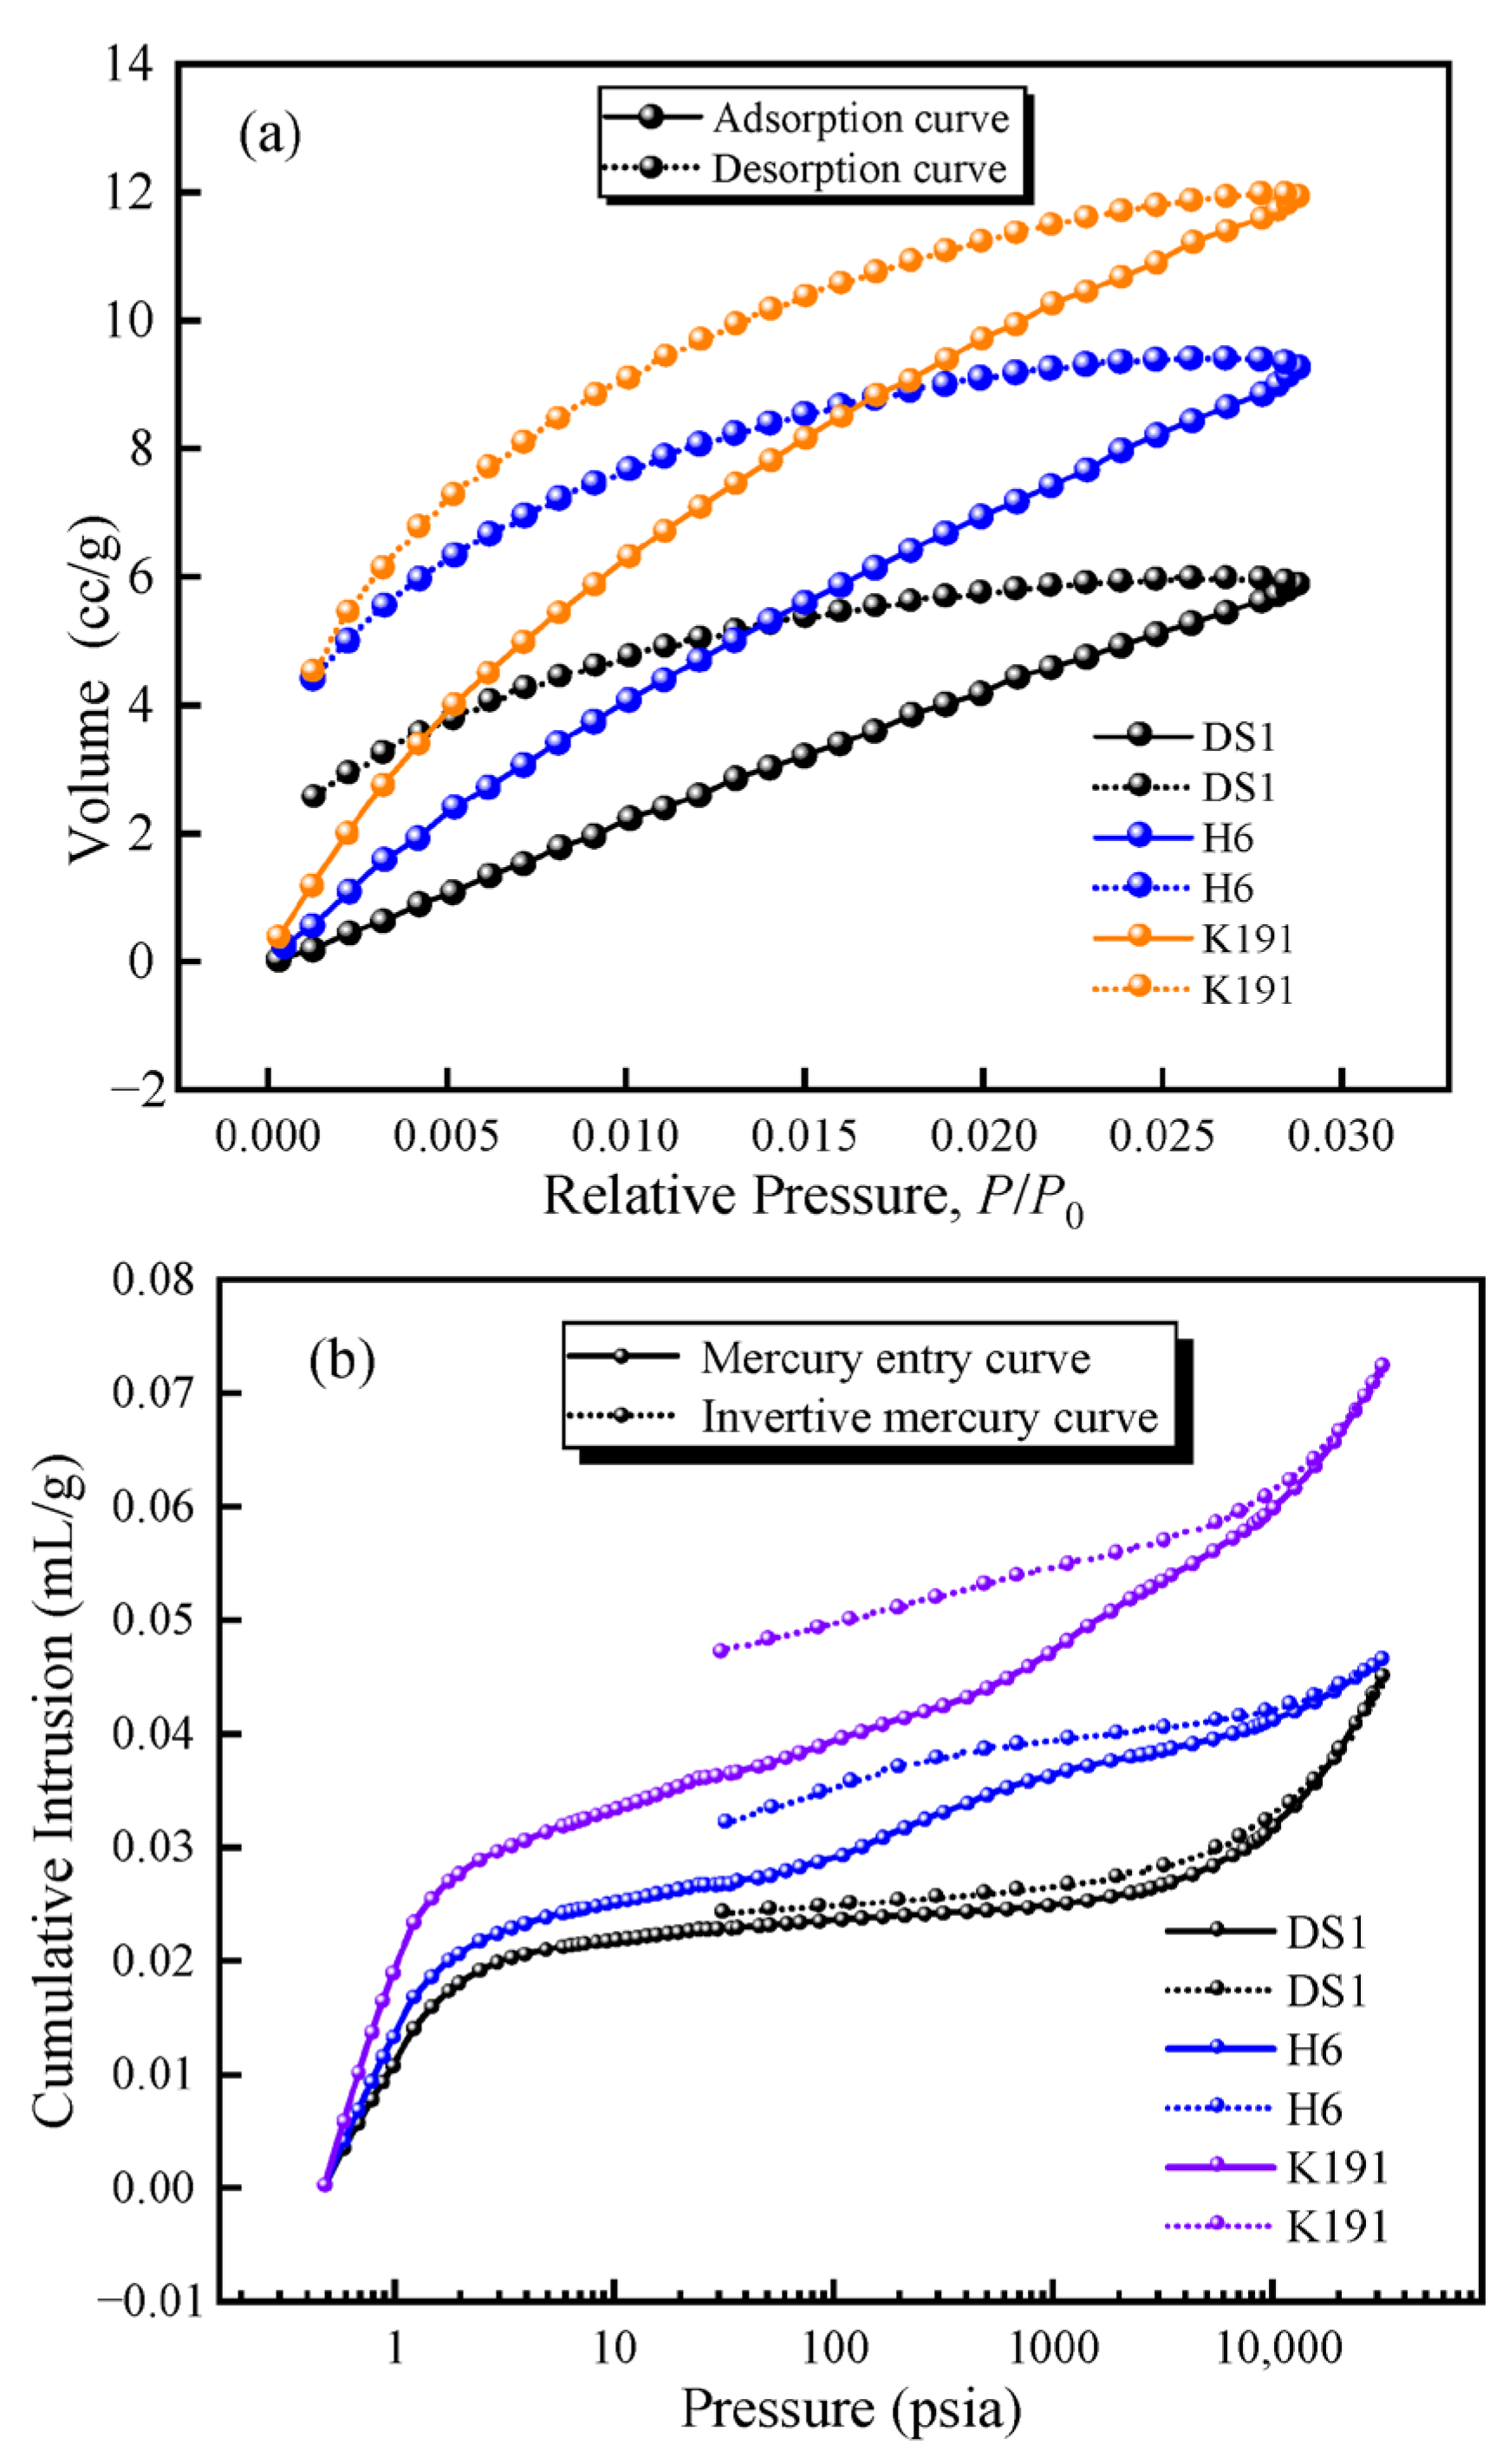
To investigate the pore–fracture development characteristics of deep coal, adsorption–desorption curves and mercury penetration–retraction curves were obtained using LTCO2A and MIP (Figure 4). By comparing the adsorption–desorption curves of the coal samples, it was found that the deep coal samples exhibited a significant desorption “lag loop,” indicating that micro-porous pores of the narrow-bottleneck type (e.g., ink bottle-shaped pores) account for a certain proportion of the sample. Additionally, the mercury penetration and desorption curves also exhibit a distinct “lag loop” Among these, DS1 exhibits a parallel type, with the mercury penetration and desorption curves largely parallel, and the difference in mercury volume at the same pressure point is very small, indicating that the pore morphology is dominated by semi-closed pores, with open pores accounting for a certain proportion; H6 exhibits an M-type, with the mercury penetration curve composed of an inverted S-shape and an S-shape while the mercury desorption curve deviates from the mercury adsorption curve from the start of pressure release, with the deviation increasing progressively, indicating a large lag loop. This suggests that semi-closed pores and narrow-neck pores account for a high proportion in the micro-porous structure, and open pores have a relatively high proportion in all stages. The formation of such pore structures may also be attributed to mercury adsorption pressure, which causes semi-closed pores to connect, increasing mercury adsorption volume and resulting in a larger lag loop opening. Additionally, the connectivity of such coal samples is poor, and the coal quality is soft and brittle due to tectonic influences. K191 exhibits a double-arc shape, with both the mercury injection curve and the mercury desorption curve forming concave arcs, and the lag loop is most pronounced. This indicates that the pores primarily consist of fine-neck pores and semi-closed pores, with a low proportion of open pores and poor pore connectivity.
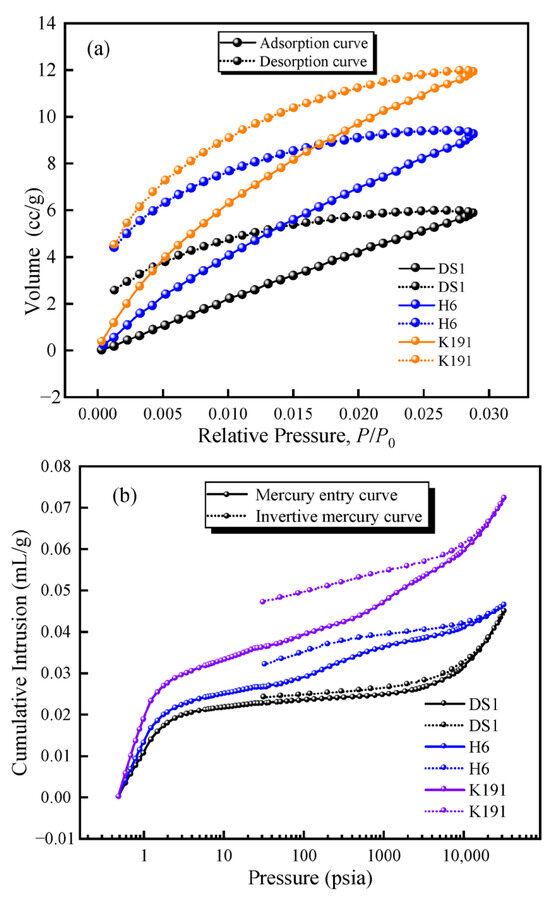
Figure 4.
(a) LTCO2A adsorption–desorption curve and (b) MIP mercury retention curve.
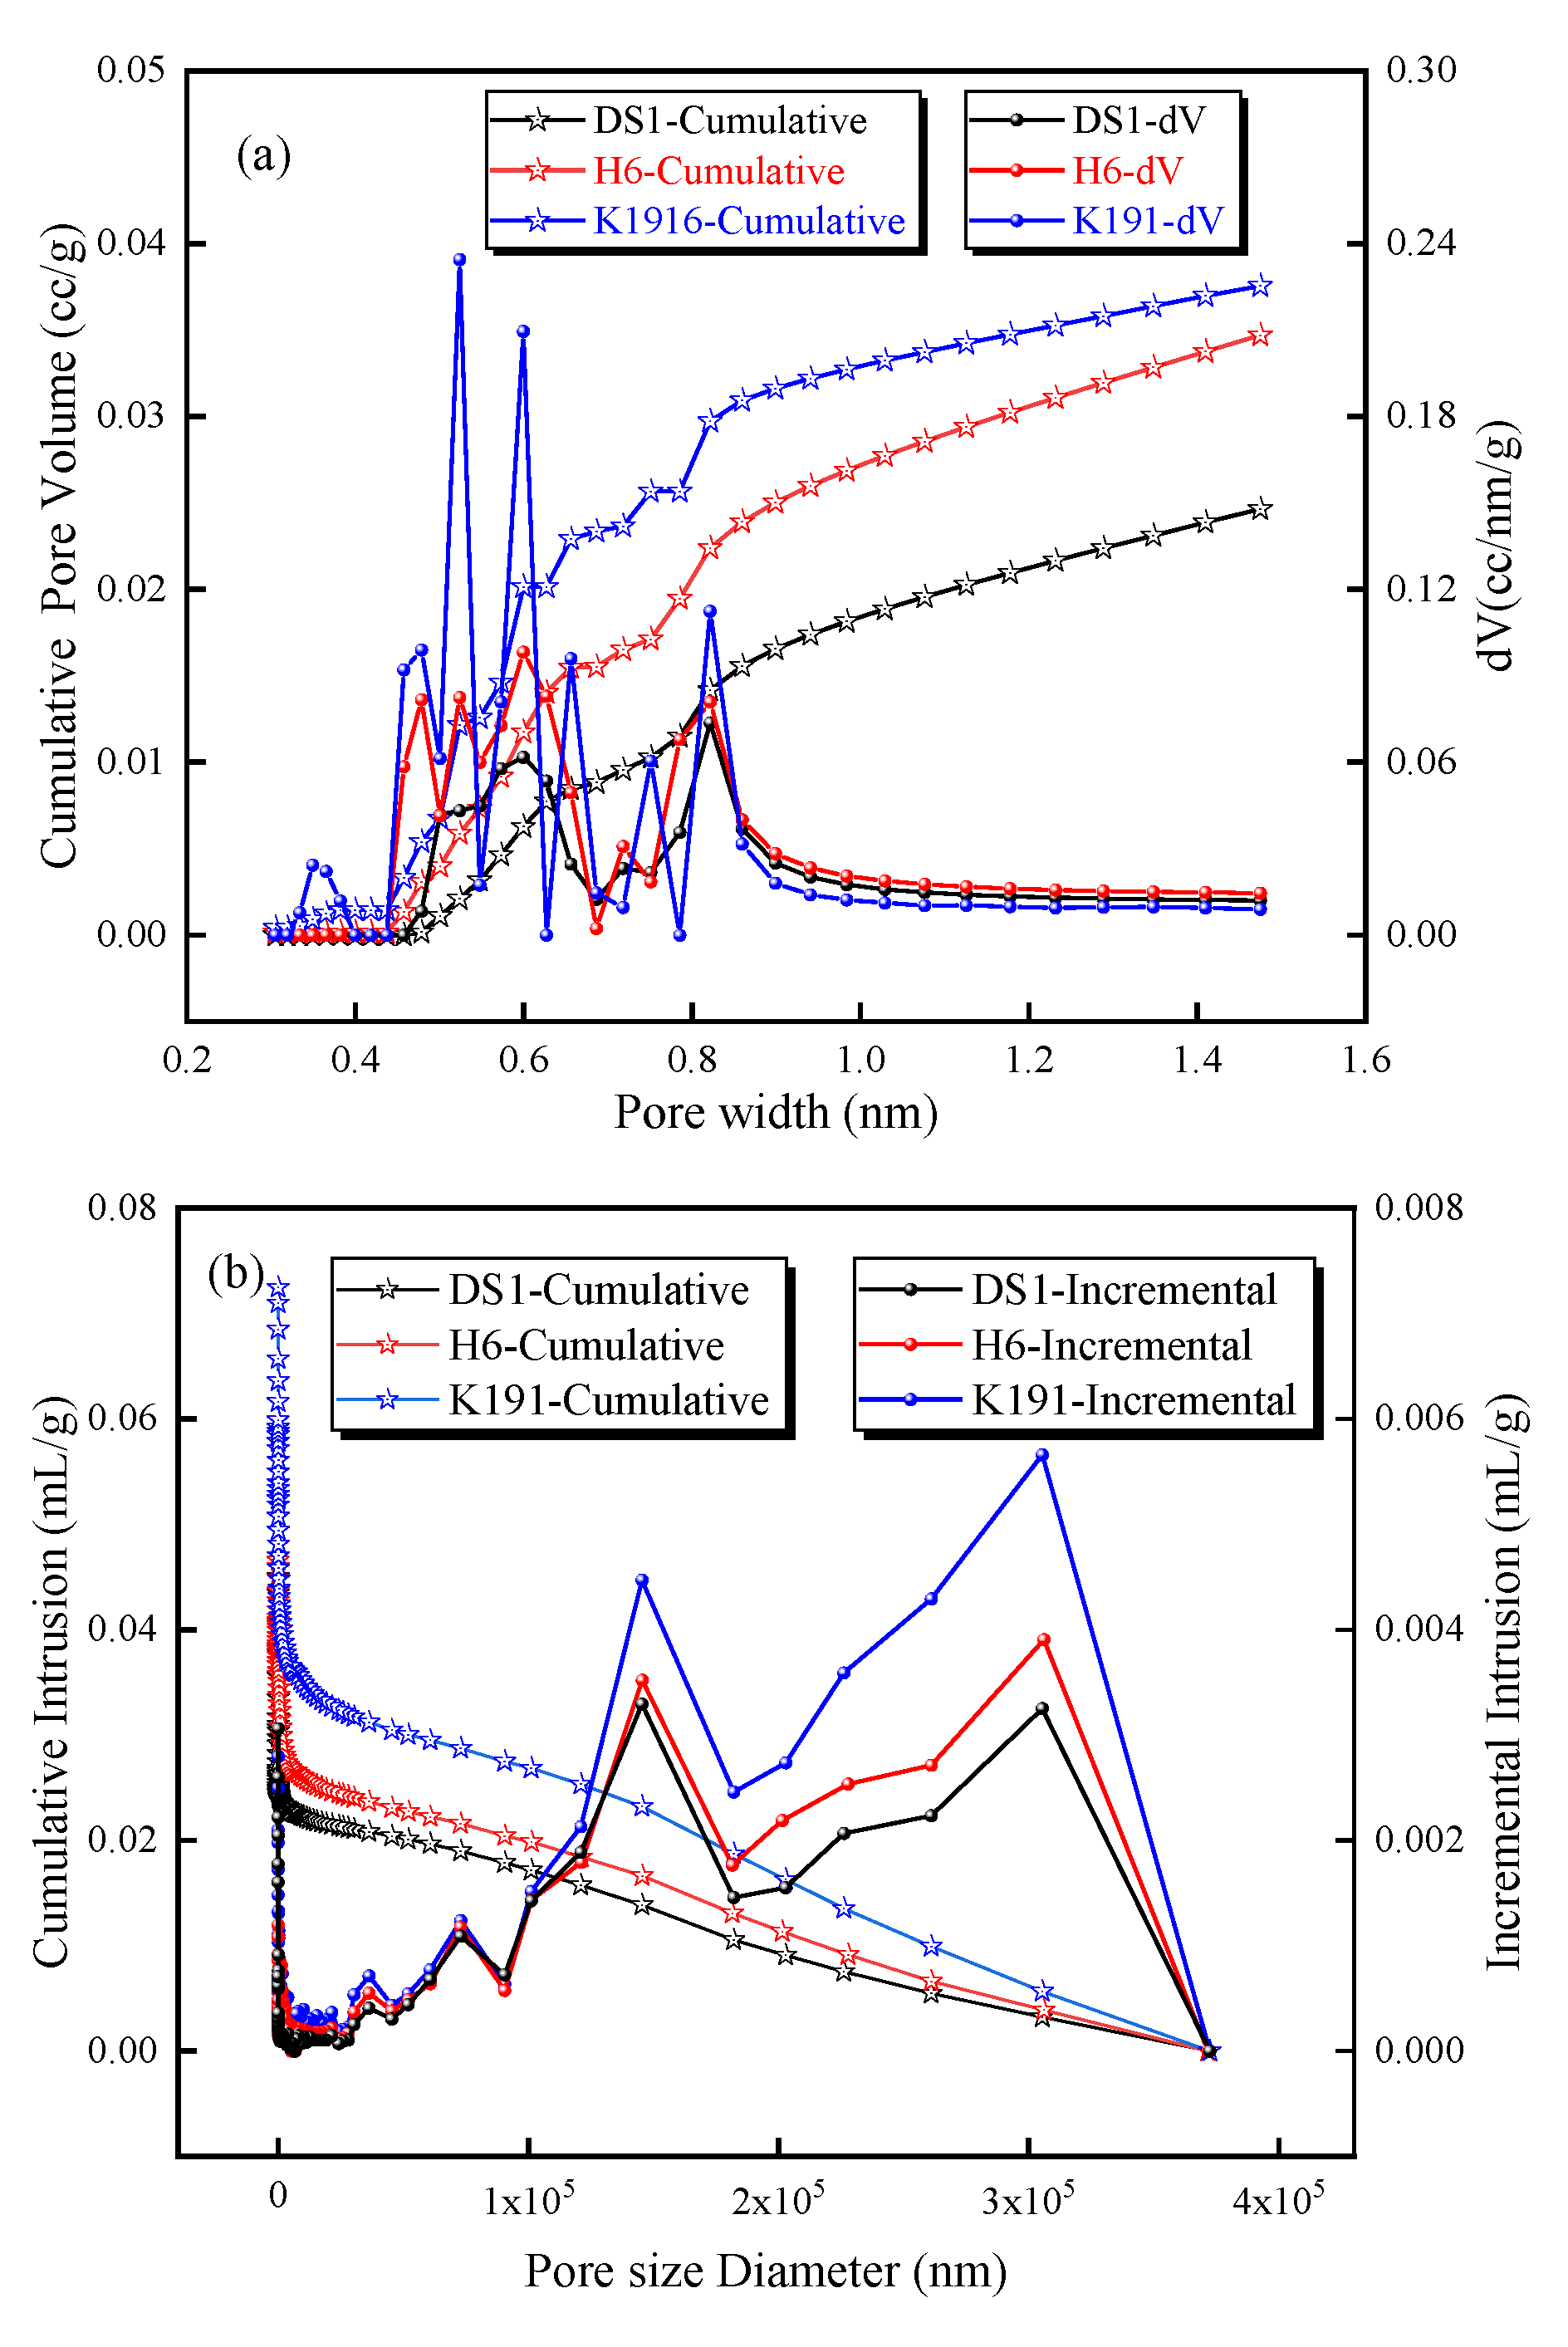
Based on LTCO2A and MIP data, the pore size distribution of micro-pores (<2 nm) was calculated using a DFT model (Figure 5a), and the pore size distribution of pores ranging from 5 nm to 360 μm was calculated using the Washburn equation (Figure 5b). The micro-porous pore size distribution shows that the pore size distribution between 0.4 nm and 1 nm is densely concentrated, and this is also the pore size range where pore volume increases most rapidly, making it the primary contributor to micro-porous volume and providing excellent pore space for methane adsorption. For pores larger than 5 nm, the mercury uptake increases significantly between 5 and 100 nm, with higher peak pore sizes at 150 μm and 300 μm, indicating that these pores and microfractures account for a significant proportion. In particular, the cumulative mercury uptake increases rapidly between 5 and 100 nm, indicating that this pore size range has the highest proportion.
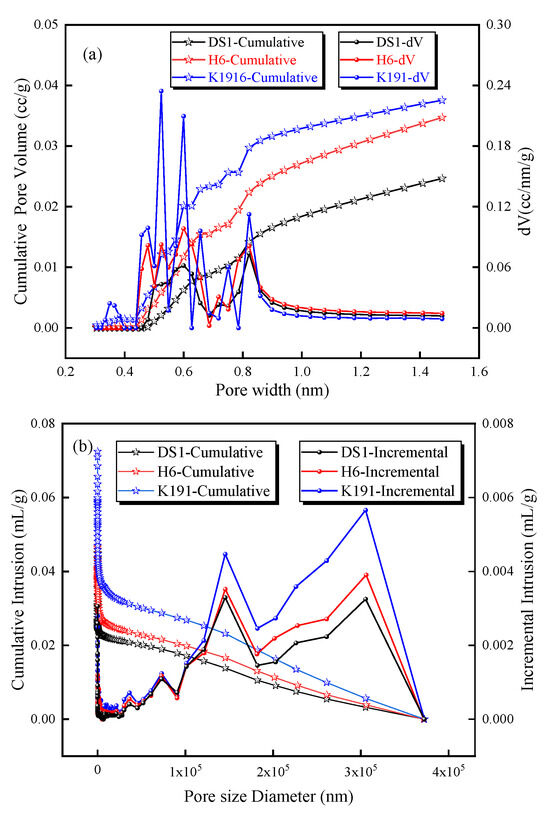
Figure 5.
Pore size distribution and cumulative pore volume based on (a) LTCO2A and (b) MIP experiments.
The pore volume and specific surface area of coal samples at different pore size stages were obtained by LTCO2A and MIP pore size data, and it was concluded that the specific surface area of micro-pores less than 2 nm was the highest, and the higher specific surface area provided more adsorption sites for methane adsorption. The diffusion pores with a relatively large area of 2–100 nm have relatively few adsorption sites, and the pores contain both adsorbed gas and free gas. The specific surface area of seepage holes is relatively small, which mainly provides gas transportation space. The pore volume of seepage pores is the main contribution, mainly because micro-cracks larger than one micron occupy a large space, which provides a good storage and migration space for free gas in deep coal seams. Secondly, the micro-pore volume accounts for a large proportion, and the diffusion pores account for the smallest proportion. But in general, the sum of pore volumes smaller than 100 nm is larger than the seepage pore volume, which is mainly due to the compression of macro-pores (larger than 100 nm) in deep coal seams under high-temperature and high-pressure conditions, and the micro-pores–meso-pores (Table 2).
Table 2.
Statistics of pore volume and specific surface area of coal samples.
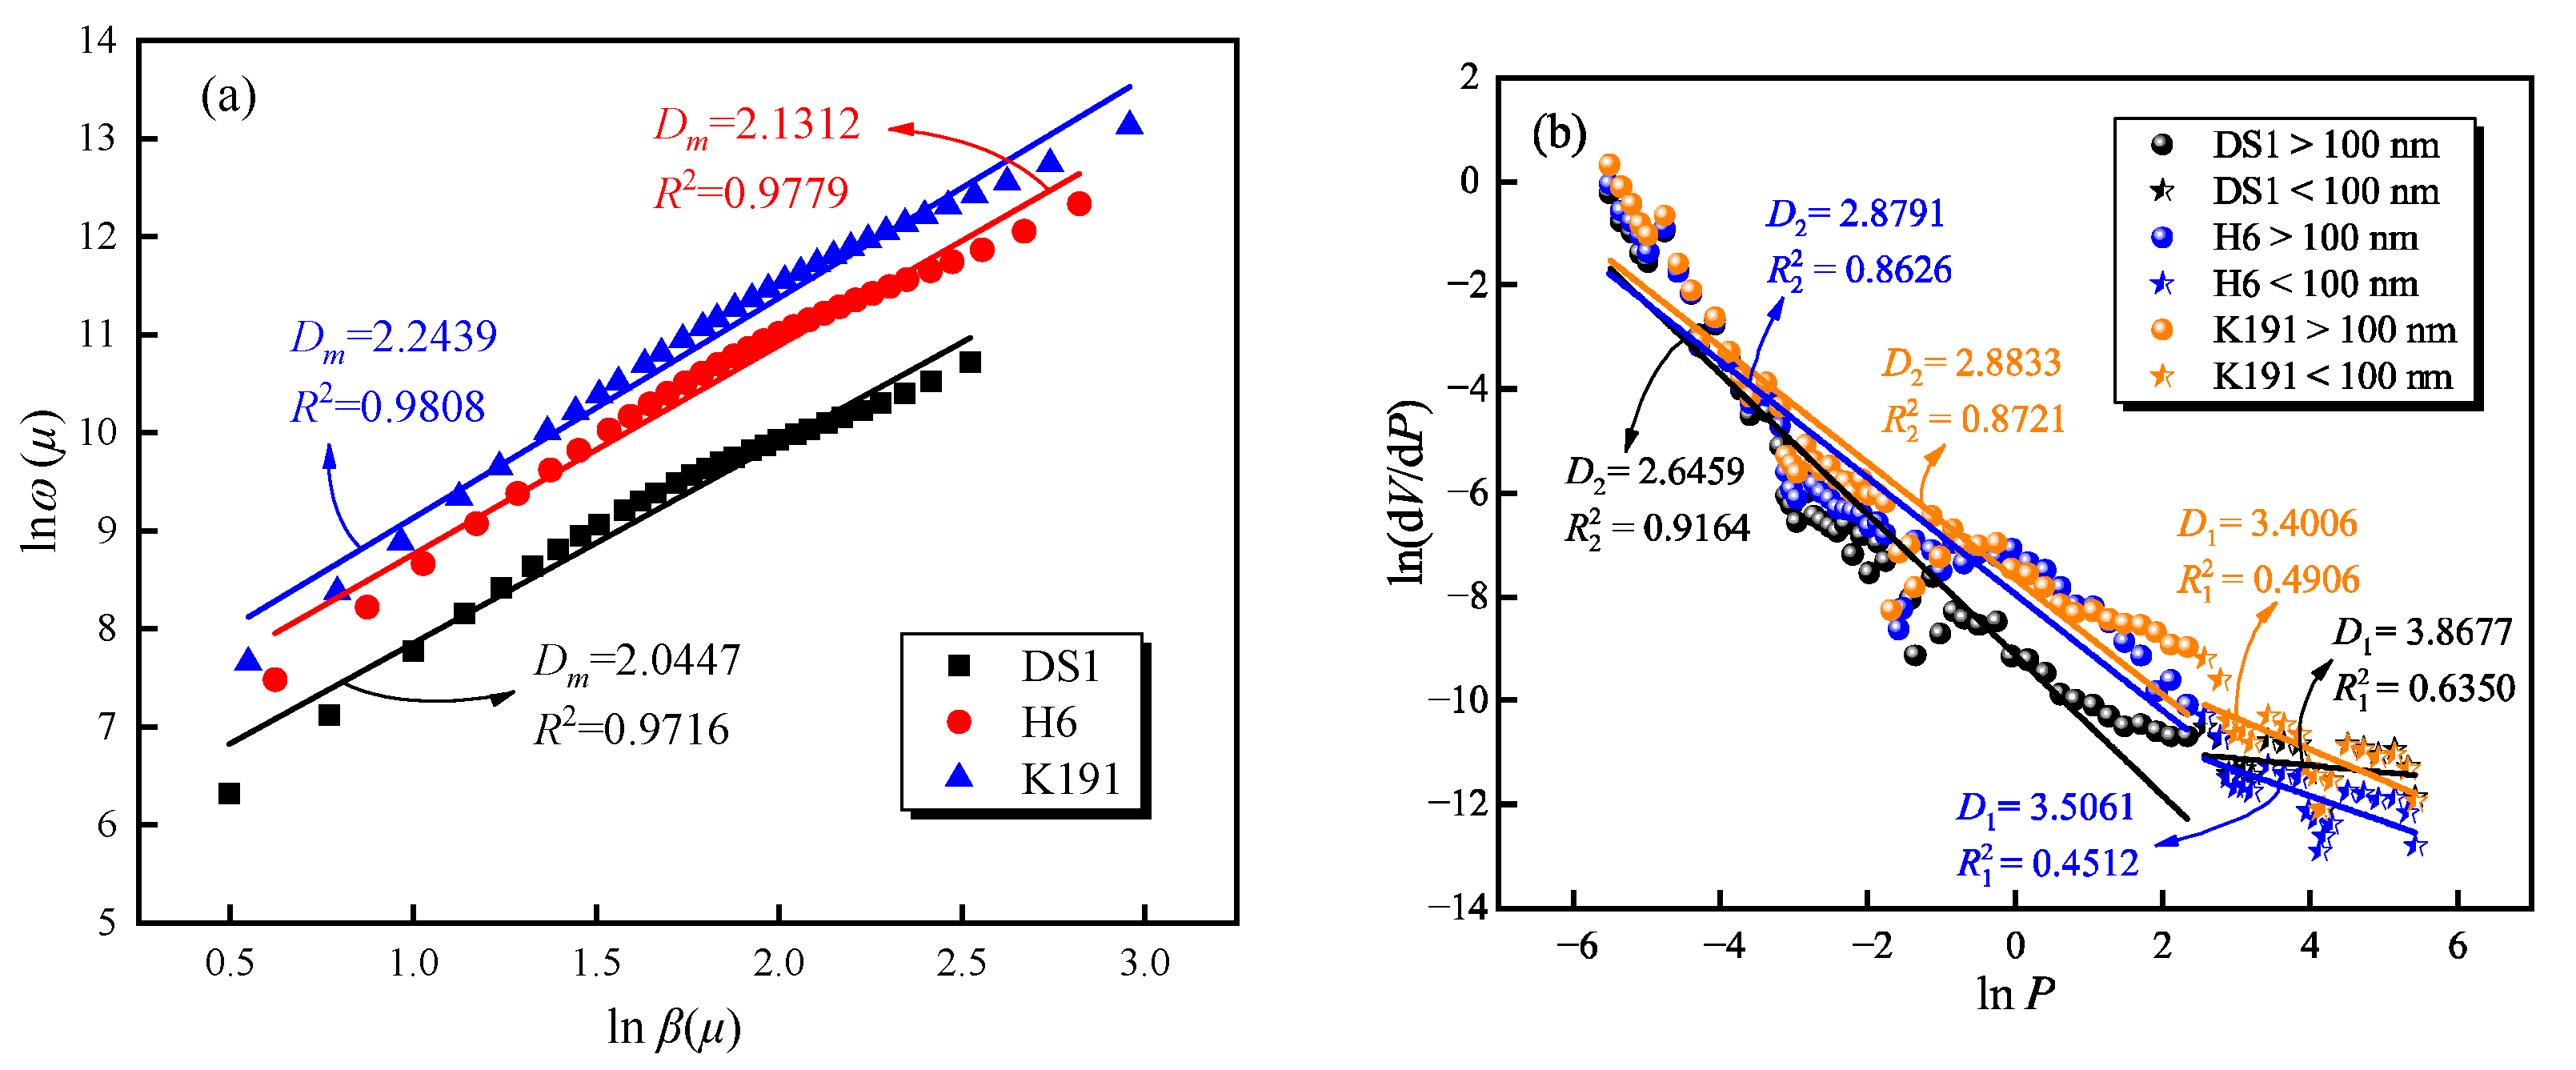
The fractal curve of the pore structure of micro-porous coal samples is shown in Figure 6a. The fractal dimension Dm ranges from 2.0447 to 2.2439, indicating that the micro-porous pores have high roughness and a large specific surface area, providing excellent sites for methane adsorption. The fractal curves calculated using the mercury porosimetry method are shown in Figure 6b. Coal samples from different burial depths exhibit distinct fractal characteristics. with fractal values for the pore structure ranging from 2.6459 to 3.8677, fractal values for the diffusion pores ranging from 3.4006 to 3.8677, and fractal values for the flow pores ranging from 2.6459 to 2.8833. This indicates that the pore surfaces of deep coal layers approach three-dimensional pore space, with a relatively rough surface, and reflect the complexity of the gas diffusion-seepage pore space. In the fractal dimensions calculated by MIP, the fractal values of diffusion pores are all greater than 3, which physically exist and reflect the degree of coal body damage. This indicates that during the high-pressure stage, coal body damage occurs, and pore fractures form, thereby increasing the connectivity between semi-closed pores and independent pores below 100 nm, forming cross-type fluid diffusion channels.
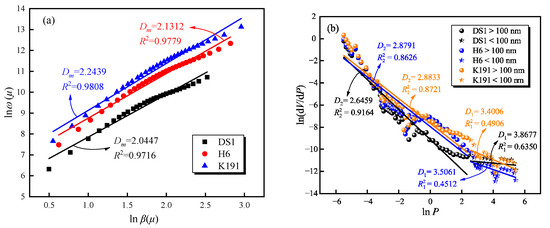
Figure 6.
Fractal characteristics of pore structures based on (a) LTCO2A and (b) MIP.
3.2. Adsorption Characteristics of Deep Coal Rock and Supercritical Methane
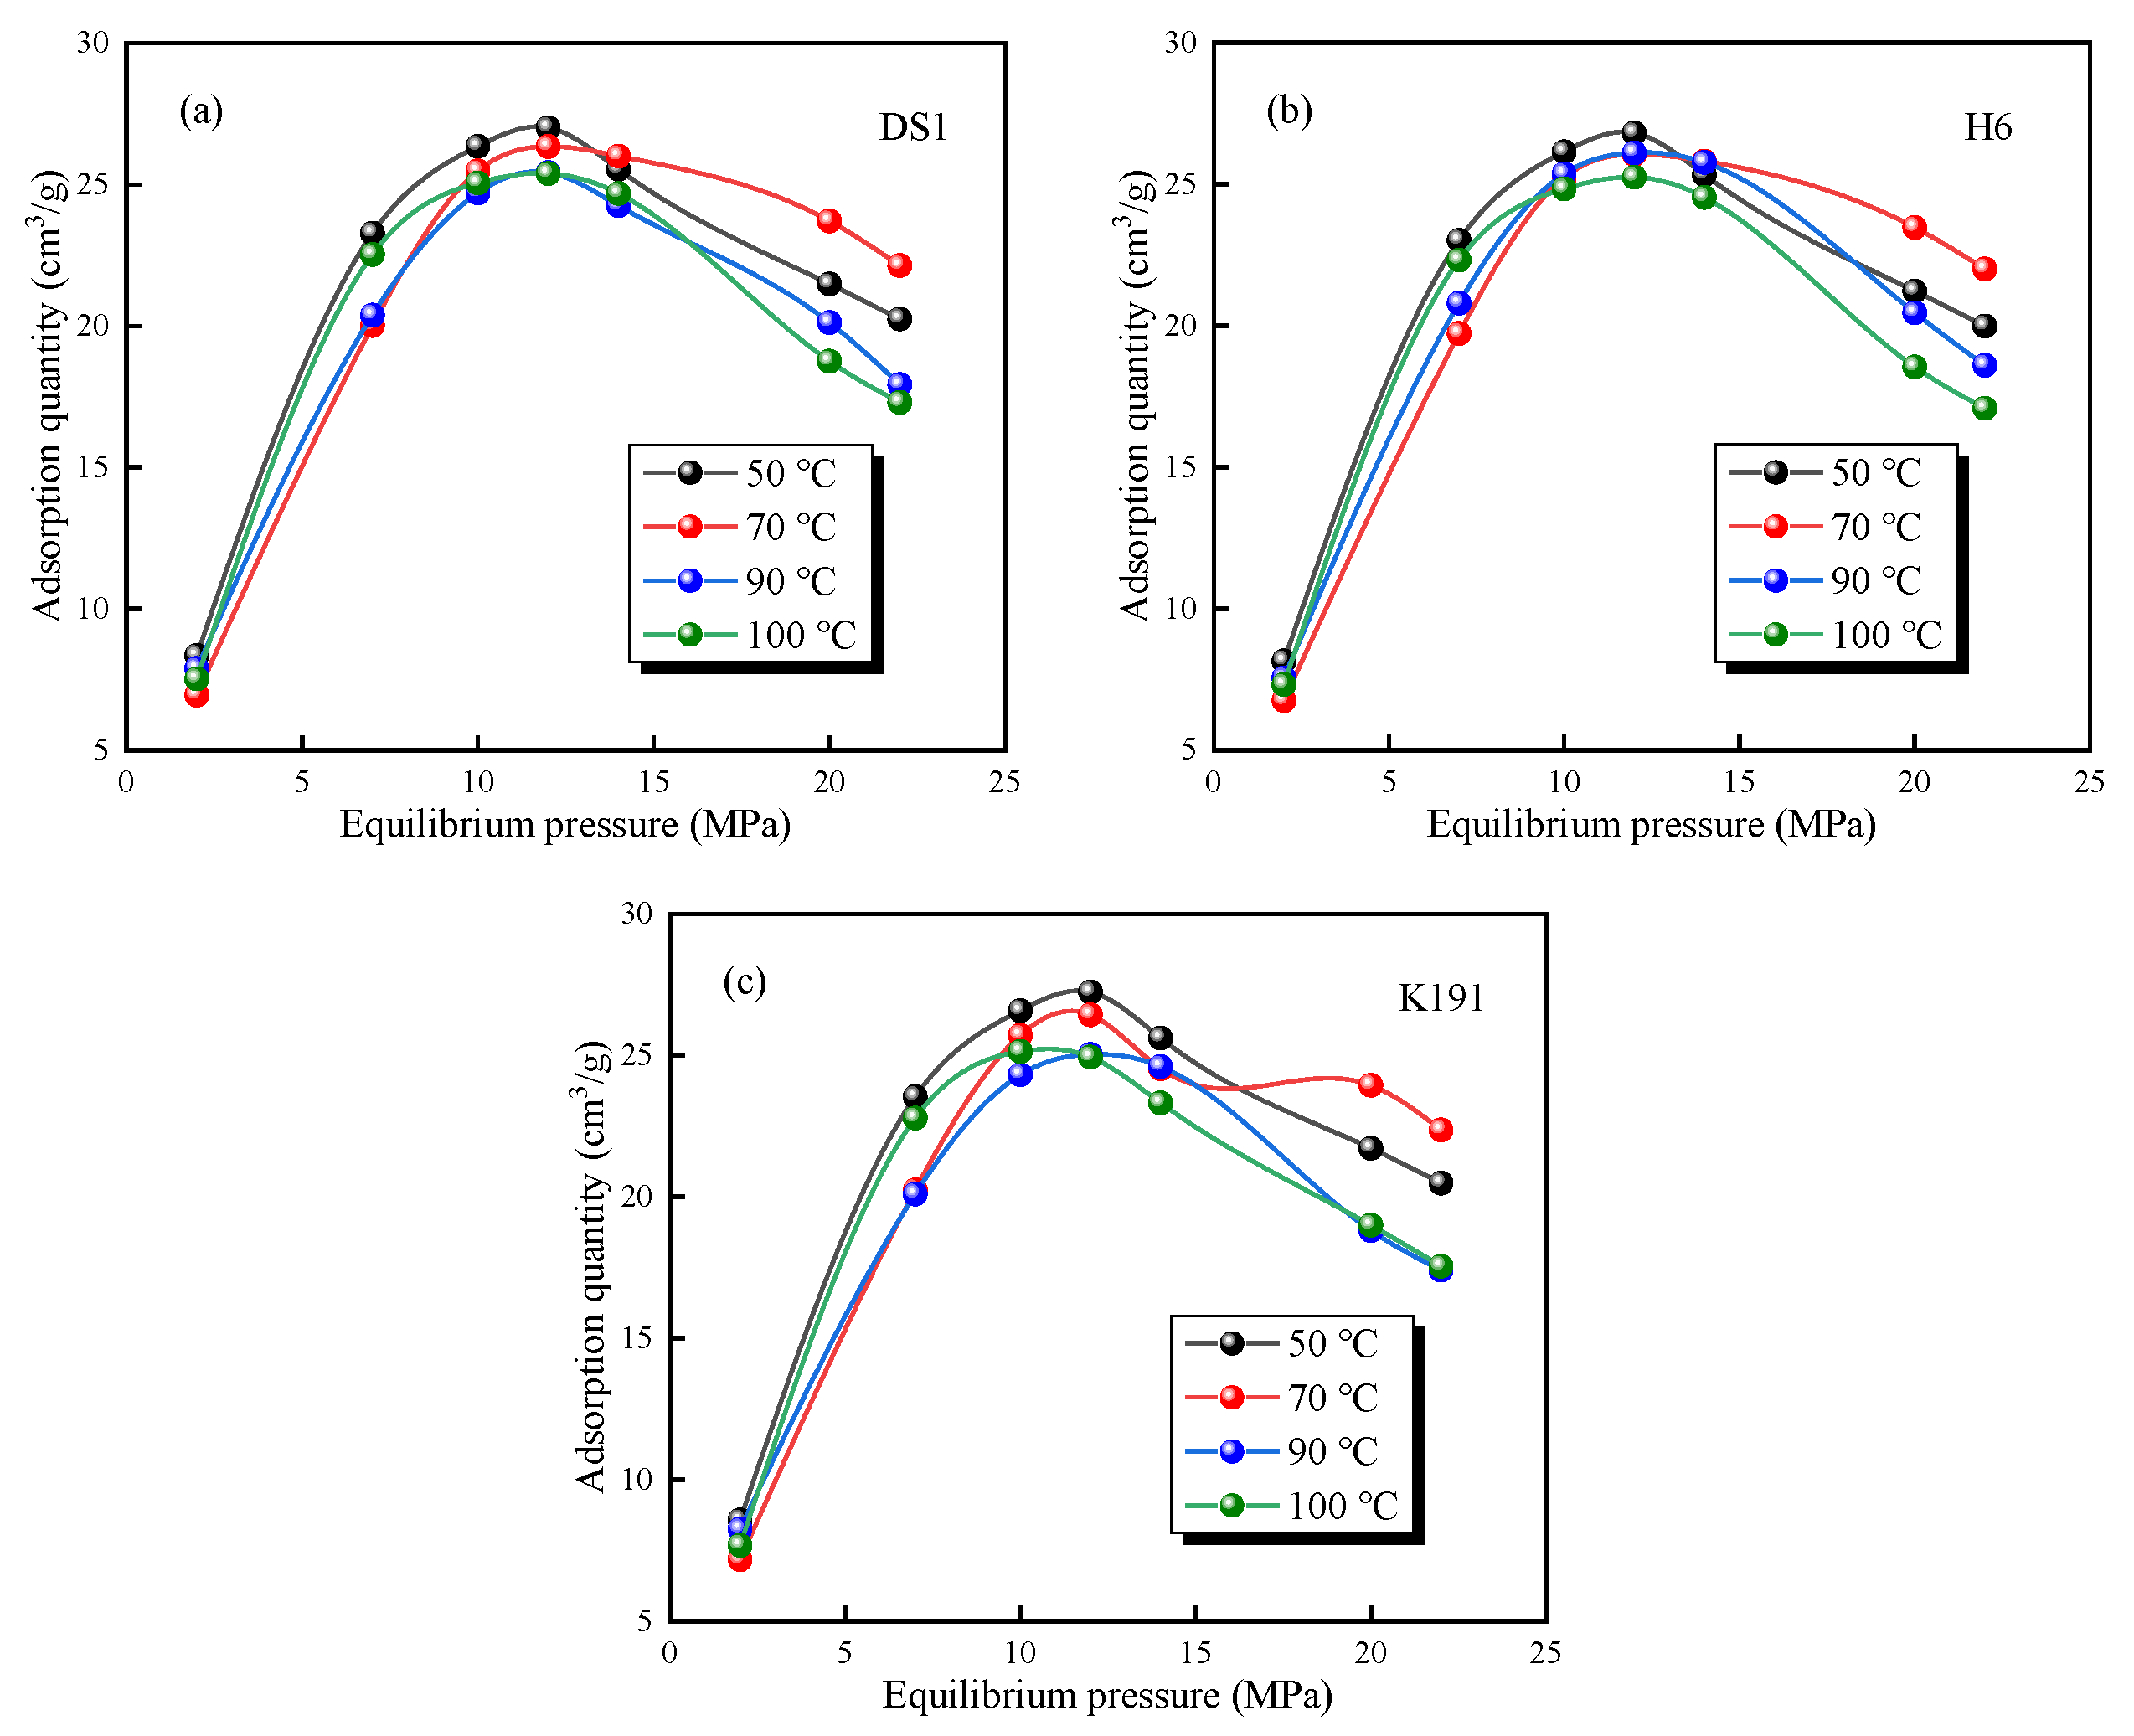
The HTHP-CH4 test data (Figure 7) show that under high-temperature and high-pressure conditions the methane adsorption capacity of deep coal seams first increases and then decreases, exhibiting typical supercritical adsorption characteristics [19,38]. The isothermal adsorption curves of the three coal samples undergo the following three evolutionary stages: Low-pressure stage (adsorption pressure between 0 and 5 MPa): The excess adsorption capacity increases rapidly with increasing pressure. Medium-pressure stage (adsorption pressure 5–12 MPa): As pressure continues to rise, the excess adsorption capacity grows slowly, reaching a maximum value when the pressure approaches 12 MPa. High-pressure stage (pressure > 12 MPa): The excess adsorption capacity gradually decreases with increasing pressure.
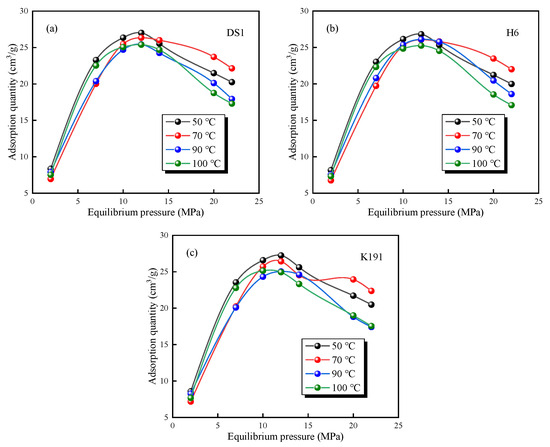
Figure 7.
Variation trend of methane excess adsorption capacity under different temperatures and pressures of coal samples: (a) DS1; (b) H6; and (c) K191.
Under the condition of constant pressure, the adsorption capacity of methane decreases with the increase in temperature because the adsorption of methane by coal is a process of releasing heat. When the temperature of the system increases, the methane molecules in the adsorption phase gain enough energy to overcome the van der Waals force and transform into free methane molecules, which leads to the decrease in adsorption capacity. In addition, the difference in excess adsorption capacity at different temperatures is significant with the increase in pressure in the high-pressure stage. Even the isothermal adsorption lines cross. Therefore, it is necessary to calibrate the absolute adsorption amount according to the adsorption-phase density. At the same time, methane in a supercritical state has the characteristics of gas and liquid, which leads to a decrease in adsorption amount. For example, at 70 °C, the residual adsorption amount is abnormal, which is caused by the influence of coupling effects such as buried depth, high-temperature, high-pressure, and coal pore structure on coal pore structure and methane, which leads to the abnormal increase or decrease in methane adsorption amount. Under the condition of deep high pressure, the excess adsorption capacity cannot be used to represent the adsorption capacity, otherwise the actual content of adsorption gas will be underestimated, and it needs to be converted into absolute adsorption capacity. According to Gibbs’ definition, the relationship between them is as follows:
where Va is the absolute adsorption capacity of CH4, cm3/g; Ve is the excess adsorption capacity of CH4, cm3/g; and Z is the gas compressibility factor of methane at different temperatures and pressures, which can be obtained based on the empirical formula proposed by Zhou et al. [39] or from the NIST database (see Table 3 for values).
Table 3.
Methane compression factor under different temperature and pressure conditions.
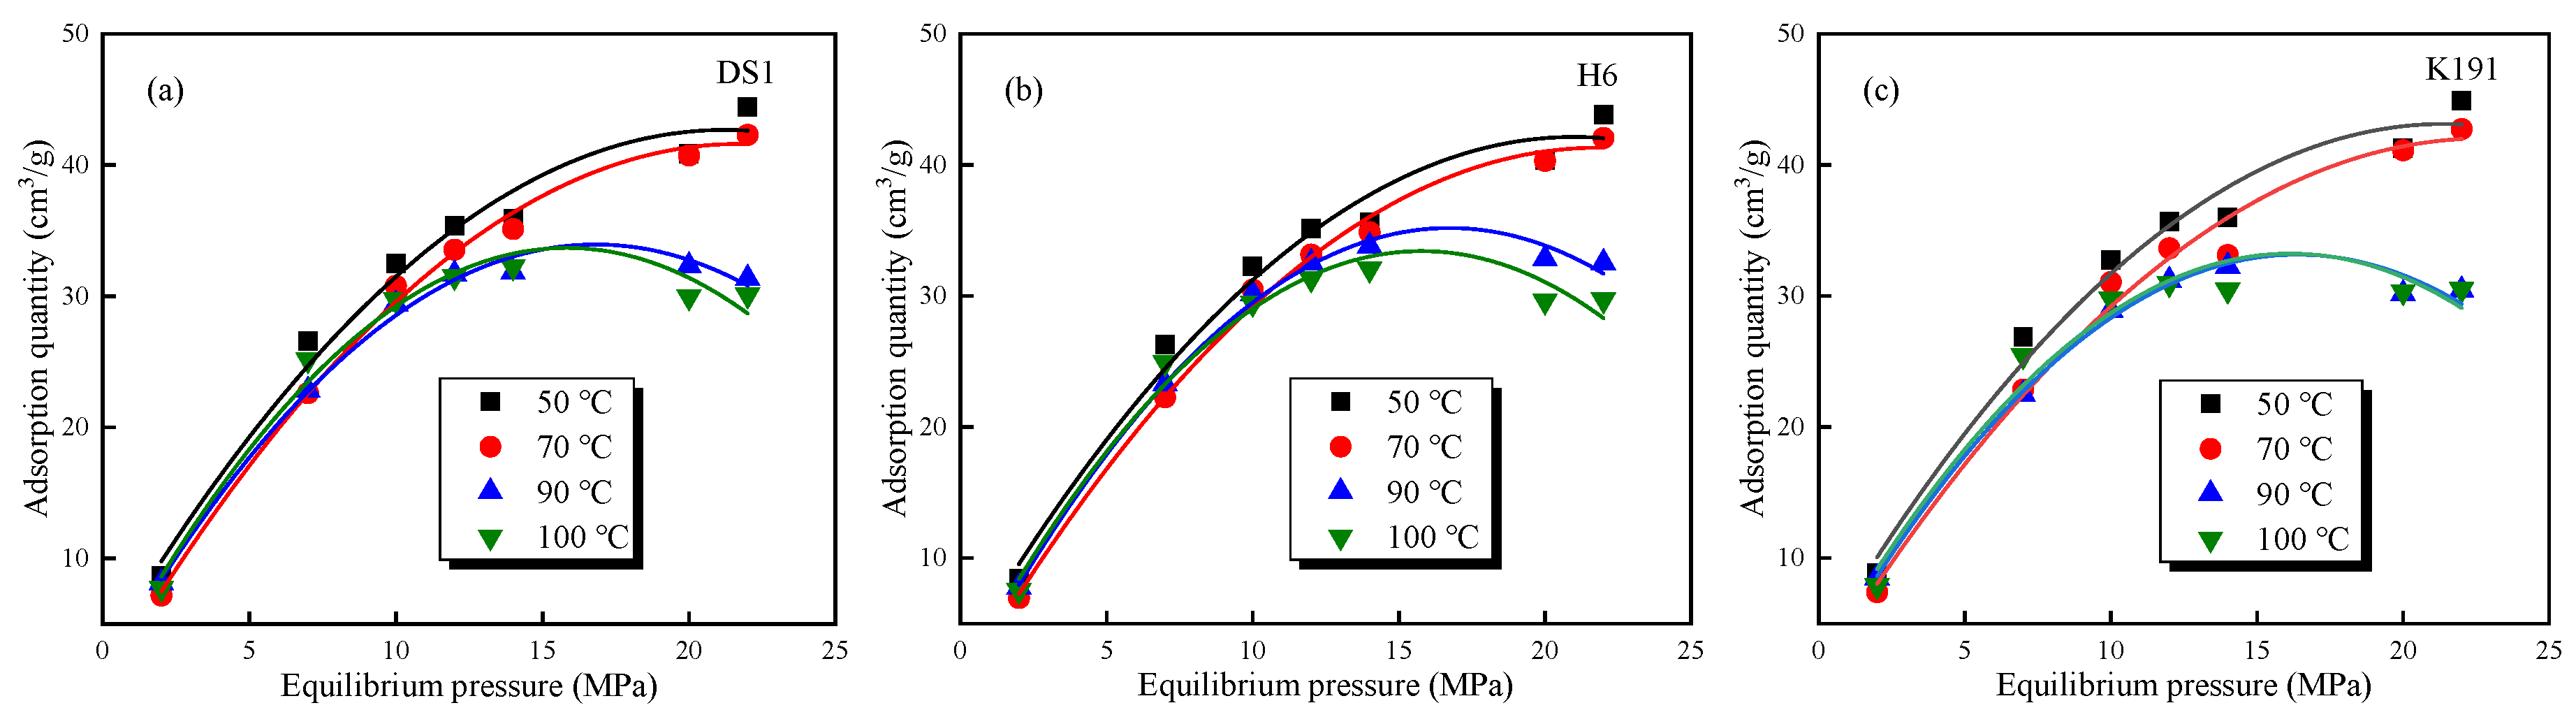
The absolute adsorption capacity calculated using Equation (12) is shown in Figure 8. The absolute adsorption capacity exhibits the following two distinct types: The first type: At temperatures below 70 °C, under isothermal conditions, the adsorption capacity increases with increasing pressure, reaching a maximum adsorption capacity at an equilibrium pressure of approximately 22 MPa; under isobaric conditions, the adsorption capacity decreases with increasing temperature. The second type: At temperatures above 70 °C, under isothermal conditions, the adsorption curve exhibits typical supercritical methane adsorption characteristics, with the adsorption capacity first increasing and then decreasing with pressure, reaching a peak adsorption value around 15 MPa. Under isobaric conditions, adsorption capacity decreases with increasing temperature. However, as burial depth increases (DS1 > K191 > H6), the decrease in adsorption capacity becomes slower, and after 15 MPa, the decrease becomes more pronounced. This is primarily due to the fact that under high-temperature and high-pressure conditions, supercritical methane simultaneously exhibits both gaseous and liquid properties, and significant overpressure phenomena form within the micro-porous structure of deep coal samples, thereby inhibiting methane adsorption capacity.
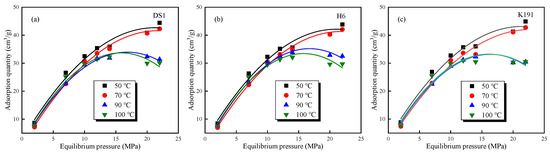
Figure 8.
Variation trends of the absolute adsorption capacity of methane under different temperatures and pressures of coal samples: (a) DS1; (b) H6; and (c) K191.
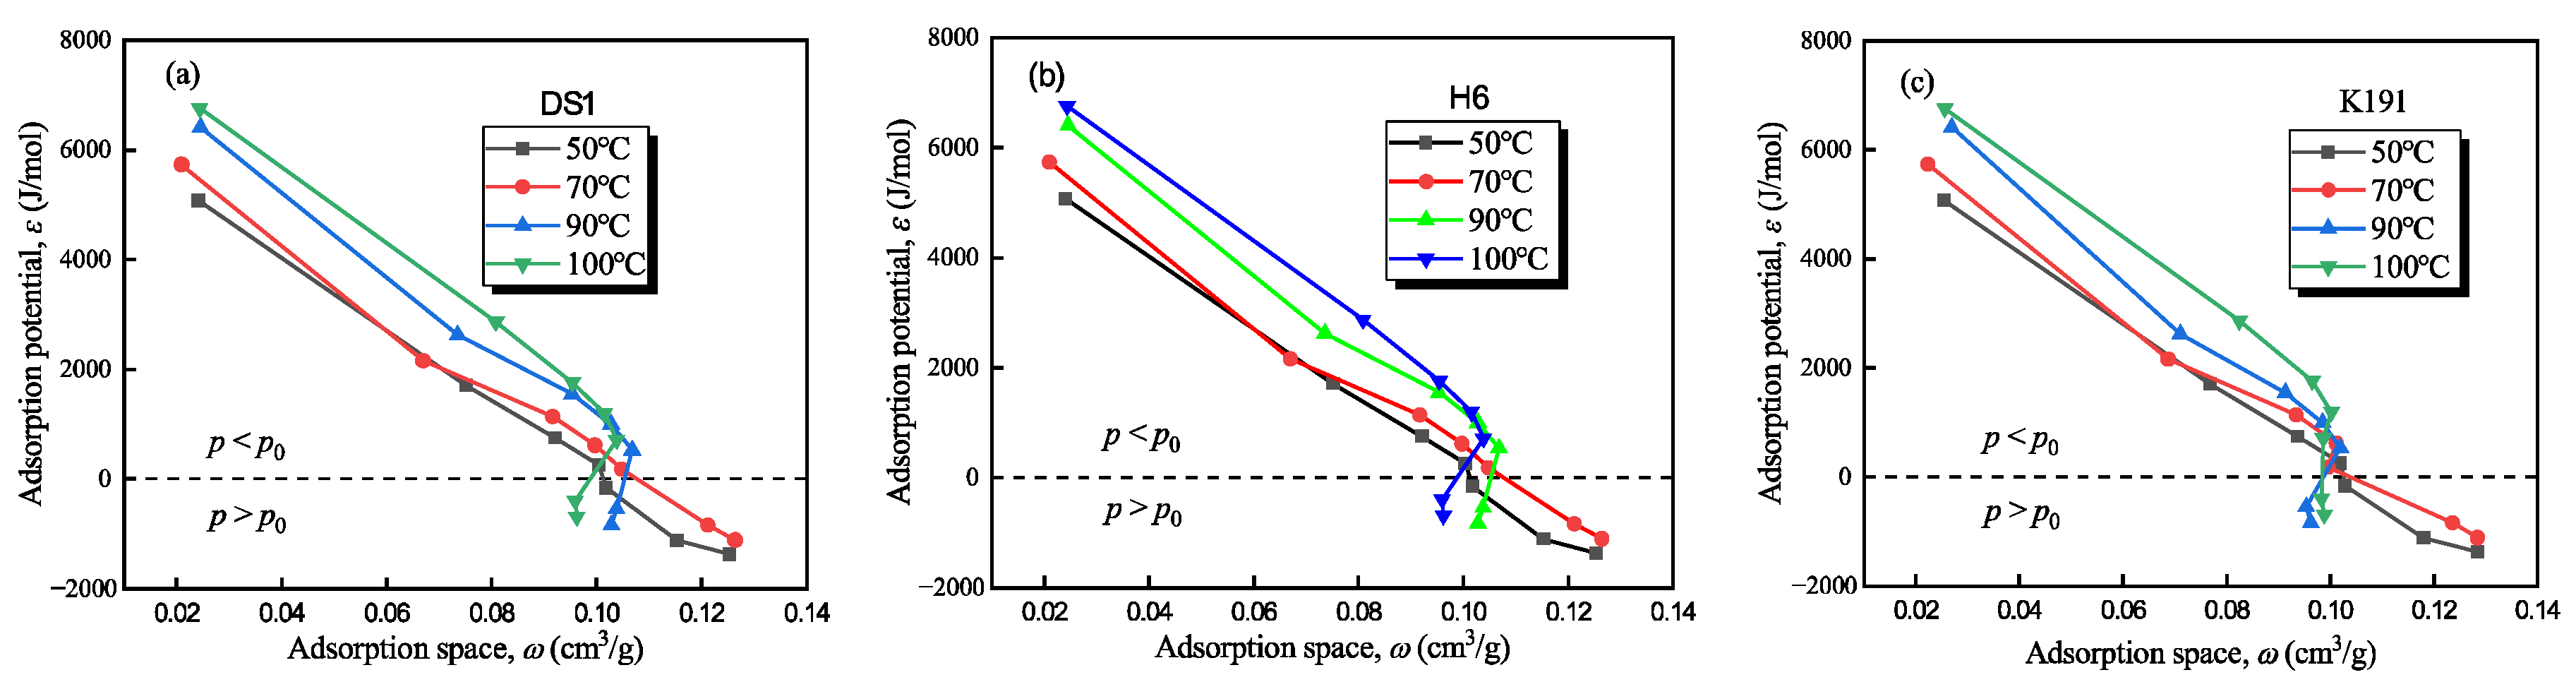
The adsorption potential and adsorption space of deep coal rock under supercritical methane conditions were calculated using HTHP-CH4A experimental data and Equations (6) and (8) (see Figure 9). The characteristic curves of the methane adsorption system in deep coal rock in the Tuhai Basin exhibit the two following types: the low-pressure zone (P < P0) (i.e., 2–15 MPa), ε > 0, indicating that methane adsorption is a spontaneous process with high adsorption potential (>700 J/mol) and strong adsorption capacity; and a high-pressure zone (P > P0) (i.e., 15–22 MPa), ε < 0, where the adsorption potential is negative, theoretically requiring external force for adsorption, but adsorption may still occur in practice due to micro-porous overpressure or adsorption-phase transitions.
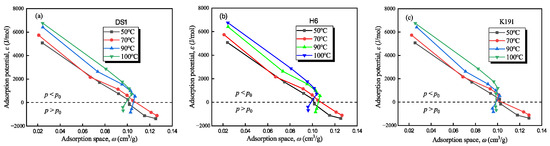
Figure 9.
Adsorption characteristic curve of methane–coal rock adsorption system: (a) DS1; (b) H6; and (c) K191.
3.3. Verification of Supercritical Methane Adsorption Capacity Prediction Model
Using HTHP-CH4A experimental data, a supercritical methane adsorption model was developed that accounts for adsorption-phase density, temperature, and pressure. The parameters a, b, c, and d for the DS1, H6, and K191 coal samples under different temperature conditions were obtained by fitting the characteristic curves of the methane–coal rock adsorption system in Figure 9 using Equation (10) (see Table 4). The fitted parameters (a, b, c, and d) represent the relationship between methane adsorption potential and adsorption space. The methane adsorption potential is related to temperature and pressure (Equations (6) and (7)), while the adsorption space is related to methane adsorption capacity and adsorption-phase density (Equations (8) and (9)). By substituting the parameters into Equation (11), the supercritical methane adsorption model for deep coalbeds in the Tuhai Basin was obtained.
Table 4.
Fitting parameters of ω and ε for coal samples under different temperature conditions.
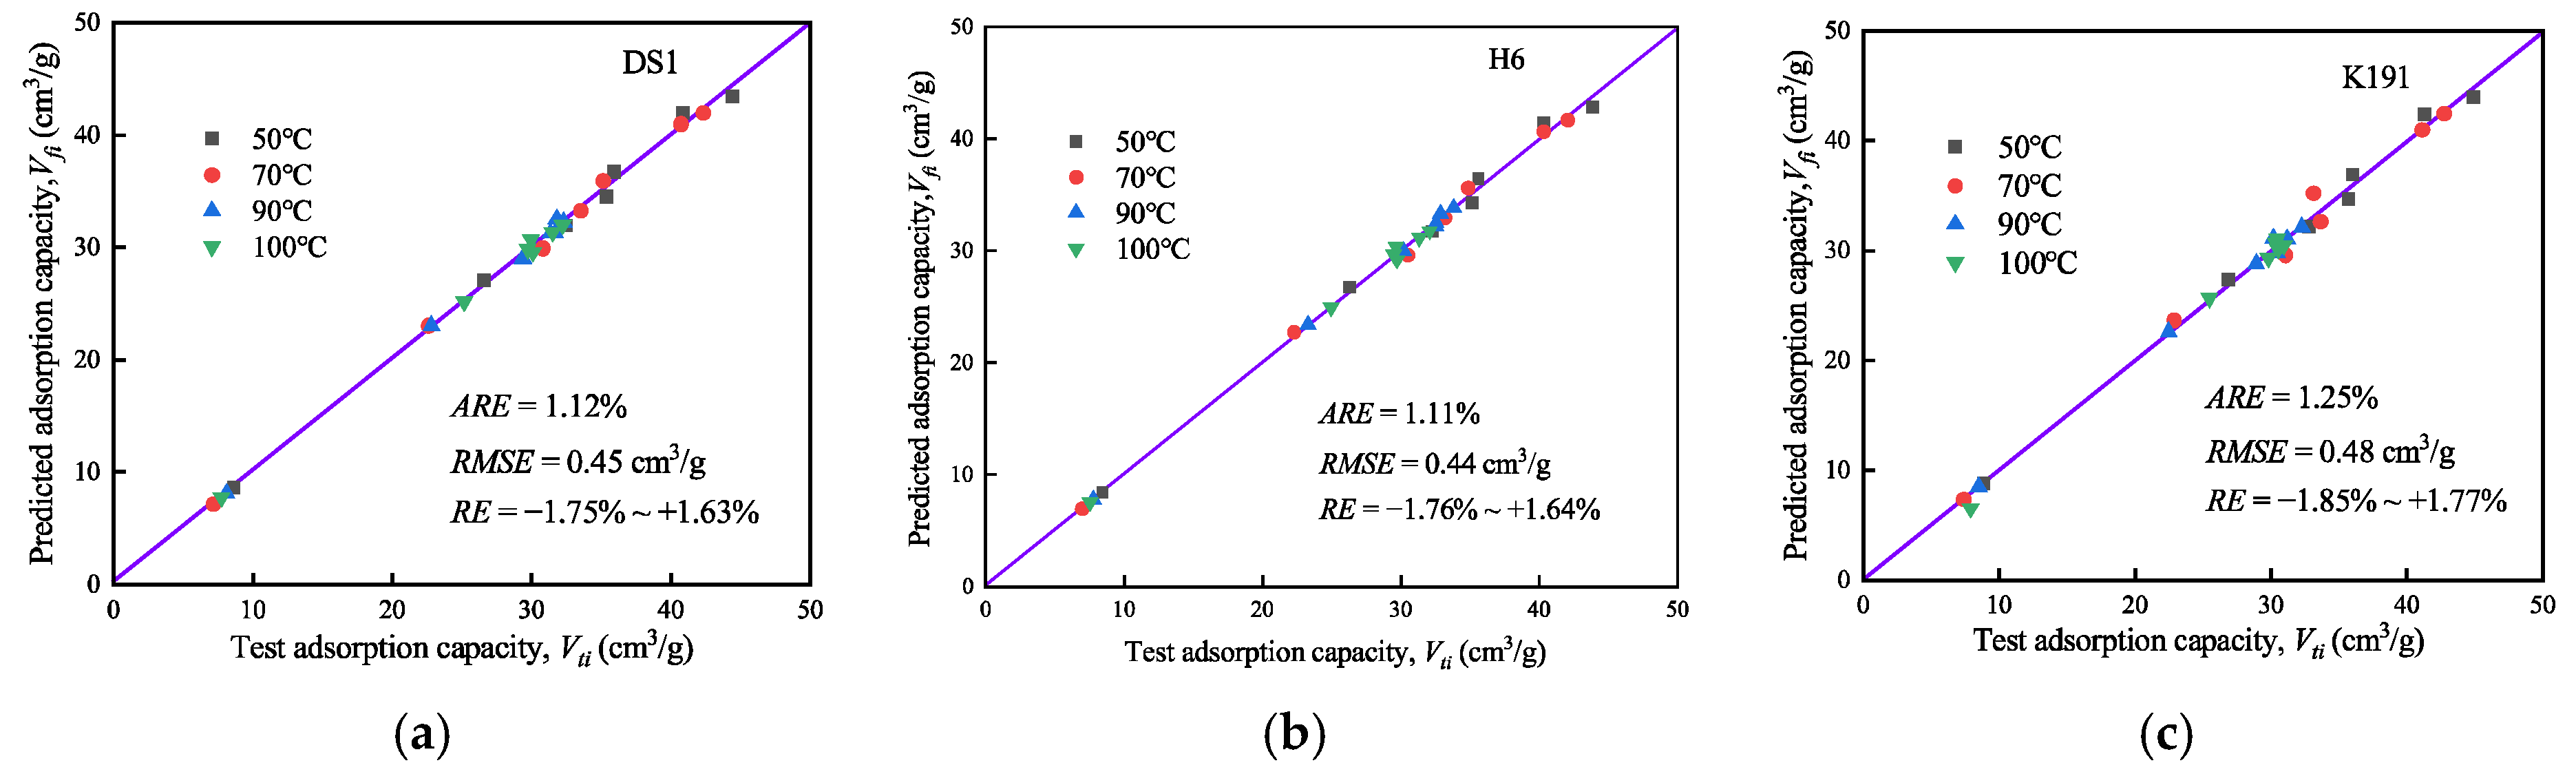
Based on the constructed supercritical methane adsorption model, the supercritical methane adsorption capacity under different temperature and pressure conditions was predicted (see Figure 10). To evaluate the model’s fitting accuracy, relative error (RE), average relative error (ARE), and root mean square error (RMSE) were introduced, with the calculation formulas as follows:
where N is the number of isothermal adsorption data points; and Vfi and Vti are the absolute adsorption amount and predicted adsorption amount under equilibrium pressure pi, respectively.
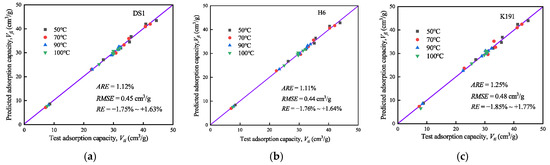
Figure 10.
Model prediction results and accuracy analysis: (a) DS1; (b) H6; and (c) K191.
The accuracy of the model prediction results indicates that the supercritical methane adsorption model provides highly reliable predictions, with an extremely low overall prediction deviation (1.11–1.25%) and exceptional precision. The average dispersion between predicted and actual values ranges from 0.44 cm3/g to 0.48 cm3/g, with minimal error fluctuations. The RE range shows no significant deviation. Overall, the model performs exceptionally well in predicting supercritical methane adsorption and is suitable for assessing and calculating deep CBM reserves. However, there are individual high-pressure points, and further research into micro-porous overpressure effect parameters could enhance the model’s overall prediction accuracy.
3.4. Supercritical Methane Adsorption Characteristics and Their Implications for Deep CBM Development
The high-temperature, high-pressure environment of deep coal seams causes methane (CH4) to exist in a supercritical state, whose adsorption behavior differs significantly from that of conventional reservoirs [22]. Supercritical methane, which has a density close to that of a liquid but diffusion properties similar to those of a gas, exhibits a synergistic effect between multilayer adsorption and capillary condensation in coal matrix micro-pores (<2 nm), resulting in a non-linear increase in adsorption capacity with increasing pressure. Studying the adsorption characteristics of supercritical methane can provide a theoretical basis for the economic development of deep CBM.
3.4.1. Pore Structure of Deep Coal Rock and Supercritical Methane Adsorption Behavior
The pore structure of deep coal is jointly controlled by geological stress and thermal maturity, as evidenced by the following characteristics: micro-porous dominance, with large pores (>100 nm) being compressed under high-temperature and high-pressure conditions, and an increased proportion of micro-pores (<2 nm). The specific surface area of the three coal samples from the Tuhai Basin ranges from 63.565 to 118.76 m2/g. Micro-porous organic matter serves as the primary adsorption site for supercritical methane, while pores larger than 2 nm primarily contribute to diffusion and flow pathways.
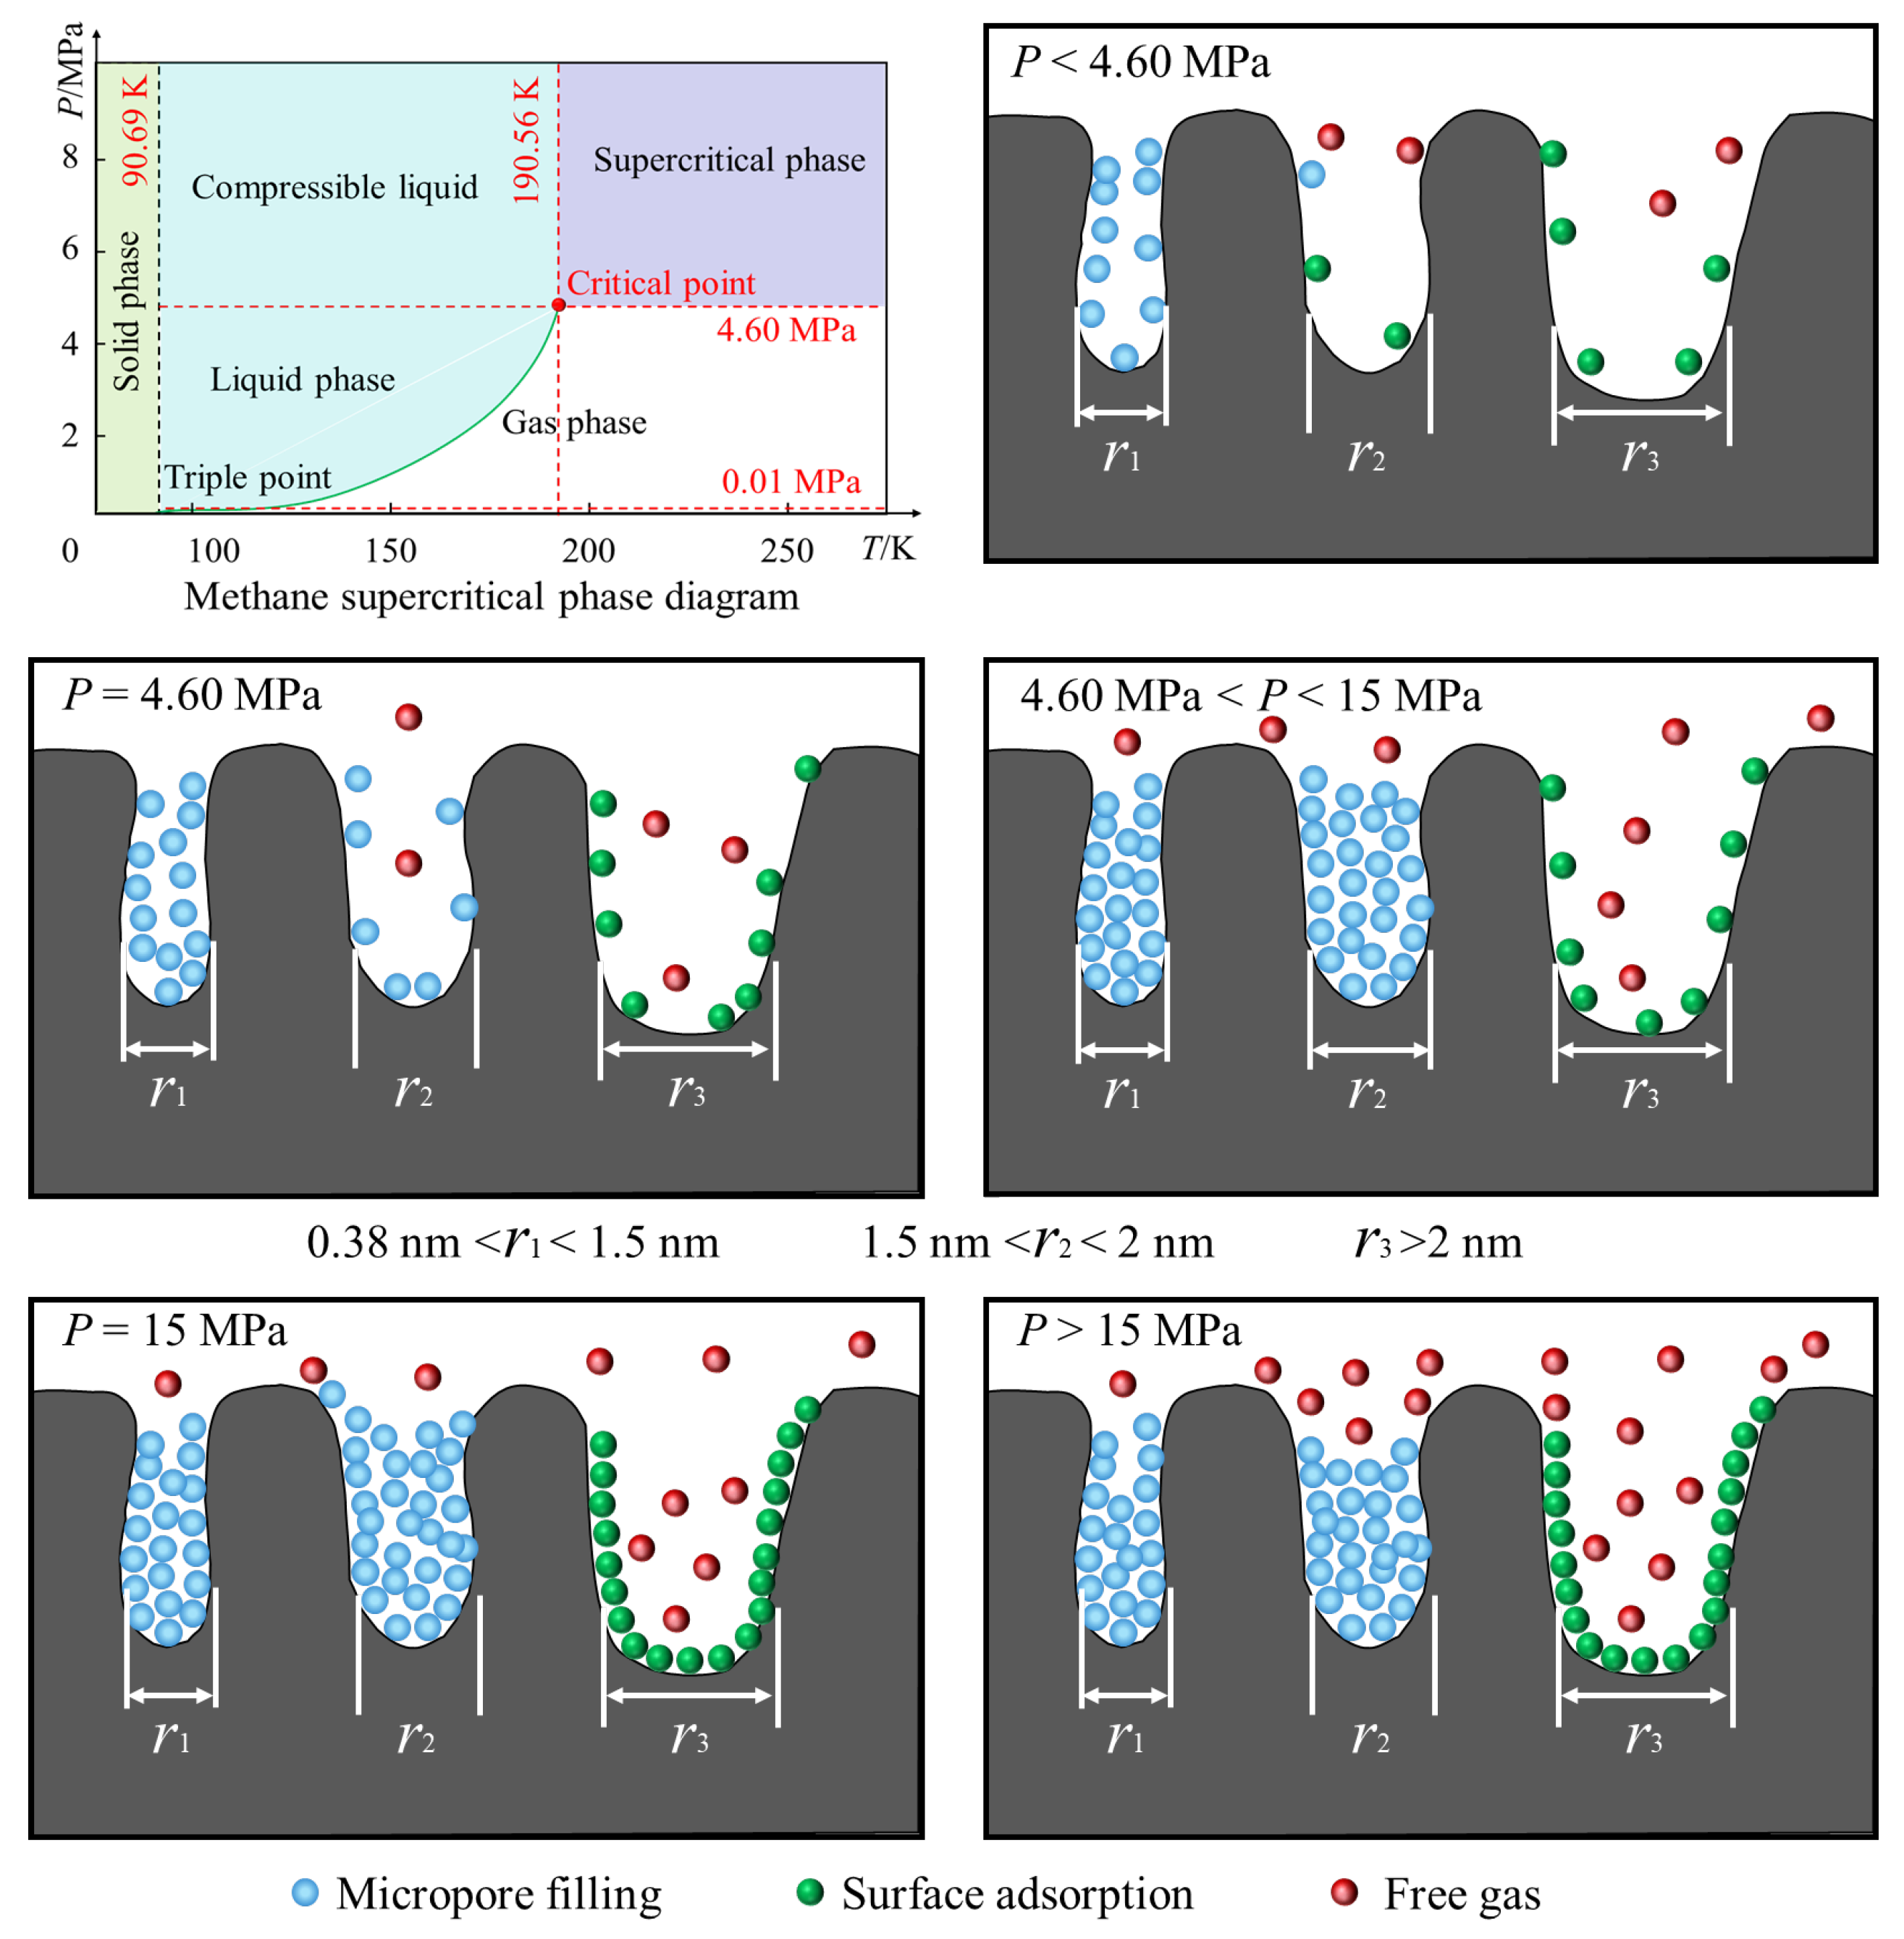
Overpressure phenomena frequently occur in the micro-porous structure of deep coal reservoirs, primarily due to the following reasons: capillary condensation effects, where strong van der Waals forces in the micro-porous structure cause gas molecules to condense even at pressures below the saturated vapor pressure, resulting in micro-porous pressures exceeding macroscopic pressures. In the Junggar Basin in the northern Xinjiang Uygur Autonomous Region, China, at depths ranging from 1360 to 3516 m, the reservoirs are also in a super-pressurized state [5]. Similarly, deep coal reservoirs (at depths greater than 1000 m) in the eastern part of the Ordos Basin are also super-pressurized [40,41]. The adsorption potential superposition is that the confined space within micro-porous structures causes gas molecules to be subjected to the superposition of adsorption potential from multiple points on the pore walls, further increasing local pressure. Under low-temperature, medium-pressure, and suitable pore size conditions, overpressure in micro-porous structures typically increases methane adsorption capacity; however, under extremely high-pressure conditions or in hydrophilic pore channels, it may have adverse effects. In addition, water significantly inhibits methane adsorption through competitive adsorption, pore plugging, and coal matrix expansion [18,42,43]. With the increase in temperature, the adsorption of water molecules increases, methane desorption accelerates, and methane adsorption decreases, especially in low-rank coal and low-pressure conditions [44,45]. However, the temperature of the selected coal seam in this study is mainly 90–100 °C, so dry coal samples are temporarily used for supercritical methane adsorption research. Based on the absolute methane adsorption capacity of coal samples at 100 °C, combined with the influence of pore size on methane adsorption, the pore structure characteristics of deep coal reservoirs in the Tuhai Basin and a schematic diagram of supercritical methane adsorption are presented (Figure 11).
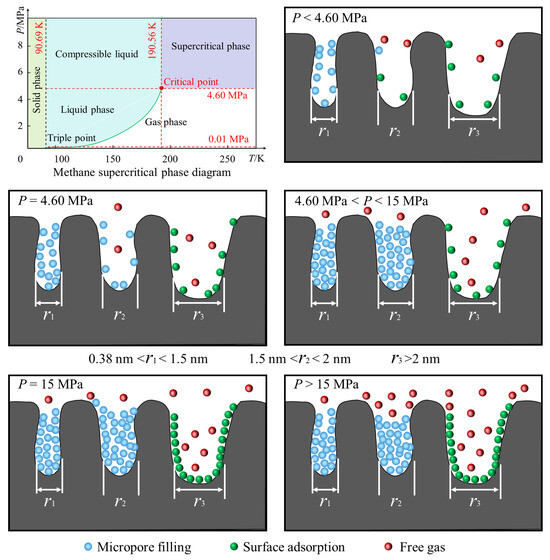
Figure 11.
Schematic diagram of the pore structure characteristics of deep coal reservoirs and supercritical methane adsorption.
Under normal reservoir fluid pressure conditions, methane in coal seams deeper than 500 m exists as a supercritical methane fluid [46]. The coalbeds studied in this paper have burial depths ranging from 2642.86 to 3879.4 m. There are no coal samples with burial depths exceeding 5000 m. However, for the Tuhai Basin, despite the limited number of samples, the reservoir burial depths are far greater than 500 m, aligning with the scope of research on deep supercritical methane fluids in the Tuhai Basin. Therefore, the pore structure of deep coalbed methane in the Tuhai Basin and the adsorption mechanism of supercritical methane can be analyzed based on the data shown in Figure 11. When the pressure p < 4.6 MPa, methane is in a self-adsorption state. As the pressure increases, methane adsorption in micro-porous pores gradually increases. Micro-porous pores with diameters of 0.38–1.5 nm undergo micro-porous filling, while pores with diameters of 1.5–2 nm contain both micro-porous filling and some free gas. Pores larger than 2 nm primarily exhibit surface adsorption and a small amount of free gas. When p = 4.6 MPa, methane is in a supercritical adsorption state, exhibiting both gaseous and liquid properties. Micro-porous filling further increases, with surface adsorption and free gas occupying a certain proportion. When 4.6 MPa < p < 15 MPa, supercritical methane in micro-pores (less than 2 nm) is primarily density gradient adsorption, forming a high-density adsorption phase in micro-pores (density can reach 80% of liquid methane). Intermolecular forces are enhanced, and under high pressure the van der Waals forces and electrostatic interactions between methane and the coal surface significantly increase, leading to a significant rise in adsorption capacity, while the proportion of free gas also remains relatively high. At p = 15 MPa, supercritical methane reaches its adsorption peak while free gas is present, and surface adsorption in macro-pores also reaches its peak. At p > 15 MPa, the amount of adsorbed gas in micro-pores decreases slightly, while surface adsorption in macro-pores still accounts for a high proportion, and the proportion of free gas increases slightly. However, the proportion of deep-seated free gas still requires further calculation.
3.4.2. Prediction and Application of Supercritical Methane Adsorption in Deep Coal Rock
Predicting and applying the adsorption capacity of methane in deep coal strata under supercritical conditions is a key scientific issue for the efficient development of CBM and gas control. As the depth of CBM extraction increases, the temperature and pressure of the strata rise, causing methane to enter a supercritical state, which significantly alters its physical properties (such as density and viscosity), thereby limiting the applicability of traditional adsorption models (such as the Langmuir equation). Prediction requires the integration of supercritical fluid adsorption theory, incorporating modified adsorption potential theory and varying adsorption-phase density to construct a supercritical methane adsorption prediction model. In deep coalbeds, methane primarily exists in adsorbed and free states, with the adsorbed state still accounting for a higher proportion. This adsorption model can predict deep methane adsorption quantities by calculating reservoir pressure and temperature based on the given coal seam burial depth and fitting parameters using isothermal adsorption experimental data. This provides strong support for calculating deep coalbed methane gas content (adsorbed gas + free gas).
In practical applications, the accurate prediction of adsorption quantities can optimize the assessment of recoverability in deep CBM reservoirs, guide the design of pressure-reduction extraction schemes, and improve recovery rates. In the field of coal mine safety, it can provide more accurate early warnings of methane outburst risks and improve the design of methane extraction systems. Future research should focus on the adsorption–desorption kinetic mechanisms under multi-field coupling conditions, develop cross-scale prediction models, and integrate real-time monitoring data to achieve dynamic corrections, thereby providing theoretical support for deep resource development.
Analysis of the limitations of research and model application: Since the coal samples used in this study were taken from depths of less than 3900 m and the numbers of samples were limited, there is a lack of methane adsorption test data for depths exceeding 4000 m. This results in insufficient validation of the model for predicting CBM in deep coal seams greater than 4000 m in depth. Additionally, no equilibrium water coal sample and methane desorption tests were conducted. At low temperatures and pressures there may be some discrepancy between the actual and predicted methane adsorption values. However, as shown in Figure 10, the model error analysis at different temperature points indicates that the supercritical methane adsorption prediction model, which considers temperature, pressure, and variable adsorption-phase density, has high accuracy. Therefore, this adsorption model can still be selected for predicting methane adsorption in deep CBM. It is worth noting that in the development of deep coalbed methane, supercritical CO2 modification and displacement for methane production enhancement is an important method. However, in this study, the impact of supercritical CO2 adsorption on CH4 desorption has not been sufficiently analyzed, weakening the model’s application in CCUS. This will be an important aspect for the team to continue in future research.
4. Conclusions
This study selected coal reservoir samples with burial depths ranging from 2642.86 to 3879.4 m. conducted SEM-EDS, LTCO2A, MIP, and HTHP-CH4A tests, analyzed the pore structure characteristics and supercritical methane adsorption properties of deep coal samples, and clarified the pore structure and supercritical methane adsorption behavior mechanism of deep coal layers. The following main conclusions were drawn:
- (1)
- The coal exhibits good pore structure integrity, with the following four types of pores developed in the coal: beaded nanopores, gas pores, cell cavities, and friction pores. The sample contains sulfides (such as pyrite) and clay minerals (such as kaolinite), as well as quartz filling the pores and fractures. The deep coal rock exhibits well-developed micro-porosity, but the porosity connectivity is generally poor, with most pores being narrow-necked or semi-closed, and it contains a certain proportion of open pores.
- (2)
- The fractal dimension Dm of the pore structure of micro-porous coal samples ranges from 2.0447 to 2.2439. The micro-porous pores have high roughness and a high specific surface area, providing excellent sites for methane adsorption. For pores larger than 100 nm, the fractal values range from 2.6459 to 2.8833. The pore surfaces in deep coal layers approach a three-dimensional pore space, with relatively rough surfaces, indicating that the gas diffusion-seepage pore space is relatively complex.
- (3)
- The supercritical methane adsorption characteristics of coal samples from the Tuhai Basin can be categorized into the following two types: low-pressure zones (<15 MPa) and high-pressure zones (>15 MPa). In low-pressure zones, the adsorption potential is relatively high (>700 J/mol), and the adsorption capacity is strong. For the high-pressure zone (>15 MPa), however, the actual adsorption amount may be dominated by external adsorption forces, pore compression effects, or micro-porous filling, and overpressure phenomena suppress the methane adsorption capacity; understanding the pore–adsorption coupling mechanism is beneficial for targeted deep coalbeds to enhance the permeability and storage capacity.
- (4)
- The adsorption model has extremely low deviation (1.11–1.25%) and high accuracy. The average deviation between predicted and actual values ranges from 0.44 cm3/g to 0.48 cm3/g, with minimal error fluctuations, and the range of RE shows no significant deviation. This paper analyzes the key scientific issues in deep CBM development (burial depth less than 3900 m) from the perspectives of temperature–pressure coupled adsorption characteristics and adsorption capacity prediction models, thereby advancing the efficient development of deep unconventional natural gas.
Author Contributions
X.C., writing—original draft; C.W., writing—review and editing; H.Z., methodology, writing—review and editing, and funding acquisition; S.L., supervision, methodology, and writing—review and editing; X.W., methodology; H.L., methodology, software, and resources; Z.Y., methodology and software; K.W., software and resources; F.H., methodology and software; Z.C., methodology. All authors have read and agreed to the published version of the manuscript.
Funding
The research was funded by the China Petroleum Youth Science and Technology Project (No. 2024DQ03025), the Key R & D projects in Xinjiang Uygur Autonomous Region (2024B03002), the China Petroleum and Natural Gas Co., Ltd. Research Applied Science and Technology Special Project (2023ZZ18YJ03), and the National Science and Technology Major Project of New Oil and Gas Exploration and Development (2024ZD1406000).
Data Availability Statement
All data used during this research are available from the corresponding author by reasonable request.
Conflicts of Interest
Authors Xuan Chen, Chao Wu, Hua Zhang, Xinggang Wang, Hongwei Li, Zongsen Yao and Kaisaer Wureyimu were employed by Research Institute of Exploration & Development, PetroChina Tuha Oilfield Company. The remaining authors declare that the research was conducted in the absence of any commercial or financial relationships that could be construed as a potential conflict of interest.
References
- Xie, H.; Sang, S.; Li, X.; Yan, Z.; Zhou, X.; Liu, S.; Han, S.; Cai, J. Competitive adsorption-penetration characteristics of multi-component gases in micro-nano pore of coal. Chem. Eng. J. 2025, 506, 159965. [Google Scholar] [CrossRef]
- Xu, F.; Hou, W.; Xiong, X.; Xu, B.; Wu, P.; Wang, H.; Feng, K.; Yun, J.; Li, S.; Zhang, L.; et al. The status and development strategy of coalbed methane industry in China. Petrol Explor. Dev. 2023, 50, 765–783. [Google Scholar] [CrossRef]
- Zhao, J.; Wang, L.; Wei, B.; Kadet, V. CO2 Utilization and Geological Storage in Unconventional Reservoirs After Fracturing. Engineering 2025, 48, 92–106. [Google Scholar] [CrossRef]
- Wang, T.; Deng, Z.; Hu, H.; Ding, R.; Tian, F.; Zhang, T.; Ma, Z.; Wang, D. Pore structure of deep coal of different ranks and its effect on coalbed methane adsorption. Int. J. Hydrog. Energy 2024, 59, 144–158. [Google Scholar] [CrossRef]
- Li, G.; Yan, D.; Zhuang, X.; Zhang, Z.; Fu, H. Implications of the pore pressure and in situ stress for the coalbed methane exploration in the southern Junggar Basin, China. Eng. Geol. 2019, 262, 105305. [Google Scholar] [CrossRef]
- Chang, Y.; Yao, Y.; Wang, L.; Zhang, K. High-Pressure adsorption of supercritical methane and carbon dioxide on Coal: Analysis of adsorbed phase density. Chem. Eng. J. 2024, 487, 150483. [Google Scholar] [CrossRef]
- Zhang, Z.; Liu, G.; Wang, X.; Lv, R.; Liu, H.; Lin, J.; Barakos, G.; Chang, P. A fractal Langmuir adsorption equation on coal: Principle, methodology and implication. Chem. Eng. J. 2024, 488, 150869. [Google Scholar] [CrossRef]
- Babatunde, K.A.; Negash, B.M.; Jufar, S.R.; Ahmed, T.Y.; Mojid, M.R. Adsorption of gases on heterogeneous shale surfaces: A review. J. Pet. Sci. Eng. 2022, 208, 109466. [Google Scholar] [CrossRef]
- Xu, A.; Han, S.; Wei, Y.; Zhou, P.; Zhang, J.; Guo, Z. Methane Adsorption During Pore Evolution and Its Microscale Impact on Coalbed Methane Recovery: A Case Study of Middle- and High-Rank Coals in the Western Guizhou. ACS Omega 2025, 10, 14439–14451. [Google Scholar] [CrossRef]
- Alafnan, S.; Awotunde, A.; Glatz, G.; Adjei, S.; Alrumaih, I.; Gowida, A. Langmuir adsorption isotherm in unconventional resources: Applicability and limitations. J. Pet. Sci. Eng. 2021, 207, 109172. [Google Scholar] [CrossRef]
- Tang, C.; Li, B.; Li, J.; Gao, Z.; Song, H.; Yang, J. A model characterising the fractal supercritical adsorption behaviour of methane in shale: Incorporating principles, methods, and applications. Chem. Eng. J. 2024, 500, 156812. [Google Scholar] [CrossRef]
- Zhao, F.; Han, S.; Sang, S.; Zhou, P.; Mondal, D.; Guo, Z.; Xu, A. Modified Method for Calculating Saturation Gas Content in Deep Coal and the Pore Size Effect of Methane Adsorption on Guizhou Middle- and High-Rank Coals. Nat. Resour. Res. 2023, 32, 1215–1233. [Google Scholar] [CrossRef]
- Feng, P.; Li, S.; Tang, S.; Tang, D.; Zhang, C.; Yang, J.; Liu, N.; Zhong, G. Estimation of Adsorption Isotherm for Deep Coalbed Methane: A Monolayer-Filling Model Based on Pore Fractal Dimension. Energy Fuel 2024, 38, 1987–2000. [Google Scholar] [CrossRef]
- Guo, F.; Liu, G.; Zhang, Z.; Lv, R.; Xian, B.; Lin, J.; Barakos, G.; Chang, P. A Fractal Adsorption Model on Methane in Coal with Temperature Effect Dependence. Fractal Fract. 2024, 8, 370. [Google Scholar] [CrossRef]
- Liu, H.; Liu, J.; Gao, D.; Fan, Z.; Xu, H.; Ding, H.; Fang, H.; Zhang, K. New insight into CH4 adsorption mechanism in coal based on modeling analysis of different adsorption theories. J. Environ. Chem. Eng. 2024, 12, 113174. [Google Scholar] [CrossRef]
- Wang, X.; Cheng, Y.; Zhang, D.; Yang, H.; Zhou, X.; Jiang, Z. Experimental study on methane adsorption and time-dependent dynamic diffusion coefficient of intact and tectonic coals: Implications for CO2-enhanced coalbed methane projects. Process Saf. Environ. 2021, 156, 568–580. [Google Scholar] [CrossRef]
- Niu, Q.; Pan, J.; Cao, L.; Ji, Z.; Wang, H.; Wang, K.; Wang, Z. The evolution and formation mechanisms of closed pores in coal. Fuel 2017, 200, 555–563. [Google Scholar] [CrossRef]
- Fu, C.; Kou, X.; Du, Y.; Jiang, L.; Sang, S.; Pan, Z. Experimental study of supercritical CO2-H2O-coal interactions and the effect on coal spontaneous imbibition characteristics. Fuel 2025, 383, 133888. [Google Scholar] [CrossRef]
- He, Y.; Li, X.; Xie, H.; Li, X.; Xia, T.; Chen, S. Dynamics change of coal methane adsorption/desorption and permeability under temperature and stress conditions. Phys. Fluids 2025, 37, 016605. [Google Scholar] [CrossRef]
- Liu, D.; Yao, Y.; Chang, Y. Measurement of adsorption phase densities with respect to different pressure: Potential application for determination of free and adsorbed methane in coalbed methane reservoir. Chem. Eng. J. 2022, 446, 137103. [Google Scholar] [CrossRef]
- Xie, H.; Li, X.; Xue, F.; Sui, H.; Zhao, J.; Cai, J.; Feng, C. Influences of Evolution of Pore Structures in Tectonic Coal under Acidization on Methane Desorption. Acs Omega 2023, 8, 34059–34076. [Google Scholar] [CrossRef] [PubMed]
- Han, S.; Sang, S.; Duan, P.; Zhang, J.; Xiang, W.; Xu, A. The effect of the density difference between supercritical CO2 and supercritical CH4 on their adsorption capacities: An experimental study on anthracite in the Qinshui Basin. Petrol Sci. 2022, 19, 1516–1526. [Google Scholar] [CrossRef]
- Liu, S.; Li, X.; Cai, J.; Xie, H.; Chen, S. Investigation of the impact of micro-nano pore geometry on CH4 adsorption. Chem. Eng. J. 2024, 500, 157162. [Google Scholar] [CrossRef]
- Zhao, J.; Tian, S.; Jiang, Z.; Ma, T.; Ran, Q. Effect of silica nanofluid on coal wettability and its stability characterization. Phys. Fluids 2025, 37, 022015. [Google Scholar] [CrossRef]
- Zhao, J.; Tian, S.; Chen, C.; Zhang, X.; Ma, T.; Ran, Q.; Luo, X. Research on the performance and application of nano-MgO modified ultrafine cement-based sealing materials. Case Stud. Constr. Mat. 2025, 22, e04694. [Google Scholar] [CrossRef]
- Li, H.; Kang, J.; Zhou, F.; Qiang, Z.; Li, G. Adsorption heat features of coalbed methane based on microcalorimeter. J. Loss Prev. Proc. 2018, 55, 437–449. [Google Scholar] [CrossRef]
- Chen, S.; Tang, D.; Tao, S.; Ji, X.; Xu, H. Fractal analysis of the dynamic variation in pore-fracture systems under the action of stress using a low-field NMR relaxation method: An experimental study of coals from western Guizhou in China. J. Pet. Sci. Eng. 2019, 173, 617–629. [Google Scholar] [CrossRef]
- Cui, J.; Niu, X.; Feng, G.; Han, Y.; Li, Z. Effect of Division Methods of the Adsorption Isotherm on the Fractal Dimension of Clay Minerals Calculated Based on the Frenkel-Halsey-Hill Model. Energy Fuel 2021, 35, 8786–8798. [Google Scholar] [CrossRef]
- Sun, F.; Liu, D.; Cai, Y.; Qiu, Y. Surface jump mechanism of gas molecules in strong adsorption field of coalbed methane reservoirs. Appl. Energy 2023, 349, 121605. [Google Scholar] [CrossRef]
- Sun, F.; Liu, D.; Cai, Y.; Qiu, Y. Coal rank-pressure coupling control mechanism on gas adsorption/desorption in coalbed methane reservoirs. Energy 2023, 270, 126849. [Google Scholar] [CrossRef]
- Roslin, A.; Pokrajac, D.; Wu, K.; Zhou, Y. 3D pore system reconstruction using nano-scale 2D SEM images and pore size distribution analysis for intermediate rank coal matrix. Fuel 2020, 275, 117934. [Google Scholar] [CrossRef]
- Fu, C.; Du, Y.; Song, W.; Sang, S.; Pan, Z.; Wang, N. Application of automated mineralogy in petroleum geology and development and CO2 sequestration: A review. Mar. Pet. Geol. 2023, 151, 106206. [Google Scholar] [CrossRef]
- Xie, H.; Li, X.; Sui, H.; Cai, J.; Xu, E.; Zhao, J. Acidification-Induced Micronano Mechanical Properties and Microscopic Permeability Enhancement Mechanism of Coal. Langmuir 2024, 40, 4496–4513. [Google Scholar] [CrossRef] [PubMed]
- Yao, Y.; Liu, D.; Tang, D.; Tang, S.; Huang, W. Fractal characterization of adsorption-pores of coals from North China: An investigation on CH4 adsorption capacity of coals. Int. J. Coal Geol. 2008, 73, 27–42. [Google Scholar] [CrossRef]
- Wang, F.; Li, S. Determination of the Surface Fractal Dimension for Porous Media by Capillary Condensation. Ind. Eng. Chem. Res. 1997, 36, 1598–1602. [Google Scholar] [CrossRef]
- Zhang, B.; Li, S. Determination of the Surface Fractal Dimension for Porous Media by Mercury Porosimetry. Ind. Eng. Chem. Res. 1995, 34, 1383–1386. [Google Scholar] [CrossRef]
- Ozawa, S.; Kusumi, S.; Ogino, Y. Physical adsorption of gases at high pressure. IV. An improvement of the Dubinin—Astakhov adsorption equation. J. Colloid Interf. Sci. 1976, 56, 83–91. [Google Scholar] [CrossRef]
- Zhang, Q.; Tang, S.; Zhang, S.; Xi, Z.; Xin, D.; Jia, T.; Yang, X.; Zhang, K.; Li, J.; Wang, Z. Methane Adsorption Capacity of Deep Buried Coal Seam Based on Full-Scale Pore Structure. Nat. Resour. Res. 2025, 34, 1481–1505. [Google Scholar] [CrossRef]
- Zhou, L.; Yan, X.; Xiong, X.; Wang, F.; Liu, W.; Yang, Y.; Yang, Z.; Feng, Y. Characteristics of occurrence and distribution rule of deep coalbed methane in supercritical state. Coal Sci. Technol. 2025, 53, 73–90. [Google Scholar]
- Wang, X.; Hou, S.; Wang, X.; Yuan, Y.; Dang, Z.; Tu, M. Geological and hydrological controls on the pressure regime of coalbed methane reservoir in the Yanchuannan field: Implications for deep coalbed methane exploitation in the eastern Ordos Basin, China. Int. J. Coal Geol. 2024, 294, 104619. [Google Scholar] [CrossRef]
- Li, S.; Tang, D.; Pan, Z.; Xu, H.; Tao, S.; Liu, Y.; Ren, P. Geological conditions of deep coalbed methane in the eastern margin of the Ordos Basin, China: Implications for coalbed methane development. J. Nat. Gas. Sci. Eng. 2018, 53, 394–402. [Google Scholar] [CrossRef]
- Yang, J.; Li, B.; Li, J.; Song, H.; Duan, S.; Jia, L. Theoretical Study of Shale Gas Adsorption under the Action of Moisture and Temperature, Including Analysis of the Relevant Adsorption Mechanisms and Thermodynamics. Ind. Eng. Chem. Res. 2024, 63, 17–635. [Google Scholar] [CrossRef]
- Zhang, K.; Cheng, Y.; Wang, L.; Dong, J.; Hao, C.; Jiang, J. Pore morphology characterization and its effect on methane desorption in water-containing coal: An exploratory study on the mechanism of gas migration in water-injected coal seam. J. Nat. Gas. Sci. Eng. 2020, 75, 103152. [Google Scholar] [CrossRef]
- Zhao, J.; Lin, B.; Liu, T.; Liu, T.; Ma, S.; Tian, S. Mechanism of water adsorption and penetration at the coal interface under methane pressure and temperature. Phys. Fluids 2025, 37, 062018. [Google Scholar] [CrossRef]
- Cheng, M.; Fu, X.; Kang, J.; Chen, Z.; Tian, Z. Effect of water on methane diffusion in coal under temperature and pressure: A LF-NMR experimental study on successive depressurization desorption. Fuel 2022, 324, 124578. [Google Scholar] [CrossRef]
- Li, C.; Yang, Z.; Yan, X.; Zhou, G.; Wang, G.; Gao, W.; Liu, C.; Lu, B.; Liang, Y. Distribution Law of Occurrence State and Content Prediction of Deep CBM: A Case Study in the Ordos Basin, China. Nat. Resour. Res. 2024, 33, 1843–1869. [Google Scholar] [CrossRef]
Disclaimer/Publisher’s Note: The statements, opinions and data contained in all publications are solely those of the individual author(s) and contributor(s) and not of MDPI and/or the editor(s). MDPI and/or the editor(s) disclaim responsibility for any injury to people or property resulting from any ideas, methods, instructions or products referred to in the content. |
© 2025 by the authors. Licensee MDPI, Basel, Switzerland. This article is an open access article distributed under the terms and conditions of the Creative Commons Attribution (CC BY) license (https://creativecommons.org/licenses/by/4.0/).