Abstract
Wellbore strengthening is a widely applied technique to mitigate wellbore leakage during drilling operations in complex formations characterized by narrow mud weight windows. This method enhances the wellbore’s pressure-bearing capacity by using lost circulation materials (LCMs) to bridge natural or induced fractures. In recent years, advanced sealing technologies such as wellbore reinforcement have gradually been applied and developed, but their related influencing factors and mechanisms have not been deeply revealed. This article uses the Cohesive module of ABAQUS to establish a wellbore fracture sealing model. By establishing a porous elastic finite element model, the elastic mechanics theory of porous media is combined with finite element theory. Under the influence of factors such as anisotropy of geostress, reservoir elastic modulus, Poisson’s ratio, and fracturing fluid viscosity, the circumferential stress distribution of the wellbore after fracture sealing is simulated. The simulation results show that stress anisotropy has a significant impact on Mises stress. The greater the stress anisotropy, the more likely the wellbore sealing is to cause wellbore rupture or instability. Therefore, it is necessary to choose a suitable wellbore direction to avoid high stress concentration areas. The elastic modulus of the reservoir is an important parameter that affects wellbore stability and fracturing response, especially in high modulus reservoirs where the effect is more pronounced. Poisson’s ratio has a relatively minor impact. In fracturing and plugging design, the viscosity of fracturing fluid should be reasonably selected to balance the relationship between plugging efficiency and wellbore mechanical stability. In the actual drilling process, priority should be given to choosing the wellbore direction that avoids high stress concentration areas to reduce the risk of wellbore rupture or instability induced by plugging, specify targeted wellbore reinforcement strategies for high elastic modulus reservoirs; using models to predict fracture response characteristics can guide the use of sealing materials, achieve efficient bridging and stable sealing, and enhance the maximum pressure bearing capacity of the wellbore. By simulating the changes in circumferential stress distribution of the wellbore after fracture sealing, the mechanism of wellbore reinforcement was explored to provide guidance for mechanism analysis and on-site application.
1. Introduction
In recent years, China’s swift economic growth has led to a steadily rising demand for oil and gas resources [1]. The domestic oil and gas resources and production capacity are no longer sufficient to meet the needs of daily life. By 2023, China’s dependence on foreign crude oil and natural gas will exceed 70% and 40%, respectively, and the tight supply situation will become increasingly prominent, posing a bottleneck constraint on the sustained and healthy development of the national economy [2,3]. To support the country’s economic growth, future oil and gas exploration and development will concentrate on two key areas: conventional oil and gas resources, and emerging types of oil and gas resources. Due to the increasing degree of exploration and development, the scope of development is also becoming wider, and the requirements for drilling are also becoming higher [4,5]. As a global drilling engineering technical problem, well leakage not only delays production time, causes loss of working fluid, pollutes oil and gas reservoirs, but also triggers drilling accidents such as stuck drill, well collapse, blowout, and even serious economic losses such as wellbore scrapping [6]. Consequently, the global petroleum industry has increasingly focused on researching how to employ effective drilling fluid technologies to enhance formation pressure resistance, expand the safe density range of drilling fluids, and address on-site fluid leakage issues [7,8]. According to reports, over 12% of NPT is caused by well leakage during drilling n the Gulf of Mexico shelf [9]. The impact of wellbore leakage on drilling operations is enormous, with an estimated annual loss of USD 2 billion to USD 4 billion in time, drilling fluids, and materials used to contain losses [10]. About 40% of the wells in North America experience well leakage during the drilling process of carbonate oil and gas reservoirs and shale oil and gas. In the drilling process of the China National Petroleum Corporation, the loss caused by well leakage accounts for over 70% [11,12]. In addition, Chen et al. [13] studied the evolution of mechanical properties and acoustic emission damage characteristics of coal rock bonding under hydrochemical corrosion. The research results indicate that as the acidity of the solution increases, the accumulated energy and AE count of the sample decrease to varying degrees. Compared with the combined coal rock section, water rock interaction has a more severe impact on the damage of sandstone sections.
Among various methods, wellbore strengthening and sealing technology has increasingly emerged as a key approach to enhancing the pressure-bearing capacity of formations. Its main purpose is to increase the fracture pressure of formations that are prone to leakage, in order to solve the problem of drilling fluid leakage under narrow safety density window conditions. This method enhances the fracture gradient or the maximum pressure the wellbore can endure by using sealing or bridging materials to close fractures and prevent fluid loss. At present, the main types of wellbore reinforcement methods include the following: circumferential stress enhancement, such as stress cage (a method of increasing formation fracture pressure or fracture reopening pressure by changing the stress state near the wellbore wall); fracture closure stress; and the enhancement of fracture resistance and tip screening, also known as fracture propagation resistance [14,15,16,17,18,19]. Despite some reported successes, wellbore strengthening operations are still largely performed through trial and error, due to a limited understanding of the fundamental mechanisms involved. The impact of several parameters is still not fully understood, and a comprehensive parameter study is needed for wellbore reinforcement to understand process mechanics and optimize on-site operations.
This article chooses the Cohesive module of ABAQUS 2021to establish a cohesive force model, sets the material properties of the model, and applies a certain load module to simulate the stress state of porous elastic media wellbore and fractures before and after sealing. Assuming that there are pre-existing fractures on the wellbore, whose surface is parallel to the direction of the maximum horizontal principal stress or the X-axis, a porous elastic finite element model was established to combine the theory of porous media elasticity with finite element theory. Under the influence of factors such as anisotropy of geostress, reservoir elastic modulus, Poisson’s ratio, and fracturing fluid viscosity, the circumferential stress distribution changes in the wellbore after fracture sealing were simulated, and the mechanism of wellbore reinforcement was explored to provide guidance for mechanism analysis and field application.
2. Mathematical Models
2.1. Cohesive Zone Model
The goal of this article is to develop a pore elasticity model that considers fluid flow inside rocks and studies the circumferential stress and fracture geometry before and after wellbore plugging. Dugdale [20] introduced the theory and application of the Cohesive Zone Model (CZM) in early research and established the concepts of debonding and damage zones. This model has since been applied to many engineering fracture mechanics problems. The softening traction-separation law describes the physical mechanism of material degradation at the interface, and the separation behavior of these materials is described in the constitutive equation, which relates the surface traction force of the fracture to the material separation on the fracture, as shown in Figure 1.
Compared with classic fracture mechanics, this model can avoid singularity at the fracture tip [21,22]. Compared with the previous classic fracture mechanics relationships, this advantage enables the cohesive model to better solve complex nonlinear fracture and convergence problems. In summary, this study chose the Cohesive module of ABAQUS to establish a cohesive force model, set the material properties of the model, and apply a certain load module to simulate the stress state of the porous elastic medium wellbore and fractures before and after sealing.
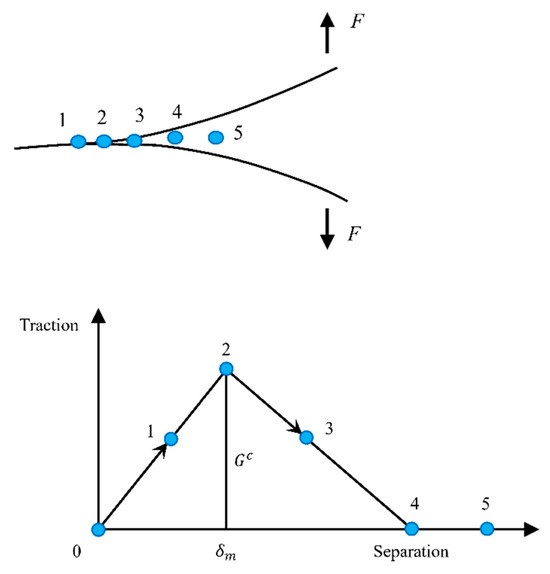
Figure 1.
Traction separation law in CZM [23].
Figure 1.
Traction separation law in CZM [23].

2.2. Principle of Virtual Work
To proceed with the finite element analysis of the cohesive force model, it is essential to clarify the virtual work principle applied to the cohesive zone. There is a pair of virtual fracture surfaces in the potential fracture path. These fracture surfaces receive separation forces, known as cohesive traction forces. These traction forces target both internal and external fracture surfaces simultaneously. The mechanical equilibrium equation takes into account the contribution of cohesive forces as follows [22]:
Among them, is the nominal stress tensor; is the deformation gradient; , and represent the volume, inner surface (i.e., cohesive surface), and outer surface of the model, respectively; represents the cohesive traction vector; represents the external traction vector; represents displacement vector; represents a displacement jump across two adjacent cohesive surfaces.
As indicated by the volume integral on the left-hand side of Equation (4), the total deformation force acting on the fracture surface is balanced by the traction integral over the inner surface of the cohesive zone (i.e., the region ahead of the fracture and its tip) as well as the traction on the outer surface of the cohesive zone. The cohesive forces under normal and shear forces can be derived as follows:
Among them, defines the maximum normal traction force that can be achieved under pure normal load; is the material separation amount with the maximum cohesive strength under normal load; and , respectively, define the cohesive forces in the normal and shear directions; defines the internal potential ratio. The above equation describes that as the normal spacing increases, it will increase the normal traction force until the spacing reaches .
This also implies that under cyclic loading, cohesive regions may experience endless cycles without exhibiting degradation. To allow for the degradation of the viscous zone, fracture mechanics provides a damage coefficient (D). This factor can be introduced through the law of traction separation, as follows:
Among them, and , respectively, represent the normal direction and two shear directions; and , respectively, represent the tensile strength and shear strength in the corresponding direction.
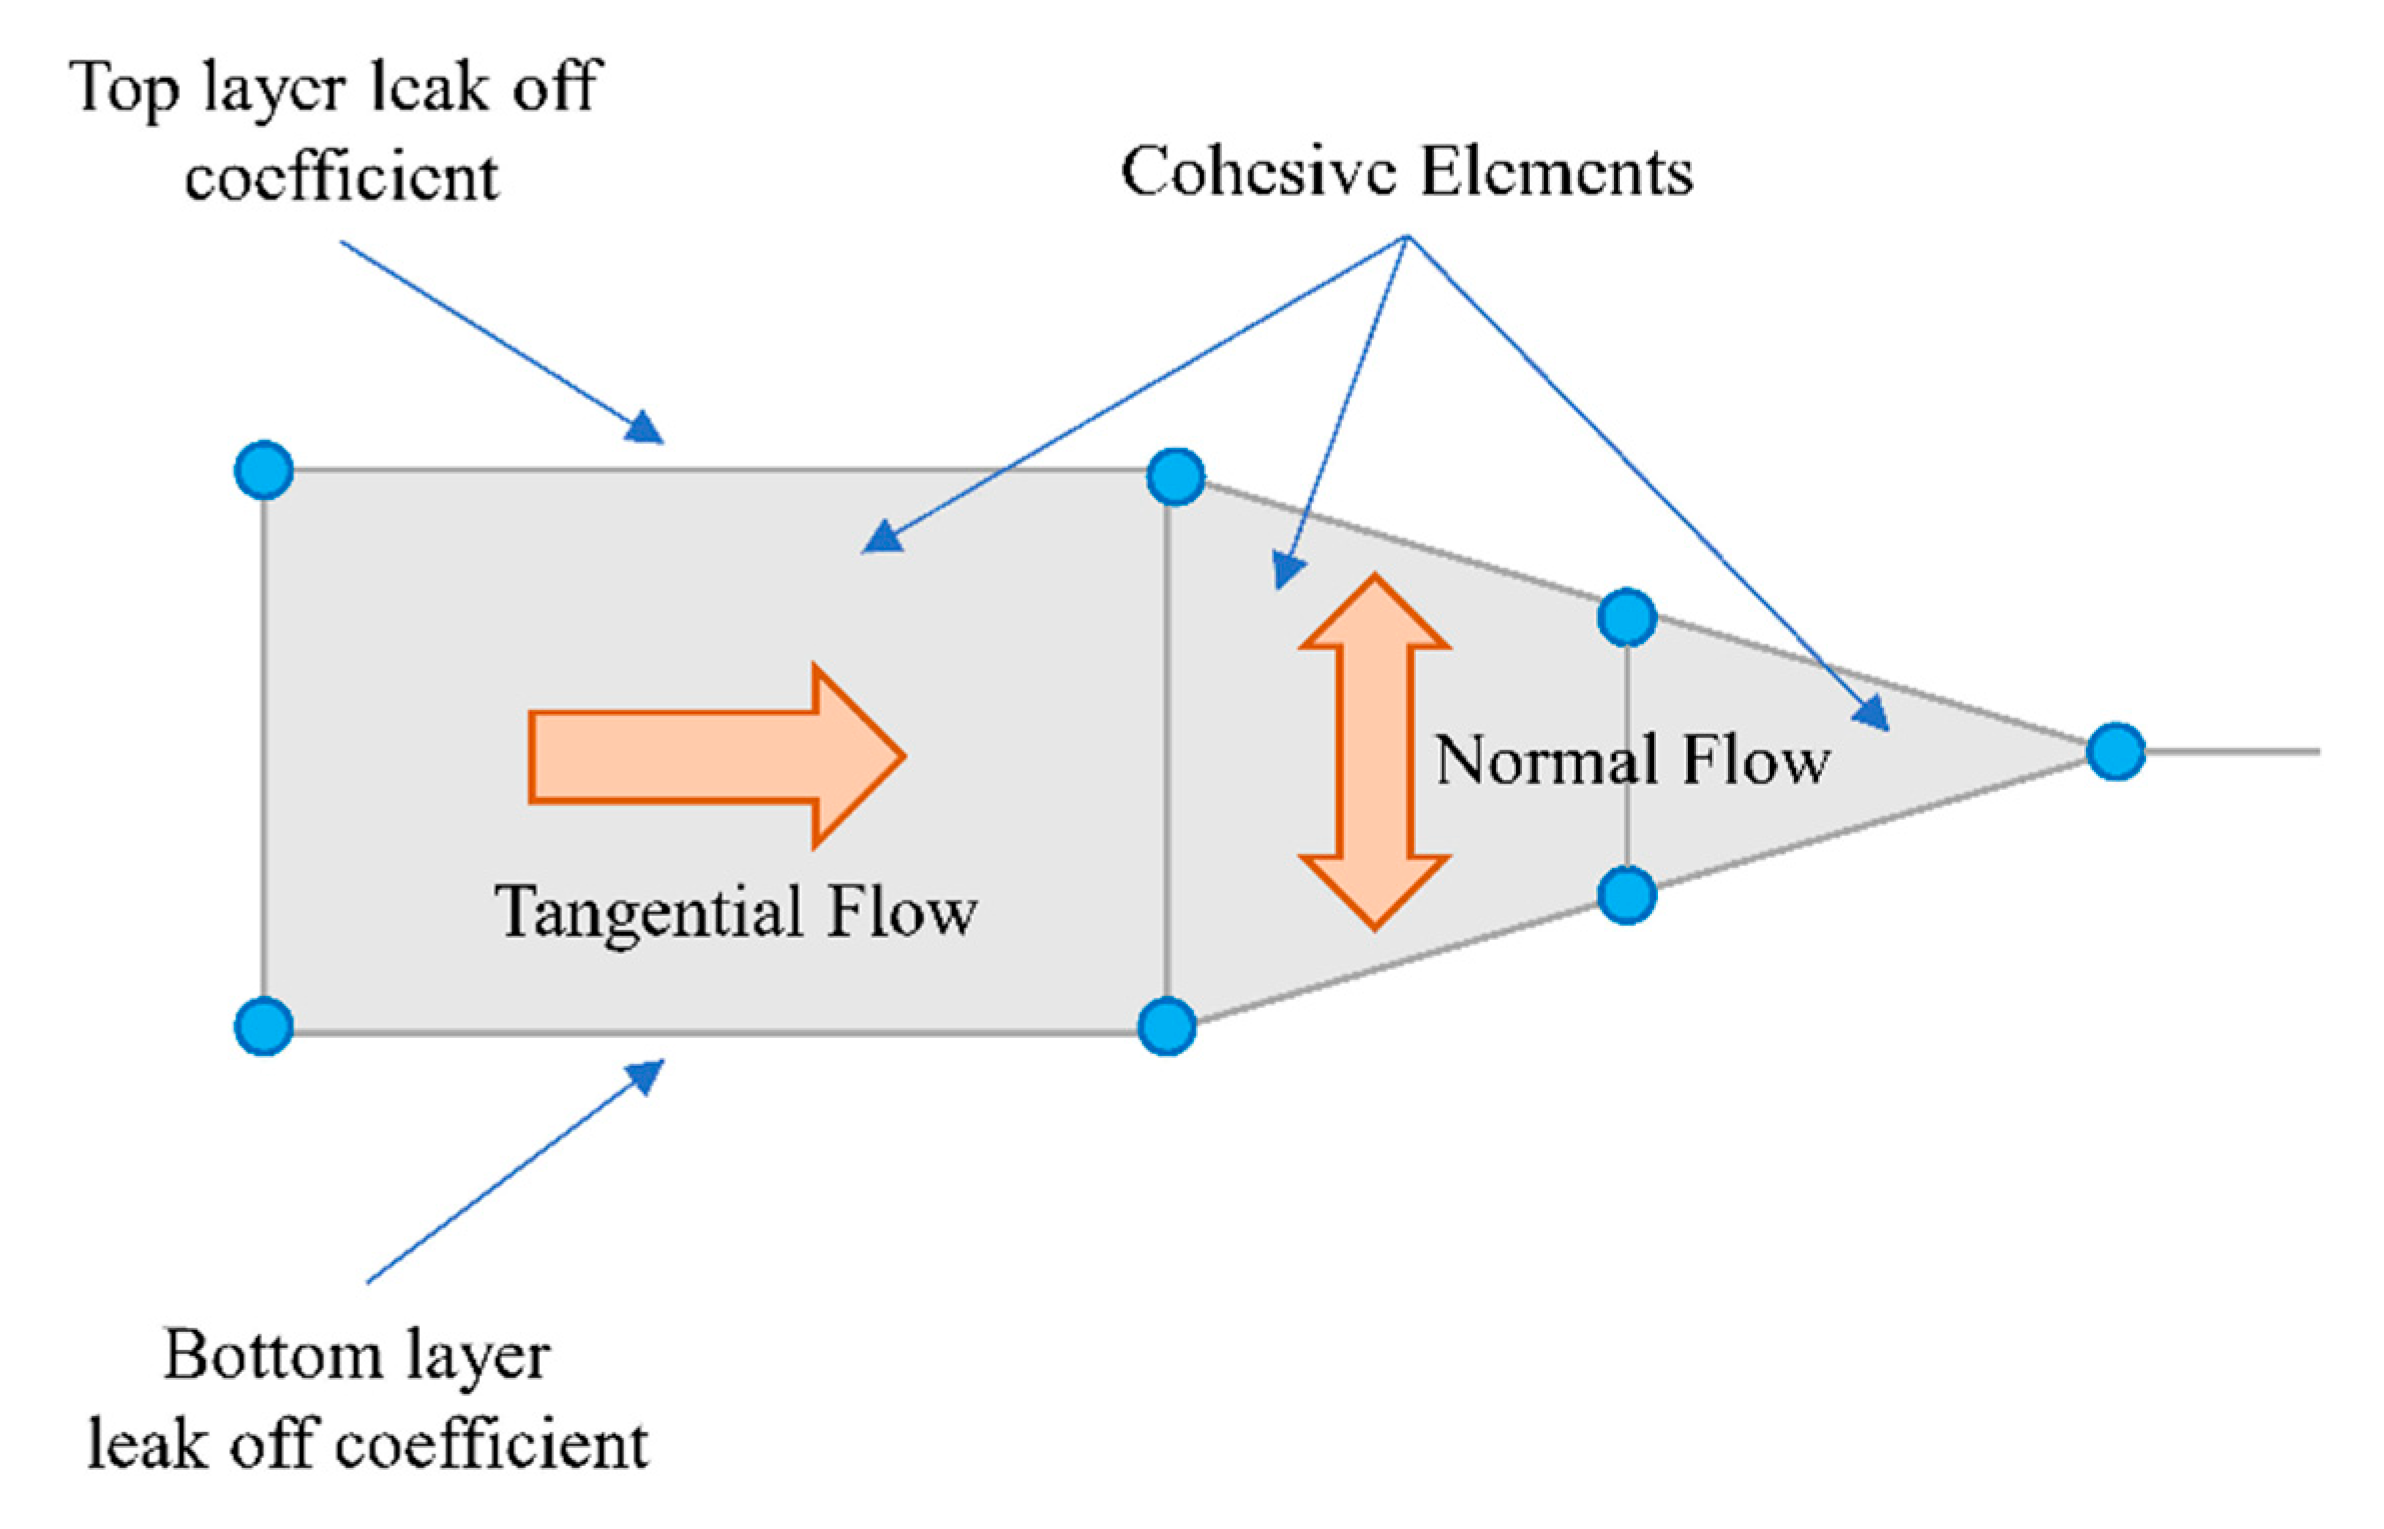
In order to estimate the current damage status, a description of the damage evolution is required. There are two definitions of fracture evolution, namely, based on effective displacement and based on fracture energy. An additional aspect of defining fracture propagation involves specifying damage and final failure characteristics, which can be accomplished through the use of linear or exponential softening laws [24]. In this article, the fracture propagation criteria required for the modeling process were extracted by considering rock fracture experiments. The fluid flowing into the fracture can be considered as tangential flow and normal flow, as shown in Figure 2. Tangential flow refers to the movement of fluid within the gap separating viscous elements and can be characterized using either Newtonian or power-law models. Normal flow refers to the fluid passing through the gaps between viscous elements, reflecting the resistance caused by agglomeration or scaling effects [25,26].
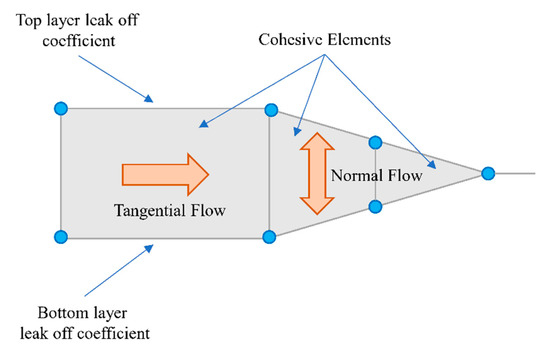
Figure 2.
Illustrates a schematic of fluid entering cohesive elements, taking into account both tangential and normal flow.
The simulation used in this study is a power-law model. In the power-law model, the definition of constitutive relationship is:
Among them, is shear stress; is the shear strain rate; is the viscosity of the fluid; is a power-law coefficient (flow behavior index).
The tangential volumetric flux can be described as:
The top and bottom of the viscous component are defined with normal flow rate and leakage coefficient:
Among them, and are the fluid flow rates at the bottom and top, respectively; is the pressure inside the cohesive element; and is the pore pressure on the top and bottom surfaces.
Fluid injection leads to an increase in pore pressure throughout the reservoir rock. The effective stress relationship of Biot was used to analyze the fracture response under the combined action of pore pressure and geostress caused by injection [27].
2.3. Constitutive and Seepage Equations
The constitutive behavior of fluid flow is controlled by Darcy’s law and Forchheimer’s law. Darcy’s law typically applies to lower fluid flow rates, while Forchheimer’s law typically involves higher fluid flow rates. In short, Darcy’s law can be seen as a linear simplified version of Forchheimer’s law. Forchheimer’s law describes the flow of pore fluids as [23]:
Among them, is the permeability of porous media; is the average velocity of the wetting liquid (also known as the permeation velocity); is the velocity coefficient; Darcy’s law is achieved by setting .
It is evident that as the fluid velocity approaches zero, Forchheimer’s law converges to Darcy’s law. The permeability is influenced by both the fluid saturation and the medium’s porosity, assuming these factors can be treated independently.
Among them, provides saturation dependence; ; and is a fully saturated permeability; for isotropic materials, .
2.4. Control Equation
As this study simulates fluid flow through porous media, it is essential to first examine the fundamental control equations for finite element modeling before discussing mesh generation and the development of the numerical model.
The governing equations of solids are very similar to those of fluids in many ways. However, there are also some differences between the two, such as the inability of fluids to support any deviatoric stress when not in motion. Therefore, stationary fluid can only apply average compressive stress or pressure. When adeviatoric stress is applied, the fluid begins to move, which is the main research point of fluid dynamics. The primary distinction between the governing equations of fluid flow and solid mechanics lies in the substitution of displacement vectors with velocity vectors, as illustrated in the following equation:
This will replace displacement variables in solid mechanics. Strain rate is the main cause of general stress, which can be defined as:
The relationship between strain rate vectors is as follows:
Among them, is the strain rate operator; is the velocity vector.
To characterize the stress–strain behavior of linear isotropic fluids, it is essential to introduce the concepts of deviatoric stress and pressure. Specifically, the deviatoric stress is defined as:
Among them, is deviatoric stress; is dynamic (shear) viscosity, similar to the shear modulus G in linear elasticity; the part in parentheses describes the deviation strain rate, where A is the Kronecker increment.
In addition:
The pressure relationship of fluid flow can be written as:
Among them, is the volumetric viscosity coefficient, similar to the bulk modulus K in solid mechanics; is the initial hydrostatic pressure.
Combining the equation, the following results can be obtained:
In addition, there is the following equation:
Disregarding the compressibility and volumetric viscosity of the fluid, the resulting equation is expressed as follows:
If compressibility is ignored, the above equation is the same as the linear elasticity equation. Fluid has no anisotropy, so it always behaves purely isotropic.
3. Model Establishment
3.1. Model Geometry
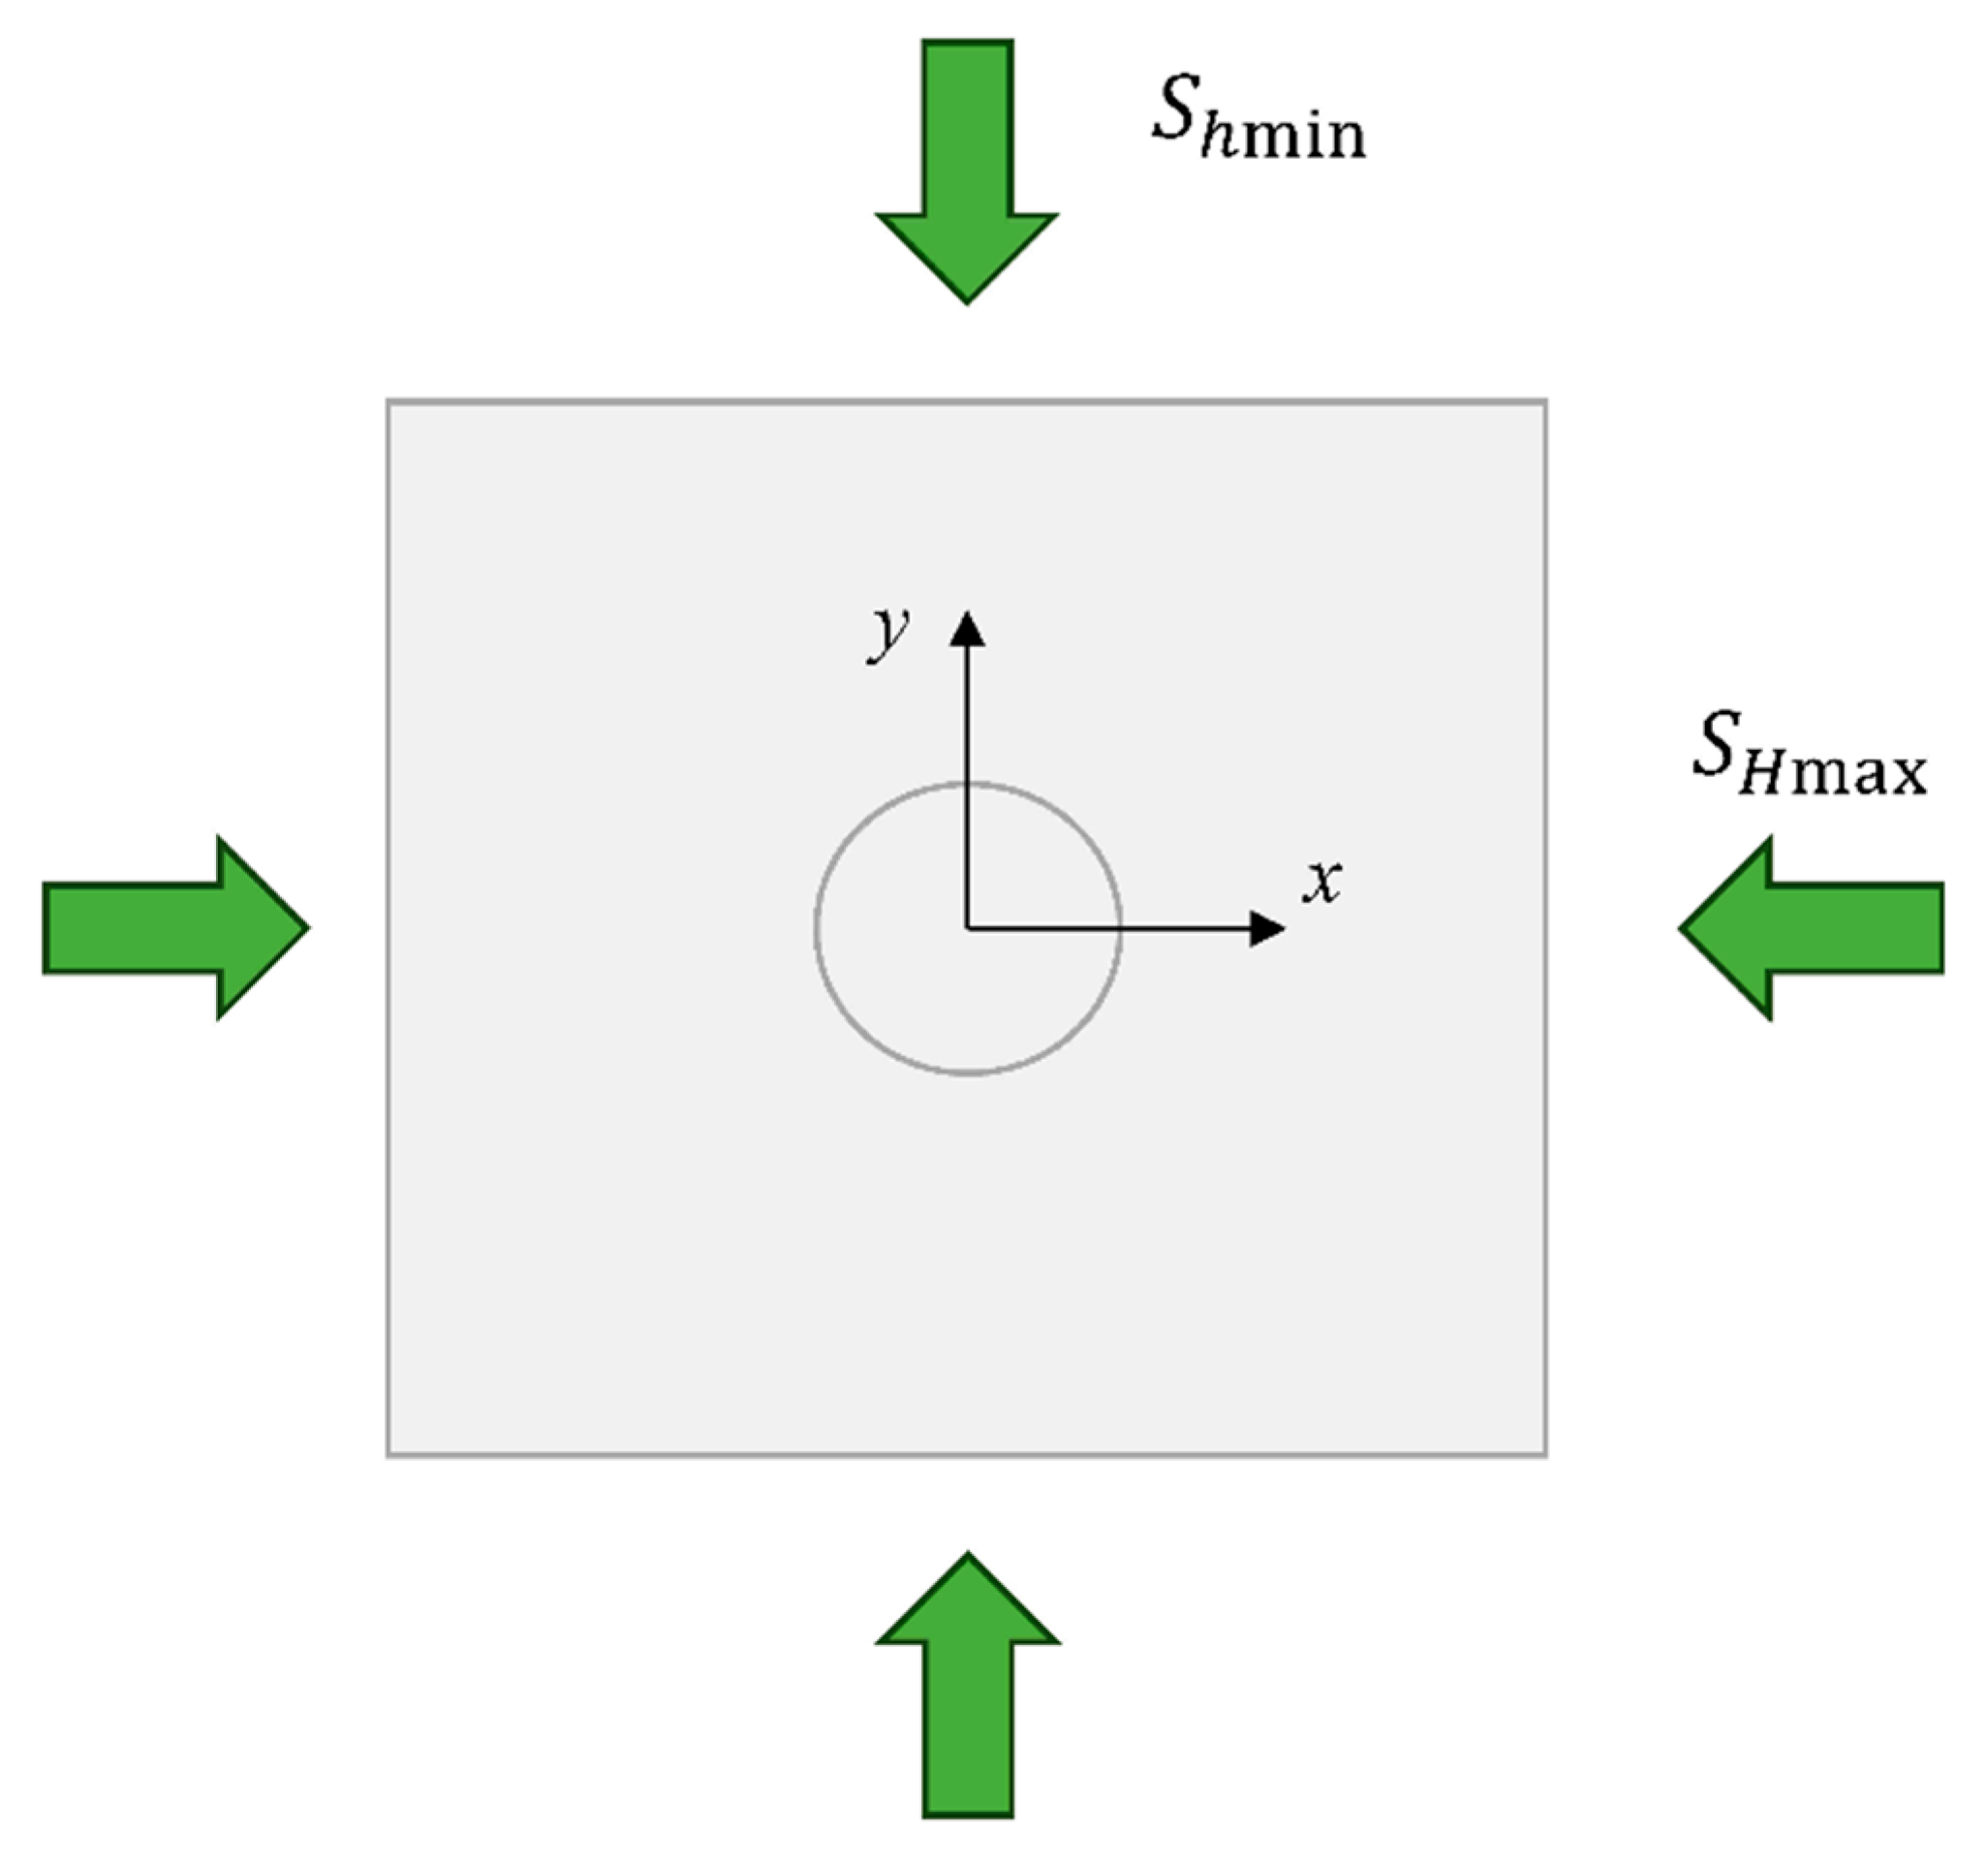
This article considers the simulation of wellbore wall sealing in vertical shafts. It is assumed the wellbore is in a plane strain state, as shown in Figure 3. Due to symmetry, only a quarter of the wellbore was used in finite element numerical analysis. The radius of the wellbore is 0.10795 m. The length of the quarter model is 2 m and the width is 1.5 m.
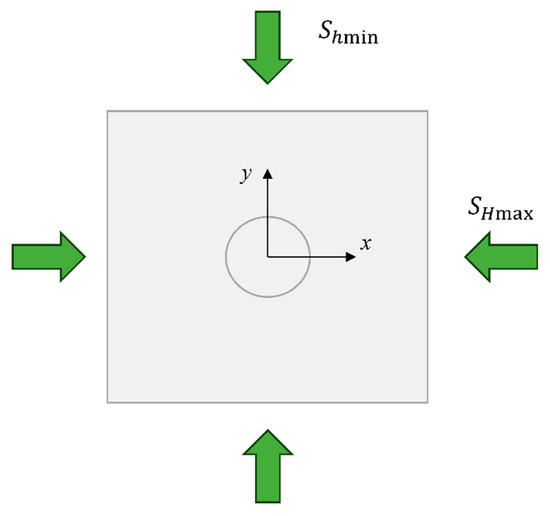
Figure 3.
Schematic diagram of two-dimensional wellbore under far-field stress [28]. The green arrows indicate two horizontal directions and do not require explanation.
As shown in Figure 4a, the “black” boundary of the model is designed symmetrically [28], assuming that there are pre-existing fractures on the wellbore, their surfaces are parallel to the direction of the maximum horizontal principal stress or the X-axis. The use of a fracture length of 13.97 cm (5.5 inches) is to maintain consistency or approach the work of other researchers [29,30]. The fracture is blocked by Loss Circulation Material (LCM), as shown in Figure 4b. It is important to note that while the role of LCM bridge material properties (such as strength and permeability) in wellbore reinforcement has long been a debated topic in the drilling industry, the influence of these properties falls outside the focus of this study.
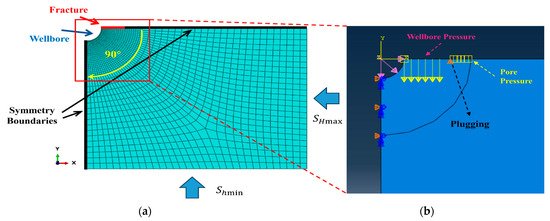
Figure 4.
Wellbore sealing model: (a) Geometric shape and boundary conditions of the model; (b) Model details.
Unlike previous studies, this study assumes a perfect blockage at the blockage point, which is a rigid body with zero magnetic conductor. Therefore, ignore the fluid flow after the blockage point. To create the bridging effect in fractures, the velocity in the Y-direction at the bridging point is set to zero. As illustrated in Figure 4a, the quadrant angle starts at 0° on the X-axis and increases to 90° around a quarter of the wellbore.
3.2. Boundary Conditions
As shown in Figure 4a, symmetric boundaries are applied to the left and upper boundaries of the model. The maximum horizontal stress is along the X direction (SHmax) and the minimum horizontal stress is along the Y direction (Shmin). As shown in Table 1, various horizontal stress values were used to study the influence of horizontal stress comparison.

Table 1.
Input parameters of numerical model.
The wellbore pressure acts on the inner wall of the wellbore and can propagate along the fracture path until effective sealing is formed, keeping the pressure inside the fracture consistent with the wellbore pressure. After using leakage circulation material LCM to achieve fracture bridging, the front section of the fracture (i.e., from the wellbore to the LCM bridging position) still maintains the same pressure as the wellbore. In the fracture segment beyond the bridge plug (i.e., from the LCM bridge plug to the fracture tip), the wellbore fluid can no longer reach this area due to the blockage. As a result, its pressure is no longer supported by the wellbore and gradually equilibrates with the formation pore pressure. This is because the fluid inside the fracture will continuously leak into the formation, causing the pressure to decay to equal the pore pressure of the formation.
In order to accurately simulate the dynamic behavior of fluids before and after the formation of bridge plugs, appropriate leakage rate boundary conditions need to be applied on the wellbore wall and fracture surface to characterize the leakage process of fluids into the formation and reflect the spatial differences in pressure distribution in fractures.
3.3. Input Parameters
Table 1 provides the input parameters for finite element numerical simulation. The total size of the model is approximately ten times the size of the wellbore to eliminate the influence of boundaries on the stress and strain state near the wellbore. Select typical geological rock characteristics. Apply maximum and minimum horizontal stresses with varying stress contrasts between 1 and 2.0. In addition, parameter sensitivity studies also include the effects of reservoir elastic modulus, Poisson’s ratio, fracturing fluid viscosity, and fracturing fluid displacement, assuming perfect sealing.
4. Simulation Results and Parameter Analysis
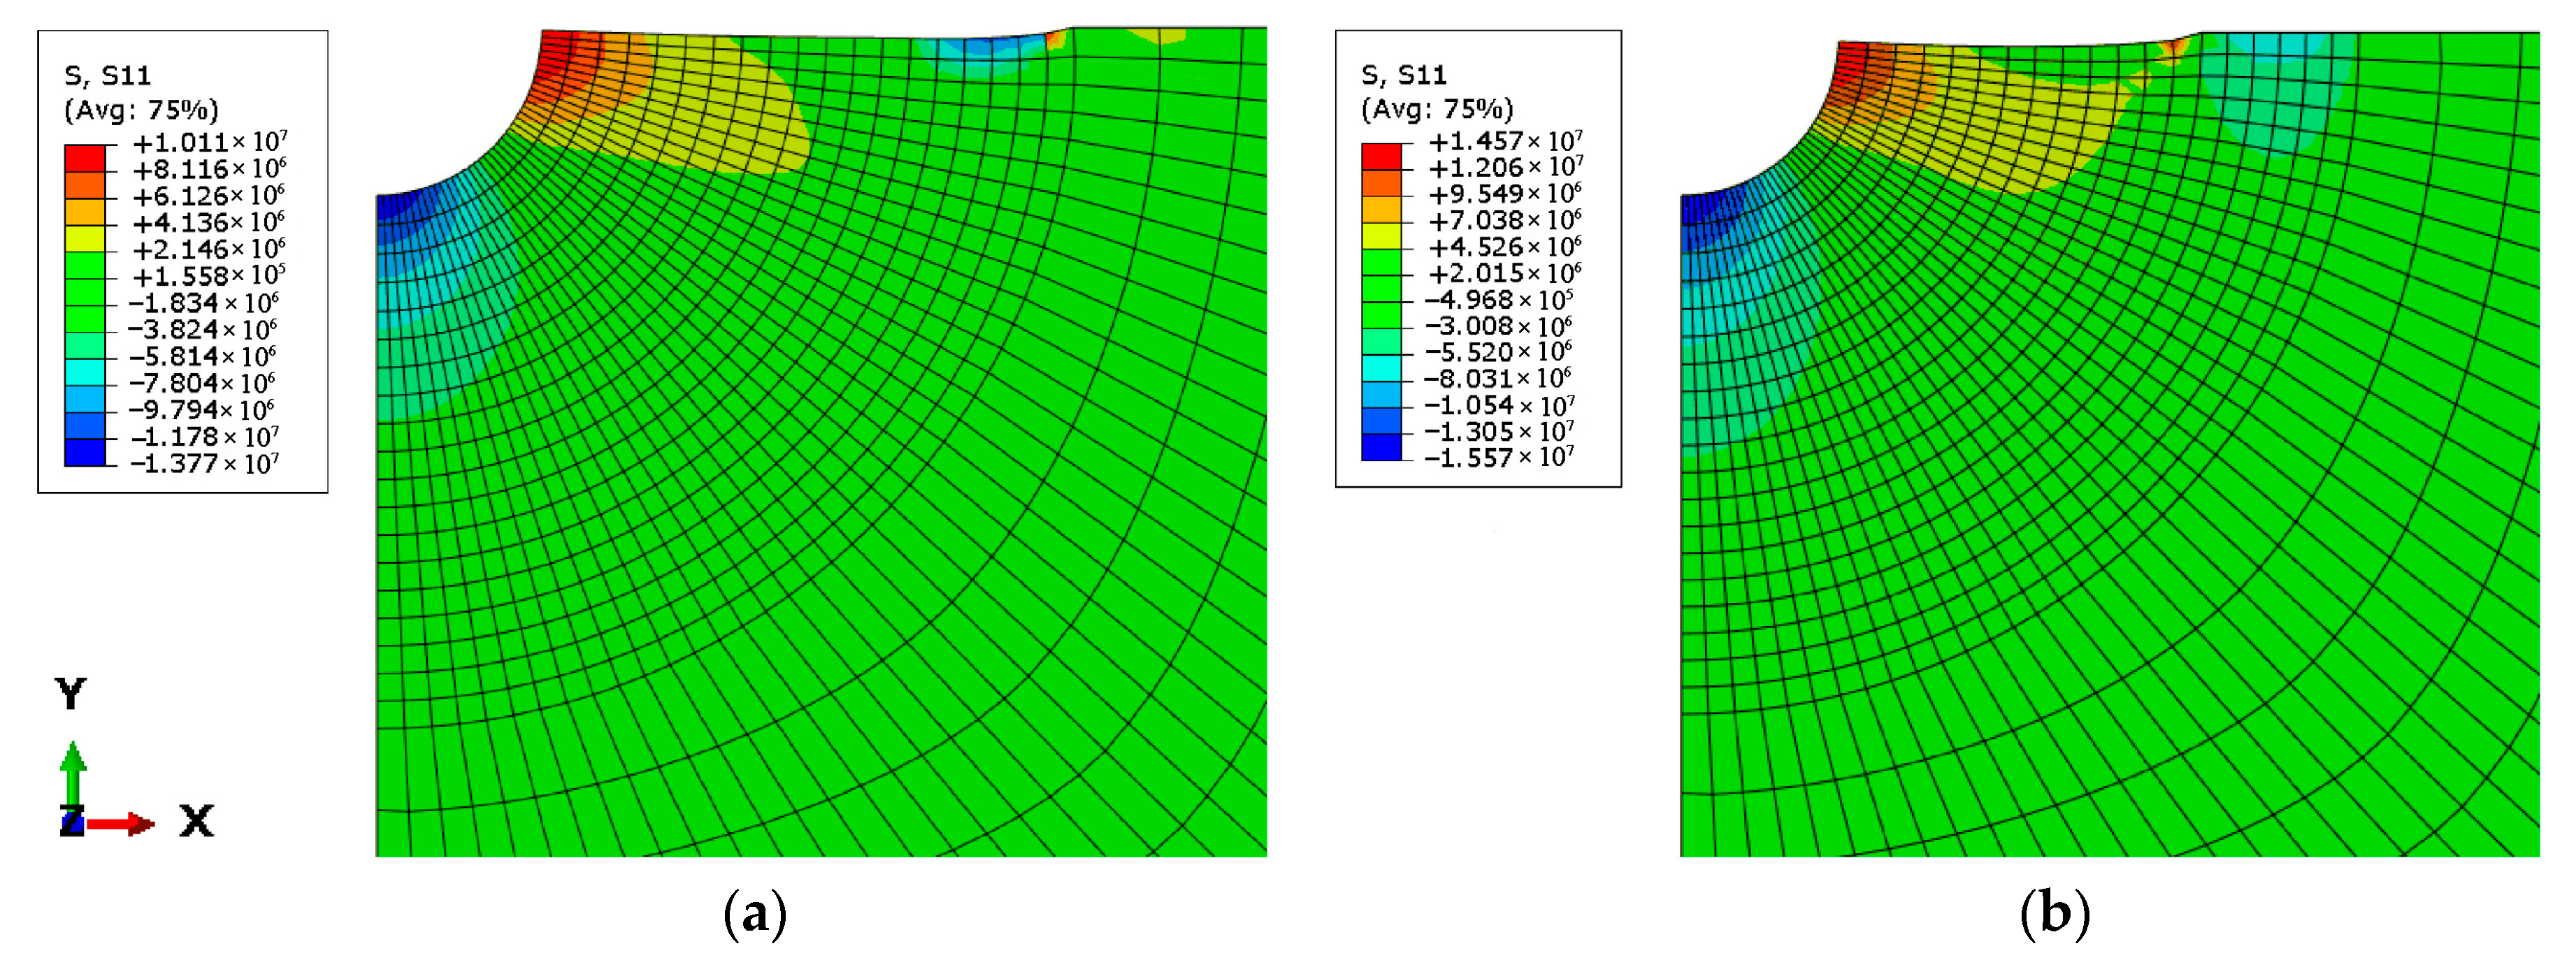
This section introduces the results of finite element numerical simulation using the input parameters in Table 1. The influence of stress anisotropy, elastic modulus, Poisson’s ratio, fracturing fluid viscosity, and fracturing fluid displacement was studied using parameter sensitivity analysis. Using the above finite element model, the circumferential stress state near the wellbore and fractures was analyzed for various combinations of influencing parameters. Figure 5 illustrates the circumferential stress distribution before and after the fracture was sealed using LCM. In this study, negative pressure values and positive pressure values represent compressive stress and tensile stress, respectively. It is evident that before sealing, the fracture tip is in a stretched state, and the rock near the wellbore transitions from a stretched state to a compressed state. At the sealing location, stress concentration is observed, indicating increased resistance to fracture opening. Additionally, the reduced tensile stress near the fracture tip suggests that further propagation is more challenging, as anticipated.
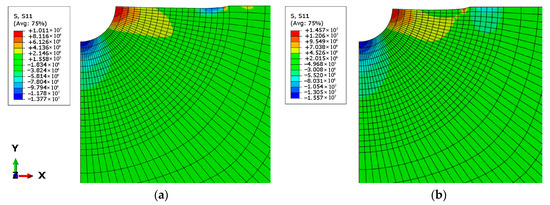
Figure 5.
Distribution of circumferential stress before and after the sealing of wellbore fractures: (a) before sealing; (b) and after blockage (Label unit: Pa).
4.1. Influence of Anisotropy of Geostress
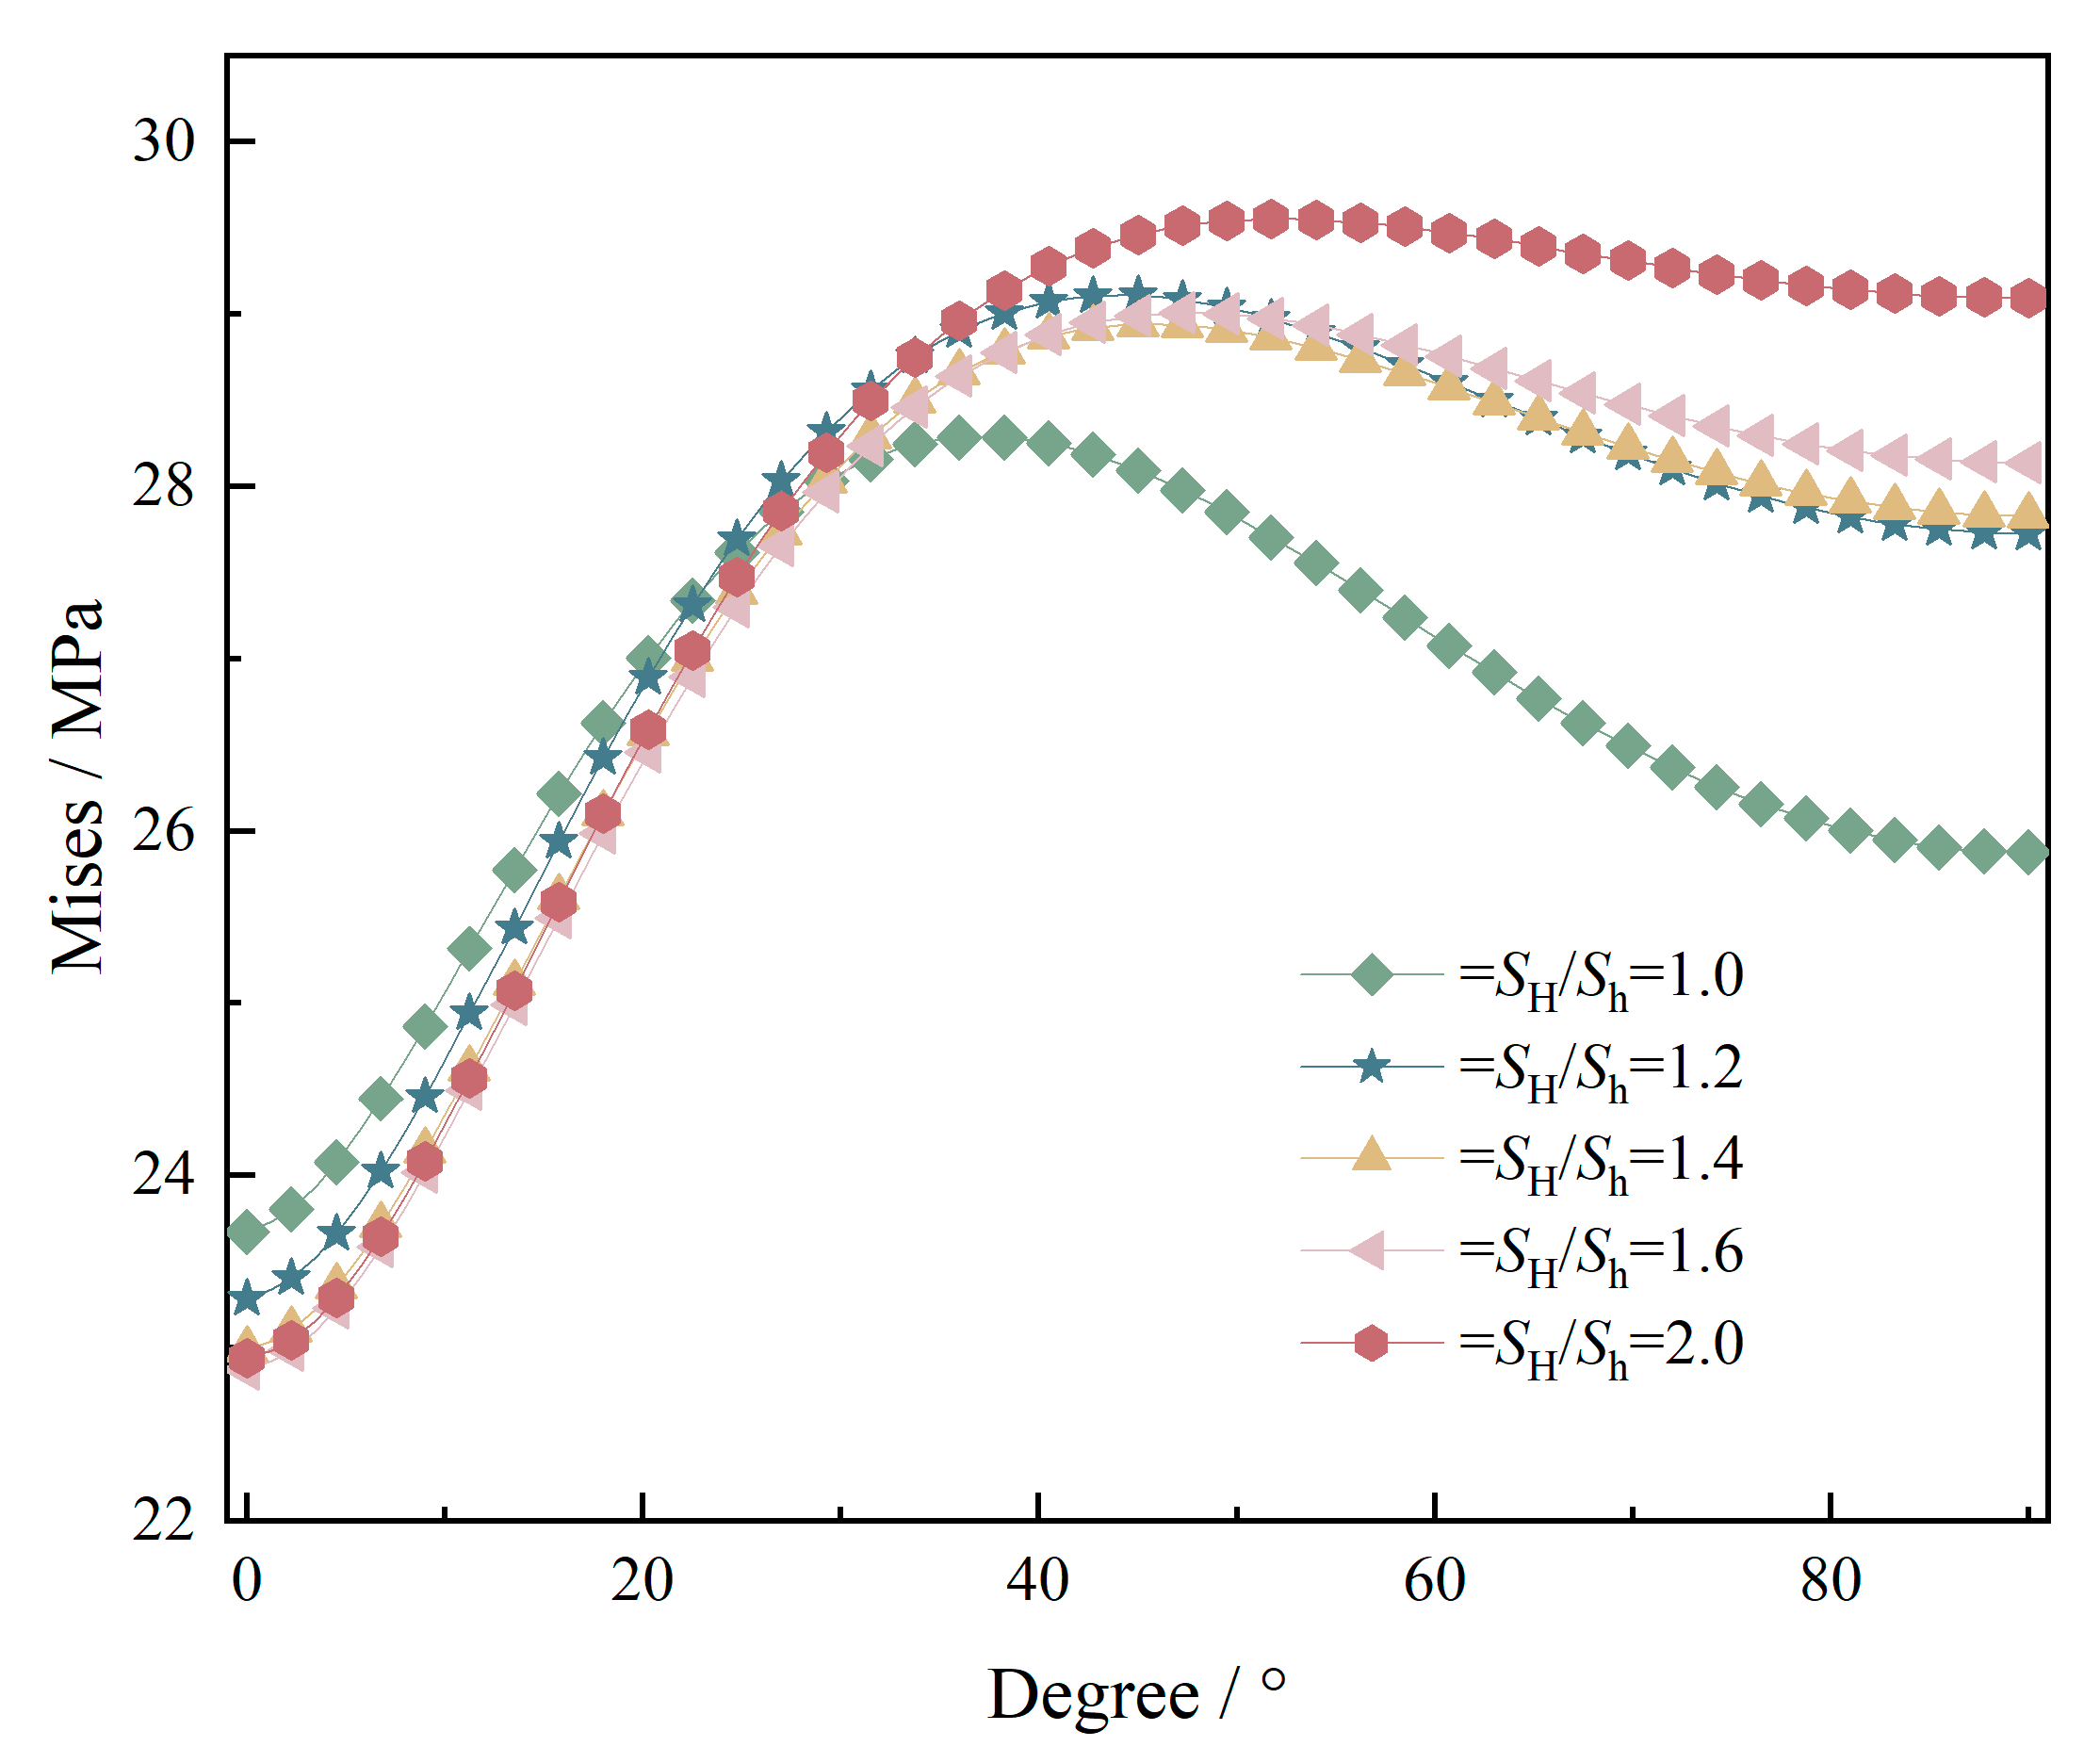
By keeping the minimum horizontal principal stress constant at 10 MPa, the minimum horizontal principal stress values were sequentially changed to 10 MPa, 12 MPa, 14 MPa, 16 MPa, and 20 MPa. Other main parameters are shown in Table 1. After calculating the fracture sealing, the circumferential stress on the wellbore wall at 0~90° was compared under different horizontal stress differences, as shown in Figure 6. For the Mises stress distribution around the wellbore after sealing, Figure 6 shows the Mises stress distribution around the wellbore with different stress anisotropy ratios (i.e., the ratio of the SH to the Sh) as a function of the wellbore azimuth angle. From the graph, it can be seen that Mises stress increases first and then stabilizes with an increasing angle. Specifically, all curves reach a peak around an angle of approximately 30°, indicating that the stress concentration on the wellbore is most pronounced in this direction, which is a sensitive area where damage may occur [31]. Afterwards, the stress changes tend to ease, indicating that the deformation or instability risk borne by the wellbore in other directions is relatively small.
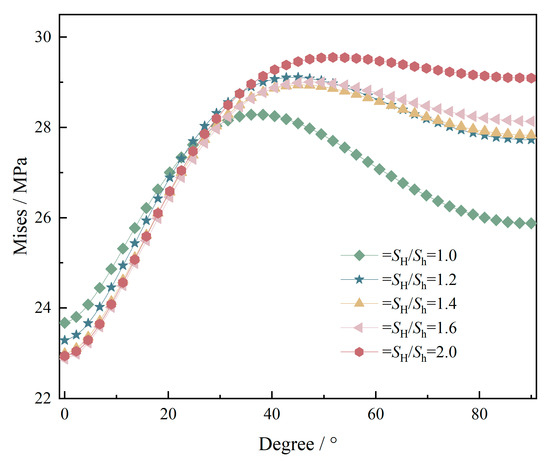
Figure 6.
Comparison of Mises stress around the wellbore under different stress anisotropy after fracture sealing.
The anisotropy of stress has a significant impact on Mises stress. When SH/Sh = 1.0, that is, when the stress is isotropic, the overall level of Mises stress is the lowest and the fluctuation is also small. As SH/Sh increases, the overall stress level rises and the peak becomes more pronounced, indicating that the greater the stress anisotropy, the more unfavorable it is for wellbore stability. The maximum Mises stress occurs at SH/Sh = 2.0, reaching approximately 30 MPa. For situations where the stress ratio is higher than 1.4, special attention should be paid to wellbore reinforcement and mud pressure control strategies. When SH/Sh is large, wellbore blockage is more likely to cause wellbore rupture or instability, and a suitable wellbore direction should be chosen to avoid high stress concentration areas.
4.2. Influence of Elastic Modulus
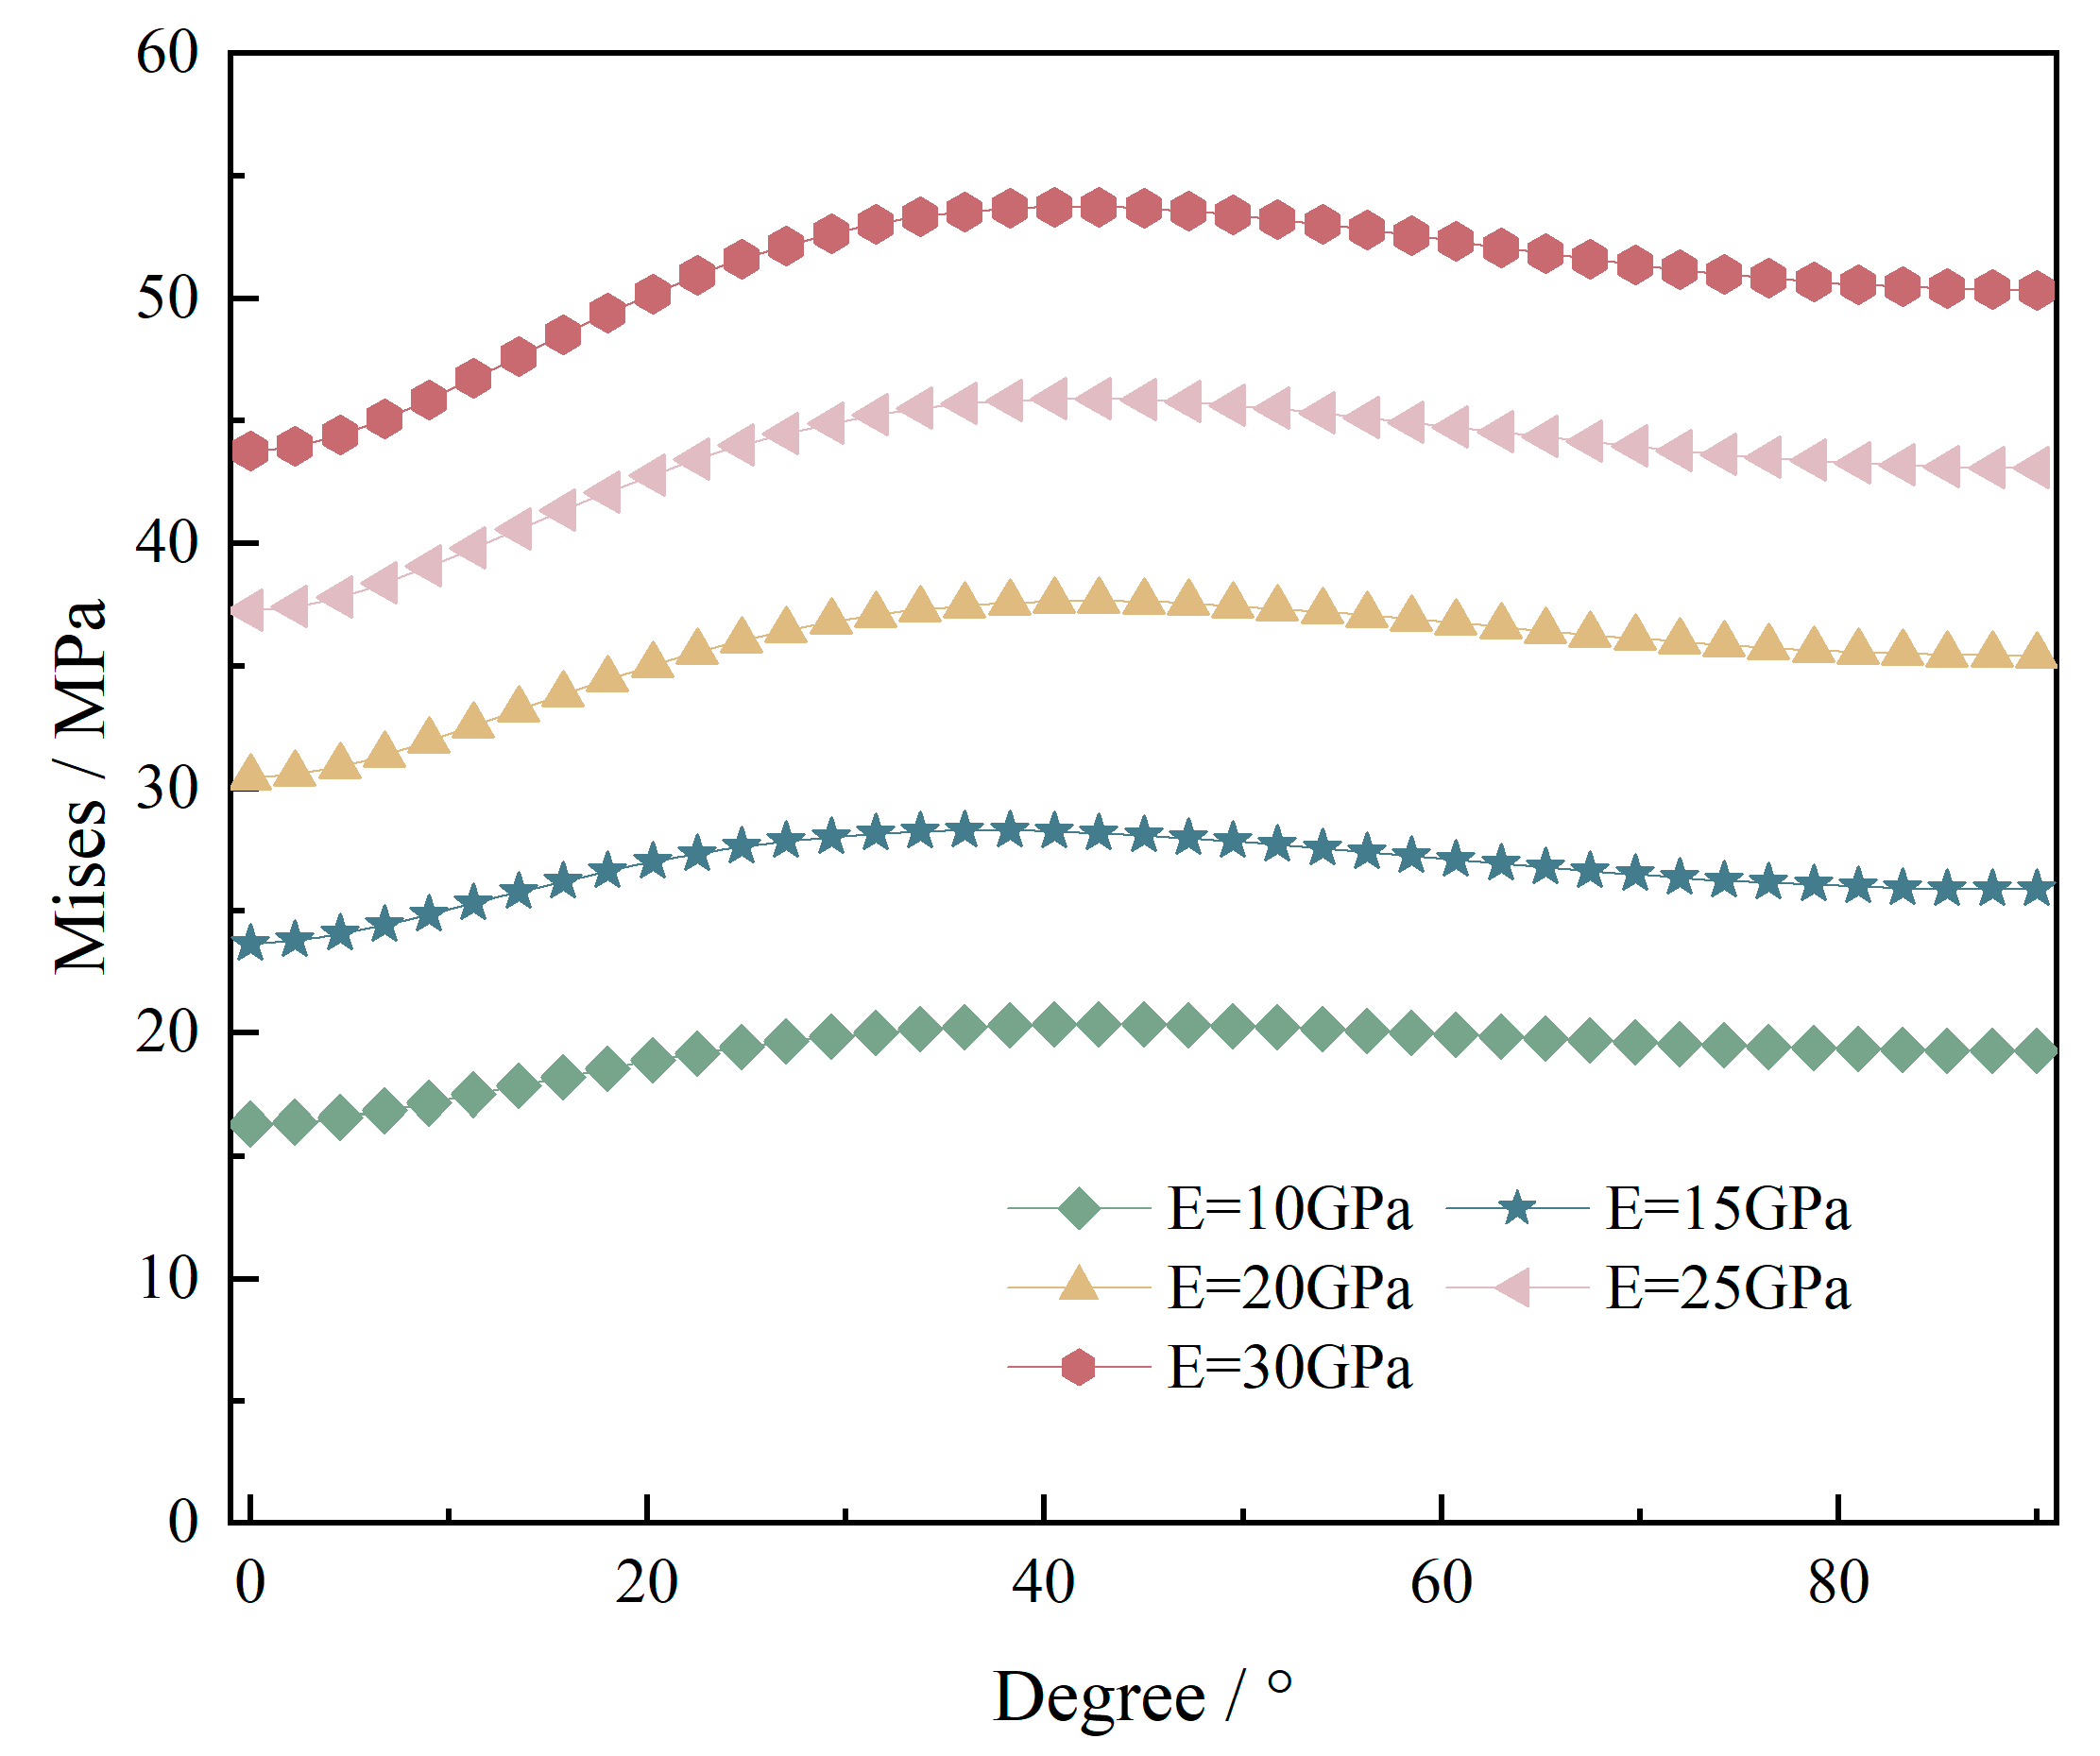
Previous mechanical experiments have shown that elastic modulus is a key parameter of reservoir rocks. By establishing different elastic modulus parameters for reservoirs, we can study the impact of changes in reservoir elastic modulus on wellbore sealing. The elastic moduli of the reservoir are set at 10 GPa, 15 GPa, 20 GPa, 25 GPa, and 30 GPa, respectively, with a stress ratio of 1. Other main parameters are shown in Table 1. After sealing the fracture, the circumferential stress on the wellbore wall at 0~90 ° was compared with different elastic moduli, as shown in Figure 7.

Figure 7.
Comparison of Mises stress around the wellbore under different reservoir elastic modulus conditions after fracture sealing.
Under the simulation conditions of this study, for the Mises stress distribution around the wellbore after sealing, Figure 7 shows the Mises stress distribution around the wellbore with different reservoir elastic modulus conditions and azimuth angles. It can be seen that as the elastic modulus of the reservoir increases from 10 GPa to 30 GPa, the Mises stress around the well shows an overall upward trend, and the maximum stress generally occurs in the angle range of 30–40°, indicating a strong stress concentration phenomenon in this area. Due to their strong rigidity, high modulus reservoirs can cause local stress to be difficult to release, which can easily lead to wellbore instability or fracture propagation; low modulus reservoirs, on the other hand, have strong deformation ability and may exhibit elastic energy absorption, but at the same time, there is a risk of reduced wellbore diameter. Therefore, the elastic modulus of the reservoir is an important parameter that affects wellbore stability and fracturing response and should be given special consideration in reservoir engineering design for wellbore plugging. In addition, in engineering, fracture sealing not only helps to improve wellbore stability, but also reduces the risk of local damage, especially in high modulus reservoirs where the effect is more pronounced. Therefore, it is necessary to design sealing materials and construction processes reasonably based on reservoir mechanics parameters.
4.3. Influence of Poisson’s Ratio
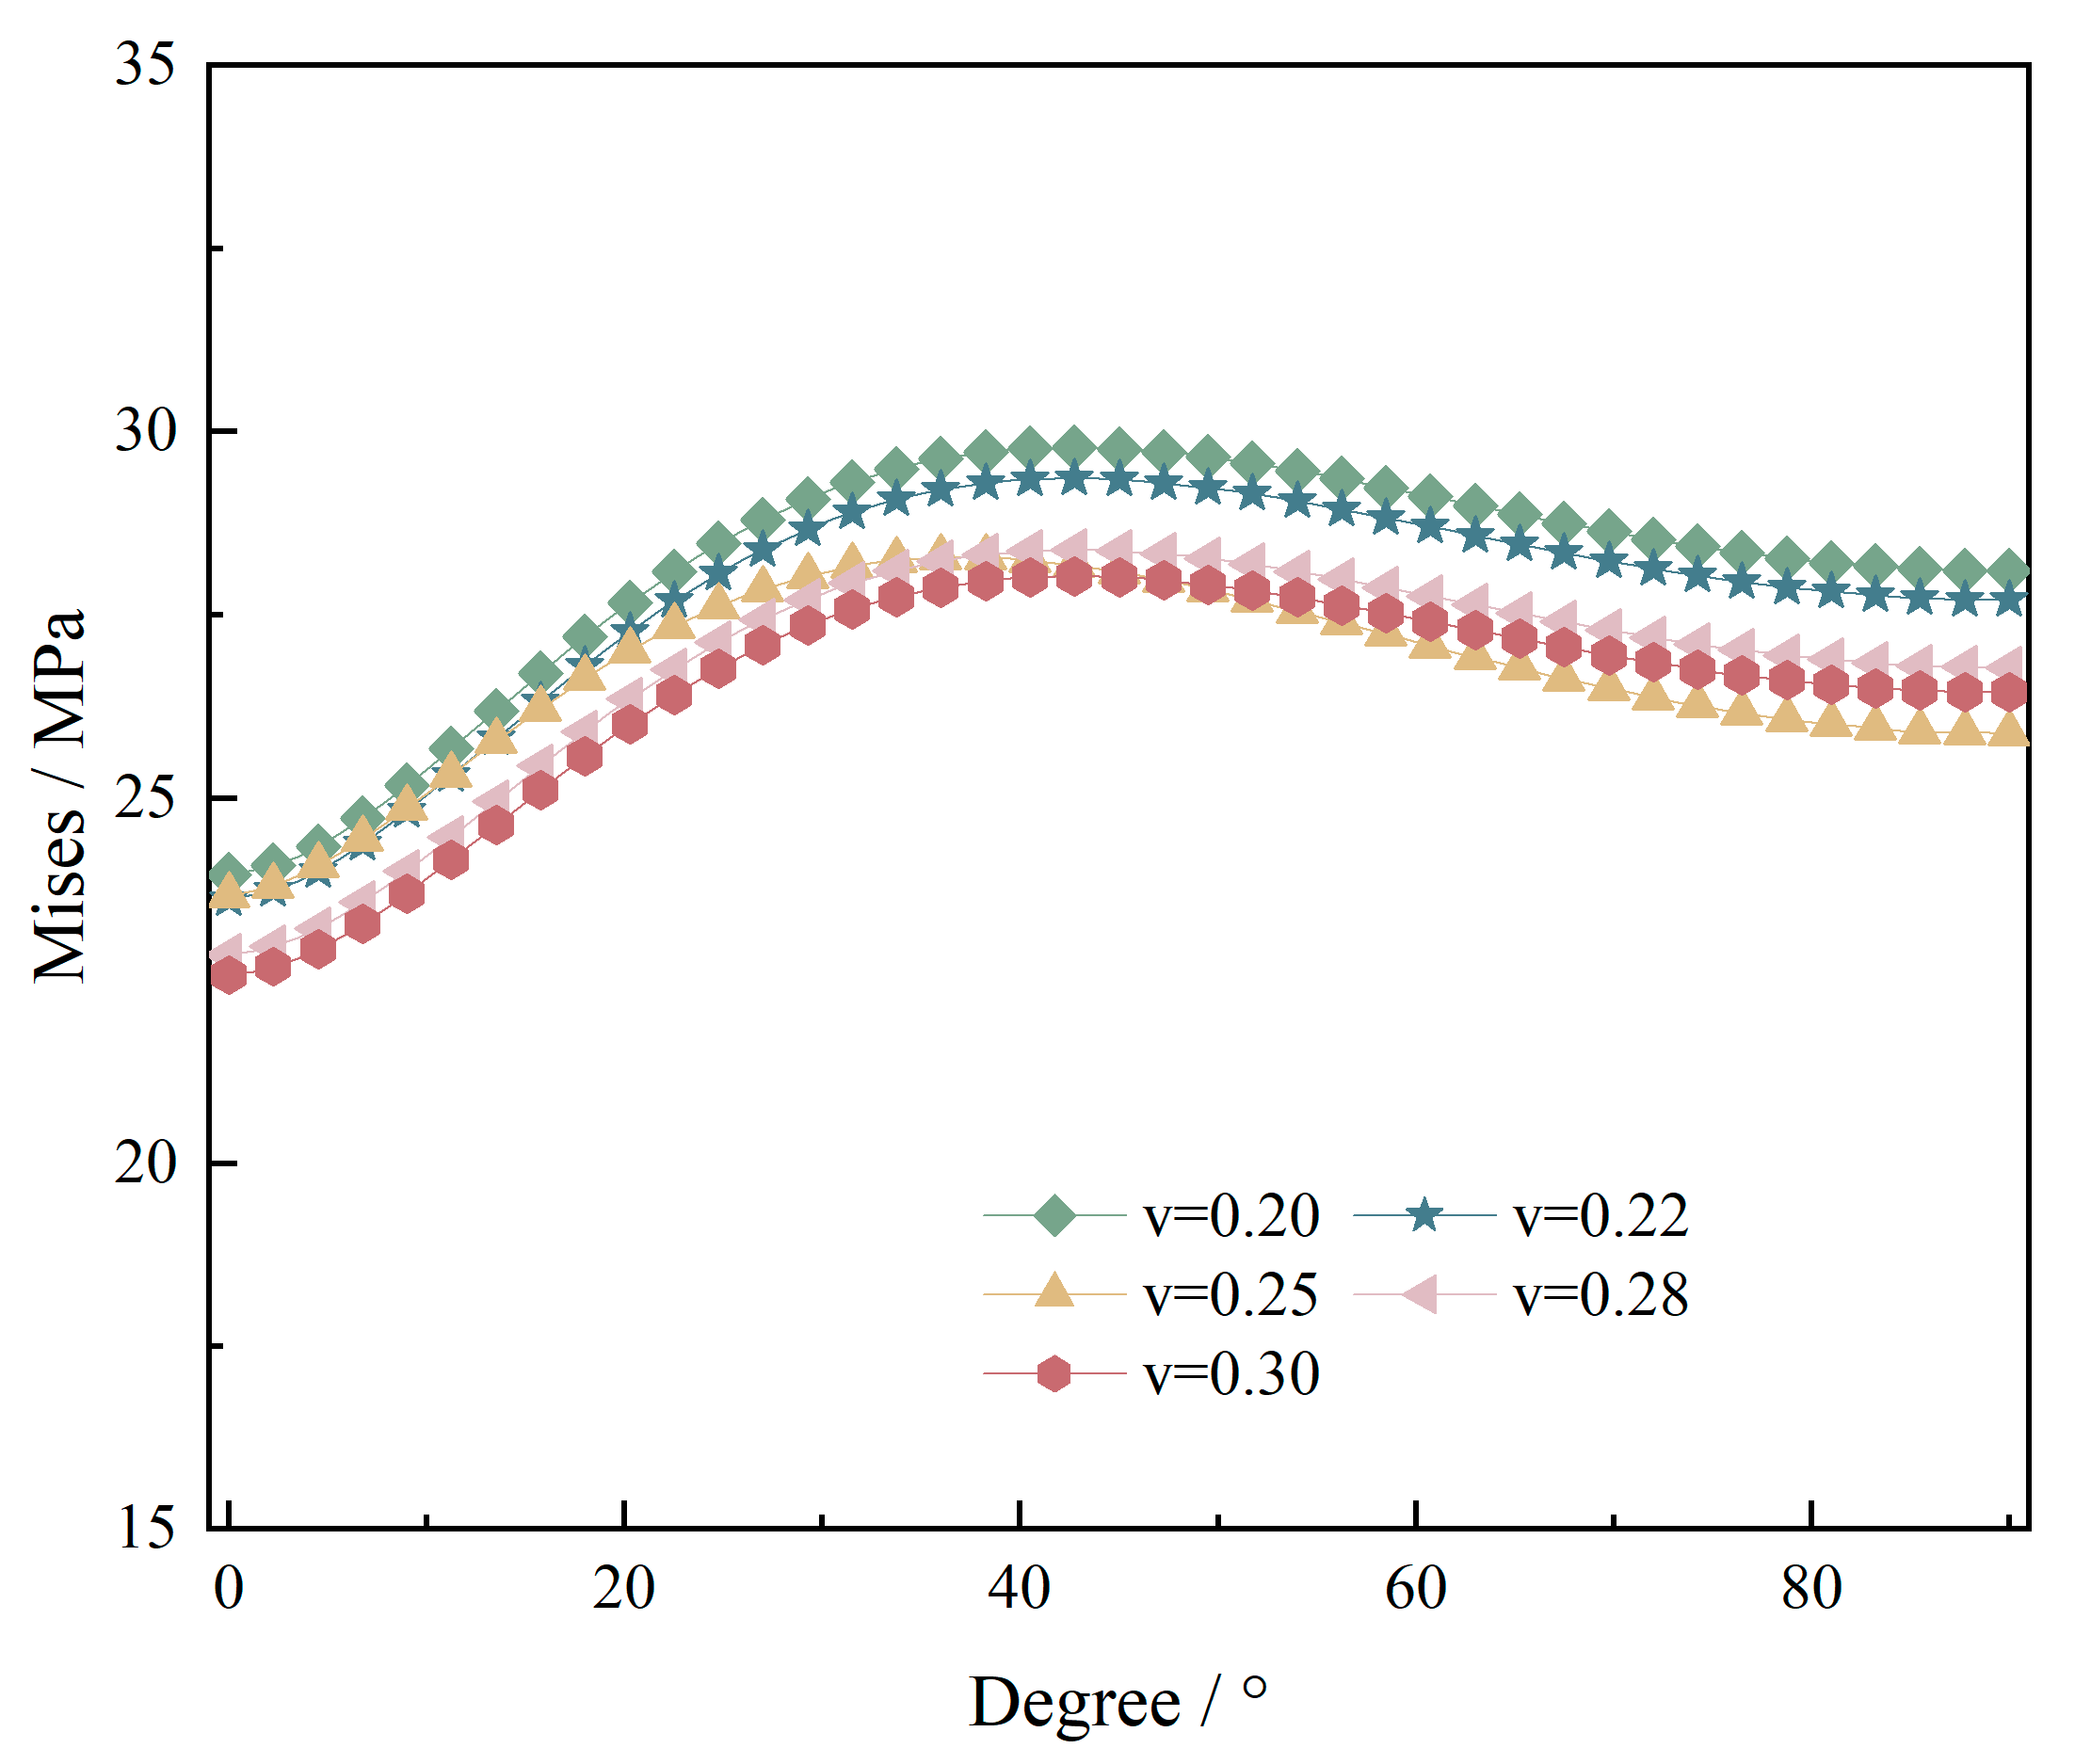
In addition, the Poisson’s ratio of the reservoir is also a key parameter of the reservoir rock. Different elastic modulus parameters of the reservoir are established to study the effect of changes in the Poisson’s ratio of the reservoir on wellbore sealing. Poisson’s ratios of the reservoir are set to 0.20, 0.22, 0.25, 0.28, and 0.30, and the geostress ratio is 1. Other main parameters are shown in Table 1. Following fracture sealing, the circumferential stress on the wellbore wall within the 0–90° range was analyzed for various elastic moduli, as illustrated in Figure 8.

Figure 8.
Comparison of Mises stress around the wellbore under different Poisson’s ratio conditions after fracture sealing.
For the Mises stress distribution around the wellbore after sealing, Figure 8 shows the Mises stress distribution around the wellbore with different reservoir elastic modulus conditions and azimuth angles. It can be clearly seen that compared to the horizontal stress difference and reservoir elastic modulus, the change in Poisson’s ratio has a smaller impact on the stress distribution of Mises around the wellbore. From the graph, it can be seen that as Poisson’s ratio of the reservoir increases, the Mises stress around the well shows a significant downward trend overall. This indicates that after fracture sealing, low Poisson’s ratio rocks are more prone to significant equivalent stress concentration compared to high Poisson’s ratio rocks. Specifically, when Poisson’s ratio is low, the Mises stress curve is steeper and the values are higher, indicating a lower stress diffusion ability of rock materials under the influence of blockage. As Poisson’s ratio increases, the Mises stress curve becomes smoother and the peak value significantly decreases, indicating that high stress concentration is less likely to occur near the wellbore, reducing the risk of instability or failure. Therefore, in practical engineering, Poisson’s ratio characteristics of reservoirs should be comprehensively considered, and more effective stress control and sealing materials should be used in low Poisson’s ratio reservoirs to reduce the risk of wellbore instability. In general, Poisson’s ratio has a comparatively minor effect.
4.4. Influence of Fracturing Fluid Viscosity
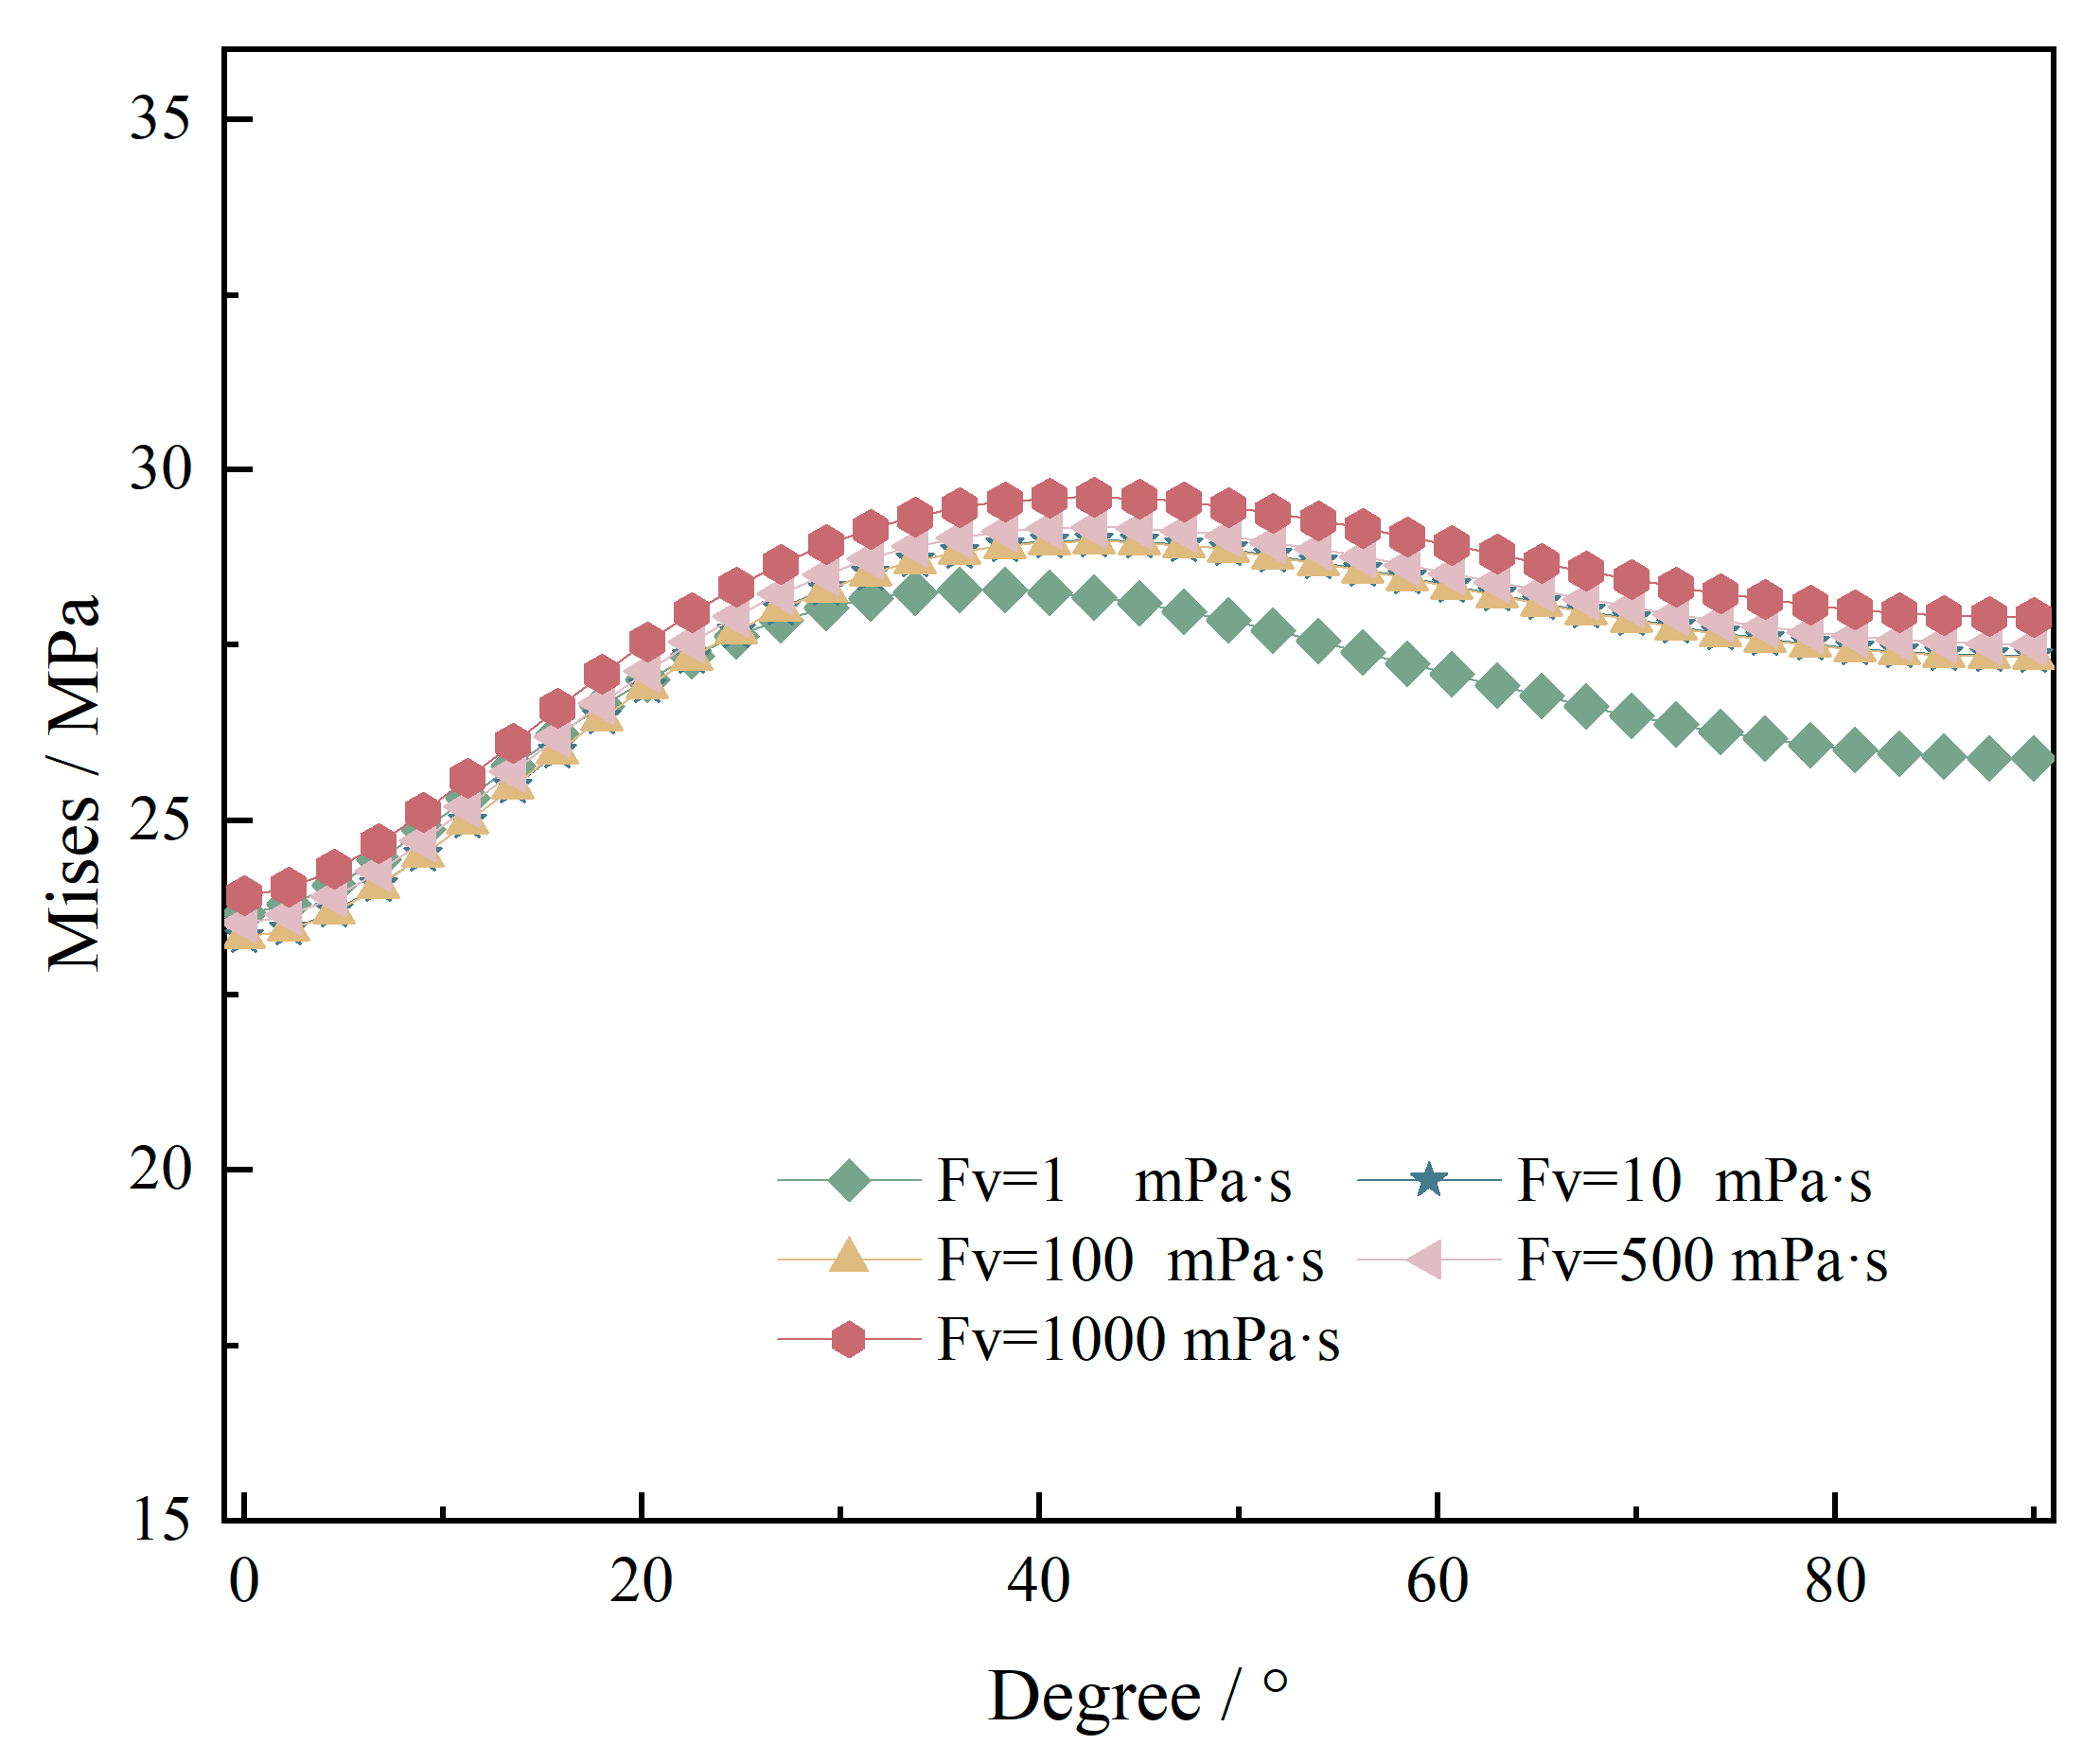
In addition, the viscosity of fracturing fluid is also a key parameter. In this section, establishing the viscosity parameters of fracturing fluid and studying the effect of changes in fracturing fluid viscosity on wellbore plugging are performed. The viscosity of the fracturing fluid is set to 1, 10, 100, 500, and 1000 mPa·s, respectively, and the geostress ratio is 1. Other main parameters are shown in Table 1. After sealing the fracture, the circumferential stress on the wellbore wall at 0~90° was compared with different fracturing fluid viscosities, as shown in Figure 9.
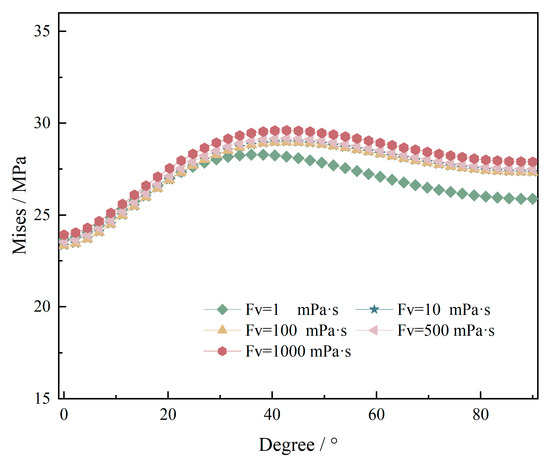
Figure 9.
Comparison of Mises stress around the wellbore under different fracturing fluid viscosity conditions after fracture sealing.
For the Mises stress distribution around the wellbore after plugging, Figure 9 shows the Mises stress distribution around the wellbore with different fracturing fluid viscosities and azimuthal angles. It can be clearly seen that compared to the horizontal stress difference and reservoir elastic modulus, the changes in fracturing fluid viscosity and Poisson’s ratio have a relatively small impact on the stress distribution of Mises around the wellbore. From the graph, it can be observed that as the viscosity of the fracturing fluid increases, the overall Mises stress level around the well gradually increases and reaches the stress peak near an angle of 40°. The Mises stress corresponding to low viscosity fracturing fluid (such as Fv = 1 mPa · s) is relatively low, while the stress corresponding to high viscosity fracturing fluid (such as Fv = 1000 mPa · s) is significantly increased, especially in the range of 20~60°, where the stress curve differentiation is more obvious. In addition, as the angle increases to 90°, all curves show a downward trend, but the high viscosity liquid still maintains a high stress value, indicating a stronger stress concentration phenomenon near the wellbore. After the fracture is sealed, the viscosity of the fracturing fluid affects the Mises stress around the wellbore. High viscosity fracturing fluid induces higher equivalent stress near the wellbore, which may be related to its longer retention time and more significant plugging effect. However, excessive Mises stress may increase the risk of wellbore instability. Therefore, in the design of hydraulic fracturing and plugging, the viscosity of the fracturing fluid should be reasonably selected to balance the relationship between plugging efficiency and wellbore mechanical stability.
5. Conclusions
While numerous successful field cases have been documented in the drilling industry, the fundamental mechanisms of wellbore plugging—particularly the localized stresses within the wellbore and fractures—remain inadequately understood. In order to better understand the sealing of wellbore fractures, the finite element model presented in this paper shows local circumferential stress. The impact of various parameters was analyzed using simulation results, leading to the following conclusions.
- (1)
- As the horizontal stress difference (SH/Sh) increases, the peak Mises stress around the wellbore significantly increases, and the anisotropy of stress exacerbates the risk of wellbore instability. When SH/Sh > 1.4, it is necessary to strengthen wellbore reinforcement and pressure control and optimize wellbore orientation to avoid high stress concentration areas. The stress isotropic (SH/Sh = 1) condition has the best stability.
- (2)
- The increase in reservoir elastic modulus (10–30 GPa) leads to an increase in Mises stress around the wellbore, with significant stress concentration at the 30–40° azimuth angle. High modulus reservoirs (>20 GPa) are prone to wellbore instability due to increased rigidity, and it is necessary to optimize sealing materials to alleviate stress concentration; low modulus reservoirs (<15 GPa) have strong deformation ability but need to prevent wellbore shrinkage. Elastic modulus is a key control parameter for sealing design and wellbore stability.
- (3)
- An increase in Poisson’s ratio (0.20~0.30) leads to a decrease in Mises stress around the wellbore, while low Poisson’s ratio (<0.25) results in more significant stress concentration in the reservoir, requiring strengthened sealing measures; high Poisson’s ratio (>0.28) reservoirs have a smoother stress distribution and better stability. Compared to the difference in geostress and elastic modulus, Poisson’s ratio has a weaker impact, but it is still necessary to optimize the sealing design in low Poisson’s ratio reservoirs to reduce the risk of instability.
- (4)
- The increase in viscosity of fracturing fluid leads to an increase in Mises stress around the well, with the most significant stress concentration occurring at a 40° azimuth angle. High viscosity (>500 mPa · s) fracturing fluid exacerbates wellbore stress concentration, and viscosity optimization is needed to balance sealing effectiveness and stability; although low viscosity (<10 mPa · s) results in lower stress, the sealing efficiency may be insufficient. The influence of viscosity is weaker than that of stress difference and elastic modulus, but it still needs to be reasonably controlled during construction.
In practical applications, the damage evolution process of prefabricated fractures is more complex, and fracture propagation has different dynamic characteristics. Therefore, this factor should be considered in practical applications, and the selection of wellbore direction and LCM should be optimized based on numerical simulation and actual site conditions.
Author Contributions
Methodology, E.A., Q.L., Z.L., L.W. and C.M.; Software, E.A., Z.L. and L.W.; Investigation, L.W. and C.M.; Writing—original draft, E.A. and Q.L.; Writing—review & editing, E.A. and Q.L. All authors have read and agreed to the published version of the manuscript.
Funding
This research was funded by CNPC Innovation Found (2024DQ02-0149).
Data Availability Statement
The original contributions presented in this study are included in the article. Further inquiries can be directed to the corresponding author.
Conflicts of Interest
The authors declare no conflict of interest.
References
- Jin, H.Z.; Peng, Q.Y. Research on the development of modern drilling technology and the trend of exploration and development of oil and gas resources. China Pet. Chem. Stand. Qual. 2013, 33, 187. [Google Scholar]
- Kang, Y.L.; Xu, C.Y.; Tang, L.; Li, S.; Li, D. Constructing a tough shield around the wellbore: Theory and method for lost circulation control. Pet. Explor. Dev. 2014, 41, 473–479. [Google Scholar] [CrossRef]
- Wei, J.F.; Liu, S.Q. Research on the influence of international oil price fluctuation on China’s oil market under the new situation. Enterp. Hebei 2024, 7, 29–32. [Google Scholar]
- Peter, J.B.; Reddy, B.R.; Hillfiger, M.; O’connell, T.P.; Thaemlitz, C. Functionalized nanosilicas as shale inhibitors in water-based drilling fluids. In Proceedings of the Offshore Technology Conference, SPE-26902. Houston, TX, USA, 2–5 May 2016. [Google Scholar]
- Huang, N.S. Research progress on the mechanism of improving the pressure-bearing capacity of fractured formation. Drill. Prod. Technol. 2023, 46, 133–138. [Google Scholar]
- Lv, K.H. Study and Application of Lost Circulation Resistance and Control Technology During Drilling; China University of Petroleum: Beijing, China, 2007. [Google Scholar]
- Wang, G. Theory and Technology on Drilling Fluids for Wellbore Strengthening; Southwest Petroleum University: Chengdu, China, 2012. [Google Scholar]
- Li, J.; Qiu, Z.S.; Song, D.D.; Liu, J.; Zhong, H.; Wang, W. Numeric simulation of factors affecting the strengthening of borehole wall. Drill. Fluid Complet. Fluid 2017, 34, 1–8. [Google Scholar]
- Wang, H.; Towler, B.F.; Mohamed, S. Fractured wellbore stress analysis: Sealing cracks to strengthen a wellbore. In Proceedings of the SPE/IADC Drilling Conference, SPE-104947-MS. Amsterdam, The Netherlands, 20–22 February 2007. [Google Scholar]
- Cook, J.; Growcock, F.; Guo, Q.; Hodder, M.; van Oort, E. Stabilizing the well-bore to prevent lost cicrulation. Oilfield Rev. 2011, 23, 26–35. [Google Scholar]
- Sun, J.; Bai, Y.; Cheng, R.; Lyu, K.; Liu, F.; Feng, J.; Lei, S.; Zhang, J.; Hao, H. Research progress and prospect of plugging technologies for fractured formation with severe lost circulation. Pet. Explor. Dev. 2021, 48, 630–638. [Google Scholar] [CrossRef]
- Su, X.M.; Lian, Z.H.; Fang, J.W.; Xiong, H.; Wu, R.; Yuan, Y. Lost circulation material for abnormally high temperature and pressure fractured-vuggy carbonate reservoirs in Tazhong block, Tarim Basin, NW China. Pet. Explor. Dev. 2019, 46, 165–172. [Google Scholar] [CrossRef]
- Chen, W.; Liu, J.; Peng, W.; Zhao, Y.; Luo, S.; Wan, W.; Wu, Q.; Wang, Y.; Li, S.; Tang, X.; et al. Aging deterioration of mechanical properties on coal-rock combinations considering hydro-chemical corrosion. Energy 2023, 282, 128770. [Google Scholar] [CrossRef]
- Lu, X.C.; Fan, B.T.; Zhao, Z.J. New research progress on wellbore strengthening technology. Drill. Fluid Complet. Fluid 2013, 29, 74–78. [Google Scholar]
- Li, S.; Kang, Y.L.; Li, D.Q.; Zhang, D.; Zhou, C. Diagnosis system for characterizing lost circulation in troublesome formations. Drill. Fluid Complet. Fluid 2015, 32, 89–95. [Google Scholar]
- Wang, Y.Z.; Hou, B.; Wang, D.; Jia, Z.H. Features of fracture height propagation in cross-layer fracturing of shale oil reservoirs. Pet. Elplor. Dev. 2021, 48, 402–410. [Google Scholar] [CrossRef]
- Song, D.D.; Qiu, Z.S.; Wang, C.; Liu, J.; Wang, Q.; Zhong, H.; Zhao, X. Numerical simulation of borehole wall strengthening using ABAQUA. Drill. Fluid Complet. Fluid 2016, 33, 15–19. [Google Scholar]
- Morita, N.; Black, A.D.; Fuh, G.F. Theory of Lost Circulation Pressure. In Proceedings of the SPE Annual Technical Conference and Exhibition, SPE-20409-MS. New Orleans, LA, USA, 23–26 September 1990. SPE-20409-MS. [Google Scholar]
- Wang, F.W.; Liu, K.Q.; Qiu, Z.S. Research progress of wellbore stability analysis model in foreign. J. Yanan Univ. (Nat. Sci. Ed.) 2014, 1, 82–87. [Google Scholar]
- Dugdale, D.S. Yielding of steel sheets containing slits. J. Mech. Phys. Solids 1960, 8, 100–104. [Google Scholar] [CrossRef]
- Chen, Z.; Bunger, A.; Zhang, X.; Jeffrey, R.G. Cohesive zone finite element-based modeling of hydraulic fractures. Acta Mech. Solida Sin. 2009, 22, 443–452. [Google Scholar] [CrossRef]
- Roe, K.L.; Siegmund, T. An irreversible cohesive zone model for interface fatigue crack growth simulation. Eng. Fract. Mech. 2003, 70, 209–232. [Google Scholar] [CrossRef]
- Salehi, S.; Nygaard, R. Full fluid-solid cohesive finite-element model to simulate near wellbore fractures. J. Energy Resour. Technol. 2015, 137, 012903. [Google Scholar] [CrossRef]
- Carrier, B.; Granet, S. Numerical modeling of hydraulic fracture problem in permeable medium using cohesive zone model. Eng. Fract. Mech. 2012, 79, 312–328. [Google Scholar] [CrossRef]
- Snow, D.T. Anisotropie permeability of fractured media. Water Resour. Res. 1969, 5, 1273–1289. [Google Scholar] [CrossRef]
- Han, L.; Shi, X.; Ni, H.J.; Zhang, W.D.; Ge, X.X.; Yang, Y.Y.; Zhang, J.C.; Yu, T.X.; Lu, M.J.; Poplygin, V. Optimization of supercritical CO2 fracturing based on random forest—Particle swarm optimization model and pre-existing fracture network. SPE J. 2024, 29, 5957–5975. [Google Scholar] [CrossRef]
- Biot, M.A. General theory of three-dimensional consolidation. J. Appl. Phys. 1941, 12, 155–164. [Google Scholar] [CrossRef]
- Feng, Y.C.; Gray, K.E. A parametric study for wellbore strengthening. J. Nat. Gas Sci. Eng. 2016, 30, 350–363. [Google Scholar] [CrossRef]
- Alberty, M.W.; Mclean, M.R. A physical model for stress cages. In Proceedings of the SPE Annual Technical Conference and Exhibition, Houston, TX, USA, 26–29 September 2004. [Google Scholar]
- Wang, H.; Soliman, M.Y.; Tower, B.F. Investigation of factors for strengthening a wellbore by propping fractures. SPE Drill. Complet. 2009, 24, 441–451. [Google Scholar] [CrossRef]
- Jiang, C.Y.; Wang, X.G.; Jourde, H. Dam leakage potential related to karstification in limestone bedrock: Effects of temperature and stress-induced anisotropy. J. Hydrol. 2025, 657, 133061. [Google Scholar] [CrossRef]

Disclaimer/Publisher’s Note: The statements, opinions and data contained in all publications are solely those of the individual author(s) and contributor(s) and not of MDPI and/or the editor(s). MDPI and/or the editor(s) disclaim responsibility for any injury to people or property resulting from any ideas, methods, instructions or products referred to in the content. |
© 2025 by the authors. Licensee MDPI, Basel, Switzerland. This article is an open access article distributed under the terms and conditions of the Creative Commons Attribution (CC BY) license (https://creativecommons.org/licenses/by/4.0/).