Abstract
This paper presents the development and analysis of a planar microfluidic microwave sensor featuring three circular complementary split-ring resonators (CSRRs) fabricated on an RO3035 substrate. The sensor demonstrates enhanced sensitivity in characterizing liquids contained in a fine glass capillary tube by leveraging a novel configuration: a central 5-split-ring CSRR with a drilled hole to suspend the capillary, flanked by two 2-split-ring CSRRs to improve the band-stop filtering effect. The sensor’s performance is benchmarked against another CSRR-based microwave sensor with a similar configuration. High linearity is observed (R2 > 0.99), confirming its capability for precise ethanol concentration prediction. Compared to the replicated square CSRR design from the literature, the proposed sensor achieves a 35.22% improvement in sensitivity, with a frequency shift sensitivity of 567.41 kHz/% ethanol concentration versus 419.62 kHz/% for the reference sensor. The enhanced sensitivity is attributed to several key design strategies: increasing the intrinsic capacitance by enlarging the effective area and radial slot width to amplify edge capacitive effects, adding more split rings to intensify the resonance dip, placing additional CSRRs to improve energy extraction at resonance, and adopting circular CSRRs for superior electric field confinement. Additionally, the proposed design operates at a lower resonant frequency (2.234 GHz), which not only reduces dielectric and radiation losses but also enables the use of more cost-effective and power-efficient RF components. This advantage makes the sensor highly suitable for integration into portable and standalone sensing platforms.
1. Introduction
Microwave sensors have emerged as indispensable tools in the characterization of microfluidic elements due to their non-invasive nature, compactness, and ability to detect minute changes in dielectric properties [1,2,3,4,5]. These features make them particularly well-suited for applications involving biomedical diagnostics, chemical concentration analysis, and lab-on-chip platforms [6,7,8].
An essential aspect of the effectiveness of microwave sensors lies in their sensitivity, particularly when detecting small changes in the dielectric properties of liquids confined within microchannels or capillary tubes. Sensitivity, in this context, refers to the sensor’s ability to detect slight shifts in the resonant frequency fr or transmission characteristics resulting from small permittivity variations in the test sample caused by changes in the analyte concentration. For sensors that operate based on shifts in fr, sensitivity can be quantified as follows [9]:
where Δf denotes the change in resonant frequency fr corresponding to a change in analyte concentration ΔC within the liquid sample. Higher sensitivity translates to better resolution, enabling the distinction between materials with closely spaced dielectric constants, a critical requirement in biomedical and chemical analysis.
However, many existing microwave sensors suffer from limited sensitivity, which hampers their precision and applicability in detecting low-concentration analytes. Recent studies have highlighted this limitation. For instance, Boybay et al. [10] developed a microwave–microfluidic platform for droplet sensing and heating and reported challenges in achieving distinct resonant frequency shifts due to weak electromagnetic field confinement and a limited interaction volume with nanoliter-scale droplets. The sensor’s sensitivity was constrained by the small sample volume and the difficulty in enhancing localized microwave fields, hindering accurate detection of dilute analytes. Similarly, Wang et al. [11] examined the influence of liquid-level variation and channel deformation on microwave resonance sensing. They found that sensitivity is affected by both the interaction volume and the need for precise control over the microfluidic environment, posing challenges in achieving consistent, high sensitivity in practical sensing scenarios. Furthermore, the study by Oh et al. [12] introduced a compact, metamaterial-based microwave sensor for dielectric constant measurement using a circular split-ring resonator (SRR). The sensor operates by tracking resonance frequency shifts induced by the permittivity of materials placed at the center of the SRR, where electric fields are most concentrated. While the sensor demonstrated good accuracy and linearity for distinguishing materials with widely spaced dielectric constants, the observed frequency shifts were relatively moderate, suggesting that the design may lack the sensitivity required to resolve small or incremental changes, especially in fluids or biological samples where subtle dielectric variations are crucial.
These limitations highlight the need for new sensor designs that can significantly enhance sensitivity. One promising strategy is the use of circular CSRRs with multiple split rings, which can generate stronger localized electric fields and improve capacitive coupling with the test medium. In this work, a novel planar microfluidic microwave sensor incorporating multiple circular CSRRs is proposed. As demonstrated in the following section, the proposed design achieves up to a 35.22% improvement in sensitivity when benchmarked against a replicated sensor from the literature with a comparable configuration.
The design by Chuma et al. [13] was chosen as the reference for benchmarking because it closely matches our proposed sensor in terms of layout dimensions (length and width), substrate material (Rogers RO3035), and fundamental sensing principle. Both sensors utilize CSRR structures that detect permittivity changes through shifts in resonance dips in the transmission coefficient (S21). This ensures that observed performance differences can be directly attributed to geometric enhancements, rather than material or baseline disparities. Furthermore, the design in [13] has been widely referenced and replicated in the literature, confirming its validity and relevance as a benchmark.
While prior works, such as Al-Gburi et al. [14] and Ebrahimi et al. [15], have demonstrated the potential of CSRR-based sensors, they did not employ the combination of structural enhancements presented in this work. The study in [14] focused on the classification of distinct substances, without evaluating sensor sensitivity through concentration gradients or regression-based analysis. The model in [15], on the other hand, emphasized the role of intrinsic capacitance (CR) but did not implement circular geometries or coupled side resonators to maximize this effect. In contrast, our design incorporates multiple circular CSRRs, optimized radial geometry, and side resonators to enhance both electric field confinement and resonant energy extraction, resulting in superior sensitivity confirmed through experimental regression analysis.
2. Sensor Design
When selecting an appropriate planar structure to generate resonance, several critical factors must be considered, including manufacturing cost, portability, and most importantly, sensitivity. It is to be noted that cost and portability often conflict: Compact devices tend to incur higher production costs due to the complexity of miniaturization, while cost-effective designs typically involve larger physical dimensions. This trade-off is partly due to the proportional relationship between the cost of microwave systems and their operating frequency. To ensure affordability, the operating frequency should be kept relatively low. However, resonant structures functioning at lower frequencies generally require larger physical dimensions, owing to the inverse relationship between frequency and electrical size.
A practical strategy to address this issue involves the use of split-ring resonators (SRRs) or complementary split-ring resonators (CSRRs), which are capable of supporting resonance at wavelengths significantly larger than their physical dimensions. This characteristic makes them ideal for maintaining both a low operating frequency and a compact form factor, which is particularly advantageous in portable and low-cost sensing applications [16].
In this work, CSRRs are selected due to their enhanced interaction with dielectric materials compared to SRRs. Unlike SRRs, CSRRs are electrically coupled to the transmission line, making them highly responsive to variations in the permittivity of nearby materials [17]. Among the available CSRR geometries, the circular configuration was chosen for its superior sensitivity, as demonstrated in previous studies [18,19]. This enhanced sensitivity is primarily attributed to the circular geometry’s ability to produce a more homogeneous electric field distribution and stronger field confinement within the sensing region. Furthermore, the absence of sharp corners reduces current crowding and energy loss, resulting in higher quality factors and sharper resonance dips. Sensitivity is also influenced by the depth of the transmission dip, with a lower dip corresponding to stronger resonance. Circular CSRRs typically produce deeper transmission dips than their non-circular counterparts, further supporting their suitability for precision sensing applications.
Following the selection of circular geometry, the structure was further optimized for sensitivity using the model introduced by Ebrahimi et al. [15], who proposed a sensitivity coefficient, β, to quantify the responsiveness of a CSRR-based sensor integrated with a transmission line:
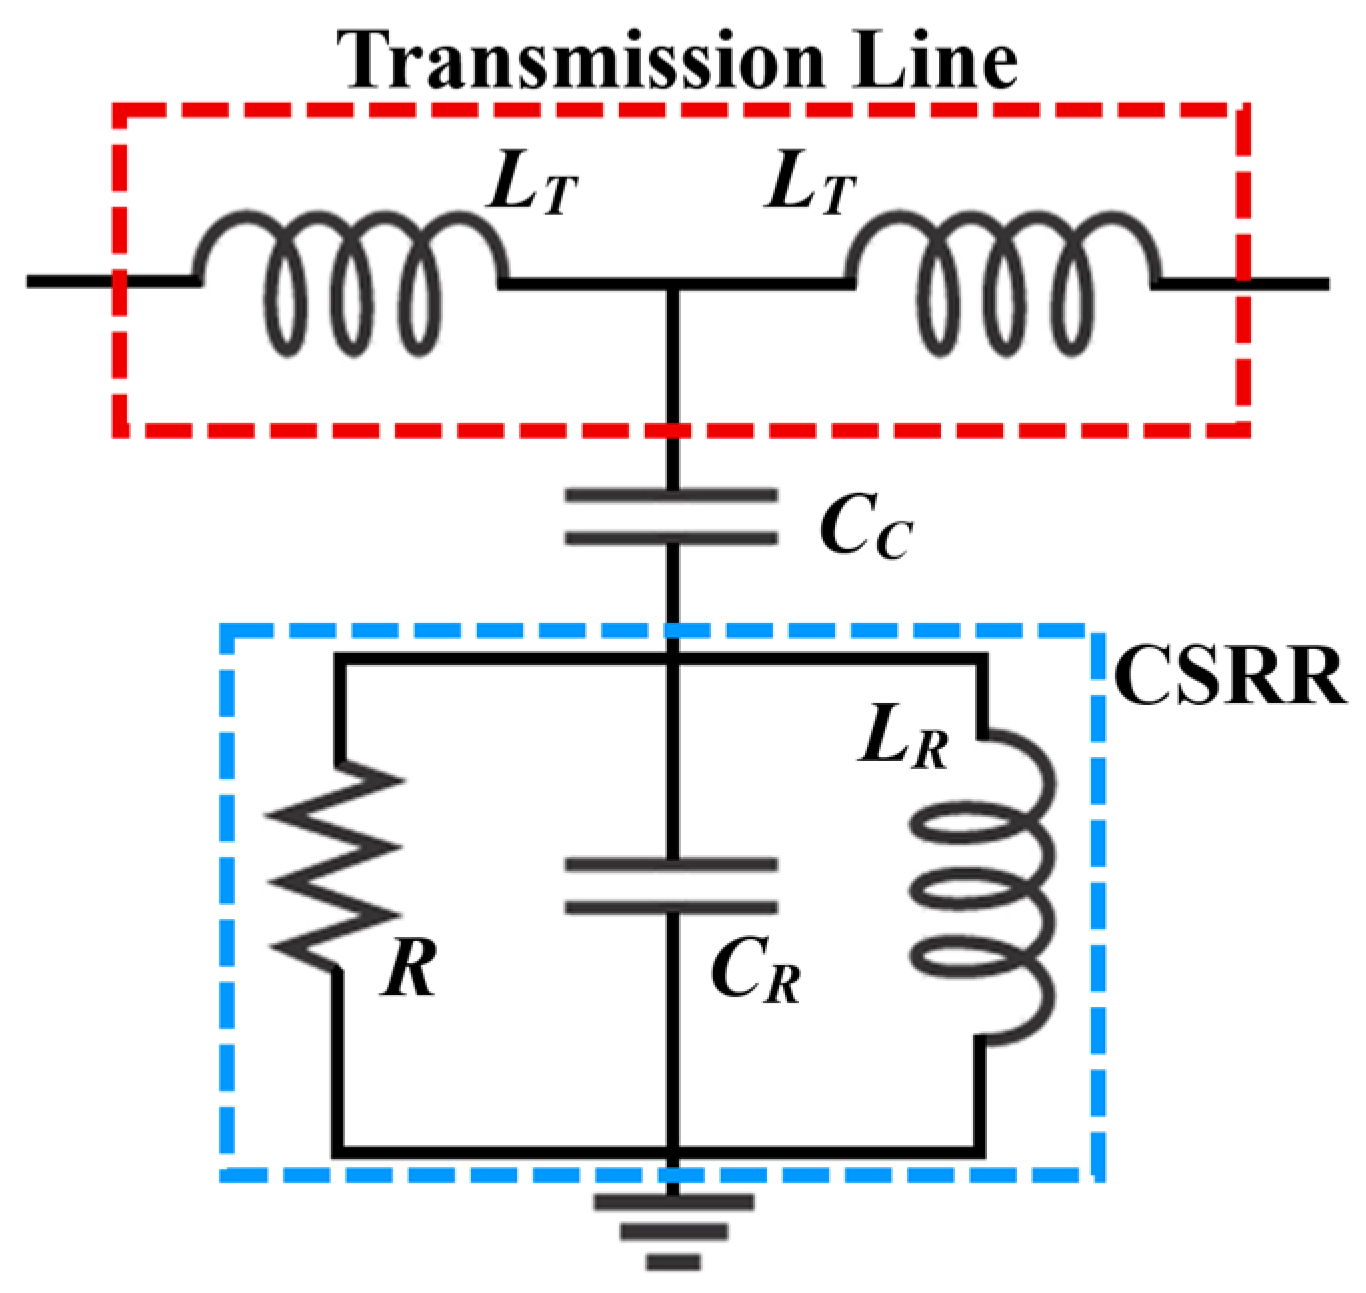
where represents a constant related to the change in capacitance resulting from loading the CSRR with a dielectric sample, CR the intrinsic capacitance of the CSRR arising from the edge capacitive effect between the CSRR patch and the surrounding ground plane, and CC refers to the coupling capacitance between the CSRR and the transmission line. The equivalent circuit model illustrated in Figure 1 graphically depicts how these capacitances, along with other lumped elements such as resistance R and inductances LT and LR, are interconnected within the sensor architecture. In this model, the resistance R represents the combined effect of conductor losses (due to the copper cladding) and dielectric losses (from the substrate), both of which influence the resonance dip depth and Q-factor. The inductance LR corresponds to the magnetic energy stored in the CSRR and depends on its geometry, specifically the number of split rings, ring radius, trace width, and inter-ring spacing. Additionally, the model includes two identical transmission line inductances LT, representing the inductive reactance of the microstrip sections on either side of the resonator. These are dictated by the substrate height, relative permittivity, and the trace width, as described in standard microstrip theory. Together, R, LR, and LT influence the resonator’s spectral shape and energy coupling efficiency.

Figure 1.
Equivalent circuit model of the CSRR-based microwave sensor.
Equation (2) indicates that both CR and CC influence the sensor’s sensitivity. However, adjusting CC is not straightforward, as it is primarily dictated by the substrate’s thickness and material properties, which are typically fixed in the design process. As a result, enhancing CR presents a more feasible approach to improving sensitivity.
Capacitance CR is directly proportional to the effective area Ar and inversely proportional to the separation D, as described by the parallel-plate capacitance approximation:
where ε is the permittivity of the dielectric material filling the etched CSRR slot, and D is the radial width of the dielectric slot, i.e., the effective separation between adjacent conductive regions in the CSRR. While this is a simplified approximation, it provides useful physical insight into how geometric parameters influence the resonator’s capacitive behavior. For a single split ring, the effective area Ar corresponds to the cross-sectional area of the annular dielectric slot between the inner and outer edges of the ring. It can be approximated by
where B is the inner radius and D is the radial slot width. Substituting (4) into (3) yields
According to (5), increasing D and B leads to a larger intrinsic capacitance CR, which can therefore enhance the sensor’s sensitivity. In the proposed design, D = 0.325 mm and B = 1.3 mm, resulting in a slot geometry that supports high capacitance and enhanced sensing performance.
Further sensitivity improvement was achieved by increasing the number of concentric split rings in the CSRR structure. As shown by Al-Gburi et al. [14], a higher number of split rings enhances the band-stop filtering effect, resulting in a deeper transmission dip and stronger resonance. In this design, a five-ring CSRR configuration was adopted.
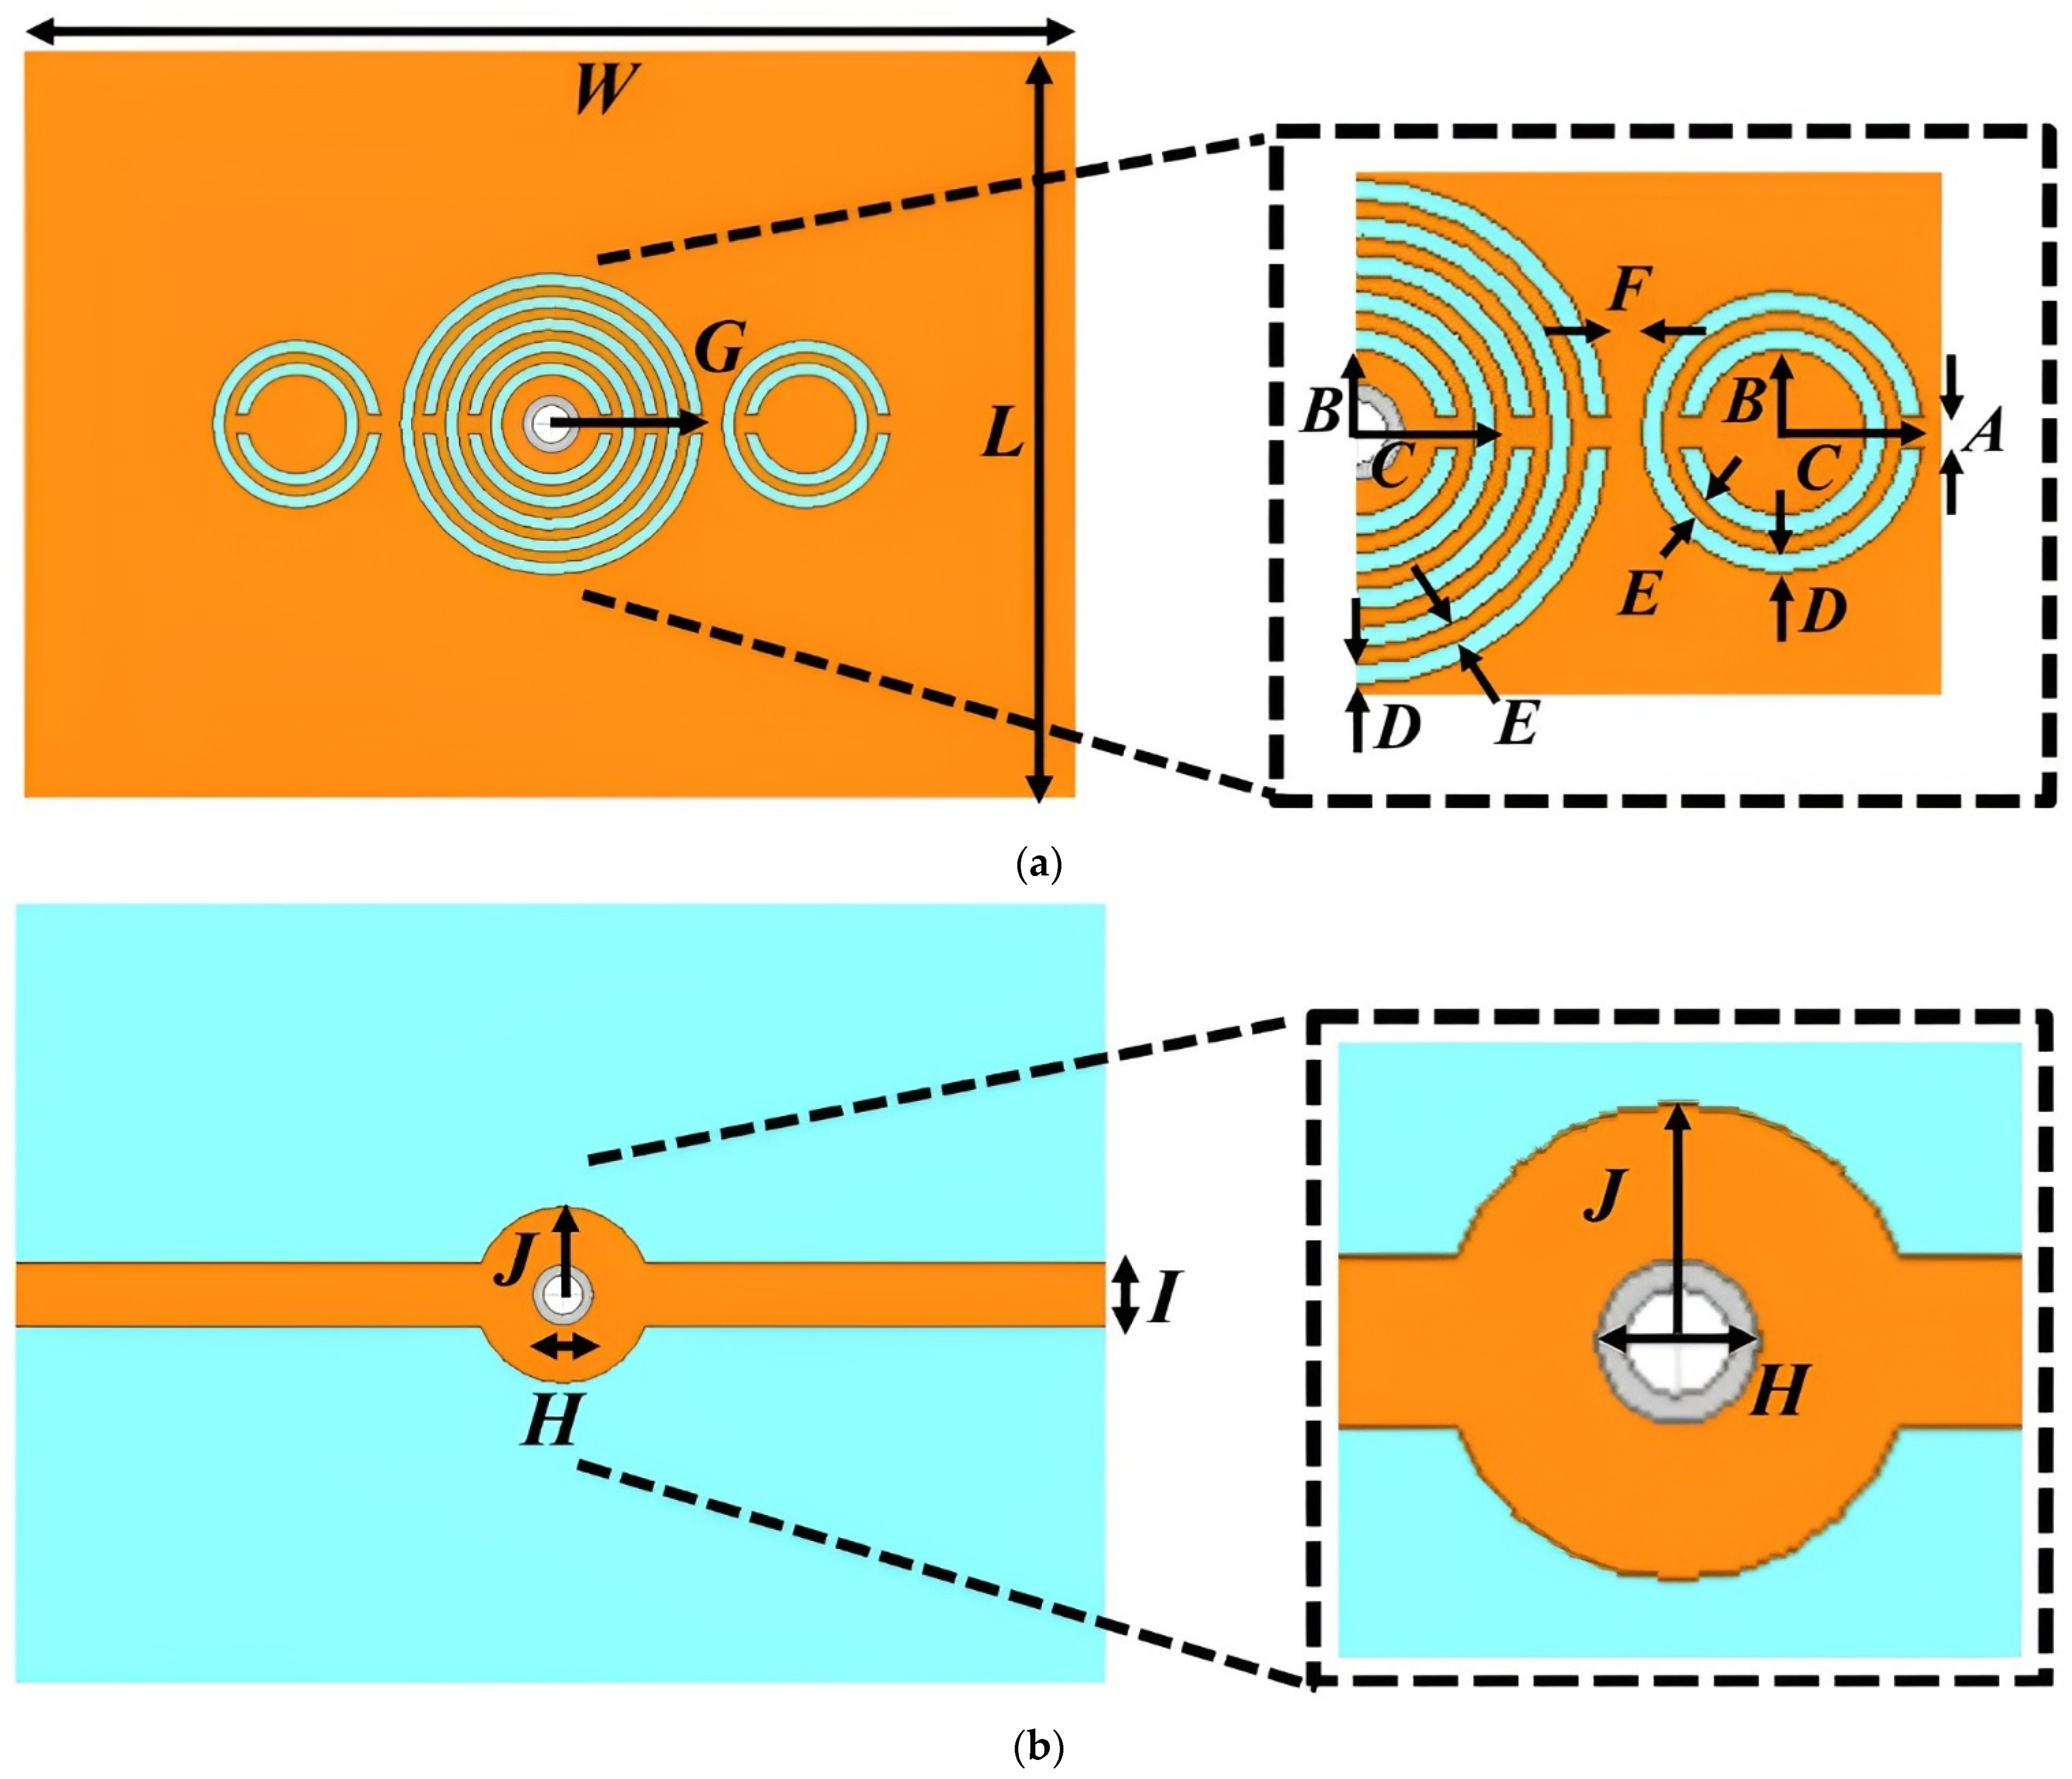
The final geometrical structure, obtained after a series of parametric adjustments for sensitivity optimization, is shown in Figure 2. The CSRR structure shown in Figure 2 is defined by the following geometric parameters:
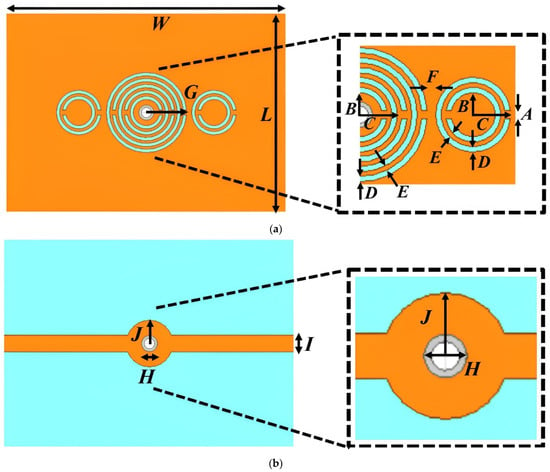
Figure 2.
Schematic diagram of the proposed sensor layout. (a) Ground plane with concentric circular CSRRs, where the inset shows a magnified view of the central resonator structure. (b) Microstrip line (top copper layer), with an inset highlighting the central coupling region. The dimensions are as follows: W = 28 mm, L = 20 mm, A = 0.5 mm, B = 1.3 mm, C = 2.215 mm, D = 0.325 mm, E = 0.265 mm, F = 0.5 mm, G = 3.985 mm, H = 1.5 mm, I = 1.6 mm, and J = 2.215 mm.
- A = 0.5 mm: width of the split-ring’s gap
- B = 1.3 mm: inner radius of the central ring
- C = 2.215 mm: radial midpoint of the innermost slot
- D = 0.325 mm: radial width of each dielectric slot
- E = 0.265 mm: separation between adjacent conductive regions
- F = 0.5 mm: width of the conductor between adjacent slots
- G = 3.985 mm: outer radius of the central CSRR
- H = 1.5 mm, I = 1.6 mm, J = 2.215 mm: dimensions related to the flanking 2-split-ring CSRRs.
These values were derived through iterative parametric sweeps in Ansoft HFSS v12.1 to optimize sensitivity. During this process, key performance indicators such as the resonance depth (S21 dip), frequency shift, and quality factor were analyzed. Values were selected to balance sensitivity, compactness, and fabrication feasibility. The outermost radius G of the central CSRR was set to 3.985 mm, fitting well within a compact rectangular planar substrate measuring W = 20 mm × L = 28 mm—a footprint suitable for handheld applications. A hole is drilled at the center of the CSRR to accommodate a glass capillary tube with an outer diameter of 1.4 ± 0.07 mm, an inner diameter of 1.0 mm, and a height of 90 mm. Although the minimum liquid column length was not experimentally characterized, we estimate that a column of at least 5 to 6 mm is required to fully engage the electromagnetic sensing region, based on the fringing field distribution surrounding the CSRR structure. The central 5-split-ring CSRR is flanked on both sides by two 2-split-ring CSRRs. As demonstrated in Figure 3, the presence of these two additional CSRRs enhances the band-stop filtering effect, resulting in a deeper transmission dip at resonance compared to a design that omits them. This deeper dip confirms improved energy extraction from the transmission line at resonance, enhancing detection robustness. This improvement is attributed to the increased coupling and resonant interaction among the CSRRs [20], which allows more energy to be extracted from the transmission line and suppressed at the resonant frequency. Additionally, the SMA connectors are positioned on opposite sides of the substrate to form a straight microstrip transmission path. This layout avoids the use of bent or meandered transmission lines, which are known to introduce radiation losses, impedance discontinuities, and signal reflections—factors that can degrade sensing accuracy and reduce Q-factor. By maintaining a straight line between ports, the proposed design ensures cleaner signal propagation and better measurement consistency compared to side-by-side connector layouts. The entire design was simulated using Ansoft HFSS v12.1 to evaluate its electromagnetic performance and verify the resonance behavior in the unloaded condition.
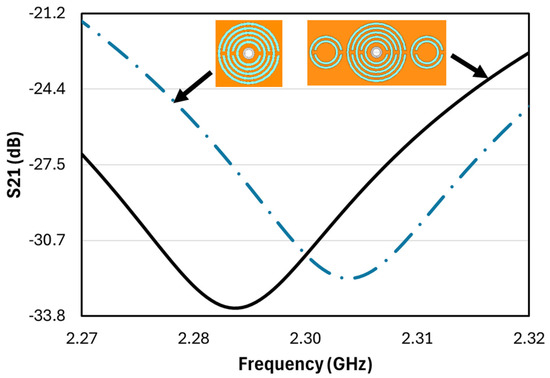
Figure 3.
Simulated S21 responses comparing the initial design, which features a single 5-split-ring CSRR at the center (dash-dotted line), with the final design, which includes two 2-split-ring CSRRs placed side-by-side alongside the central 5-split-ring CSRR (solid line). The transmission coefficient at the resonance frequency is −32.2 dB for the initial design and −33.5 dB for the final design.
3. Fabrication and Measurement
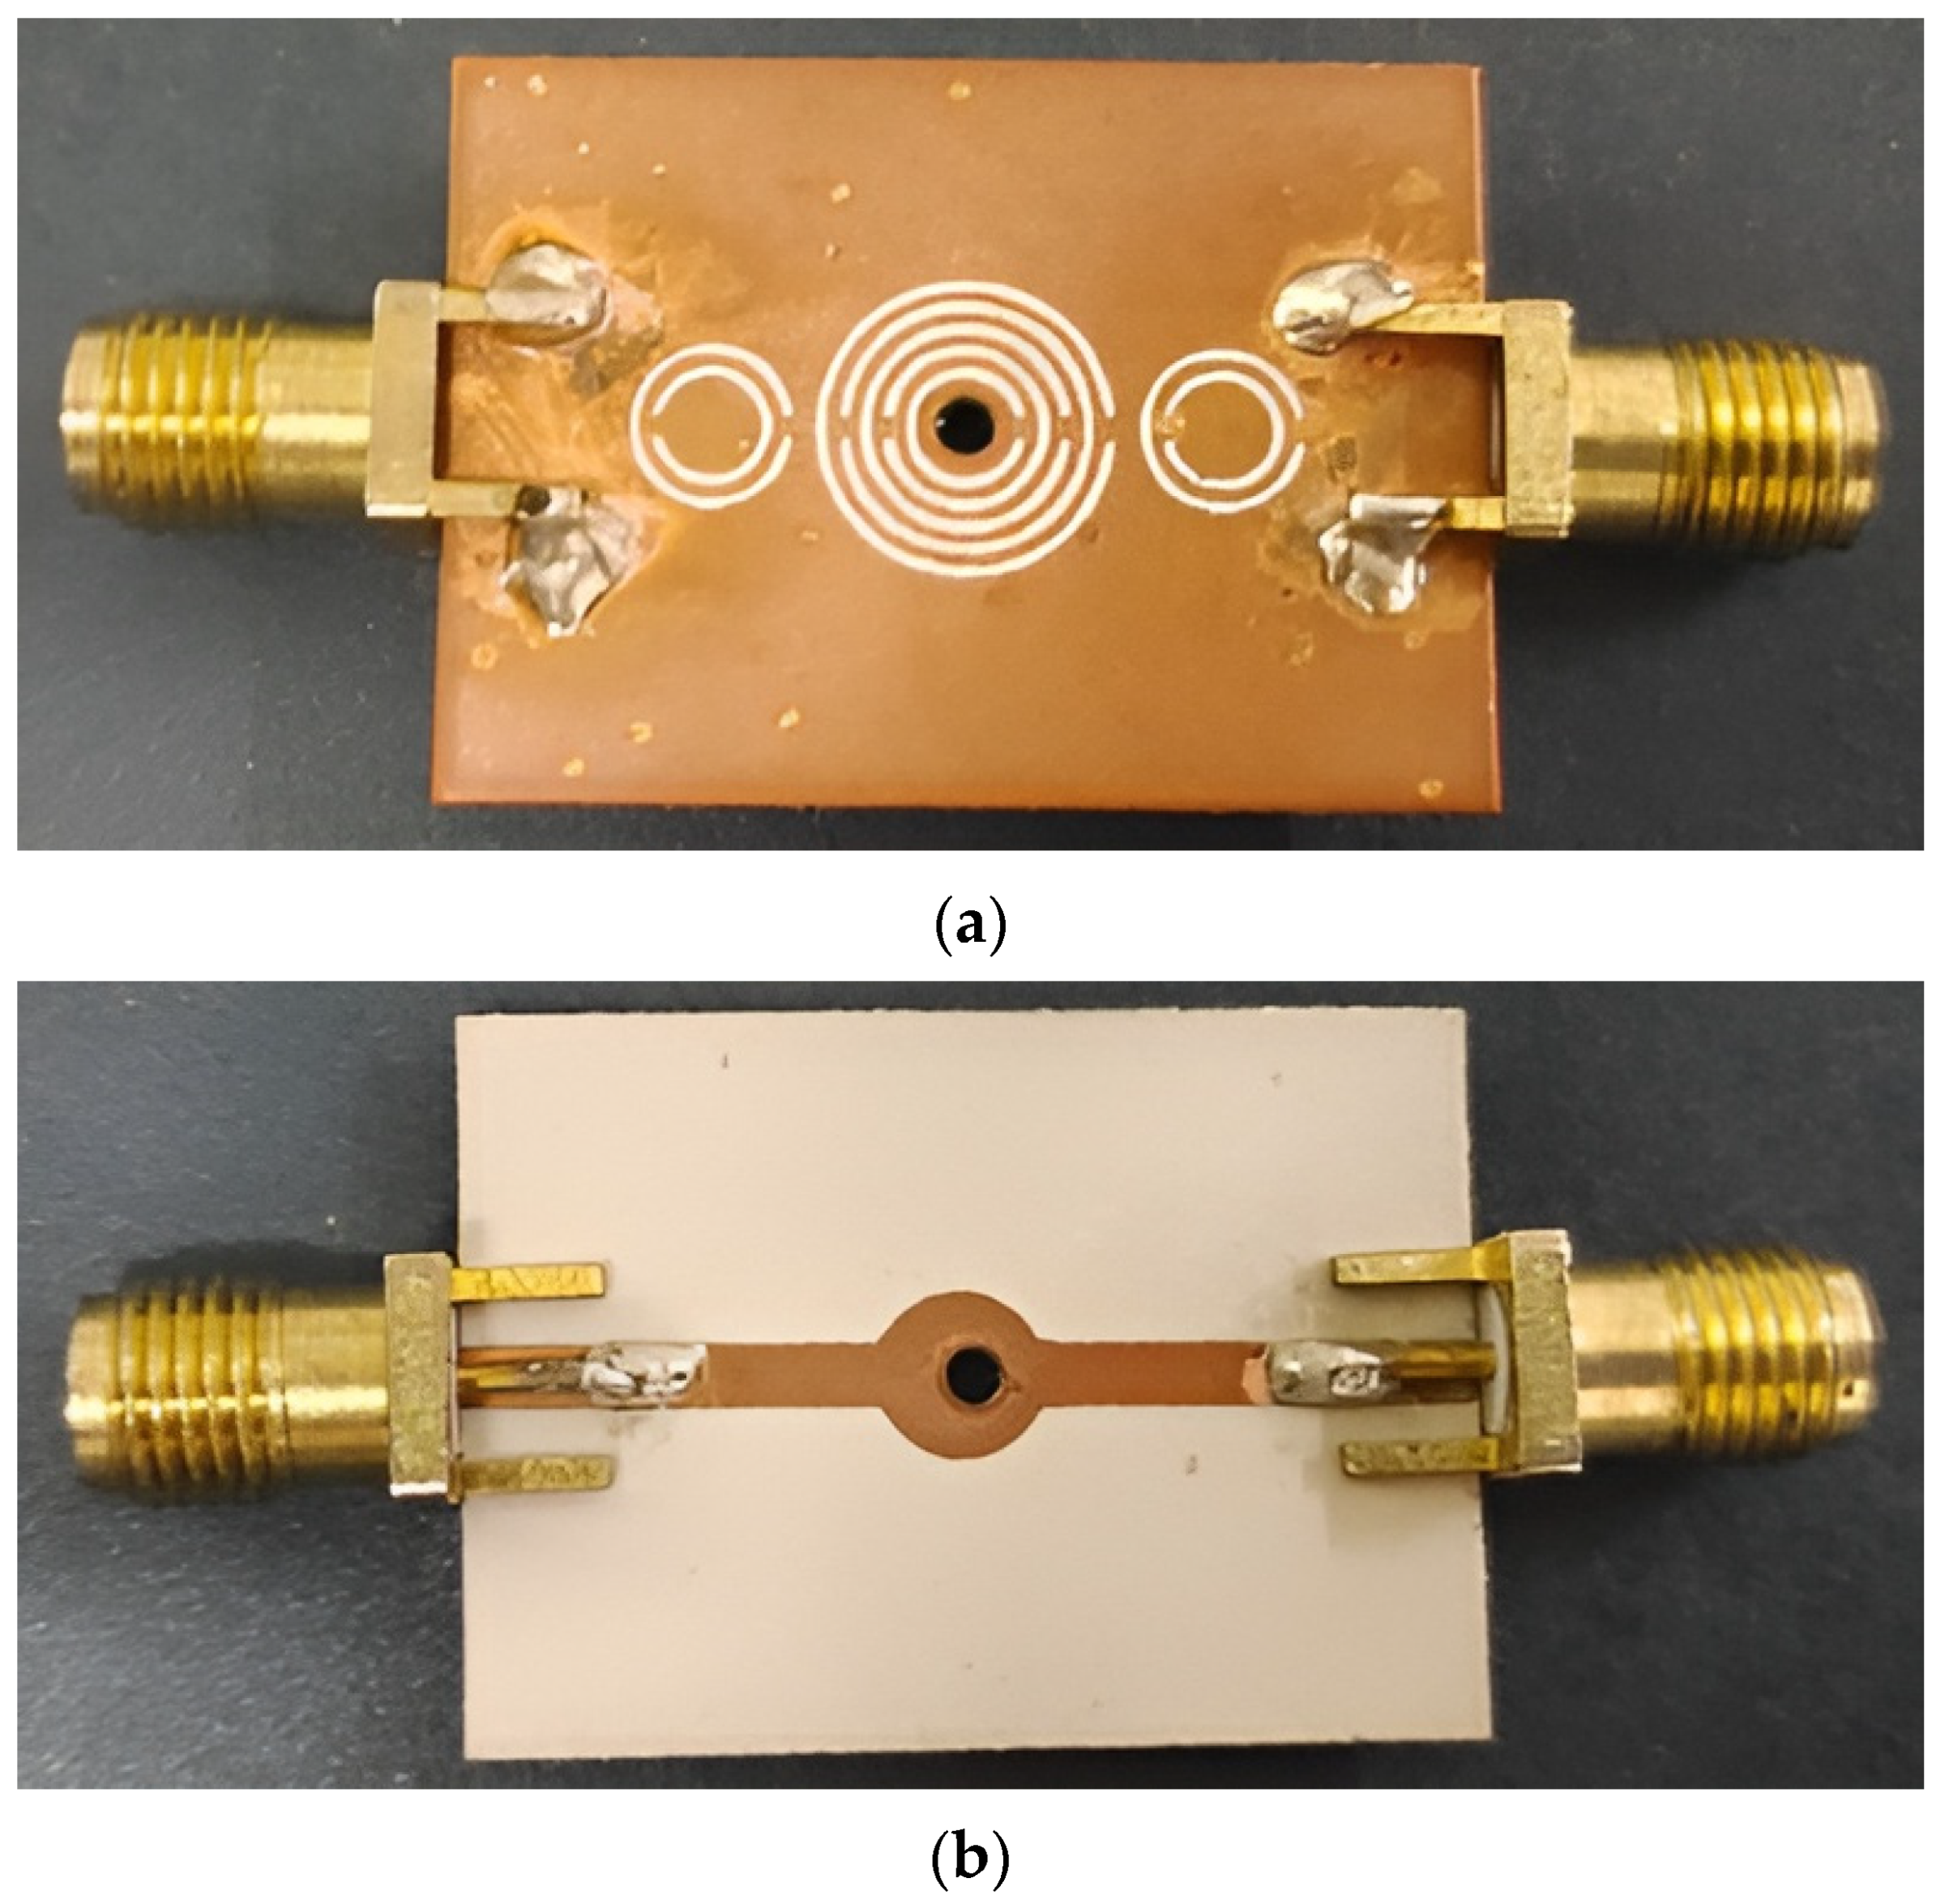
To validate the sensitivity of the proposed sensor, it was benchmarked against another planar CSRR-based sensor with a similar configuration. Figure 4 and Figure 5 illustrate both the proposed design and the benchmarked sensor, which was replicated from Chuma et al. [13].
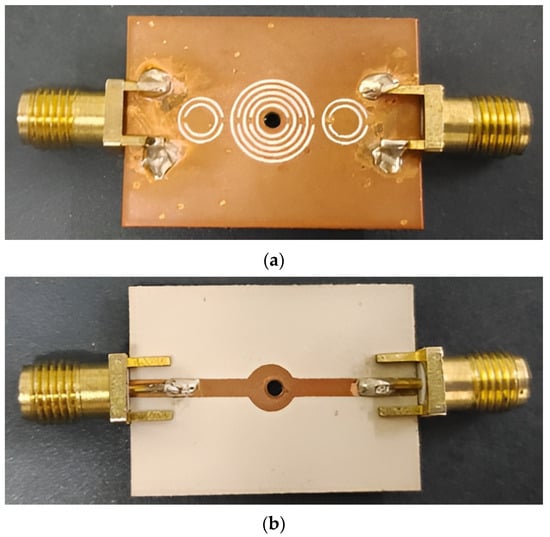
Figure 4.
The (a) top and (b) bottom views of the proposed sensor.

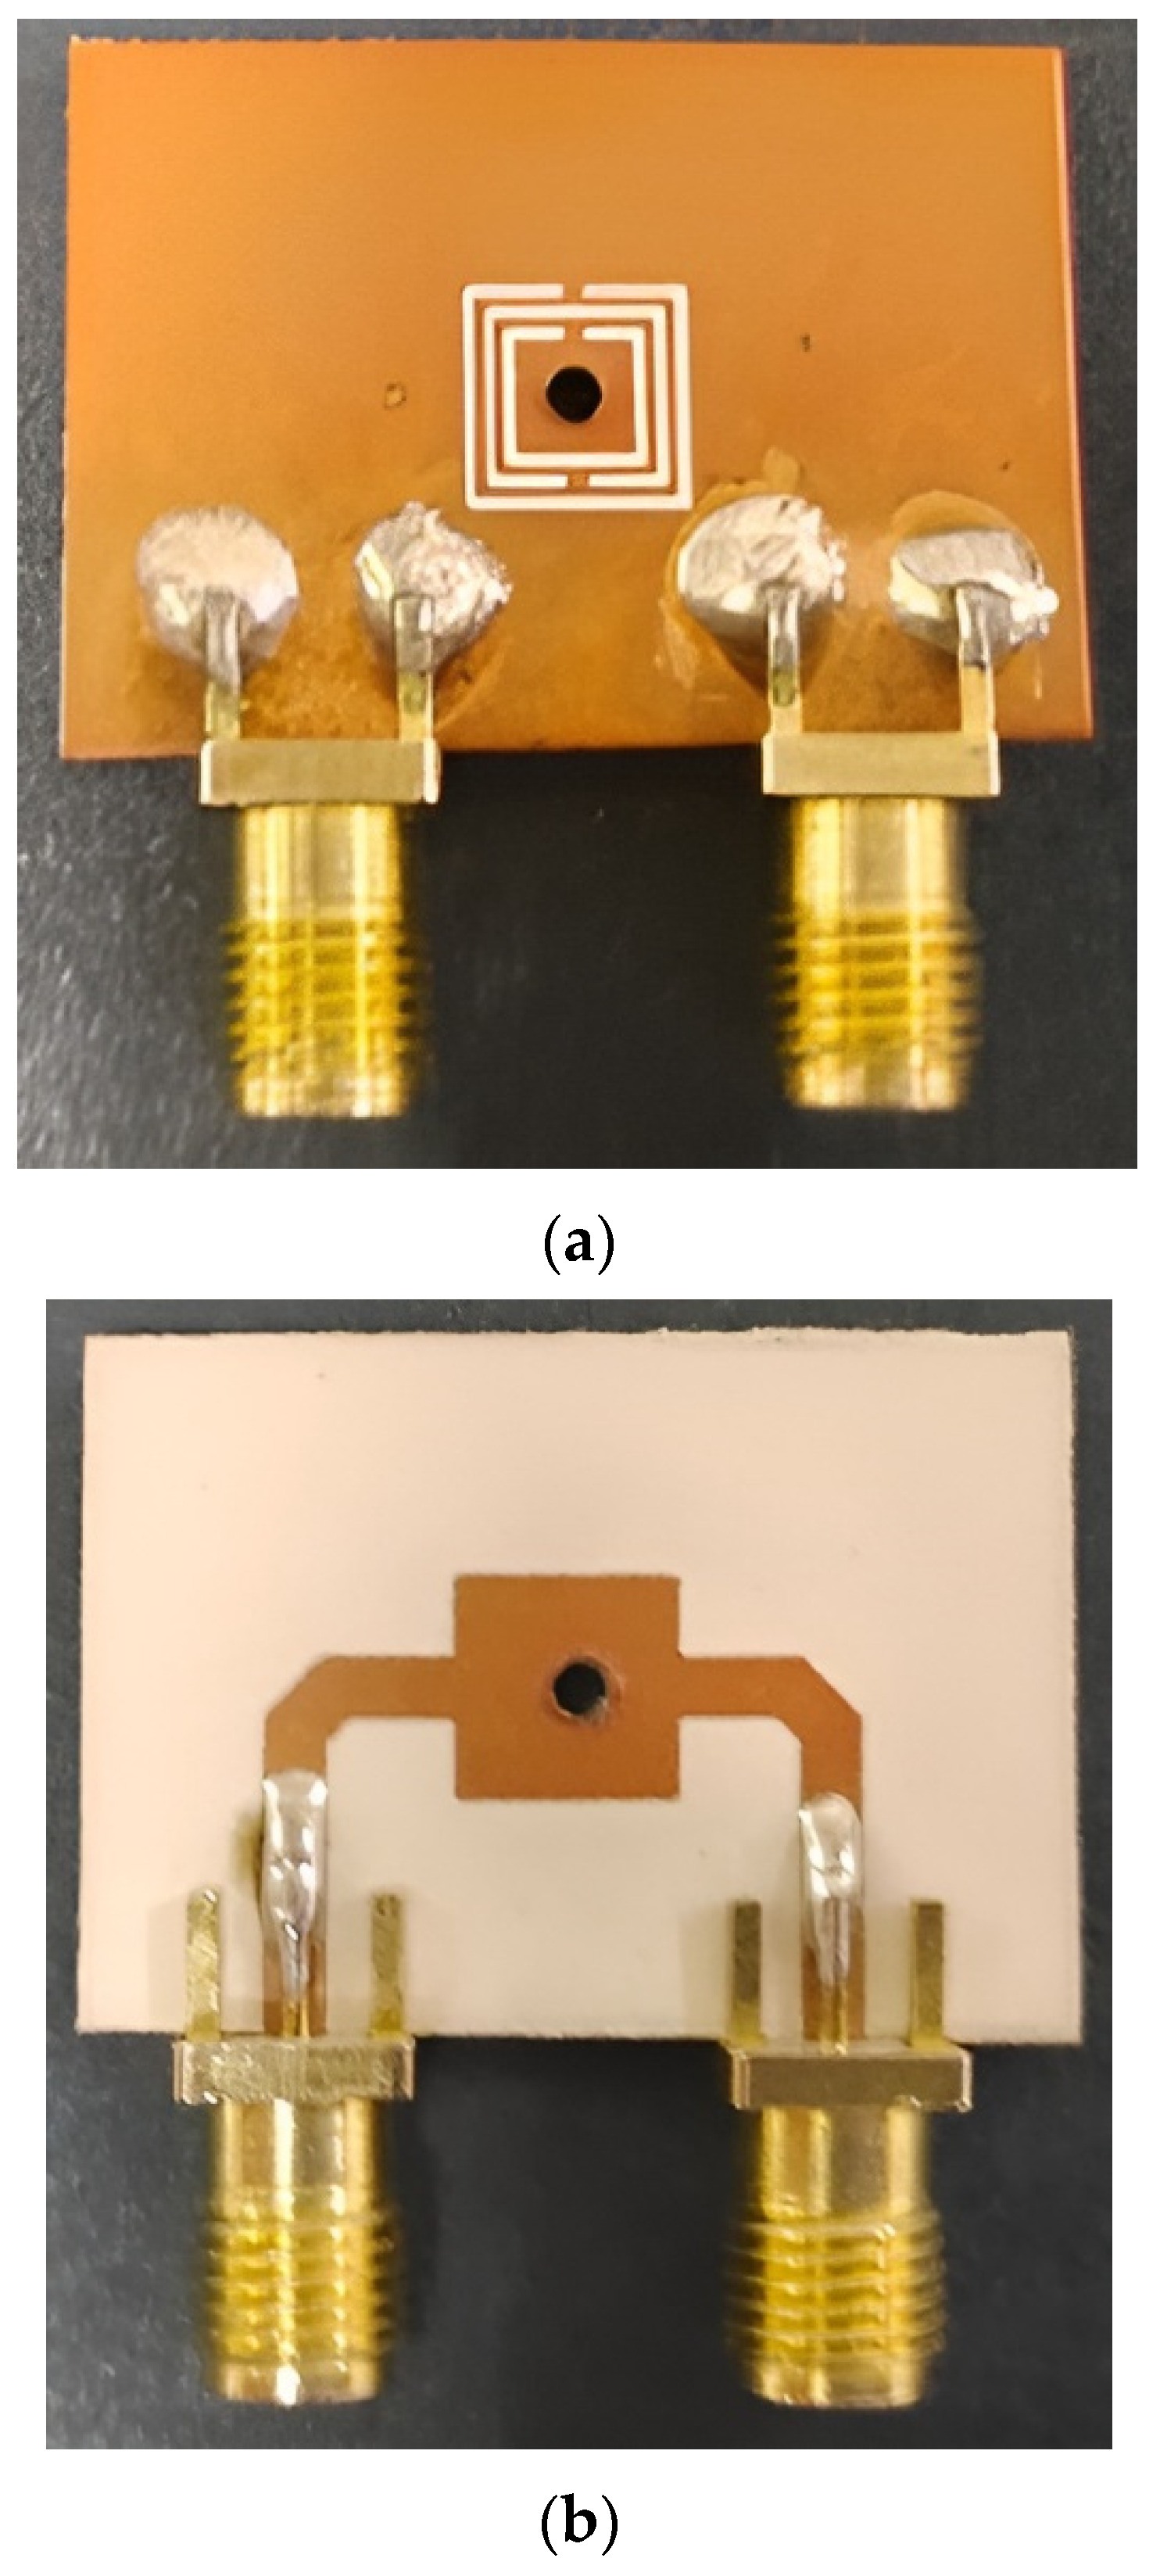
Figure 5.
The (a) top and (b) bottom views of the sensor replicated from Chuma et al. [13].
To ensure reproducibility and reduce reliance on external sources, key dimensions of the replicated sensor are summarized here. The layout follows a three-ring square CSRR structure based on Chuma et al. [13] and Mosbah et al. [21] and is illustrated in those works. The square rings have side lengths of 6.2 mm, 5.55 mm, 4.37 mm, and 3.19 mm, each separated by 0.5 mm gaps. The resonator is positioned 1.5 mm from the microstrip line. Additional layout dimensions include microstrip and ground plane lengths and spacings of 13.1 mm, 6.9 mm, 9.2 mm, 8.54 mm, 0.94 mm, 2.26 mm, 3.6 mm, 1.6 mm, 2.3 mm, 3.6 mm, 6.2 mm, and 2.94 mm. These values were implemented exactly as reported in the cited works and verified in HFSS before fabrication. While the layout is not redrawn here, it remains identical to that published in [13,21], ensuring compatibility and fair benchmarking.
Both sensors were fabricated on RO3035 substrates (dielectric constant = 3.5 ± 0.05, loss tangent = 0.0015, substrate thickness = 0.75 mm, and copper cladding thickness = 35 µm) with identical dimensions and constitutive properties. RO3035 is a high-frequency ceramic-filled PTFE laminate manufactured by Rogers Corporation (USA), designed specifically for RF and microwave circuits. Its excellent dimensional and dielectric stability, along with a low loss tangent, make it highly suitable for resonator-based sensing applications operating in the GHz range. It is noteworthy that the sensor designed by Chuma et al. [13] has been widely adopted as a reference in the literature due to its demonstrated high sensitivity. Consequently, design parameters that were not explicitly detailed in the original publication can be found in subsequent works that have also benchmarked this sensor, such as Mosbah et al. [21].
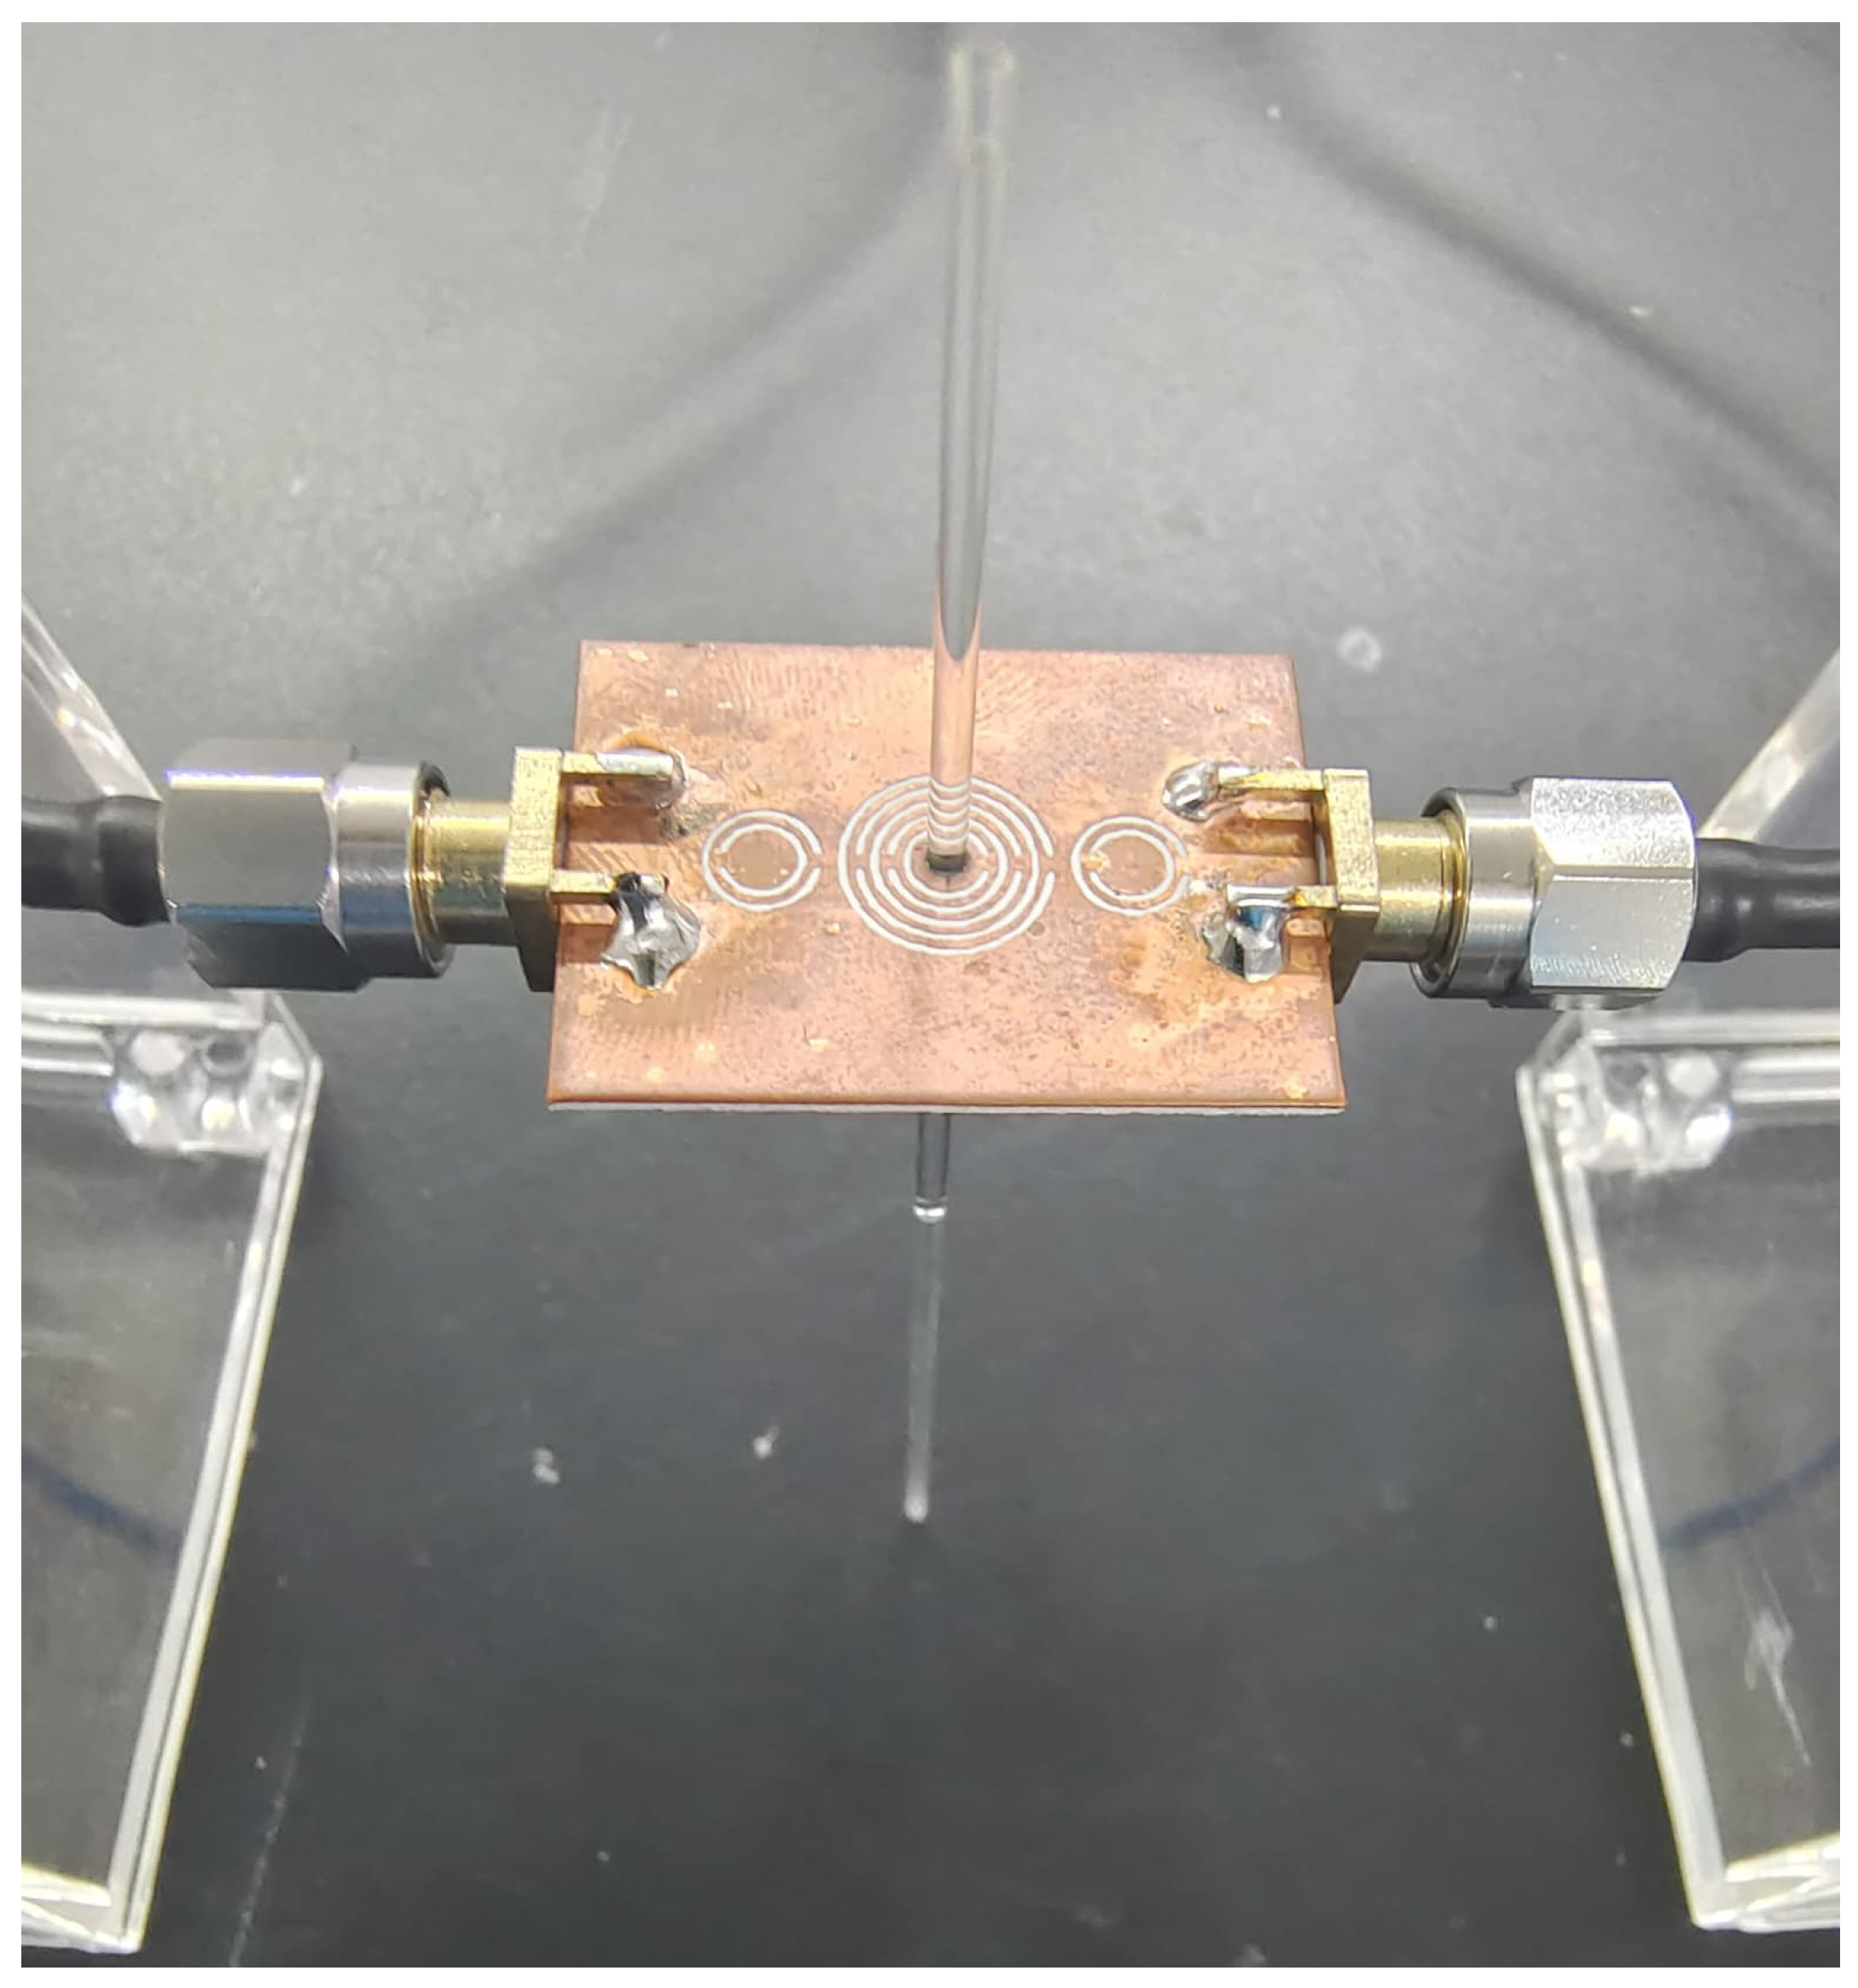
Figure 6 and Figure 7 illustrate the experimental setups for the proposed and benchmarked sensors, respectively. Both sensors were employed to measure ethanol concentration in ethanol–water mixtures. Ethanol was chosen to ensure consistency with the benchmark study by Chuma et al. [13], which also used ethanol–water mixtures to characterize sensor sensitivity. This allows for a direct comparison between the two designs. Ethanol is also widely used in microwave sensor calibration due to its availability, distinct dielectric contrast with water, and relevance in chemical and biomedical sensing applications. Seven mixtures with ethanol concentrations of 0%, 10%, 30%, 50%, 70%, 90%, and 100% (by volume) were prepared, with the remaining volume in each case consisting of water. The total volume in each volumetric flask was maintained at 50 mL. These solutions were then carefully transferred into the glass capillary tubes using a P100 micropipette. As the CSRR structure operates as a band-stop filter, the frequency responses of the transmission coefficients (S21 parameters) were measured using a vector network analyzer (VNA) for each ethanol concentration. As a passive structure, the sensor requires no external power supply. It is connected to the VNA via SMA connectors for both signal excitation and response measurement. All measurements were conducted at a controlled room temperature. While temperature effects on permittivity were not explicitly corrected, both the proposed and reference sensors were tested under identical environmental conditions, ensuring a fair comparison. Future work may explore temperature compensation to improve sensor robustness in real-world applications.
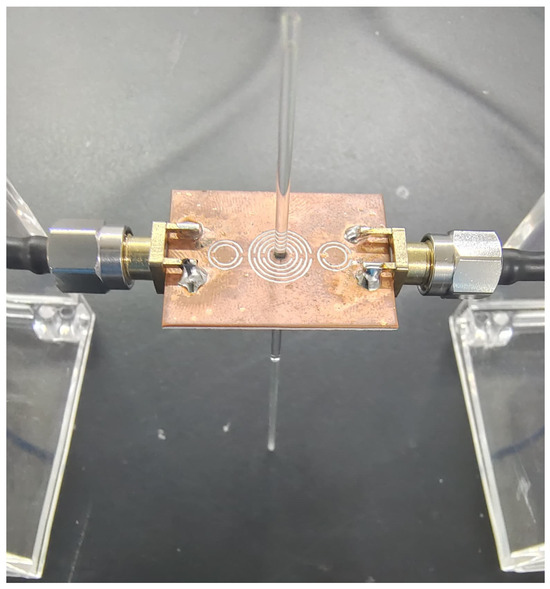
Figure 6.
Experimental setup for the proposed sensor.
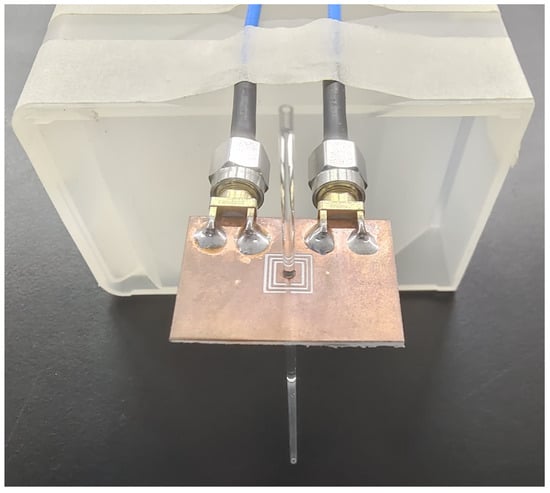
Figure 7.
Experimental setup for the sensor replicated from Chuma et al. [13].
The varying ethanol content in the water–ethanol mixtures can be identified by tracking the corresponding resonant frequencies of the sensor. This is because the CR of the CSRR is influenced by the dielectric constant of the test sample held in the glass capillary tube positioned at the center of the CSRR structure. To distinguish between the geometric contribution and the sample-related contribution to the total intrinsic capacitance, we denote the geometry-derived component as Ca. The overall intrinsic capacitance CR is then modeled as the sum of Ca and a permittivity-dependent term. With the inclusion of the glass capillary tube and the test sample, the CR can be approximated by:
where r represents the inner radius of the capillary tube, t the glass thickness, ε0 the vacuum permittivity, and εw and εe are the dielectric constants of water (~78.5) and ethanol (~24.5), respectively [22], while Pw and Pe denote their respective volumetric compositions in percent. The coefficient γ is an empirical factor (typically < 1) introduced to account for geometric and field-distribution effects that reduce the effective capacitance compared to the ideal case. While γ was not determined through explicit calibration, it was introduced to conceptually account for fringing field effects and non-uniform field distribution around the capillary. The equation is intended to provide a qualitative understanding of how the geometry and permittivity influence the capacitance, rather than serve as a quantitative extraction model. Therefore, the accuracy of the sensor’s sensitivity and regression results does not depend on the exact value of γ. As the ethanol concentration increases, the effective permittivity of the mixture decreases due to ethanol’s lower dielectric constant, leading to a reduction in CR. Since the CSRR is capacitively excited via the microstrip line across the dielectric substrate, the total effective capacitance that governs resonance includes both the coupling capacitance CC and CR. The overall resonant frequency of the sensor is thus described by [23]:
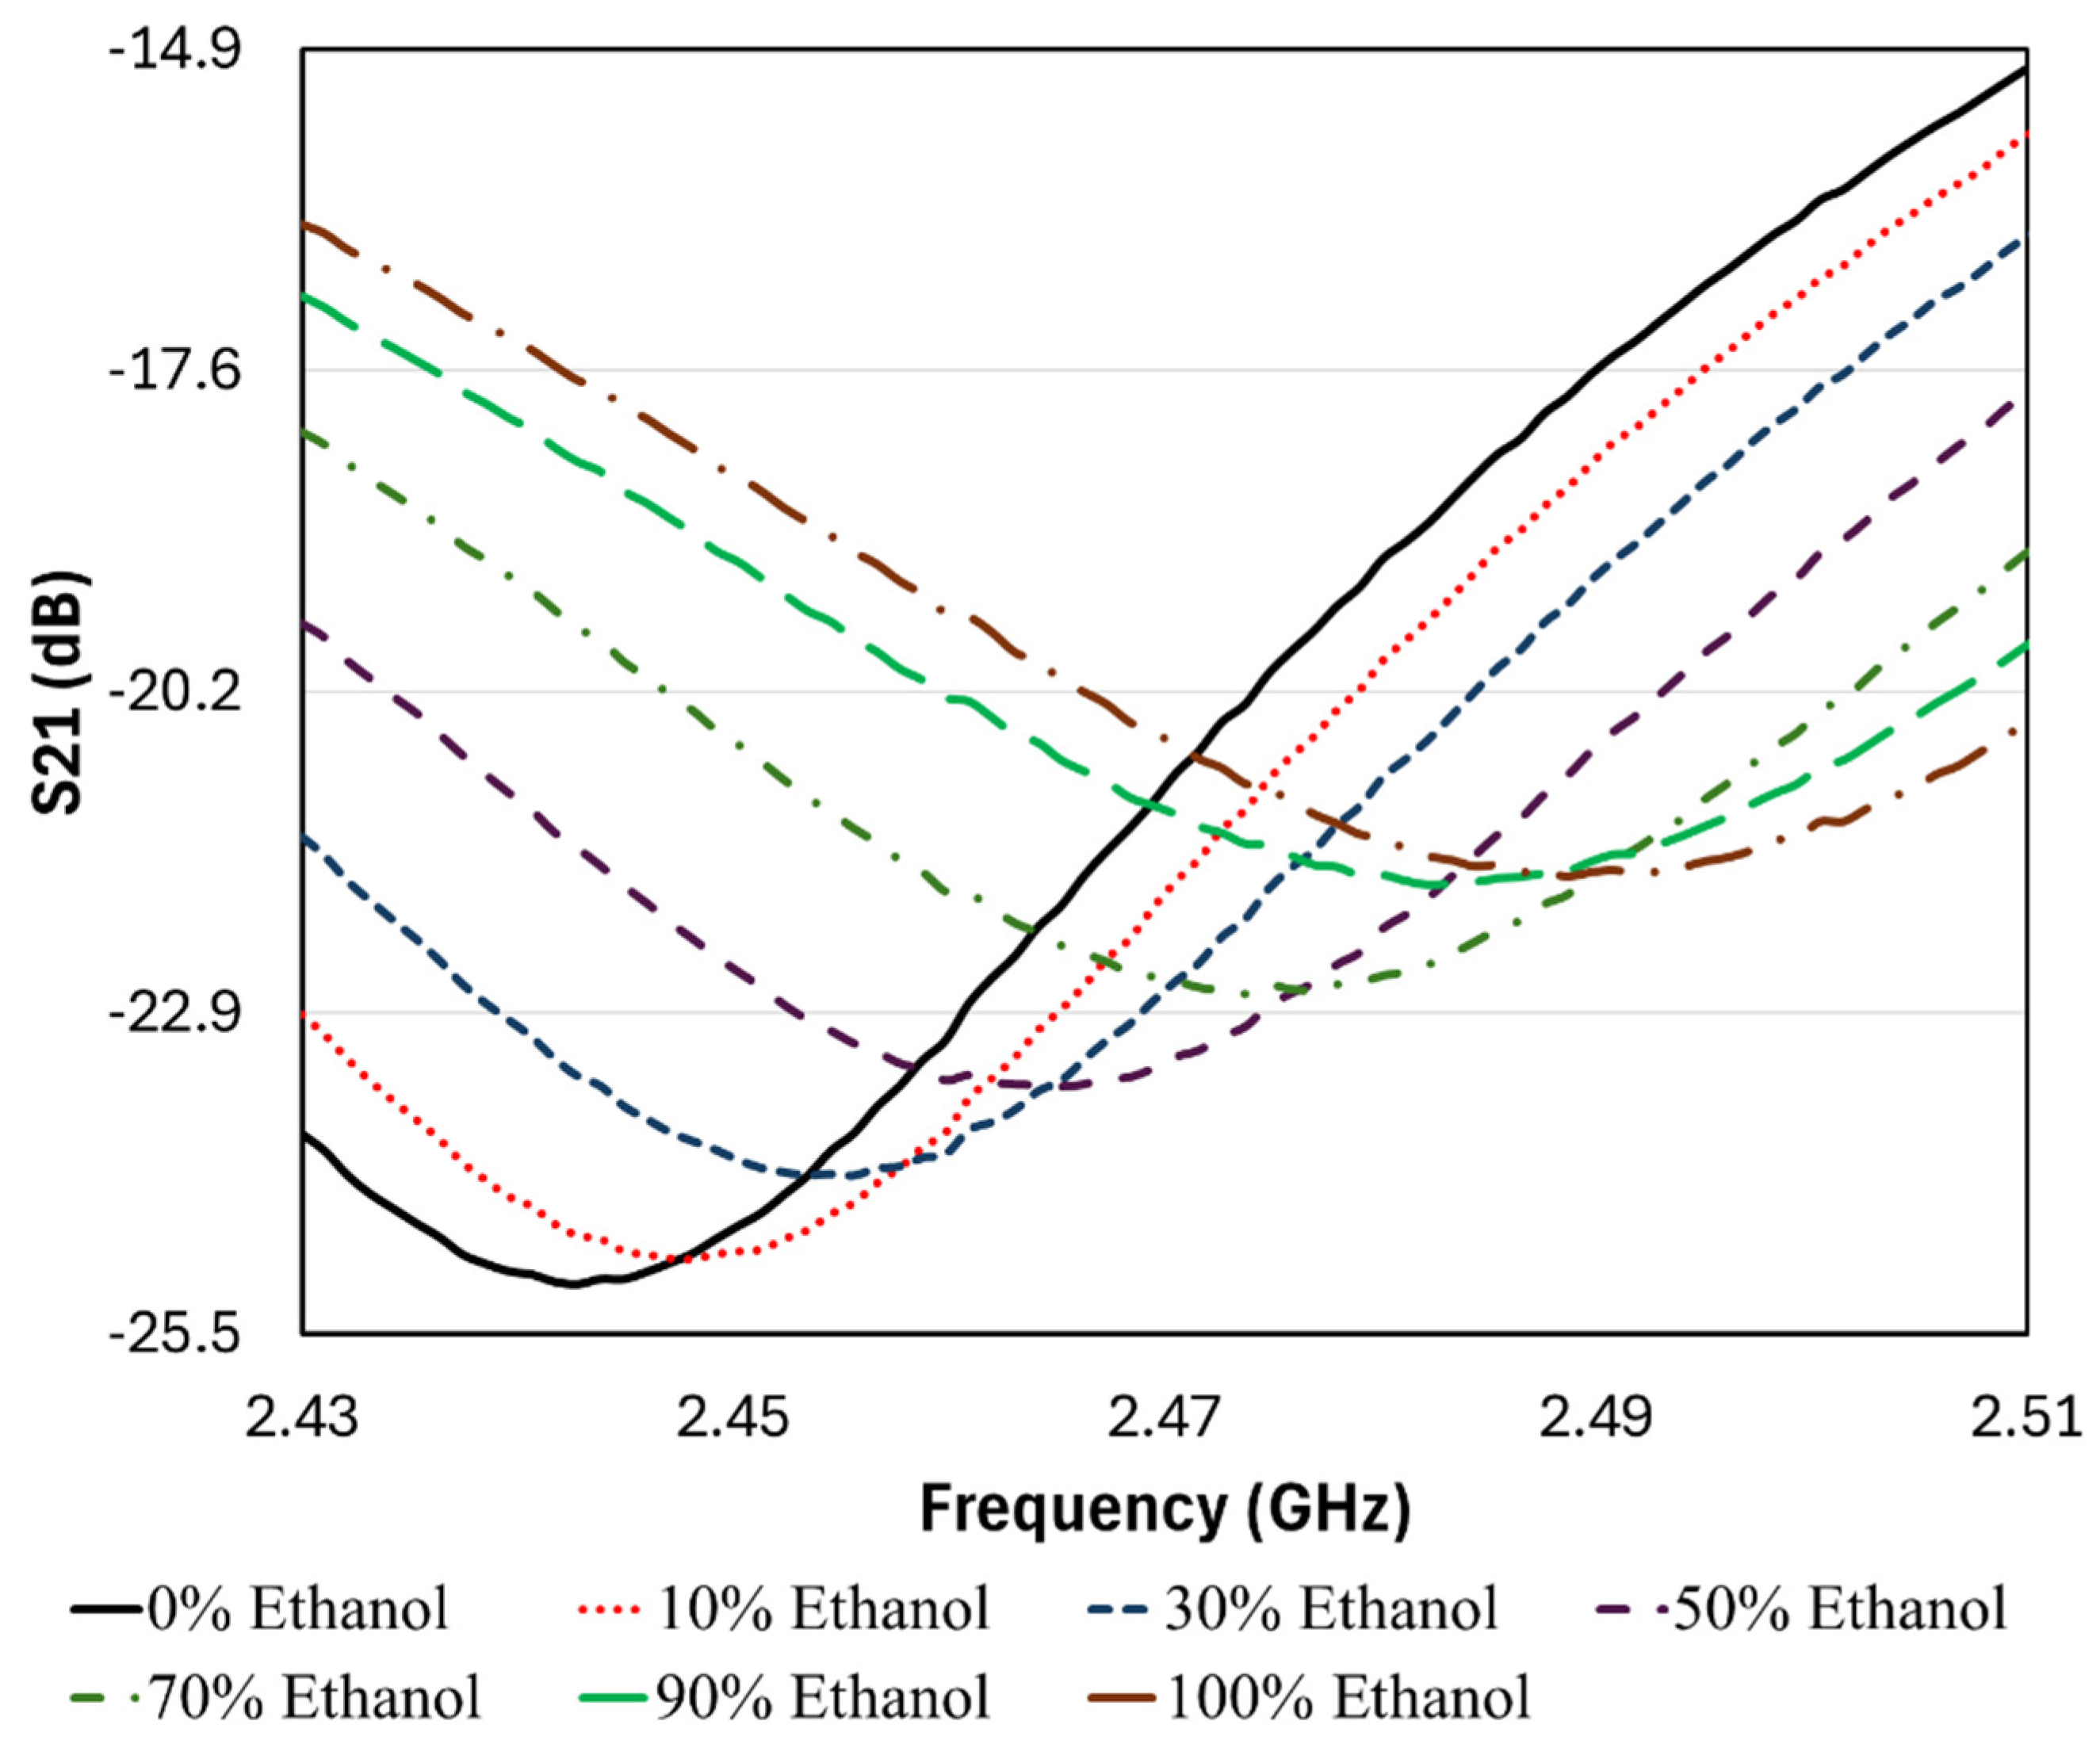
where LR is the inductance associated with the CSRR. From (7), it is evident that fr is inversely proportional to the square root of the total capacitance. Therefore, as CR decreases with increasing ethanol concentration, the total capacitance also decreases, resulting in an increase in the resonant frequency fr. This blue shift is clearly observed in Figure 8 and Figure 9 and reflects the sensor’s sensitivity to changes in the dielectric properties of the test mixture.
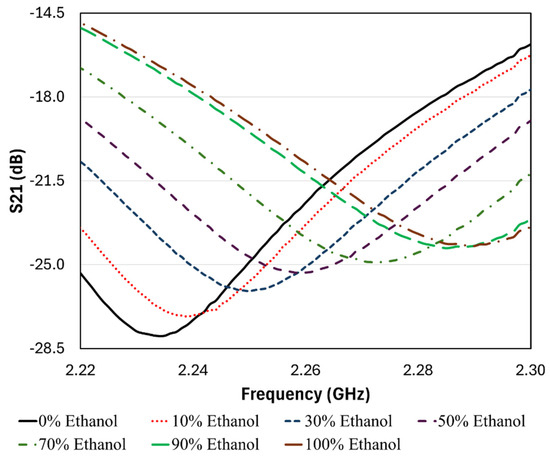
Figure 8.
Measured transmission coefficient (S21) of the proposed sensor at ethanol concentrations of 0%, 10%, 30%, 50%, 70%, 90%, and 100%.
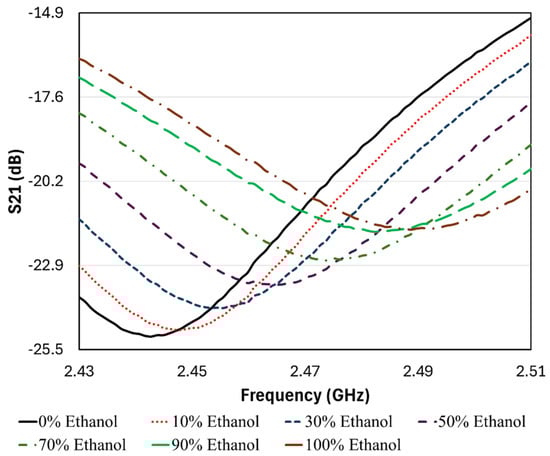
Figure 9.
Measured transmission coefficient (S21) of the replicated sensor at ethanol concentrations of 0%, 10%, 30%, 50%, 70%, 90%, and 100%.
It is worth noting that the simulated transmission coefficient (S21) under unloaded conditions, shown in Figure 3, exhibits a dip depth of approximately –33 dB, which reflects strong resonance and effective energy coupling. When the capillary is filled with pure water (0% ethanol), as shown in Figure 8, the measured dip depth slightly reduces to –27.97 dB. This attenuation is expected due to dielectric loading and higher losses introduced by the test fluid. Nonetheless, the dip remains well below the –10 dB threshold typically considered sufficient for microwave sensor resonance, indicating good robustness. Although integration with actual microfluidic channels and pumps may further influence dip depth and Q-factor through added losses and reflections, the current design demonstrates sufficient margin and strong performance. This robustness under loading conditions supports the sensor’s ability to maintain performance across varying analyte compositions.
It is important to note that the sensor’s sensitivity, as reported in this study, is specific to ethanol–water mixtures and may vary for other analyte systems depending on the contrast between their dielectric constants. In cases where the dielectric properties of the constituent liquids are closely matched, the resulting frequency shift, and thus the sensor’s sensitivity, would be significantly reduced.
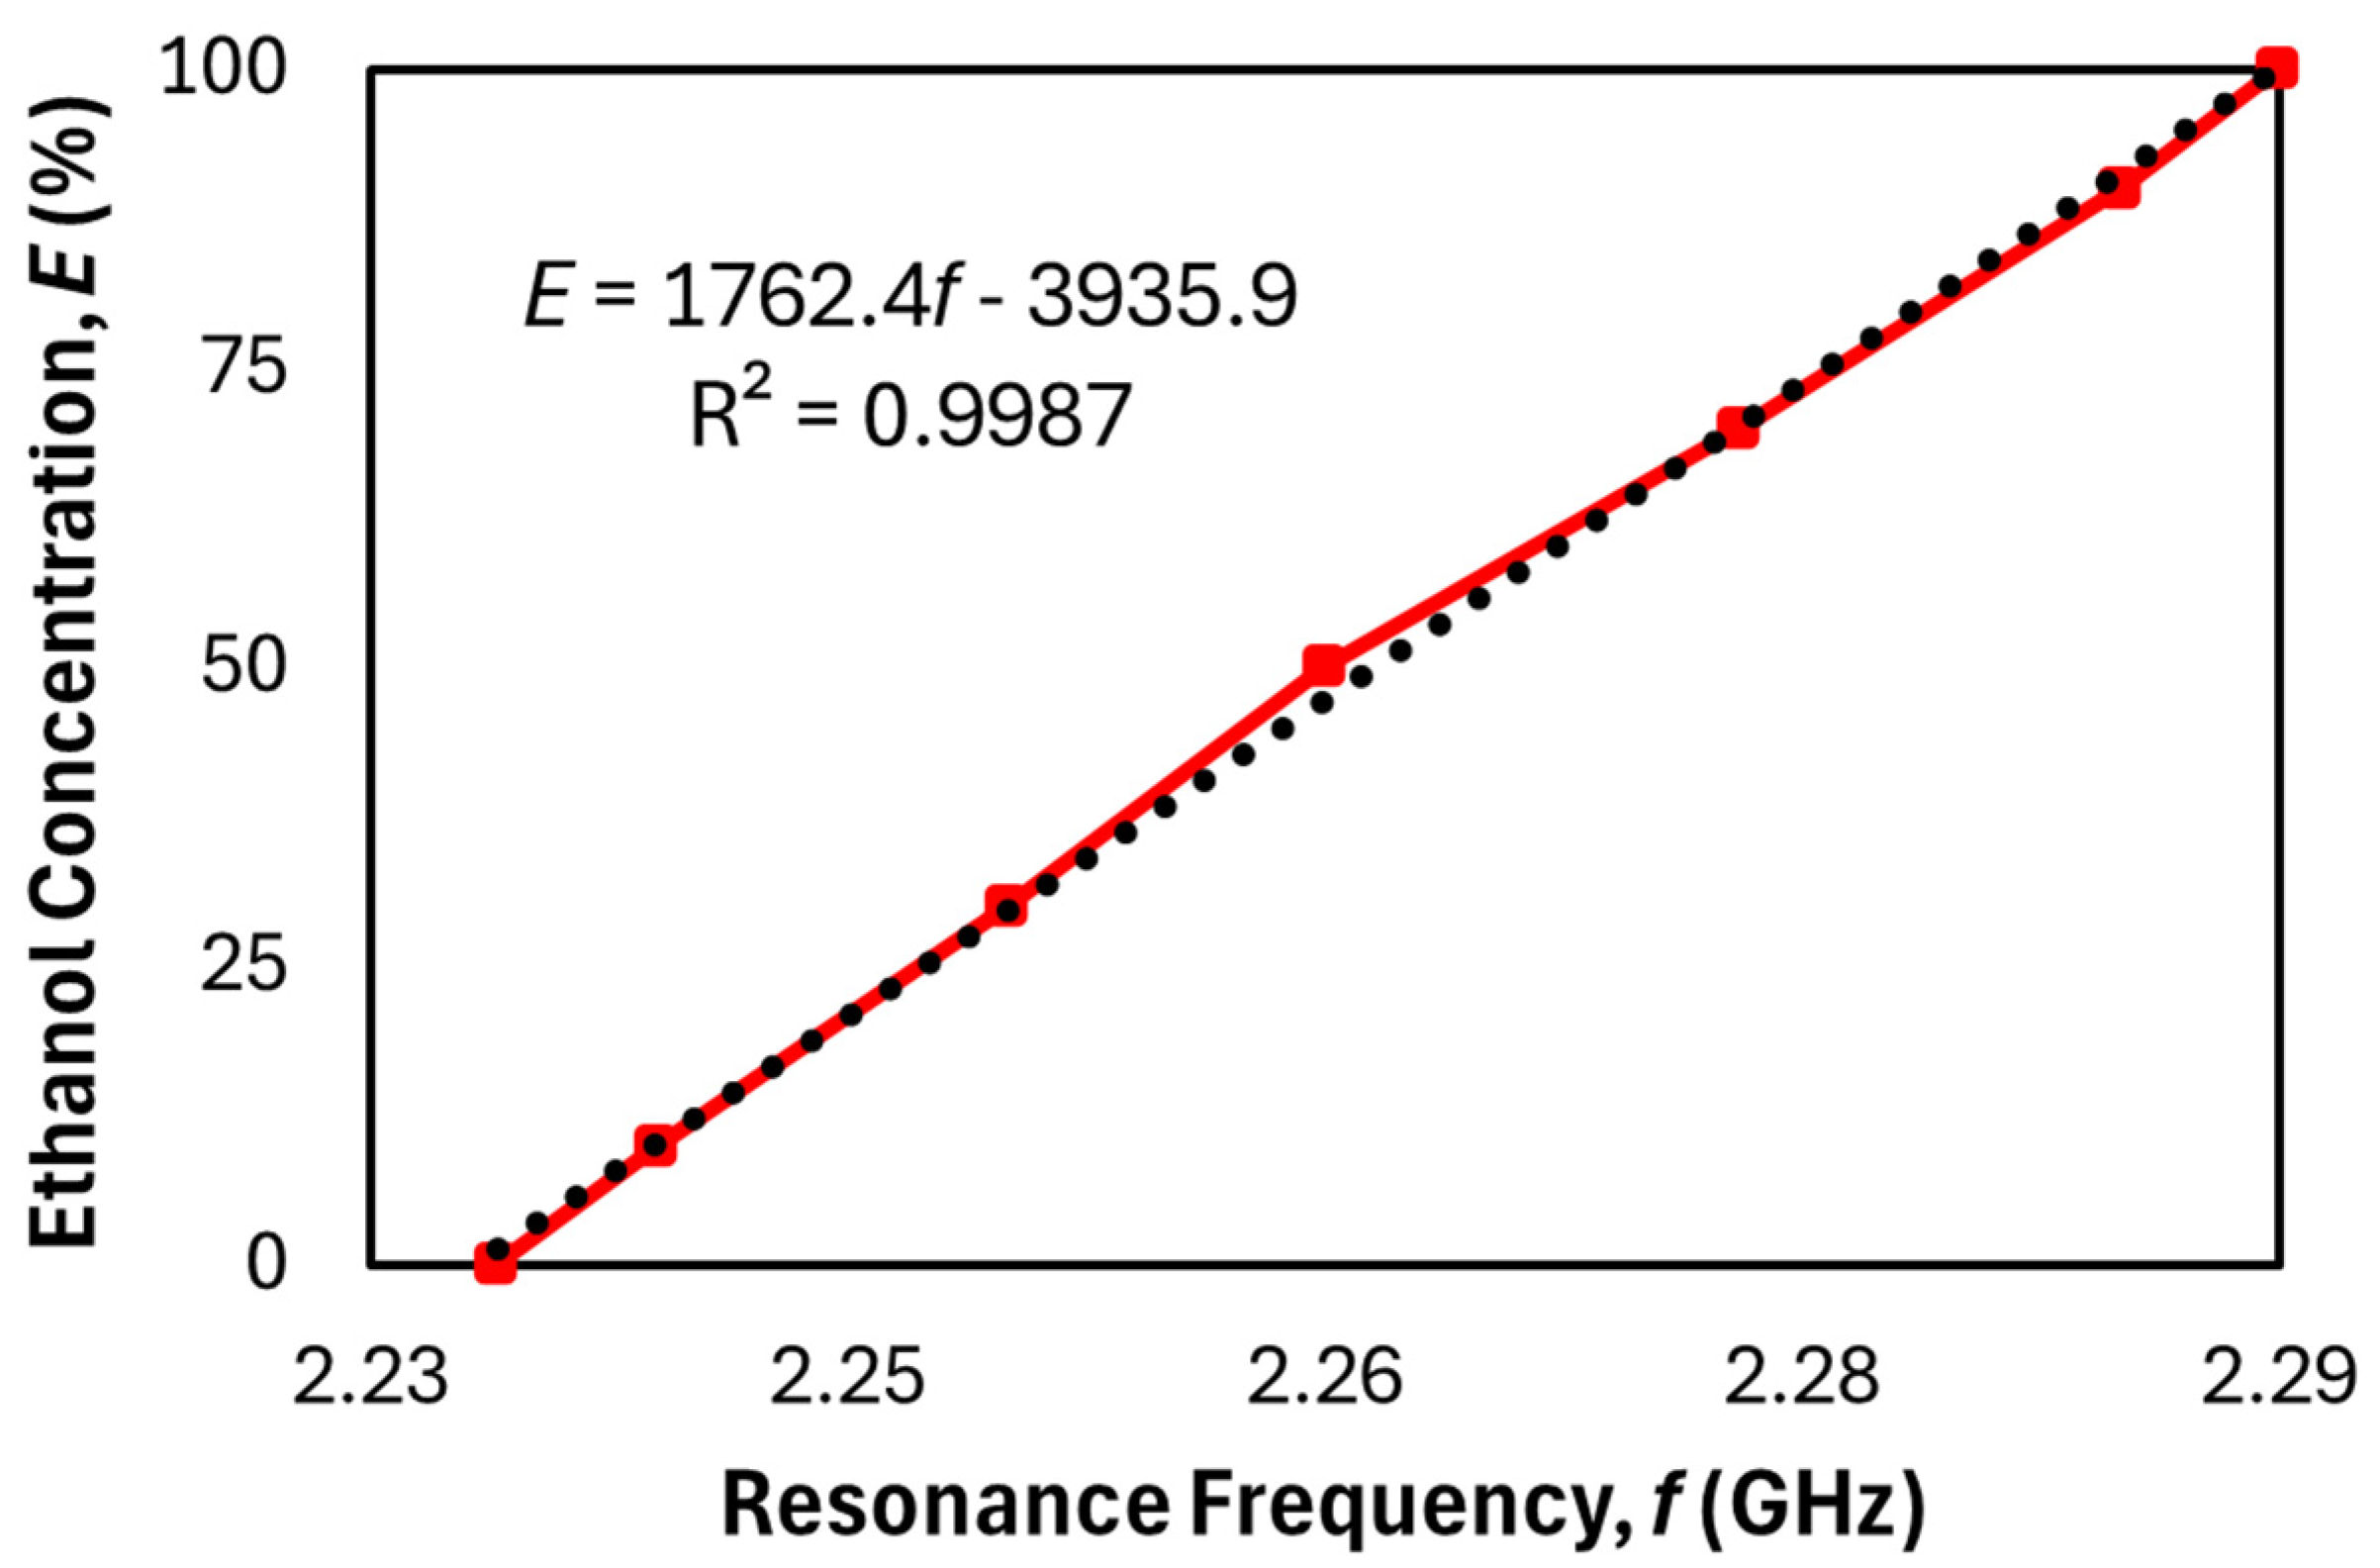
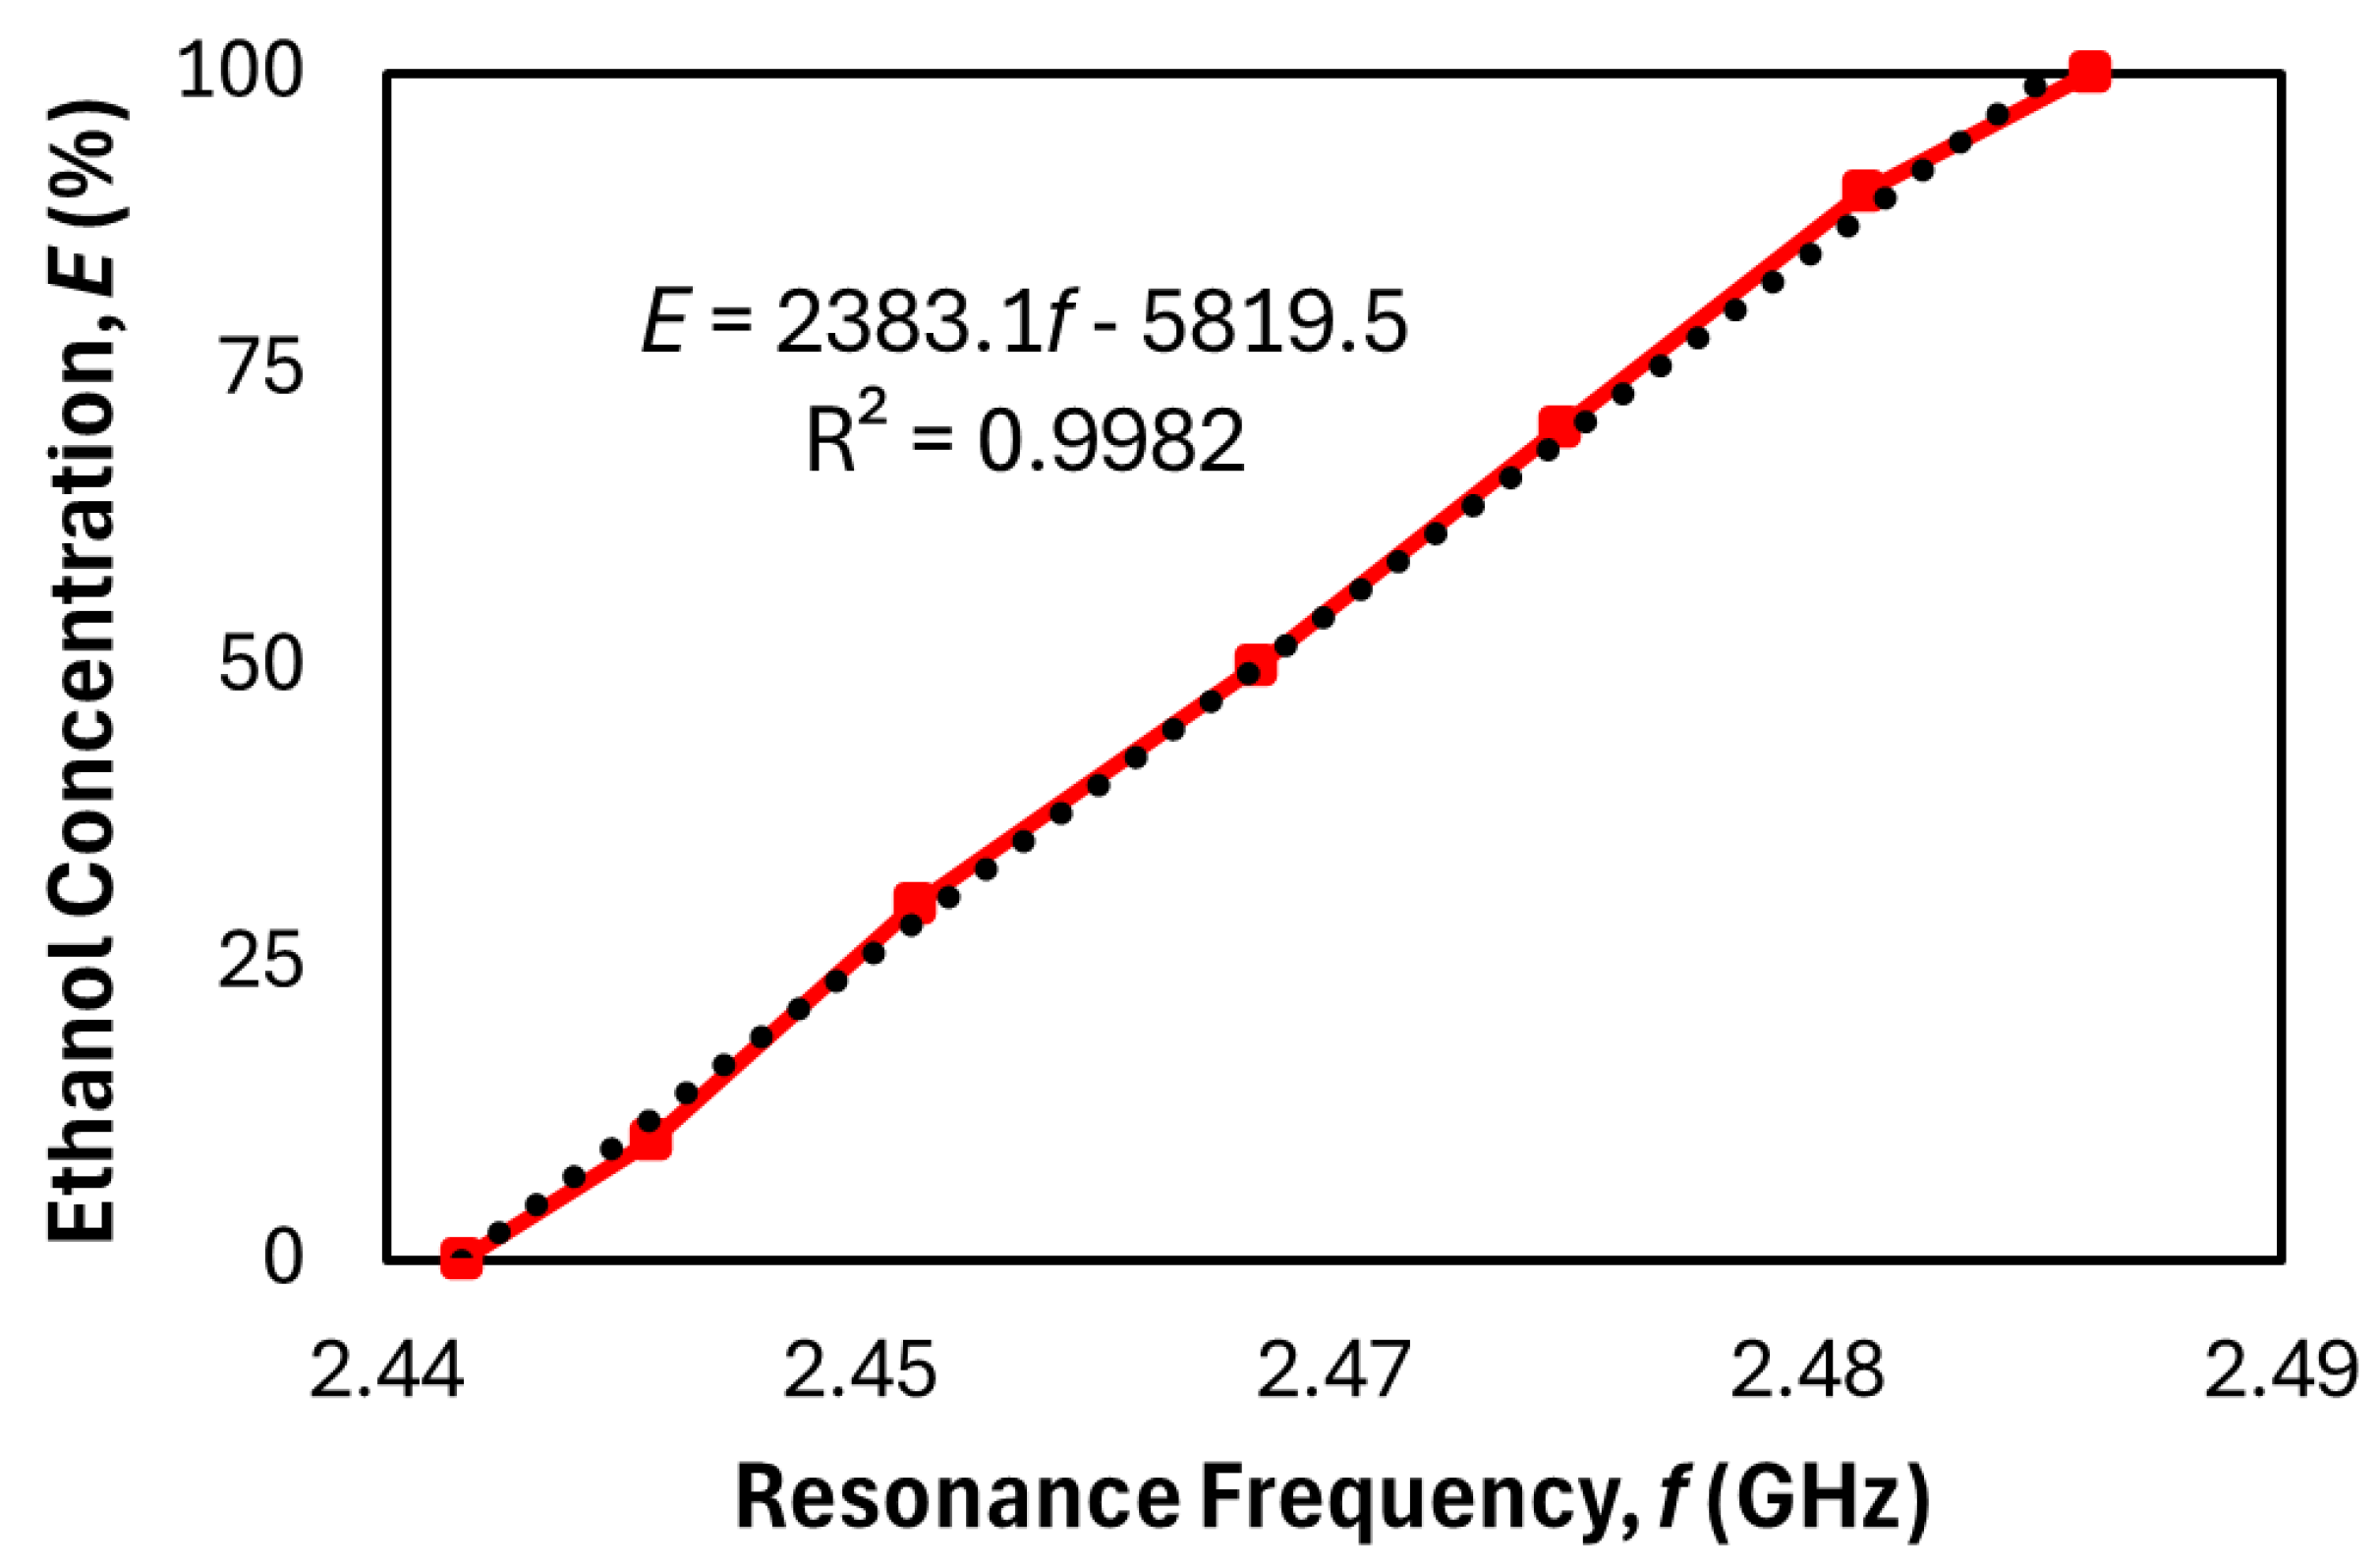
To enable a microwave sensor to quantify the concentration of an analyte, we correlate shifts in the resonant frequency fr, with changes in the analyte’s composition. Figure 10 and Figure 11 illustrate the relationship between ethanol concentration and fr for both the proposed and the replicated reference sensors. Using 0% ethanol as the baseline, the proposed sensor exhibits a resonant frequency of 2.234 GHz, compared to 2.442 GHz for the replicated design. Although this 8.5% or 208 MHz reduction in frequency may appear modest, it offers practical advantages, especially when developing a standalone sensing device. Lower-frequency operation enables the use of more cost-effective and readily available RF components such as signal generators, filters, and amplifiers. These components are generally easier to design and integrate due to relaxed impedance matching requirements, reduced radiation losses, and improved dielectric behavior. Additionally, lower operating frequencies often translate to reduced power consumption, which is particularly beneficial for battery-powered or portable sensing applications. These factors collectively make the proposed sensor more suitable for low-cost, energy-efficient, and compact standalone implementations.

Figure 10.
Ethanol concentration versus resonance frequency for the proposed sensor. The red curve shows experimental data, and the black dotted line represents the linear regression fit.

Figure 11.
Ethanol concentration versus resonance frequency for the replicated sensor. The red curve shows experimental data, and the black dotted line represents the linear regression fit.
Both frequency response curves can be quantitatively characterized using linear regression. The fitted models for the proposed and replicated sensors are given, respectively, by:
where E represents the ethanol concentration in percent, and fr is in GHz. The coefficient of determination R2 values are 0.9987 for the proposed sensor and 0.9982 for the replicated design, indicating excellent linearity in both cases. Since R2 = 1 represents a perfectly linear relationship, these results confirm that ethanol concentration can be accurately predicted by substituting the measured frequency into (8a) or (8b). Although each data point represents the average of three measurements, the variation between trials was minimal (estimated within ~0.5%), and the resulting error bars were too small to be visually distinguishable in the plotted graphs. Hence, they were omitted for clarity. Rearranging these equations to express fr as a function of E reveals the sensitivity of each design, quantified by the gradient Δfr/ΔE. The proposed sensor yields a sensitivity of 567.41 kHz/% compared to 419.62 kHz/% for the replicated sensor. Given the VNA frequency step size of 1 MHz, the minimum detectable change in ethanol concentration for the proposed sensor is approximately 1.76%. Given ethanol’s density of 0.789 g/mL, this corresponds to an estimated limit of detection (LOD) of approximately 13.89 mg/mL. This conversion allows for approximate performance comparison with optical or electrochemical ethanol sensors that report detection limits in mass-based units. Since sensitivity reflects the frequency shift per unit concentration, the proposed design achieves a 35.22% improvement in sensitivity, enabling more precise detection of ethanol content.
E = 1762.4fr − 3935.9
E = 2383.1fr − 5819.5
4. Conclusions
In this work, a highly sensitive planar microwave sensor based on concentric circular CSRRs was designed and demonstrated. Although ethanol solutions were used as a test case, the sensor is not restricted to ethanol detection and can be adapted for a variety of liquid-phase analytes. The design enhancements focused on optimizing the sensor geometry to maximize sensitivity. Specifically, the sensitivity improvements are primarily attributed to increasing the intrinsic capacitance CR by enlarging both the effective area and radial separation of the CSRR structure, thereby strengthening the edge capacitive effects. Additional strategies included increasing the number of concentric split rings to deepen the resonance dip, adopting circular CSRRs over alternative geometries to improve electric field confinement, and flanking the central resonator with two 2-split-ring CSRRs. These side resonators enhance the band-stop filtering effect by reinforcing resonant coupling, leading to a deeper transmission dip and improved energy extraction from the transmission line. Together, these structural optimizations result in stronger field–matter interaction and enhanced detection capability.
Further investigations may examine the impact of capillary tube dimensions, particularly the inner diameter, on sensor sensitivity, to validate the theoretical r2 dependency predicted by the capacitance model. Additionally, subsequent implementations could incorporate tubing-based fluid delivery systems to enable continuous, real-time monitoring of liquid mixtures, enhancing the sensor’s applicability in dynamic microfluidic environments. To further evaluate the sensor’s generalizability, future work may also explore its response to a wider range of solute types and concentrations. As the current study focused on ethanol–water mixtures for benchmarking purposes, additional validation using analytes with varying dielectric contrasts would provide insight into detection limits and potential application scope.
The sensor’s lower resonant frequency of 2.234 GHz (compared to 2.442 GHz in the reference design) provides important system-level advantages. Lower-frequency operation facilitates the use of simpler, more affordable, and less power-hungry RF components, making the proposed sensor more practical for low-power, compact, and standalone implementations.
While the proposed design adopts a relatively simple planar structure, it builds upon a lineage of proven CSRR-based microwave sensors, including those by Chuma et al. [13] and Mosbah et al. [21]. Such configurations have been widely used in prior studies due to their ease of fabrication, strong field confinement, and resonance-based sensing precision. Our work demonstrates that through careful geometric optimization, rather than increased complexity, significant improvements in sensitivity can be achieved. This refinement-focused approach preserves the benefits of a planar architecture while enhancing performance. Owing to its simplicity and robustness, the proposed design can be realistically integrated into compact systems for ethanol quality assessment in beverages, purity monitoring in biofuels, and real-time control in industrial fermentation processes.
Although the present sensor operates at the millimeter scale, this configuration is compatible with capillary-based microfluidic systems and enables robust prototyping and accurate sensitivity characterization. Future work may explore miniaturization to sub-millimeter dimensions, which are typical of integrated lab-on-chip platforms. However, scaling down introduces significant challenges such as reduced electromagnetic field confinement, increased conductor and dielectric losses, lower Q-factors, and tighter fabrication tolerances. Overcoming these limitations would likely require the use of high-permittivity substrates, advanced lithographic techniques, and optimized CSRR geometries to maintain sensing performance at reduced scales.
The proposed sensor architecture is compact, scalable, and compatible with standard PCB fabrication processes, making it a promising candidate for real-time, non-invasive sensing applications in chemical, environmental, and biomedical domains.
Author Contributions
Conceptualization, H.K.L.; Software, P.L.T.; Formal analysis, N.E.; Investigation, W.C.C.; Data curation, K.B.T.; Writing—original draft, K.H.Y.; Writing—review & editing, F.W.L. All authors have read and agreed to the published version of the manuscript.
Funding
This research received no external funding. The APC was partially funded by Universiti Tunku Abdul Rahman.
Data Availability Statement
The original contributions presented in this study are included in the article. Further inquiries can be directed to the corresponding author.
Conflicts of Interest
The authors declare no conflict of interest.
References
- Abduljabar, A.A.; Rowe, D.; Porch, A.; Barrow, D. Novel Microwave Microfluidic Sensor Using a Microstrip Split-Ring Resonator. IEEE Trans. Microw. Theory Tech. 2014, 62, 679–688. [Google Scholar] [CrossRef]
- Muñoz-Enano, J.; Vélez, P.; Gil, M.; Martín, F. Planar Microwave Resonant Sensors: A Review and Recent Developments. Appl. Sci. 2020, 10, 2615. [Google Scholar] [CrossRef]
- Dai, L.; Zhao, X.; Guo, J.; Feng, S.; Fu, Y.; Kang, Y.; Guo, J. Microfluidics Based Microwave Sensor. Sens. Actuators A Phys. 2020, 309, 111910. [Google Scholar] [CrossRef]
- Alahnomi, R.; Zakaria, Z.; Mohdyusof, Z.; Althuwayb, A.; Alhegazi, A.; Alsariera, H.; Rahman, N.A. Review of Recent Microwave Planar Resonator-Based Sensors: Techniques of Complex Permittivity Extraction, Applications, Open Challenges and Future Research Directions. Sensors 2021, 21, 2267. [Google Scholar] [CrossRef] [PubMed]
- Han, X.; Liu, K.; Zhang, S. High-Sensitivity Dual-Band Microfluidic Microwave Sensor for Liquid Dielectric Characterization. IEEE Sens. J. 2024, 24, 36689–36697. [Google Scholar] [CrossRef]
- Yeap, K.H.; Le Lam, J.; Loh, S.H.; Dakulagi, V.; Mazlan, A.U. Microwave Sensor for Sodium Chloride Density Measurement in Aqueous Solutions. J. Eng. Technol. Appl. Phys. 2024, 6, 52–56. [Google Scholar] [CrossRef]
- Azcatl, R.F.; Barbosa, M.C. Sodium Chloride, NaCl/ϵ: New Force Field. J. Physic. Chem. B 2016, 120, 2460–2470. [Google Scholar] [CrossRef]
- Tong, J.; Peng, B.; Kontogeorgis, G.M.; Liang, X. Behavior of The Aqueous Sodium Chloride Solutions from Molecular Simulations and Theories. J. Molecul. Liq. 2023, 371, 121086. [Google Scholar] [CrossRef]
- Koirala, G.R.; Dhakal, R.; Kim, E.S.; Yao, Z.; Kim, N.Y. Radio frequency detection and characterization of water-ethanol solution through spiral-coupled passive micro-resonator sensor. Sensors 2018, 18, 1075. [Google Scholar] [CrossRef]
- Boybay, M.S.; Jiao, A.; Glawdel, T.; Ren, C.L. Microwave sensing and heating of individual droplets in microfluidic devices. Lab A Chip 2013, 13, 3840–3846. [Google Scholar] [CrossRef]
- Wang, W.Z.; Zhang, X.; Zhang, L.F.; Cui, T.J. Impacts of liquid level on microwave resonance sensing with a flexible microfluidic channel. Adv. Sens. Res. 2023, 2, 2200040. [Google Scholar] [CrossRef]
- Oh, Z.X.; Yeap, K.H.; Teh, P.C.; Dakulagi, V. Circular Split-ring Resonator-based Sensor for Dielectric Constant Measurement. Microw. Opt. Technol. Lett. 2023, 65, 513–518. [Google Scholar] [CrossRef]
- Chuma, E.L.; Iano, Y.; Fontgalland, G.; Roger, L.L.B. Microwave sensor for liquid dielectric characterization based on metamaterial complementary split ring resonator. IEEE Sens. J. 2018, 18, 9978–9983. [Google Scholar] [CrossRef]
- Al-Gburi, A.J.A.; Rahman, N.A.; Zakaria, Z.; Palandoken, M. Detection of semi-solid materials utilizing triple-rings CSRR microwave sensor. Sensors 2023, 23, 3058. [Google Scholar] [CrossRef]
- Ebrahimi, A.; Scott, J.; Ghorbani, K. Ultrahigh-sensitivity microwave sensor for microfluidic complex permittivity measurement. IEEE Trans. Microw. Theory Tech. 2019, 67, 4269–4277. [Google Scholar] [CrossRef]
- Basaran, S.C.; Olgun, U.; Sertel, K. Multiband monopole antenna with complementary split-ring resonators for WLAN and WiMAX applications. Electron. Lett. 2013, 49, 636–638. [Google Scholar] [CrossRef]
- Shahzad, W.; Hu, W.; Ali, Q.; Raza, H.; Abbas, S.M.; Ligthart, L.P. A Low-cost metamaterial sensor based on DS-CSRR for material characterization applications. Sensors 2022, 22, 2000. [Google Scholar] [CrossRef]
- Ebrahimi, A.; Withayachumnankul, W.; Al-Sarawi, S.; Abbott, D. High-Sensitivity Metamaterial-Inspired Sensor for Microfluidic Dielectric Characterization. IEEE Sens. J. 2014, 14, 1345–1351. [Google Scholar] [CrossRef]
- Khanna, Y.; Awasthi, Y.K. Dual-band microwave sensor for investigation of liquid impurity concentration using a metamaterial complementary split-ring resonator. J. Electron. Mater. 2020, 49, 385–394. [Google Scholar] [CrossRef]
- Yeap, K.H.; Gan, A.J.H.; Oh, Z.X.; Hirasawa, K.; Teh, P.C. Resonant Characteristics of Two Closely Arranged Split-Ring Resonators. J. Fiz. Malays. 2024, 45, 10046–10061. [Google Scholar]
- Mosbah, S.; Zebiri, C.; Sayad, D.; Elfergani, I.; Bouknia, M.L.; Mekki, S.; Zegadi, R.; Palandoken, M.; Rodriguez, J.; Abd-Alhameed, R.A. Compact and highly sensitive bended microwave liquid sensor based on a metamaterial complementary split-ring resonator. Appl. Sci. 2022, 12, 2144. [Google Scholar] [CrossRef]
- Mulloni, V.; Marchi, G.; Lorenzelli, L.; Donelli, M. Chipless RFID sensing system for precise ethanol determination in alcoholic solutions. Electronics 2022, 11, 735. [Google Scholar] [CrossRef]
- Bonache, J.; Gil, M.; Gil, I.; Garcia-Garcia, J.; Martin, F. On the electrical characteristics of complementary metamaterial resonators. IEEE Microw. Wirel. Compon. Lett. 2006, 16, 543–545. [Google Scholar] [CrossRef]


Disclaimer/Publisher’s Note: The statements, opinions and data contained in all publications are solely those of the individual author(s) and contributor(s) and not of MDPI and/or the editor(s). MDPI and/or the editor(s) disclaim responsibility for any injury to people or property resulting from any ideas, methods, instructions or products referred to in the content. |
© 2025 by the authors. Licensee MDPI, Basel, Switzerland. This article is an open access article distributed under the terms and conditions of the Creative Commons Attribution (CC BY) license (https://creativecommons.org/licenses/by/4.0/).