Article

Adoption of Lean, Agile, Resilient, and Cleaner Production Strategies to Enhance the Effectiveness and Sustainability of Products and Production Processes

by
Abbas Al-Refaie
1 and
Natalija Lepkova
2,*
1
Department of Industrial Engineering, University of Jordan, Amman 11942, Jordan
2
Department of Construction Management and Real Estate, Vilnius Gediminas Technical University (VILNIUSTECH), Saulėtekio al. 11, LT-10223 Vilnius, Lithuania
*
Author to whom correspondence should be addressed.
Processes 2025, 13(7), 2152; https://doi.org/10.3390/pr13072152
Submission received: 9 June 2025 / Revised: 30 June 2025 / Accepted: 2 July 2025 / Published: 7 July 2025

Abstract

This research assesses the impacts of five cleaner production (CP) profiles of soap products and the overall equipment effectiveness (OEE) of liquid detergent production lines. A simulation model was built to depict the “As-Is” condition, and then the overall equipment effectiveness was calculated. Results showed high rejection rates and bottlenecks, resulting in long average cycle times and waiting times, as well as low production rates and machine utilization. Consequently, lean, agile, and resilient actions were utilized to enhance the OEE of the line’s processes. The improvement results showed that the bottle placement, filling, labeling, and taping processes were enhanced by 237%, 4.67%, 5.41%, and 26.02%, respectively. Moreover, the smallest percentages of availability, quality, and performance were 97.46%, 99.82%, and 81.56%, respectively, indicating a considerable enhancement in the performance of the line’s processes. Further, cleaner production assessment was performed on soap products to estimate environmental profile indices for raw material, energy, product, waste, and packaging. The estimated overall environmental index was 107.93, with liquid waste contributing the largest index value. Therefore, a proposal for a water treatment system was suggested and then assessed. In conclusion, lean, agile, and resilient actions were found to be effective in enhancing the OEE of production processes. Moreover, cleaner production provided valuable support to decision-makers in determining the appropriate actions for improving the OEE and environmental performance of the technological processes and products of detergent production lines.

1. Introduction

Uncertain and unexpected changes in demand and processes/products have urged firms to adopt effective improvement practices. Lean, agile, resilient, and cleaner production comprise effective practices that can improve the capability and efficiency of manufacturing processes [1,2,3]. Hence, this research employs applicable improvement practices to enhance the performance of the detergent production system.
Lean management focuses on eliminating eight types of waste, including overproduction, waiting, transportation, overprocessing, inventory, motion, defects, and non-utilized talent [4,5,6]. Lean practices can significantly reduce production lead and cycle times, waiting times, and the number of units in queues [7,8]. Further, industrial firms are facing rapid and unanticipated changes in demand. Agility is defined as the ability of a production system to reconfigure its operating status quickly, flexibly, and adequately to respond cost-effectively to unpredictable and ever-changing product demand [9]. Furthermore, agile manufacturing can enhance the capabilities of manufacturing processes and improve a firm’s competitive advantage [10]. Finally, resilience represents the ability of manufacturing systems to cope with disturbances that negatively impact product quality and process performance, such as unexpected machine breakdowns, product queues, and process variations [11,12,13]. It also prevents manufacturing systems from shifting to an undesirable state without incurring significant additional costs. Resilient systems have been considered in various manufacturing applications [14,15,16].
Furthermore, the growing recognition of environmental issues necessitates immediate reductions in the negative impacts caused by manufacturing processes and products. Therefore, production engineers are challenged to enhance the efficiency and productivity of manufacturing processes without attributing negative environmental impacts [17,18,19]. Conceptually, Cleaner Production (CP) seeks to integrate the continuous utilization of preventive environmental approaches to processes, products, and services, aiming to enhance efficiency, minimize negative environmental impacts, and achieve sustainable development goals [20,21]. CP practices collaborate in preserving raw materials and power, ensure the reduction or elimination of toxic materials, and minimize the toxicity of emissions and residues during the production processes [22,23]. Several studies have implemented CP to achieve the environmental goals of manufacturing processes [24,25,26]. Additionally, some studies aimed to enhance quality and reduce carbon emissions [27,28], whereas other studies examined the conceptual relationships between quality improvement techniques [29,30,31,32]. This research focuses on enhancing the OEE components and environmental performance of the technological processes and products of the detergent and soup production lines.
In this regard, this research aims to (1) enhance the OEE of liquid detergent production processes utilizing lean, agile, and resilient practices and (2) assess the environmental performance of the technological processes for soap products using cleaner production. The results of this research provide valuable support to production engineers on how to enhance the operational and environmental performance of the technological processes and products. Compared to previous studies, this research contributes to ongoing research by combining lean, agile, and resilient practices, and environmental assessment to improve the efficiency of technological processes and the sustainability of the produced products. The remainder of this research is outlined in the following sections. Section 2 describes the research methodology and application. Section 3 presents the improvement actions. Section 4 presents research results. Section 5 summarizes research conclusions.

2. Research Methodology and Application

The methodology to achieve the objectives of this research is depicted in Figure 1. Initially, the key production line is selected based on production experience with processes that need significant improvement to achieve the firm’s goals. Next, the main product is chosen, and the relevant technological processes are mapped. Data collection for processing times, handling characteristics, and product specifications is performed. Evaluation of the OEE at the current process conditions and assessment of the environmental impacts for five environmental profiles based on the existing product characteristics are then conducted. Improvement opportunities are then identified for manufacturing processes and products. Finally, appropriate improvement actions utilizing the practices of lean, agile, resilient, and CP are conducted, and then improvements in process OEE and environmental performance are assessed. Finally, improvements are implemented and maintained.

2.1. As-Is Simulation Model

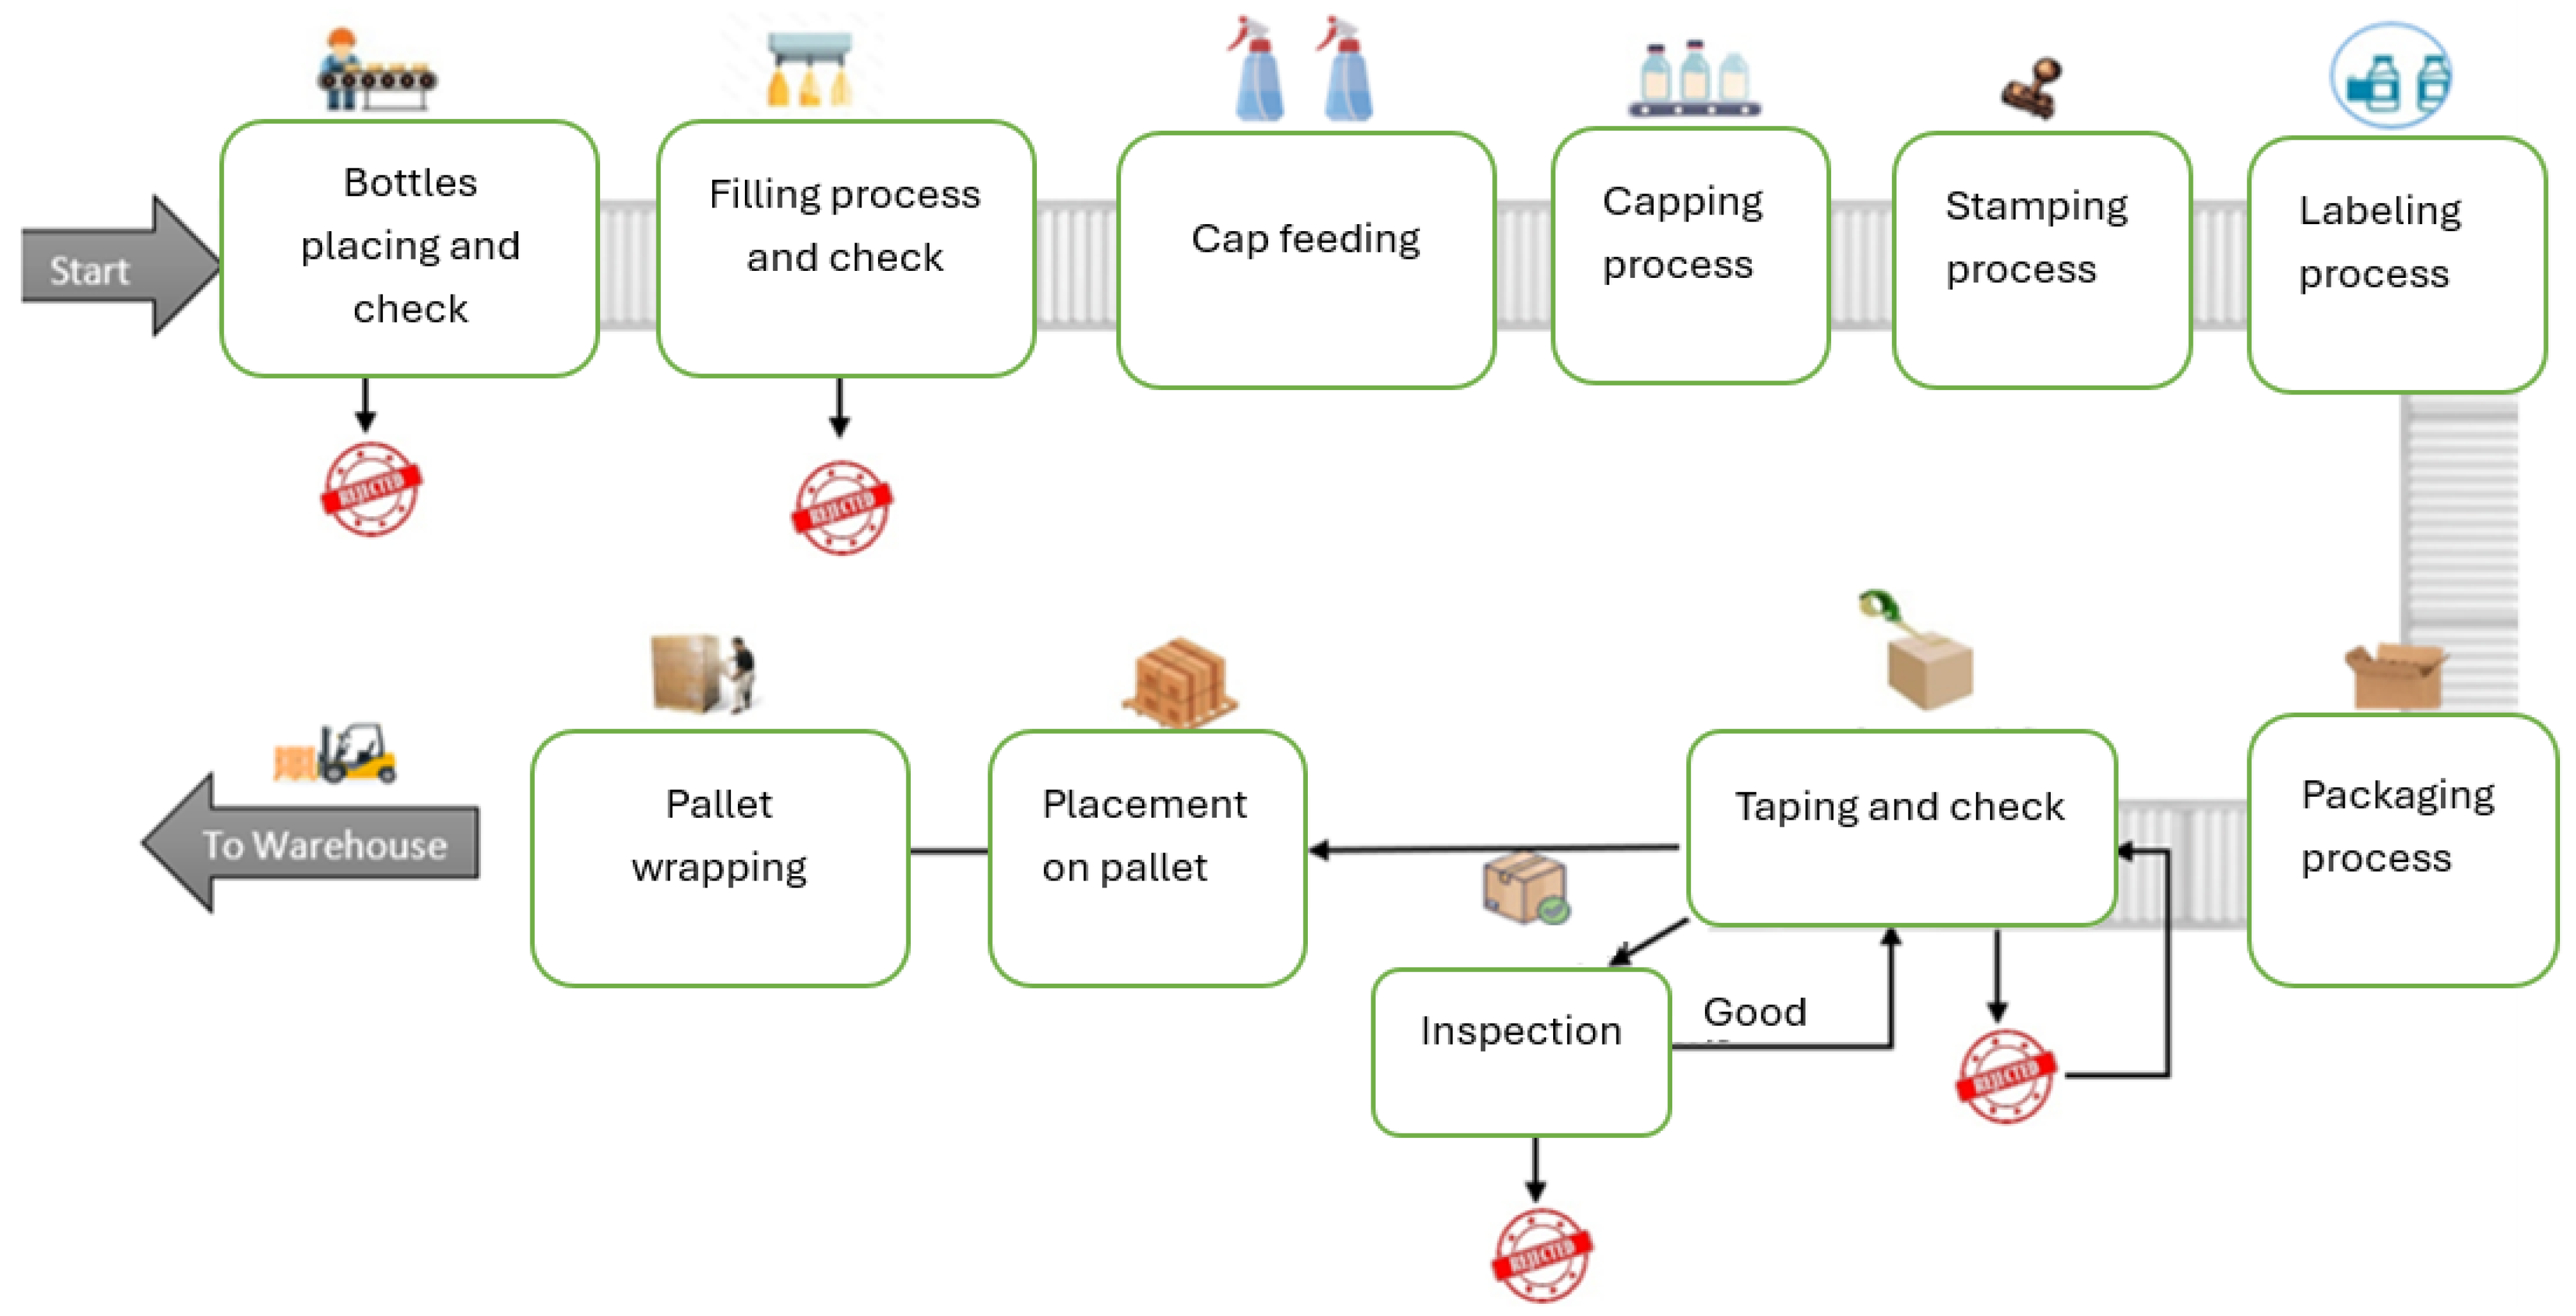
Figure 2 shows the production line of liquid detergents, which contains various processes, including bottle placing, filling, cap feeding, stamping, labeling, packaging, and taping. Time and motion studies were conducted to collect process data, which were then fitted to appropriate distributions, as shown in Table 1. The conveyor characteristics are presented in Table 2.
The As-Is model consists of the following Sub-models.

2.1.1. Bottle Arrival Sub-Model

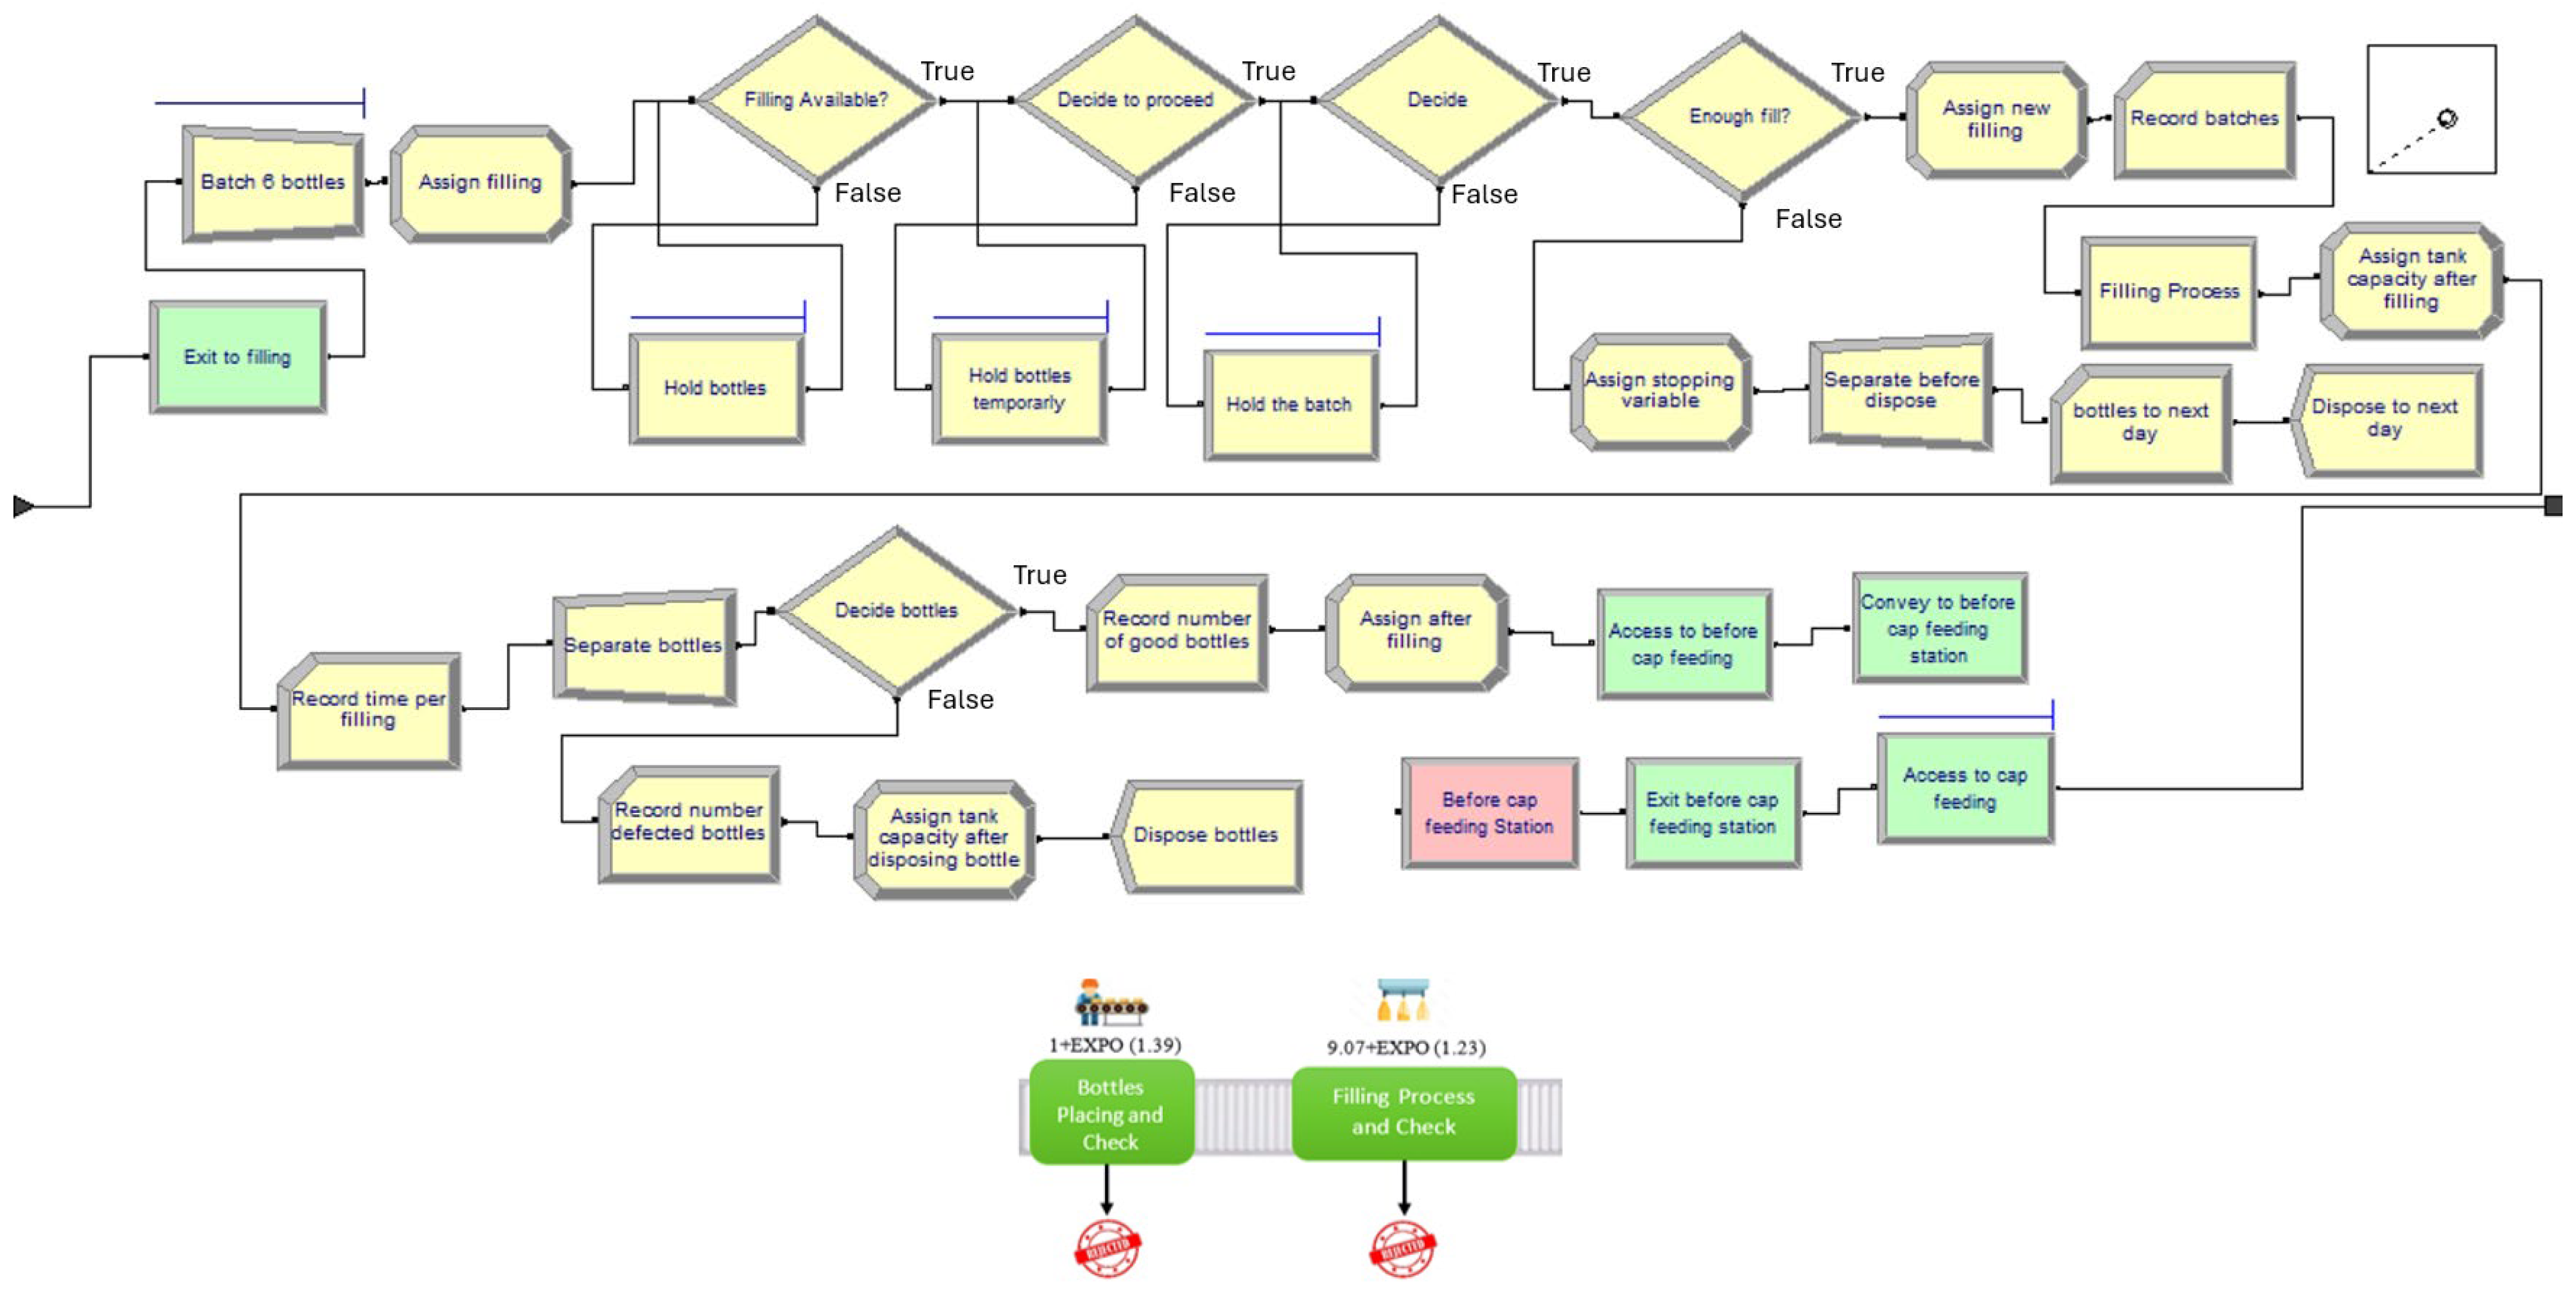
The bottle arrival sub-model is depicted in Figure 3. A pallet of nine plastic bags of 165 bottles is fed manually to the production line. The interarrival time between the bottles is defined as 1 + EXPO (1.39) seconds. Once a bottle has entered the production line, an operator checks the conformity of the bottles. The non-conforming bottles are returned to the plastic factory to be recycled, whereas acceptable ones access the plastic station and are transported by conveyor to the filling machine.

2.1.2. Filling Process Sub-Model

The detergent material is stored, as shown in Figure 4, in a tank with a 10,000 L capacity. The filling machine has six nozzles to fill six bottles concurrently. The processing time data for filling bottles is modeled as 9.07 + Exponential (1.23) seconds. A sensor failure occurs every 24 h and requires a 10-min fix.

2.1.3. Cap-Feeding Sub-Model

The cap-feeding process is shown in Figure 5 and requires two operators who place and screw caps. The processing time follows a normal distribution NORM (12.6, 3.55). For every 396 bottles, the process stops temporarily for 40 s while a new box of caps is bought. When the process queue reaches 18 bottles, the filling machine stops.

2.1.4. Capping Sub-Model

The filled bottles are moved, as shown in Figure 6, to the capping process for closing, which takes 0.3 s.

2.1.5. Stamping Sub-Model

The sealed bottles are moved automatically, as shown in Figure 7, to the stamping station. The processing time is 0.47 s.

2.1.6. Labeling Sub-Model

The simulation model for the labeling process is depicted in Figure 8. Two stoppages occur as the label roll must be changed every 3456 bottles. The process mean time to failure and downtime are 2 h and 5 min, respectively.

2.1.7. Packaging Sub-Model

The labeled bottles, as shown in Figure 9, are batched into boxes of 12 bottles. At the packaging station, two operators package bottles following a processing time defined as 13 + WEIB (40.4, 1.19) seconds. An inspection is conducted to detect misalignments of the label position on the bottle.

2.1.8. Taping Sub-Model

The taping process is shown in Figure 10. The machine requires lubrication every 2 h.

2.1.9. Inspection Sub-Model

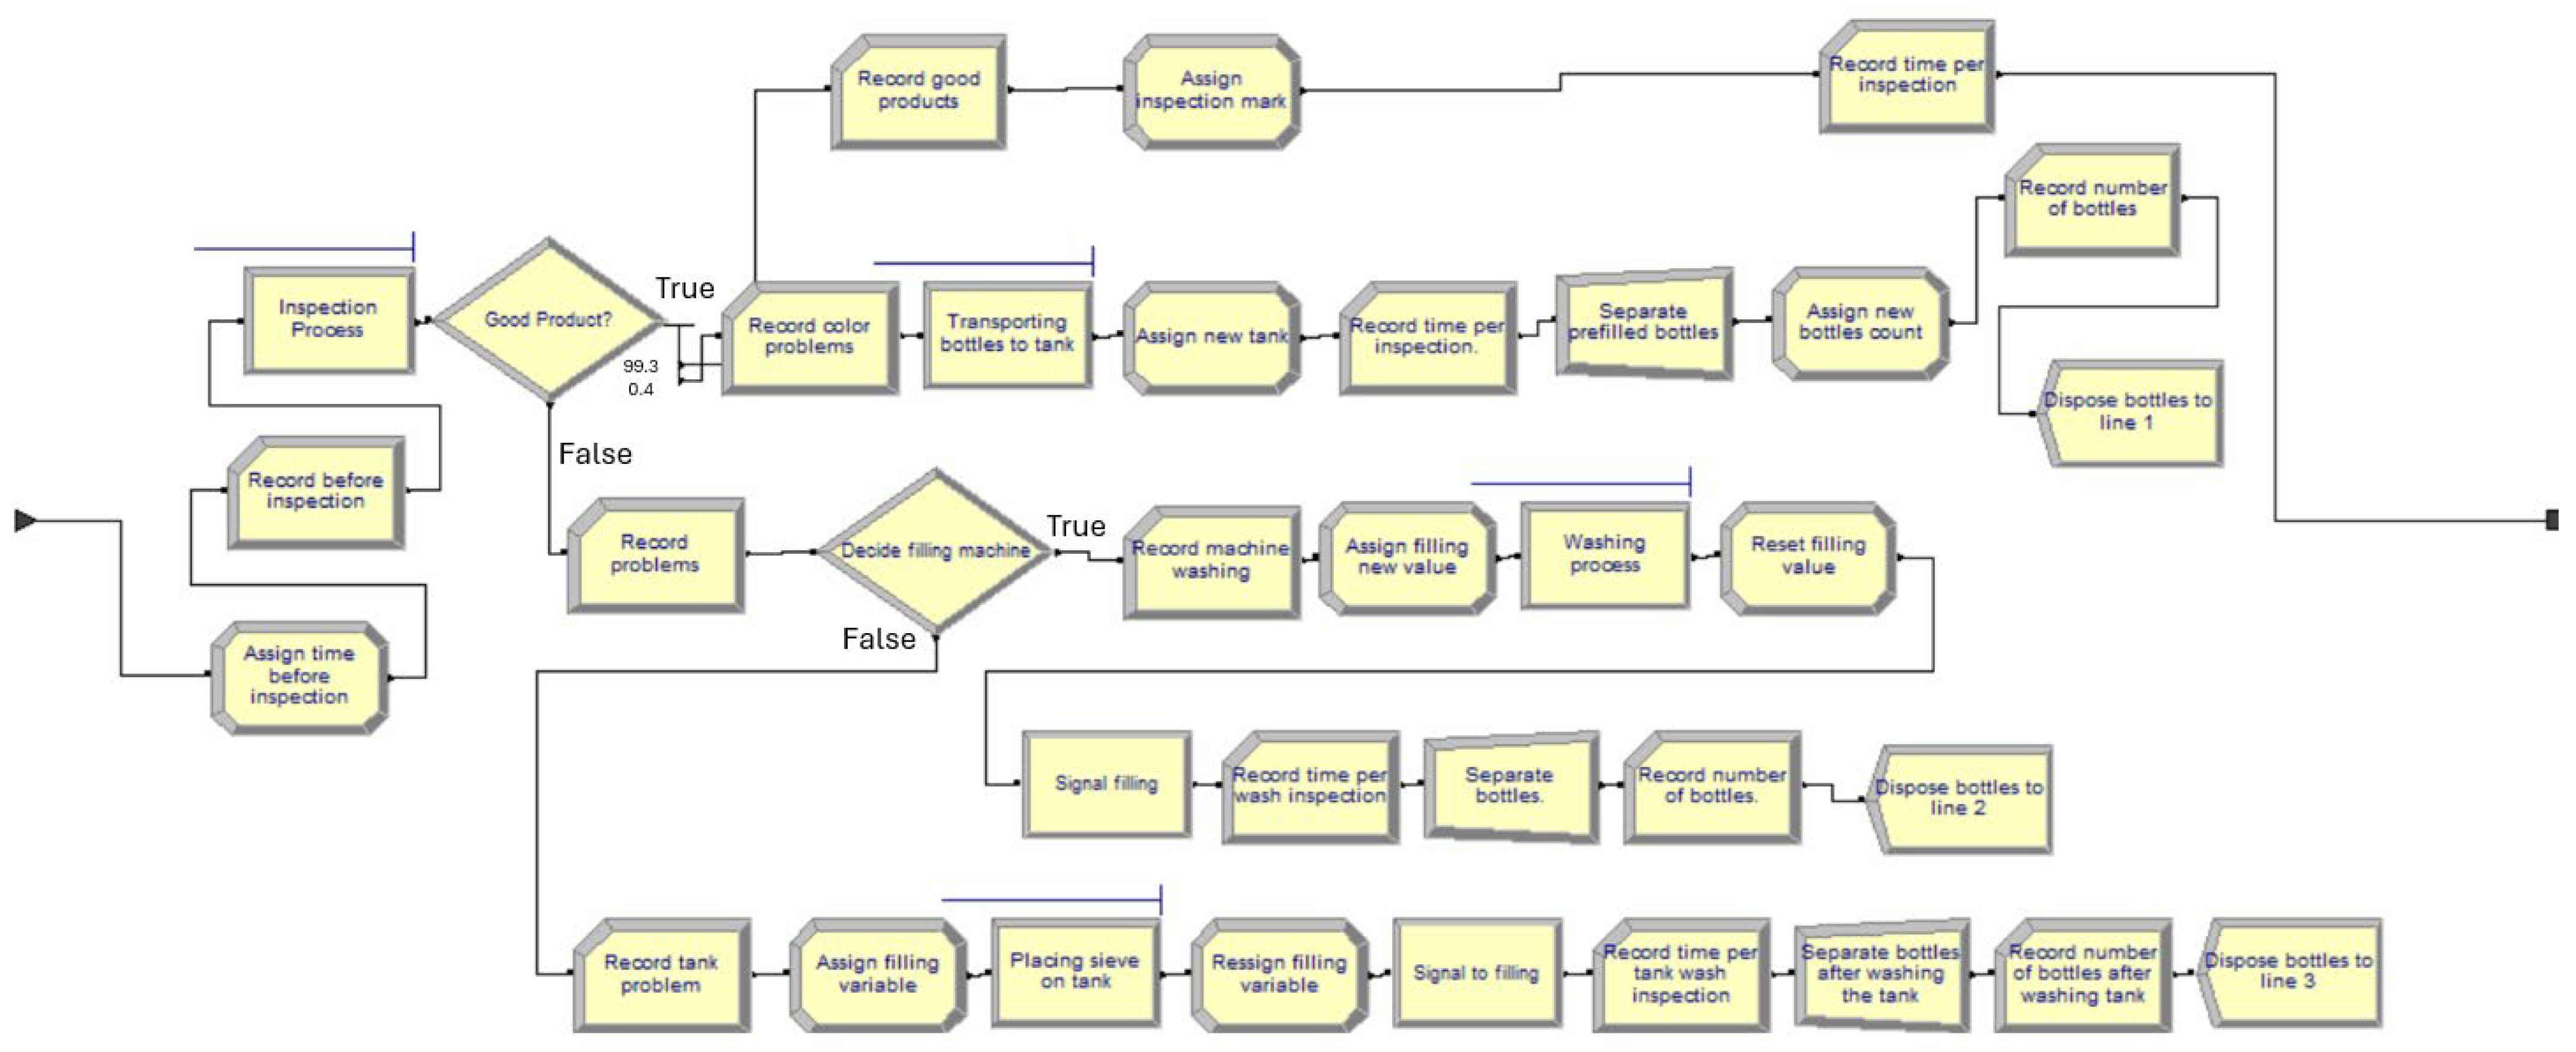
The inspection sub-model is constructed, as shown in Figure 11. The box inspection is performed by one inspector every 20 min with an inspection time of 45 s.

2.1.10. Palletizing Process

After the boxes are taped and inspected, they proceed as shown in Figure 12 to the pallet at the end of the production line with a transfer time defined as TRI (2, 3, 5) seconds. Each pallet contains 72 boxes wrapped securely. This process is performed manually and takes 3 s. Completed pallets are then transported to the finished goods warehouse.
Simulation for the production line was run for a two-shift working day of 11.5 h/shift and replicated 50 times. Simulation results were then compared to the actual output to assess the model’s validity and reliability, as shown in Table 3. The maximum error between the simulated output and actual observed data is 2.79% for the transportation to the retaping process. Consequently, the simulation model is considered valid because the error is less than 5%.
Overall Equipment Effectiveness (OEE) is commonly used to measure three critical manufacturing performance indicators (availability %, quality %, and performance %). Measuring OEE provides a valuable indication of how to systematically improve production line processes and provides an accurate picture of how effectively a process runs over time. OEE is calculated as follows [33]:
O E E = A v a i l a b i l i t y × Q u a l i t y × P e r f o r m a n c e
Availability (%) considers all unplanned and planned events that stop planned production and result in machine downtime. Availability is calculated using Equation (2).
A v a i l a b i l i t y   % = R u n   T i m e P l a n n e d   P r o d u c t i o n   T i m e   × 100 %
where Planned Production Time (PPT) is calculated as follows:
PPT = Shift Working Hours − Breaks
and
Run Time = PPT Down Time
According to the simulation results, the Availability for each process is calculated and presented in Table 4. Furthermore, quality (%) considers quality losses, which encompass manufactured parts that fail to meet quality requirements and standards. Quality can be measured as follows:
Q u a l i t y = G o o d   C o u n t T o t a l   C o u n t × 100   %  
The calculated quality (%) for each process is presented in Table 5. Finally, performance (%) considers anything that causes the manufacturing process to run at less than the maximum possible speed when it is running. Performance can be measured as follows [34]:
P e r f o r m a n c e = I d l e   C y c l e   T i m e × T o t a l   c o u n t   R u n   T i m e × 100   %
where the ideal cycle time (ICT) represents the minimum time to produce one part. The performance of each process is calculated and presented in Table 6.
Table 7 displays the calculated OEE for the production line. It is noted that the bottle placing, filling process, labeling process, and taping correspond to OEE values below the targeted world-class level (=85%). Consequently, improvement actions are needed to enhance the OEE level for these processes.

2.2. Environmental Assessment

The environmental assessment for the soap production line is conducted as follows [17]. The basic components of the soap bar are as follows: (1) fats and oils, including palm oil, palm stearine oil, palm kernel oil, and coconut fatty acids; (2) sodium hydroxide (NaOH), also known as caustic soda; and (3) sodium chloride (NaCl). The basic formulations of soap are as follows:
Fats/Oils + Water --------> Fatty Acids + Glycerin
Fatty Acids + Caustic Soda --------> Soaps + Water
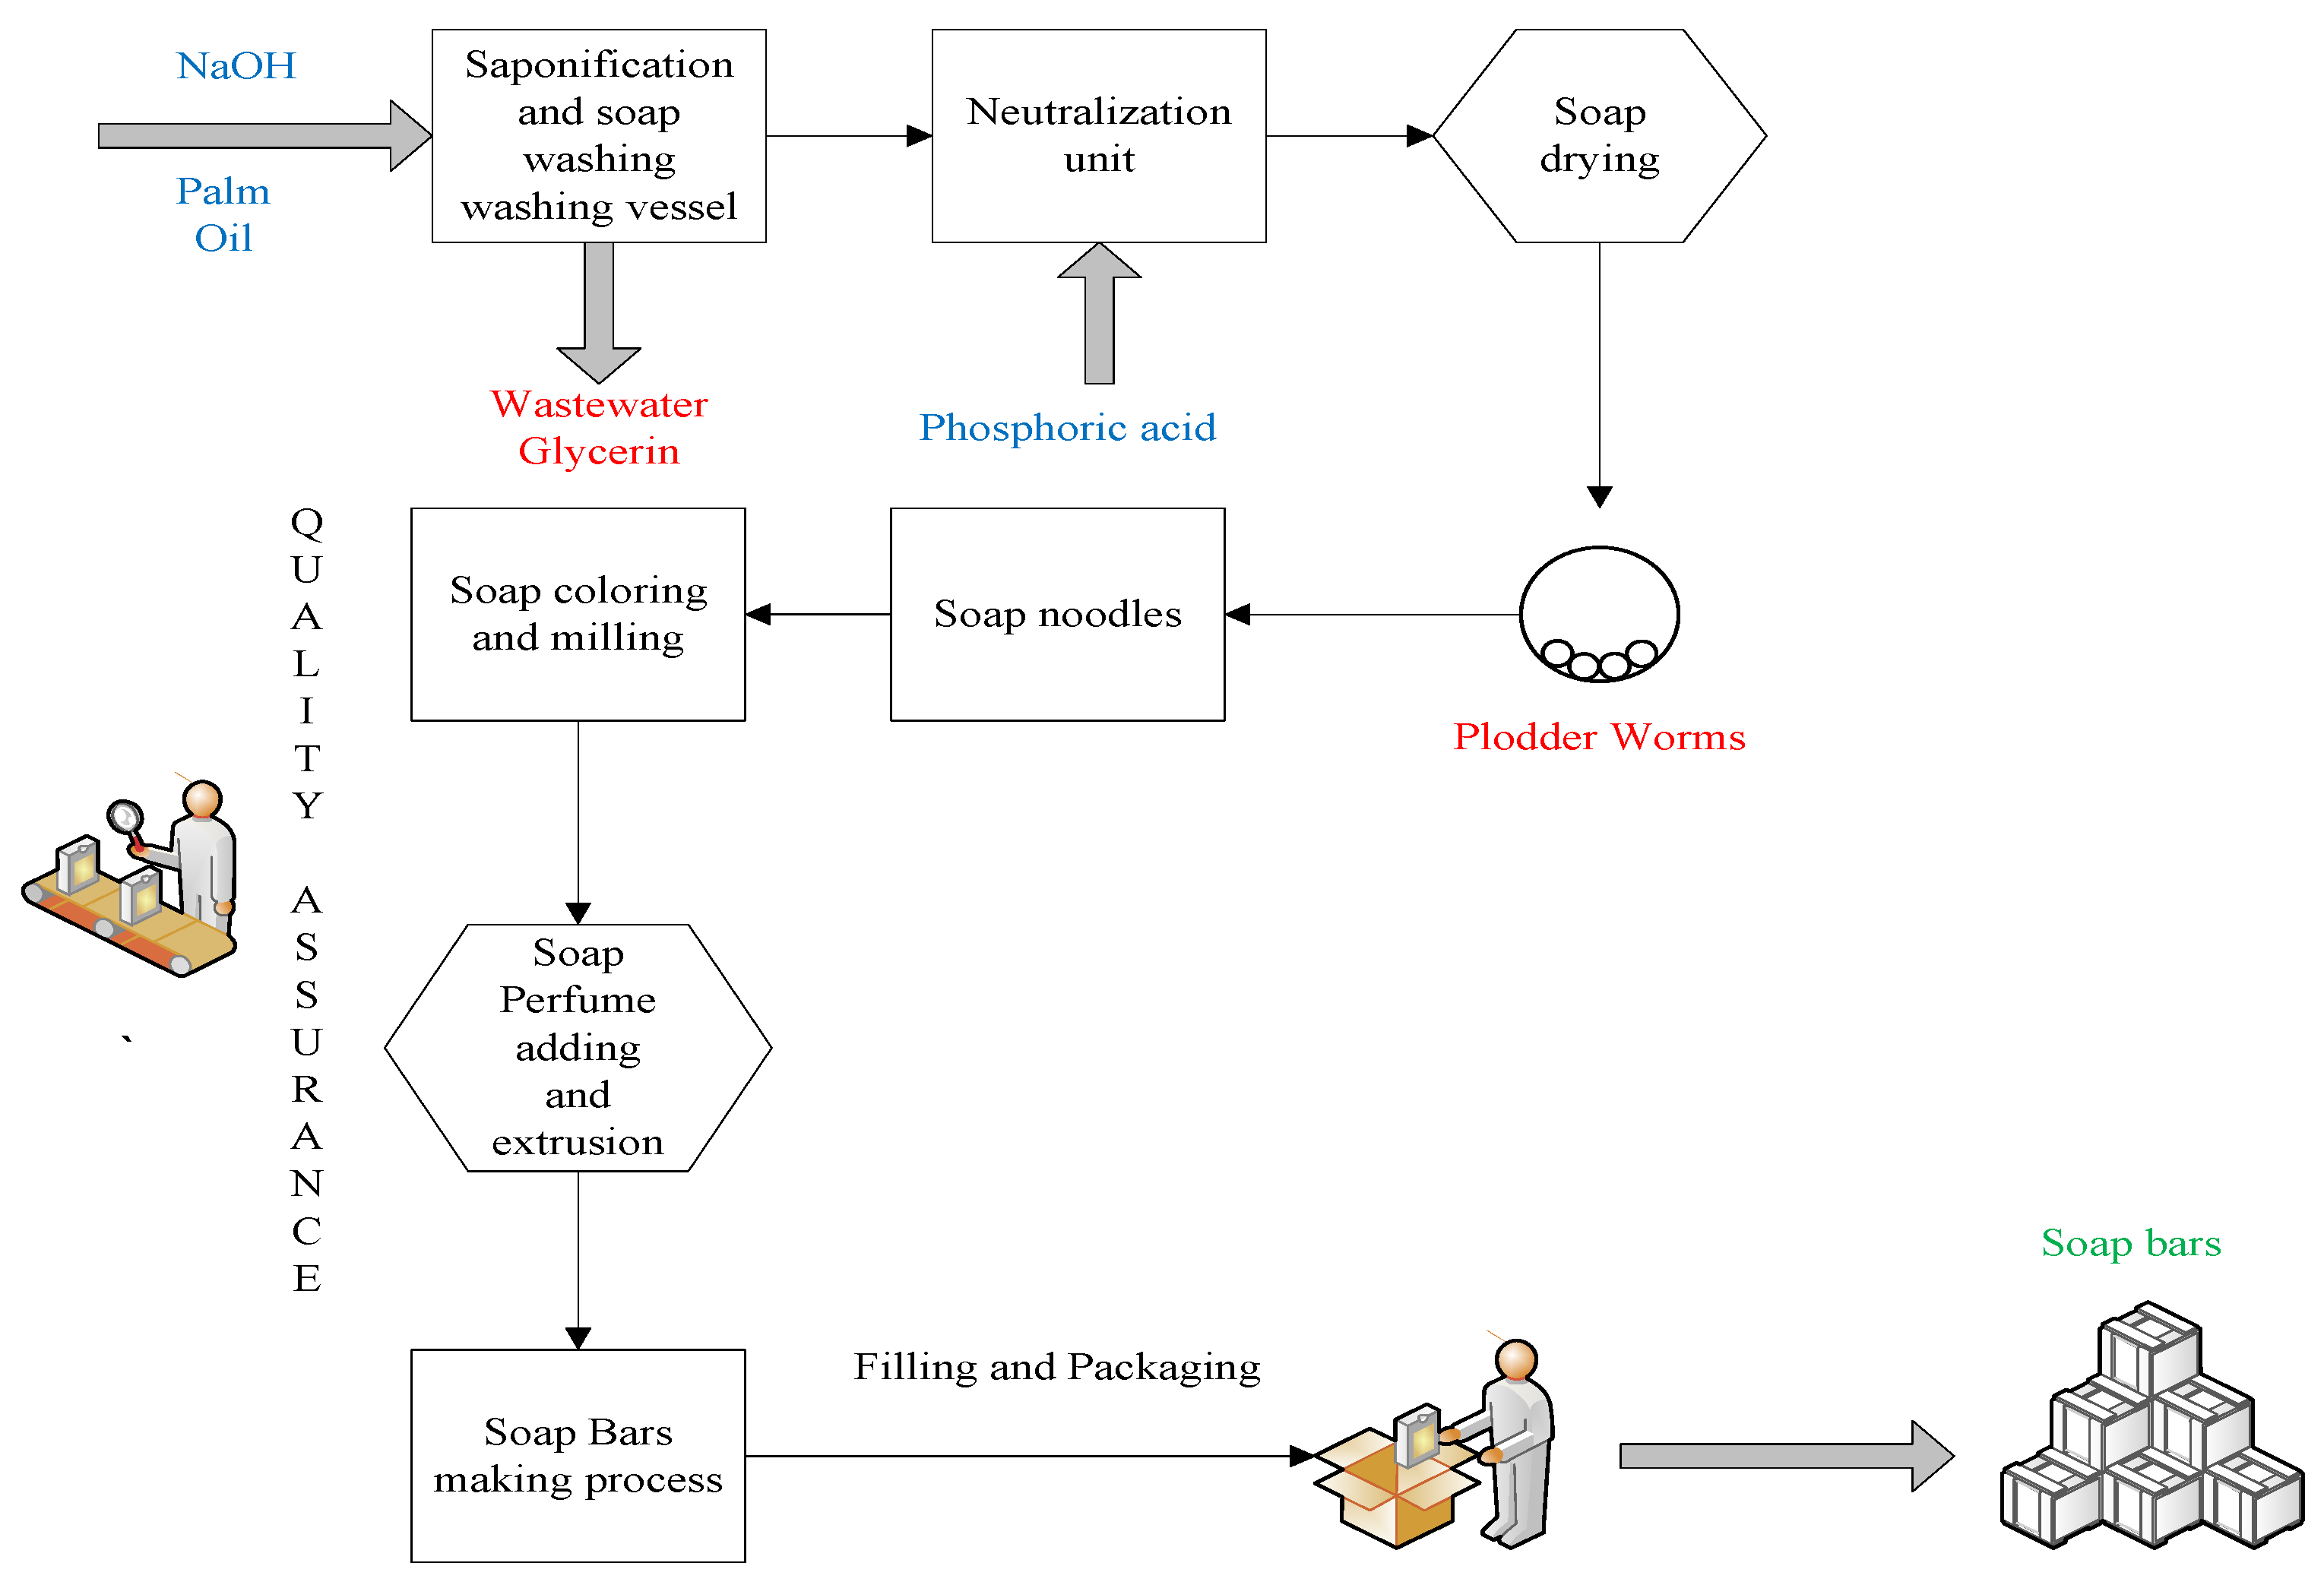
Figure 13 illustrates the soap production processes; it usually goes through saponification and toilet soap production processes, where palm oil and other raw fats are thermally treated with steam in the presence of caustic soda (NaOH), forming soap and water with traces of glycerin and salt by-products. The neutralization process is important, as the caustic levels are unacceptably high for toilet soap.
Five profiles are considered when preparing the environmental characteristics, including the following:
(i)
Raw material unit index
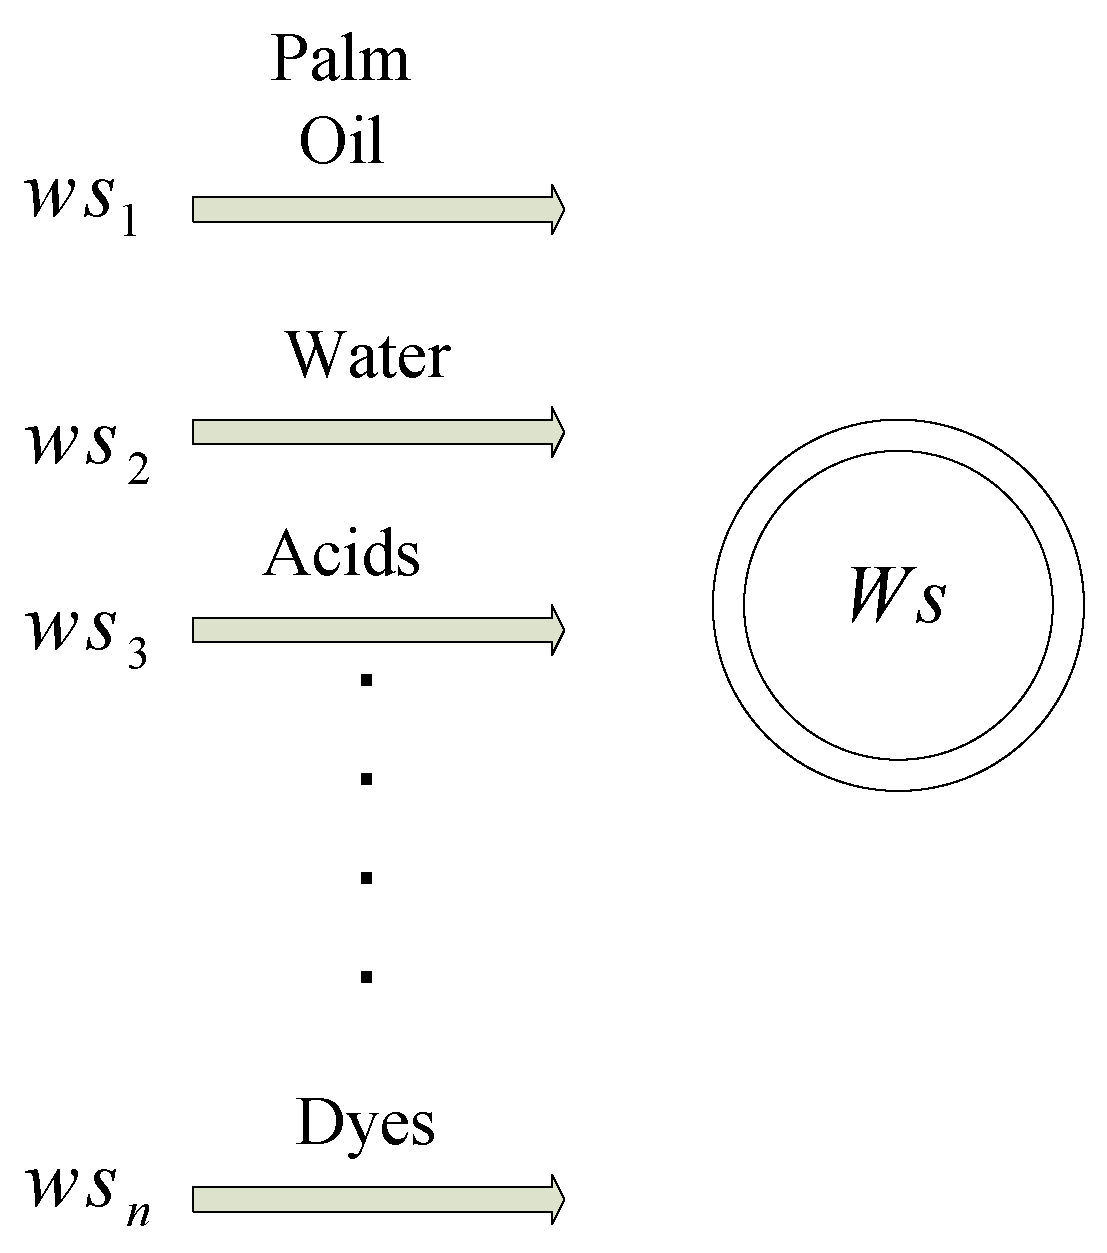
The raw material profile for the soap product, as shown in Figure 14, comprises quantitative data related to all raw material flows, including primary raw materials, auxiliary raw materials, and water used in technological processes. Let Ws and wsi denote the raw material unit index and the partial raw material unit index for the primary raw material i, respectively.
w s i = m s i m c p ,
where msi denotes the weight of the primary raw material i used in the technological process, and mcp denotes the total weight of all products manufactured in the technological process.
(ii)
Energy unit index
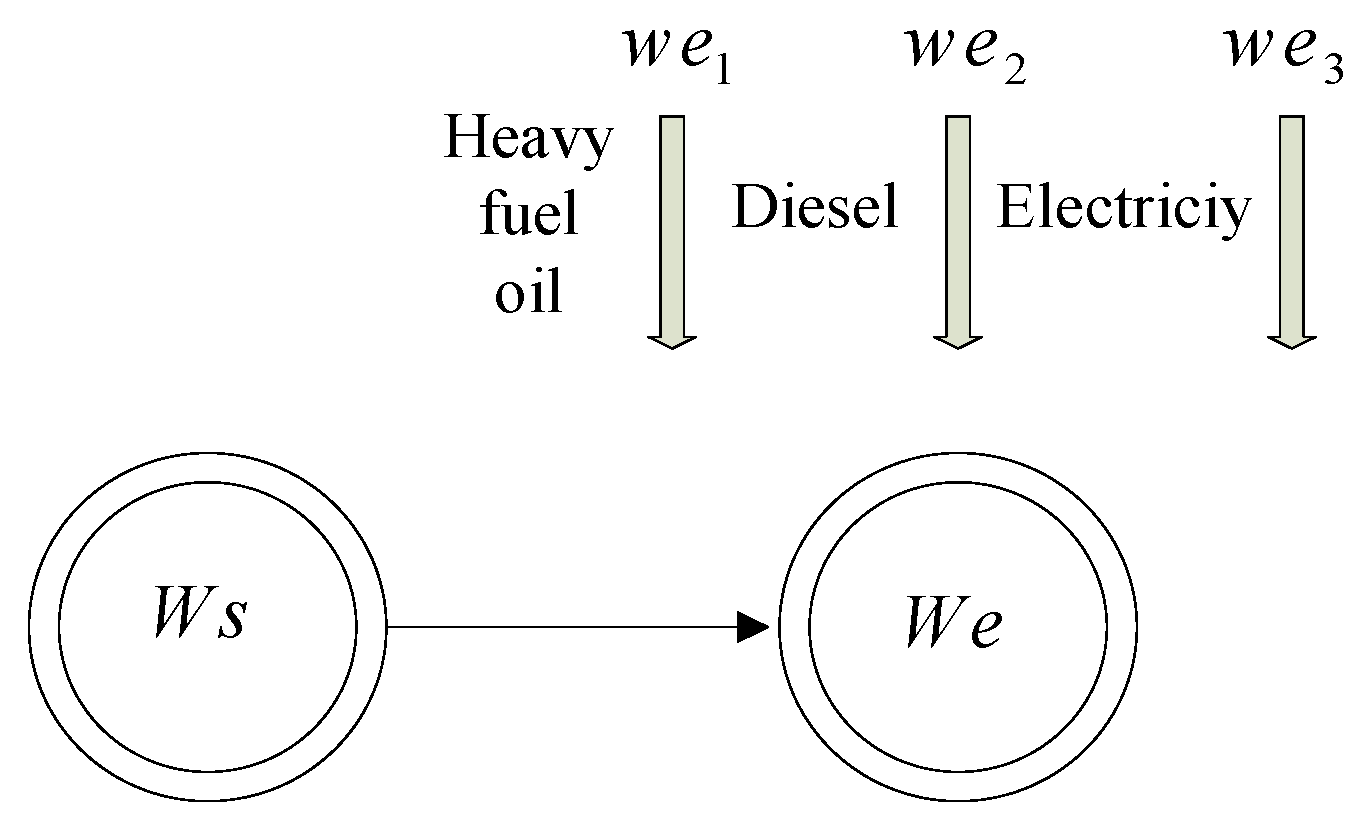
The energy profile, as shown in Figure 15, covers quantitative data related to the consumption of all power raw material flows (solid, liquid, and gaseous fuels) and any kind of energy (heat, electricity) used in the process. Let wej denote the partial energy unit index for the power raw material j, calculated as follows:
w e j = z e j m c p ,
where zej denotes the consumption of power raw material j, expressed in weight of standard fuel.
(iii)
Waste unit index
The waste profile, as shown in Figure 16, consists of quantitative data related to all waste flows, including solid, liquid, and gaseous wastes generated during the process. Let w o s k and k o s k denote the partial solid waste generation unit index and the relative solid toxicity index, respectively. Let mosk denote the weight of solid waste generated. Then,
w o s k = m o s k m c p
Let wocl and kocl denote the partial liquid waste generation unit index and the relative liquid toxicity index, respectively. Then,
w o c l = m o c l m c p
where mocl denotes the weight of liquid waste generated.
Let wogg and kogg denote the partial gaseous waste generation unit index and the relative gaseous toxicity index, respectively. Then,
w o g g = m o g g m c p
where m o g k denotes the weight of gaseous waste generated.
(iv)
Product unit index
The product profile, as shown in Figure 17, comprises quantitative data related to product flows that have adverse environmental impacts resulting from the technological process. Let wpp denote the partial product unit index for product p, calculated as follows:
w p p = m p p m c p
where msp denotes the weight of the manufactured product p by the technological process. Let
k p e = m s e m p p
where mse denotes the weight of environmentally hazardous components of the unit product p.
(v)
Packaging unit index
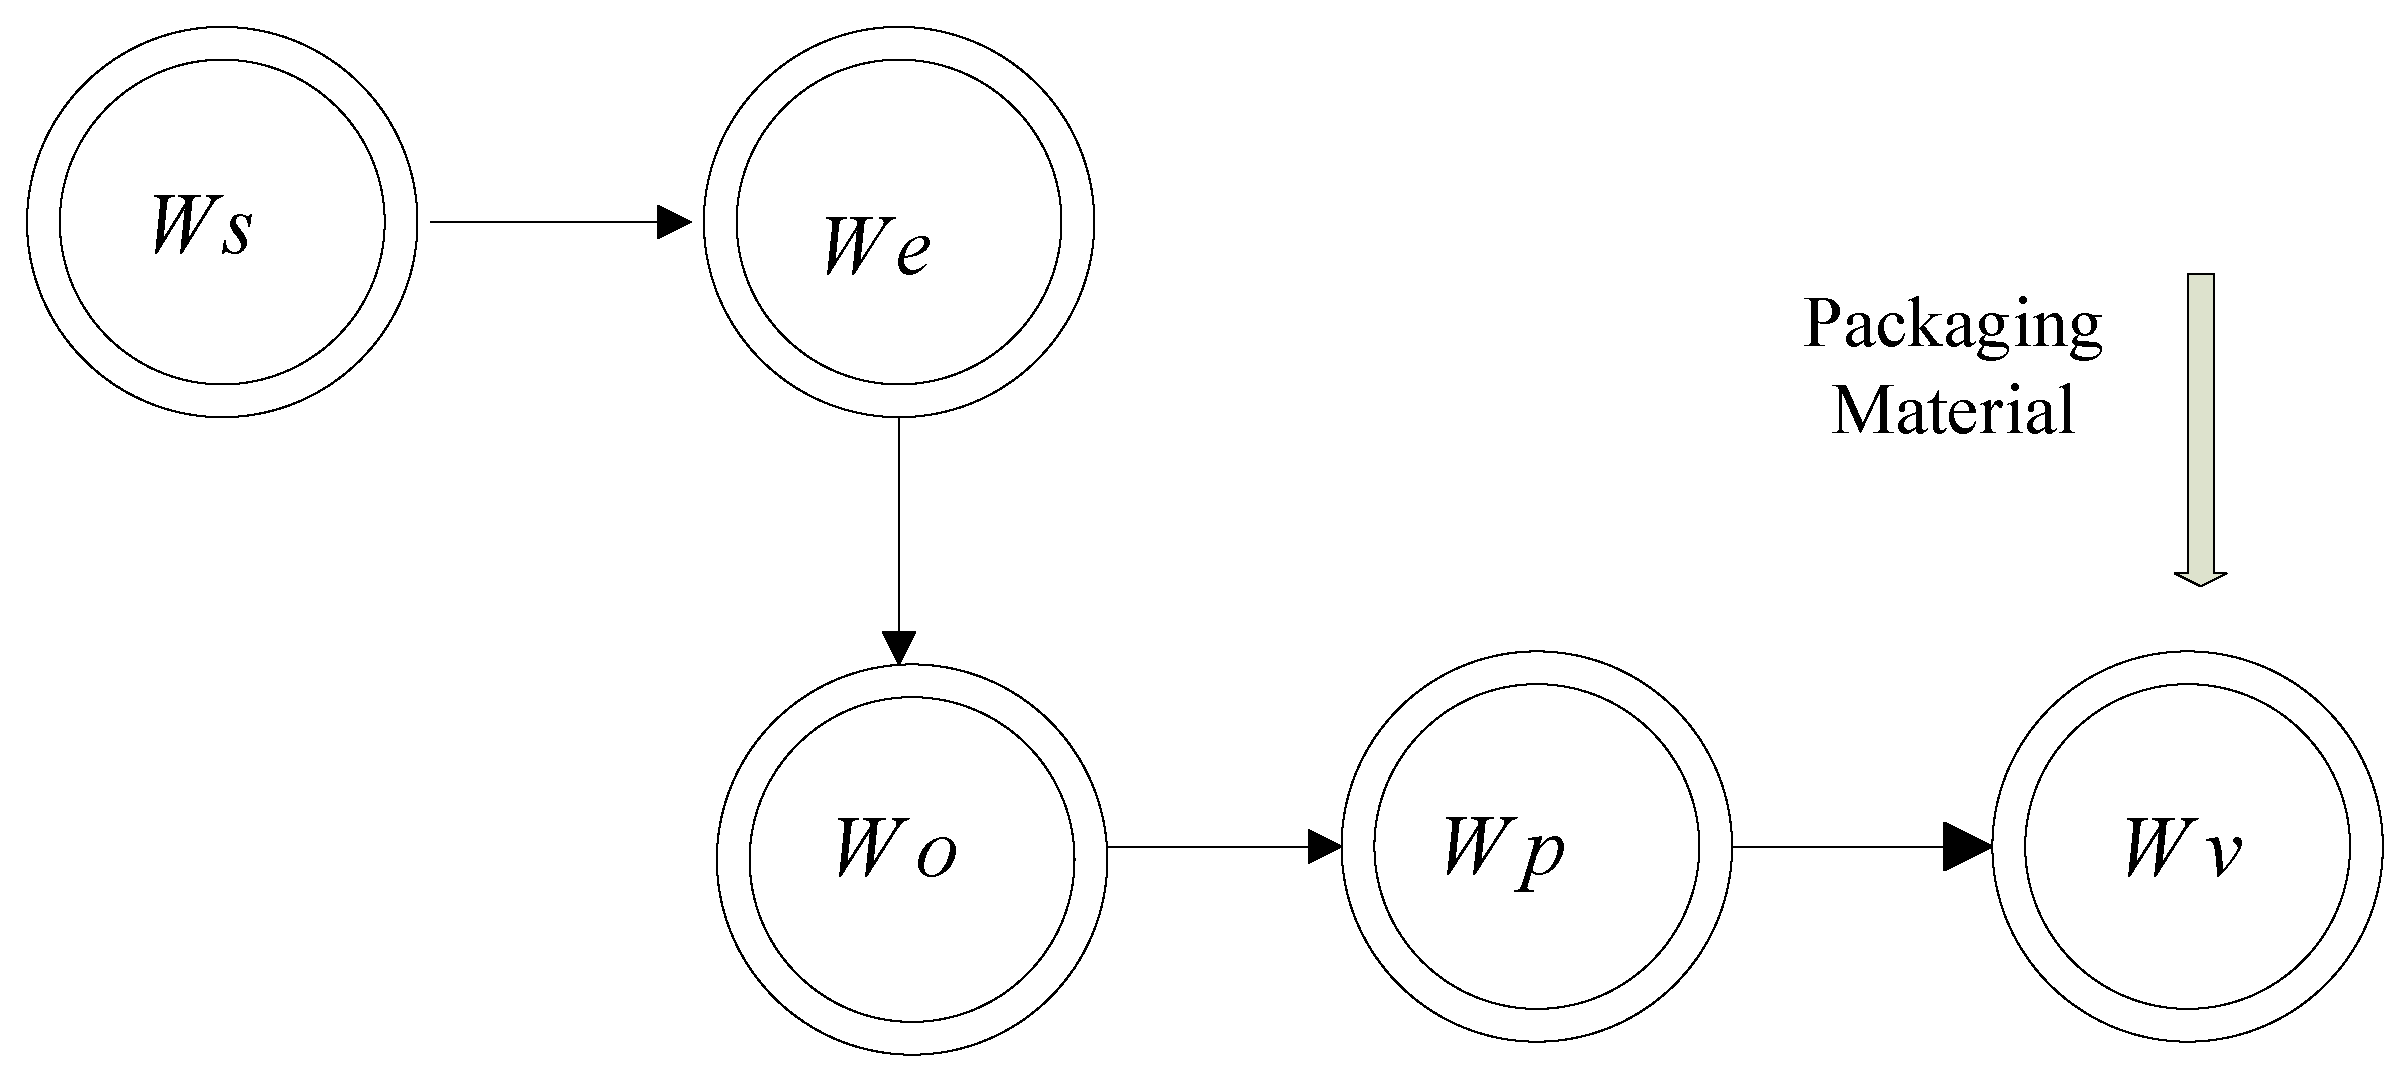
The packaging profile, as shown in Figure 18, comprises the environmental characteristics of the packaging materials used in the technological process, including quantitative data related to all types of packaging, while considering their negative environmental impact. Let wvh be the partial packaging unit index for packaging material h, calculated as follows:
w v h = m v h m c p
That mvh denotes the weight of the kind of packaging material h. Let
k v h = k v s k v s max
where kvs and kvs max denote the total environmental loading index for the given packaging material and the maximum value of the total environmental loading index for packaging materials, respectively.
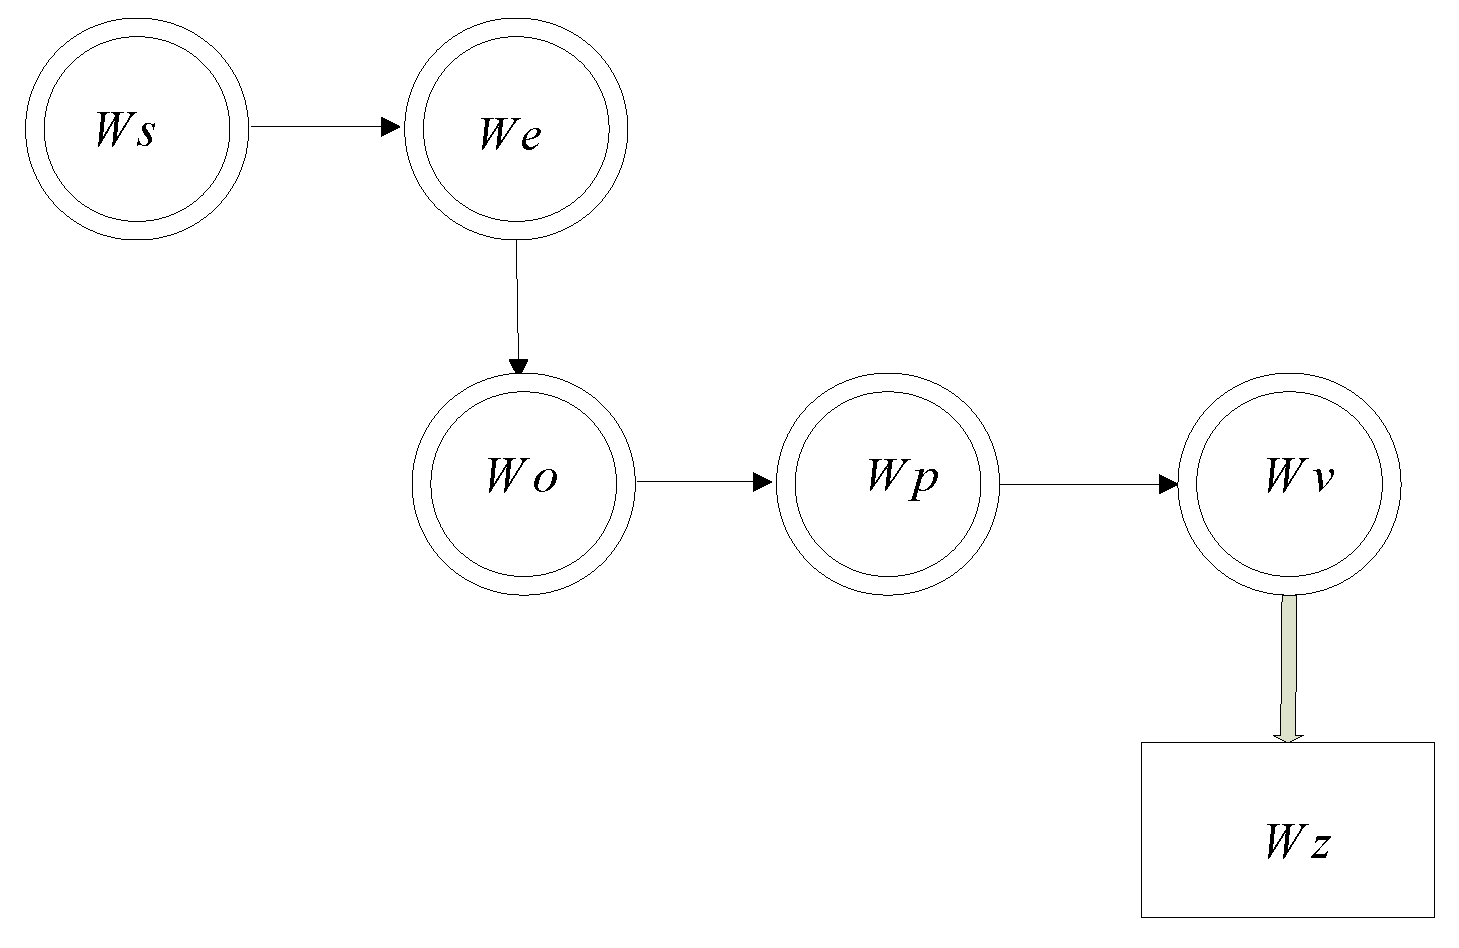
The integrated index is a mathematical expression describing the developed model for the overall environmental assessment of the technological process, while considering the environmental quality of the manufactured products. The integrated environmental assessment index, Wz, for cleaner production technologies, as shown in Figure 19, is estimated using Equation (16).
W z = ( W s ) 2 + ( W e ) 2 + ( W o ) 2 + ( W p ) 2 + ( W v ) 2
The environmental nuisance for any analyzed technological process is classified according to Table 8.
The Wz was calculated to determine the degree of environmental nuisance related to the technological processes at the soap factory and is presented as follows:
(i)
Raw material unit index
The raw material unit index, Ws, for the soap production was calculated for the raw materials, and the results are displayed in Table 9. For illustration, the unit index for palm oil is calculated as follows. The weight of palm oil used in the process is 1960 metric tons, and the total weight of all soap manufactured in the process is 3605 tons. The partial palm oil unit index, ws1, is calculated as 0.544 (=1960/3605). Knowing that the mass of one unit of soap produced is 0.1 kg, which gives 10 units in 1 kg, ws1 in terms of units produced is 5.44.
From Table 9, the raw material unit index (Ws) is 10.763, where the largest partial raw material unit index (=5.44) corresponds to the palm oil.
(ii)
Energy unit index
Let Q w be the calorific value of the heat amount produced by the complete combustion of a material or fuel, measured in units of energy per amount of material, as shown in Table 10. The energy unit index, We, is estimated for three raw energy materials as shown in Table 11. Knowing that 1 t p u (ton per standard fuel) equals 1 Mt of hard coal and 29.3 MJ/kg. Also, the Q w for heavy fuel oil (HFO) is 43.5 MJ/kg. Then, the tpu of HFO, tupHFO, is calculated as follows:
tpu HFO = 43.5 29 = 1.484
The annual heavy fuel oil consumption is 1705 Mt. The annual tupHFO is 2530.66 tons/year. The m c p is 3605 tons. Then, the partial energy unit index, we1, is 0.702 (=2530.66/3605). For 10 units of product, we1 is 7.02. The partial energy unit indices for diesel and electricity are estimated similarly.
In Table 11, the We is estimated to be 15.889, where the partial energy indices for heavy fuel oil (=7.11) and diesel (=7.61) contribute significantly to We. An insignificant partial energy index is found for electricity.
(iii)
Waste unit index
The technological process generates no solid waste. Thus, the waste material unit index, Wo, is calculated from the partial waste indices for the liquid and gaseous wastes as shown in Table 12. For liquid waste, for example, given the volume of water waste is 29,481 m3 (mass = 29,481 tons). The partial waste generation unit index for water waste, woc1, is 8.1778. The relative toxicity (kt = 0.9) and k max (=0.9) give k of 1.0.
In Table 12, it is observed that the partial liquid waste index (=8.1778) constitutes the largest portion of the waste unit index (10.6181).
(iv)
Product unit index
The product unit index is calculated from the partial product indices of soap and byproducts. First, the partial unit indices of the hazardous components, such as NaOH, fragrances, titanium dioxide, and phosphoric acid, are calculated as shown in Table 13. Then, the product unit index is estimated as shown in Table 14. The primary product is soap (wp1 = 1) is calculated as follows. Taking NaOH of mass 710 tons results in an environmental nuisance index, kp1, of 0.196948 (=710/3605). The partial product unit index is 0.196948 (=0.196948 × 1). The total index for hazardous components of soap is 0.225.
In Table 14, the components NaOH and fragrances of the primary product (soap) contribute significantly to the environmental nuisance index.
(v)
Packaging unit index
The packaging material unit index for cartons is obtained as follows. Each packaging carton weighs 0.5 kg and contains 100 units. A total production of 36,050,000 units needs 180,250 kg of packaging cartons. Then, the partial packaging unit index, w v 1 , for the packaging carton is 0.05 (=180,250/3,605,000).
Table 15 summarizes the profile indices, where the integrated environmental assessment index, Wz, for cleaner production technologies is calculated as 107.93.
According to Table 15, the Wz (=107.93) indicates a high degree of environmental nuisance related to its technological process.

3. Improvement Actions on the Production Line

To-Be Simulation Models

Several lean, agile, and resilient practices were deployed to enhance the performance of the production line and are presented as follows:
Action 1: Lean practice involving the addition of a container to collect waste from the filling process, as shown in Figure 20. The action collects an average waste of 10.32 mL per fill or 20 L/day.
Action 2: Resilient and lean practices by sharing the operator of bottle placing with the cap feeding station when the conveyor is full, as shown in Figure 21. The cap feeding process undergoes a problem that causes disturbances to the production line flow. The speed of two cap-feeding operators may not match the fast flow of six bottles dispatched. As a result, the conveyor and the filling machine should be stopped to cap all the bottles before proceeding to the capping machine. This action reduces the idle time of the bottle placing operator (lean) and enhances the performance of the cap feeding process under emergency conditions (resilient). Table 16 shows the OEE results for actions 1 and 2, where the OEE of bottle placing significantly increased from 20.05% to 81.31%. Moreover, the filling and cap feeding processes improved from 82.68% and 95.37% to 84.47% and 97.17%, respectively. Consequently, the capping process increased from 98% to 98.7%.
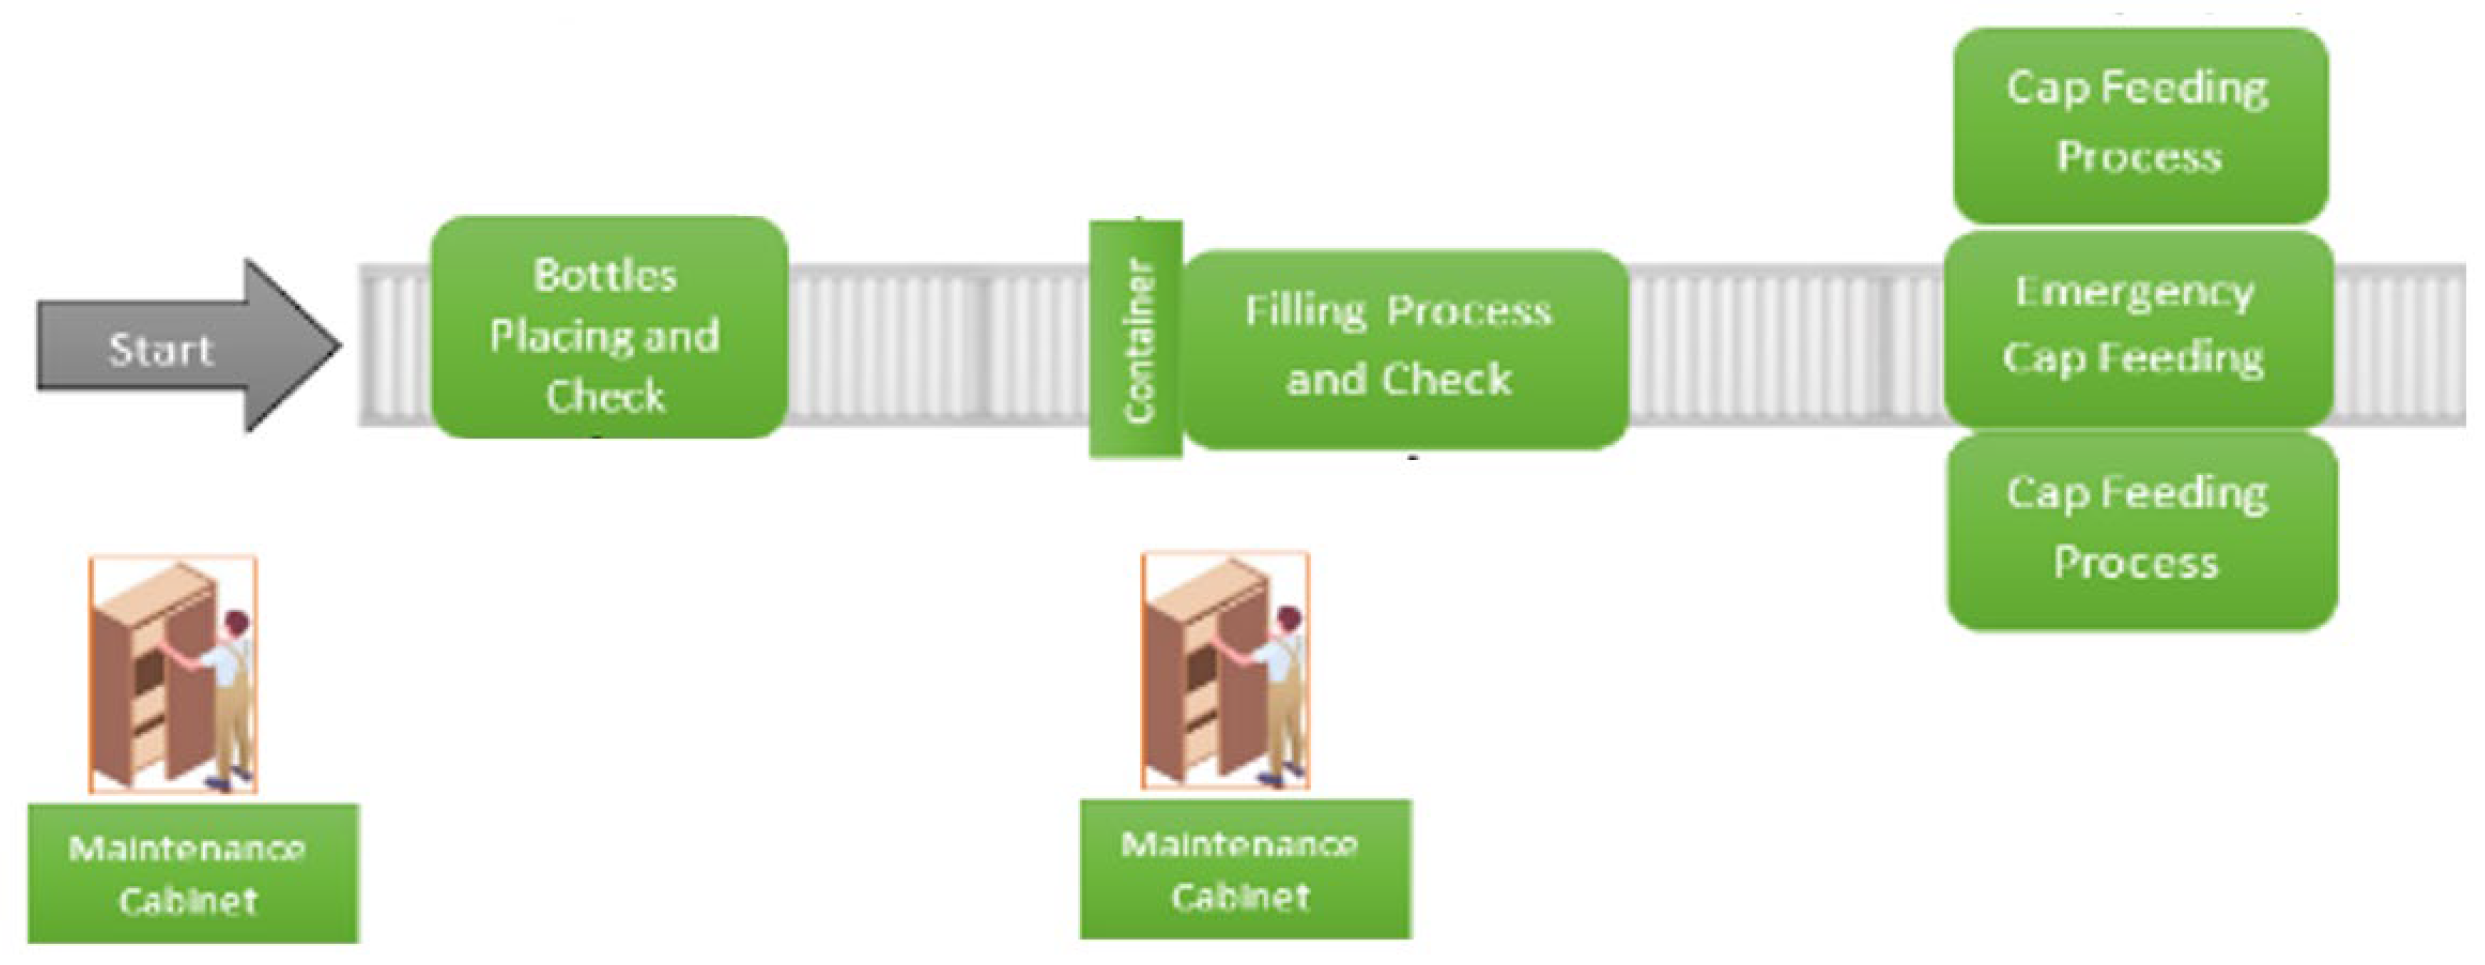
Action 3: Adopting resilient maintenance practices by placing common replacement parts, tools, and lubricants close to the production line, as shown in Figure 22. Failures, changeovers, and errors cause the production line to stop temporarily. This action results in reducing the downtimes for filling, labeling, and taping due to the shorter distance traveled to assess the failure. It thereby enhances machine availability, as shown in Table 17, where the availability of the filling, labeling, and taping processes is improved from 99.23%, 95.81%, and 99.08% to 99.5%, 97.47%, and 99.54%, respectively.
Action 4: Agile practice by sharing the taping machine with two production lines, as shown in Figure 23, to increase its performance. The arrival rate of boxes is TRIA (25,60,120) seconds. Table 18 displays the obtained OEE for actions 1 to 4, where the performance of the taping machine improved from 82.19% to 100%. Consequently, the OEE of the taping process increased from 82.19% to 99.92%.

4. Research Results

The results of this research are summarized as follows.

4.1. Simulation Results

The adoption of lean, agile, and resilient actions in the production line resulted in the OEE improvements shown in Table 18. Generally, relative improvements of more than 20% indicate significant improvement. In Table 18, the OEE values of the bottle placing and taping processes increased significantly compared to the as-is condition by 237.53% and 26.02%, respectively. Moreover, the filling and labeling processes were enhanced slightly by 4.67% and 5.41%, respectively. Furthermore, the smallest percentages of availability, quality, and performance are 97.46%, 99.82%, and 81.56%, respectively. These improvements can result in reduced waiting time and average number of units in the queue, and improved performance of the production line.

4.2. Waste Treatment

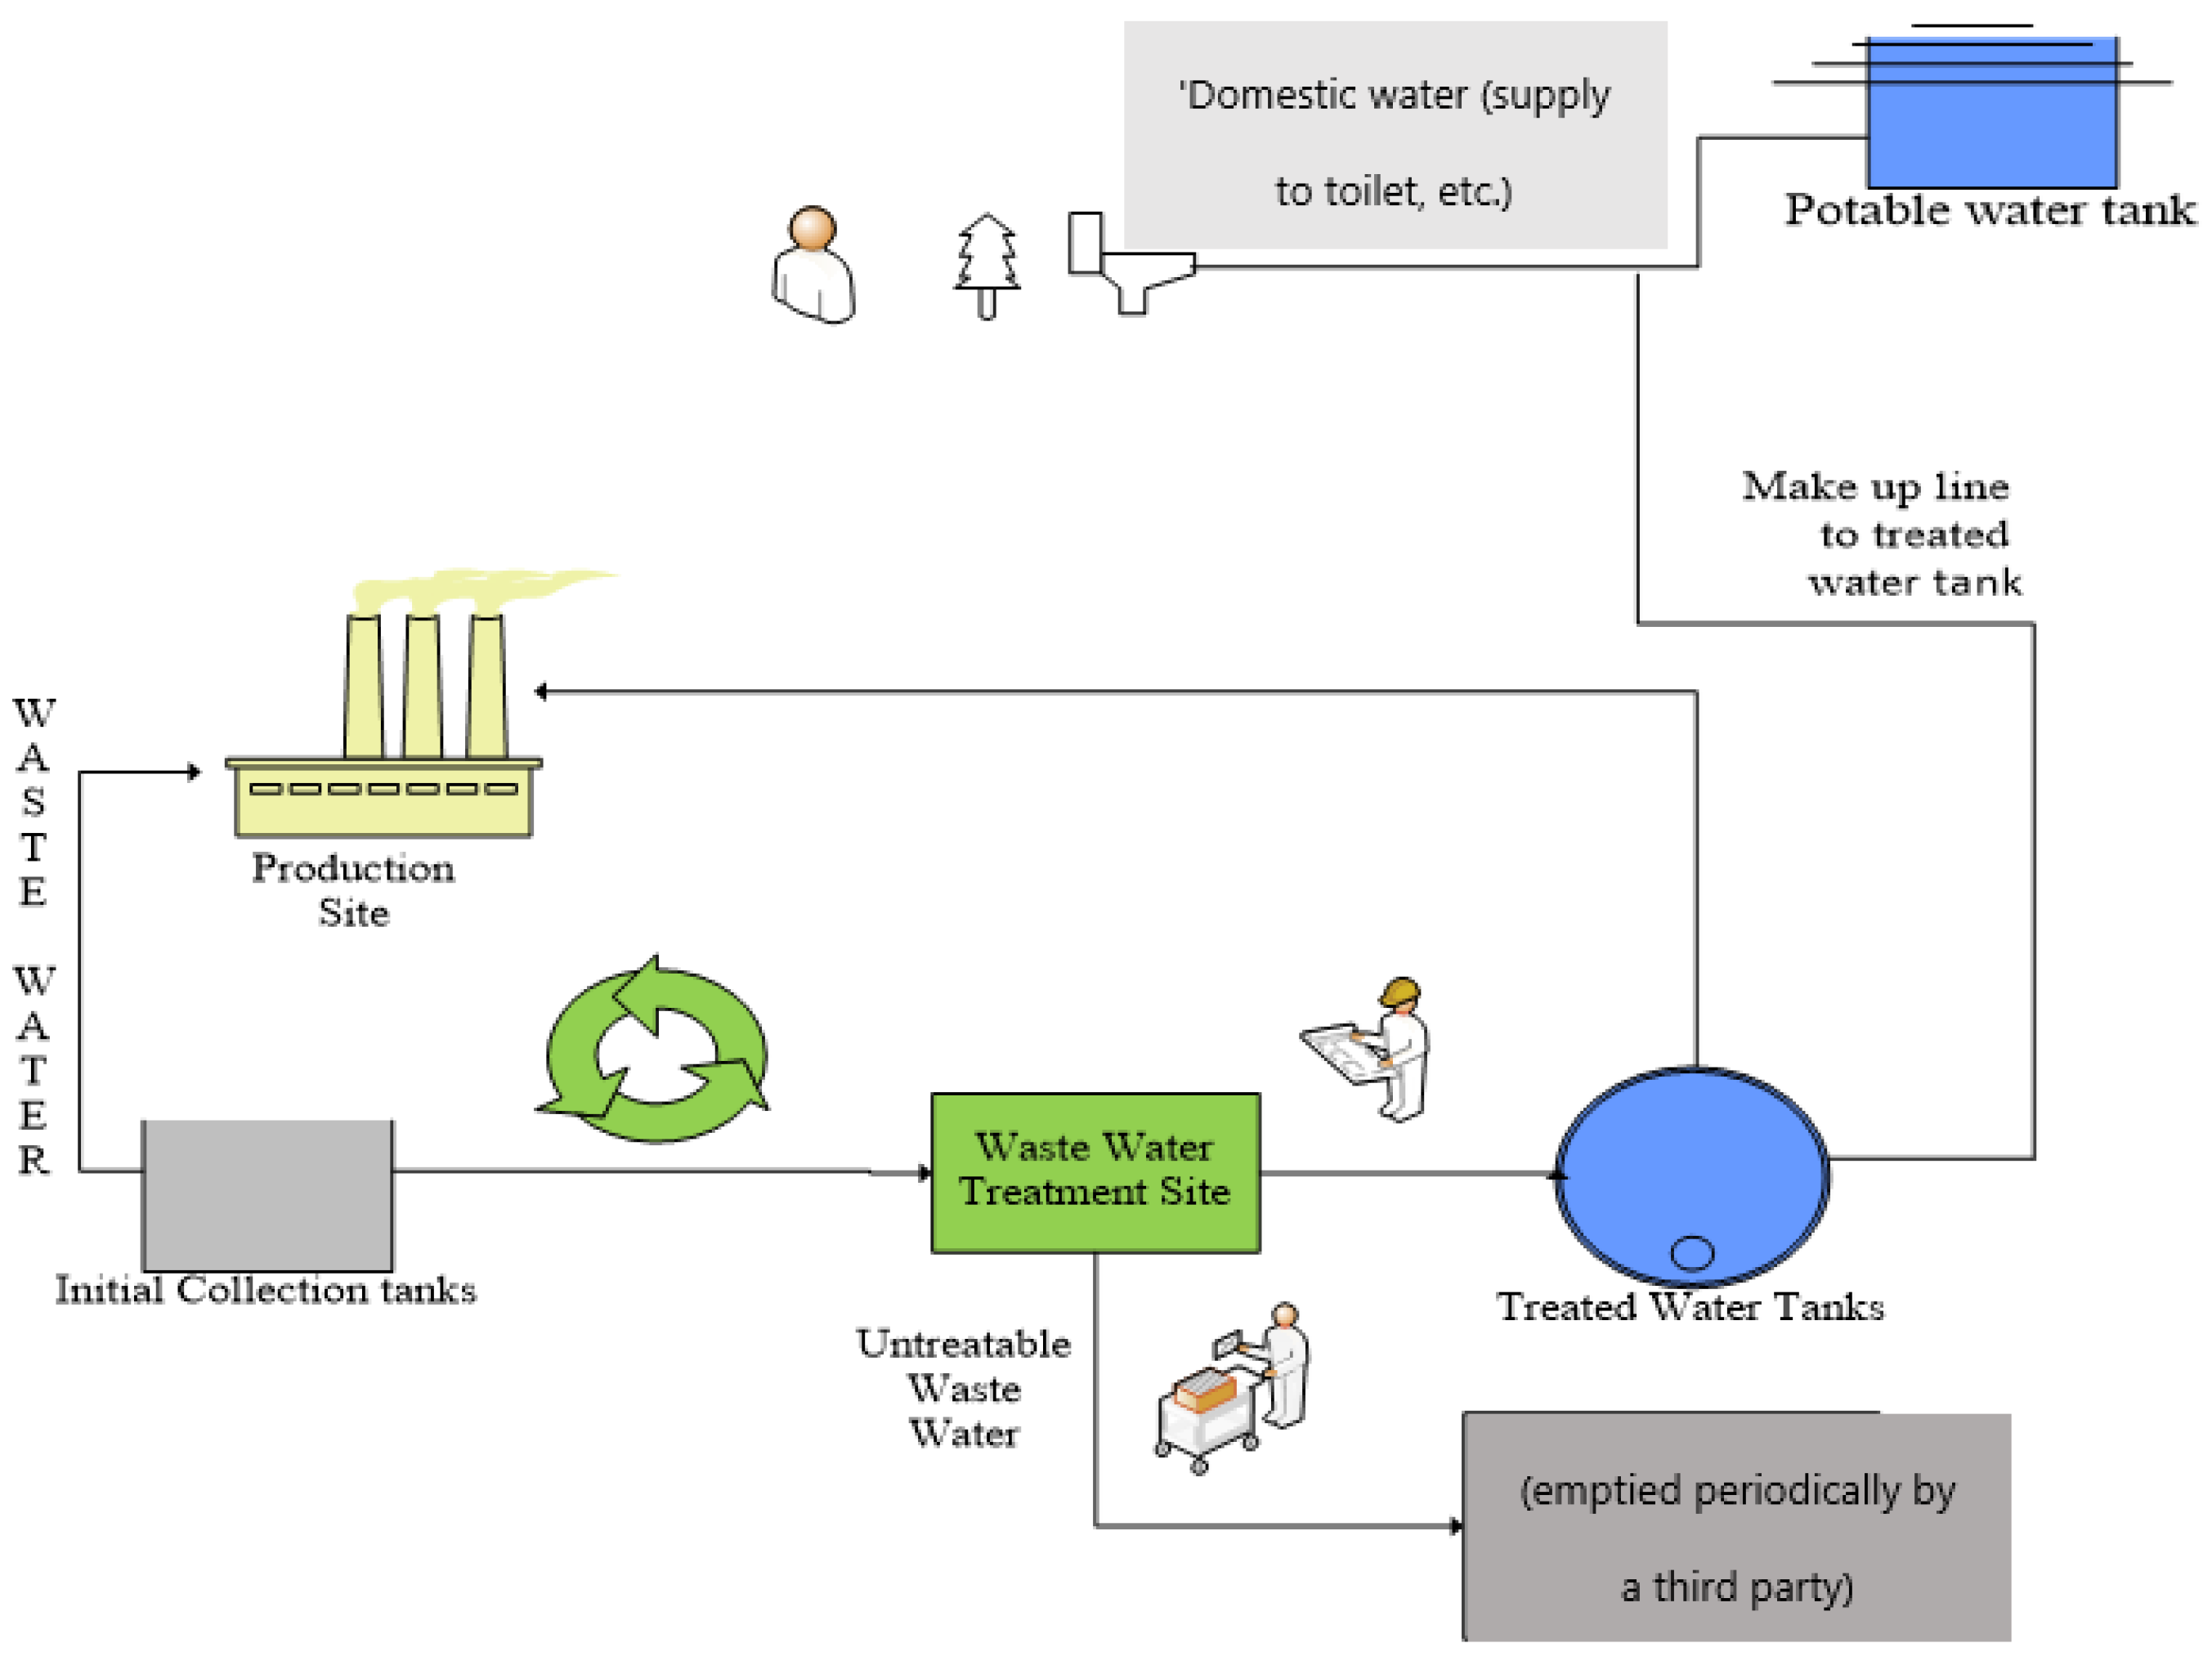
Environmental assessments showed that water waste is the most significant environmental problem. Figure 24 represents the proposed waste treatment system. Water is treated physically, chemically, and biologically to meet a minimum level of quality needed for the process. The treated water passes through pipes back to the production site, while the sludge is collected and emptied periodically.
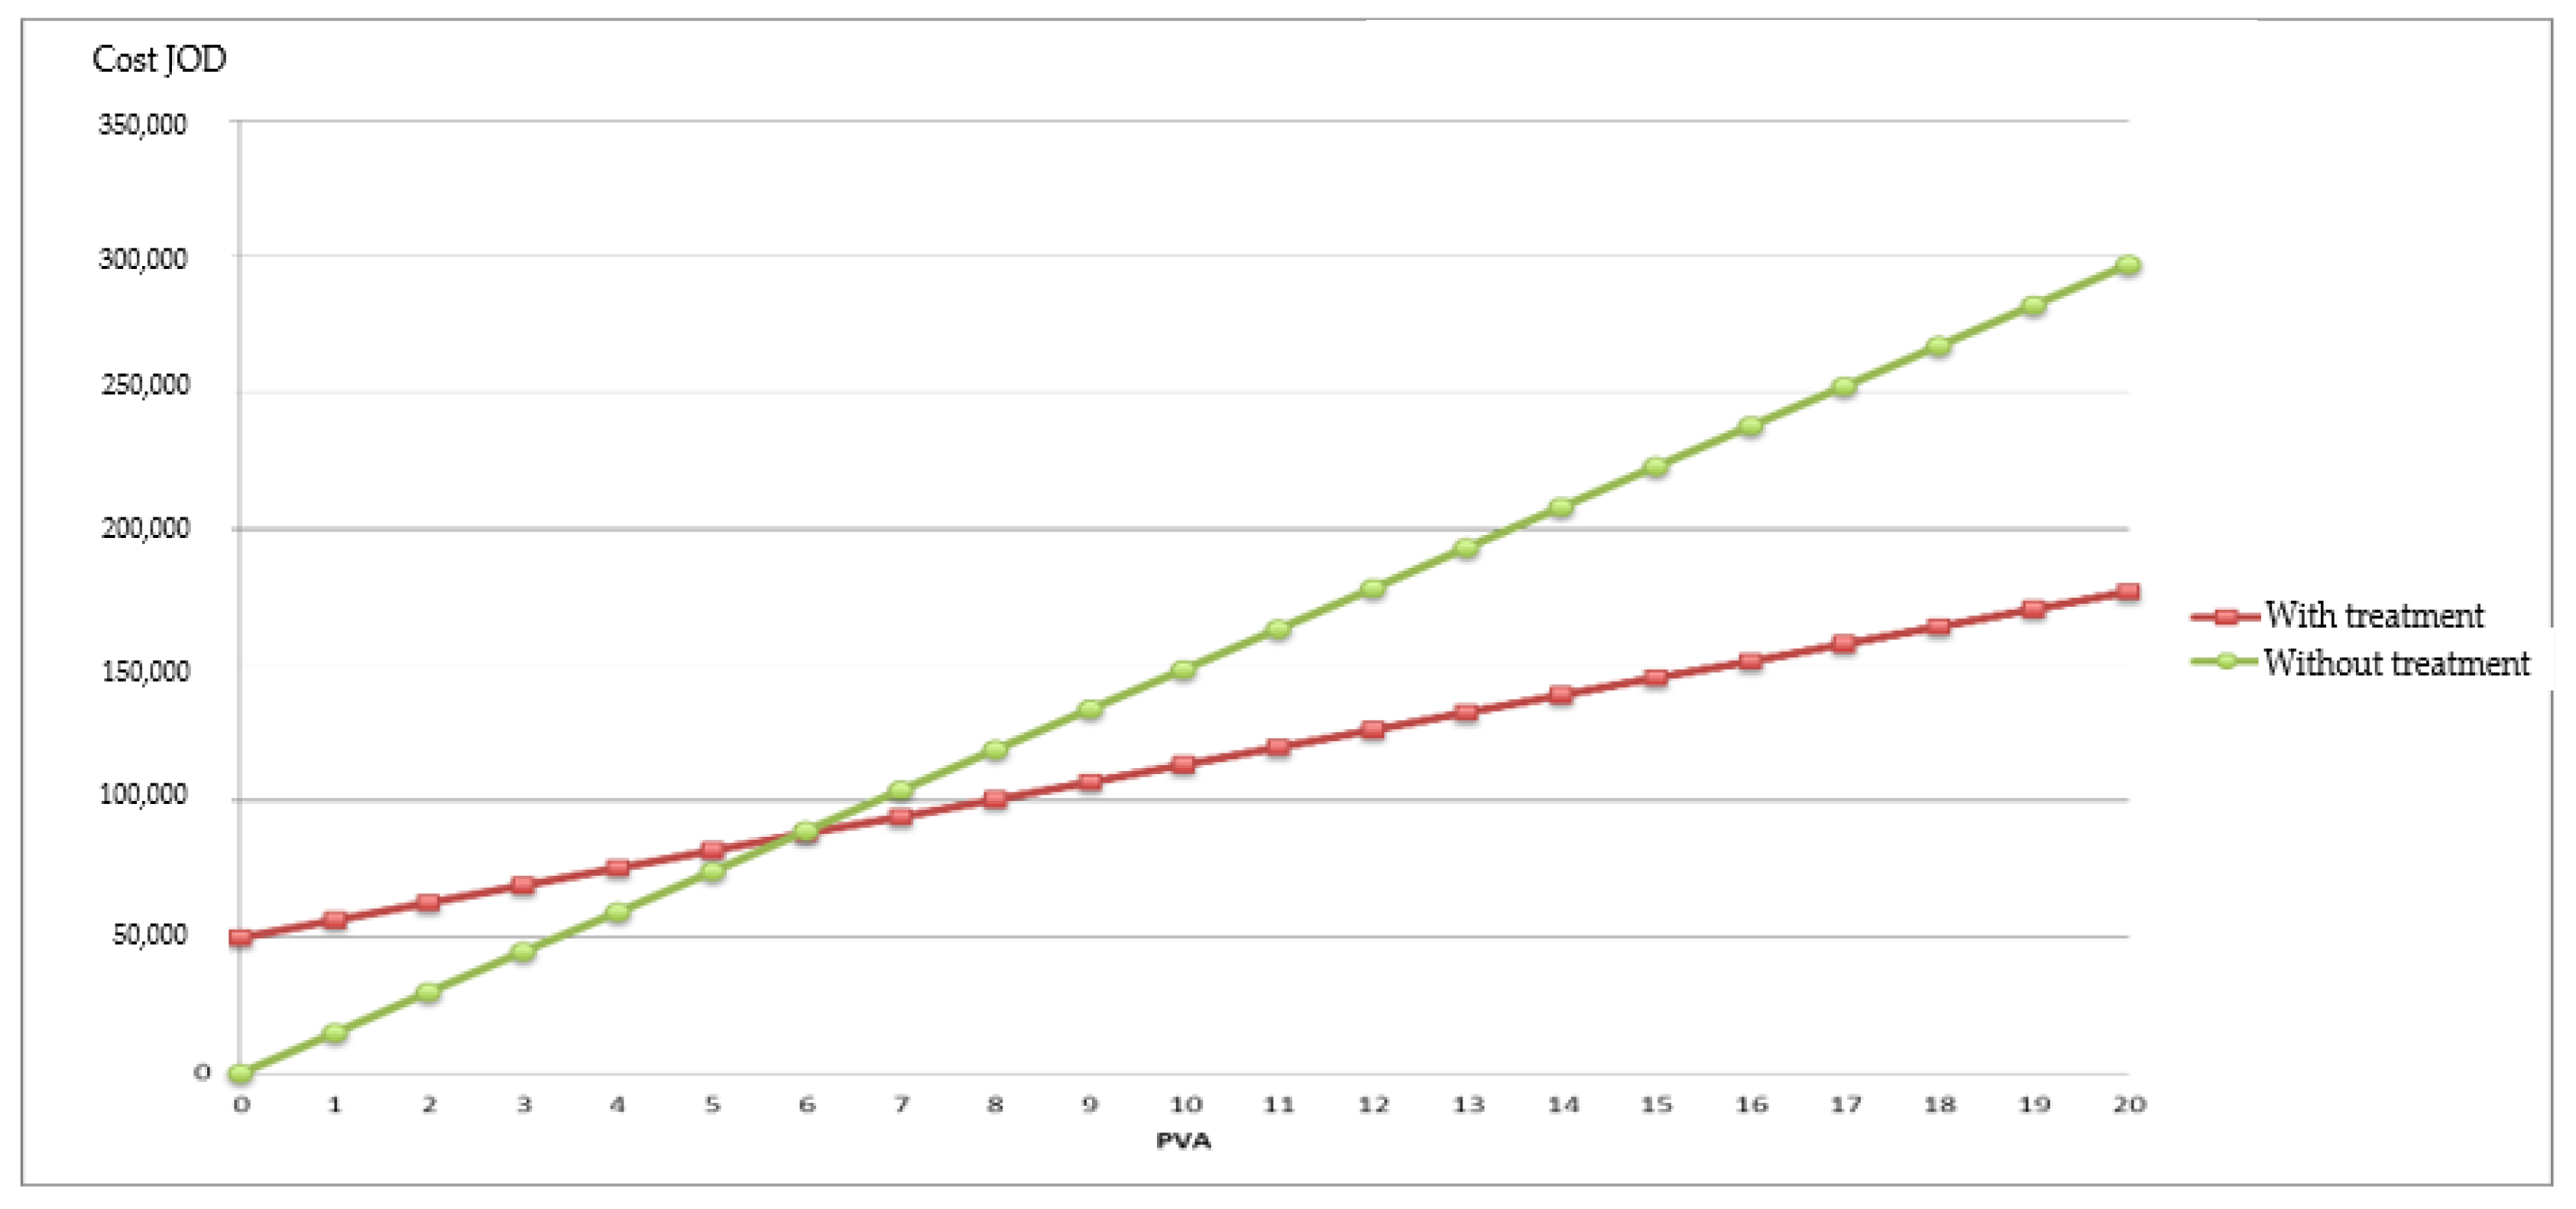
The feasibility of applying a treatment solution to the wastewater generated by the saponification process is assessed through a comparison between a system that operates without wastewater treatment (Case 1) and a system that includes wastewater treatment with a specified recovery rate (Case 2). The payback period for the treatment system is defined as the period necessary to cover the cost of installing and operating the treatment system through the savings acquired from the usage of the treated water. For Case 1, the clean water consumption is 44 m3 per day, and the waste discharge is 36 m3. For Case 2, the treatment system recovers a specified percentage of the waste discharge and reuses it. Knowing that the daily water consumption cost for Case 1 is (JOD 1.1/m3 × 44 m3/day) = JOD 48.4/day, which is equal to JOD 14,858.8/year. On the other hand, Case 2 indicates a considerable reduction in the purchasing cost of clean water, due to the different water recovery rates from the treatment center, as shown in Figure 25. For example, a 40% recovery rate produces 14.4 m3 of treated water, and the cost of the purchased water will be (JOD 1.1/m3 × 29.6 m3/day) = JOD 32.56/day. The yearly water consumption cost for Case 2 is (32.56/day × 307 days) = JOD 9995.92/year. Figure 26 displays the annual cost versus present value of an annuity (PVA) at a recovery rate of 70%, where a significant reduction in annual cost will be gained by installing the proposed water treatment system.
The treatment system (cost: JOD 50,000; effective rate: 5%) with a 70% recovery rate, which corresponds to the system with the shortest payback period of 7 years, is considered. For case 1, the freshwater consumption is 44 m3 per day, and the waste discharge is 36 m3. For case 2, the treatment system recovers 70% of the waste discharge, equivalent to (0.70 × 36 m3/day = 25.2 m3/day), and reuses it. Hence, the freshwater consumption for case 2 is (44 − 25.2 = 18.8 m3/day). The daily water consumption cost for case 1 is (JOD 1.1m3 × 44 m3/day) = JOD 48.4/day. However, for case 2, due to the recovery of 25.2 m3 by the treatment unit, the cost of water is (JOD 1.1 m3 × 18.8 m3/day) = JOD 20.68/day. Table 19 summarizes the amounts and costs of purchased local water before and after applying the treatment.

5. Conclusions

This research aimed to enhance the performance of the detergent production line by implementing lean, agile, and resilient practices. Firstly, the AS-IS simulation model was developed and assessed utilizing OEE. Some processes required improvement in quality, availability, and performance percentages. Lean, agile, and resilient actions were utilized to enhance the OEE of the bottle placing, filling, labeling, and taping processes, which were enhanced by 237%, 4.67%, 5.41%, and 26.02%, respectively. Further, cleaner production assessments for soap production were used to estimate five indices, including raw material, energy, product, waste, and packaging. The estimated cleaner production index was 107.93, with liquid waste contributing the largest partial waste index. Consequently, a water treatment system was suggested and evaluated. A feasibility analysis showed that the payback period would be 7 years at a 5% rate of return. In conclusion, lean, agile, and resilient actions can result in significant savings in production and quality costs. Moreover, the adopted assessment for cleaner production can support decision makers in taking appropriate actions to reduce the environmental impact of their production lines. Future research will consider developing a combined OEEE index to assess OEE and the environmental impact of manufacturing processes.

Author Contributions

Conceptualization and methodology, A.A.-R.; software, A.A.-R.; validation, A.A.-R. and N.L.; formal analysis, A.A.-R. and N.L.; investigation, A.A.-R. and N.L.; resources, A.A.-R. and N.L.; data curation, A.A.-R., writing—original draft preparation, A.A.-R. and N.L.; writing—review and editing, A.A.-R.; visualization, A.A.-R.; supervision, A.A.-R. and N.L. All authors have read and agreed to the published version of the manuscript.

Funding

This research received no external funding.

Data Availability Statement

The original contributions presented in this study are included in the article. Further inquiries can be directed to the corresponding author.

Conflicts of Interest

The authors declare no conflicts of interest.

References

  1. Jadoon, G.; Din, I.U.; Almogren, A.; Almajed, H. Smart and agile manufacturing framework, a case study for automotive industry. Energies 2020, 13, 5766. [Google Scholar] [CrossRef]
  2. Santos, D.M.C.D.; Santos, B.K.D.; Santos, C.G.D. Implementation of a standard work routine using Lean Manufacturing tools: A case Study. Gestão Produção 2021, 28, e4823. [Google Scholar] [CrossRef]
  3. Kaeo-Tad, N.; Jeenanunta, C.; Chumnumporn, K.; Nitisahakul, T.; Sanprasert, V. Resilient manufacturing: Case studies in Thai automotive industries during the COVID-19 pandemic. Eng. Manag. Prod. Serv. 2021, 13, 99–113. [Google Scholar] [CrossRef]
  4. Pattanaik, L.N.; Sharma, B.P. Implementing lean manufacturing with cellular layout: A case study. Int. J. Adv. Manuf. Technol. 2009, 42, 772–779. [Google Scholar] [CrossRef]
  5. Muslimen, R.; Yusof, S.M.; Abidin, A.Z. Lean manufacturing implementation in Malaysian automotive components manufacturer: A case study. In Proceedings of the World Congress on Engineering, London, UK, 6–8 July 2011; Volume 1, No. 1. pp. 6–8. [Google Scholar]
  6. Helleno, A.L.; de Moraes, A.J.I.; Simon, A.T. Integrating sustainability indicators and Lean Manufacturing to assess manufacturing processes: Application case studies in Brazilian industry. J. Clean. Prod. 2017, 153, 405–416. [Google Scholar] [CrossRef]
  7. Singh, J.; Singh, H.; Singh, G. Productivity improvement using lean manufacturing in manufacturing industry of Northern India: A case study. Int. J. Product. Perform. Manag. 2018, 67, 1394–1415. [Google Scholar] [CrossRef]
  8. Jimenez, G.; Santos, G.; Sá, J.C.; Ricardo, S.; Pulido, J.; Pizarro, A.; Hernández, H. Improvement of Productivity and Quality in the Value Chain through Lean Manufacturing—A case study. Procedia Manuf. 2019, 41, 882–889. [Google Scholar] [CrossRef]
  9. Potdar, P.K.; Routroy, S. Performance analysis of agile manufacturing: A case study on an Indian auto component manufacturer. Meas. Bus. Excell. 2017, 21, 117–135. [Google Scholar] [CrossRef]
  10. Kumar, R.; Singh, K.; Jain, S.K. Agility enhancement through agile manufacturing implementation: A case study. TQM J. 2022, 34, 1527–1546. [Google Scholar] [CrossRef]
  11. Zhang, W.J.; Van Luttervelt, C.A. Toward a resilient manufacturing system. CIRP Ann. 2011, 60, 469–472. [Google Scholar] [CrossRef]
  12. Kusiak, A. Fundamentals of Smart Manufacturing: A Multi-Thread Perspective. Annu. Rev. Control. 2019, 47, 214–220. [Google Scholar] [CrossRef]
  13. Lee, J.; Siahpour, S.; Jia, X.; Brown, P. Introduction to resilient manufacturing systems. Manuf. Lett. 2022, 32, 24–27. [Google Scholar] [CrossRef]
  14. Mourtzis, D.; Angelopoulos, J.; Panopoulos, N. Robust engineering for the design of resilient manufacturing systems. Appl. Sci. 2021, 11, 3067. [Google Scholar] [CrossRef]
  15. Dittfeld, H.; van Donk, D.P.; van Huet, S. The effect of production system characteristics on resilience capabilities: A multiple case study. Int. J. Oper. Prod. Manag. 2022, 42, 103–127. [Google Scholar] [CrossRef]
  16. Fowler, D.S.; Epiphaniou, G.; Higgins, M.D.; Maple, C. Aspects of resilience for smart manufacturing systems. Strateg. Change 2023, 32, 183–193. [Google Scholar] [CrossRef]
  17. Fijal, T. An environmental assessment method for cleaner production technologies. J. Clean. Prod. 2007, 15, 914–919. [Google Scholar] [CrossRef]
  18. Gong, Q.; Wu, J.; Jiang, Z.; Hu, M.; Chen, J.; Cao, Z. An integrated design method for remanufacturing scheme 19. considering carbon emission and customer demands. J. Clean. Prod. 2024, 476, 143681. [Google Scholar] [CrossRef]
  19. Ding, C.; Li, C.; Xiong, Z.; Li, Z. Computer big data technology in additive manufacturing and product design in sustainable manufacturing. Int. J. Adv. Manuf. Technol. 2024, 135, 4855–4863. [Google Scholar] [CrossRef]
  20. Alkaya, E.; Demirer, G.N. Sectoral assessment of the Turkish textile industry for the diffusion of sustainable production approach. J. Text. Inst. 2015, 106, 1212–1225. [Google Scholar] [CrossRef]
  21. Giannetti, B.F.; Agostinho, F.; Eras, J.C.; Yang, Z.; Almeida, C.M.V.B. Cleaner production for achieving the sustainable development goals. J. Clean. Prod. 2020, 271, 122127. [Google Scholar] [CrossRef]
  22. Ghazinoory, S. Cleaner production in Iran: Necessities and priorities. J. Clean. Prod. 2005, 13, 755–762. [Google Scholar] [CrossRef]
  23. Van Berkel, R. Cleaner production for process industries. In Proceedings of the Plenary Lecture—CHEMECA 2000, Perth, WA, USA, 9–12 July 2000. [Google Scholar]
  24. Bai, S.W.; Zhang, J.S.; Wang, Z. A methodology for evaluating cleaner production in the stone processing industry: Case study of a Shandong stone processing firm. J. Clean. Prod. 2015, 102, 461–476. [Google Scholar] [CrossRef]
  25. Ramos, A.R.; Ferreira, J.C.E.; Kumar, V.; Garza-Reyes, J.A.; Cherrafi, A. A lean and cleaner production benchmarking method for sustainability assessment: A study of manufacturing companies in Brazil. J. Clean. Prod. 2018, 177, 218–231. [Google Scholar] [CrossRef]
  26. de Oliveira Neto, G.C.; Correia, J.M.F.; Silva, P.C.; de Oliveira Sanches, A.G.; Lucato, W.C. Cleaner Production in the textile industry and its relationship to sustainable development goals. J. Clean. Prod. 2019, 228, 1514–1525. [Google Scholar] [CrossRef]
  27. Dai, N.; Li, L.; Xu, K.; Lu, Z.; Hu, X.; Yuan, Y. Development of a standardized data collection and intelligent fabric quality prediction system for the weaving department. J. Eng. Fibers Fabr. 2025, 20, 15589250241312778. [Google Scholar] [CrossRef]
  28. Li, T.; Li, Y. Artificial intelligence for reducing the carbon emissions of 5G networks in China. Nat. Sustain. 2023, 6, 1522–1523. [Google Scholar] [CrossRef]
  29. Al-Refaie, A.; Lepkova, N. A Fuzzy LARG Index for Assessing the Lean, Agile, Resilience, and Green Paradigms in Industrial Companies. Sustainability 2025, 17, 1863. [Google Scholar] [CrossRef]
  30. Al-Refaie, A.; Al-Tahat, M.; Lepkova, N. Modelling relationships between agility, lean, resilient, green practices in cold supply chains using ISM approach. Technol. Econ. Dev. Econ. 2020, 26, 675–694. [Google Scholar] [CrossRef]
  31. Al-Refaie, A.; Lepkova, N.; Camlibel, M.E. The relationships between the pillars of TPM and TQM and manufacturing performance using structural equation modeling. Sustainability 2022, 14, 1497. [Google Scholar] [CrossRef]
  32. Al-Refaie, A.; Kokash, T. Optimization of sustainable reverse logistics network with multi-objectives under uncertainty. J. Remanufacturing 2023, 13, 1–23. [Google Scholar] [CrossRef]
  33. Al-Refaie, A.; Jararweh, A. Adoption of quality management 4.0 to enhance the overall effectiveness of vehicle licence renewal services. Int. J. Electron. Gov. 2024, 16, 406–427. [Google Scholar]
  34. Al-Refaie, A.; Abbasi, G.; Al-shalaldeh, H. Lean and agile practices to improve the performance of filling process via simulation and data envelopment analysis. SN Appl. Sci. 2019, 1, 1131. [Google Scholar] [CrossRef]
Figure 1. Research methodology.
Processes 13 02152 g001
Figure 2. Production line segments.
Processes 13 02152 g002
Figure 3. Bottle arrival sub-model.
Processes 13 02152 g003
Figure 4. Filling sub-model.
Processes 13 02152 g004
Figure 5. Cap-feeding sub-model.
Processes 13 02152 g005
Figure 6. Capping Sub-model.
Processes 13 02152 g006
Figure 7. Stamping sub-model.
Processes 13 02152 g007
Figure 8. Labeling sub-model.
Processes 13 02152 g008
Figure 9. Packaging sub-model.
Processes 13 02152 g009
Figure 10. Taping sub-model.
Processes 13 02152 g010
Figure 11. Inspection sub-model.
Processes 13 02152 g011
Figure 12. Palletizing process.
Processes 13 02152 g012
Figure 13. Soap production processes.
Processes 13 02152 g013
Figure 14. Raw material unit indices.
Processes 13 02152 g014
Figure 15. Energy unit indices.
Processes 13 02152 g015
Figure 16. Waste unit indices.
Processes 13 02152 g016
Figure 17. Product unit indices.
Processes 13 02152 g017
Figure 18. Packaging unit indices.
Processes 13 02152 g018
Figure 19. Integrated environmental assessment indices.
Processes 13 02152 g019
Figure 20. Improvement action 1.
Processes 13 02152 g020
Figure 21. Operator sharing.
Processes 13 02152 g021
Figure 22. Improvement in maintenance.
Processes 13 02152 g022
Figure 23. Sharing the tape machine.
Processes 13 02152 g023
Figure 24. Proposed system (with water treatment).
Processes 13 02152 g024
Figure 25. Cost vs. PVA for different treatment recovery rates.
Processes 13 02152 g025
Figure 26. Annual cost vs. PVA at a recovery rate of 70%.
Processes 13 02152 g026
Table 1. Process time fitting distributions (in seconds).
ProcessFitted DistributionProcessFitting Distributions
Placing Plastic Bottles1 + EXPO (1.39)Tape ProcessConstant (3.5)
Filling Process9.07 + EXPO (1.23)Inspection ProcessConstant (45)
Cap Feeding ProcessNORM (12.6, 3.55)Placing Sieve on TankConstant (2700)
Capping ProcessConstant (0.3)Transport After Color ProblemConstant (120)
Stamping ProcessConstant (0.47)Transport to RetapeConstant (2)
Labeling ProcessConstant (5)Transport to palletTRIA (3, 4, 5)
Packaging Process13 + WEIB (40.4, 1.19)Pallet WrappingConstant (3)
Table 2. Conveyor characteristics.
ConveyorDetailsVelocity
(Bottle/min)
Length
(m)
Capacity
(Bottle)
Conveyor 1Plastic to Filling Conveyor2502.0723
Conveyor 2Filling before Cap Feeding Conveyor2500.586
Conveyor 3Before Cap Feeding to Cap Feeding conveyor2501.3316
Conveyor 4Cap Feeding to Capping Conveyor2001.4818
Conveyor 5Capping to Stamping conveyor2000.665
Conveyor 6Stamping to Labeling Conveyor2000.798
Conveyor 7Labeling to Packaging Conveyor2001.9117
Table 3. Model validation.
Process10 Replications50 ReplicationsUnit
SimulationActualError %SimulationActualError
Bottle Placing12,176.412,2110.2812,13112,2110.66Bottle
Filling12,12612,1840.4812,08212,1840.84Bottle
Cap Feeding12,123.412,1840.5012,075.9212,1840.89Bottle
Capping12,123.212,1840.5012,075.612,1840.89Bottle
Stamping12,123.212,1840.5012,075.5612,1840.89Bottle
Labeling12,123.112,1840.5012,075.2612,1840.89Bottle
Packaging1009.610150.531005.5410150.93Box
Taping1009.610150.531005.5410150.93Box
Inspection102.61020.5999.74990.75Box
Transport to Retape3673582.513683582.79Box
Transport to pallet1009.610150.531005.5410150.93Box
Pallet wrapping13.9014.11.4213.9714.10.95Pallet
Table 4. Availability (%) of the AS-IS model.
ProcessPPT (s)Down Time (s)Run Time (s)Availability %
Filling25,200200023,20092.06
Capping78,000078,000100.00
Labeling78,000327074,73095.81
Taping5400220518095.93
Table 5. Quality (%) of the AS-IS model.
ProcessGood CountTotal CountUnitQuality %
Filling12,081.9812,101.04Bottle99.84
Capping12,075.612,075.6Bottle100.00
Labeling12,075.2612,075.54Bottle100.00
Taping1036.541105.28Box93.78
Table 6. Performance (%) of the AS-IS model.
ProcessICT (s)Total CountRun Time (s)Performance %
Bottle Placing1.1813,281.1878,00020.09
Filling9.62016.8423,20083.46
Cap Feeding6.1612,081.9476,80096.91
Capping6.3312,075.678,00098.00
Labeling512,075.5474,73080.79
Taping41105.28518085.33
Table 7. OEE (%) of the AS-IS model.
ProcessAvailabilityQualityPerformanceOEE %
Bottle Placing100.00100.0020.0920.09
Filling99.2399.8483.4682.68
Cap Feeding100.00100.0095.3795.37
Capping100.00100.0098.0098.00
Labeling95.81100.0080.7977.40
Taping99.0893.7885.3379.29
Table 8. Environmental nuisance classification scheme.
Degree of Environmental NuisanceWz
Very low (insignificant)Below 25
Low25–50
Medium50–100
High100–200
Very highAbove 200
Table 9. Summary of raw material unit indices.
Raw Material imsi (tons)Processwsiwsi (per kg)
Palm Oil1960Saponification0.5445.44
Palm Stearin Oil330Saponification0.0920.92
Palm Kernel Olein Oil600Saponification0.1661.66
Coconut Fatty Acids11Saponification0.0030.03
Fatty Acid18Saponification0.0050.05
Sodium Hydroxide710Saponification0.1971.97
Sodium Chloride111Saponification0.0310.31
Fragrances, Perfume compounds90Adding Perfume and extrusion0.0250.25
Antioxidants10Mixing0.0030.03
Pure titanium dioxide3Soap coloring & milling0.0010.01
Phosphoric acid8Neutralization0.0020.02
Water Saponification/neutralization/drying0.0040.04
Dyes15Soap coloring and milling0.0040.04
Total weight 1.076
Raw material unit index (Ws) 10.763
Table 10. Consumption of raw energy materials.
1   tpu = 1   Mt   Hard   Coal   ( Q w = 29.31 MJ/Kg); Mass of 10 Units = 1 Kg
Calorific   Value   Q w tpuConsumption (kg/yr) × tpu
Diesel46 (MJ/kg)1.58622,743,725.5
HFO43.5 (MJ/kg)1.48432,530,657.576
Electricity3.6 (MJ/kWh) 453,682.59
Table 11. Summary of energy unit indices.
Raw Energy Material (i)ConsumptionConsumption
Mt/year
Consumption (kg/yr) × tpuwejwej
(10 unit)
Yearly Cost (JOD)
Heavy fuel oil1705 Mt/year17052,530,657.60.7117.11861,347
Disel2,011,687.6 (litre/yr)1729.74
(1163 Lt/ton)
2,743,725.50.7617.611,071,252
Electricity36,929,844.5 kwh/year132,947.44453,682.600.1261.26350,325
Energy unit index
1927 kilowatt-hours
15.889
Table 12. Summary of waste unit indices.
Waste TypeWaste
(m3)
Waste
(Kg)
ktk = kt/kmaxwocwogk × wock × wog
Liquid waste (l)29,48129,481,0000.918.178 8.1788.1778
Gaseous waste (CO2) 13,195,854.90.60.667 3.6 2.4403
Waste unit index 10.6181
Table 13. Summary of product unit indices.
Products Manufacturedmppmpp (kg)wppkpp
Soap (primary product)3605 ton3,605,0001table (8)0.225
Water Glycerin (byproduct)10 m331,7000.000910.0009
Product unit index 0.234
Table 14. Hazardous components of soap.
Hazardous Components of Soapmse (kg)kpewpe =
kpe × wp1
Process
NaOH710,0000.1970.1969Saponification
Fragrances90,0000.0250.0249Soap perfume adding and extrusion
Titanium dioxide30000.00080.0008Soap coloring and milling
Phosphoric acid80000.0020.0022Neutralization
Total wpe 0.225
Table 15. Summary of profile indices.
Profile Unit IndicesUnit Index
Raw material10.7628
Energy15.8892
Waste generation106.1810
Product2.3376
Packaging0.5
Integrated107.93
Table 16. OEE results for actions 1 and 2.
Process/OperatorAvailability %Quality %Performance %OEE %OEE AS-IS
Bottle placing99.6999.8281.7181.3124.09
Filling99.2399.8485.2684.4782.68
Cap Feeding100.00100.0097.1797.1795.37
Capping100.00100.0098.7098.7098.00
Labeling95.81100.0082.3178.8677.40
Taping99.0893.7888.0481.8079.29
Table 17. OEE results for actions 1 to 3.
Process/OperatorAvailability %Quality %Performance %OEE %
Actions 1 to 3
OEE %
Actions 1 and 2
Bottle placing99.6999.8281.7181.3181.31
Filling99.5099.84 86.0685.4984.47
Cap Feeding100.00100.0097.5297.5297.17
Capping100.00100.0098.7098.7098.70
Labeling97.46100.0082.3180.2278.86
Taping99.5493.7888.0482.1981.80
Table 18. OEE results for actions 1 to 4.
Process/OperatorAvailabilityQualityPerformanceOEE %Improvement
%
A1-A4A1-A3AS-IS
Bottle Placing10099.8281.5681.3181.3124.09237.53
Filling99.5099.8487.1186.5485.4982.684.67
Cap Feeding10010097.8896.7497.5295.371.44
Capping100.00100.0099.9699.9698.7098.002.00
Labeling97.46100.0083.7281.5980.2277.405.41
Taping99.92100.0010099.9282.1979.2926.02
Table 19. Cost comparison between two cases.
CasesPurchased Water (m3/Day)Cost (JOD/Day)Cost (JOD/Year)
Case 1: without treatment4448.414,858.8
Case 2: with treatment18.820.686348.76
Disclaimer/Publisher’s Note: The statements, opinions and data contained in all publications are solely those of the individual author(s) and contributor(s) and not of MDPI and/or the editor(s). MDPI and/or the editor(s) disclaim responsibility for any injury to people or property resulting from any ideas, methods, instructions or products referred to in the content.