
Adoption of Lean, Agile, Resilient, and Cleaner Production Strategies to Enhance the Effectiveness and Sustainability of Products and Production Processes


Abstract
1. Introduction
2. Research Methodology and Application
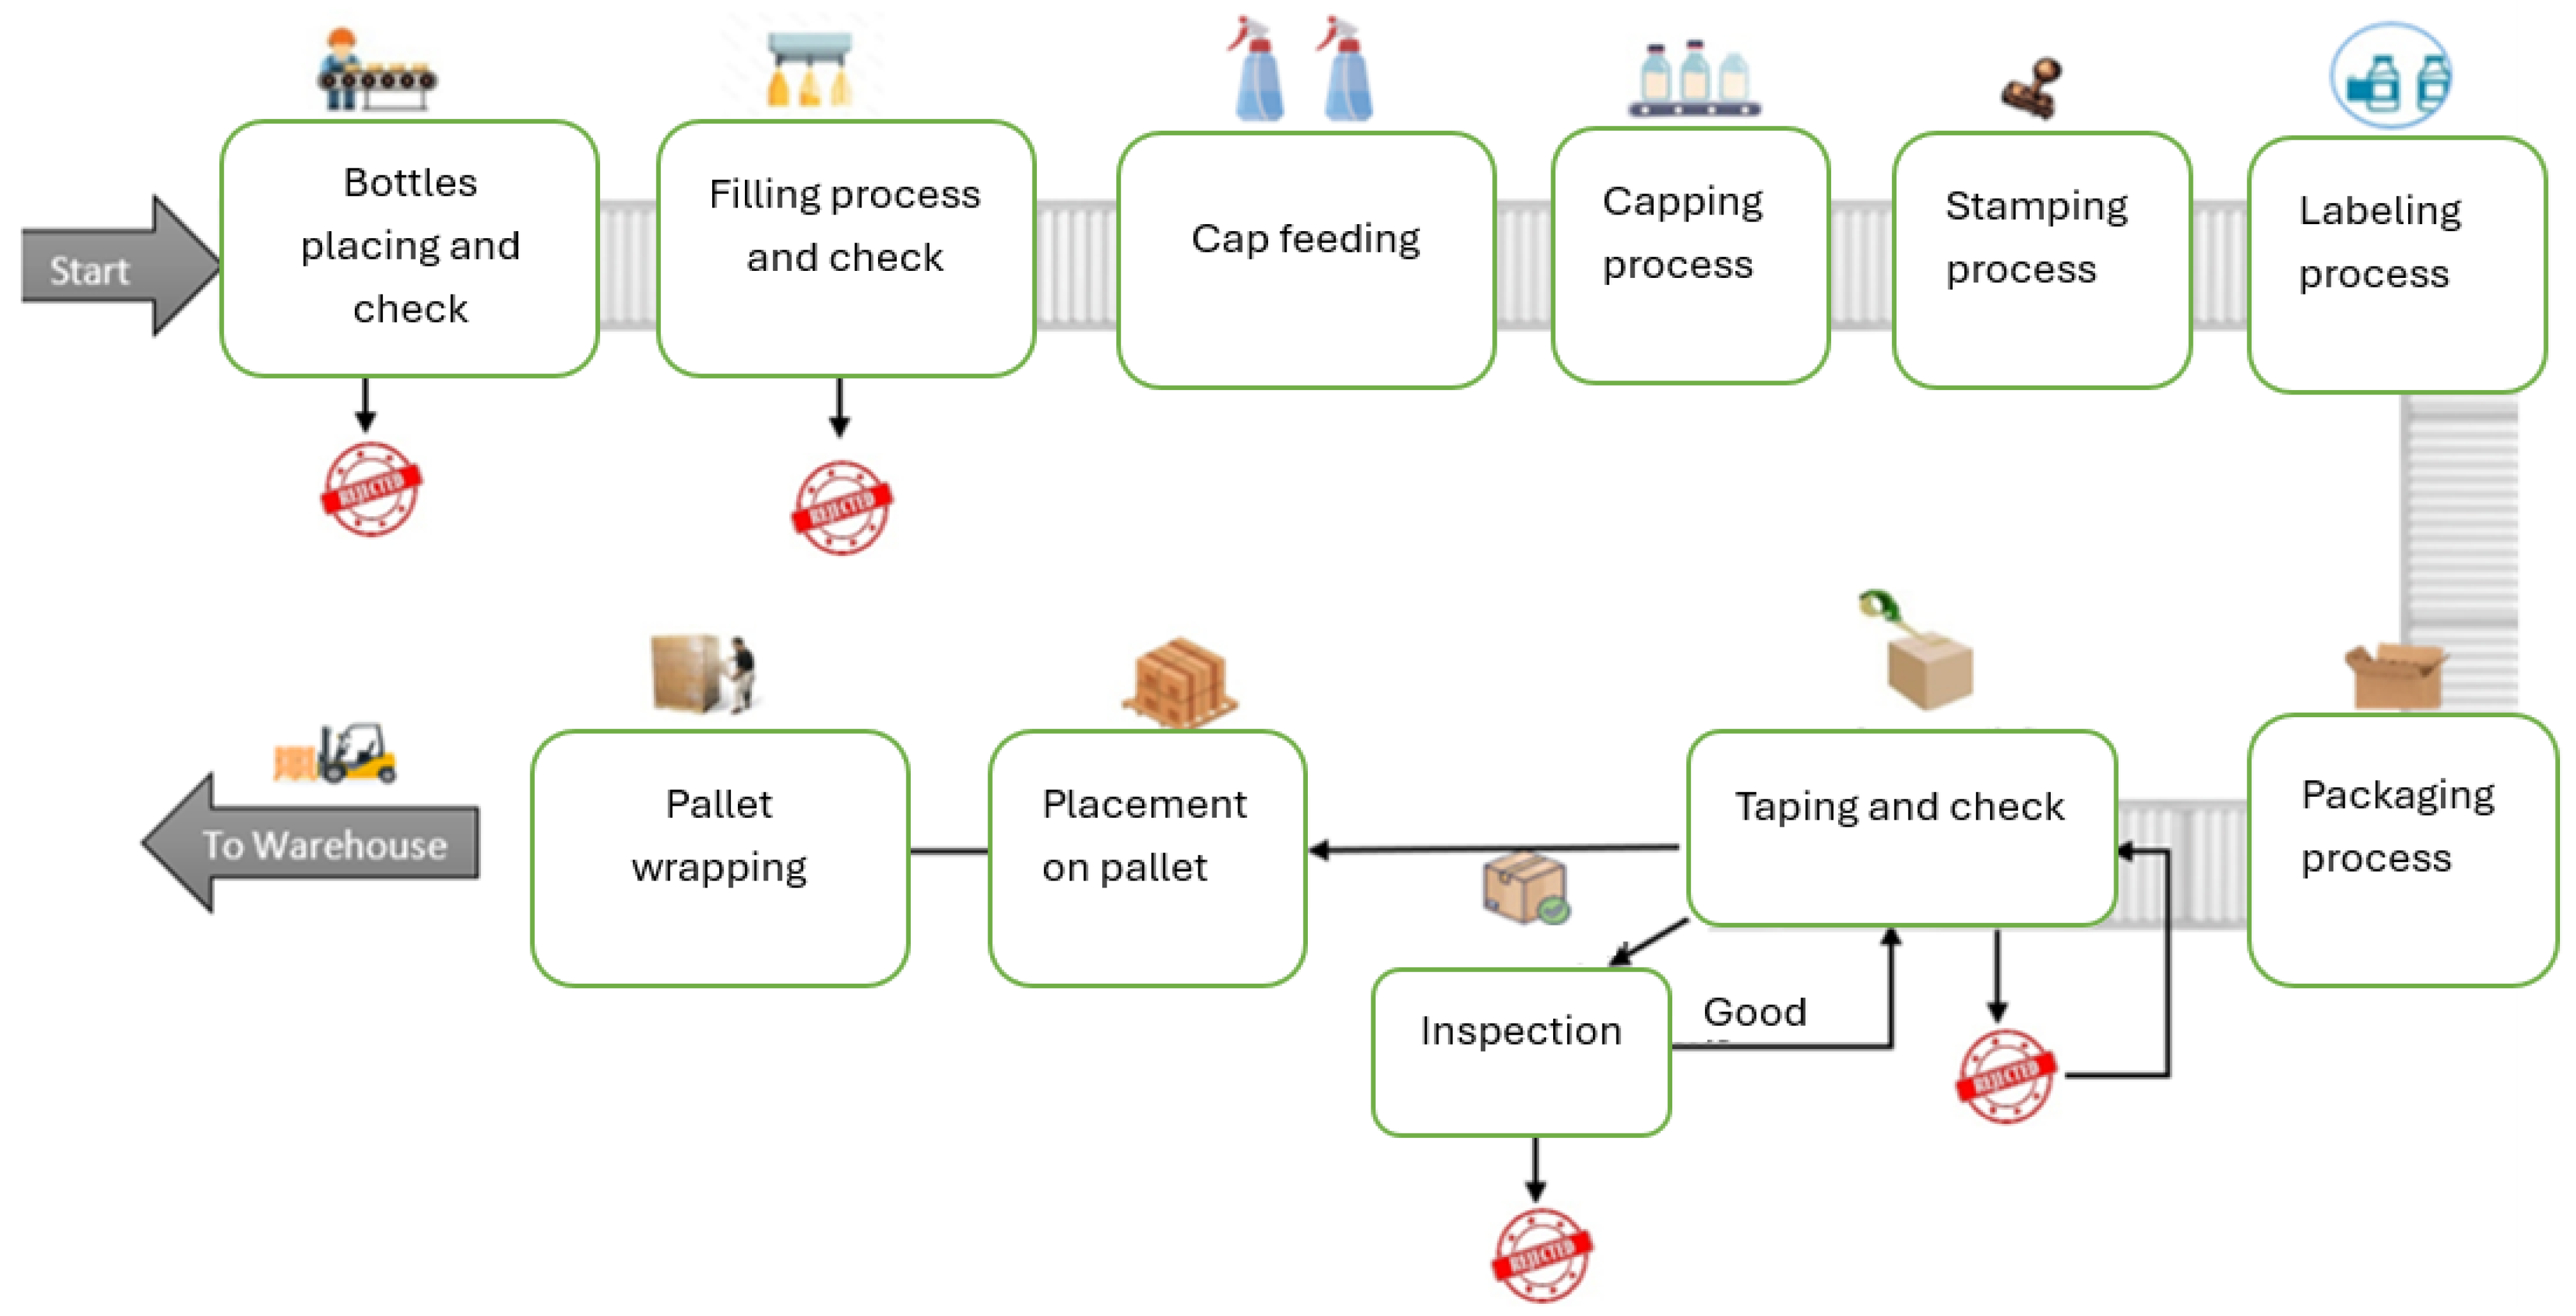
2.1. As-Is Simulation Model
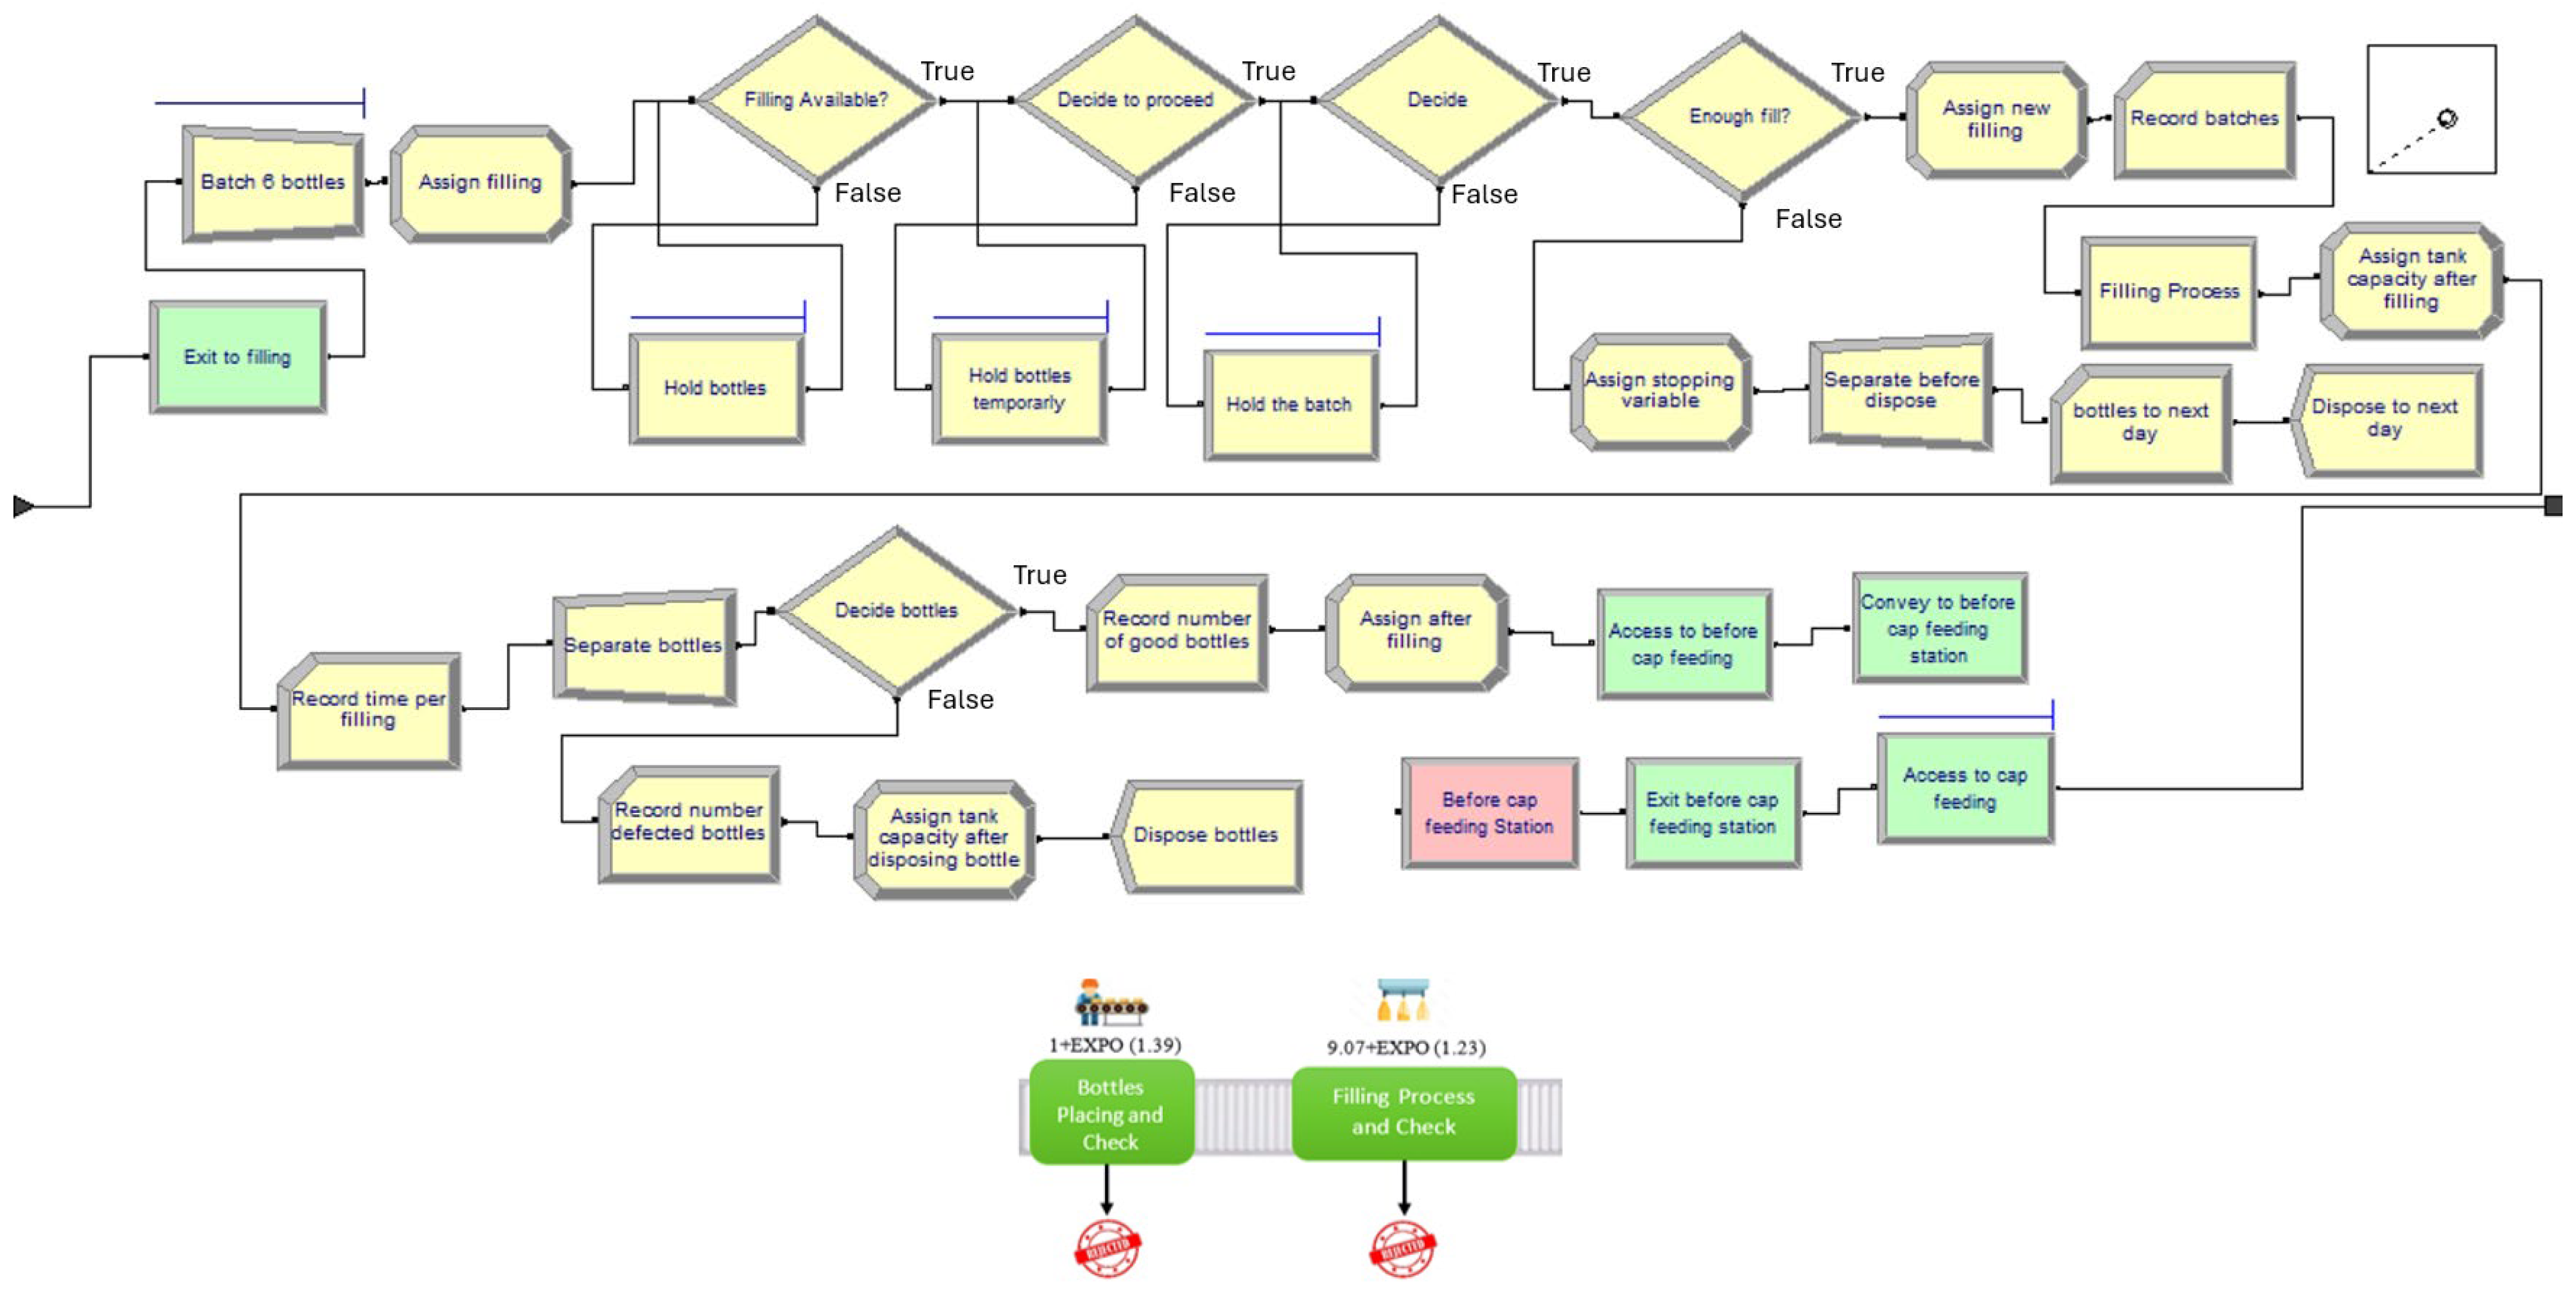
2.1.1. Bottle Arrival Sub-Model
2.1.2. Filling Process Sub-Model
2.1.3. Cap-Feeding Sub-Model
2.1.4. Capping Sub-Model
2.1.5. Stamping Sub-Model
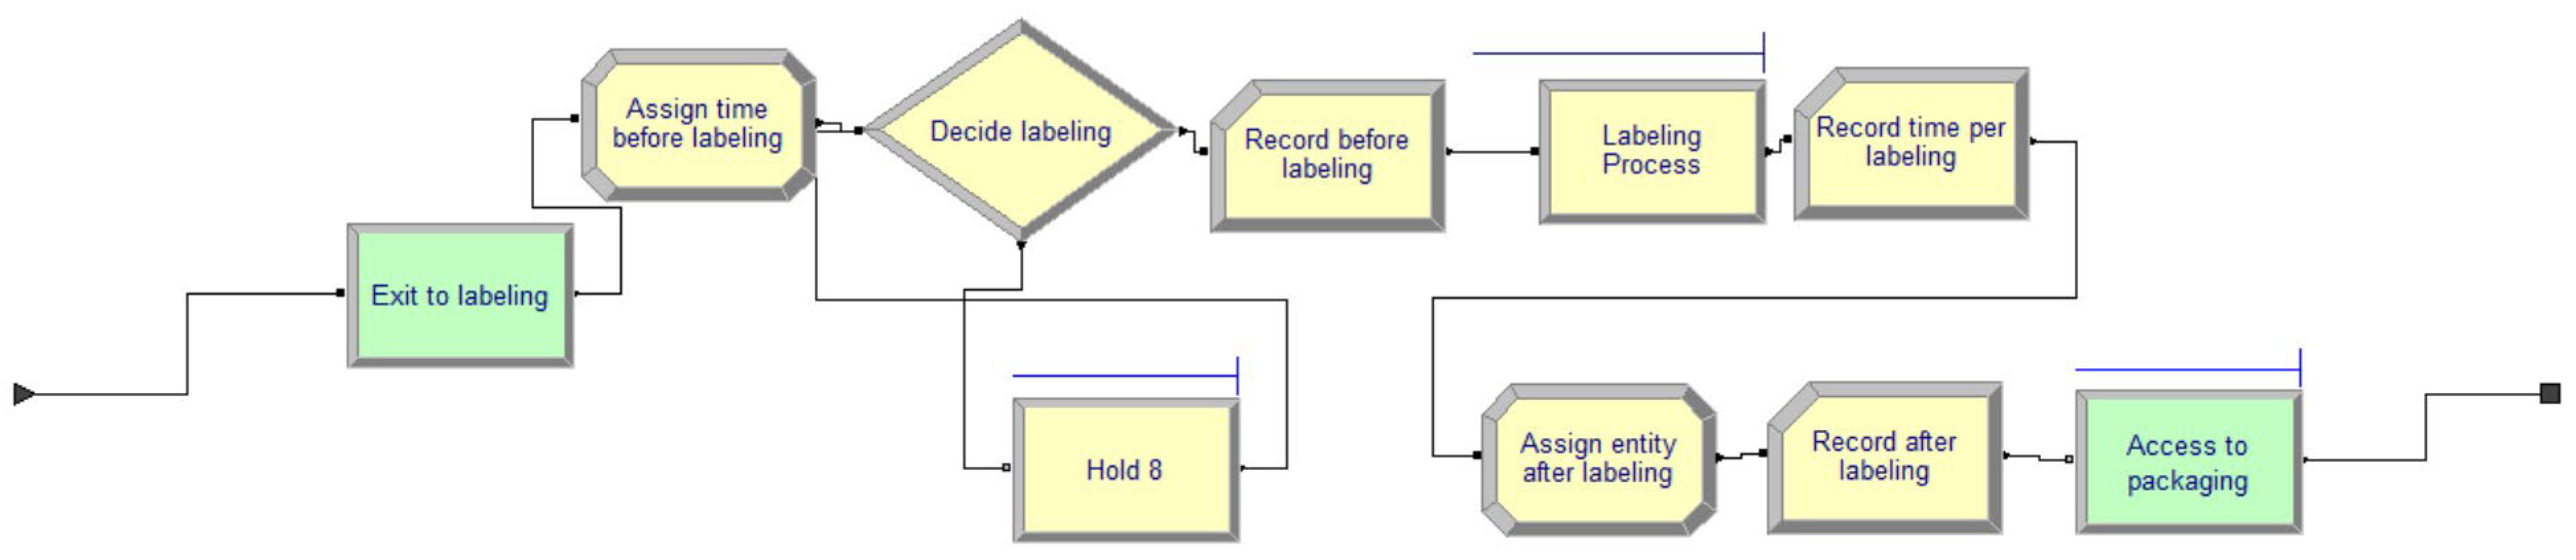
2.1.6. Labeling Sub-Model
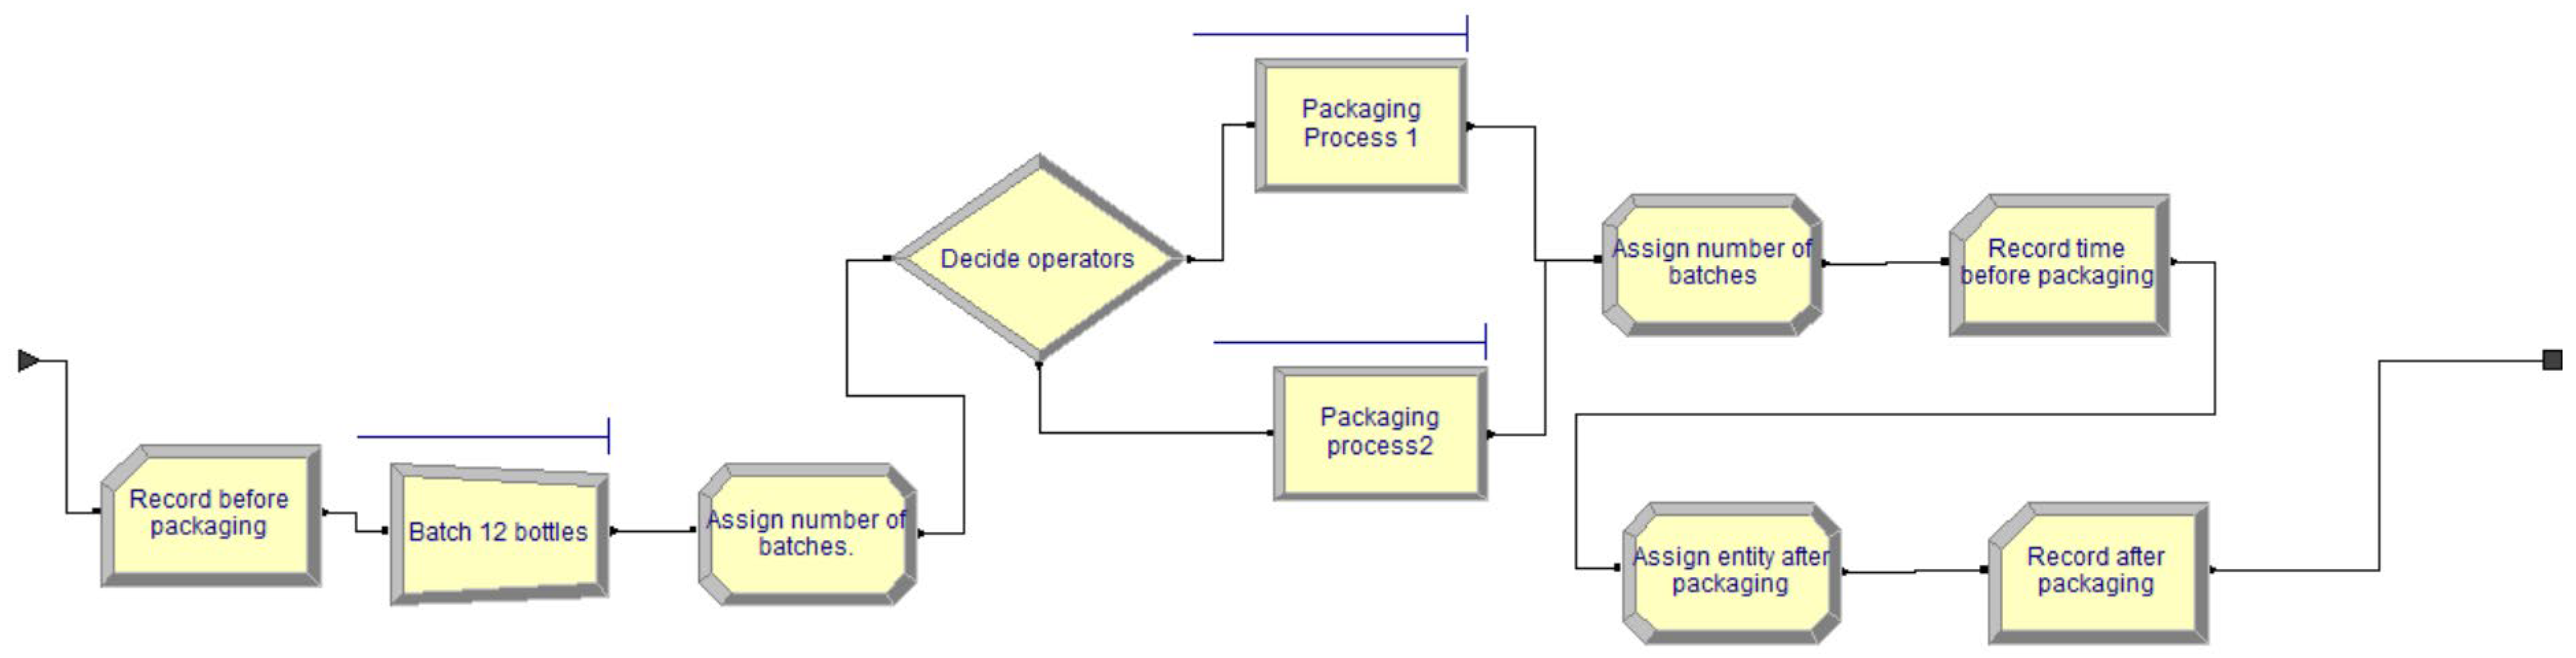
2.1.7. Packaging Sub-Model
2.1.8. Taping Sub-Model
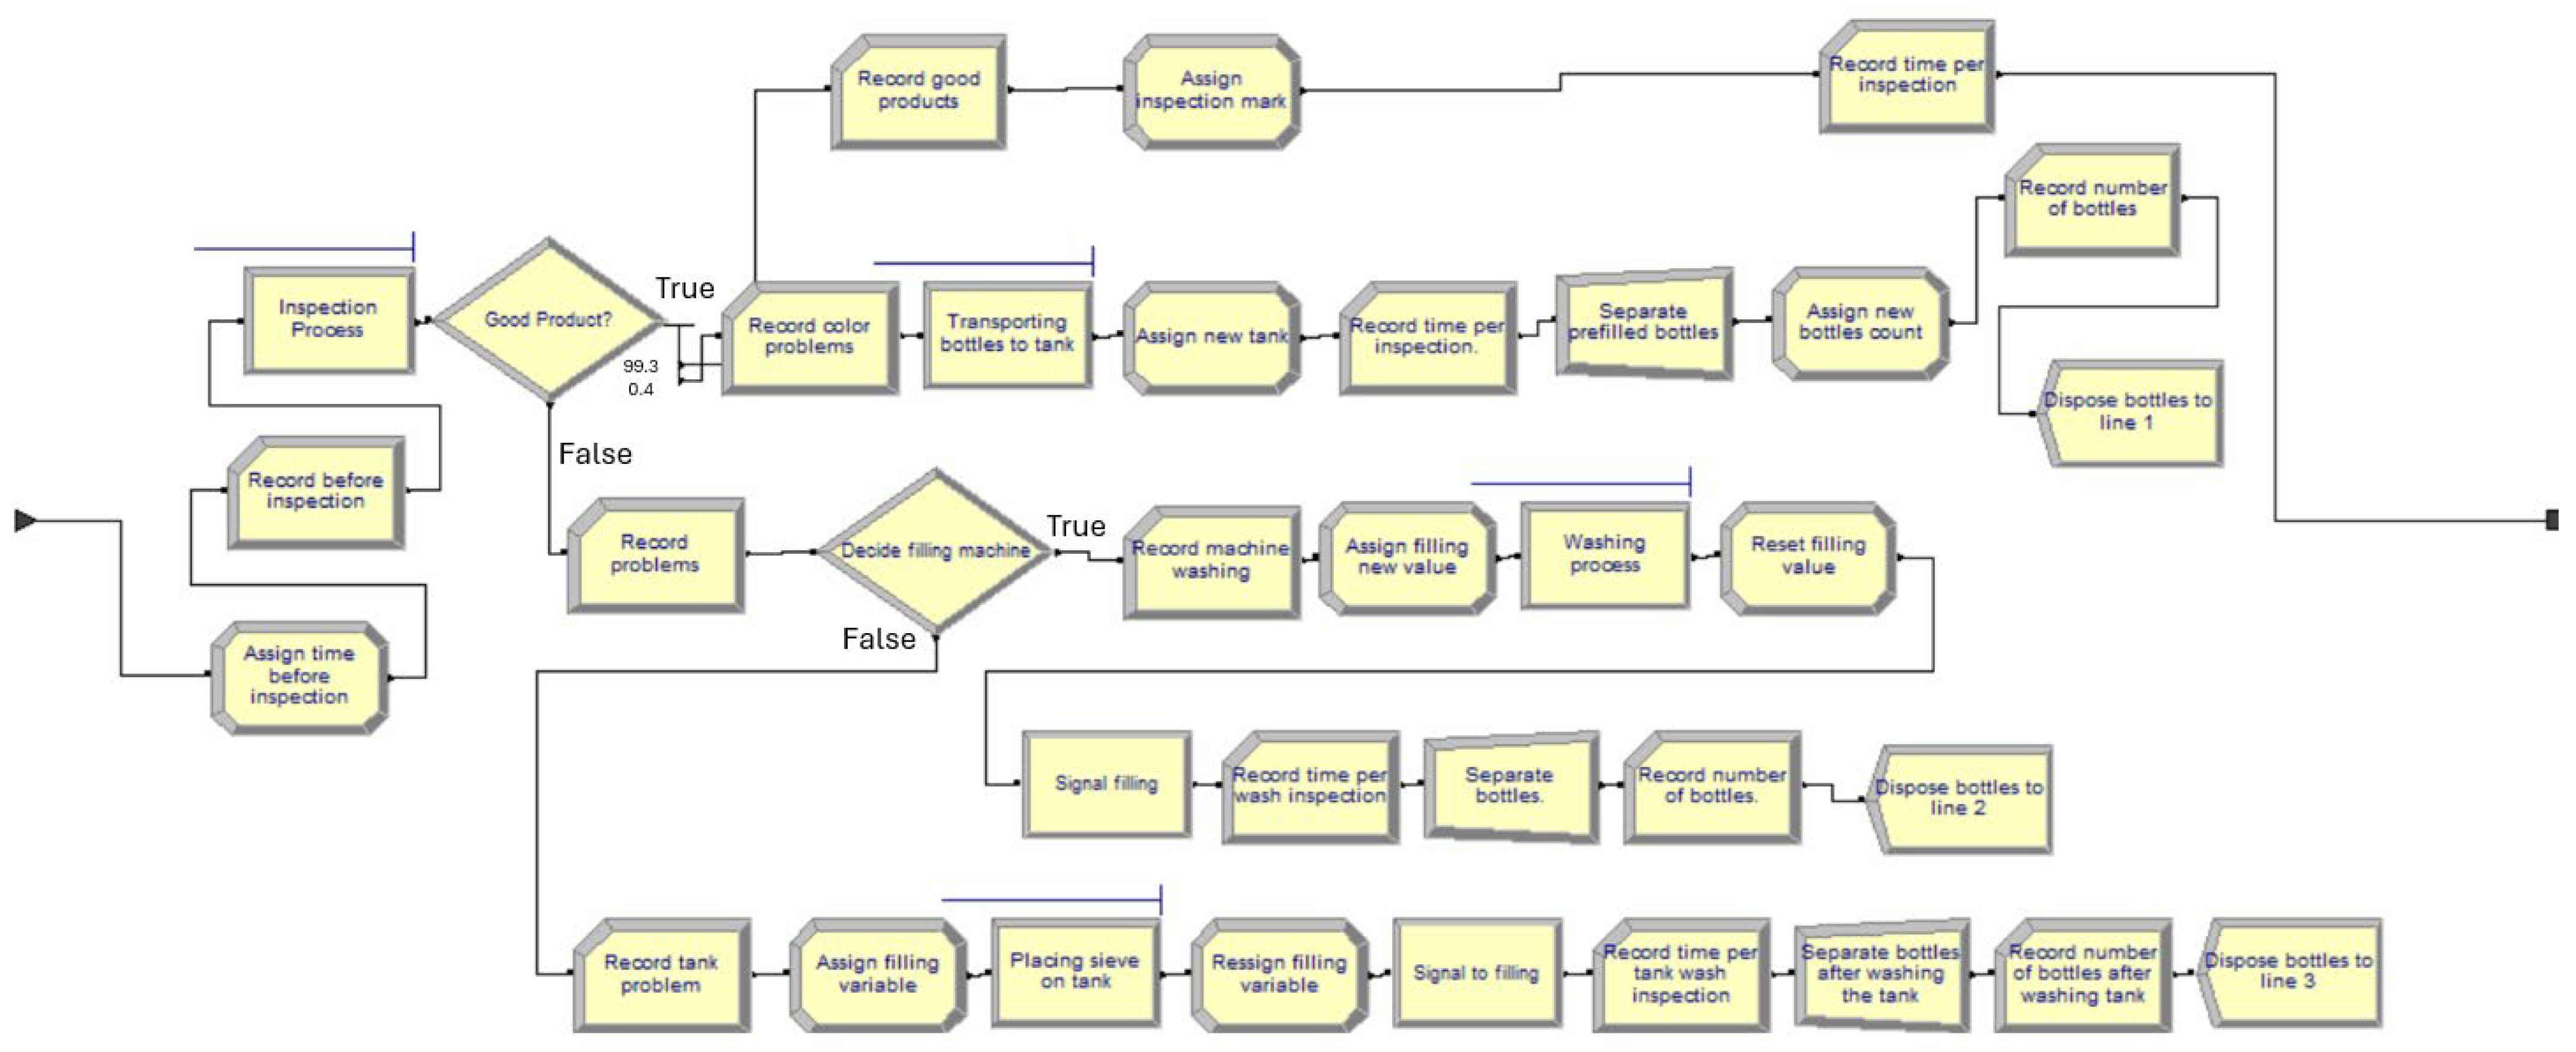
2.1.9. Inspection Sub-Model
2.1.10. Palletizing Process
2.2. Environmental Assessment
- (i)
- Raw material unit index
- (ii)
- Energy unit index
- (iii)
- Waste unit index
- (iv)
- Product unit index
- (v)
- Packaging unit index
- (i)
- Raw material unit index
- (ii)
- Energy unit index
- (iii)
- Waste unit index
- (iv)
- Product unit index
- (v)
- Packaging unit index
3. Improvement Actions on the Production Line
To-Be Simulation Models
4. Research Results
4.1. Simulation Results
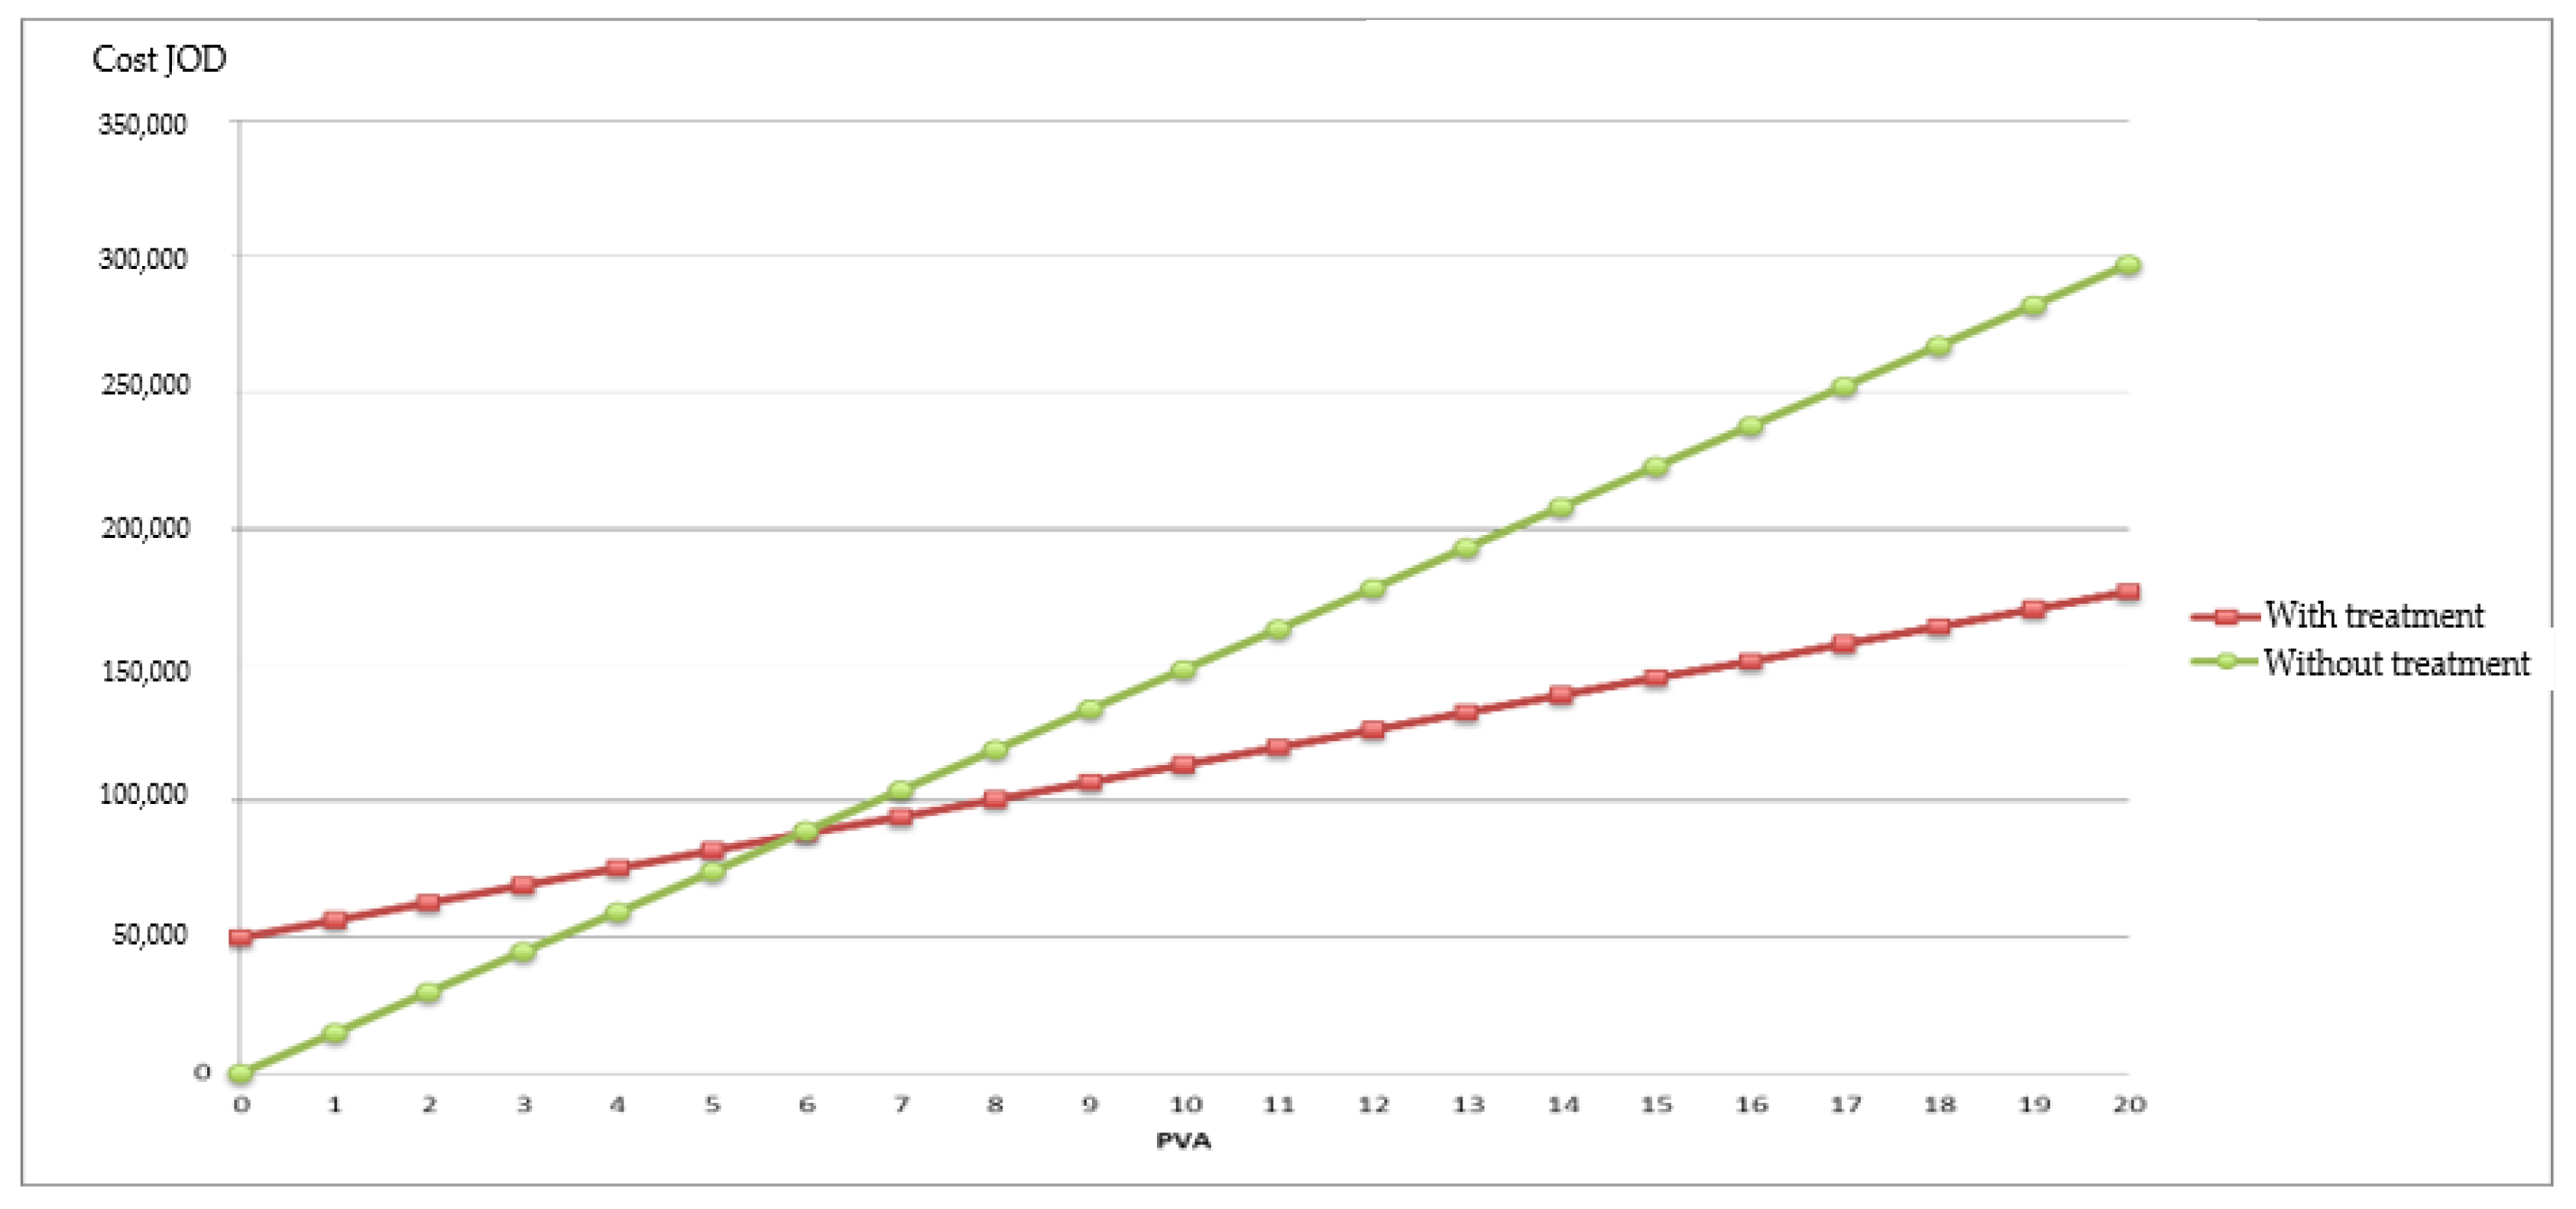
4.2. Waste Treatment
5. Conclusions
Author Contributions
Funding
Data Availability Statement
Conflicts of Interest
References
- Jadoon, G.; Din, I.U.; Almogren, A.; Almajed, H. Smart and agile manufacturing framework, a case study for automotive industry. Energies 2020, 13, 5766. [Google Scholar] [CrossRef]
- Santos, D.M.C.D.; Santos, B.K.D.; Santos, C.G.D. Implementation of a standard work routine using Lean Manufacturing tools: A case Study. Gestão Produção 2021, 28, e4823. [Google Scholar] [CrossRef]
- Kaeo-Tad, N.; Jeenanunta, C.; Chumnumporn, K.; Nitisahakul, T.; Sanprasert, V. Resilient manufacturing: Case studies in Thai automotive industries during the COVID-19 pandemic. Eng. Manag. Prod. Serv. 2021, 13, 99–113. [Google Scholar] [CrossRef]
- Pattanaik, L.N.; Sharma, B.P. Implementing lean manufacturing with cellular layout: A case study. Int. J. Adv. Manuf. Technol. 2009, 42, 772–779. [Google Scholar] [CrossRef]
- Muslimen, R.; Yusof, S.M.; Abidin, A.Z. Lean manufacturing implementation in Malaysian automotive components manufacturer: A case study. In Proceedings of the World Congress on Engineering, London, UK, 6–8 July 2011; Volume 1, No. 1. pp. 6–8. [Google Scholar]
- Helleno, A.L.; de Moraes, A.J.I.; Simon, A.T. Integrating sustainability indicators and Lean Manufacturing to assess manufacturing processes: Application case studies in Brazilian industry. J. Clean. Prod. 2017, 153, 405–416. [Google Scholar] [CrossRef]
- Singh, J.; Singh, H.; Singh, G. Productivity improvement using lean manufacturing in manufacturing industry of Northern India: A case study. Int. J. Product. Perform. Manag. 2018, 67, 1394–1415. [Google Scholar] [CrossRef]
- Jimenez, G.; Santos, G.; Sá, J.C.; Ricardo, S.; Pulido, J.; Pizarro, A.; Hernández, H. Improvement of Productivity and Quality in the Value Chain through Lean Manufacturing—A case study. Procedia Manuf. 2019, 41, 882–889. [Google Scholar] [CrossRef]
- Potdar, P.K.; Routroy, S. Performance analysis of agile manufacturing: A case study on an Indian auto component manufacturer. Meas. Bus. Excell. 2017, 21, 117–135. [Google Scholar] [CrossRef]
- Kumar, R.; Singh, K.; Jain, S.K. Agility enhancement through agile manufacturing implementation: A case study. TQM J. 2022, 34, 1527–1546. [Google Scholar] [CrossRef]
- Zhang, W.J.; Van Luttervelt, C.A. Toward a resilient manufacturing system. CIRP Ann. 2011, 60, 469–472. [Google Scholar] [CrossRef]
- Kusiak, A. Fundamentals of Smart Manufacturing: A Multi-Thread Perspective. Annu. Rev. Control. 2019, 47, 214–220. [Google Scholar] [CrossRef]
- Lee, J.; Siahpour, S.; Jia, X.; Brown, P. Introduction to resilient manufacturing systems. Manuf. Lett. 2022, 32, 24–27. [Google Scholar] [CrossRef]
- Mourtzis, D.; Angelopoulos, J.; Panopoulos, N. Robust engineering for the design of resilient manufacturing systems. Appl. Sci. 2021, 11, 3067. [Google Scholar] [CrossRef]
- Dittfeld, H.; van Donk, D.P.; van Huet, S. The effect of production system characteristics on resilience capabilities: A multiple case study. Int. J. Oper. Prod. Manag. 2022, 42, 103–127. [Google Scholar] [CrossRef]
- Fowler, D.S.; Epiphaniou, G.; Higgins, M.D.; Maple, C. Aspects of resilience for smart manufacturing systems. Strateg. Change 2023, 32, 183–193. [Google Scholar] [CrossRef]
- Fijal, T. An environmental assessment method for cleaner production technologies. J. Clean. Prod. 2007, 15, 914–919. [Google Scholar] [CrossRef]
- Gong, Q.; Wu, J.; Jiang, Z.; Hu, M.; Chen, J.; Cao, Z. An integrated design method for remanufacturing scheme 19. considering carbon emission and customer demands. J. Clean. Prod. 2024, 476, 143681. [Google Scholar] [CrossRef]
- Ding, C.; Li, C.; Xiong, Z.; Li, Z. Computer big data technology in additive manufacturing and product design in sustainable manufacturing. Int. J. Adv. Manuf. Technol. 2024, 135, 4855–4863. [Google Scholar] [CrossRef]
- Alkaya, E.; Demirer, G.N. Sectoral assessment of the Turkish textile industry for the diffusion of sustainable production approach. J. Text. Inst. 2015, 106, 1212–1225. [Google Scholar] [CrossRef]
- Giannetti, B.F.; Agostinho, F.; Eras, J.C.; Yang, Z.; Almeida, C.M.V.B. Cleaner production for achieving the sustainable development goals. J. Clean. Prod. 2020, 271, 122127. [Google Scholar] [CrossRef]
- Ghazinoory, S. Cleaner production in Iran: Necessities and priorities. J. Clean. Prod. 2005, 13, 755–762. [Google Scholar] [CrossRef]
- Van Berkel, R. Cleaner production for process industries. In Proceedings of the Plenary Lecture—CHEMECA 2000, Perth, WA, USA, 9–12 July 2000. [Google Scholar]
- Bai, S.W.; Zhang, J.S.; Wang, Z. A methodology for evaluating cleaner production in the stone processing industry: Case study of a Shandong stone processing firm. J. Clean. Prod. 2015, 102, 461–476. [Google Scholar] [CrossRef]
- Ramos, A.R.; Ferreira, J.C.E.; Kumar, V.; Garza-Reyes, J.A.; Cherrafi, A. A lean and cleaner production benchmarking method for sustainability assessment: A study of manufacturing companies in Brazil. J. Clean. Prod. 2018, 177, 218–231. [Google Scholar] [CrossRef]
- de Oliveira Neto, G.C.; Correia, J.M.F.; Silva, P.C.; de Oliveira Sanches, A.G.; Lucato, W.C. Cleaner Production in the textile industry and its relationship to sustainable development goals. J. Clean. Prod. 2019, 228, 1514–1525. [Google Scholar] [CrossRef]
- Dai, N.; Li, L.; Xu, K.; Lu, Z.; Hu, X.; Yuan, Y. Development of a standardized data collection and intelligent fabric quality prediction system for the weaving department. J. Eng. Fibers Fabr. 2025, 20, 15589250241312778. [Google Scholar] [CrossRef]
- Li, T.; Li, Y. Artificial intelligence for reducing the carbon emissions of 5G networks in China. Nat. Sustain. 2023, 6, 1522–1523. [Google Scholar] [CrossRef]
- Al-Refaie, A.; Lepkova, N. A Fuzzy LARG Index for Assessing the Lean, Agile, Resilience, and Green Paradigms in Industrial Companies. Sustainability 2025, 17, 1863. [Google Scholar] [CrossRef]
- Al-Refaie, A.; Al-Tahat, M.; Lepkova, N. Modelling relationships between agility, lean, resilient, green practices in cold supply chains using ISM approach. Technol. Econ. Dev. Econ. 2020, 26, 675–694. [Google Scholar] [CrossRef]
- Al-Refaie, A.; Lepkova, N.; Camlibel, M.E. The relationships between the pillars of TPM and TQM and manufacturing performance using structural equation modeling. Sustainability 2022, 14, 1497. [Google Scholar] [CrossRef]
- Al-Refaie, A.; Kokash, T. Optimization of sustainable reverse logistics network with multi-objectives under uncertainty. J. Remanufacturing 2023, 13, 1–23. [Google Scholar] [CrossRef]
- Al-Refaie, A.; Jararweh, A. Adoption of quality management 4.0 to enhance the overall effectiveness of vehicle licence renewal services. Int. J. Electron. Gov. 2024, 16, 406–427. [Google Scholar]
- Al-Refaie, A.; Abbasi, G.; Al-shalaldeh, H. Lean and agile practices to improve the performance of filling process via simulation and data envelopment analysis. SN Appl. Sci. 2019, 1, 1131. [Google Scholar] [CrossRef]


| Process | Fitted Distribution | Process | Fitting Distributions |
|---|---|---|---|
| Placing Plastic Bottles | 1 + EXPO (1.39) | Tape Process | Constant (3.5) |
| Filling Process | 9.07 + EXPO (1.23) | Inspection Process | Constant (45) |
| Cap Feeding Process | NORM (12.6, 3.55) | Placing Sieve on Tank | Constant (2700) |
| Capping Process | Constant (0.3) | Transport After Color Problem | Constant (120) |
| Stamping Process | Constant (0.47) | Transport to Retape | Constant (2) |
| Labeling Process | Constant (5) | Transport to pallet | TRIA (3, 4, 5) |
| Packaging Process | 13 + WEIB (40.4, 1.19) | Pallet Wrapping | Constant (3) |
| Conveyor | Details | Velocity (Bottle/min) | Length (m) | Capacity (Bottle) |
|---|---|---|---|---|
| Conveyor 1 | Plastic to Filling Conveyor | 250 | 2.07 | 23 |
| Conveyor 2 | Filling before Cap Feeding Conveyor | 250 | 0.58 | 6 |
| Conveyor 3 | Before Cap Feeding to Cap Feeding conveyor | 250 | 1.33 | 16 |
| Conveyor 4 | Cap Feeding to Capping Conveyor | 200 | 1.48 | 18 |
| Conveyor 5 | Capping to Stamping conveyor | 200 | 0.66 | 5 |
| Conveyor 6 | Stamping to Labeling Conveyor | 200 | 0.79 | 8 |
| Conveyor 7 | Labeling to Packaging Conveyor | 200 | 1.91 | 17 |
| Process | 10 Replications | 50 Replications | Unit | ||||
|---|---|---|---|---|---|---|---|
| Simulation | Actual | Error % | Simulation | Actual | Error | ||
| Bottle Placing | 12,176.4 | 12,211 | 0.28 | 12,131 | 12,211 | 0.66 | Bottle |
| Filling | 12,126 | 12,184 | 0.48 | 12,082 | 12,184 | 0.84 | Bottle |
| Cap Feeding | 12,123.4 | 12,184 | 0.50 | 12,075.92 | 12,184 | 0.89 | Bottle |
| Capping | 12,123.2 | 12,184 | 0.50 | 12,075.6 | 12,184 | 0.89 | Bottle |
| Stamping | 12,123.2 | 12,184 | 0.50 | 12,075.56 | 12,184 | 0.89 | Bottle |
| Labeling | 12,123.1 | 12,184 | 0.50 | 12,075.26 | 12,184 | 0.89 | Bottle |
| Packaging | 1009.6 | 1015 | 0.53 | 1005.54 | 1015 | 0.93 | Box |
| Taping | 1009.6 | 1015 | 0.53 | 1005.54 | 1015 | 0.93 | Box |
| Inspection | 102.6 | 102 | 0.59 | 99.74 | 99 | 0.75 | Box |
| Transport to Retape | 367 | 358 | 2.51 | 368 | 358 | 2.79 | Box |
| Transport to pallet | 1009.6 | 1015 | 0.53 | 1005.54 | 1015 | 0.93 | Box |
| Pallet wrapping | 13.90 | 14.1 | 1.42 | 13.97 | 14.1 | 0.95 | Pallet |
| Process | PPT (s) | Down Time (s) | Run Time (s) | Availability % |
|---|---|---|---|---|
| Filling | 25,200 | 2000 | 23,200 | 92.06 |
| Capping | 78,000 | 0 | 78,000 | 100.00 |
| Labeling | 78,000 | 3270 | 74,730 | 95.81 |
| Taping | 5400 | 220 | 5180 | 95.93 |
| Process | Good Count | Total Count | Unit | Quality % |
|---|---|---|---|---|
| Filling | 12,081.98 | 12,101.04 | Bottle | 99.84 |
| Capping | 12,075.6 | 12,075.6 | Bottle | 100.00 |
| Labeling | 12,075.26 | 12,075.54 | Bottle | 100.00 |
| Taping | 1036.54 | 1105.28 | Box | 93.78 |
| Process | ICT (s) | Total Count | Run Time (s) | Performance % |
|---|---|---|---|---|
| Bottle Placing | 1.18 | 13,281.18 | 78,000 | 20.09 |
| Filling | 9.6 | 2016.84 | 23,200 | 83.46 |
| Cap Feeding | 6.16 | 12,081.94 | 76,800 | 96.91 |
| Capping | 6.33 | 12,075.6 | 78,000 | 98.00 |
| Labeling | 5 | 12,075.54 | 74,730 | 80.79 |
| Taping | 4 | 1105.28 | 5180 | 85.33 |
| Process | Availability | Quality | Performance | OEE % |
|---|---|---|---|---|
| Bottle Placing | 100.00 | 100.00 | 20.09 | 20.09 |
| Filling | 99.23 | 99.84 | 83.46 | 82.68 |
| Cap Feeding | 100.00 | 100.00 | 95.37 | 95.37 |
| Capping | 100.00 | 100.00 | 98.00 | 98.00 |
| Labeling | 95.81 | 100.00 | 80.79 | 77.40 |
| Taping | 99.08 | 93.78 | 85.33 | 79.29 |
| Degree of Environmental Nuisance | Wz |
|---|---|
| Very low (insignificant) | Below 25 |
| Low | 25–50 |
| Medium | 50–100 |
| High | 100–200 |
| Very high | Above 200 |
| Raw Material i | msi (tons) | Process | wsi | wsi (per kg) |
|---|---|---|---|---|
| Palm Oil | 1960 | Saponification | 0.544 | 5.44 |
| Palm Stearin Oil | 330 | Saponification | 0.092 | 0.92 |
| Palm Kernel Olein Oil | 600 | Saponification | 0.166 | 1.66 |
| Coconut Fatty Acids | 11 | Saponification | 0.003 | 0.03 |
| Fatty Acid | 18 | Saponification | 0.005 | 0.05 |
| Sodium Hydroxide | 710 | Saponification | 0.197 | 1.97 |
| Sodium Chloride | 111 | Saponification | 0.031 | 0.31 |
| Fragrances, Perfume compounds | 90 | Adding Perfume and extrusion | 0.025 | 0.25 |
| Antioxidants | 10 | Mixing | 0.003 | 0.03 |
| Pure titanium dioxide | 3 | Soap coloring & milling | 0.001 | 0.01 |
| Phosphoric acid | 8 | Neutralization | 0.002 | 0.02 |
| Water | Saponification/neutralization/drying | 0.004 | 0.04 | |
| Dyes | 15 | Soap coloring and milling | 0.004 | 0.04 |
| Total weight | 1.076 | |||
| Raw material unit index (Ws) | 10.763 | |||
| = 29.31 MJ/Kg); Mass of 10 Units = 1 Kg | |||
|---|---|---|---|
| tpu | Consumption (kg/yr) × tpu | ||
| Diesel | 46 (MJ/kg) | 1.5862 | 2,743,725.5 |
| HFO | 43.5 (MJ/kg) | 1.4843 | 2,530,657.576 |
| Electricity | 3.6 (MJ/kWh) | 453,682.59 | |
| Raw Energy Material (i) | Consumption | Consumption Mt/year | Consumption (kg/yr) × tpu | wej | wej (10 unit) | Yearly Cost (JOD) |
|---|---|---|---|---|---|---|
| Heavy fuel oil | 1705 Mt/year | 1705 | 2,530,657.6 | 0.711 | 7.11 | 861,347 |
| Disel | 2,011,687.6 (litre/yr) | 1729.74 (1163 Lt/ton) | 2,743,725.5 | 0.761 | 7.61 | 1,071,252 |
| Electricity | 36,929,844.5 kwh/year | 132,947.44 | 453,682.60 | 0.126 | 1.26 | 350,325 |
| Energy unit index 1927 kilowatt-hours | 15.889 | |||||
| Waste Type | Waste (m3) | Waste (Kg) | kt | k = kt/kmax | woc | wog | k × woc | k × wog |
|---|---|---|---|---|---|---|---|---|
| Liquid waste (l) | 29,481 | 29,481,000 | 0.9 | 1 | 8.178 | 8.178 | 8.1778 | |
| Gaseous waste (CO2) | 13,195,854.9 | 0.6 | 0.667 | 3.6 | 2.4403 | |||
| Waste unit index | 10.6181 |
| Products Manufactured | mpp | mpp (kg) | wpp | kpp | |
|---|---|---|---|---|---|
| Soap (primary product) | 3605 ton | 3,605,000 | 1 | table (8) | 0.225 |
| Water Glycerin (byproduct) | 10 m3 | 31,700 | 0.0009 | 1 | 0.0009 |
| Product unit index | 0.234 |
| Hazardous Components of Soap | mse (kg) | kpe | wpe = kpe × wp1 | Process |
|---|---|---|---|---|
| NaOH | 710,000 | 0.197 | 0.1969 | Saponification |
| Fragrances | 90,000 | 0.025 | 0.0249 | Soap perfume adding and extrusion |
| Titanium dioxide | 3000 | 0.0008 | 0.0008 | Soap coloring and milling |
| Phosphoric acid | 8000 | 0.002 | 0.0022 | Neutralization |
| Total wpe | 0.225 |
| Profile Unit Indices | Unit Index |
|---|---|
| Raw material | 10.7628 |
| Energy | 15.8892 |
| Waste generation | 106.1810 |
| Product | 2.3376 |
| Packaging | 0.5 |
| Integrated | 107.93 |
| Process/Operator | Availability % | Quality % | Performance % | OEE % | OEE AS-IS |
|---|---|---|---|---|---|
| Bottle placing | 99.69 | 99.82 | 81.71 | 81.31 | 24.09 |
| Filling | 99.23 | 99.84 | 85.26 | 84.47 | 82.68 |
| Cap Feeding | 100.00 | 100.00 | 97.17 | 97.17 | 95.37 |
| Capping | 100.00 | 100.00 | 98.70 | 98.70 | 98.00 |
| Labeling | 95.81 | 100.00 | 82.31 | 78.86 | 77.40 |
| Taping | 99.08 | 93.78 | 88.04 | 81.80 | 79.29 |
| Process/Operator | Availability % | Quality % | Performance % | OEE % Actions 1 to 3 | OEE % Actions 1 and 2 |
|---|---|---|---|---|---|
| Bottle placing | 99.69 | 99.82 | 81.71 | 81.31 | 81.31 |
| Filling | 99.50 | 99.84 | 86.06 | 85.49 | 84.47 |
| Cap Feeding | 100.00 | 100.00 | 97.52 | 97.52 | 97.17 |
| Capping | 100.00 | 100.00 | 98.70 | 98.70 | 98.70 |
| Labeling | 97.46 | 100.00 | 82.31 | 80.22 | 78.86 |
| Taping | 99.54 | 93.78 | 88.04 | 82.19 | 81.80 |
| Process/Operator | Availability | Quality | Performance | OEE % | Improvement % | ||
|---|---|---|---|---|---|---|---|
| A1-A4 | A1-A3 | AS-IS | |||||
| Bottle Placing | 100 | 99.82 | 81.56 | 81.31 | 81.31 | 24.09 | 237.53 |
| Filling | 99.50 | 99.84 | 87.11 | 86.54 | 85.49 | 82.68 | 4.67 |
| Cap Feeding | 100 | 100 | 97.88 | 96.74 | 97.52 | 95.37 | 1.44 |
| Capping | 100.00 | 100.00 | 99.96 | 99.96 | 98.70 | 98.00 | 2.00 |
| Labeling | 97.46 | 100.00 | 83.72 | 81.59 | 80.22 | 77.40 | 5.41 |
| Taping | 99.92 | 100.00 | 100 | 99.92 | 82.19 | 79.29 | 26.02 |
| Cases | Purchased Water (m3/Day) | Cost (JOD/Day) | Cost (JOD/Year) |
|---|---|---|---|
| Case 1: without treatment | 44 | 48.4 | 14,858.8 |
| Case 2: with treatment | 18.8 | 20.68 | 6348.76 |
Disclaimer/Publisher’s Note: The statements, opinions and data contained in all publications are solely those of the individual author(s) and contributor(s) and not of MDPI and/or the editor(s). MDPI and/or the editor(s) disclaim responsibility for any injury to people or property resulting from any ideas, methods, instructions or products referred to in the content. |
© 2025 by the authors. Licensee MDPI, Basel, Switzerland. This article is an open access article distributed under the terms and conditions of the Creative Commons Attribution (CC BY) license (https://creativecommons.org/licenses/by/4.0/).
Share and Cite
Al-Refaie, A.; Lepkova, N. Adoption of Lean, Agile, Resilient, and Cleaner Production Strategies to Enhance the Effectiveness and Sustainability of Products and Production Processes. Processes 2025, 13, 2152. https://doi.org/10.3390/pr13072152
Al-Refaie A, Lepkova N. Adoption of Lean, Agile, Resilient, and Cleaner Production Strategies to Enhance the Effectiveness and Sustainability of Products and Production Processes. Processes. 2025; 13(7):2152. https://doi.org/10.3390/pr13072152
Chicago/Turabian StyleAl-Refaie, Abbas, and Natalija Lepkova. 2025. "Adoption of Lean, Agile, Resilient, and Cleaner Production Strategies to Enhance the Effectiveness and Sustainability of Products and Production Processes" Processes 13, no. 7: 2152. https://doi.org/10.3390/pr13072152
APA StyleAl-Refaie, A., & Lepkova, N. (2025). Adoption of Lean, Agile, Resilient, and Cleaner Production Strategies to Enhance the Effectiveness and Sustainability of Products and Production Processes. Processes, 13(7), 2152. https://doi.org/10.3390/pr13072152