Abstract
In islanded microgrids with high-proportion renewable energy, the disconnection from the main grid leads to the characteristics of low inertia, weak damping, and high impedance ratio, which exacerbate the safety risks of frequency and voltage. To balance the requirements of system operation economy and frequency–voltage safety, a coordinated optimization scheduling method for frequency and voltage in islanded microgrids considering the active support of battery energy storage (BES) is proposed. First, to prevent the state of charge (SOC) of BES from exceeding the frequency regulation range due to rapid frequency adjustment, a BES frequency regulation strategy with an adaptive virtual droop control coefficient is adopted. The frequency regulation capability of BES is evaluated based on the capacity constraints of grid-connected converters, and a joint frequency and voltage regulation strategy for BES is proposed. Second, an average system frequency model and an alternating current power flow model for islanded microgrids are established. The influence of steady-state voltage fluctuations on active power frequency regulation is analyzed, and dynamic frequency safety constraints and node voltage safety constraints are constructed and incorporated into the optimization scheduling model. An optimization scheduling method for islanded microgrids that balances system operation costs and frequency–voltage safety is proposed. Finally, the IEEE 33-node system in islanded mode is used as a simulation case. Through comparative analysis of different optimization strategies, the effectiveness of the proposed method is verified.
1. Introduction
In special areas such as high-altitude regions, mountainous areas, and remote islands, constructing isolated microgrid systems mainly powered by renewable energy with BES as a supplement to achieve energy self-sufficiency is an important means to facilitate the development of new power systems [1]. However, isolated microgrids generally have characteristics such as simple topological structures, small capacity scales, high renewable energy penetration rates, and low inertia levels. Moreover, the resistance-inductance characteristics of microgrid transmission lines are gradually increasing. The high resistance/reactance ratio makes the coupling characteristics between system frequency and voltage as well as between active and reactive power more and more obvious, posing serious challenges to the safe and stable control of microgrid frequency and voltage [2]. BES has advantages such as fast response speed, large adjustable power, and flexible control, which can effectively solve the problems of safe and stable frequency and voltage in islanded microgrids [3,4,5]. In some cases, the frequency regulation ability of BES is even more effective than that of traditional synchronous units [6]. However, the capacity of BES converters is limited. When the converter provides more power for peak shaving or voltage regulation auxiliary services, the remaining idle capacity of the BES converter is insufficient, and the frequency regulation ability decreases, which is likely to trigger accidents such as system protection device actions, under-frequency load shedding, and power grid islanding. Therefore, it is urgent to study the joint optimal scheduling strategy for BES to participate in multiple auxiliary services to meet the safety requirements of frequency and voltage in islanded microgrids.
BES displays fast charging/discharging capabilities, enabling the decoupling of power generation and consumption in time and space. These systems are widely used in grid services such as new energy integration, energy arbitrage, peak shaving and valley filling, voltage regulation, and frequency regulation [7]. In terms of voltage regulation, BES can quickly absorb or release reactive power by flexibly controlling the power factor of converters, effectively mitigating voltage fluctuations caused by the uncertainty of renewable energy output [8,9]. Therefore, many studies have proposed methods that consider the participation of BES and other distributed energy resources, voltage regulation devices, etc., in reactive power optimization of power grids. By comprehensively accounting for system operational economy and voltage quality issues, many studies have established a collaborative reactive power optimal dispatch model integrating multiple resources [10,11]. In terms of frequency regulation, with the development and application of virtual synchronous machine technology, BES with virtual inertia control and virtual droop control technology has been widely studied. Many scholars have proposed strategies for BES to actively support grid frequency. Ref. [12] proposed a distributed control strategy to coordinate multiple BES to provide frequency regulation auxiliary services for power systems with a high proportion of renewable energy. Ref. [13] proposed a droop control strategy for BES considering the SOC to quickly respond to system frequency deviations and provide fast frequency support. Ref. [14] proposed an adaptive coordinated frequency control method based on SOC management. This strategy can effectively regulate the frequency under different initial SOCs of the BES and ensure the stable recovery of SOC. Ref. [15] proposed a new primary control strategy based on output regulation theory. This strategy takes advantage of the fast response ability of the energy storage system and the communication links within the microgrid to overcome the shortcomings of traditional droop control methods. However, the above control strategies are relatively complex and mainly applied to transient frequency regulation, ignoring the collaborative optimization between BES and other grid frequency regulation resources. Additionally, the general control strategy with a fixed virtual droop coefficient ignores the influence of the SOC of BES, which may lead to overcharging and over-discharging when BES provides frequency response power, affecting the control state and service life of BES. Thus, this paper proposes an adaptive power regulation coefficient control strategy for BES considering SOC, balancing SOC safety and frequency regulation capability. The strategy is applied to steady-state optimal scheduling, allowing BES to adaptively adjust its SOC value according to grid frequency regulation demands.
As traditional synchronous units in power systems are gradually replaced by power electronic devices, characteristics such as low system inertia and weak power grids have become increasingly prominent, leading to an increased risk to system frequency security [16]. Therefore, there is an increasingly urgent need to introduce diverse and flexible frequency regulation resources to enhance the system’s frequency security margin. Common indicators for characterizing the dynamic frequency security of the primary frequency regulation in power systems include rate of change of frequency, frequency nadir, and quasi-steady-state frequency deviation [17]. The main reasons for these frequency security indicators exceeding the safety thresholds are insufficient system inertia support and a shortage of frequency regulation reserve capacity. To address this issue, some scholars have proposed constructing dynamic frequency security constraints based on a simplified equivalent model of the power system frequency response and incorporating them into the optimal scheduling model [18,19]. At the scheduling level, the combination arrangement and output plans of synchronous units are optimized to improve the inertia level and primary frequency regulation capability of the power system. To further enhance the security level of the power system, resources such as BES, wind farms, and flexible loads are gradually participating in frequency regulation, forming an optimal scheduling system for power systems with multi-source participation in frequency support [20,21]. However, auxiliary services that only participate in a single function such as peak shaving and valley filling, energy arbitrage, frequency regulation, or reactive power optimization have not fully exploited the potential of BES for flexible regulation.
Existing research shows that BES can obtain more economic benefits by participating in multiple auxiliary services simultaneously [22,23,24]. Therefore, many scholars have proposed joint optimal scheduling strategies considering BES participating in multiple auxiliary services. Ref. [25] proposed a multi-time-scale dynamic programming method, which effectively solved the charging and discharging decision problems of BES participating in energy arbitrage and frequency regulation with two different time scales. Ref. [26] proposed a frequency–voltage coordinated support method with adaptive active power and reactive power distribution. Ref. [27] decomposed the joint optimization problem of BES participating in energy arbitrage, peak shaving, and frequency regulation into three sub-problems and integrated them using a dynamic programming framework, reducing the complexity of model solving. Ref. [28] proposed a joint optimal scheduling method for BES participating in peak shaving and valley filling and voltage regulation based on the day-ahead and intraday multi-time-scale technology. However, the above references rarely involve the research on the joint optimal scheduling of BES participating in frequency regulation and voltage regulation simultaneously and ignore the impact of the capacity limitation of BES converters on frequency regulation and voltage regulation. In fact, the reactive power output of BES will occupy a part of the converter capacity, thus affecting the primary frequency regulation capability of BES. Therefore, on the basis of considering the joint optimization model of BES participating in peak shaving and voltage regulation, this paper additionally considers the frequency regulation function of BES and analyzes the impact of the capacity limit of BES converters on frequency regulation ability so as to coordinately optimize the output of BES providing the two auxiliary services of frequency regulation and voltage regulation.
Therefore, a coordinated optimization scheduling method for frequency and voltage in islanded microgrids considering active support of BES is proposed. The main contributions of this article are stated as follows:
- A frequency regulation strategy for BES with an adaptive virtual droop control coefficient is herein proposed. Based on the virtual inertia and virtual droop coefficient control strategies, BES is enabled to actively support the system frequency. To prevent the SOC from exceeding the frequency regulation range due to rapid frequency regulation by BES, a piecewise control strategy for the BES virtual droop coefficient with respect to SOC is proposed;
- A joint optimization strategy for frequency and voltage regulation considering the converter capacity limitation of BES is proposed. The coupling relationship between the active and reactive power outputs of the BES converter was thus analyzed, and the maximum frequency regulation power of BES was evaluated based on the converter’s maximum apparent power constraint considering overcurrent capability. By flexibly adjusting the power factor of the converter, the active and reactive power outputs of the converter were reasonably allocated, and sufficient frequency regulation reserve capacity was reserved to meet the system’s frequency and voltage regulation requirements;
- An economic optimal scheduling model for islanded microgrids considering frequency and voltage security constraints was established. An economic cost calculation model for islanded microgrids including BES investment and degradation costs was developed. Based on the average system frequency model and alternating current power flow model of the islanded microgrid, dynamic frequency security constraints and node voltage security constraints were constructed and incorporated into the optimal scheduling model to balance the system’s economic operation costs and frequency–voltage security.
The remainder of the article is organized as follows. Section 2 proposes the adaptive virtual droop coefficient control strategy of BES. Section 3 proposes the joint optimization strategy for frequency regulation and voltage regulation of BES. The optimal scheduling model of the islanded microgrid considering the frequency regulation and voltage regulation of BES converters is proposed in Section 4. Case studies are conducted in Section 5, and Section 6 presents the conclusions.
2. The Adaptive Virtual Droop Coefficient Control Strategy of BES
Ignoring the frequency response delay link of the BES, based on the virtual inertia control strategy, the inertial response power provided by the BES for the system can be expressed as
where τ is the frequency response time, with the unit of s; t is the dispatch period, with the unit of h; is the virtual inertial response power of the BES; is the virtual inertia constant of the BES; Δft,τ is the system frequency deviation.
Based on the virtual droop control strategy, the BES can provide primary frequency regulation response power to the system.
where is the primary frequency regulation response power of the BES; is the virtual droop coefficient of the BES.
In order to better meet the system’s frequency regulation requirements and optimize the SOC management of the BES, in this paper, is regarded as an adjustable variable, and an adaptive virtual droop coefficient control strategy for the BES based on the Sigmoid function is proposed. According to the SOC state of the BES, the virtual droop coefficient is adjusted adaptively. When the SOC is large, it indicates that the BES has a large amount of stored energy. At this time period, the virtual droop coefficient should be increased to quickly compensate for the system’s power shortage. When the SOC is small, it means that the internal energy of the BES is insufficient. At this time period, the virtual droop coefficient should be decreased to avoid excessive charging and discharging.
When a power shortage occurs in the system, the BES compensates for the power shortage by discharging. The virtual droop coefficient for the BES during discharging can be expressed as follows:
where is the virtual droop coefficient of the BES during discharging; is the maximum virtual droop coefficient of the BES; is the SOC value of the BES. and are the maximum value and the intermediate value of the SOC, respectively; λ is a natural number, and its value range is [1, 20].
When there is a power surplus in the system, the BES absorbs the surplus power by charging. The virtual droop coefficient of the BES during charging can be expressed as follows:
where is the virtual droop coefficient of the BES during charging.
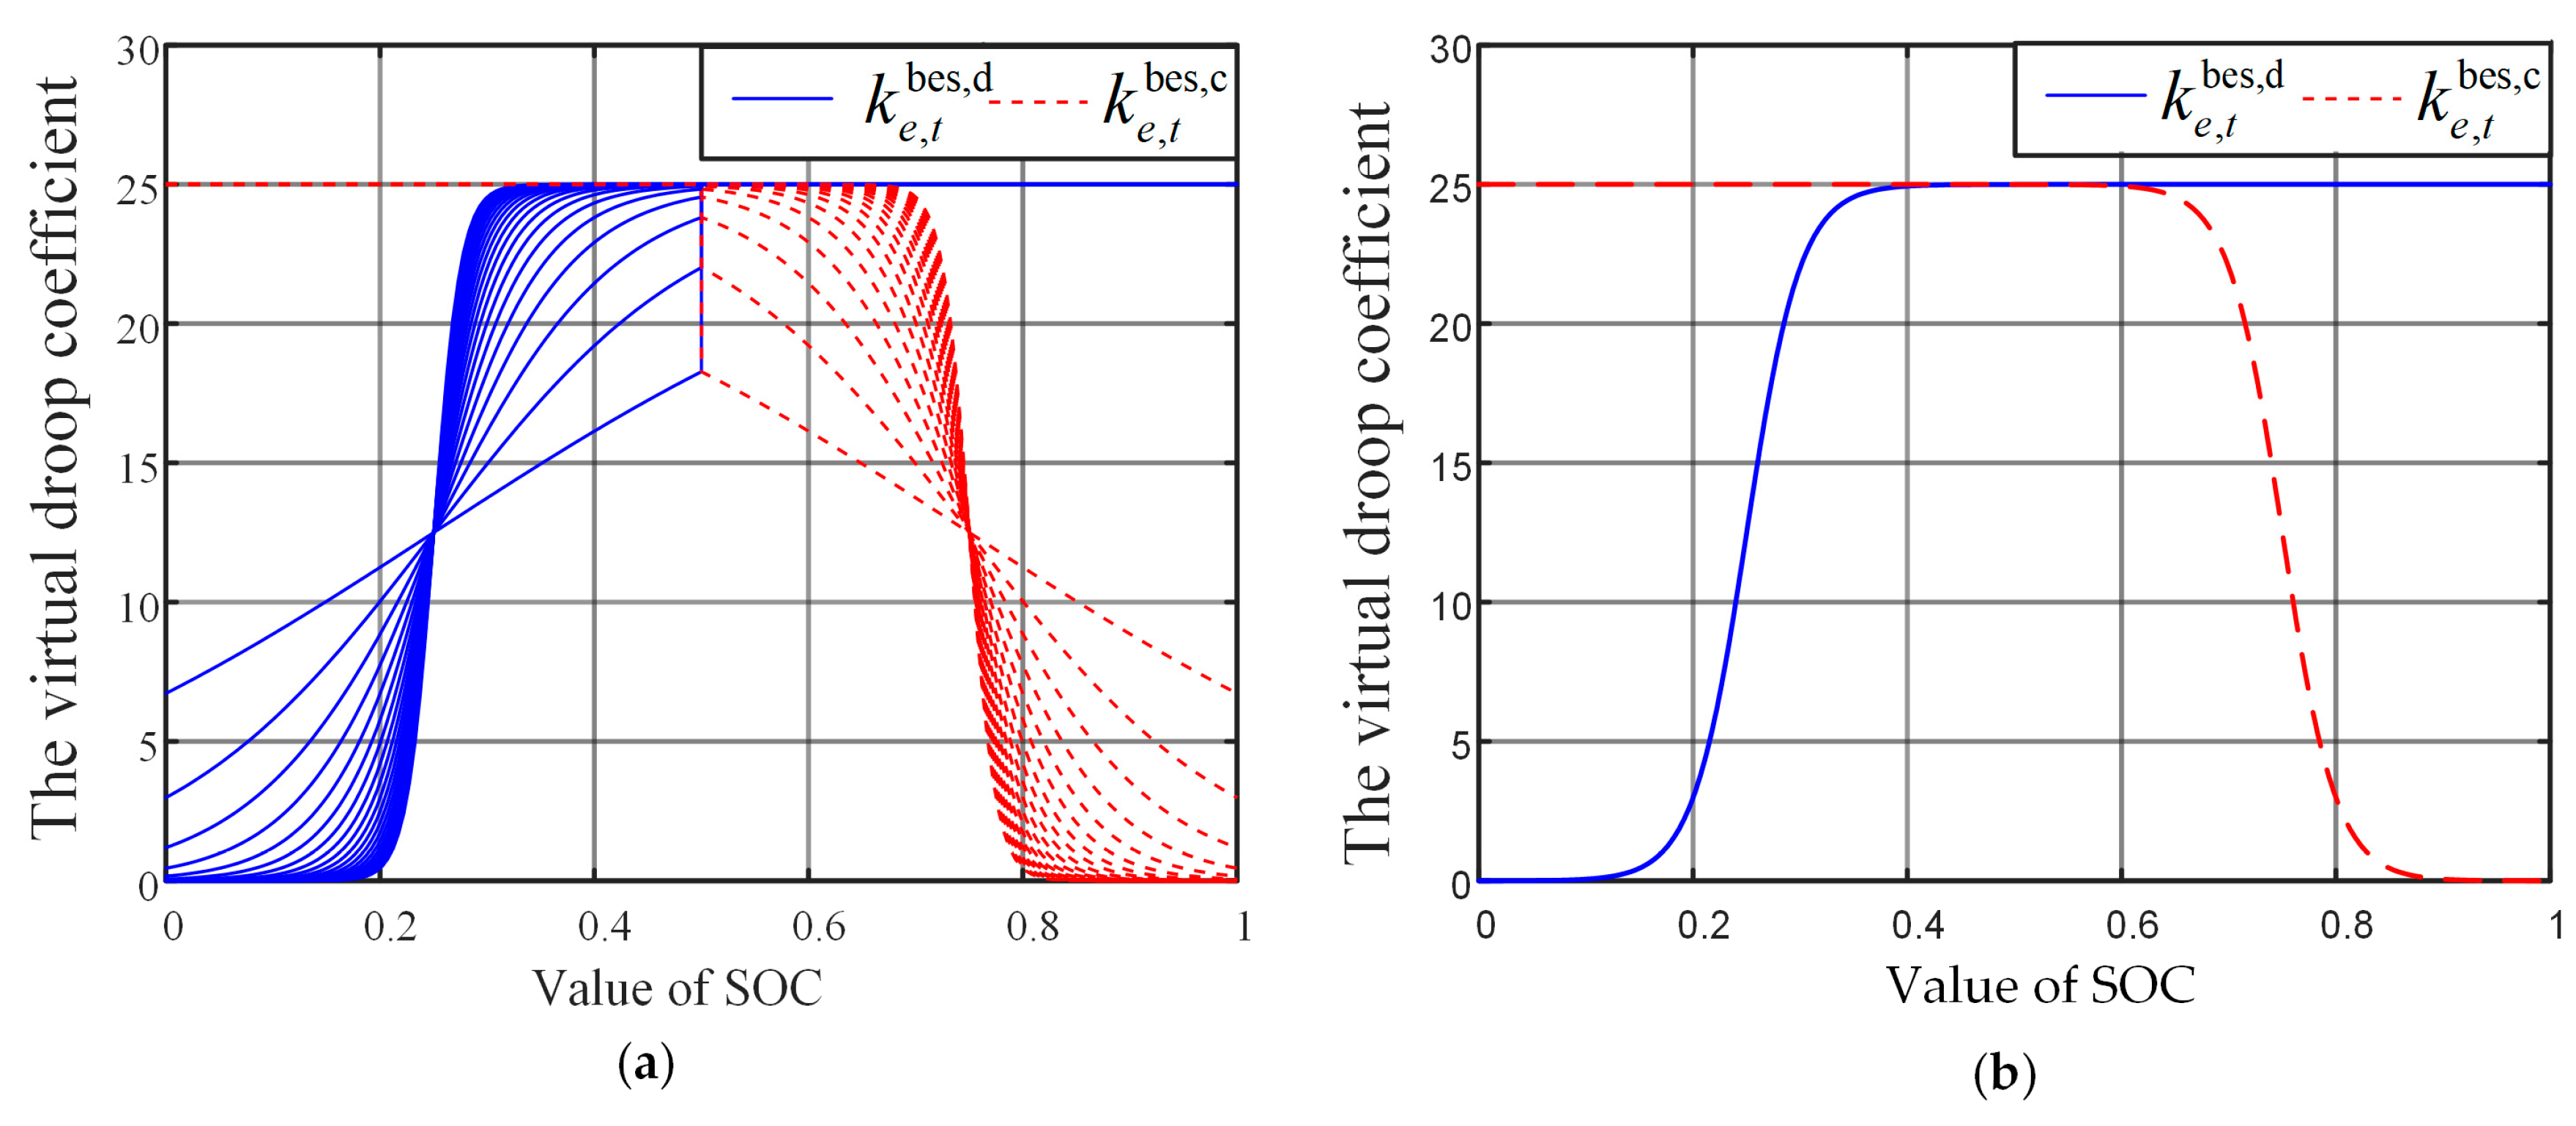
When = 25, the curves of the adaptive virtual droop coefficient corresponding to different values of λ are shown in Figure 1a. It can be seen that when the value of λ is small, the variation range of and with the SOC is small, and the adaptability is weak. In addition, in most of the SOC range, the value of and is small, and the frequency regulation capability of the BES cannot be fully utilized. When the value of λ is large, the variation of and with the SOC is large. Especially when λ = 20, within the range of [0, 0.2], the value of is approximately 0, and there is basically no frequency regulation capability, resulting in a low utilization rate of the BES capacity. Therefore, in order to balance the utilization rate of the BES capacity and the frequency regulation capability, in this paper, λ is taken as the intermediate value of 10.

Figure 1.
The curves of the adaptive virtual droop coefficient: (a) λ takes different values, and (b) λ = 10.
As can be seen from Figure 1b, when the SOC is between 0 and 0.1, to avoid over- discharging of the BES, the value of is controlled to be 0, resulting in no frequency-regulation capability. When the SOC is between 0.4 and 1, the value of is basically at its maximum, and the BES has the strongest frequency-regulation discharging capability. When the SOC is between 0 and 0.6, the value of is basically at its maximum, and the BES has the strongest frequency-regulation charging capability. When the SOC is between 0.9 and 1, to avoid overcharging of the BES, the value of is controlled to be 0, resulting in no frequency-regulation capability.
3. The Joint Optimization Strategy for Frequency Regulation and Voltage Regulation of BES
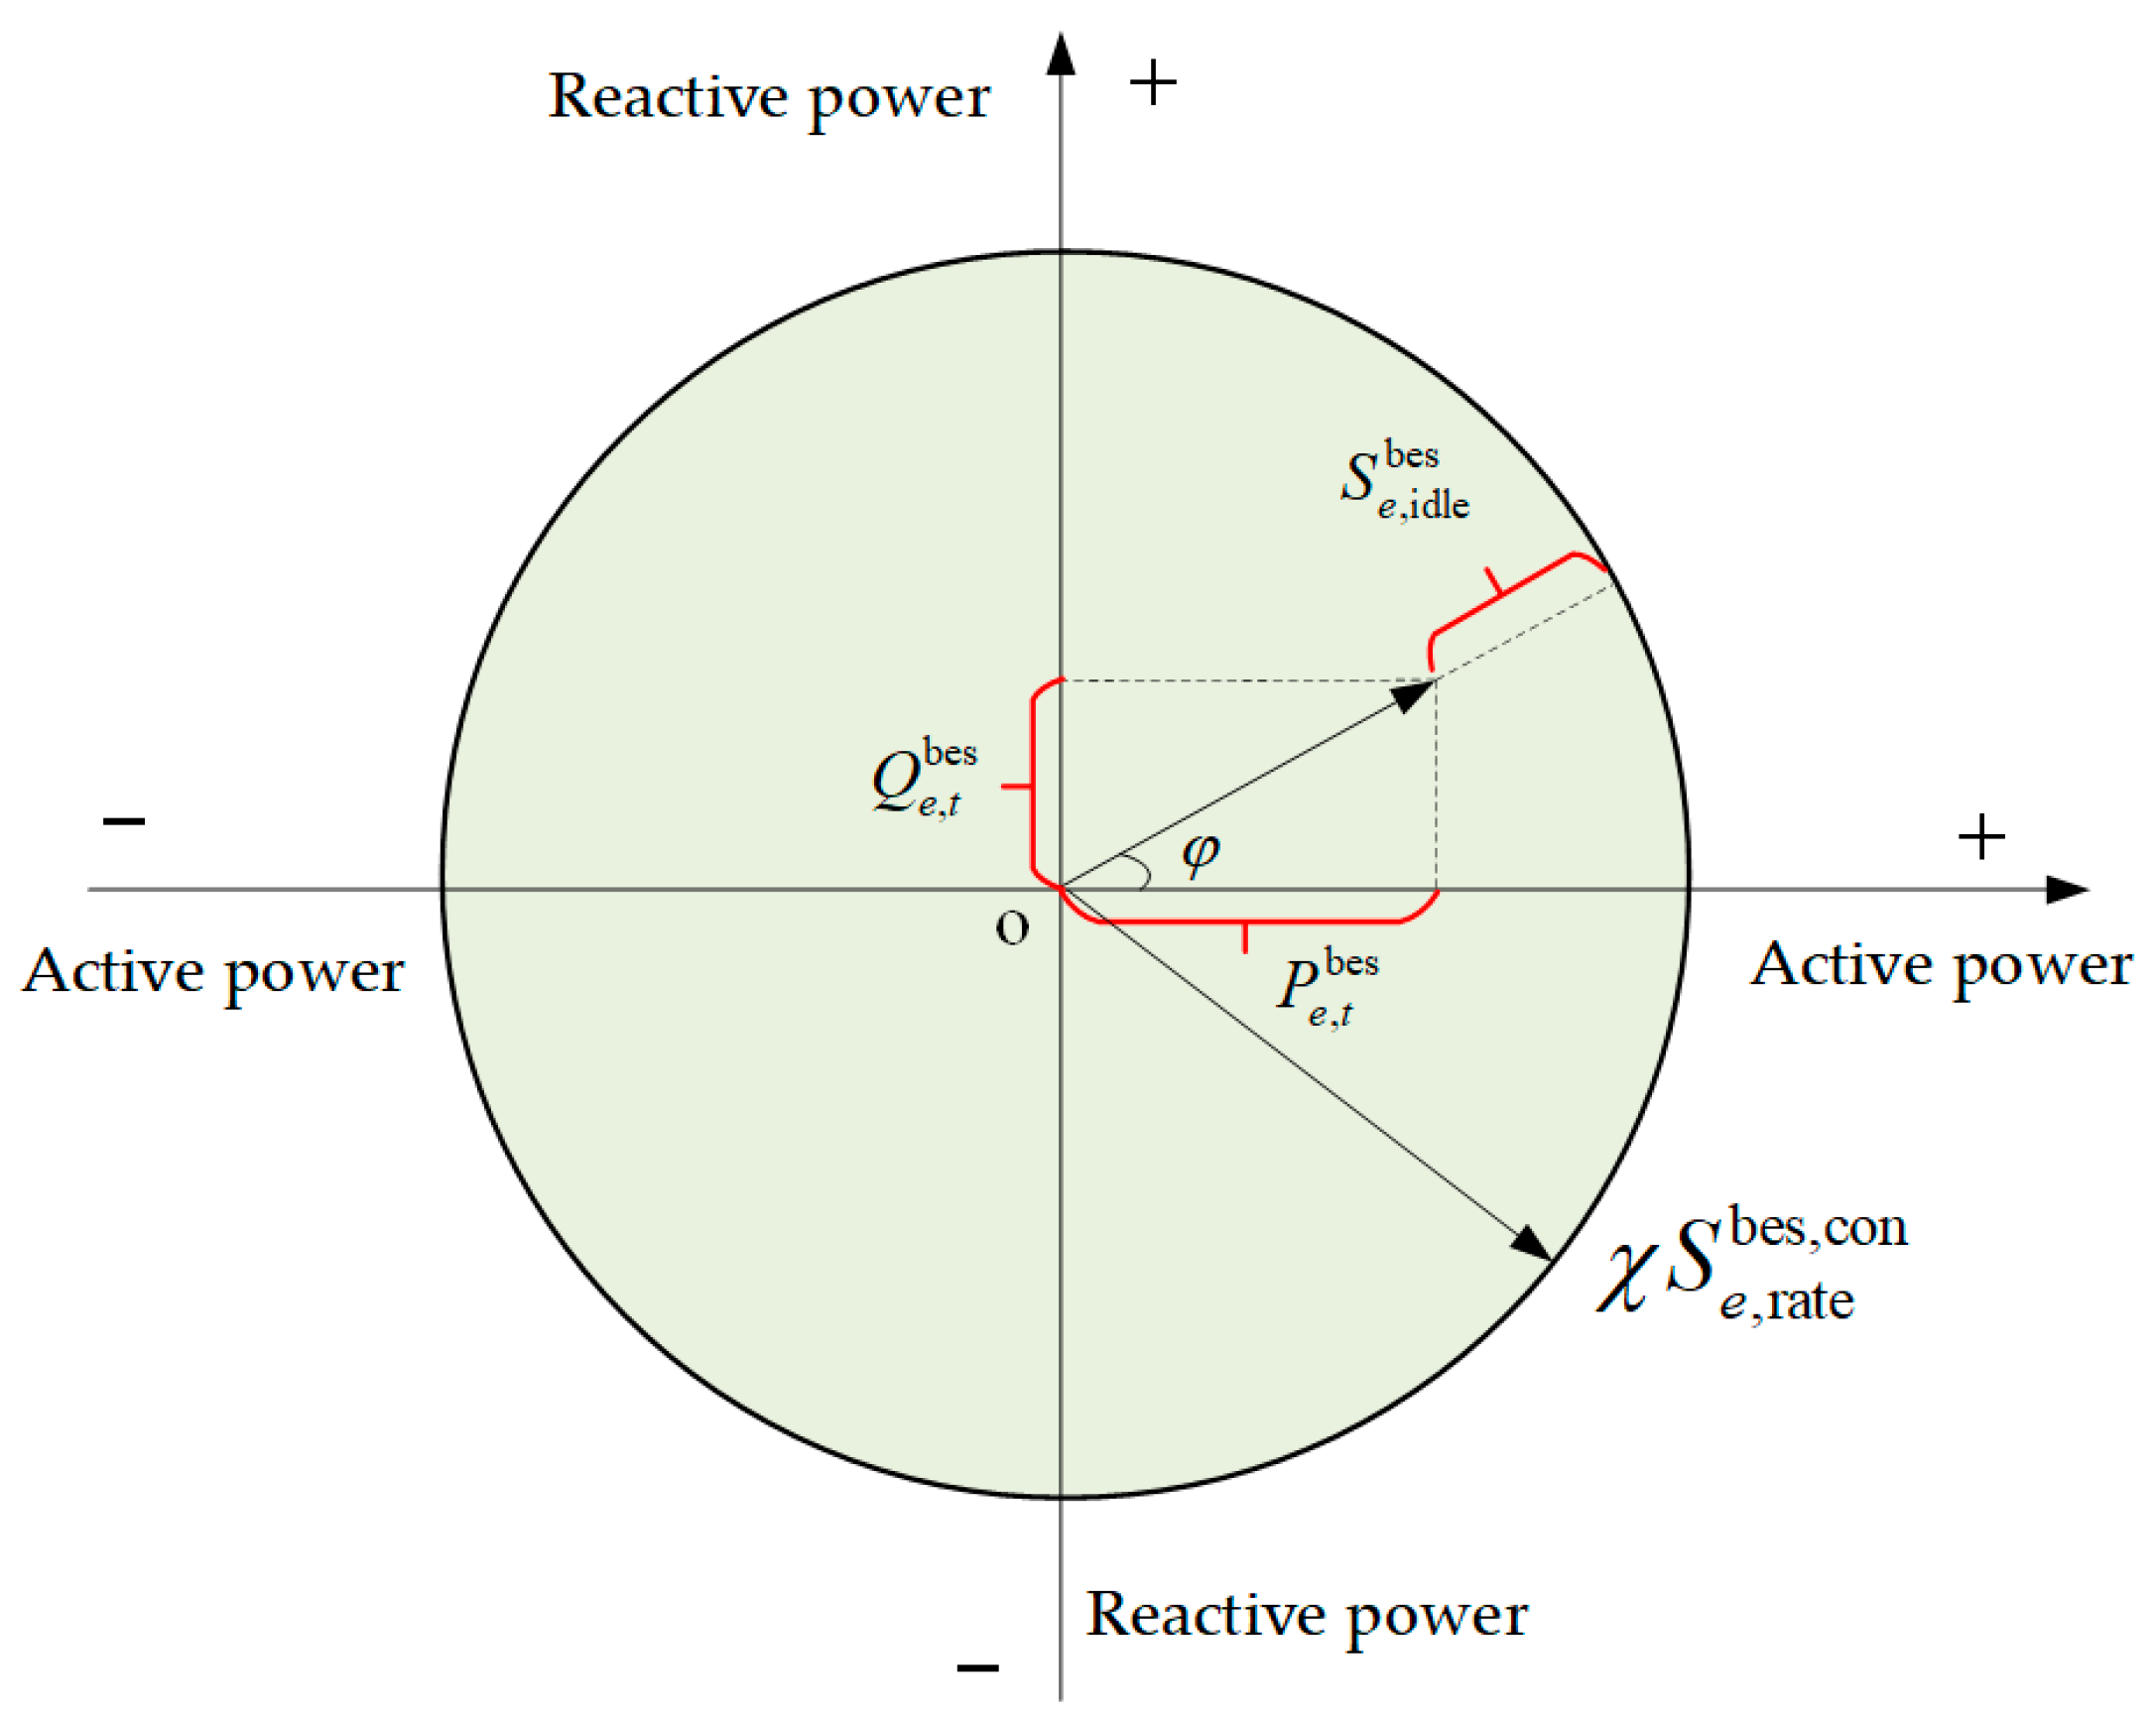
BES can flexibly adjust the active and reactive power output of the converter by controlling the power factor angle to meet the system’s power demand. After the BES outputs active and reactive power as planned, the remaining power regulation capacity can participate in the system frequency-modulation auxiliary service. However, the capacity of the converter is limited. When the grid voltage fluctuates greatly, the converter needs to release or absorb a large amount of reactive power for voltage regulation, resulting in a reduction of the remaining idle capacity of the converter. Correspondingly, the maximum available active power output will also decrease, and the frequency-regulation capability will decline. Therefore, this paper proposes a frequency and voltage regulation strategy considering the capacity limitation of the BES converter. By flexibly adjusting the active and reactive power output of the converter, sufficient frequency-modulation reserve power is reserved to meet the system frequency and voltage safety simultaneously. The output range of the active and reactive power of the BES converter is shown in Figure 2.
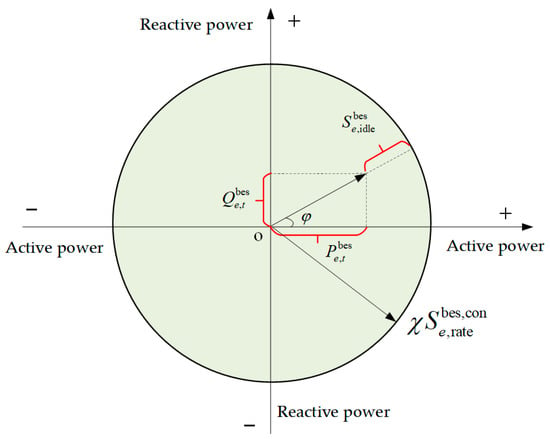
Figure 2.
The power regulation range of the BES converter.
In Figure 2, and are the active and reactive power outputs of the BES active and reactive power, respectively; is the residual idle capacity of converter; φ the power factor angle of the converter; is the rated apparent power of the converter; χ is the overcurrent capability of the converter.
The active and reactive power outputs of the BES can be expressed as follows:
where and are the active power absorbed or released by BES; and are the reactive power absorbed or released by BES; is the adjustment amounts of BES maximum active power. and are the states of BES absorbing or releasing active power, respectively; and are the upper and lower limits of the power factor of the BES converter, respectively.
The SOC of the BES can be expressed as follows:
where is the maximum stored power of the BES; and are the initial and final values of SOC; and are the active charge and discharge efficiency of the BES.
Considering the capacity limitation of the converter, the upper limit of the BES active can be expressed as follows:
After subtracting the regular active power output of the BES system, the maximum additional active power that can be generated by the BES as follows:
where is the maximum additional active power that can be delivered by the BES.
4. The Optimal Scheduling Model for Islanded Microgrid
4.1. Islanded Microgrid Architecture
Figure 3 shows the structure schematic diagram of the islanded microgrid. This paper comprehensively considers the joint optimization of active power sources and reactive power devices in the islanded microgrid. The internal grid is mainly composed of wind, solar, and hydropower renewable energy sources, BES, voltage regulation devices, and loads. Among them, the voltage regulation devices include static var compensators, shunt capacitors, and on-load tap changers, which are responsible for reactive power and voltage optimization of the microgrid. The BES adopts virtual inertia response and virtual droop control strategies and participates in microgrid frequency regulation together with hydroelectric units.
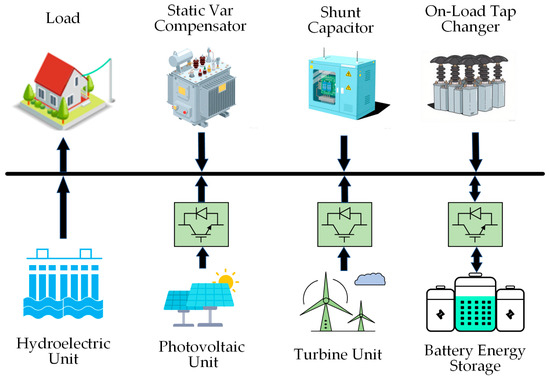
Figure 3.
Structure Schematic Diagram of Islanded Microgrid.
4.2. Objective Function
This paper proposes a frequency and voltage security optimization dispatching model for isolated microgrids containing wind-solar-hydro-storage energy. Taking the minimum economic operation cost of the isolated microgrid and the voltage deviation level as optimization objectives while considering the participation of BES and hydropower synchronous units in system frequency regulation, the dynamic frequency security constraints of the system are constructed and incorporated into the optimization dispatching model to balance the economic operation of the system and the security of frequency and voltage.
In this paper, multiple costs for the isolated microgrid are mainly considered, including the startup and shutdown costs of hydroelectric units; the operation and maintenance costs of hydropower units, photovoltaic (PV) units, and wind turbine units; the costs of wind curtailment and solar curtailment; as well as the daily average investment cost, operation and maintenance cost, and power purchase cost of the BES. Among them, the operation and maintenance costs of PV units and wind turbine units can be expressed by linearized cost functions [29]. In addition, to prevent excessive fluctuations in node voltage from affecting the power supply quality of the system, this paper adds a penalty term for the deviation of node voltage from the rated value to the objective function.
where m, v, and w are the indices for hydropower units, PV units, and wind turbine units, respectively; is the active power output of the hydroelectric unit; and are the predicted power of the PV unit and wind turbine unit, respectively; um,t is the start-stop status of the hydropower unit, where 1 indicates startup, and 0 indicates shutdown; and are the startup cost coefficient and shutdown cost coefficient of the hydroelectric unit, respectively; coph, copv, and copw represent the operation and maintenance cost coefficients of hydropower units, PV units, and wind turbine units, respectively; and are the curtailment rates of photovoltaic and wind power, respectively; cfw and cfv are the penalty cost coefficients for wind curtailment and solar curtailment, respectively; i is the node number; Cbes,inv, Cbes,ope, and Cbes,buy are, respectively, the daily average investment cost, operation and maintenance cost, and power purchase cost of the BES; Vi,t is the voltage magnitude of node i at time period t; V0 is the rated voltage value; μ is the penalty coefficient for node voltage deviation; cope is the operation and maintenance cost coefficient of the BES; cbuy and csell are, respectively, the purchase electricity price and the sell electricity price for BES; r is the discount rate; cpinv and ceinv are, respectively, the unit capacity cost and unit power cost of the BES, respectively; Te,bes is the service life of the BES.
4.3. Constraints
- (1)
- Constraints for hydroelectric units
- (1)
- The active power and reactive power constraints are as follows:where and are the maximum and minimum active power outputs of the hydroelectric unit, respectively; and are the maximum and minimum reactive power outputs of the hydroelectric unit, respectively; is the reactive power output of the hydroelectric unit.
- (2)
- Active power ramping constraint is as follows:where is the maximum ramping rate of the hydroelectric unit.
- (3)
- Spinning reserve power constraints are as follows:where γ is the spinning reserve rate of the system load; is the active power load of the system.
- (4)
- Startup and shutdown time constraints are as follows:where and are the minimum startup time and shutdown time of the hydroelectric unit, respectively.
- (2)
- Constraints for PV unitswhere is the reactive power output of the PV unit; is the power factor angle of the PV unit inverter; is the maximum apparent power of the PV unit inverter.
- (3)
- Constraints for wind turbine unitswhere is the reactive power output of the wind turbine unit; is the power factor angle of the wind turbine unit inverter; is the maximum apparent power of the wind turbine unit inverter.
- (4)
- Security constraints for network power flow
This paper uses the DistFlow model [30] to calculate the network power flow, and the power balance of each node can be expressed as follows:
where and are the active and reactive power loads of the system node j, respectively; , , , and are the active and reactive power flows of the lines with node j as the terminal node and the sending-end node, respectively; Iij,t is the magnitude of the current in the line ij; Rij and Xij are the resistance and reactance values of the line ij, respectively.
where hij,t is the tap ratio of the on-load tap changer on line ij, and if there is no OLTC on the line, the tap ratio is 1; Vi,t is the voltage magnitude at node j; emax is the maximum deviation of the node voltage. Iij,max and Iij,min are the maximum and minimum values of the line current, respectively.
- (5)
- Dynamic frequency security constraints
In this paper, hydroelectric units and BES are considered to participate in the system’s inertia response and primary frequency regulation. The dynamic frequency response equation of the islanded microgrid is as follows:
where is the system disturbance power; is the primary frequency regulation power of the hydroelectric unit; is the system inertia response constant; is the inertia response constant of the hydroelectric unit; kD is the load damping frequency regulation coefficient; and are the rated capacities of the hydroelectric unit and the BES, respectively; bbase is the reference capacity.
Based on Equation (32), the constraints on the rate of change of frequency, the nadir frequency deviation, and the quasi-steady-state frequency deviation of the system are derived as follows:
where , , and are the rate of change of frequency, the nadir frequency deviation, and the quasi-steady-state frequency deviation; is the water hammer effect coefficient of the hydroelectric unit; Δ is the primary frequency regulation power provided by the hydroelectric unit at the moment of minimum frequency; is the allowable value of the maximum rate of change of frequency; is the allowable value of the maximum frequency deviation; is the allowable value of the quasi-steady-state frequency deviation; τmin is the time corresponding to the minimum frequency point.
At the lowest frequency moment τmin and the quasi-steady-state moment τqss, the frequency response power provided by BES and hydroelectric units shall not exceed their maximum reserve power.
The primary frequency regulation process of the hydroelectric unit is assumed to be a first-order inertial link in this paper. The transfer function of the primary frequency response model for the hydro unit is as follows:
where s is the Laplace operator; is the response time constant of the hydroelectric unit.
Based on the linearized frequency deviation method and inverse Laplace transform, the analytical expression of can be obtained as follows [17]:
where c is a constant with the value of 1.5.
- (6)
- Other constraints
The related constraints of reactive power voltage regulation devices in power grids, such as static var compensator, shunt capacitor, and on-load tap changer, are described in ref. [29].
4.4. Model Solution
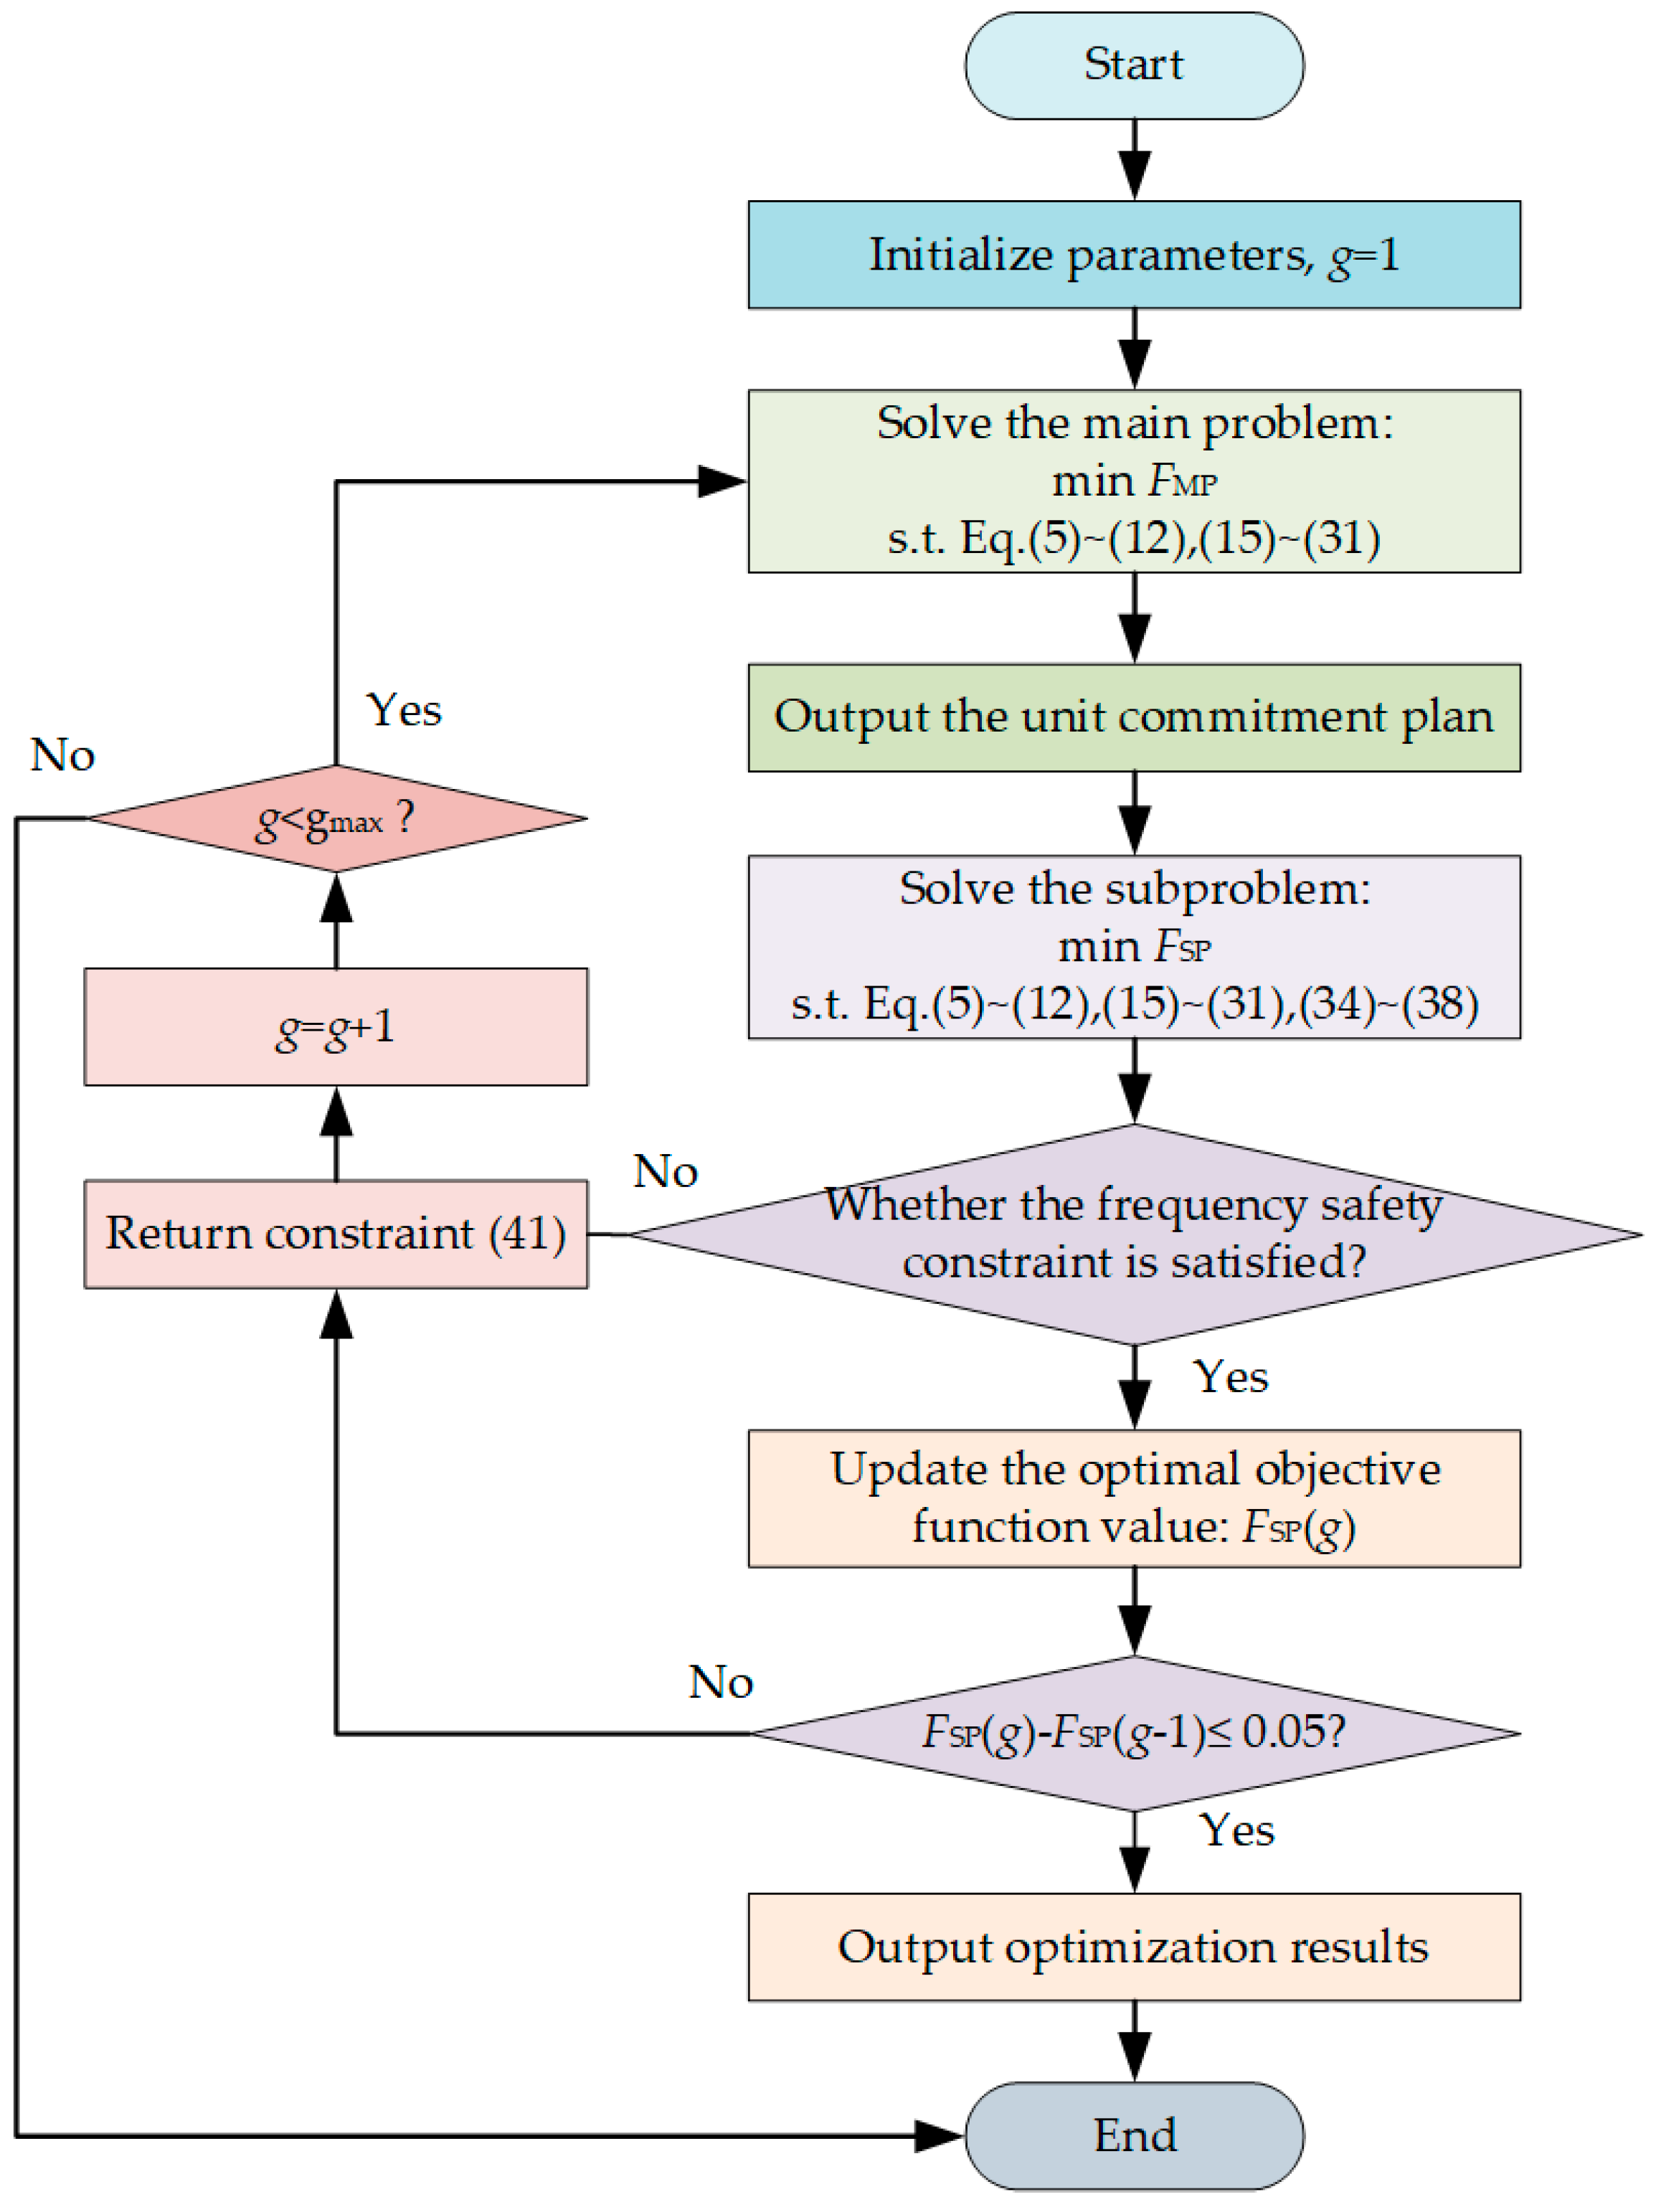
Equation (35) is a complex nonlinear equality constraint, which makes this model unable to be directly solved by a solver. Therefore, this paper adopts the Benders decomposition method to divide the model into two models: a main problem and a subproblem. The main problem is an optimization problem without dynamic frequency safety constraints, while the subproblem is an optimization problem for verifying whether the dynamic frequency safety indicators satisfy the constraints. The two problems are connected by constraint (41), and the optimal solution of the original problem is gradually approached through iterative solution of the main problem and the subproblem. The specific solution steps are as follows:
- (1)
- Parameter initialization. Input system network structure parameters and load predicted power, wind power and PV predicted power, the hydroelectric unit parameters, etc., and then set the iteration count: g = 1;
- (2)
- Solve the main problem. Use the Gurobi solver to solve the main problem and output the start–stop schedule of hydroelectric units;
- (3)
- Solve the subproblem. Under the unit commitment result of the main problem, use the Gurobi solver to solve the subproblem. Check whether the subproblem has a solution. If there is a solution, it indicates that the dynamic frequency safety indicator satisfies the constraint, and proceed to step (6); if there is no solution, it indicates that the dynamic frequency safety indicator does not satisfy the constraint, and proceed to step (4);
- (4)
- Add new constraints to the main problem. The main reason for the non-satisfaction of the dynamic frequency safety constraint is that the system’s inertia level is too low, or the primary frequency regulation reserve power is insufficient. Therefore, add constraint condition (41) to the main problem to increase the system inertia level and power adjustment coefficient.where υ1 and υ2 are, respectively, the minimum change step sizes for the two variables um,t and .
- (5)
- g = g + 1. Determine whether g is less than the maximum iteration count gmax. If yes, return to step (2) to re-solve the unit start-stop schedule; if not, go to step (8);
- (6)
- Continue iterative optimization. Continue solving the main problem and subproblem iteratively, and update the optimal objective function value of the subproblem;
- (7)
- Convergence judgment. Check whether the difference between the objective function values of two adjacent iterations is less than the convergence error. If yes, go to step (8); if not, return to step (6);
- (8)
- End. Output the optimized scheduling scheme of the subproblem, including the power output plans of hydroelectric units, wind turbine units and PV units, BES charging/discharging plans, etc.
The solution flowchart is shown in Figure 4.
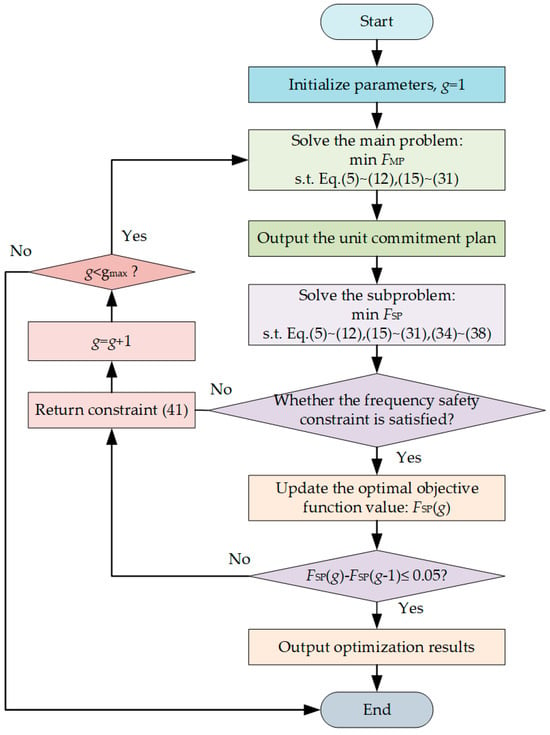
Figure 4.
The solution flowchart.
5. Results
5.1. Parameter Settings
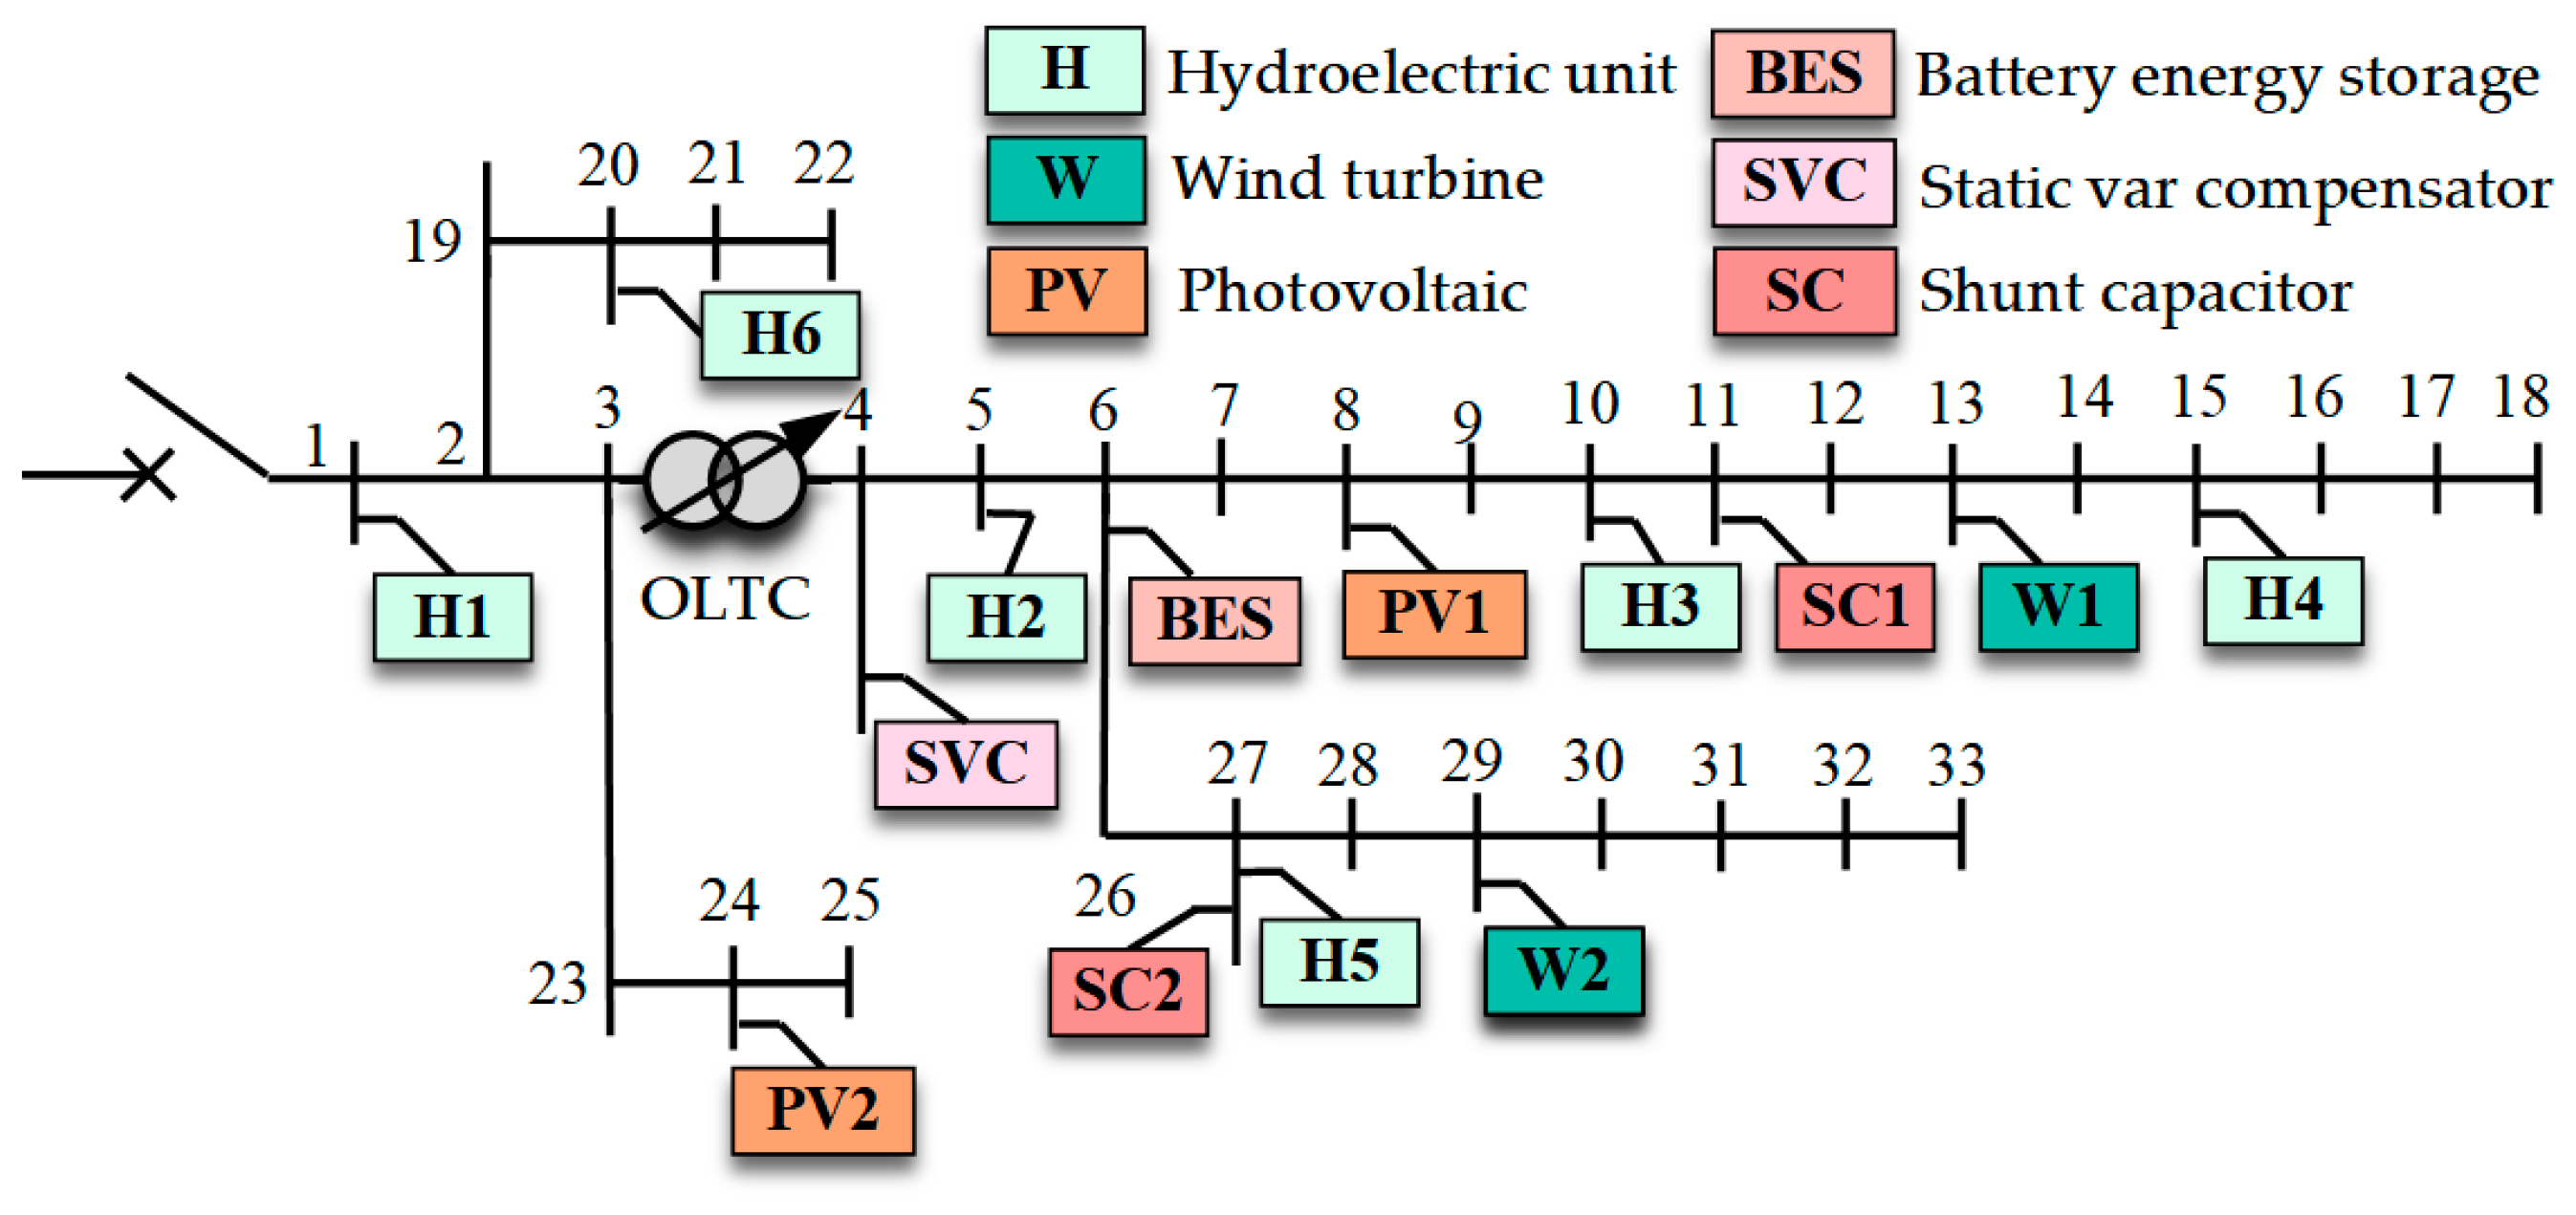
The IEEE 33-node system in islanded mode is taken as an example for simulation analysis, as shown in Figure 5. The maximum node voltage deviation of the system is ±5%. The system includes six hydroelectric units, two wind turbine units, two PV units, and one BES. The voltage regulation devices in the system include one static var compensator, two shunt capacitors, and one on-load tap changer. The reactive power compensation range of the static var compensator is from −1 Mvar to 1.5 Mvar. The maximum reactive power compensation capacity of the shunt capacitor is 0.75 Mvar, and the compensation power of the shunt capacitor unit is 0.05 Mvar. The adjustable transformation ratio of the on-load tap changer ranges from 0.95 to 1.05, and the adjustment step size is 0.01. The system parameters are presented in Table 1, Table 2 and Table 3.
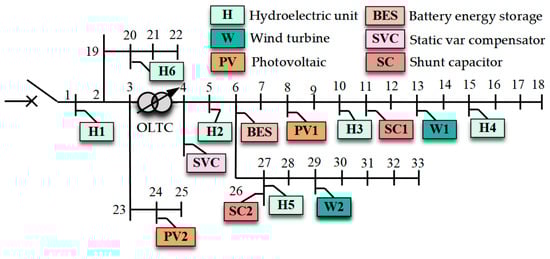
Figure 5.
The IEEE 33-node system in the islanded mode.

Table 1.
The hydroelectric unit parameters.
Table 2.
The BES parameters.
Table 3.
The other parameters.
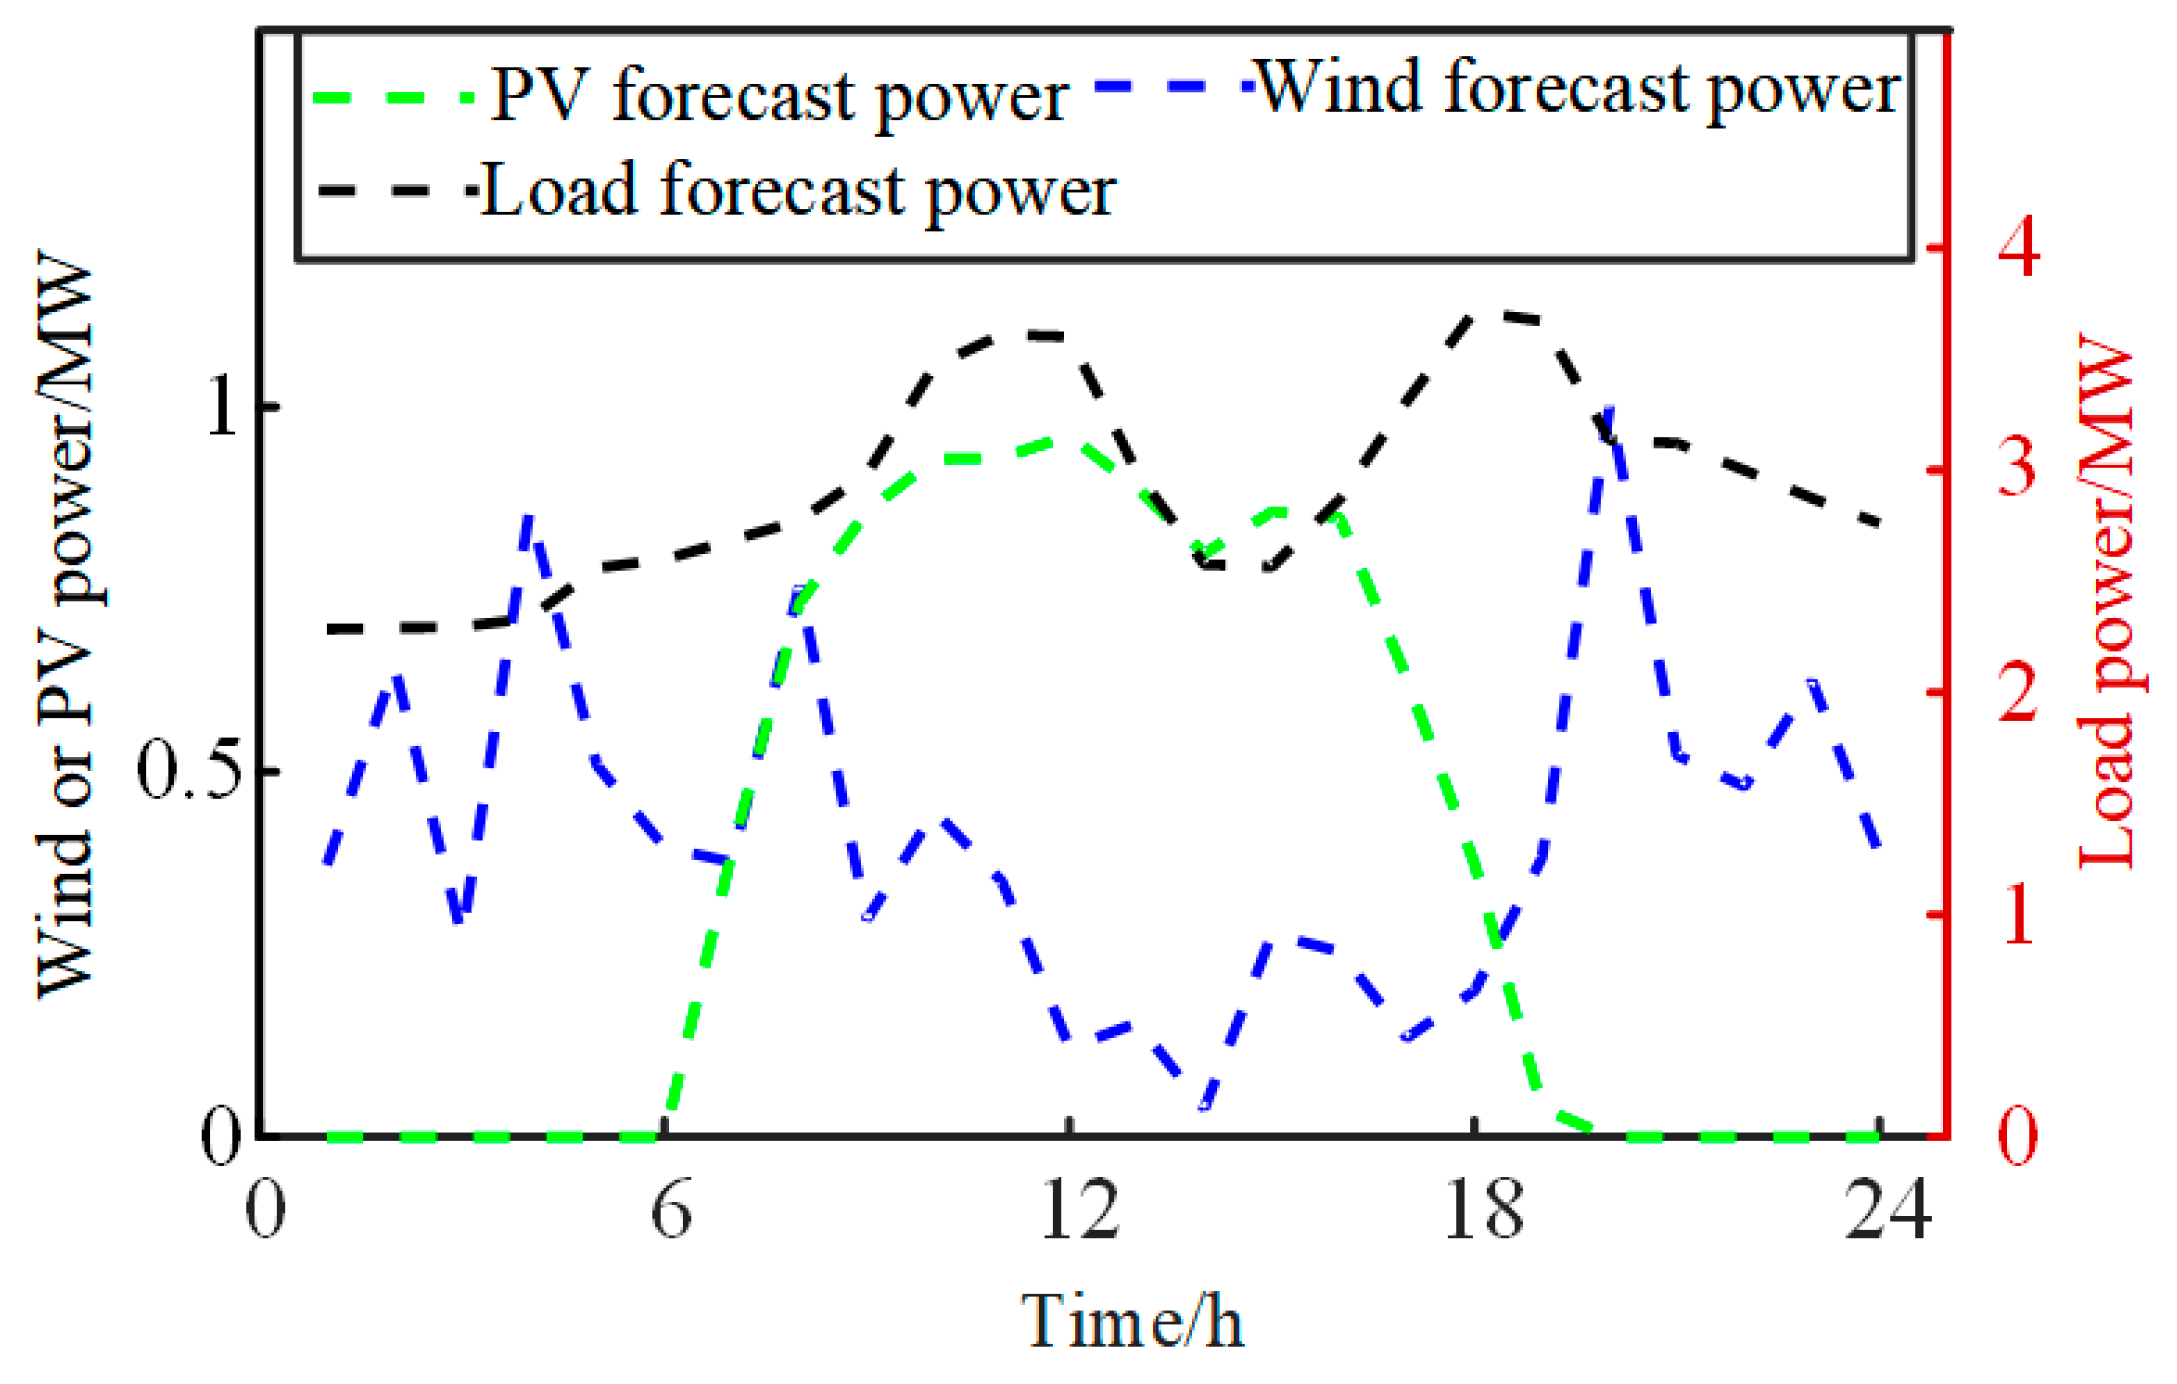
Figure 6 shows the predicted power curves of wind power, photovoltaic power, and load. It can be observed that wind power output is relatively high during nighttime and low during daytime. In contrast, photovoltaic power output is high during daytime and zero at night. Therefore, there is a certain complementarity between wind and solar energy outputs. However, wind power fluctuates significantly, and the predicted load power curve exhibits an obvious “double-peak” characteristic with remarkable peak-to-valley difference. As a result, the system faces relatively high pressure in peak shaving, frequency regulation, and voltage regulation.

Figure 6.
Wind, PV, and load prediction power curves.
5.2. Implementation Procedure
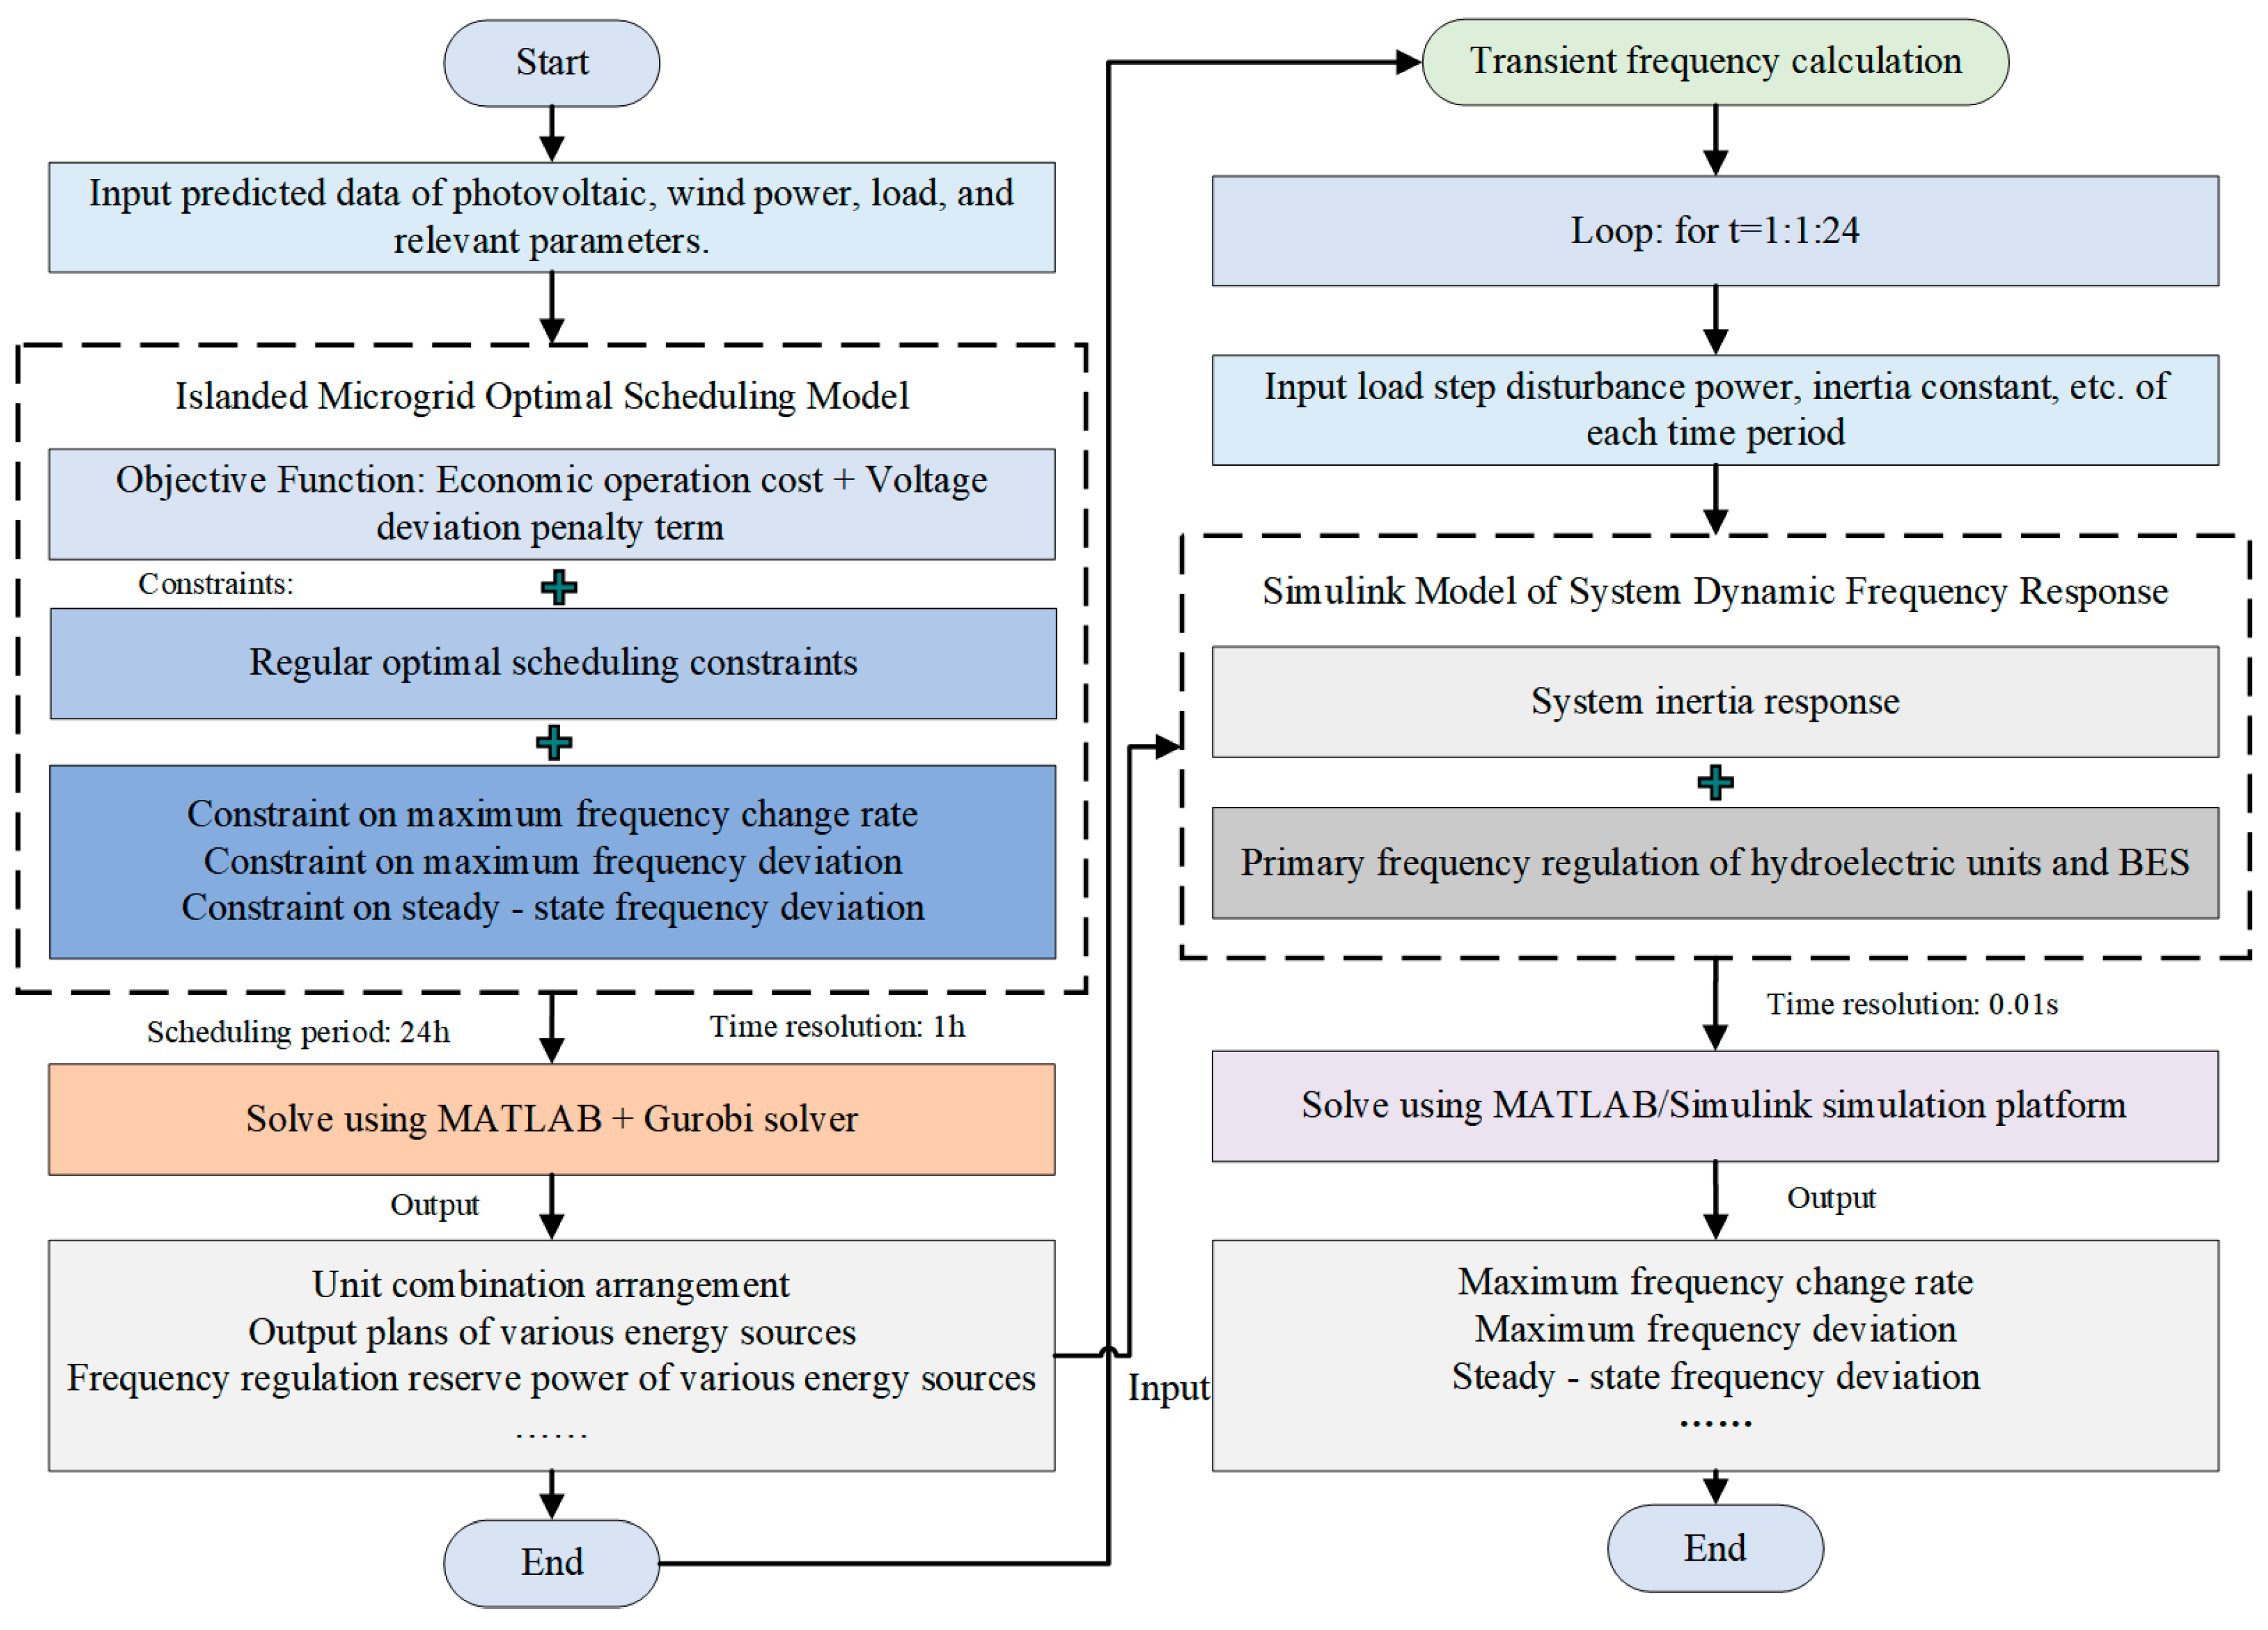
A coordinated optimization scheduling method for frequency and voltage in islanded microgrids considering active support of BES is proposed in this paper. The implementation process of the method as shown in the Figure 7.
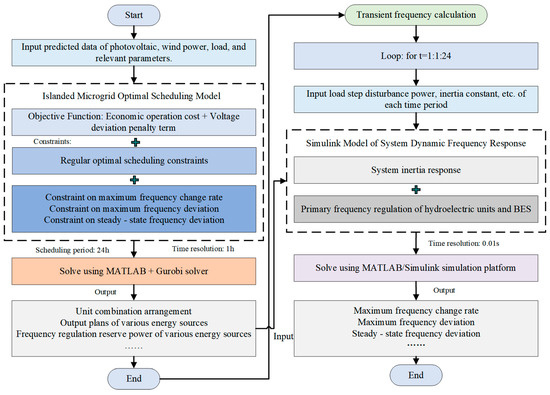
Figure 7.
Implementation procedure.
First, input the predicted data of photovoltaic, wind power, load, and relevant parameters; then set the optimal scheduling period as 24 h and the time resolution as 1 h.
Next, solve the proposed optimal scheduling model for the islanded microgrid based on the Gurobi solver to obtain scheduling results such as unit start–stop arrangements, output plans of various energy sources, and frequency regulation reserve power, and then input these results into the established Simulink simulation model for the system dynamic frequency response.
Then, perform transient frequency calculation on the Simulink platform. It is assumed that the system state (including unit combination arrangements, output plans, and reserve capacity, etc.) remains unchanged within one time period. An 8% load power step disturbance is applied at the initial moment of each time period, the simulation duration is set to 30 s, the time resolution is 0.01 s, and the operation is cycled 24 times.
Finally, output the frequency response process of the system per hour under this state as well as the corresponding maximum frequency change rate, maximum frequency deviation, and quasi-steady-state frequency deviation.
The frequency modulation resources in the system include hydroelectric units and BES. In order to verify the effectiveness of the methods proposed in this paper, this paper compares and analyzes the following three optimization solutions.
Case 1: Adopt traditional optimization scheduling method without considering dynamic frequency security constraints [11,31], and BES adopts an adaptive virtual droop coefficient control strategy.
Case 2: Adoption of the optimized scheduling method that considers dynamic frequency security constraints mentioned in this paper, and BES adopts an adaptive virtual droop coefficient control strategy.
Case 3: Adoption of the optimized scheduling method that considers dynamic frequency safety constraints mentioned in this paper, and BES adopts a fixed virtual droop coefficient control strategy.
5.3. Analysis of Steady-State Scheduling Results
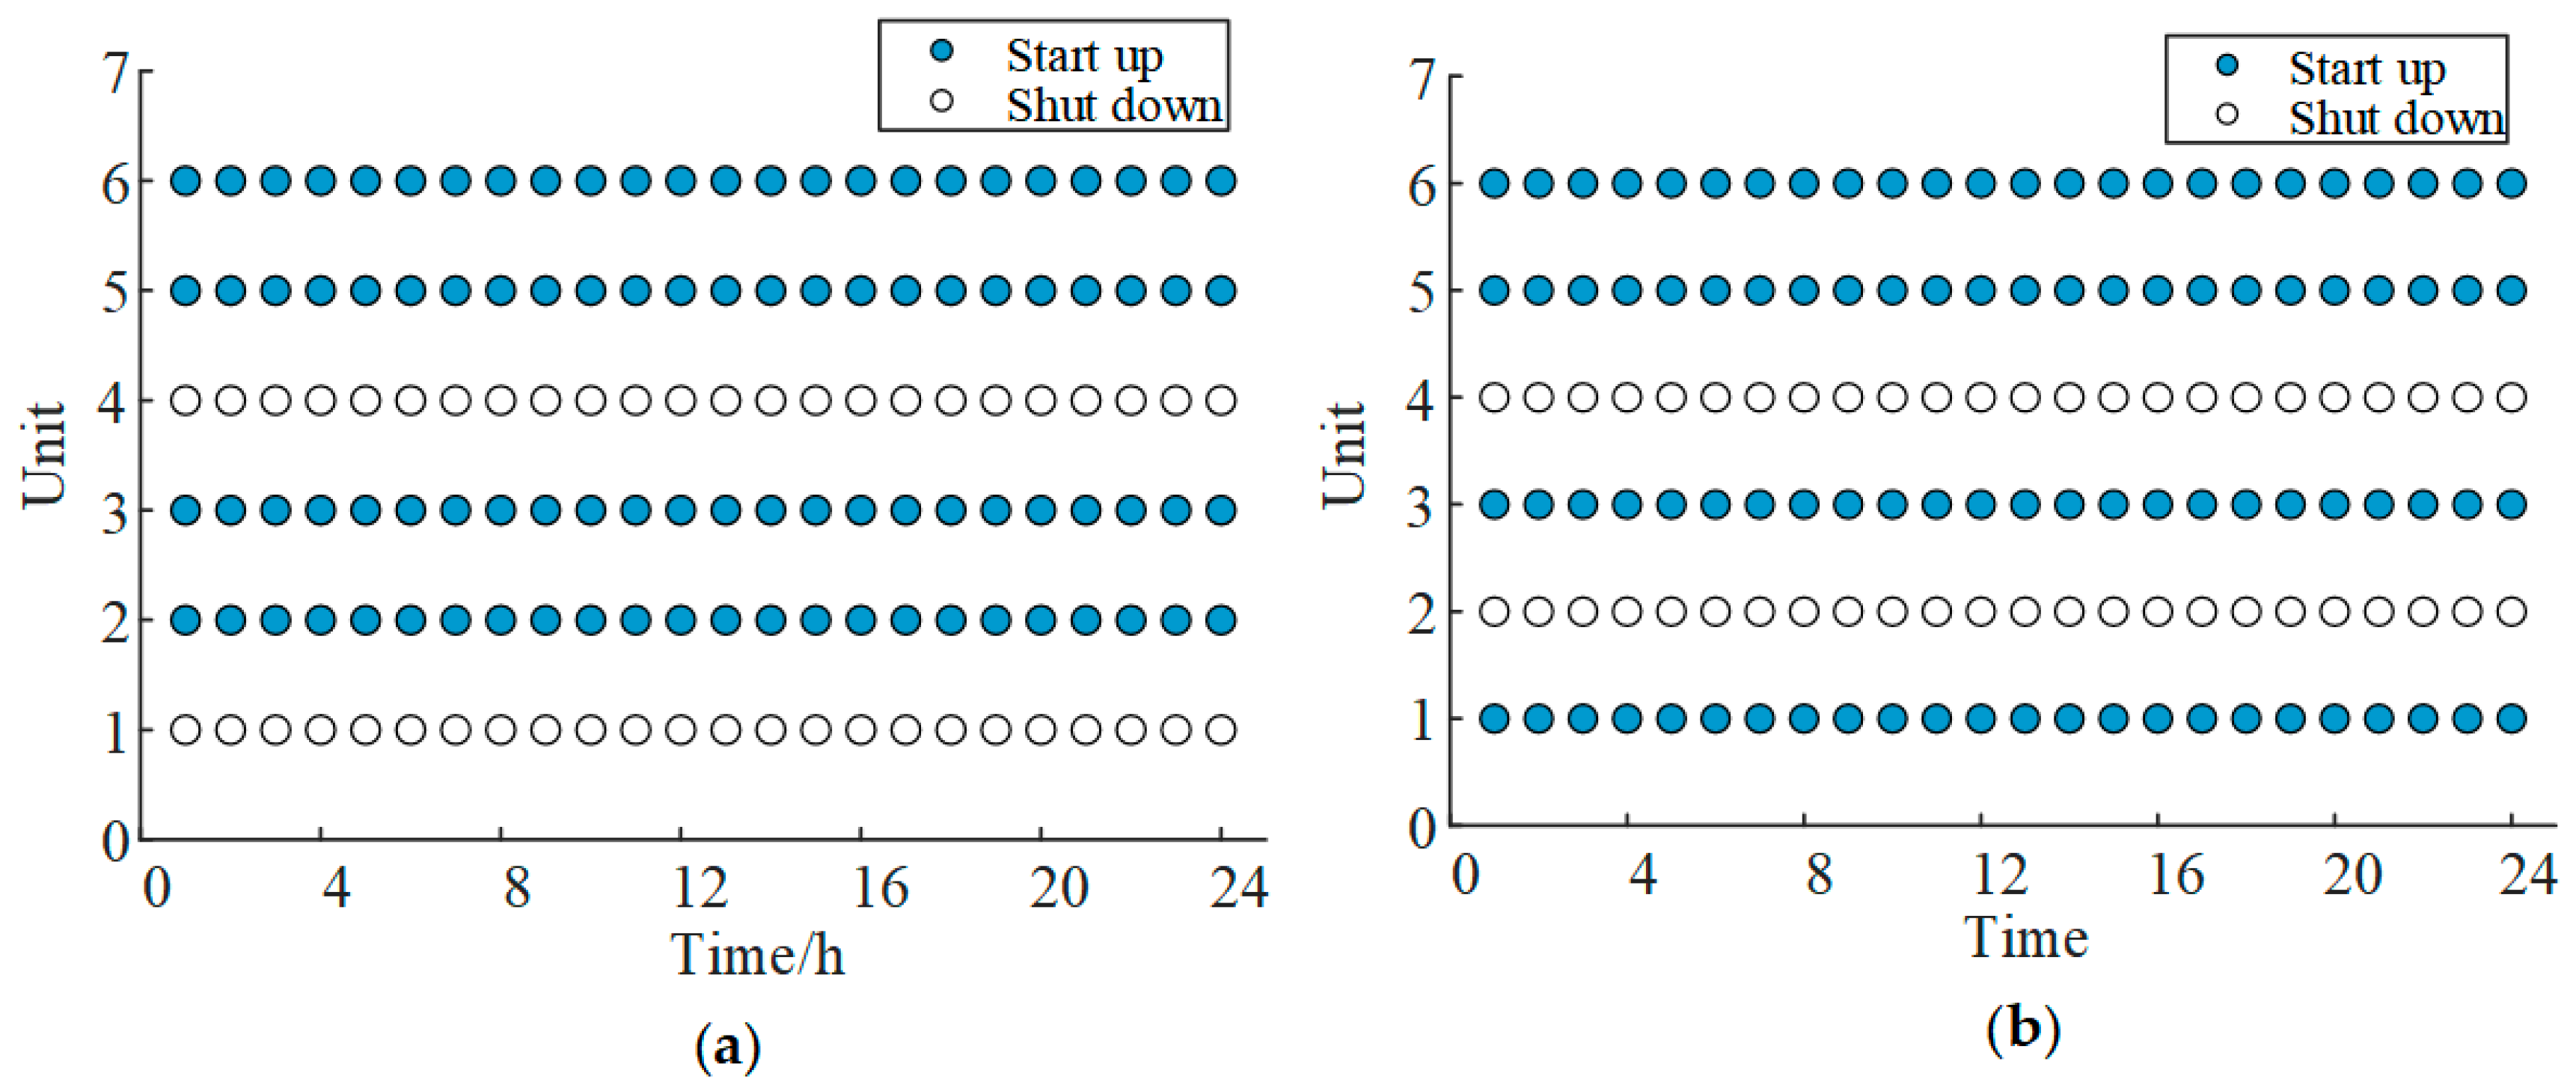
Figure 8 shows the on–off status of hydropower units under Case 1 and Case 2. It can be seen that there are the following differences in the unit commitment results between the two cases: (1) Different unit commitment: In Case 1, Units 1 and 4 are shut down throughout the day, while Units 2, 3, 5, and 6 are in operation all day. In Case 2, Units 2 and 4 are shut down throughout the day, while Units 1, 3, 5, and 6 are in operation all day. (2) Different total system inertia constants: Compared with Unit 2, Unit 1 has a larger inertia constant, so the total inertia constant of Case 2 is larger. (3) Different total installed capacity of the system: Unit 1 has a larger installed capacity than Unit 2, indicating that Case 2 can reserve more primary frequency modulation capacity under the same load demand. In summary, compared with Case 1, Case 2 has higher inertia response and primary frequency modulation capabilities. This is because Case 2 considers frequency security constraints. To ensure that the system frequency security indicators do not exceed the boundaries, Unit 1 with a larger inertia constant and installed capacity is enabled to replace Unit 2.
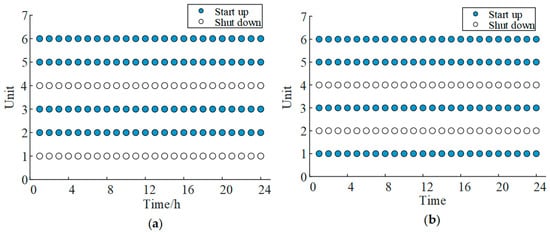
Figure 8.
Unit on–off status: (a) Case 1: traditional methods and (b) Case 2: the proposed method.
Table 4 shows the optimal operation results of the system under Case 1 and Case 2. It can be observed that the startup cost in Case 2 is higher than that in Case 1. This is because the start-up cost of Unit 1 is higher than that of Unit 2. There is no wind or solar energy curtailment in the system, resulting in zero curtailment costs. In this paper, a tiered electricity price mechanism is adopted to guide the BES to charge during low-demand periods and discharge during peak-demand periods. Consequently, the charging and discharging cost of BES is negative. Compared with Case 1, Case 2 may reduce the discharge power of BES during certain periods to reserve more frequency regulation reserve power, leading to a slight decrease in BES revenue. Since both Case 1 and Case 2 consider multiple voltage regulation resources for reactive power optimization, the voltage optimization effects of the two scenarios show little difference. Overall, the upward reserve capacity of Case 2 is 29.97% higher than that of Case 1, and the inertia constant is 19.24% higher. Therefore, the inertia response and primary frequency regulation capability of Case 2 are significantly stronger than those of Case 1. Nevertheless, the improvement of frequency security in Case 2 inevitably leads to the rise of operation costs, with the total economic cost of Case 2 being 3.1% higher than that of Case 1.
Table 4.
System operation optimization results.
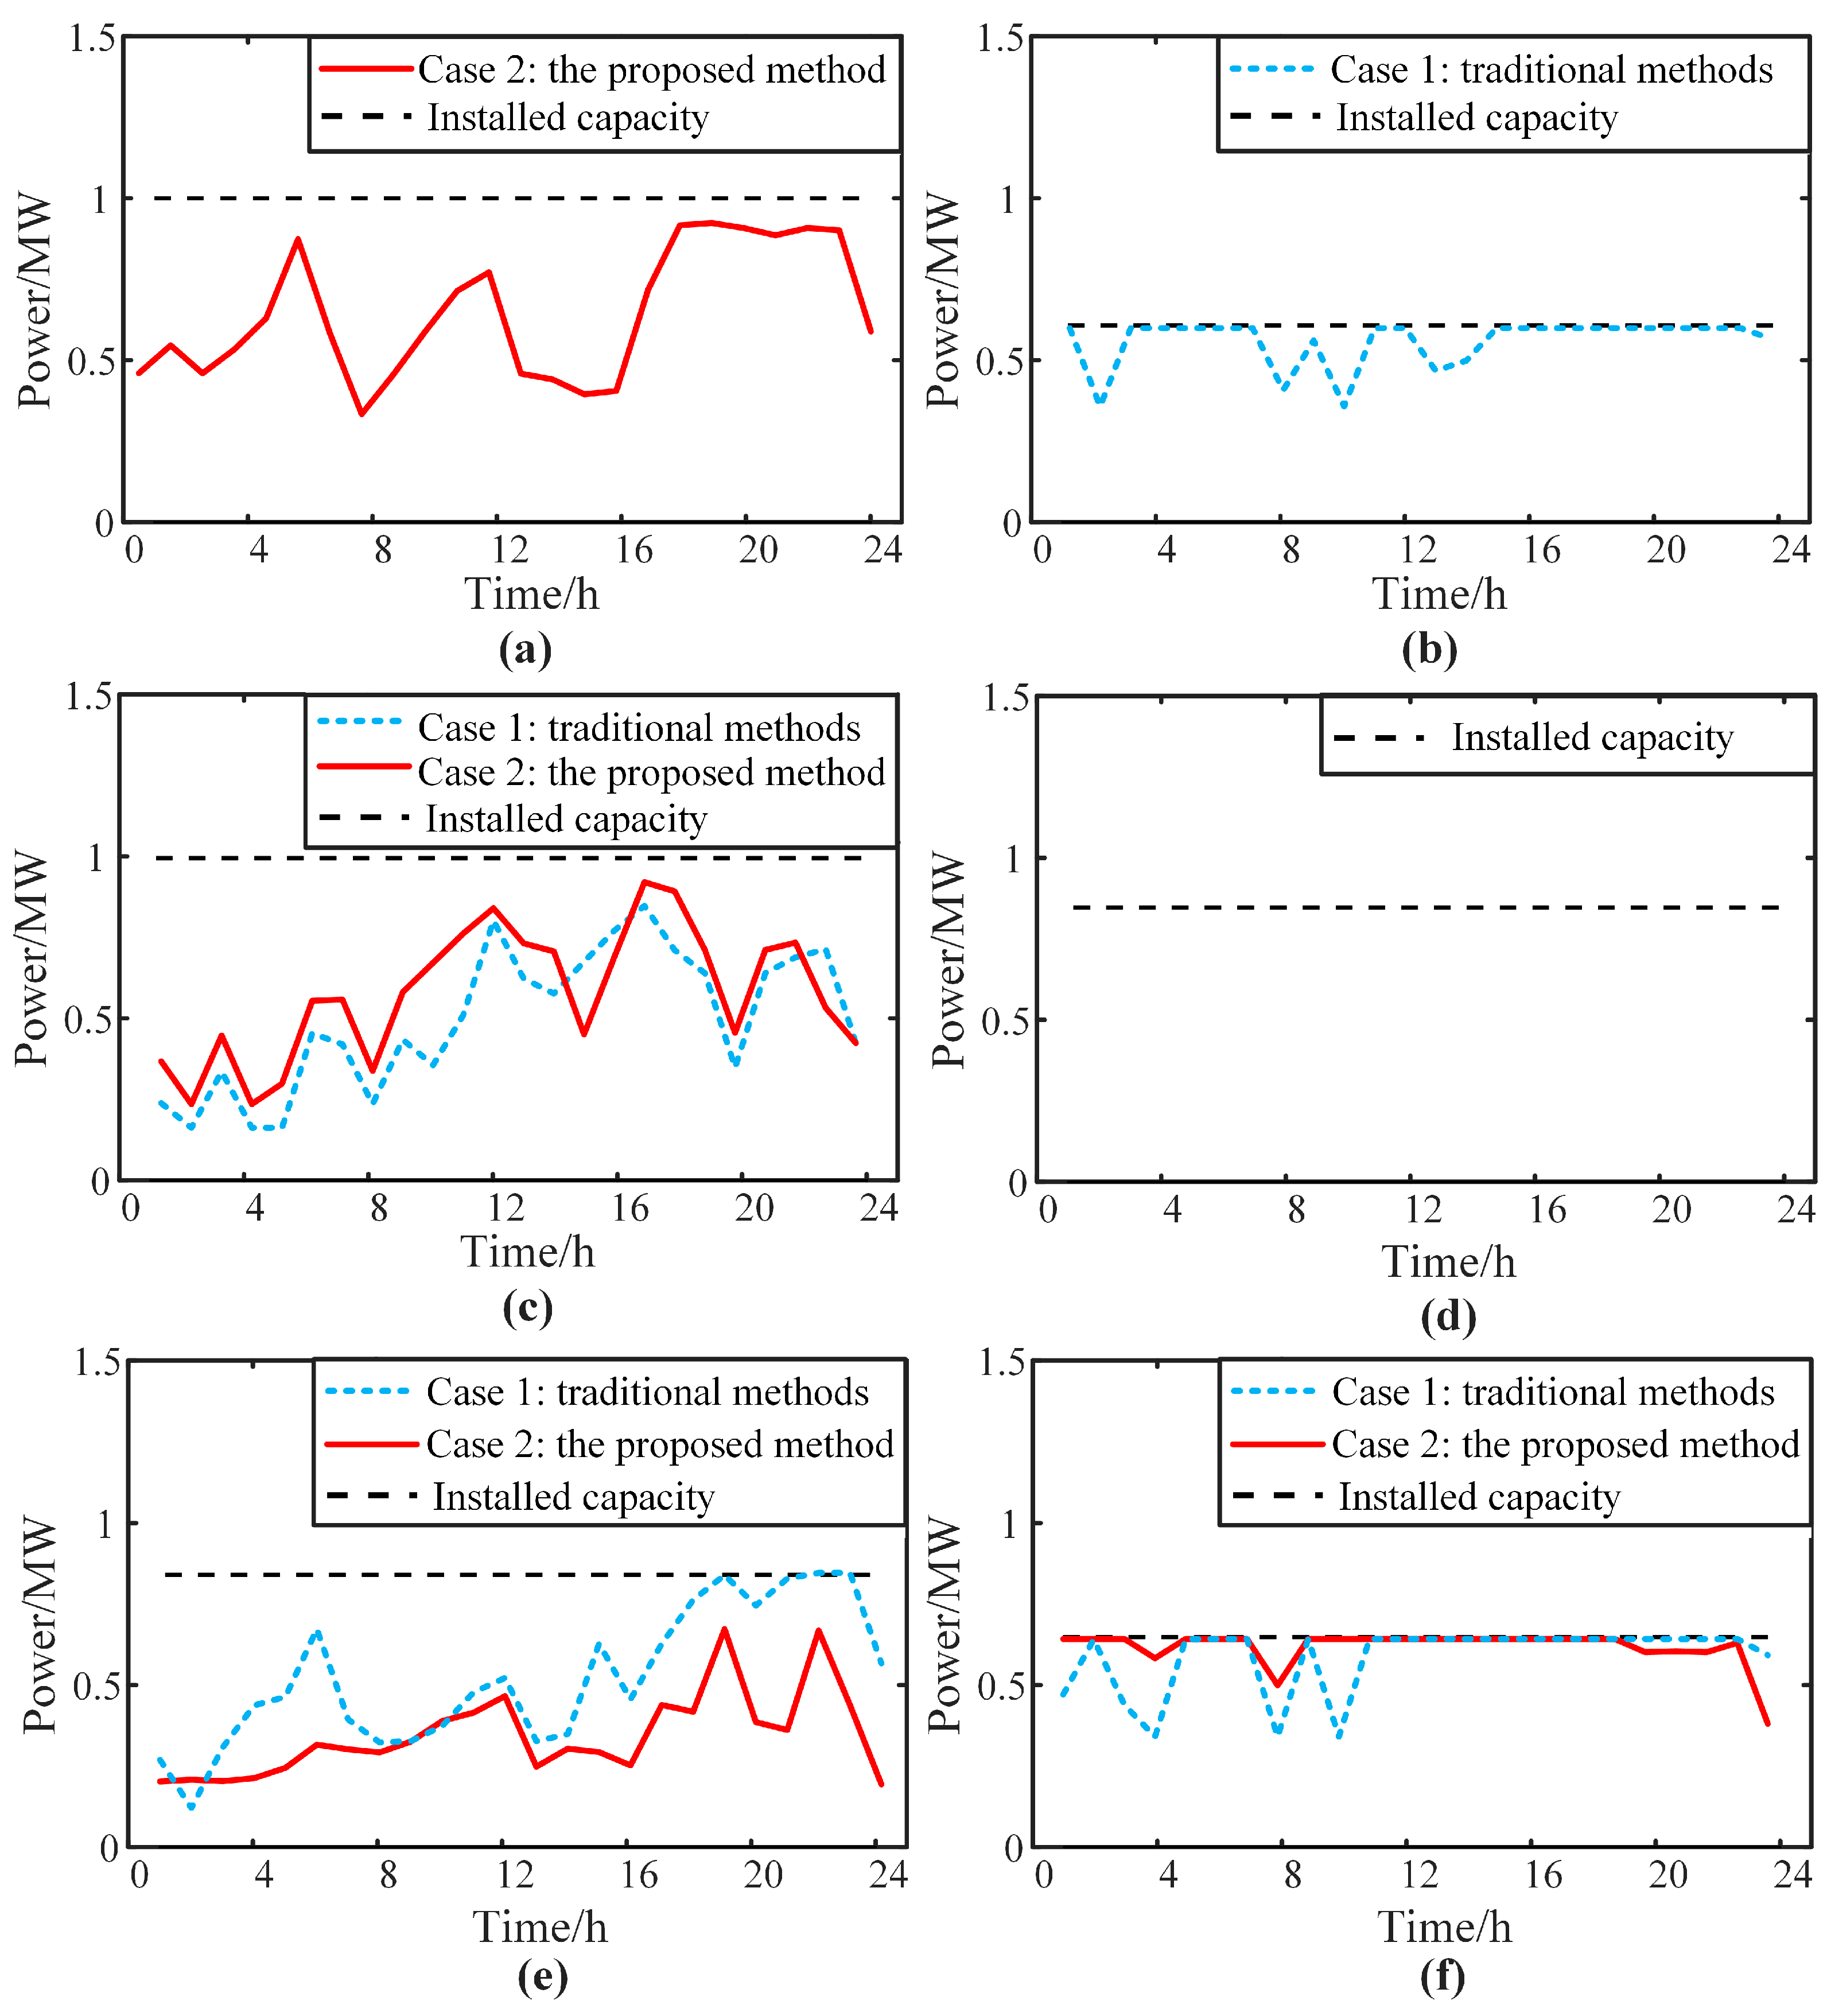
Figure 9 shows the output power of each hydropower unit. In Case 1, Units 2 and 6—with smaller installed capacities—operate at full load for most of the time and lack primary frequency modulation capability, relying mainly on Units 3 and 5 to reserve rotational standby power. However, during time periods 19 and 21–23, Unit 5 is in a full-load state, and only Unit 3 has primary frequency regulation capability, which may easily cause the system frequency to exceed the allowable limits. In Case 2, Units 1, 3, and 5 have larger installed capacities and power regulation coefficients, enabling faster primary frequency modulation ramping rates; thus, these three units primarily reserve standby power to quickly respond to system frequency regulation needs. Unit 6, with a smaller capacity and regulation coefficient, operates at full load during most periods. Overall, Case 2 has higher total standby power and power regulation coefficients, enhancing its primary frequency modulation capability compared to Case 1.
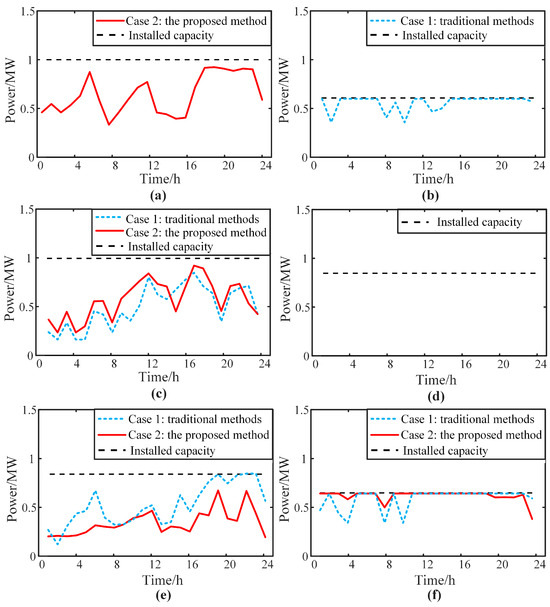
Figure 9.
Output power of the hydroelectric units: (a) Unit 1, (b) Unit 2, (c) Unit 3, (d) Unit 4, (e) Unit 5, and (f) Unit 6.
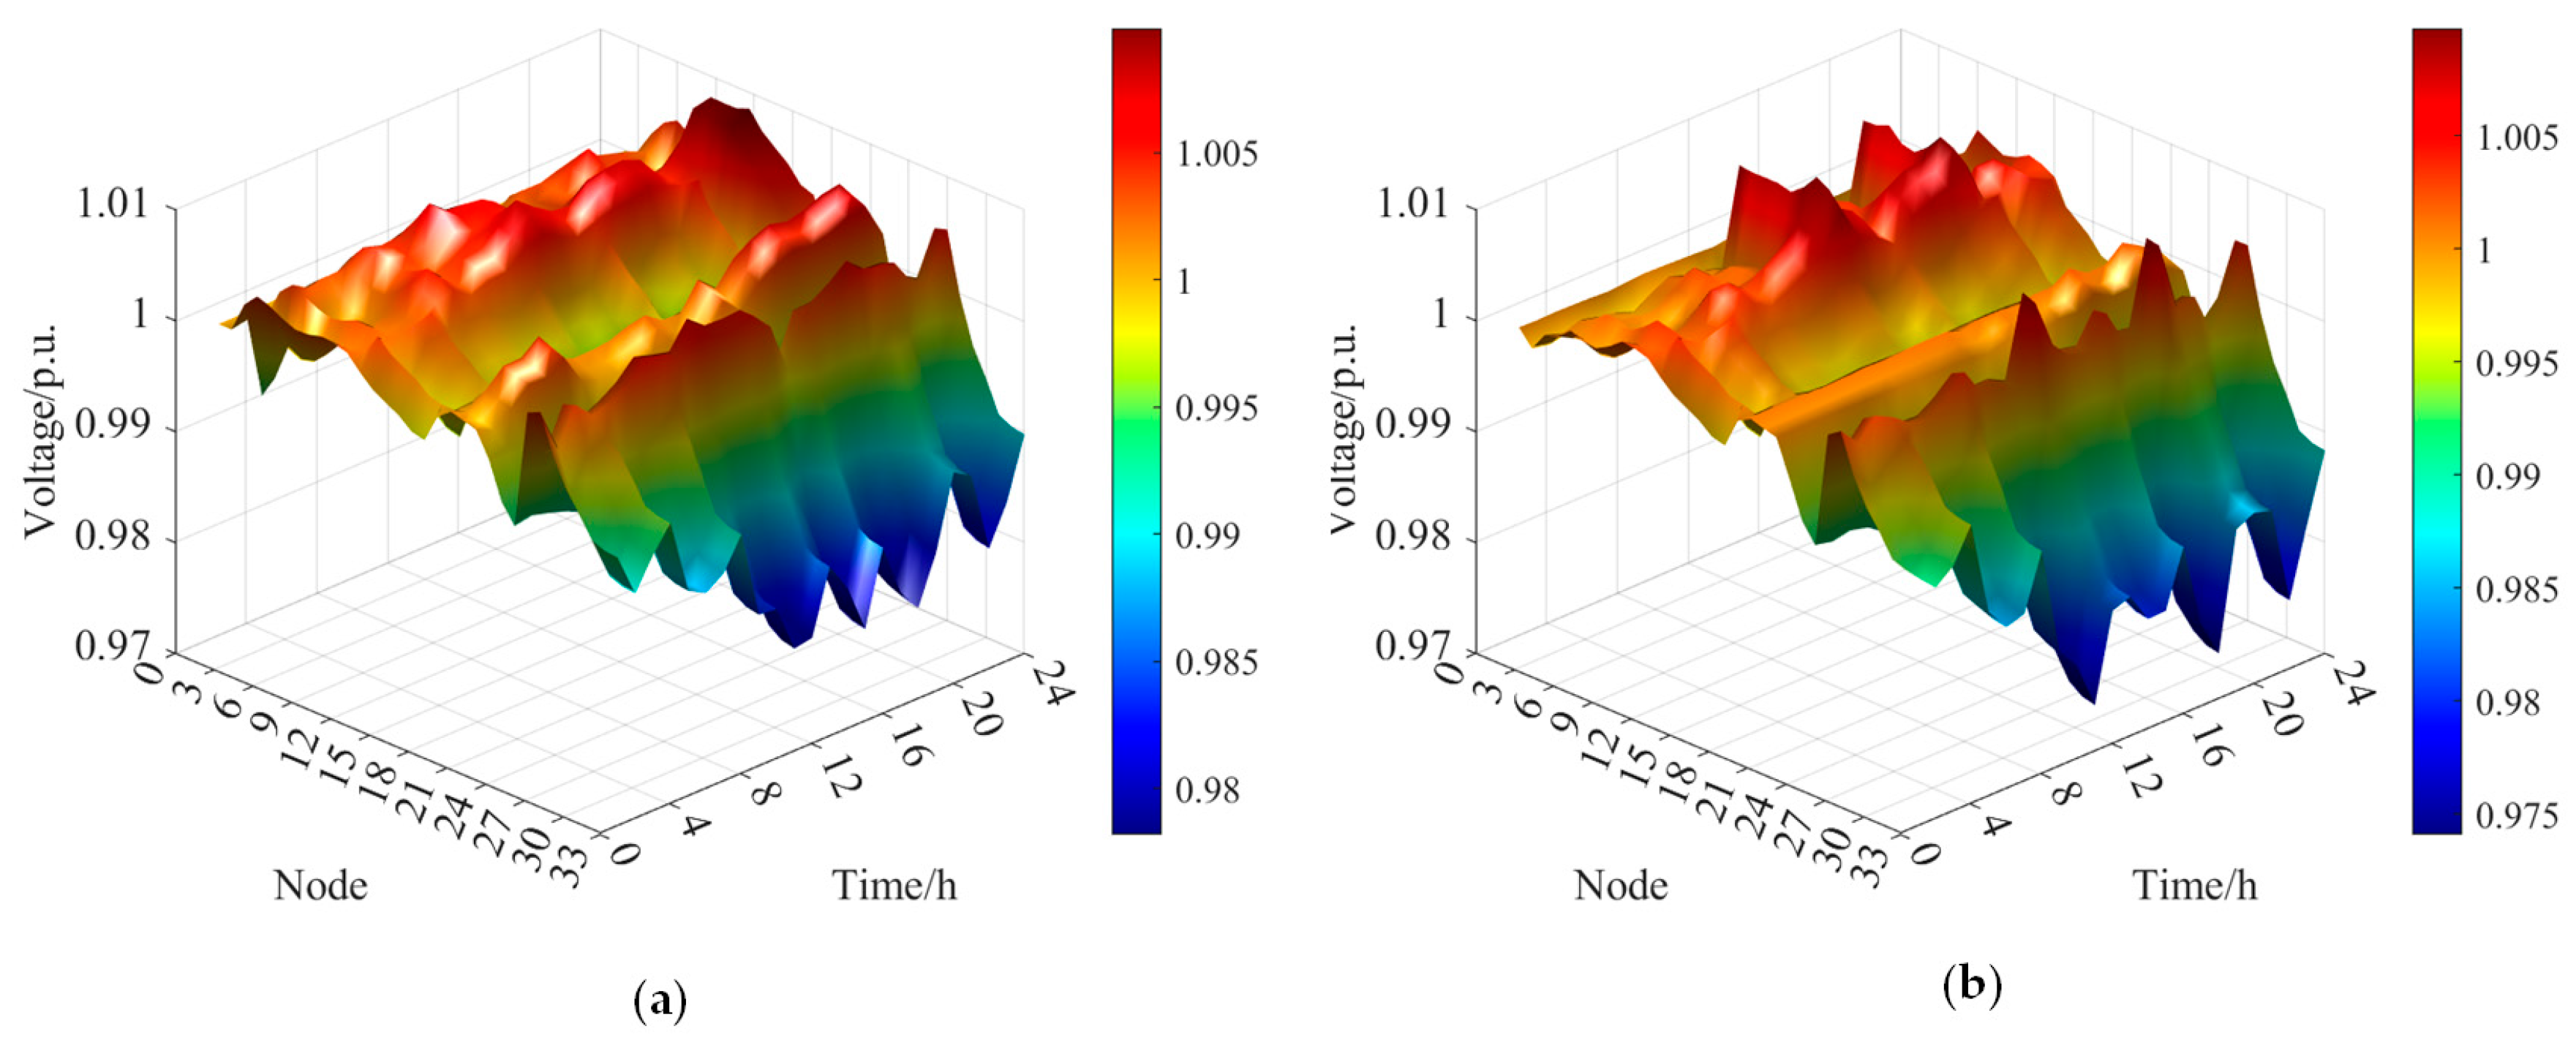
Figure 10 shows the voltage magnitude at each system node. In both cases, voltage magnitudes remain near the rated value with minimal fluctuations, indicating that coordinated optimization of multi-source flexible resources effectively mitigates the impact of uncertain renewable power outputs on voltage and improves power supply quality.
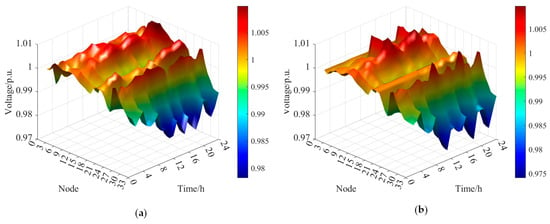
Figure 10.
System node voltage amplitude: (a) Case 1: traditional methods and (b) Case 2: the proposed method.
Figure 11 shows the output power of wind, photovoltaic, hydropower, and storage systems. The system primarily relies on hydropower units to meet load demands, with hydropower and BES smoothing the volatility of wind and photovoltaic outputs. The BES significantly reduces peak loads and fills valley loads, alleviating the peak-shaving pressure on hydropower units.
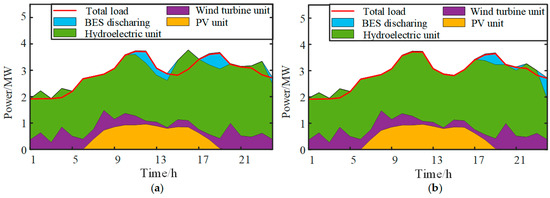
Figure 11.
Output power of the wind-solar-hydro-storage energy: (a) Case 1: traditional methods and (b) Case 2: the proposed method.
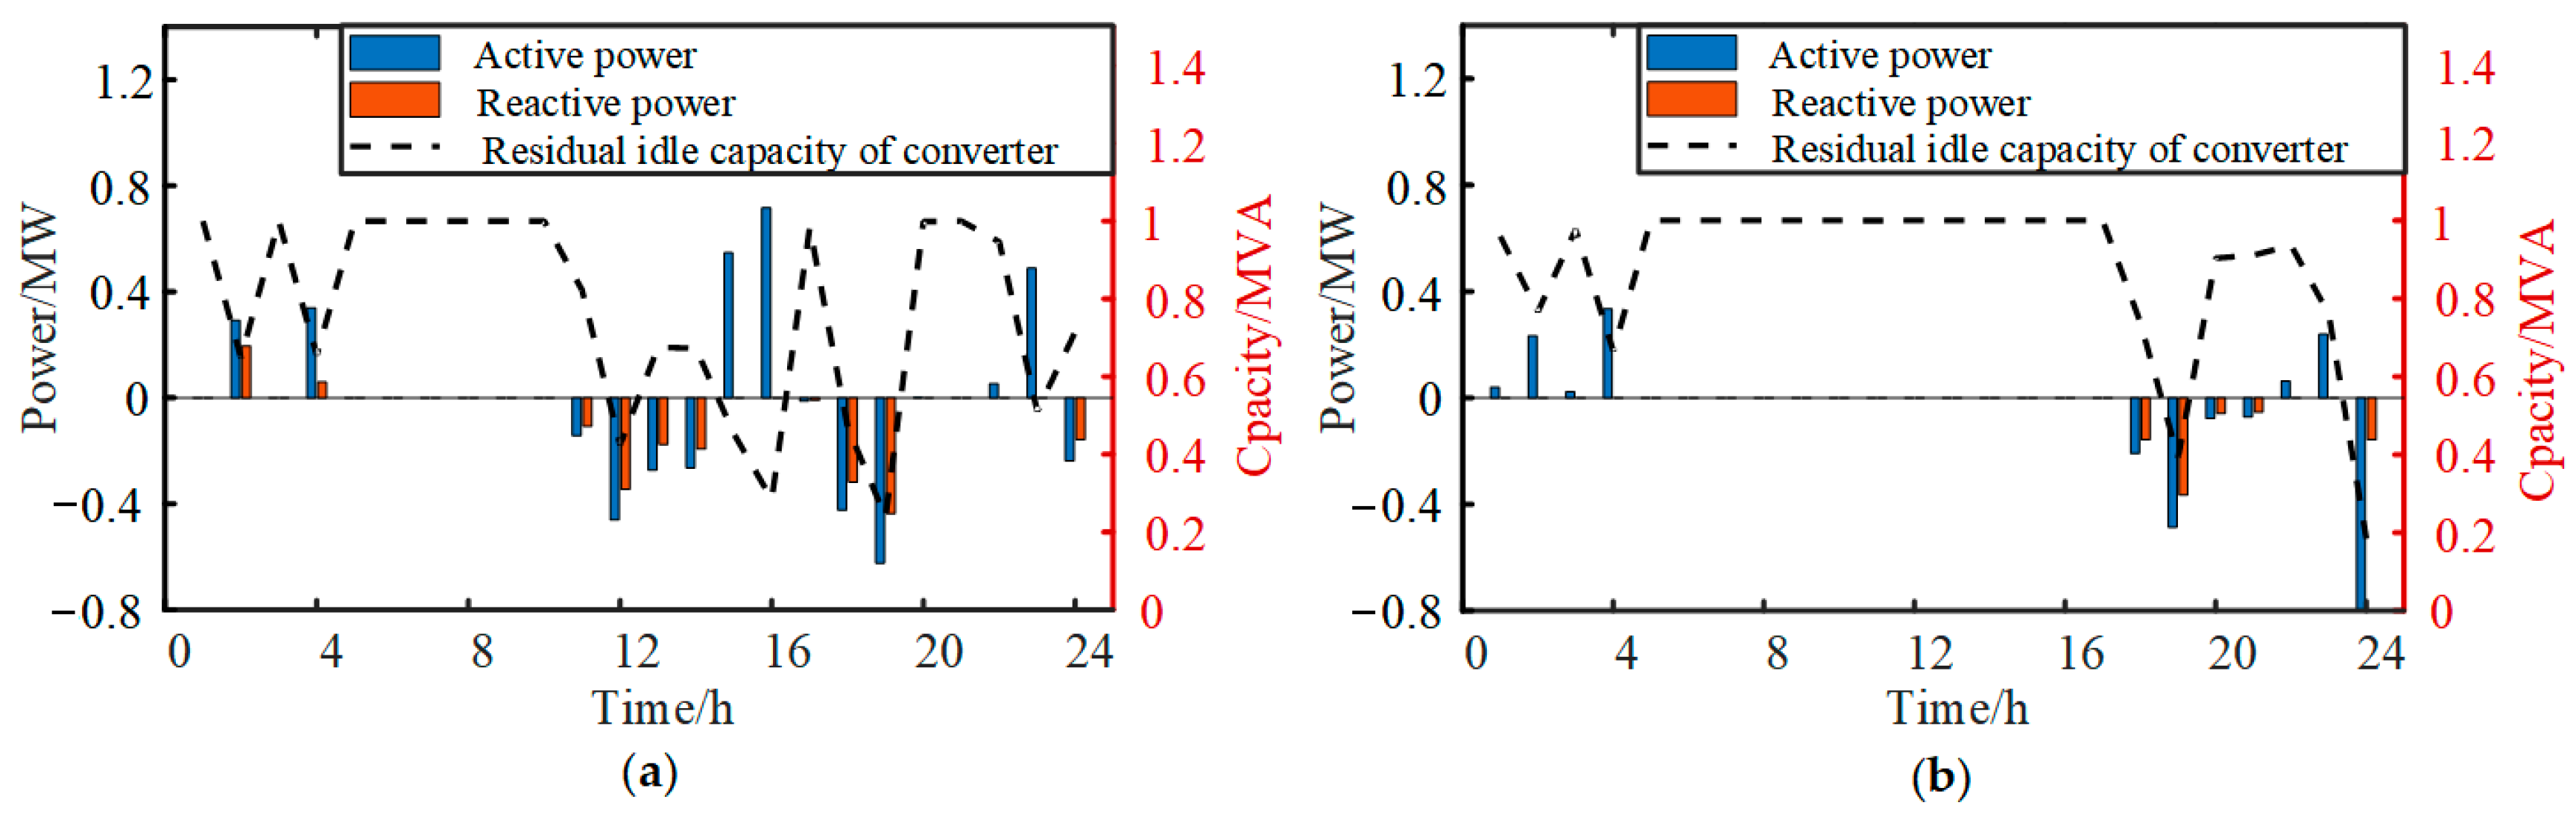
Figure 12 shows the charging and discharging power of the BES and the residual idle capacity of the converter. It can be seen that in Case 1, the BES tends to charge during low-load periods and discharge during peak-load periods to reduce system operating costs. However, this may lead to insufficient idle capacity of the converter, making it impossible for the BES to meet the system’s frequency regulation requirements. Compared with Case 1, the BES in Case 2 has less charging and discharging power. Especially during the first peak-load period, the BES discharge power is zero. This is because the system experiences large disturbance power during this period, and the BES needs to reduce discharge power to increase frequency regulation reserve power, avoiding insufficient idle capacity of the converter and ensuring that the BES can meet the system’s frequency regulation requirements. Therefore, in all periods, Case 2 has more idle capacity in the converter, indicating that in Case 2, the BES can balance both the system’s economic costs and frequency regulation needs.
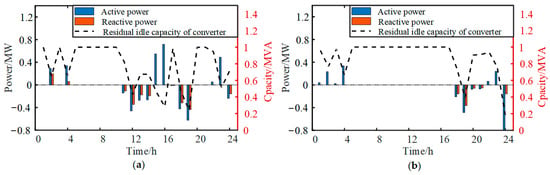
Figure 12.
Charging and discharging power of the BES and residual idle capacity of converter: (a) Case 1: traditional methods and (b) Case 2: the proposed method.
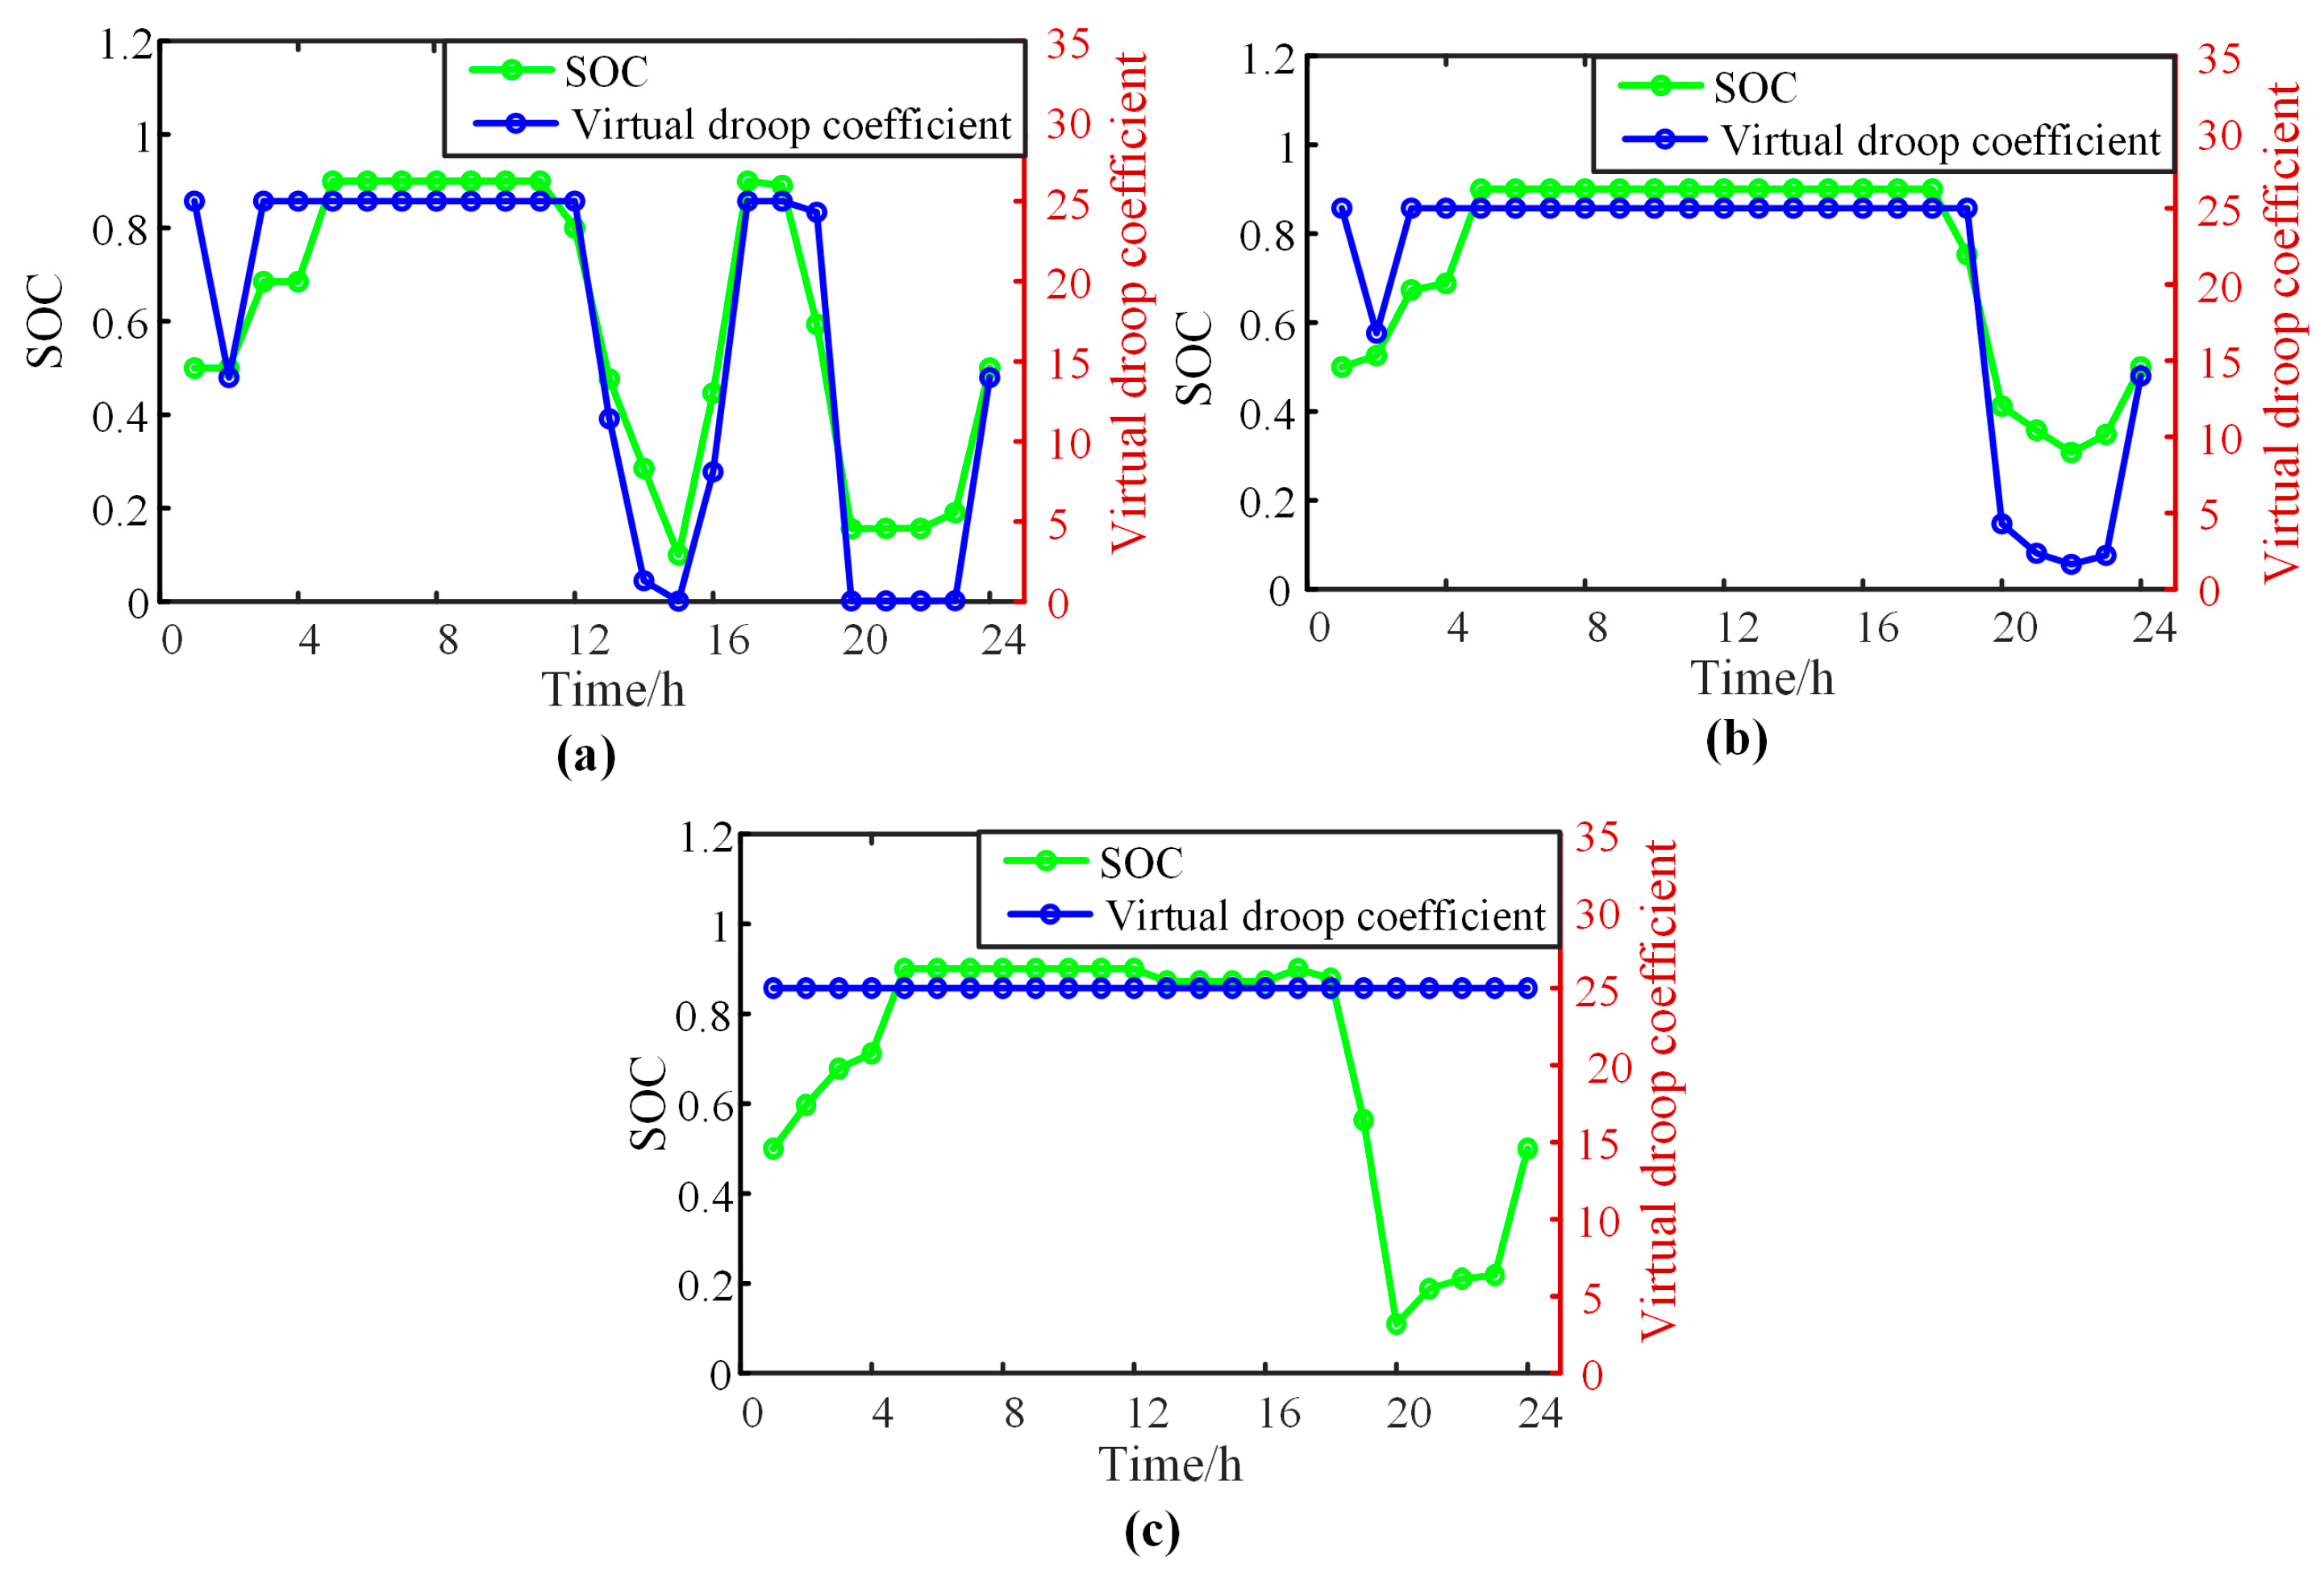
Figure 13 illustrates the variations in the SOC of the BES and its virtual droop coefficient. It is evident that both Case 1 and Case 2 employ an adaptive virtual droop coefficient control strategy, causing the virtual droop coefficient of the BES to change with the SOC. During time periods 12–15, when the system is subjected to significant disturbance power, the virtual droop coefficient of the BES in Case 1 decreases to a relatively small value as the SOC declines. Consequently, the primary frequency regulation capability of the BES is low, which fails to meet the system’s frequency regulation requirements. In contrast, in Case 2, both the SOC and the virtual droop coefficient of the BES are maintained at their maximum values, endowing the BES with strong frequency regulation capabilities. During time periods 20–23, the virtual droop coefficient of the BES in Case 1 drops to zero as the SOC decreases, resulting in the BES losing its primary frequency regulation capability. At this time, only the hydropower units in the system participate in frequency regulation. Different from Case 1, the virtual droop coefficient of the BES in Case 2 still remains at a certain value. Therefore, compared with Case 1, Case 2 can adjust the SOC and virtual droop coefficient of the BES according to the system’s frequency regulation requirements, thereby reducing the risk of the system frequency exceeding the limit. The BES in Case 3 uses a fixed virtual droop coefficient control strategy, so the virtual droop coefficient of the BES is always maintained at the maximum value. During time periods 20–23, the SOC is relatively low. If the BES discharges rapidly to provide frequency response power to the system at this time, the SOC will decrease, possibly exceeding the frequency regulation range and affecting the service life of the BES.
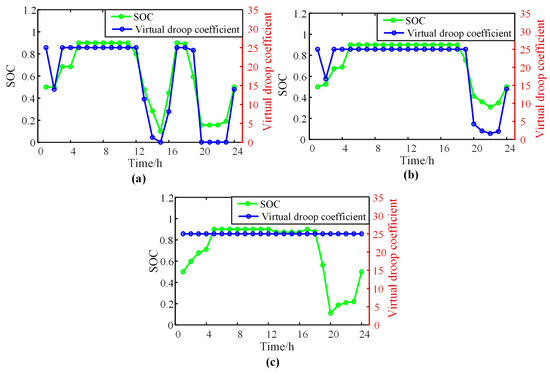
Figure 13.
SOC of the BES and virtual droop coefficient of the BES: (a) Case 1: traditional methods with adaptive virtual droop coefficient, (b) Case 2: the proposed method with adaptive virtual droop coefficient, and (c) Case 3: the proposed method with fixed virtual droop coefficient.
5.4. Analysis of Transient Frequency
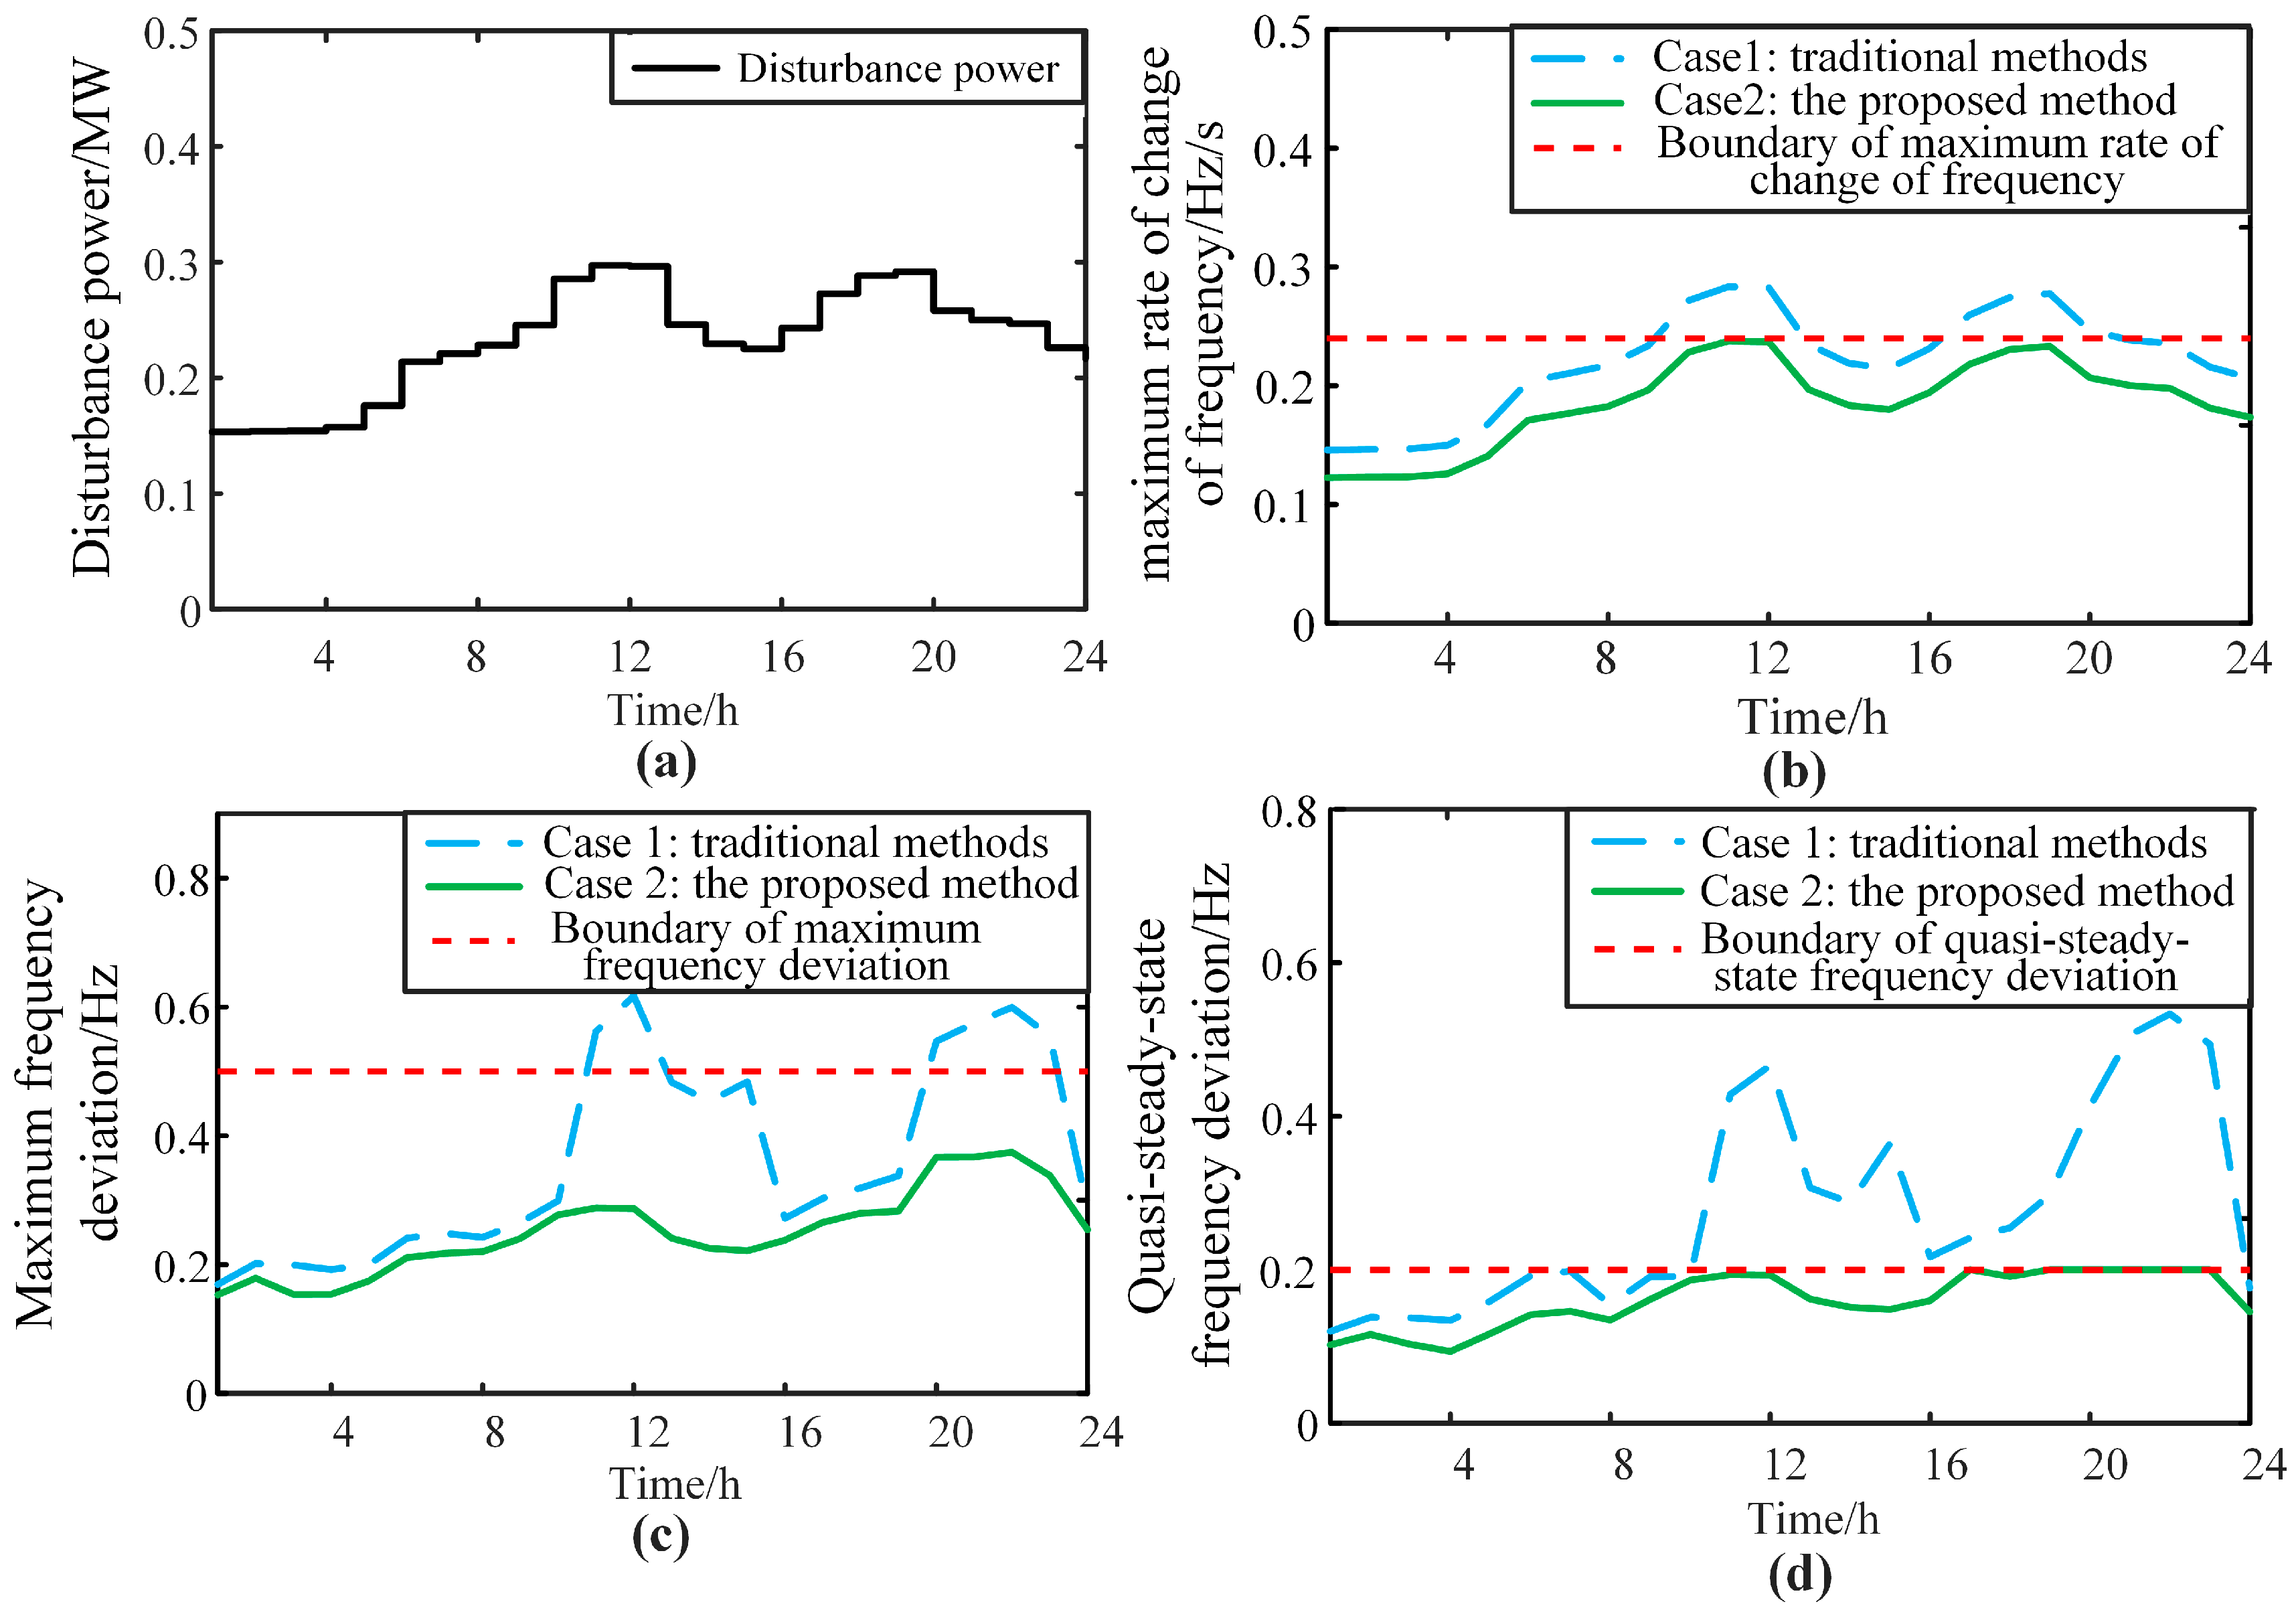
To analyze the frequency transient process of the system, this paper establishes a central frequency response model for islanded microgrids on the Simulink platform with a time resolution of 0.01 s. It is assumed that the system state (including unit commitment arrangements, power output plans, reserve capacity, etc.) remains unchanged within a time period. The hourly optimal scheduling results of the system are input, an 8% load power step disturbance is applied at the initial moment, the simulation duration is set to 30 s, and the transient frequency process at the initial moment of each hour under this system state, along with the corresponding maximum rate of change of frequency, maximum frequency deviation, and quasi-steady-state frequency deviation, are recorded, as shown in Figure 14 and Figure 15.
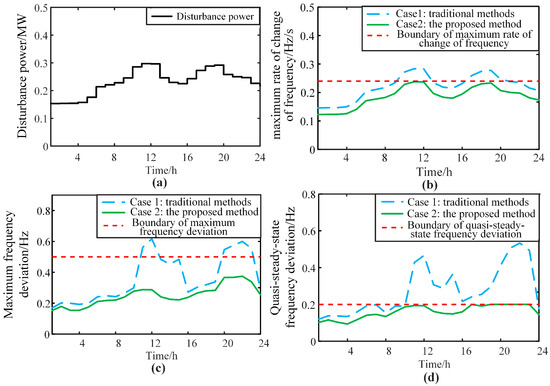
Figure 14.
Frequency safety index: (a) disturbance power, (b) maximum rate of change of frequency, (c) maximum frequency deviation, and (d) quasi-steady-state frequency deviation.
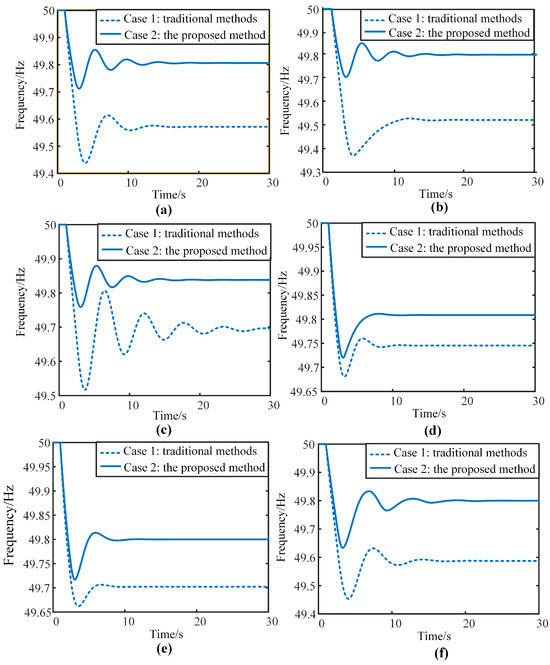
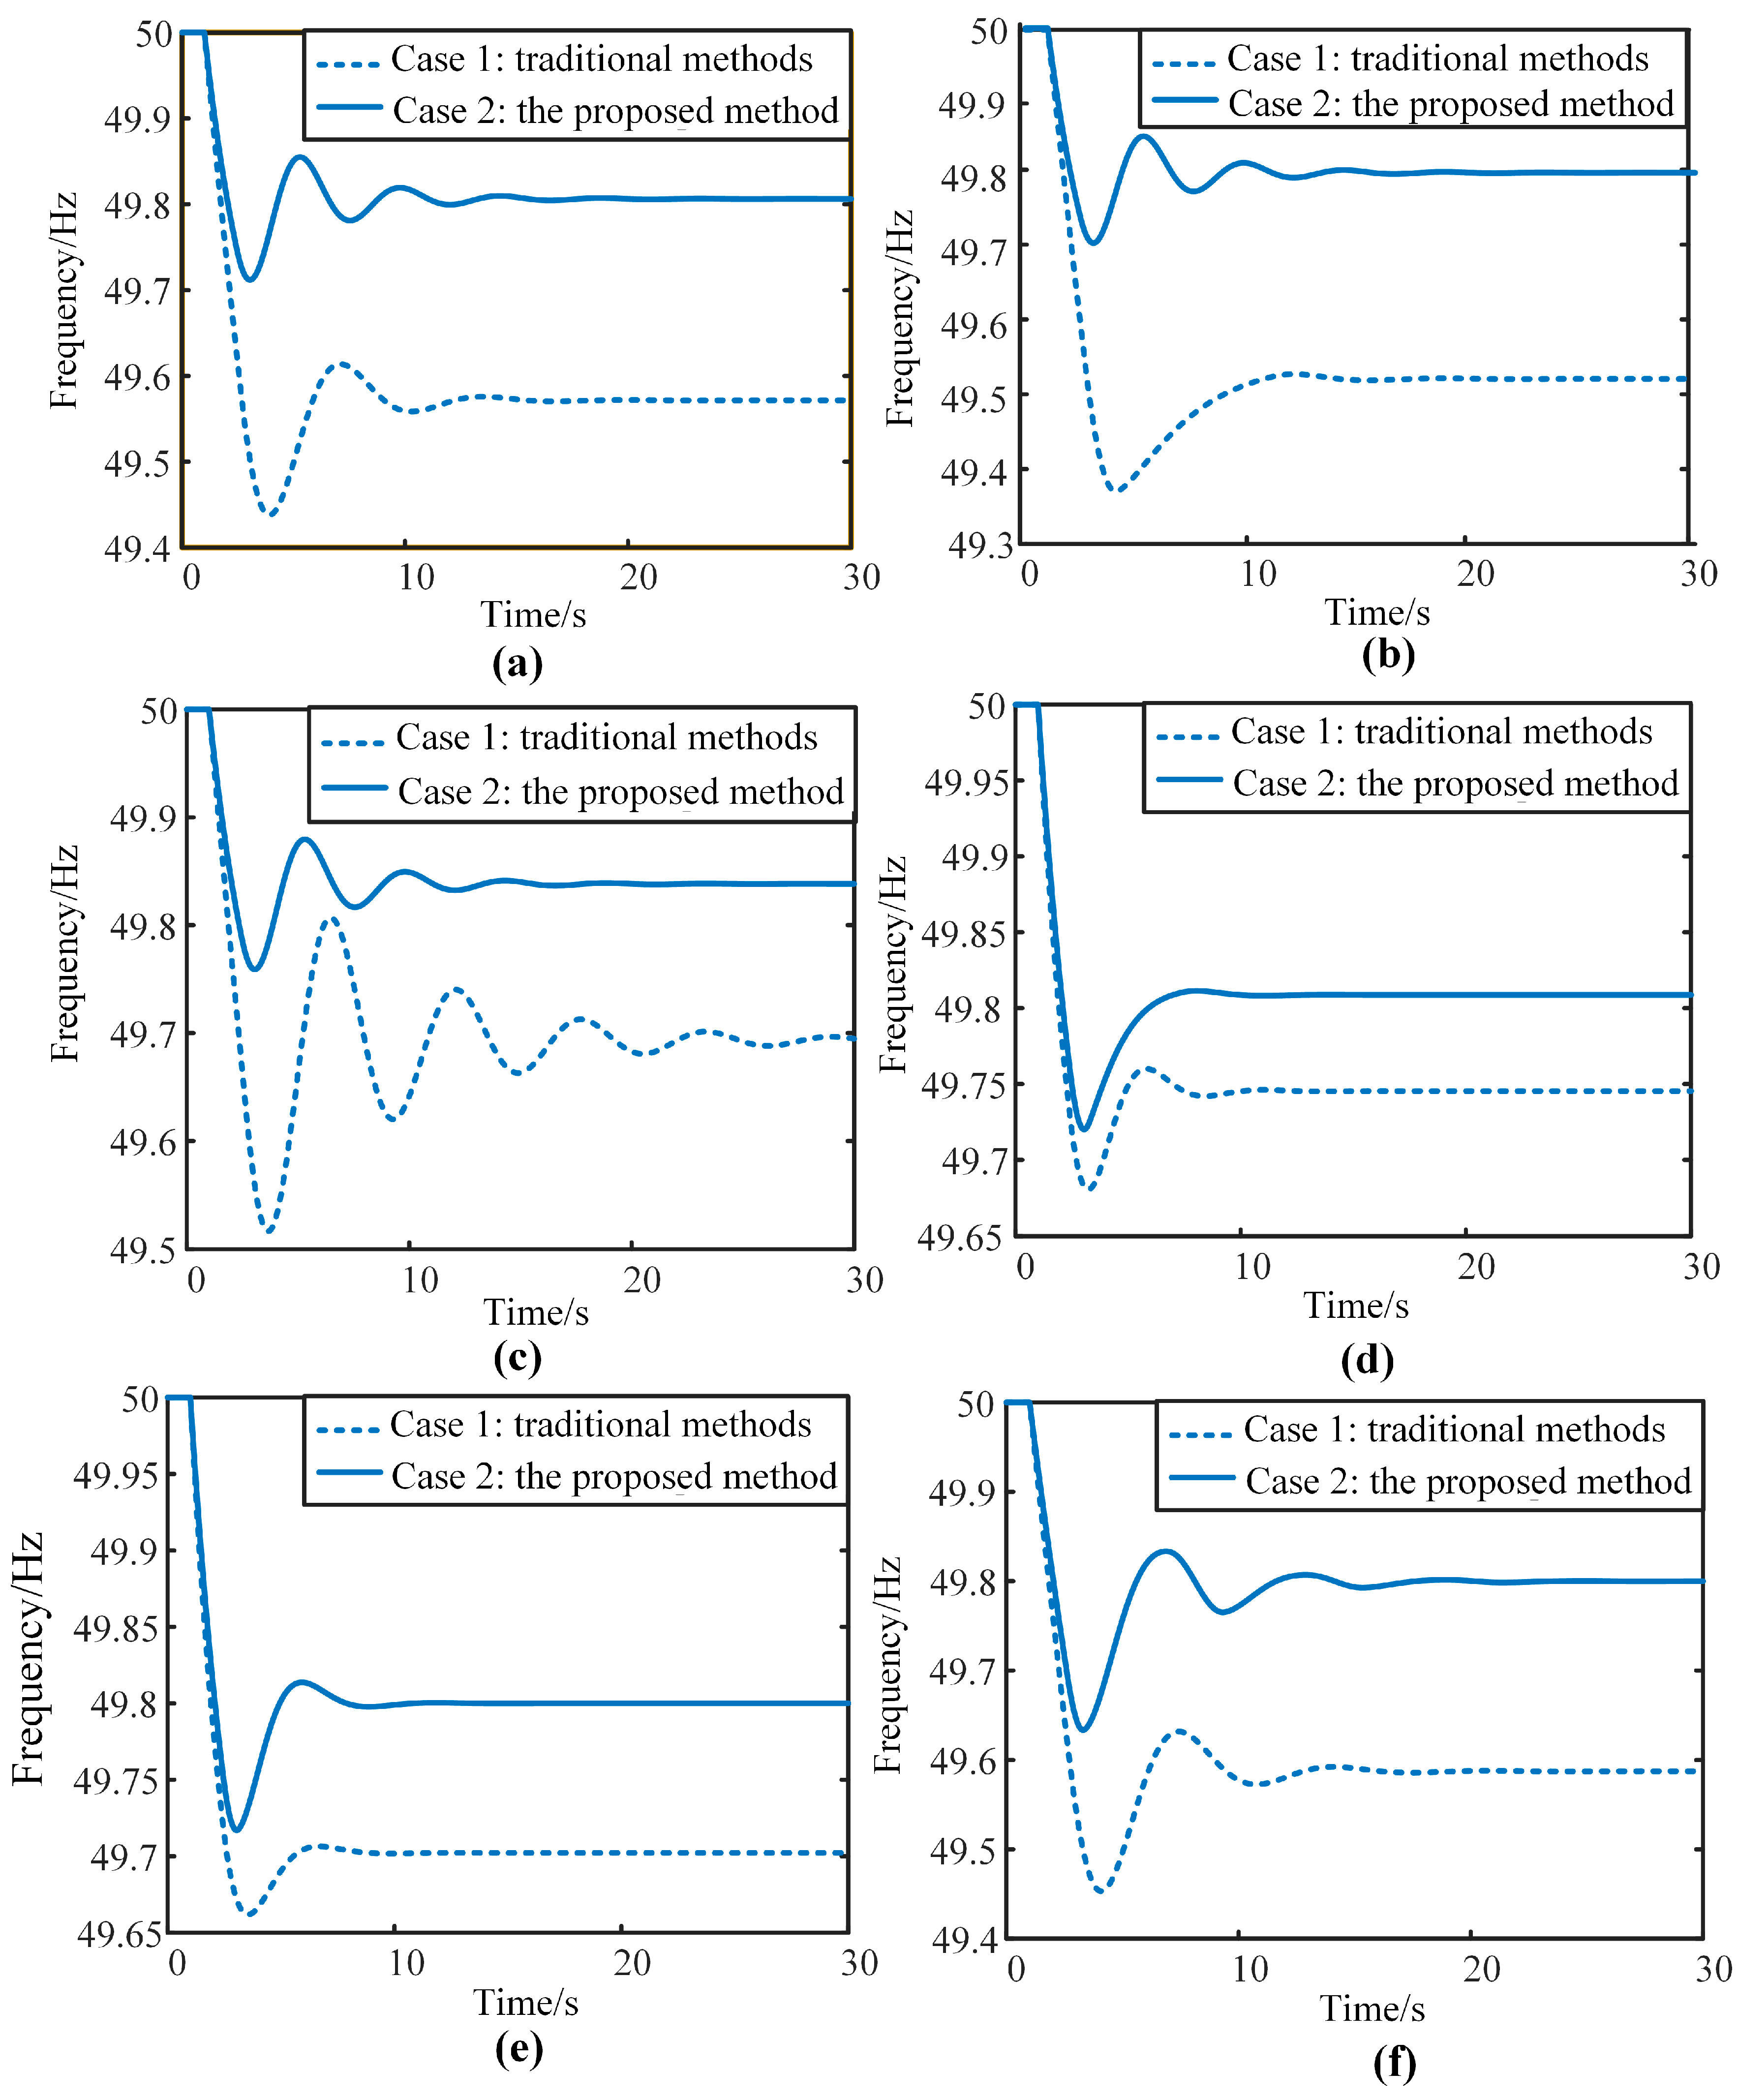
Figure 15.
Transient frequency curve: (a) t = 11 h, (b) t = 12 h, (c) t = 13 h, (d) t = 18 h, (e) t = 19 h, and (f) t = 20 h.
Figure 14 depicts the hourly dynamic frequency security indices of the system under load power step disturbances. It can be observed that during periods with significant disturbance power, the risk of the system frequency exceeding the limits is relatively high. In Case 1, the maximum rate of change of frequency, maximum frequency deviation, and quasi-steady-state frequency deviation indices of the system exceeded their respective threshold boundaries at different times. Among these, the quasi-steady-state frequency deviation exhibited the most severe over-limit situation, exceeding 0.5 Hz during time periods 21–23. This is primarily because the virtual droop coefficient of the BES was zero during this period, rendering it unable to provide primary frequency regulation auxiliary services. Consequently, only the hydropower units in the system participated in frequency regulation. However, the frequency regulation reserve power of the hydropower units alone was insufficient to balance the system load power disturbances, forcing the system to operate at a lower frequency. In Case 2, by additionally considering dynamic frequency security constraints and further optimizing the system unit commitment schedule and primary frequency regulation reserve power deployment plan, the overall inertia level and primary frequency regulation reserve power of the system were able to meet the system’s frequency regulation requirements. As a result, all three major frequency security indices of the system were maintained within the safe range. Moreover, compared with Case 1, Case 2 exhibited a higher margin for frequency security indices, which validates the effectiveness of the method proposed in this paper in enhancing the system frequency security level.
Figure 15 shows the system’s transient frequency processes in different periods. It can be seen that compared with Case 2, Case 1 has a lower total inertia level. Therefore, within the initial few seconds after the disturbance occurs, the frequency drop rate in Case 1 is significantly faster than that in Case 3, and the corresponding maximum frequency deviation is also larger. After the frequency drops to the lowest point, the ramp rate of frequency response power in Case 1 is low, and the reserve power is insufficient, leading to a large quasi-steady-state frequency deviation. Compared with Case 1, Case 2 has a lower frequency drop rate and a higher ramp rate of frequency response power. The system frequency basically enters the quasi-steady-state stage at approximately 20 s after the disturbance occurs.
6. Conclusions
Aiming at the problem that the operational economy and frequency–voltage security of isolated microgrids are difficult to balance under high-proportion renewable energy integration, this paper proposes a coordinated optimal scheduling method for frequency and voltage in isolated microgrids considering active support from BES. The main conclusions are as follows:
- (1)
- Compared with Case 3, the BES frequency regulation strategy with adaptive virtual droop coefficients proposed in this paper fully considers the SOC safety and primary frequency regulation capability. It enables the BES to dynamically adjust its own SOC value according to the system’s frequency regulation requirements, avoiding the SOC from exceeding the safe range due to rapid frequency regulation by the BES;
- (2)
- The proposed combined frequency and voltage regulation strategy for BES takes into account the influence of converter capacity limitations. It allows the BES converter to reasonably schedule the output of active and reactive power, reserving sufficient converter idle capacity for the BES to participate in active frequency support for the system;
- (3)
- Compared with Case 1, the method proposed in this paper additionally considers dynamic frequency security constraints. Although this leads to a 3.1% increase in economic costs, the system’s upward reserve capacity is 29.97% higher than that of Case 1, and the inertia constant is 19.24% higher, effectively improving the system’s frequency security.
Author Contributions
Conceptualization, X.L.; data curation, J.T., Q.Z., J.P., and N.H.; formal analysis, X.L., J.T., Q.Z., and J.P.; funding acquisition, X.L.; investigation, Q.Z.; methodology, X.L. and J.T.; resources, J.P.; validation, X.L., J.T., and Q.Z.; visualization, J.T. and N.H.; writing—original draft, J.T. and Q.Z.; writing—review and editing, X.L., J.P., and N.H. All authors have read and agreed to the published version of the manuscript.
Funding
This research was funded in part by the National Natural Science Foundation of China under Grant 52207145, in part by the Key Technology R&D Program of Hunan Province of China under Grant 2023GK2017, and in part by the Hunan Provincial Natural Science Foundation for Excellent Young Scholars of China under Grant 2024JJ4060.
Data Availability Statement
The data presented in this study are available on request from the corresponding authors due to confidentiality agreements.
Conflicts of Interest
The authors declare no conflicts of interest.
References
- Islam, S.; Roy, N.K. Renewables integration into power systems through intelligent techniques: Implementation procedures, key features, and performance evaluation. Energy Rep. 2023, 9, 6063–6087. [Google Scholar] [CrossRef]
- Charalambous, A.; Hadjidemetriou, L.; Kyriakides, E.; Polycarpou, M.M. A Coordinated Voltage–Frequency Support Scheme for Storage Systems Connected to Distribution Grids. IEEE Trans. Power Electron. 2021, 36, 8464–8475. [Google Scholar] [CrossRef]
- Wu, Y.K.; Tang, K.T. Frequency Support by BESS–Review and Analysis. Energy Procedia 2019, 156, 187–191. [Google Scholar] [CrossRef]
- Akram, U.; Nadarajah, M.; Shah, R.; Milano, F. A review on rapid responsive energy storage technologies for frequency regulation in modern power systems. Renew. Sustain. Energy Rev. 2020, 120, 109626. [Google Scholar] [CrossRef]
- Charalambous, A.; Hadjidemetriou, L.; Kyriakides, E. Voltage and Frequency Support Scheme for Storage Systems in Distribution Grids. In Proceedings of the 2019 21st European Conference on Power Electronics and Applications, Genova, Italy, 28 November 2019. [Google Scholar] [CrossRef]
- Zhang, F.; Hu, Z.; Xie, X.; Zhang, J.; Song, Y. Assessment of the Effectiveness of Energy Storage Resources in the Frequency Regulation of a Single-Area Power System. IEEE Trans. Power Syst. 2017, 32, 3373–3380. [Google Scholar] [CrossRef]
- Fang, Z.; Shek, J.K.H.; Sun, W.A. review of grid-connected hybrid energy storage systems: Sizing configurations, control strategies, and future directions. J. Energy Storage 2025, 118, 116226. [Google Scholar] [CrossRef]
- Krata, J.; Saha, T.K. Real-Time Coordinated Voltage Support with Battery Energy Storage in a Distribution Grid Equipped with Medium-Scale PV Generation. IEEE Trans. Smart Grid 2018, 10, 3486–3497. [Google Scholar] [CrossRef]
- Zhang, D.; Li, J.; Hui, D. Coordinated control for voltage regulation of distribution network voltage regulation by distributed energy storage systems. Prot. Control Mod. Power Syst. 2018, 3, 3. [Google Scholar] [CrossRef]
- Yu, P.; Wan, C.; Song, Y.; Jiang, Y. Distributed Control of Multi-Energy Storage Systems for Voltage Regulation in Distribution Networks: A Back-and-Forth Communication Framework. IEEE Trans. Smart Grid 2021, 12, 1964–1977. [Google Scholar] [CrossRef]
- Xie, Y.; Liu, L.; Wu, Q.; Zhou, Q. Robust Model Predictive Control Based Voltage Regulation Method for a Distribution System with Renewable Energy Sources and Energy Storage Systems. Int. J. Electr. Power Energy Syst. 2020, 118, 105749. [Google Scholar] [CrossRef]
- Zhao, T.; Parisio, A.; Milanovi, J.V. Distributed Control of Battery Energy Storage Systems for Improved Frequency Regulation. Power Systems. IEEE Trans. (T-PWRS) 2020, 35, 10. [Google Scholar] [CrossRef]
- Yu, J.; Liao, S.; Xu, J. Frequency control strategy for coordinated energy storage system and flexible load in isolated power system. Energy Rep. 2022, 8, 966–979. [Google Scholar] [CrossRef]
- Faragalla, A.; Abouzeid, S.I.; Abdel-Rahim, O.; Orabi, M.; Abdelhameed, E.H. Adaptive and coordinated load frequency control for isolated microgrids considering battery state of charge dynamics. J. Energy Storage 2025, 112, 115467. [Google Scholar] [CrossRef]
- Zhao, H.; Hong, M.; Lin, W.; Loparo, K.A. Voltage and Frequency Regulation of Microgrid With Battery Energy Storage Systems. IEEE Trans. Smart Grid 2019, 10, 414–424. [Google Scholar] [CrossRef]
- Yi, W.; Hill, D.J.; Song, Y. Impact of High Penetration of Renewable Resources on Power System Transient Stability. In Proceedings of the Power and Energy Society General Meeting, Atlanta, GA, USA, 30 January 2020. [Google Scholar]
- Li, K.; Fang, J.; Cui, S.; Feng, Y.; Liu, D.; Gu, P.; Qiu, W.; Wen, J. Frequency Security Constrained Robust Unit Commitment for Sufficient Deployment of Diversified Frequency Support Resources. IEEE Trans. Ind. Appl. 2023, 60, 1725–1737. [Google Scholar] [CrossRef]
- Nguyen, N.; Bera, A.; Mitra, J. Energy Storage to Improve Reliability of Wind Integrated Systems under Frequency Security Constraint. IEEE Trans. Ind. Appl. 2018, 54, 4039–4047. [Google Scholar] [CrossRef]
- Wen, Y.; Li, W.; Huang, G.; Liu, X. Frequency Dynamics Constrained Unit Commitment with Battery Energy Storage. IEEE Trans. Power Syst. 2016, 31, 5115–5125. [Google Scholar] [CrossRef]
- Li, J.; Qiao, Y.; Lu, Z.; Ma, W.; Cao, X.; Sun, R. Integrated Frequency-constrained Scheduling Considering Coordination of Frequency Regulation Capabilities from Multi-source Converters. Mod. Power Syst. Clean Energy 2024, 12, 261–274. [Google Scholar] [CrossRef]
- Zhang, C.; Liu, L.; Cheng, H.; Liu, D.; Zhang, J.; Li, G. Frequency-constrained Co-planning of Generation and Energy Storage with High-penetration Renewable Energy. Mod. Power Syst. Clean Energy 2021, 9, 760–775. [Google Scholar] [CrossRef]
- Shi, Y.; Xu, B.; Wang, D.; Zhang, B. Using Battery Storage for Peak Shaving and Frequency Regulation: Joint Optimization for Superlinear Gains. IEEE Trans. Power Syst. 2017, 33, 2882–2894. [Google Scholar] [CrossRef]
- Hamza, S.; Lina Bertling, T.; Dan-Eric, A.; Samuel, W. Energy Management System (EMS) of Battery Energy Storage System (BESS)—Providing Ancillary Services. In Proceedings of the IEEE Madrid PowerTech, Madrid, Spain, 28 June–2 July 2021. [Google Scholar]
- Yamujala, S.; Jain, A.; Bhakar, R.; Mathur, J. Multi-service based economic valuation of grid-connected battery energy storage systems. J. Energy Storage 2022, 52, 104657. [Google Scholar] [CrossRef]
- Cheng, B.; Powell, W. Co-optimizing Battery Storage for the Frequency Regulation and Energy Arbitrage Using Multi-Scale Dynamic Programming. IEEE Trans. Smart Grid 2016, 9, 1997–2005. [Google Scholar] [CrossRef]
- Liu, X.; Han, W.; Liu, Y.; Liu, Z.; Su, M.; Li, C.; Zhang, X.; Wang, P.A. Coordinated Voltage-Frequency Support Method for VSC-MTDC Integrated Offshore Wind Farms System. IEEE Trans. Power Syst. 2024, 39, 1485–1502. [Google Scholar] [CrossRef]
- Su, H.; Feng, D.; Zhao, Y.; Zhou, Y.; Zhou, Q.; Fang, C.; Rahman, U. Optimization of Customer-Side Battery Storage for Multiple Service Provision: Arbitrage, Peak Shaving, and Regulation. IEEE Trans. Ind. Appl. 2022, 58, 2559–2573. [Google Scholar] [CrossRef]
- Guo, Y.; Zhang, Q.; Wang, Z. Cooperative Peak Shaving and Voltage Regulation in Unbalanced Distribution Feeders. IEEE Trans. Power Syst. 2021, 36, 5235–5244. [Google Scholar] [CrossRef]
- Papazis, S.A. Integrated Economic Optimization of Hybrid Thermosolar Concentrating System Based on Exact Mathematical Method. Energies 2022, 15, 7019. [Google Scholar] [CrossRef]
- Lu, Y.; Lu, C.; Liu, Y.; Deng, M.; Chen, Y.; Duan, R. A multi-objective coordinating model for distribution network with EVs, energy storage, and reactive power compensation devices. Energy Rep. 2024, 12, 2600–2610. [Google Scholar] [CrossRef]
- Luo, L.; Abdulkareem, S.S.; Rezvani, A.; Miveh, M.R.; Samad, S.; Aljojo, N.; Pazhoohesh, M. Optimal scheduling of a renewable based microgrid considering photovoltaic system and battery energy storage under uncertainty. J. Energy Storage 2020, 28, 101306. [Google Scholar] [CrossRef]


Disclaimer/Publisher’s Note: The statements, opinions and data contained in all publications are solely those of the individual author(s) and contributor(s) and not of MDPI and/or the editor(s). MDPI and/or the editor(s) disclaim responsibility for any injury to people or property resulting from any ideas, methods, instructions or products referred to in the content. |
© 2025 by the authors. Licensee MDPI, Basel, Switzerland. This article is an open access article distributed under the terms and conditions of the Creative Commons Attribution (CC BY) license (https://creativecommons.org/licenses/by/4.0/).