
Experimental Study on the Treatment of Printing and Dyeing Wastewater by Iron–Carbon Micro-Electrolysis and Combined Processes


Abstract
1. Introduction
2. Experimental Design and Sample Testing
2.1. Materials, Reagents, and Instruments
2.2. Material Pretreatment
2.3. Experimental Design
2.4. Sample Testing and Data Processing Methods
3. Results and Analysis
3.1. Single Factor Experiment of Iron–Carbon Micro-Electrolysis
3.1.1. Effects of Different Reaction Times
3.1.2. Effects of Initial pH Values
3.1.3. Effects of Different Fe/C Mass Ratios
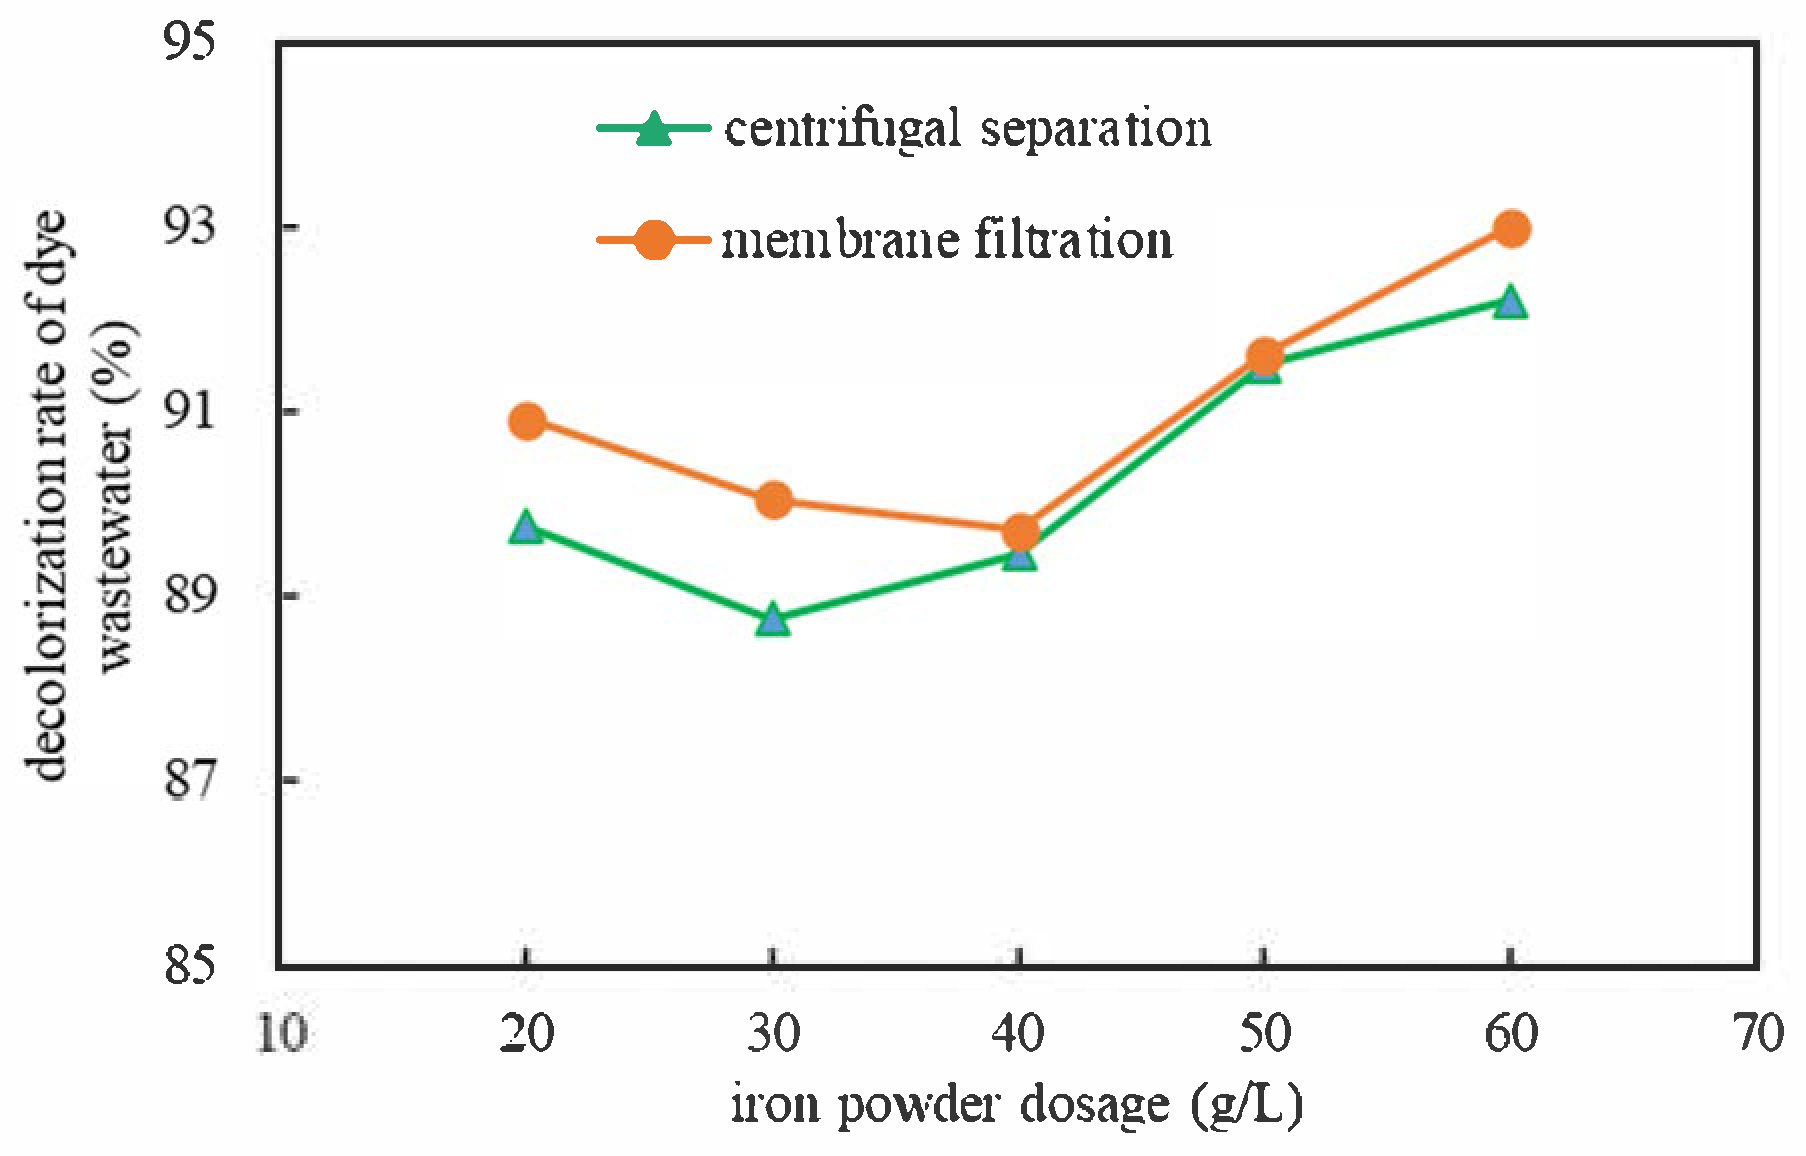
3.1.4. Effects of Different Separation Methods
3.1.5. Iron–Carbon Micro-Electrolysis Experiments Under Optimal Conditions
3.2. Analysis of the Treatment Effect of Iron–Carbon Micro-Electrolysis Combined Processes
3.2.1. Analysis of the Treatment Effect of Iron–Carbon Micro-Electrolysis and Coagulation Sedimentation Combined Process
3.2.2. Analysis of the Treatment Effect of Combined Process of Iron–Carbon Micro-Electrolysis + Fenton Oxidation
4. Conclusions
Author Contributions
Funding
Data Availability Statement
Conflicts of Interest
References
- Leme, D.M.; Primo, F.L.; Gobo, G.G.; da Costa, C.R.V.; Tedesco, A.C.; de Oliveira, D.P. Genotoxicity assessment of reactive and disperse textile dyes using human dermal equivalent (3D cell culture system). J. Toxicol. Environ. Health A 2015, 78, 466–480. [Google Scholar] [CrossRef] [PubMed]
- Sun, X.; Xu, J.; Chu, Z. Experimental study of absorption of methylene blue with activated carbon prepared by modification pomelo peel in different methods. J. Hohai Univ. Nat. Sci. 2021, 49, 536–542. [Google Scholar]
- Li, Z. Study on the Preparation and Adsorption Characteristics of Auricula Chaff Charcoal. Master’s Thesis, Northeast Electric Power University, Jilin, China, 2024. [Google Scholar]
- Zhang, C. Study on preparation of almond shell-based activated carbon and its adsorption of methylene blue. Ind. Microbiol. 2023, 53, 59–62. [Google Scholar]
- Luo, X. Study on O3-coagulation Enhanced Pretreatment and O3-SBBR Advanced Treatment of Wastewater from a Printing and Dyeing Industrial Park in Foshan. Ph.D. Thesis, South China University of Technology, Guangzhou, China, 2022. [Google Scholar]
- Ding, J.; Zhang, J.; Ren, Y.; Han, Y. Treatment of dyeing wastewater by a combined process of coagulation, A/O, flotation, ozone, and magnetic coagulation. China Water Wastewater 2021, 37, 112–115. [Google Scholar]
- Li, Z.; Chang, N.; Xu, Y.; Liu, P.; Chen, D.; Wang, H. Fenton process treating small pore-sized ultrafiltration membrane concentrate of printing and dyeing wastewater. Chin. J. Environ. Eng. 2024, 18, 41–50. [Google Scholar]
- Feng, Y.; Sun, R.; Zhao, J.; Li, H. Engineering design of Fenton oxidation process in advanced treatment of printing and dyeing wastewater. Water Wastewater Eng. 2023, 59, 58–63. [Google Scholar]
- He, Y.; Chen, W.; Zheng, X.; Zhang, Y.; Wang, X.; Huang, X.; Xia, M. Pretreatment experiment of high-concentration aromatic tobacco flavor wastewater with Fenton reagent and PAM coagulation. J. Hohai Univ. Nat. Sci. 2012, 40, 525–529. [Google Scholar]
- Jing, X.; Cai, D.; Li, B.; Hu, D.; Li, J.; Yuan, J. Progress in the deep treatment technology of printing and dyeing wastewater. Technol. Water Treat. 2022, 48, 13–19. [Google Scholar]
- Jing, X. Study on the Advanced Treatment Process of High Concentration Printing and Dyeing Wastewater. Master’s Thesis, Hebei University of Technology, Tianjin, China, 2023. [Google Scholar]
- Zhang, L.; Wang, C.; Li, Y.; Fan, J.; Sun, P.; Han, J. Mechanism of complex superior oxidation system Vis/LaFeO3/PDS for methylene blue degradation. Water Resour. Prot. 2021, 37, 142–149. [Google Scholar]
- Zhang, Z. Study on the Efficiency and Mechanism of Iron Carbon Microelectrolysis Treatment of Dyeing Wastewater. Master’s Thesis, Northeast Electric Power University, Jilin, China, 2020. [Google Scholar]
- Sun, Z.-Z.; Liu, Z.-H.; Han, L.; Qin, D.-L.; Yang, G.; Xing, W.-H. Study on the treatment of simulated azo dye wastewater by a novel micro-electrolysis filler. Water Sci. Technol. 2019, 79, 2279–2288. [Google Scholar] [CrossRef]
- Liu, W.-W.; Tu, X.-Y.; Wang, X.-P.; Wang, F.-Q.; Li, W. Pretreatment of coking wastewater by acid out micro-electrolysis process with in situ electrochemical peroxidation reaction. Chem. Eng. J. 2012, 200, 720–728. [Google Scholar] [CrossRef]
- Zhu, Q.; Guo, S.; Guo, C.; Dai, D.; Jiao, X.; Ma, T.; Chen, J. Stability of Fe-C micro-electrolysis and biological process in treating ultra-high concentration organic wastewater. Chem. Eng. J. 2014, 255, 535–540. [Google Scholar] [CrossRef]
- Chen, K.; Gong, M.; Li, R.; Li, P.; Xia, W. Comprehensive Experimental Design of Fe-C Micro-electrolysis for Treating Dye Wastewater. Res. Explor. Lab. 2023, 42, 183–187+193. [Google Scholar]
- He, W.; Li, G.; Song, J.; Wang, S.; Chen, H. Research on a new type of micro-electrolysis material for the degradation of printing and dyeing wastewater. Ind. Water Treat. 2018, 38, 71–74. [Google Scholar]
- Jia, Y.; Zhang, Z.; Tong, Z.; Wang, W.; Zhang, L. Study on efficiency and mechanism of iron-carbon microelectrolysis treatment of dyeing wastewater. CIESC J. 2020, 71, 1791–1801. [Google Scholar]
- She, S.; Chen, H.; Xue, G.; Zeng, C.; Xie, X.; Chen, S. Mechanism for treatment of dyeing wastewater by Fe-C micro-electrolysis. Environ. Prot. Chem. Ind. 2021, 41, 699–704. [Google Scholar]
- Ren, Q. Removal of Direct Dyes and Reactive Dyes from Printing and Dyeing Wastewater by Microelectrolysis and the Mechanism of Decolorization. Master’s Thesis, Lanzhou Jiaotong University, Lanzhou, China, 2022. [Google Scholar]
- Chen, G. Study on Biological Decolorization of Azo Dye Wastewater and Aerobic Degradation Performance of Typical Decolorization Products. Ph.D. Thesis, Donghua University, Shanghai, China, 2012. [Google Scholar]
- Liu, X. Study on the Effect and Decolorization Mechanism of Azo Dye Wastewater Treatment by Micro Electrolysis. Master’s Thesis, Lanzhou Jiaotong University, Lanzhou, China, 2021. [Google Scholar]
- GB4287-2012; Emission Standard for Water Pollutants in Textile Dyeing and Finishing Industry. National Environmental Protection Department: Beijing, China, 2012.
- HJ 1182-2021; Water Quality—Determination of Colority—Dilution Level Method. Ministry of Ecology and Environment of the People’s Republic of China: Beijing, China, 2021.
- Bai, B.; Chen, Z.; Wang, L. Treatment of direct scarlet 4BE dye wastewater by the hybrid method of Fe/C microelectrolysis and ultrasound radiation. Appl. Chem. Ind. 2007, 36, 130–133. [Google Scholar]
- Fan, J.; Zhou, W.; Yang, X.; Lin, T. Effect of Fe2+ and PMS synchronous coagulation and oxidation pretreatment on purification of sludge water by ultrafiltration. Water Resour. Prot. 2021, 37, 148–152. [Google Scholar]
- Li, C.; Guo, Y.; Zheng, L.; Jiao, Y.; Zhang, H.; Wu, Z.; Huang, G.; Wang, Z.; Wei, Y. DOM removal characteristics and coagulation mechanism of silica sand loading coagulation process. Water Resour. Prot. 2021, 37, 148–155. [Google Scholar]
- Wei, Y.; Zheng, L.; Zhang, C.; Yu, D.; Wang, Y.; Zheng, J.; Yue, Z.; Wang, G. Progress of application and research of advanced treatment technologies for reclaimed water reuse in thermal power generation plant in China. Water Resour. Prot. 2018, 34, 1–11. [Google Scholar]
- Zhang, K. Study on Treatment of Aromatic Compounds in Printing and Dyeing Wastewater by Fenton Oxidation. Master’s Thesis, Beijing University of Chemical Technology, Beijing, China, 2023. [Google Scholar]
- Zhao, H.; Li, M.; Bai, M.; Wang, W.; Wu, Y.; Zhang, B. Research progress of advanced oxidation technology in dyeing wastewater treatment. Appl. Chem. Ind. 2023, 52, 1884–1890. [Google Scholar]
- Bu, Q.; Zhao, T.; Liu, J.; Lin, L.; Xin, H. Pretreatment of phosphoric ester flame-retardant wastewater with Fenton oxidation technique. Water Resour. Prot. 2016, 32, 90–92. [Google Scholar]
- Yang, X. Study on the Performance of PAM-PAFC in Degrading Printing and Dyeing Wastewater. Master’s Thesis, Guizhou University, Guizhou, China, 2022. [Google Scholar]
- Chen, X.; Wu, L.; Zhang, L.; Yu, C.; Zhang, C.; Cao, Y.; Chen, C.; Chen, H. Advanced treatment of practical dyeing wastewater by electron beam coupled with coagulation technology. Ind. Water Treat. 2025, 45, 143–150. [Google Scholar]
- Sun, S.; Shen, Y.; Li, J.; Li, X.; Li, K. Analysis on Flocculation Decolorization and COD Removal of Dye Wastewater by Aluminum Salt Coagulant. Contemp. Chem. Ind. 2025, 54, 972–977. [Google Scholar]
- Pang, Y.; Lou, H.; Gao, R.; Zhang, Z.; Chen, X.; Shi, H. Study on Advanced Treatment of Dyeing Wastewater by Fenton Oxidation. Technol. Water Treat. 2023, 49, 40–44. [Google Scholar]
- Qiao, T.; Yang, K.; Feng, M.; Wu, M.; Wang, G.; Wang, W.; Gao, J. Research Progress on Application of Micro Electrolysis-Fenton Oxidation Combined Technology in Industrial Wastewater Treatment. China Resour. Compr. Util. 2023, 41, 89–92. [Google Scholar]
- Kong, Z. Treatment of Azo Dye Wastewater by Iron-Carbon Microelectrolysis Combined with Fenton Reagent. Master’s Thesis, Jiangxi University of Science and Technology, Ganzhou, China, 2019. [Google Scholar]
- Wang, Y.; Wu, X.; Yi, J.; Chen, L.; Lan, T.; Dai, J. Pretreatment of printing and dyeing wastewater by Fe/C micro-electrolysis combined with H2O2 process. Water Sci. Technol. 2018, 2017, 707–717. [Google Scholar] [CrossRef]

| Reaction Time (min) | Absorbance After Treatment | Concentration After Treatment (mg/L) | Decolorization Rate (%) |
|---|---|---|---|
| 50 | 0.309 | 20.7 × 25 | 65.50 |
| 70 | 0.211 | 14.58 × 25 | 75.70 |
| 90 | 0.213 | 14.70 × 10 | 90.20 |
| 110 | 0.797 | 51.20 | 96.59 |
| 130 | 0.184 | 12.89 | 99.14 |
| Initial pH | Absorbance After Treatment | Concentration After Treatment (mg/L) | Decolorization Rate (%) |
|---|---|---|---|
| 3 | 0.031 | 3.33 | 99.78 |
| 4 | 0.065 | 5.45 | 99.64 |
| 5 | 0.157 | 11.20 | 99.25 |
| 6 | 0.111 | 8.325 × 10 | 94.45 |
| 7 | 0.357 | 23.70 × 10 | 84.20 |
| Iron–Carbon Ratio | Absorbance After Treatment | Concentration After Treatment (mg/L) | Decolorization Rate (%) |
|---|---|---|---|
| 2:1 | 0.165 | 11.70 × 10 | 92.20 |
| 1:1 | 0.213 | 14.70 × 10 | 90.20 |
| 1:2 | 0.305 | 20.45 | 98.64 |
| 1:3 | 0.055 | 4.83 | 99.68 |
| Separation | Iron Powder Dosage (g/L) | Absorbance After Treatment (Dilute 10 Times) | Concentration After Treatment (mg/L) | Decolorization Rate (%) |
|---|---|---|---|---|
| centrifugal separation | 20 | 0.244 | 16.638 × 10 | 88.91 |
| 30 | 0.268 | 18.137 × 10 | 87.91 | |
| 40 | 0.251 | 17.075 × 10 | 88.62 | |
| 50 | 0.202 | 14.013 × 10 | 90.66 | |
| 60 | 0.185 | 12.950 × 10 | 91.37 | |
| membrane filtration | 20 | 0.216 | 14.887 × 10 | 90.08 |
| 30 | 0.237 | 16.200 × 10 | 89.20 | |
| 40 | 0.245 | 16.700 × 10 | 88.87 | |
| 50 | 0.199 | 13.825 × 10 | 90.78 | |
| 60 | 0.166 | 11.763 × 10 | 92.16 |
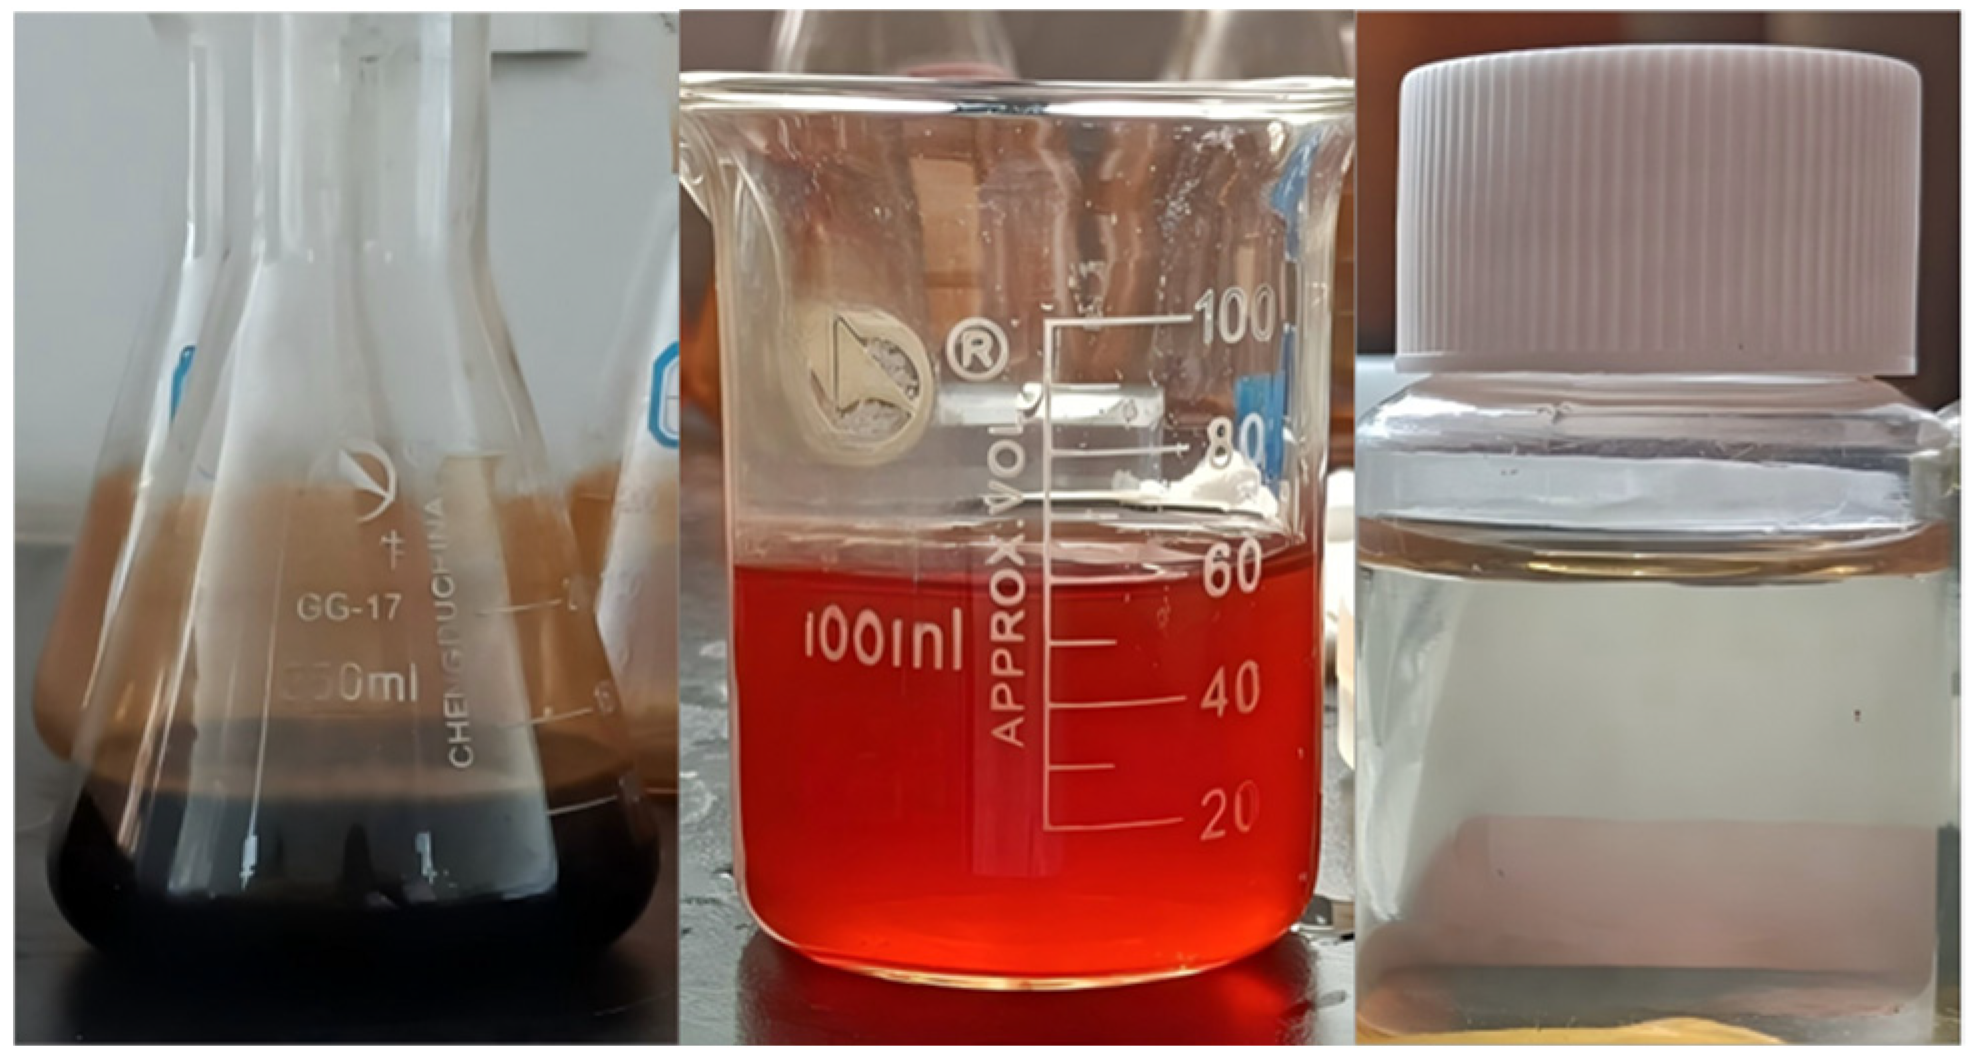
| Wastewater | Color | Dye Concentration (mg/L) | Chromaticity (Times) |
|---|---|---|---|
| Pretreatment | reddish-black | 1500 | 80,000 |
| Post-treatment | light orange | 14.51 | 3000 |
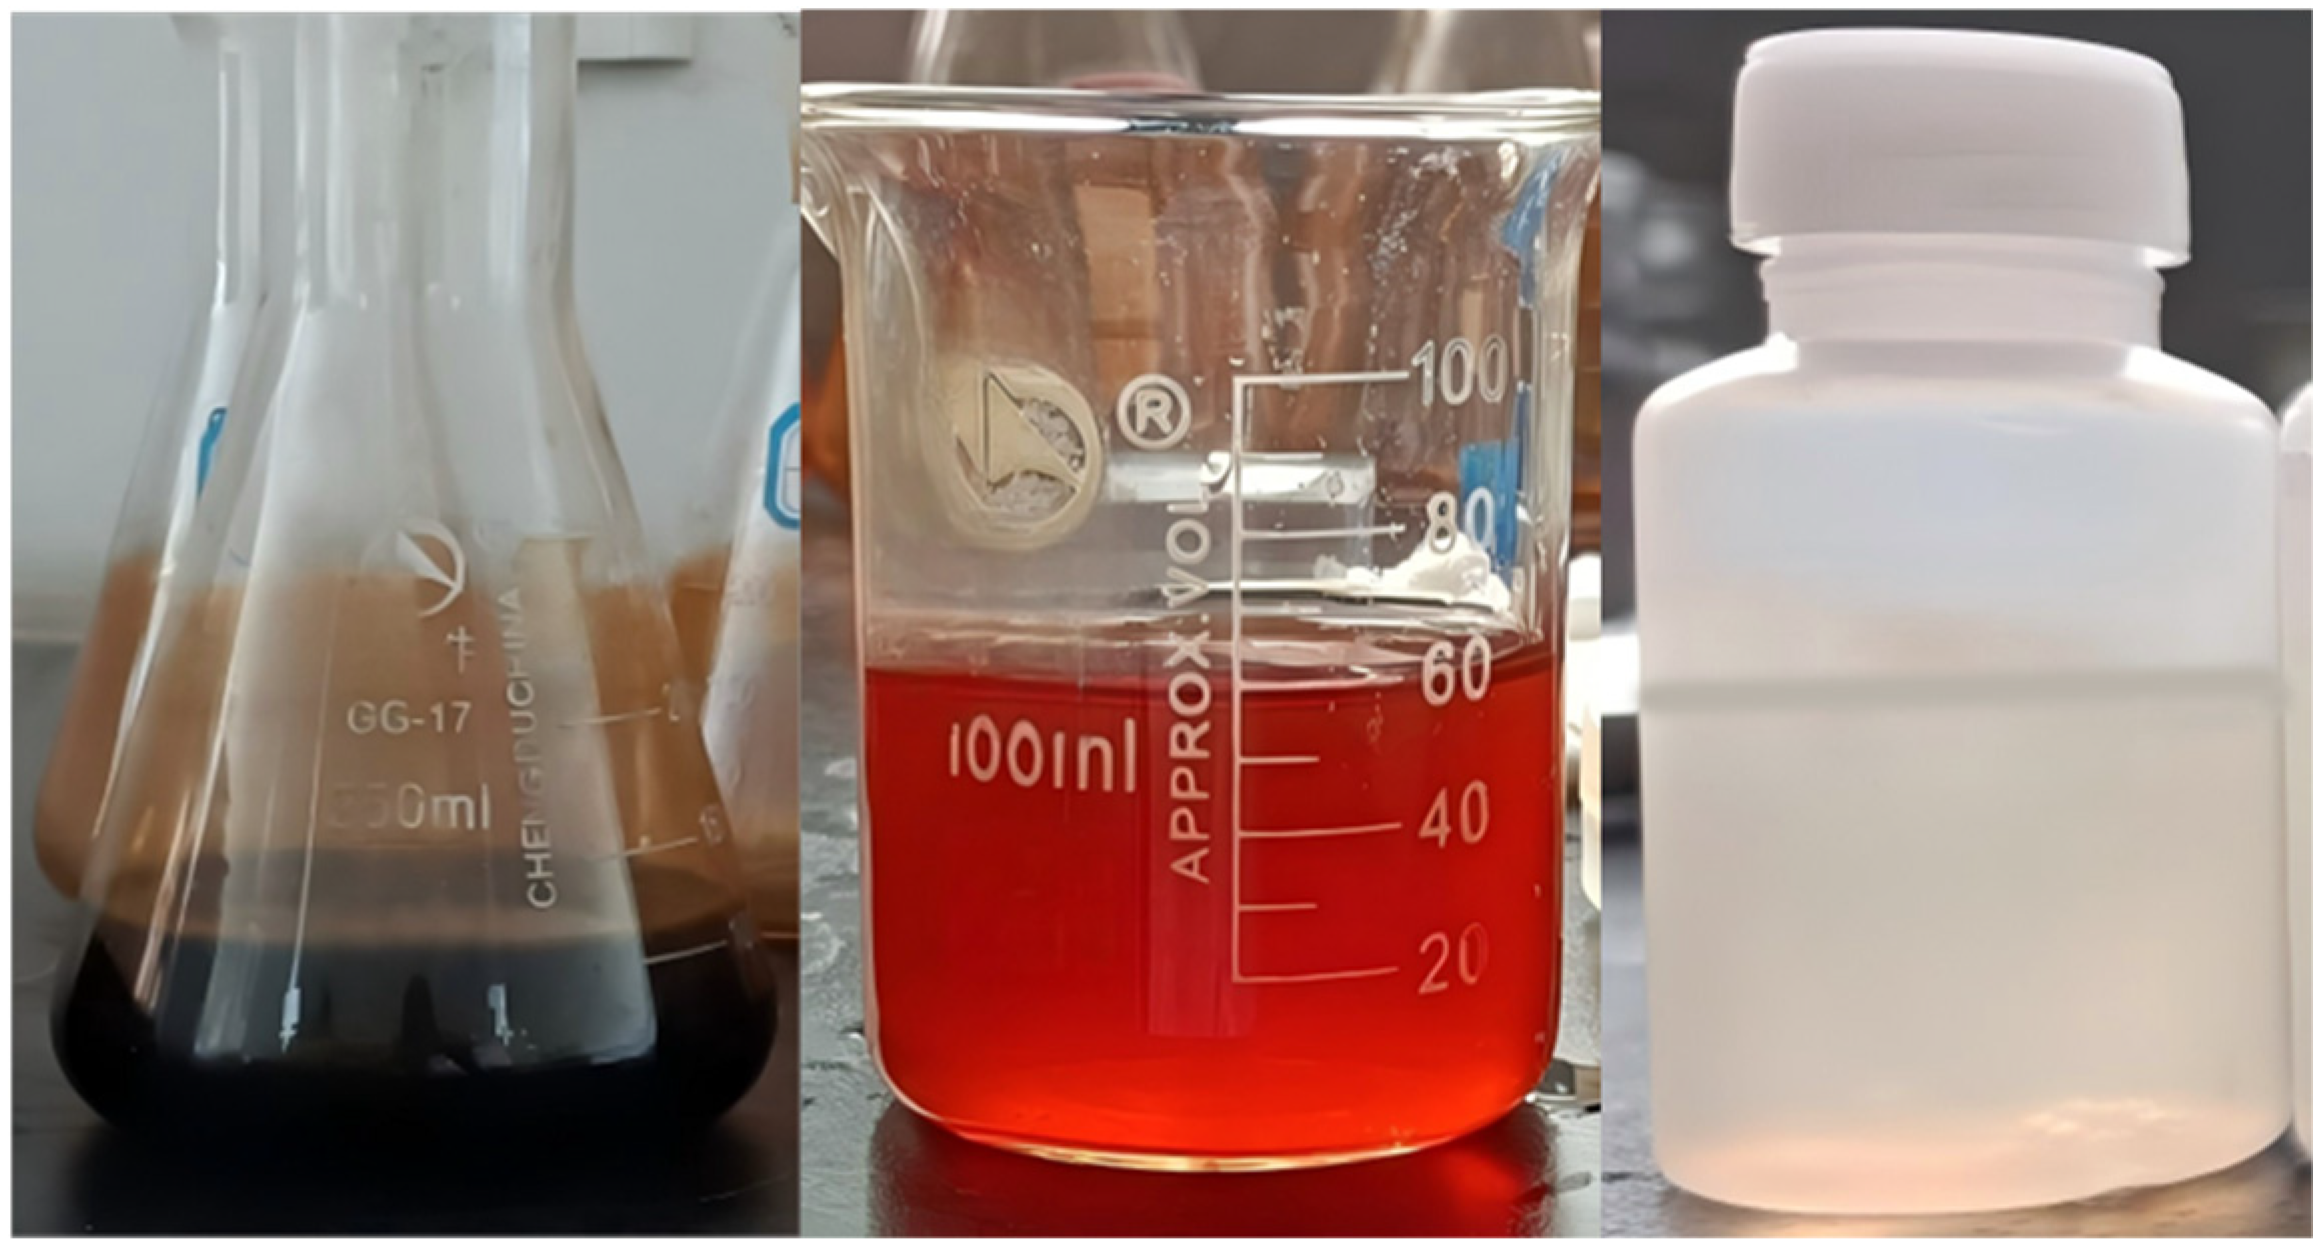
| Wastewater | Color | Dye Concentration (mg/L) | Chromaticity (Times) |
|---|---|---|---|
| Unpurified water | Reddish-black | 1500 | 80,000 |
| After iron–carbon micro-electrolysis treatment | Orange-red | 14.51 | 3000 |
| After coagulation and sedimentation treatment | Light yellow | 3.51 | 60 |
| Wastewater | Color | Dye Concentration (mg/L) | Chromaticity (Times) |
|---|---|---|---|
| Unpurified water | Reddish-black | 1500 | 80,000 |
| After iron–carbon micro-electrolysis treatment | Orange-red | 14.51 | 3000 |
| After Fenton oxidation | Light yellow | 3.14 | 40 |
Disclaimer/Publisher’s Note: The statements, opinions and data contained in all publications are solely those of the individual author(s) and contributor(s) and not of MDPI and/or the editor(s). MDPI and/or the editor(s) disclaim responsibility for any injury to people or property resulting from any ideas, methods, instructions or products referred to in the content. |
© 2025 by the authors. Licensee MDPI, Basel, Switzerland. This article is an open access article distributed under the terms and conditions of the Creative Commons Attribution (CC BY) license (https://creativecommons.org/licenses/by/4.0/).
Share and Cite
Sun, X.; Xu, J.; Kang, X.; Li, B.; Zhang, Y. Experimental Study on the Treatment of Printing and Dyeing Wastewater by Iron–Carbon Micro-Electrolysis and Combined Processes. Processes 2025, 13, 2147. https://doi.org/10.3390/pr13072147
Sun X, Xu J, Kang X, Li B, Zhang Y. Experimental Study on the Treatment of Printing and Dyeing Wastewater by Iron–Carbon Micro-Electrolysis and Combined Processes. Processes. 2025; 13(7):2147. https://doi.org/10.3390/pr13072147
Chicago/Turabian StyleSun, Xiaoxu, Jin Xu, Xiaorong Kang, Bing Li, and Yuanyan Zhang. 2025. "Experimental Study on the Treatment of Printing and Dyeing Wastewater by Iron–Carbon Micro-Electrolysis and Combined Processes" Processes 13, no. 7: 2147. https://doi.org/10.3390/pr13072147
APA StyleSun, X., Xu, J., Kang, X., Li, B., & Zhang, Y. (2025). Experimental Study on the Treatment of Printing and Dyeing Wastewater by Iron–Carbon Micro-Electrolysis and Combined Processes. Processes, 13(7), 2147. https://doi.org/10.3390/pr13072147