Abstract
Research on energy demand is advancing, with the addition of nanomaterials in anaerobic digestion increasing stability, accelerating hydrolysis, and reducing microbial inhibition. However, further research is needed to determine the mechanisms, ideal dosages, and long-term impacts. This work used continuous stir tank reactors (CSTRs) to experimentally examine the biocompatibility of iron oxide nanoparticles (Fe3O4-NPs) at a concentration of 75 mg/L at various organic loading rates (OLRs) of 0.3, 0.8, and 1.3 gVS/L.d (CSTRs). The efficiency of the reactors was observed by considering various parameters, such as pH, soluble chemical oxygen demand (sCOD), TVFA formation and degradation, total solids (TS), and volatile solids (VS) removal, as well as methane (CH4) generation. Hence, it was found that the reactor with added NPs (R1) yielded an optimum 725.9 mL/gVS of CH4 and this was achieved at the lowest OLR of 0.3 gVS/Ld. However, another reactor (R2, without NPs), exhibited more stabilized results, ranging from 372.8 to 424.4 mL/gVS at 0.3 to 1.3 gVS/Ld of OLR, respectively. Therefore, in R1, the maximum removal of sCOD, TVFAs, and VS was achieved at 90%, 74%, and 93%, respectively, as compared to R2.
1. Introduction
The exploration of renewable energy sources and the harnessing of anaerobic digestion (AD) technology have become considerable points of interest in research in the last few decades [1]. Moreover, AD technology offers global benefits such as a reduction in greenhouse gases, utilization of waste (organic fraction) for energy recovery, and nutrient-rich digestion for agriculture. The addition of nanomaterials in the AD process has brought advancements in process stabilization, accelerated hydrolysis, and methanogenesis, as well as providing resistance against inhibition-causing microbes, etc. The AD of organic waste is preferred and termed as the most efficient method over the other methods available to treat it [2,3]. AD is preferred because it yields bioenergy (i.e., biogas/methane) [4], nutrient-rich digest for agricultural purposes, and has simple environment-friendly operating procedures [5].
In the past, numerous methods, such as pretreatment of the substrate with chemicals [6], hydrothermal and ionizing radiation [7], physical size reduction by any mechanical means [8], and biological means [9], were adopted to stabilize further the AD process for better disintegration of complex organic waste into biogas.
AD is a multi-biological-stage method [10] to treat organic waste at mostly mesophilic [11] and thermophilic temperature ranges [12]. However, factors like pH, temperature, organic loading rates (OLR), and volatile fatty acid (VFA) concentration are pivotal considerations in the AD process [10]. Moreover, the AD process can be carried out in batch or continuous mode. In continuous mode, the AD reactors work on the fill-and-draw method, where the OLR plays a significant role in process stabilization and calibration.
Ferguson et al. [1] revealed that AD process instability could also be linked to sudden changes in feedstock composition or OLR. Hence, the optimization of OLR concerning the waste composition to produce optimum methane or biogas in reactors remained the main objective of the various studies around the world. Furthermore, an imbalance of OLR in the reactors yields a higher formation of volatile fatty acids (VFAs) and an ammonia concentration that exceeds the permissible limits reported by [13].
In the last decade, the addition of nanoparticles to the AD process has been much researched by researchers around the world [2,14,15,16,17] who have studied the impact of NPs on biogas and CH4 production in the AD process. Studies have reported that the addition of NPs in AD is presumed to be a biodegradation accelerator [16], CH4 or biogas-production booster [18], and cited as the pH buffer [19]. NPs possess a large surface area, self-assembly and dispersibility, high reactivity, greater specificity, and good biocompatibility. However, their unique properties are due to their small size and the chemical reaction of the nanoparticles that increases reactivity. They increase anaerobic digestion by enhancing microbial and enzyme activities and electron transfer. Conductive NPs allow direct interspecies electron transfer (DIET), which accelerates methane generation. Additionally, metal-based nanoparticles provide vital micronutrients that improve microbial metabolism, whereas others support the stabilization of pH, buffer redox conditions, and absorb harmful chemicals such as ammonia and sulfide. These benefits result in a more efficient, steady, and robust digesting process [20,21,22]. Microbial fluctuation control is considered a significant parameter for the success of AD treatment.
The NP addition to the AD process is cited as the cardinal property of biological treatments. These nanomaterials enter the cell membrane and assist the route across biological barriers between the distribution and metabolism and maximize the immune systems’ uptake and adsorption of the microbes in an oxygen-free environment [16]. Meanwhile, the authors of [23] reported that CH4 enhancements increased from 16.1% to 180% with the addition of Fe3O4-NPs. Wo et al. [24] cited that the addition of iron boosts electron transfer, the activity of bacteria, and methanogenesis, keeping digestion more efficient.
The objective of this study was to investigate the behavior of CSTRs in treating the organic fraction of municipal solid waste (OFMSW) in AD at different OLRs and supplement it with the optimized NP (Fe3O4) concentration. As a result, several operating conditions were designed to evaluate the influence of NPs in the continuous mode of AD, including CH4 formation, bacterial responses, and the removal of other chemical substances such as total solids (TS), soluble chemical oxygen demand (sCOD), and total VFAs. The statistical influence of NPs in the AD process was investigated, with an emphasis on the impact of NPs on CH4 production at various concentrations.
2. Materials and Methods
2.1. List of Materials and Instruments
Salts such as Fe (ii) and Fe (iii), ferrous chloride tetrahydrate (FeCl2·4H2O), ferric chloride hexahydrate (FeCl3·6H2O) were used as the precursor materials for the synthesis of nanomaterials, whereas sodium hydroxide (NaOH) was used as the pH controlling buffer and was obtained from Dae-Jung Chemicals & Materials Co., Ltd., Republic of Korea. Zeta potential instrument (Malvern Instruments Ltd., serial number: MAL-1,135,362) was employed for analysis of zeta potential, size distribution and composition of materials and atomic force microscopy (AFM).
2.2. Optimization Methods for AD Reactors
The optimized concentration of 75 mg/L of iron oxide (Fe3O4) was used in this study at mesophilic conditions (37 ± 1.5 °C) in CSTRs; a schematic diagram is shown in Figure 1. Stainless steel reactors with automated control panels were used. This concentration of NPs was optimized in our previous study using different concentrations and the optimum CH4 generation was achieved at 75 mg/L [19]. This approach was adopted because several studies have reported the positive impact of NPs on bioenergy generation in the AD process. However, NPs may function as catalysts or promote the growth of microbes involved in the AD process. Additionally, NPs can accelerate the AD system, resulting in increased generation of biogas. This helps in breaking complicated organic molecules into simpler chemical compounds that bacteria can digest [25,26].
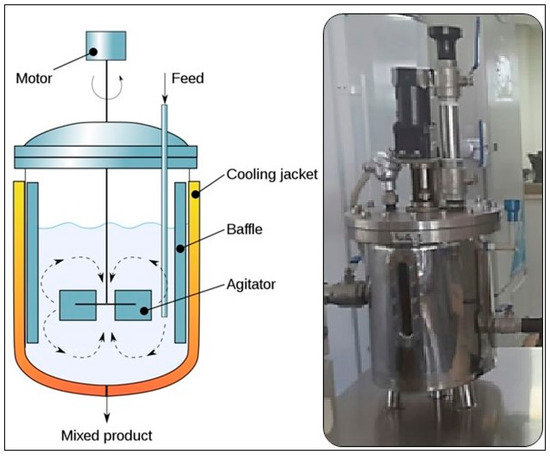
Figure 1.
A schematic view of the CSTRs used in this study.
During the experimentation, the required temperature of the reactors was maintained by circulating water through a water jacket. A mixture of cooked and uncooked food waste (FW) was utilized as the substrate for this study, while the effluent from a buffalo dung biogas plant was added as the inoculum to initiate microbial growth. The characterization of FW and inoculum was carried out by conducting analytical tests, such as total solids (TS), VS, soluble chemical oxygen demand (sCOD), and total volatile fatty acids (TVFAs), according to the standard methods [27]. The characterization of both substrate and inoculum was reported in a previous study by [21]. The collected FW was shredded manually and then mechanically using a chopper (AG-3044 Deluxe Chopper). The results presented in this study are the average of two runs of each bioreactor (R1 and R2).
The collected inoculum and prepared substrate (FW) were stored at 4 °C before use, as [28] discussed. Furthermore, pH and temperature were monitored regularly and electrochemically measured with an Ingold pH electrode (Zhengzhou city, Henan, Taiwan) and thermometer (GH Zeal LTD, London, UK). Sodium hydroxide (NaOH, Daejung, Republic of Korea) was used as a neutralizer to raise the pH during the process. VFAs, sCOD, and microbial analysis were determined following the procedure cited by [29,30].
2.3. Synthesis of Fe3O4 NPs
The magnetite nanoparticles were prepared using the chemical precipitation method [31,32]. In the first step, the stock solution of FeCl2. 4H2O and FeCl2. 6H2O with 0.1 M, respectively, were added and mixed in 10 mL of ultrapure water. Then, the homogenized mixture was allowed at 85 Co for 15 min on the magnetic stirrer hot plate. Later, 0.5 M of NaOH concentration was added until the pH of the solution reached the range of 9–12. The mixture was continuously stirred during the process until the precipitate formed. The resulting precipitates were collected and washed three times with ultrapure water and ethanol to remove the impurities of synthesized nanoparticles. Finally, the prepared nanoparticles were dried in an oven at 150 °C for 4 h. The characterization of Fe3O4-NPs was carried out using UV–visible spectroscopy (Shimadzu, Kyoto City, Japan, UV-199i), transmission electron microscopy (TEM) (JEOL, Musashino, Tokyo, Japan, JEM 2100) and atomic force microscopy (SPM-8100FM, Shimadzu, Kyoto, Japan).
2.4. Reactors Working Mechanism
In this study, the reactors were loaded with three organic loading rates (OLRs), i.e., 0.3, 0.8, and 1.3 gVS/L.d, to monitor the behavior of the reactors with Fe3O4-NPs with a concentration of 75 mg/L (R1) and without NPs (R2). The volume of each reactor was 10 L, and the working volume was set at 7 L during the experiment. The volume of CH4 generation was calculated daily based on the downward displacement of water. The acryl-based 15 L gas jars were prepared for the gas measurement. Both the reactors started loading from 0.3 to 1.8 kgVS/L.d, and the whole process was carried out for 120 days. The reactors were operated using the fill-and-draw method. Every day, diluted substrate was added, and digested slurry was removed from the reactors for the analysis of TS, VS, VFAs, sCOD, and pH measurements as described in [33].
2.5. Statistical Analysis
The experimental results were calibrated and measured by the two different statistical tools. Root mean square error (rMSE) and coefficient of determination (R2) were adopted to indicate the goodness of fit using a prediction model as reported by [34]. Karidio et al., 2023 [35] stated that the value of rMSE should be minimal and R2 must be high for better model performance as indicators. The statistical analysis was performed depending on the overall average daily reading affected by the different OLRs using Microsoft Excel at the significance level of p < 0.05.
3. Results and Discussion
3.1. Characterization of Fe3O4 Nanoparticles
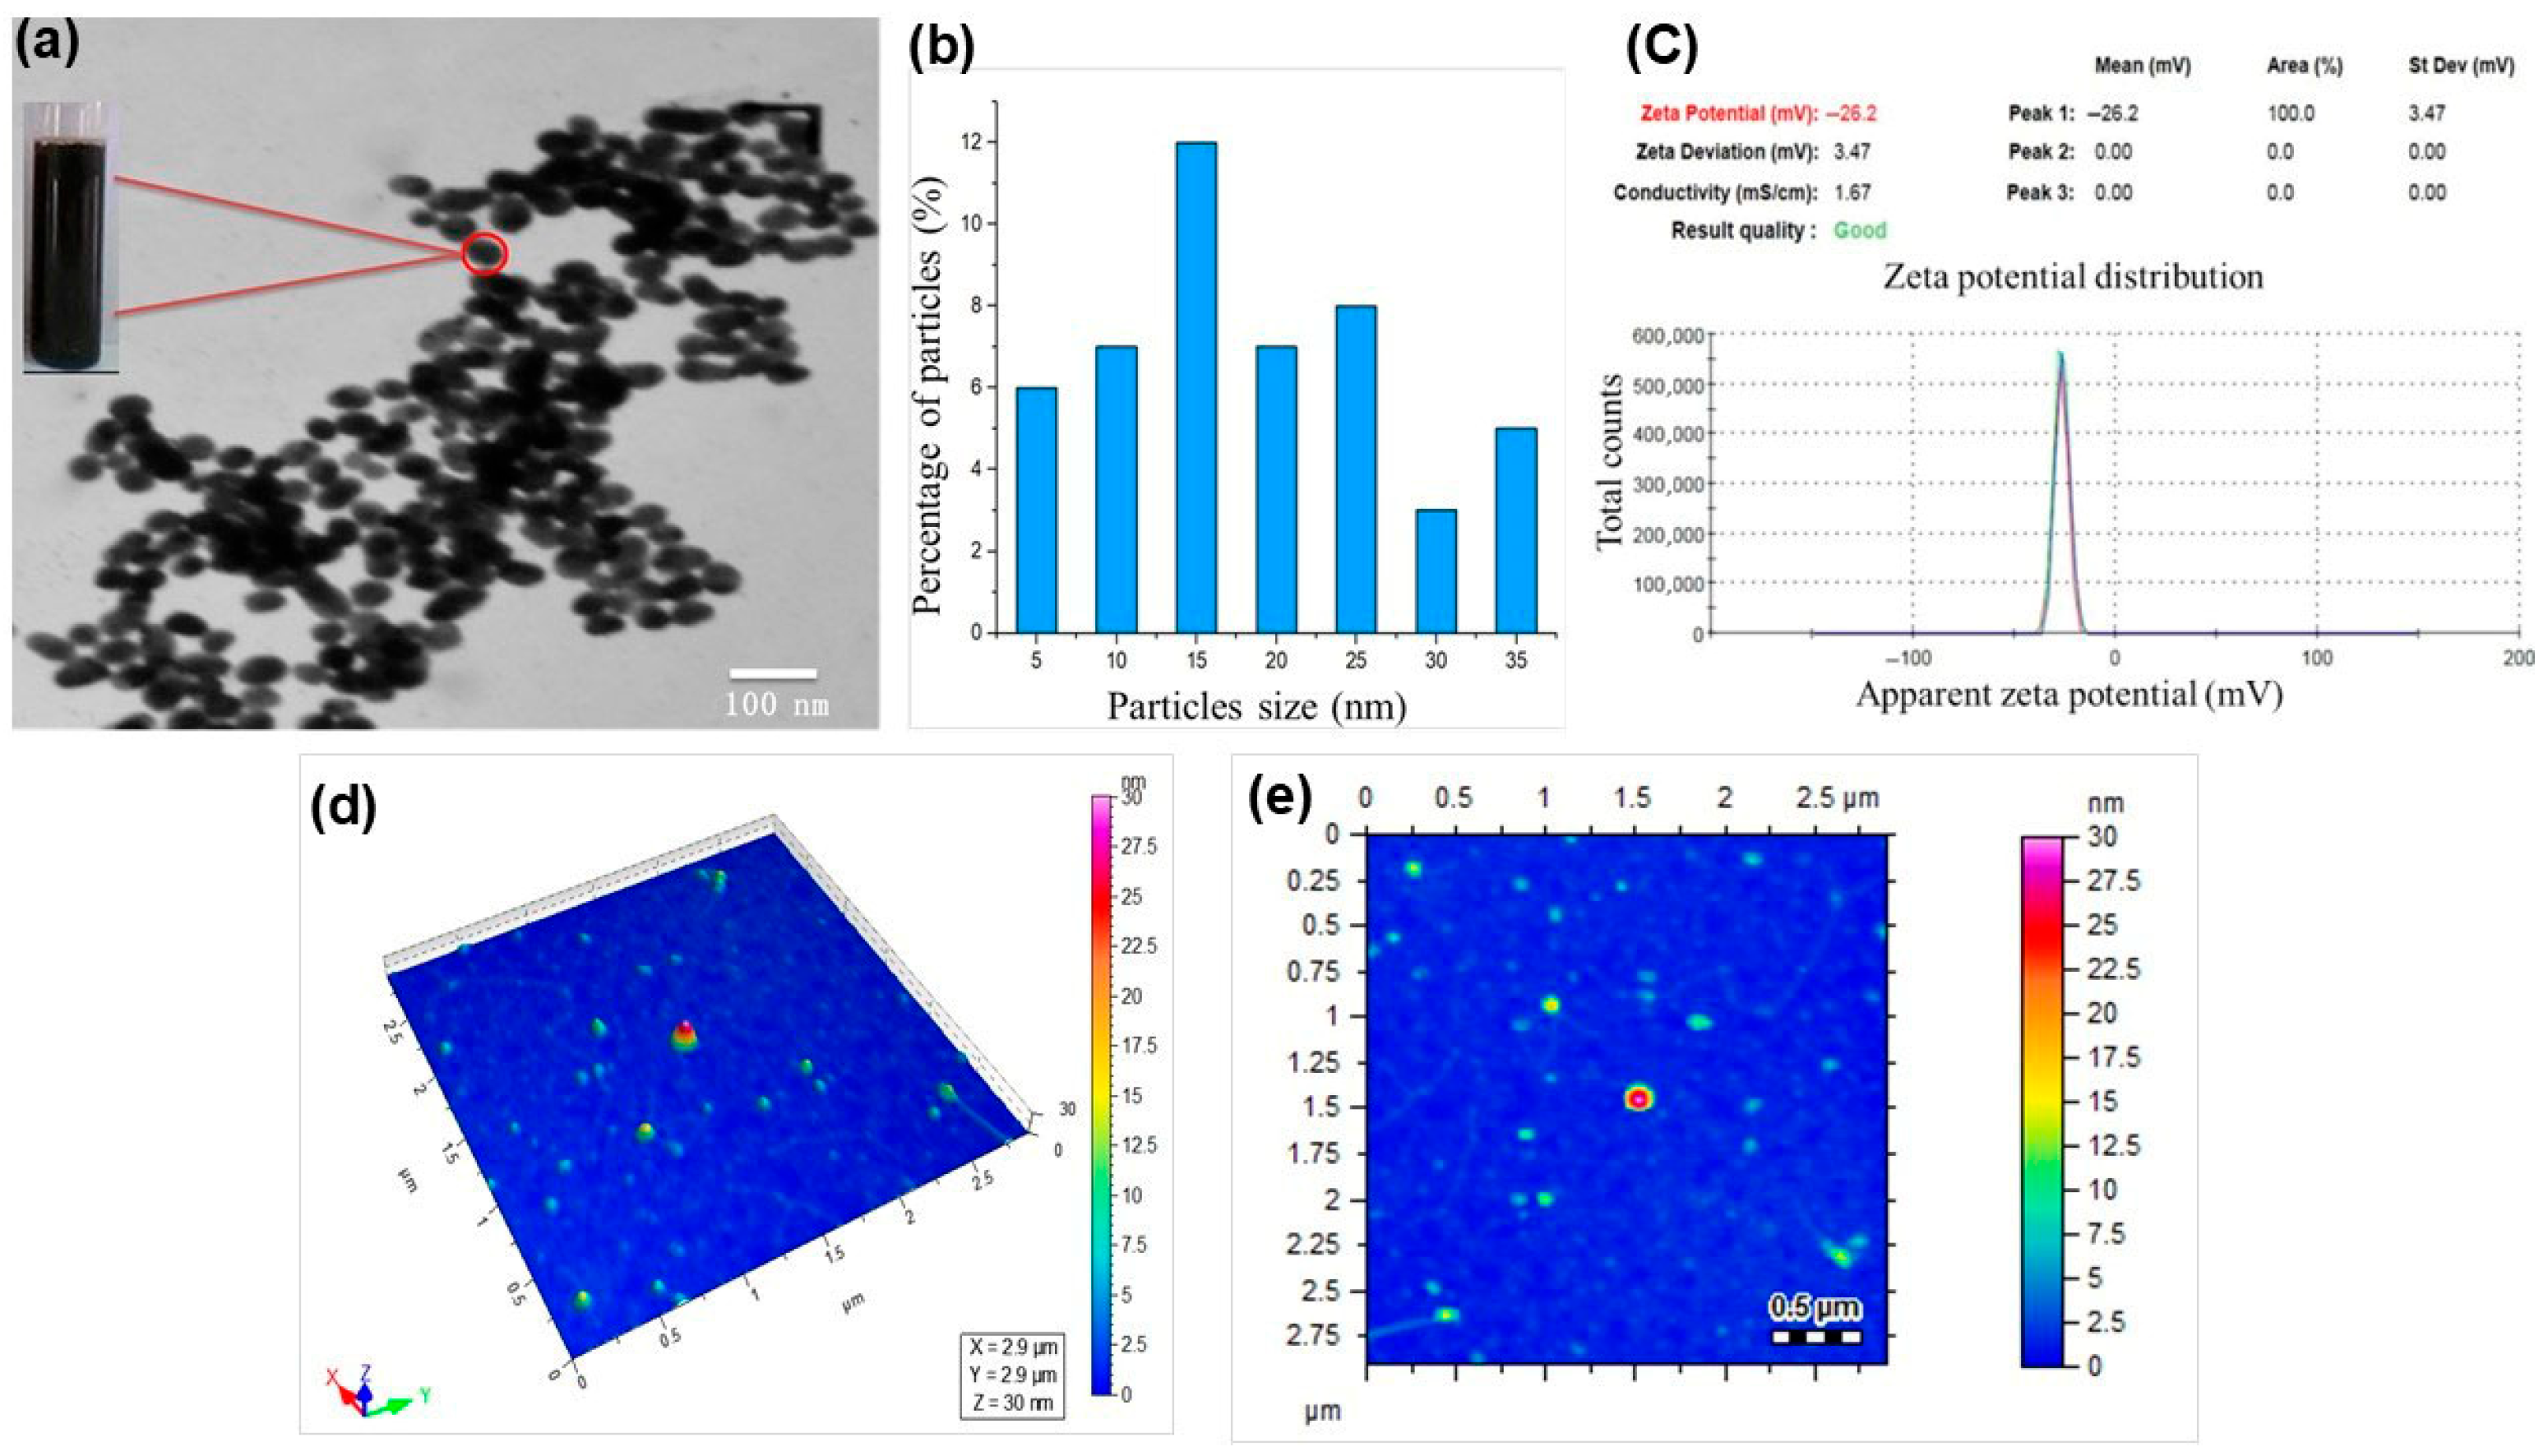
The formation of Fe3O4 Nanoparticles was confirmed for their size and morphology using various analytical techniques. TEM was used to confirm the size, crystallinity, and spherical morphology of the synthesized Fe3O4-NPs, as shown in Figure 2a. Most of the particles appeared spherical. Also, some particles were agglomerated due to the magnetic property of the nanoparticles. The size of the Fe3O4-NPs was observed in the range of 10–40 nm [36]. A histogram of particles to determine the size distribution of the nanoparticles is presented in Figure 2b. Most of the particles were observed in sizes ranging from 15 to 25 nm.

Figure 2.
The characterization results of Fe3O4 NPs; (a) TEM, (b) particle size distribution, (c) zeta potential (d), and (e) heatmaps of particle sizes.
Zeta potential analysis was carried out for confirmation of the stability and surface charge of the synthesized Fe3O4-NPs, as presented in Figure 2c. However, the current study revealed that Fe3O4-NPs are more stable with a zeta potential value of −26 mV. The stability of the nanoparticles was measured at the optimal line between stable and unstable particles, as generally categorized as either higher than −26 mV or lower than −26 mV. The previous study reported that more stable nanoparticles were synthesized with the zeta potential value of −26 mV. As a result, the particle is more stable and has a strong negative surface charge [37]. AFM contour imaging in Figure 2b,c was also conducted for the size, geometry, size distribution, and morphology of the synthesized Fe3O4 NPs. The profiles of Fe3O4-NPs range in height from 10 to 30 nm. The measurement principles of AFM are customized to obtain data that is usually higher than the data of the x, y plane [38]. The acquired results revealed that the particles were spherical in shape and dispersed on the x and y planes. Most of the particles were agglomerated due to the magnetic properties of the nanoparticles.
3.2. Impact of OLR on Methane Generation
Methane contributes to biogas generation by 50–70% of total volume [16]. Furthermore, the OLR decides what volume of organic waste can be efficiently treated in reactors [39]. Moreover, the OLR streamlines the biological conversion capacity and, ultimately, biogas generation [40]. In the literature, various studies have used different OLRs to stabilize the biodigesters to generate maximum energy. Calzada et al. [39] stated that with a low OLR, the biodigesters operate inefficiently, whereas a high OLR is more susceptible to destabilization and ultimately leads to bioreactor failure. For example, the authors of [41] utilized OLRs of 3.3–4.0, 1.0–4.0, and 1.7–15 gVS/Ld, respectively. Whereas ref. [40] adopted the same strategy to increase the OLR gradually from 1.5 to 3.0 and 1.0 to 5.0 gTS/Ld, respectively. Wang et al. [42] concluded that treating FW in a CSTR at 1.0 to 2.5 gVS/L.d of OLR showed stable performance.
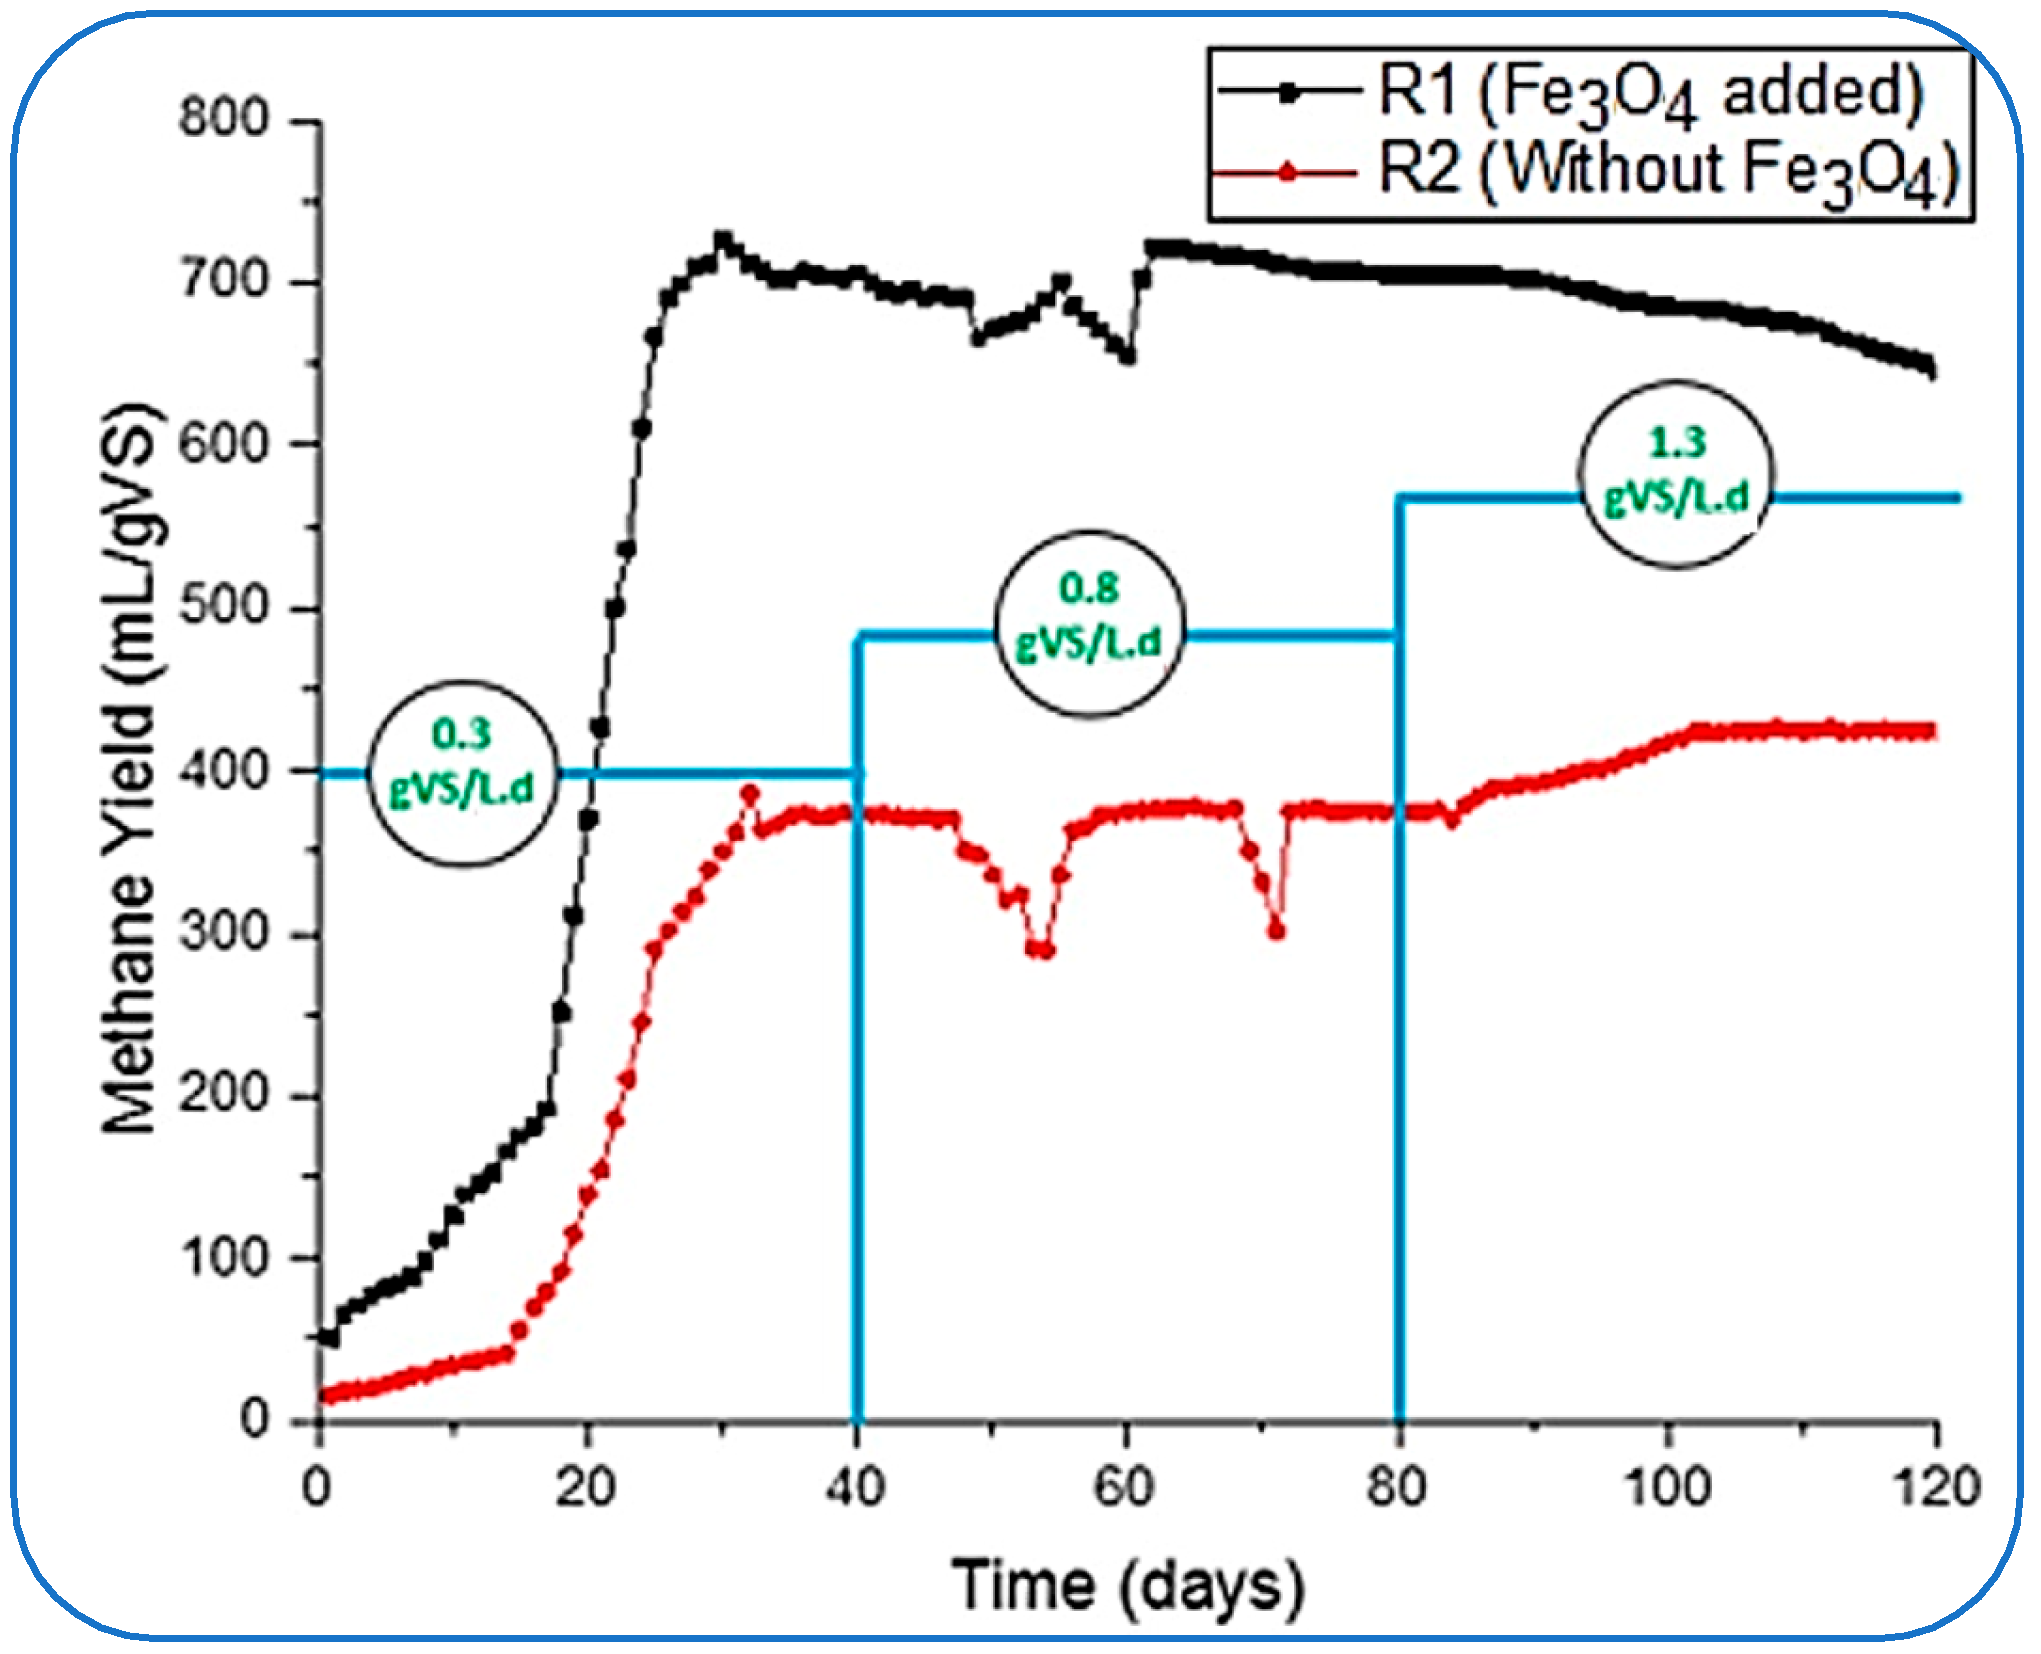
In this study, the same process was followed, and we started loading reactors with the lowest OLR of 0.3 and gradually increased it to 1.3 by adjusting 0.8 gVS/Ld as an intermediate concentration of substrate inside the reactors. During this variation in OLRs, the concentration or the dosage of NPs (Fe3O4) was kept constant for 120 days. The impact of the addition of NPs on CH4 is given in Figure 3. Two reactors, R1 (with the supplementation of Fe3O4-NPs) and R2 (without NP loading), were run simultaneously to investigate the impact of NPs with different OLRs and the activities that took place in the conventional (R2) reactors.
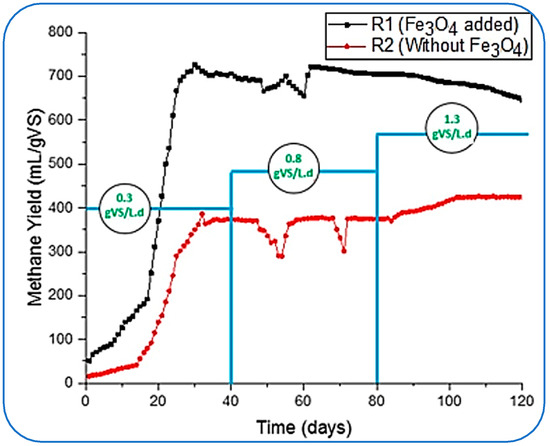
Figure 3.
Specific CH4 yield flow at varying OLR.
Figure 3 shows that reactor R1 started with a greater CH4 yield than R2; the initial yield of CH4 from both reactors was 51.3 and 15.7 mL/gVS, respectively. The NPs stabilized the AD conditions inside the reactor and started producing more than three times the methane yield produced by the R2 reactor. Furthermore, R1 took under 20 days to reach its ultimate gas production of 725.9 mL/gVS.
Meanwhile, R2 produced a maximum CH4 of 373.6 mL/gVS on the 39th day at 0.3 gVS/Ld. However, this yield (by R1) was much higher than the results reported by [43,44] for treating FW. These studies concluded the optimal yield of methane rates as 484.9 ± 38.5 mL CH4/g VS, 371 mL/g of VSadded, 455 mL/gVS, and 396 mL/g VSadded, respectively. However, in this study, a mild destabilization in the reactors was observed when the organic loading was changed from 0.3 to 0.8 gVS/L.d after 40 days. The methane yield in R1 dropped to its lowest rate of 655 mL/gVS after achieving optimal production on the 60th day of the process. This imbalance in the performance of R1 might be caused by the increased toxicity to the methanogens, reduction in enzymatic activity, hampering direct interspecies electron transfer (DIET) between microorganisms, and inhibitory impact [25,26]. Likewise, the CH4 yield rate became unstable and achieved 300 mL/gVS in the R2, and this fluctuation was detected from the 50th to 70th day of digestion.
With the decrease in methane production, the pH of the reactors dropped to a minimum of 5.60 in reactors R1 and 5.51 in R2. The pH was then adjusted by flushing the dropwise 2.0 M sodium hydroxide (NaOH) in the reactors to bring it up to the required range of 6.5 to 7.5, as recommended by [43,44] as successful and stable conditions for AD.
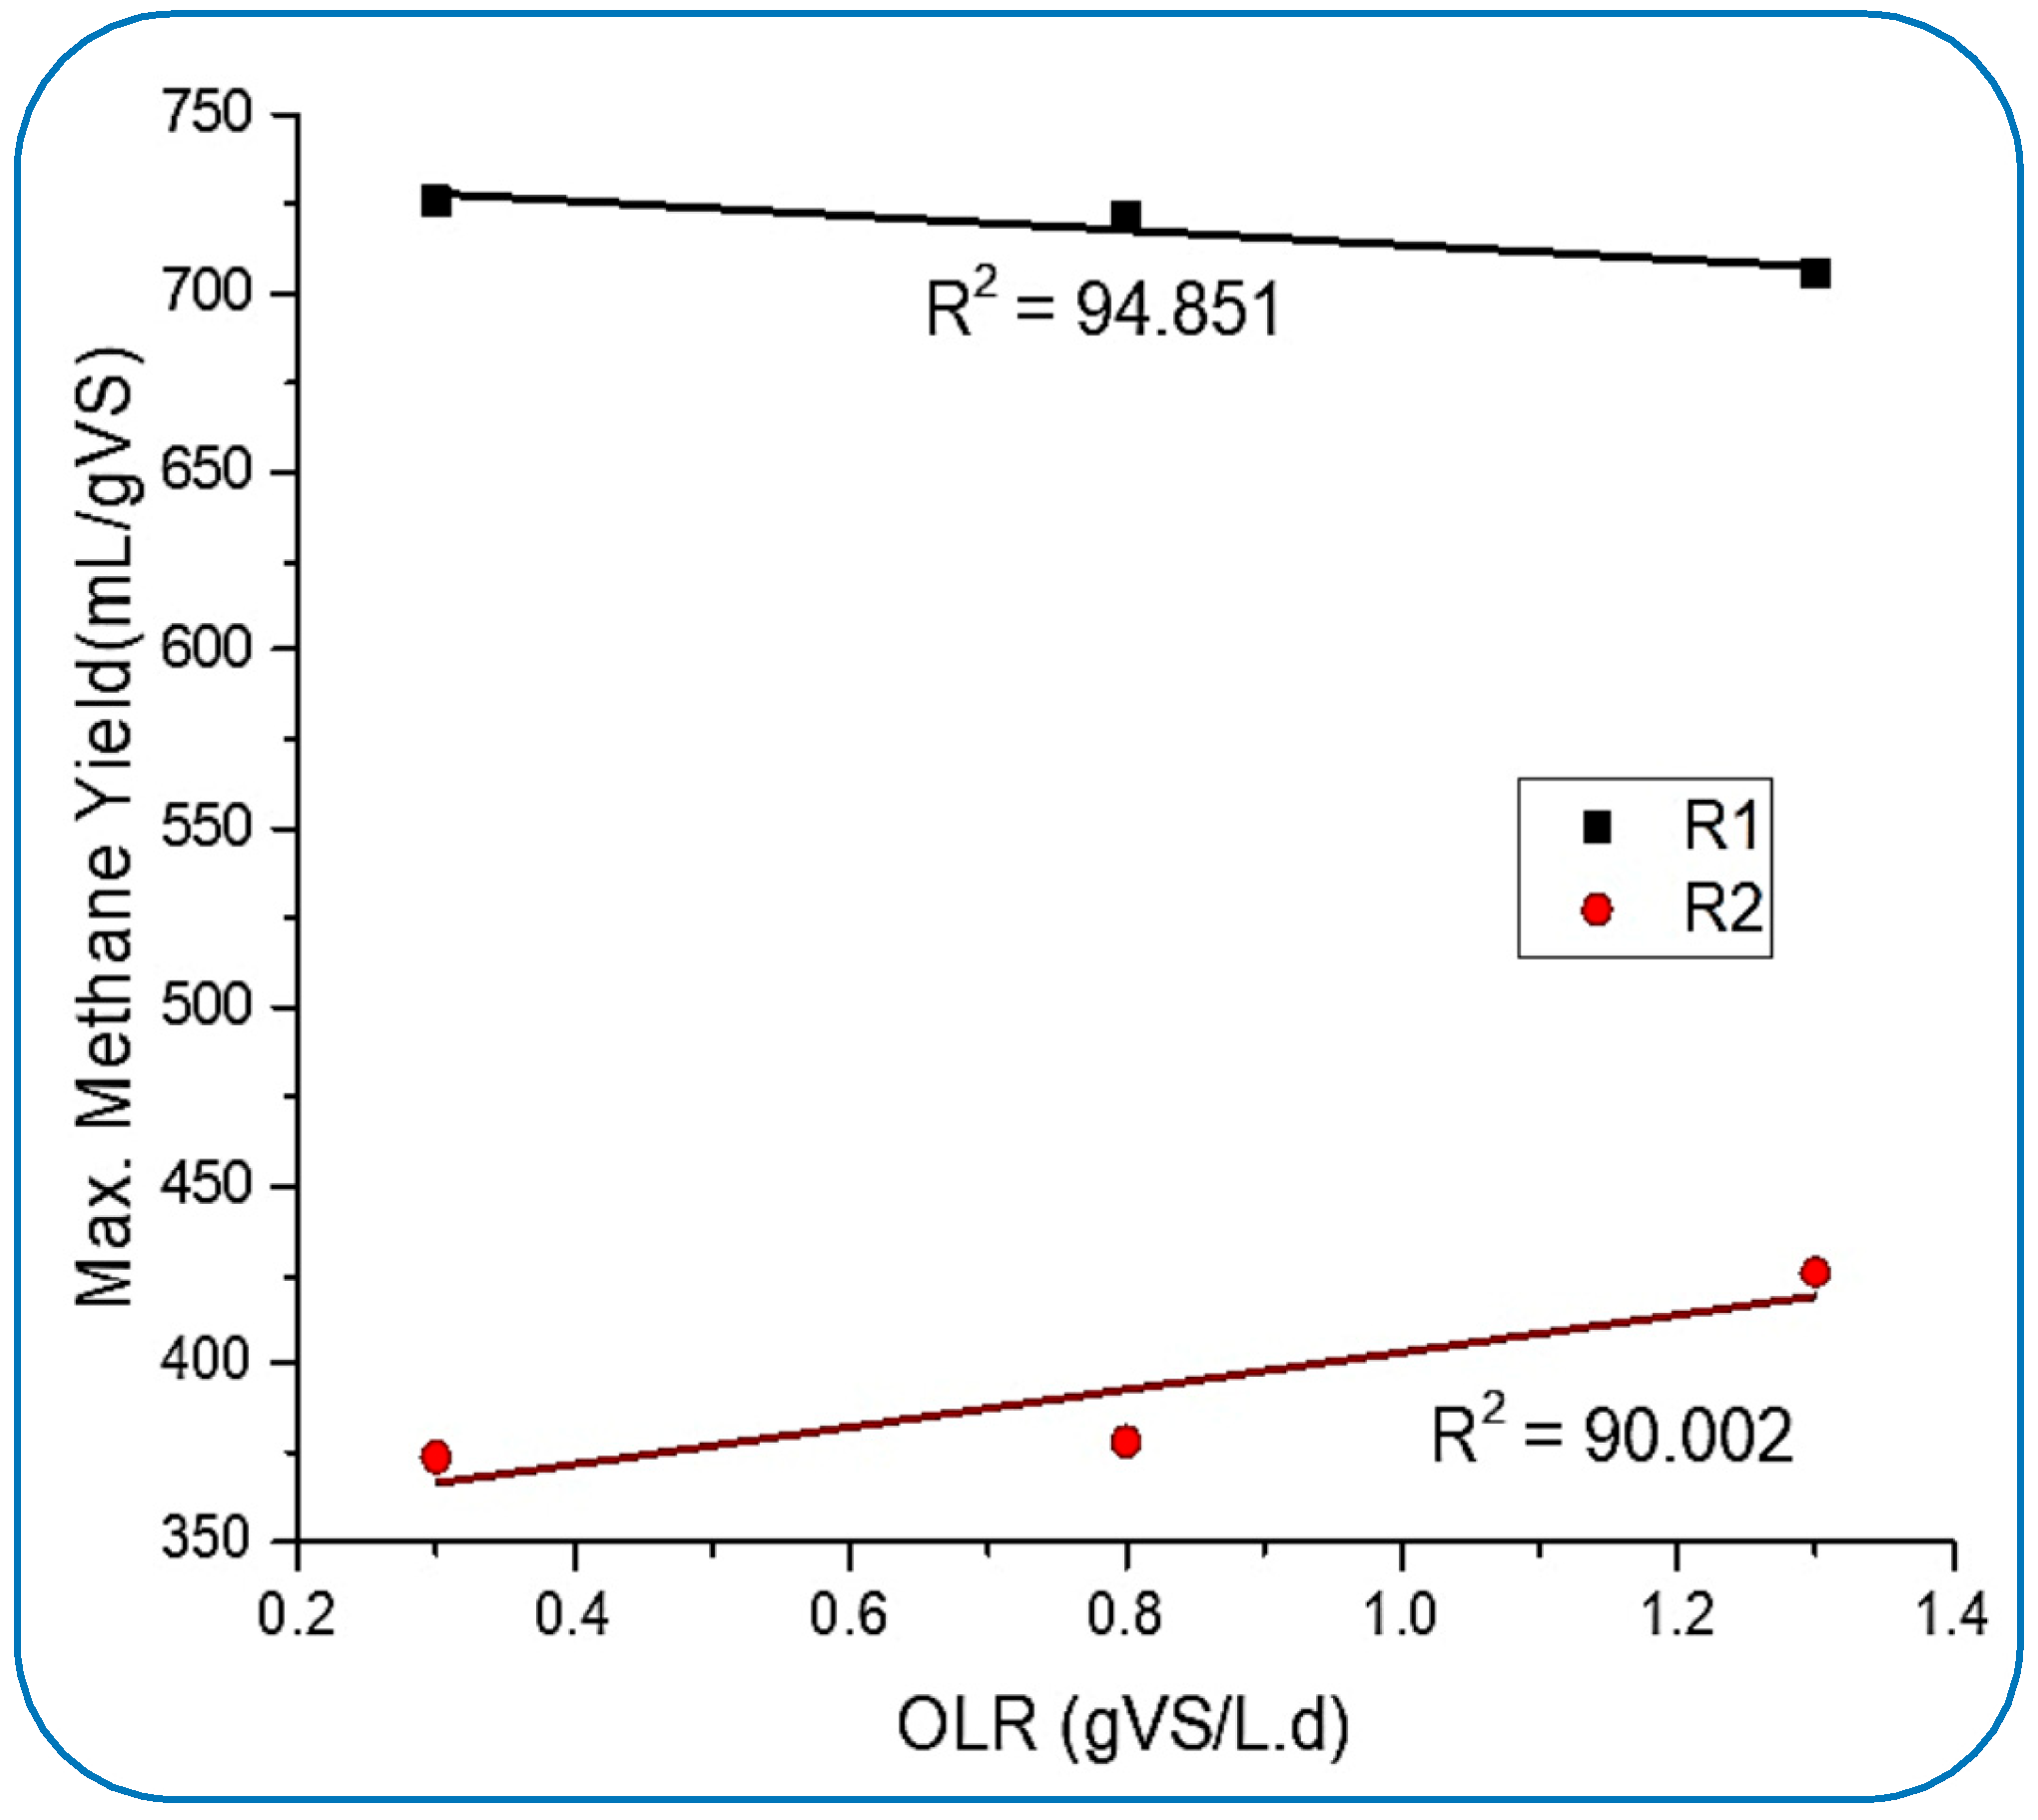
From Figure 4, it can be perceived that the production rate of methane in R1 was slowly going down and reached 645.4 mL/gVS.d from 725.9 mL/gVS, which was achieved at 0.3 gVS/Ld of OLR. Meanwhile, R2 showed stable CH4 production. These results very much follow the supposition made by [45]. The optimum CH4 yield in R2 was 424.4 mL/gVS.d, which was achieved on day 102 of digestion when the OLR was 1.3 gVS/L.d. However, R1 was found to be not so efficient in stabilizing the maximum yield rate, but it produced about 52% higher CH4 yield than the maximum produced by R2. This suppression of methane yield in R1 could be because of the insufficient balancing of the microbe-to-NP dosing ratio for optimum conditions inside the reactor, which was achieved at 0.3 gVS/L.d. There might be another factor, such as the continuous activities inside the tank (R1) exhausting the NPs and ultimately impacting the chemical properties.
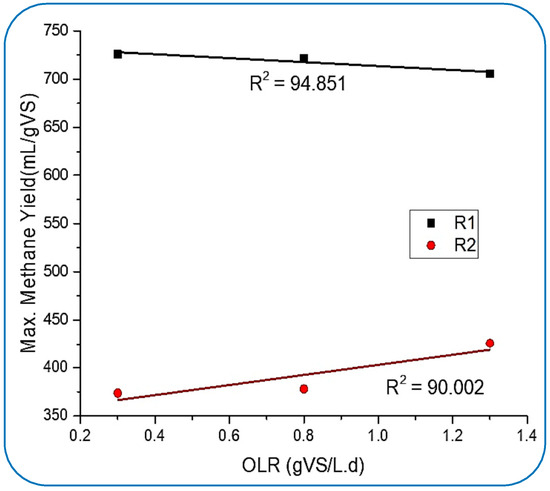
Figure 4.
Influence of OLR on methane yield behavior.
3.3. Impact of pH on CH4 and TVFAs Generation
Anaerobic-digestion-process stability is directly associated with the total production of volatile acids (TVFAs) and stabilization produced during the hydrolysis step of the AD process [16]. The imbalance of pH inside reactors causes ammonia inhibition [46,47]. At the beginning of digestion, the concentration of TVFAs was maximum, and the pH started to go down, relatively.
From Figure 5a, it can be witnessed that the pH dropped and reached about 5.5 in R2 on the 17th day, while a mild drop in pH was also observed in R1. In R1, the destabilization of pH was not as high as it was in R2. Meanwhile, the concentration of TVFAs was maximum at this stage of the digestion, at 0.3 OLR. The TVFA concentrations in both reactors were recorded as 1822.6 and 2878.4 mg/L in R1 and R2, respectively (Figure 5b).
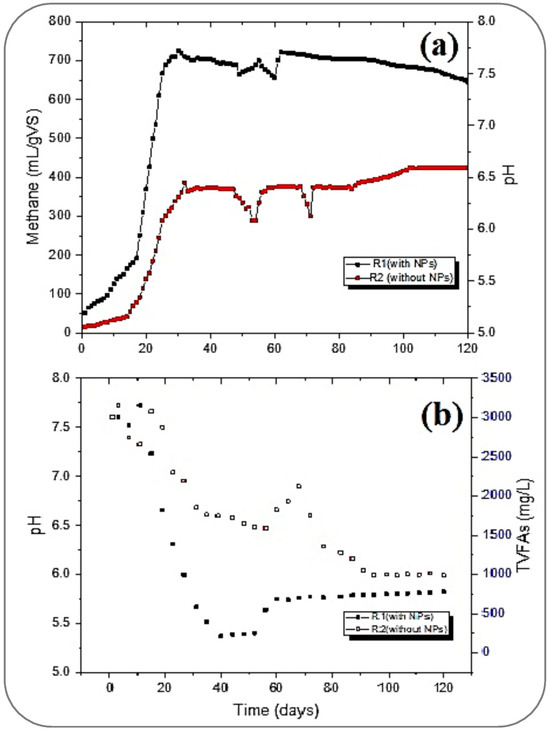
Figure 5.
Influence of pH on methane (a) and TVFA generation (b).
The pH drop was more rapidly recovered in R1 than in R2. Meanwhile, the CH4 yield in both reactors reached the maximum generation. At this stage of stabilized generation after the 30th day, the generation of CH4 in R1 and R2 was in the range of 700 to 725.9 mL/gVS and 361 to 373.3 mL/gVS, respectively. Hence, the pH was at this stage in the range of 6.6 to 7.6 in R1. The pH was also well adjusted in R2, which is required for well-stabilized conditions for any successful digestion, as suggested by [48] and further cited by [43,44]. From Figure 5b, it can be seen that the highest CH4 (725.9 mL/gVS) in R1 was achieved at 0.3 OLR with maximum bioconversion of TVFAs, which were less than 500 mg/L.
While increasing the OLR from 0.3 to 0.8 gVS/Ld after stabilizing the methane yield and pH (around 7.5) with the maximum conversion of TVFAs, the accumulation of TVFAs was observed again. Meanwhile, in R2, the pH drop caused an increase in the concentration of TVFAs (from 1589.6 to 2122.4 mg/L) inside, and the pH drop subsequently dropped to less than 5.5. A further drop in pH in both reactors was stopped by flushing 2.0 M NaOH solution dropwise to assist with the required range. Thus, pH was again stabilized, and a homogeneous yield of CH4 was obtained before switching to the 1.3 gVS/Ld OLR after the 80th day. At this OLR, the pH was maintained, and an improvement in CH4 yield was achieved in the R2, from 373.6 to 424.8 mL/gVS, by increasing the OLR from 0.3 to 1.3, respectively. Moreover, R1 slowly reduced its maximum yield by increasing the OLR.
Table 1 gives the final digestate analysis on the 120th day. The TVFA concentration in the reactors was well within the range reported by Nagao et al. [43]. His study suggested a concentration of TVFAs in the range of 500–600 mg/L for a well-stabilized AD process in a CSTR. This study resulted in a final concentration of the bioreactor of 500–800 mg/L, which is well in agreement with the results presented by [43].

Table 1.
The final digestate analysis of both biodigesters (with standard deviation, SD).
3.4. CH4 vs. Biogas Content
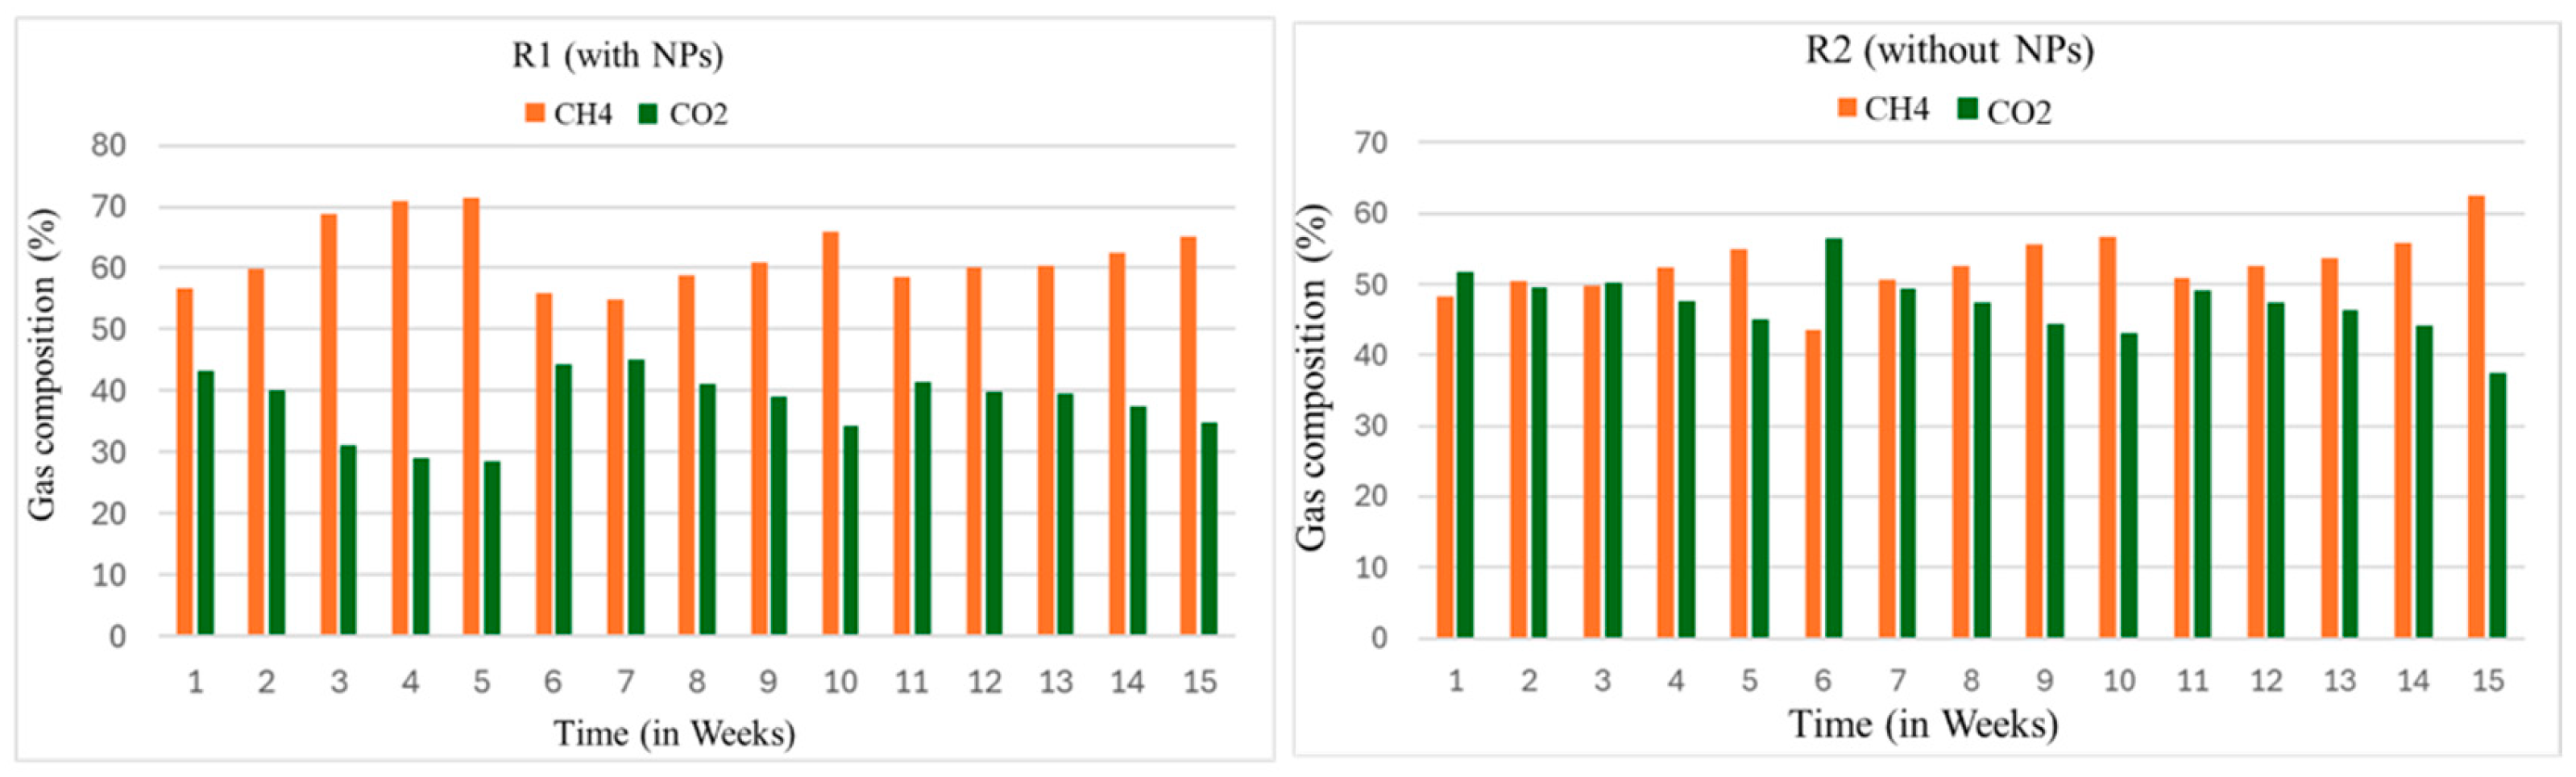
The CH4 content in the biogas varies due to the substrate type, composition, and time of the digestion, as shown in Figure 6. The impact of NPs on the AD process to yield biogas versus the CH4 portion was studied. For this purpose, to analyze the composition of biogas, the biogas samples were directly taken from the reactors (R1 and R2). The gas chromatography (GC) model (PACKARD model 437A) was used to analyze the samples.

Figure 6.
Weekly gas chromatographic (GC) analysis of biogas of the reactors.
The samples from each reactor were taken once a week. This analysis was carried out right from the first week to the 15th week of the digestion process. In the first week, GC analysis showed that the CH4 content was about 56 and 47% in the R1 and R2 reactors, respectively. The content of methane in the R1 at this stage agreed with the results reported by [49]. Their study cited maximum CH4 content in the whole search, ranging from 57 to 69%. Furthermore, ref. [50] utilized Fe to improve the digestibility of the process. He reported the CH4 content as 60–65%.
3.5. Behavior of sCOD Removal and TVFAs
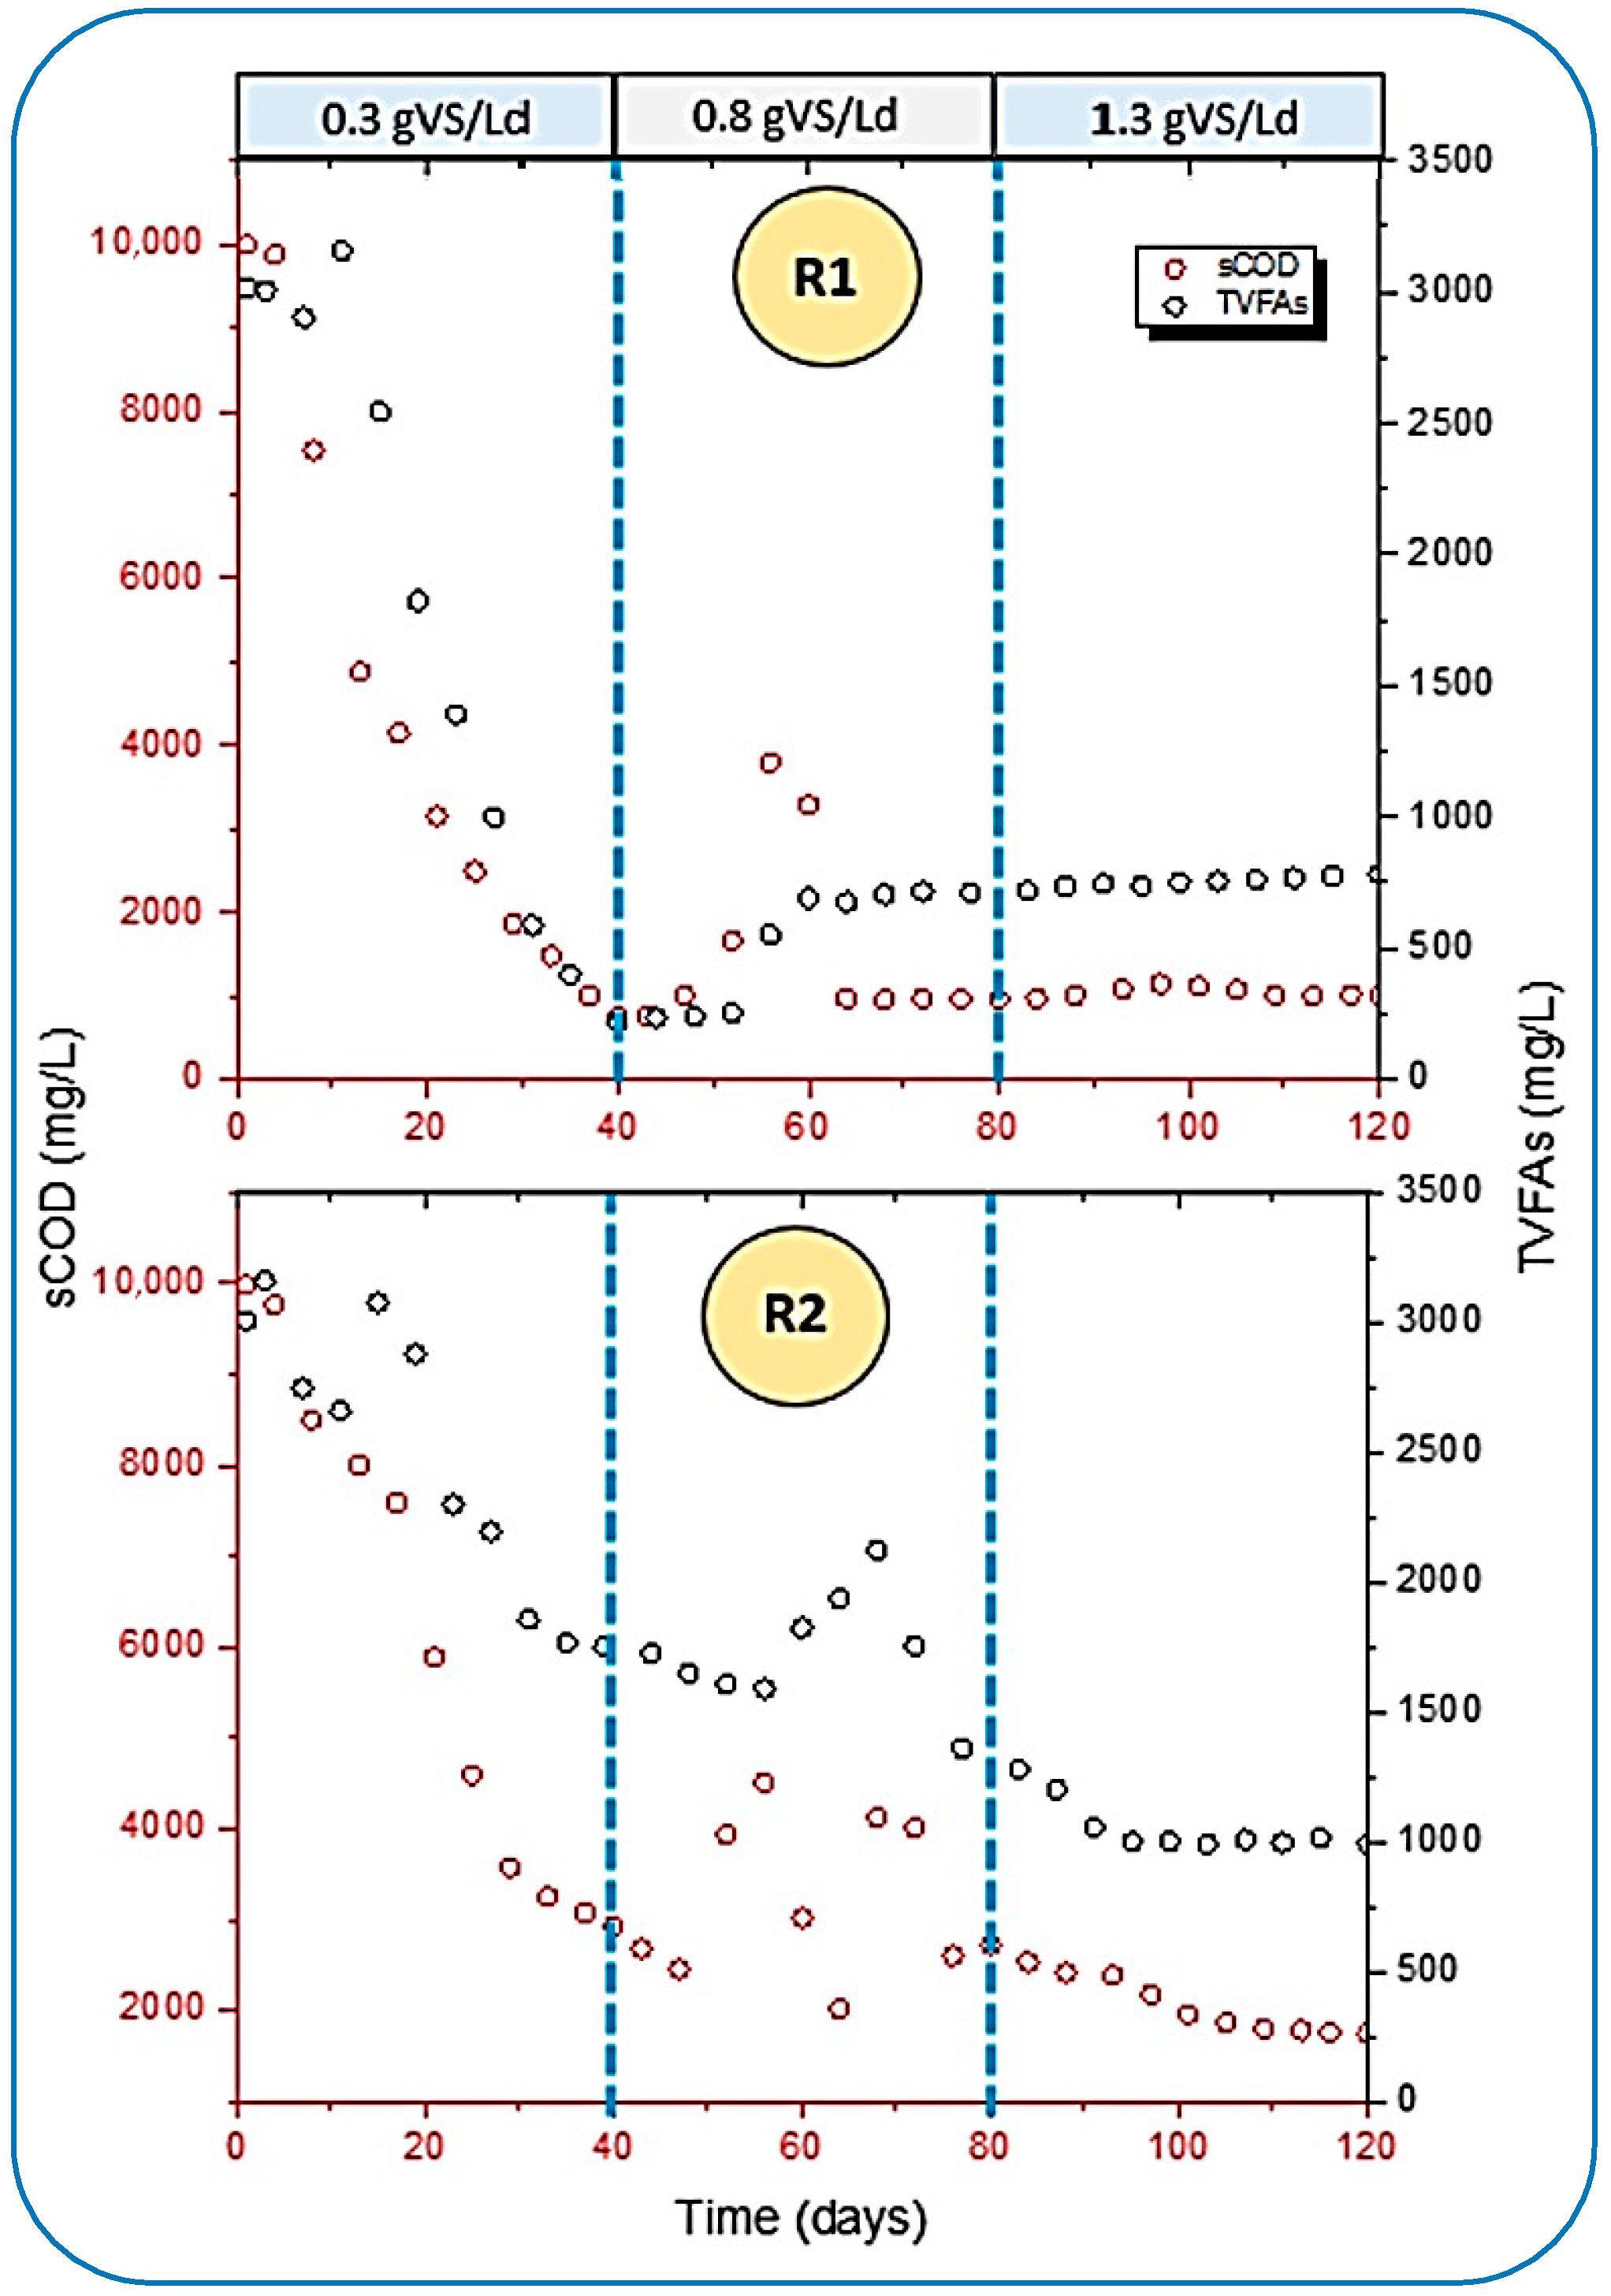
The performance of both reactors was further compared and analyzed by the removal rate of soluble chemical oxygen demand (sCOD) and TVFAs. From Figure 7, a higher rate for both was observed in R1, whereas R2 yielded slow degradation rates. A study conducted by [45] reported that mono digestion (only FW) could result in the final concentration of chemical oxygen demand at 571.5 ± 8.0 mg/gTS. This study found that the maximum sCOD removal rate reached 756.68 mg/L in R1, which is quite contrary to the result cited by [45] at 0.3 gVS/Ld of OLR. Additionally, R2 hardly maintained 1749.7 mg/L when the gas production was much more stable in the bioreactor. The influent concentration of sCOD in R1 and R2 was 9876.67 and 9768.32 mg/L, respectively. However, ref. [51] stated the concentration of sCOD was loaded to the digester as 14,500 mg/L.
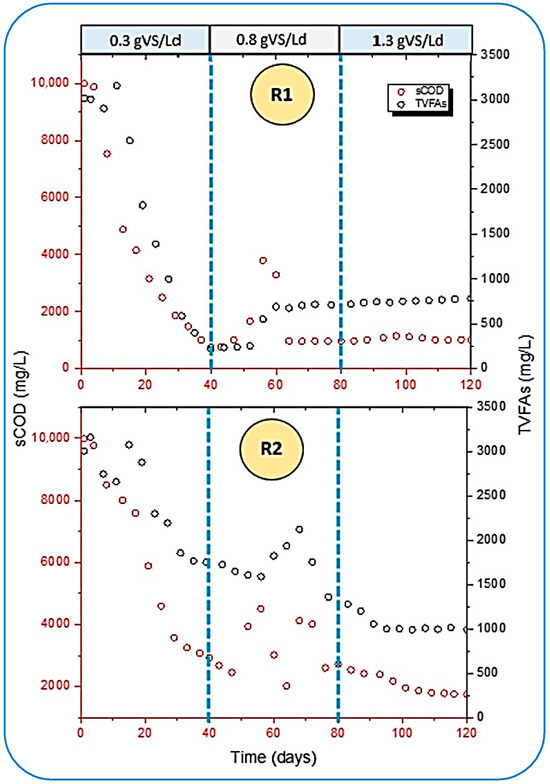
Figure 7.
Interrelation of sCOD reduction and TVFA removal in both reactors.
Furthermore, the removal efficiency of both parameters during the well-stabilized period of digestion was 90 and 86.5% of sCOD in R1 and R2 at 0.3 and 1.3 gVS/Ld of OLR, respectively. Whereas, in a study conducted by [51], which discussed the AD of FW under thermophilic (50 °C) conditions, the maximum removal of sCOD achieved was 83%. This shows that the removal rate of sCOD is better than the results cited by [51].
Later on, the OLR was increased from 0.3 to 0.8 gVS/Ld in both reactors after 40 days of digestion, as shown in Figure 7. Unbalanced behavior was observed in the reactors for the removal of sCOD, and the bioconversion of TVFAs became lower. This impact was caused by the accumulation of TVFAs, which were again raised from 215.45 to 549.98 mg/L in R1, and a similarly higher concentration of TVFAs was analyzed in R2 as well. This accumulation caused a drop in pH from greater than 7 to less than 5 in both reactors. It was noted that when the concentration of TVFAs was increased inside the reactors, it hampered the removal of sCOD. The results at this stage were quite in agreement with the observation made by [51].
In addition to this, ref. [43] cited that at a low OLR, there are fewer chances of inhibition caused by the volatile fatty acids (VFAs). In these conditions, the AD of readily degradable organic compounds (like FW) provides a sufficient balance between the rates of hydrolysis and methanogenesis because methanogenic bacteria are more sensitive than hydrolytic and acidogenic bacteria to high concentrations of VFAs and the corresponding pH drop. Slowly, this condition became reversible in R1 because the feeding rate became higher as the OLR increased, which led to a higher accumulation of TVFAs. The rates of hydrolytic and acidogenic organisms became higher, which agrees with the results of [52].
3.6. TS, VS, TS/VS Disintegration
The disintegration of total solids (TS), VS and their removal ratios were rigorously analyzed during the entire 120 days of operation. Figure 8 shows the VS behavior of each OLR. The VS bio-removal received more attention because the methane yield and the bioreactor’s performance were measured in terms of it and the study of AD of FW at different OLRs. In one study, the removal of total volatile solids (TVS) was reported as 80.9 to 82.7%, when treating the FW using different sizes of the substrate [53].
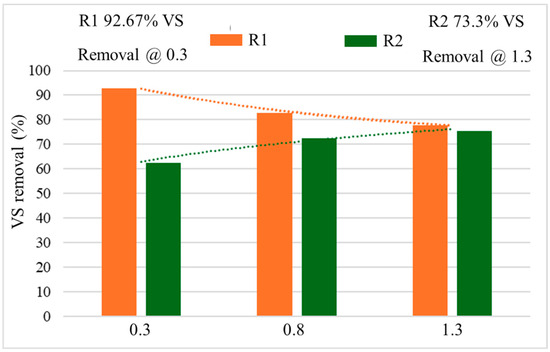
Figure 8.
The percentage of VS removal with different OLRs.
From Figure 8, the optimum VS reduction was achieved in R1 when the OLR was 0.3 gVS/Ld. Whereas, the R2 yielded maximum removal at 1.3 gVS/Ld of OLR with 75.3% elimination of VS. Then R1 behaved a bit differently. The VS removal increased in R2 and reduced in R1. This effect might be caused by the reduced functionality of the NPs in R1, which failed to maintain their biochemical compatibility with the increasing OLR. In R2, the VS reduction was a bit fast at the OLR of 0.3 gVS/Ld, but at 0.8, the second OLR, the VS reduction became a little shaky as compared to the first OLR. The rise in pH again showed the stabilized behavior of the reactor, and gradually increased VS destruction was noted.
At the third OLR (1.3 gVS/Ld), initially, the removal of VS increased, but after the 100th day, it became almost steady. The results obtained from R2 (without NPs) followed the behavior of VS removal as reported by [43]. Moreover, in R1 (with NP addition) the reduction rate was quite contrary because it reduced with increasing OLR. It was reduced from 93% to around 75% at OLRs of 0.3 to 1.3 gVS/Ld, respectively.
Nevertheless, a slight disturbance was observed in the removal of VS during the middle OLR (0.8 gVS/Ld) due to increased substrate feeding and limited microbial concentration. This impact led to a reduction of more than 90% removal in R1, which was set at 0.3 gVS/Ld OLR and reached around 80% at 0.8 gVS/Ld, as described in Figure 8. Ref. [13] also reported that the OLRs, 0.8 gVS/Ld (which was the lowest OLR) yielded the maximum VS removal of 76% when they found only 63% VS reduction at 2.1 gVS/Ld OLR.
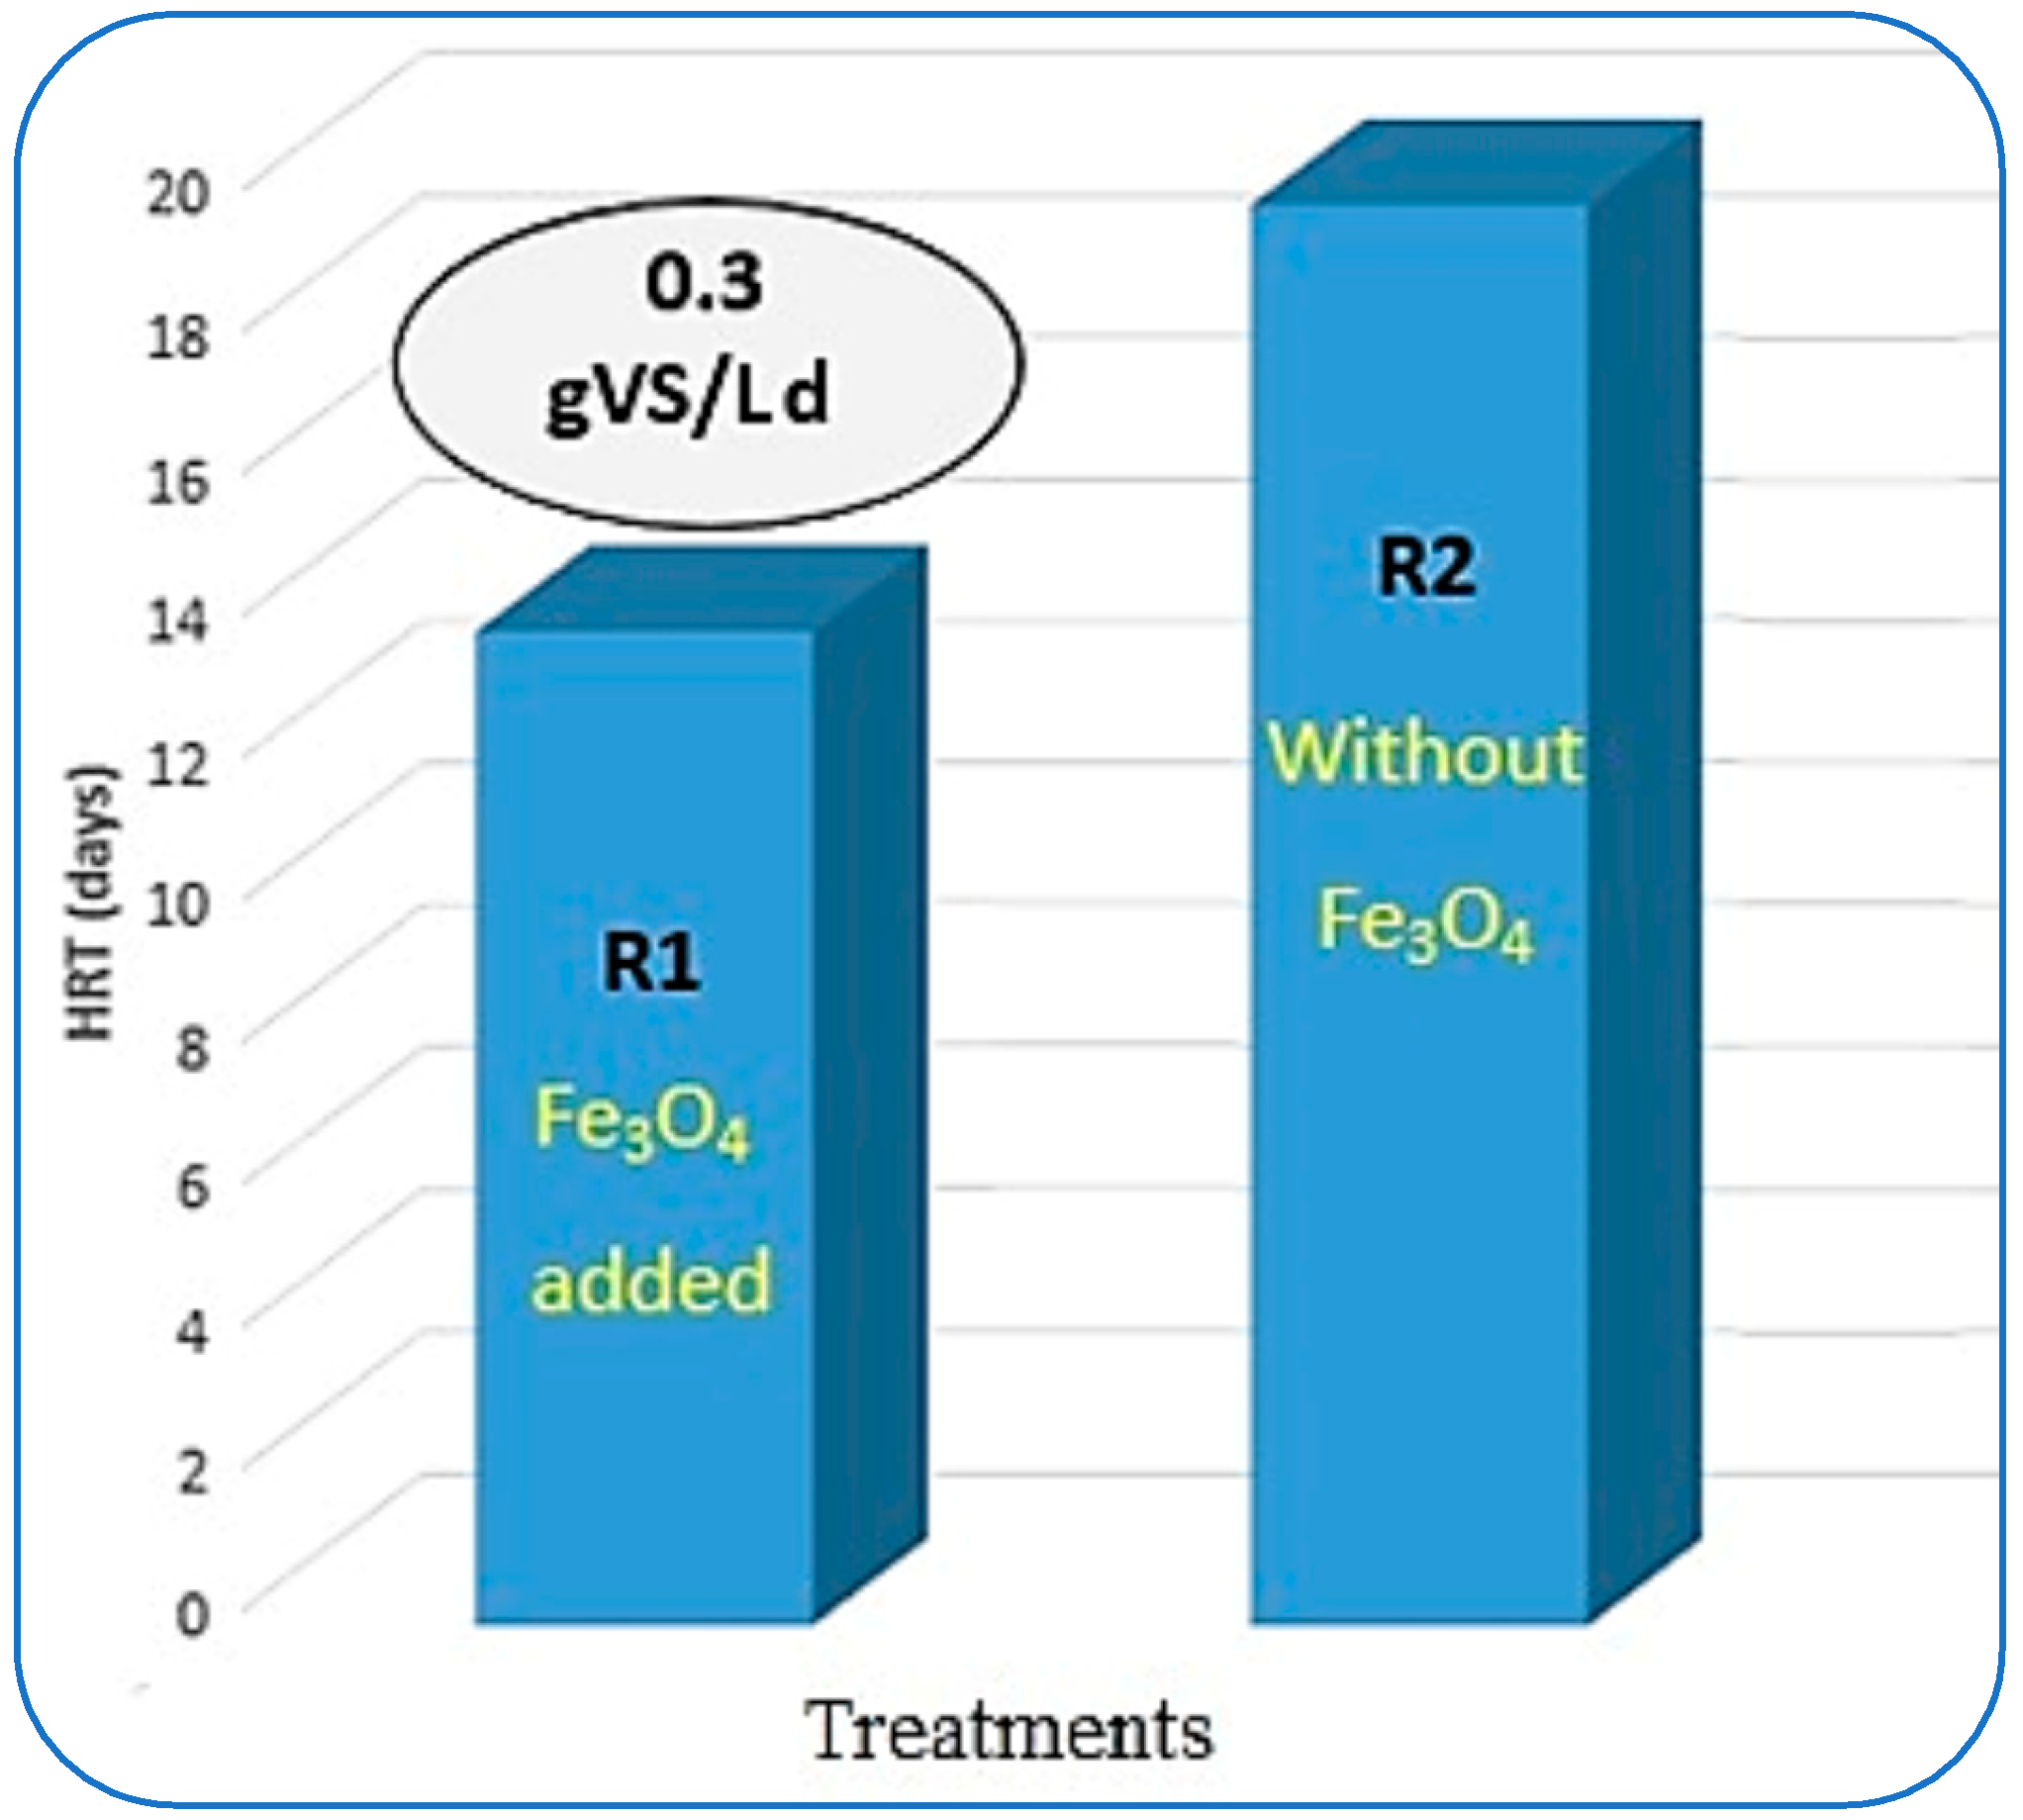
The estimation of hydraulic retention time (HRT) in CSTR-based AD of organic waste plays an important role. This HRT analysis leads to the design of the reactors needed to treat a specific amount of organic waste [40]. From Figure 9, it can be seen that the maximum VS reduction with optimum CH4 yield was achieved at 0.3 gVS/Ld of OLR in R1. More than 90% of VS removal was achieved in 14 days of hydraulic retention time. Whereas R2 took 20 days to biodegrade the same loading rate as the substrate. Somewhere else in the literature, the mesophilic AD of municipal solid waste digestion gave 15 days of HRT when the reactors were loaded up to 15 gVS/Ld [54].

Figure 9.
Impact of Fe3O4-NPs on HRT.
It was observed that both reactors behaved in opposite ways to each other. In R1, the HRT was increasing with the increase in the OLR along with the reduction in VS removal and reduced CH4 yield. In contrast to this, in R2, the HRT gradually shortened and reached about 18 days to achieve maximum VS reduction with optimum CH4 generation. In the literature, ref. [43] took more than 16 days to achieve maximum results. Furthermore, ref. [49], in their study, recommended the most suitable HRT for treating FW as 20 days in continuous AD. Besides these findings, in another research study, the methane yield was the highest in the reactor when an HRT of 12 d was used (223 LCH4/kg sCODdegraded) [51]. But in another study, the single-stage CSTRs are favored because they permit simpler designs that suffer less frequent technical failures and have a smaller investment cost [43].
3.7. Effect of Fe3O4-NPs on Microbial Communities
The dynamics of microbial communities during anaerobic digestion at different states of acclimation and inhibition are key to diagnosing ailments in this process [55]. The varying OLR in AD causes shakes in the microbial population communities and dynamics during treatment [56]. Thus, the study and the deep analysis of these microorganisms are the core of the digesters as AD is a biochemical process mediating the involvement of a variety of microbial groups [51]. However, most of them focused on the succession of dominant groups or the fluctuations in their relative abundance during the stable stage of the digester [57].
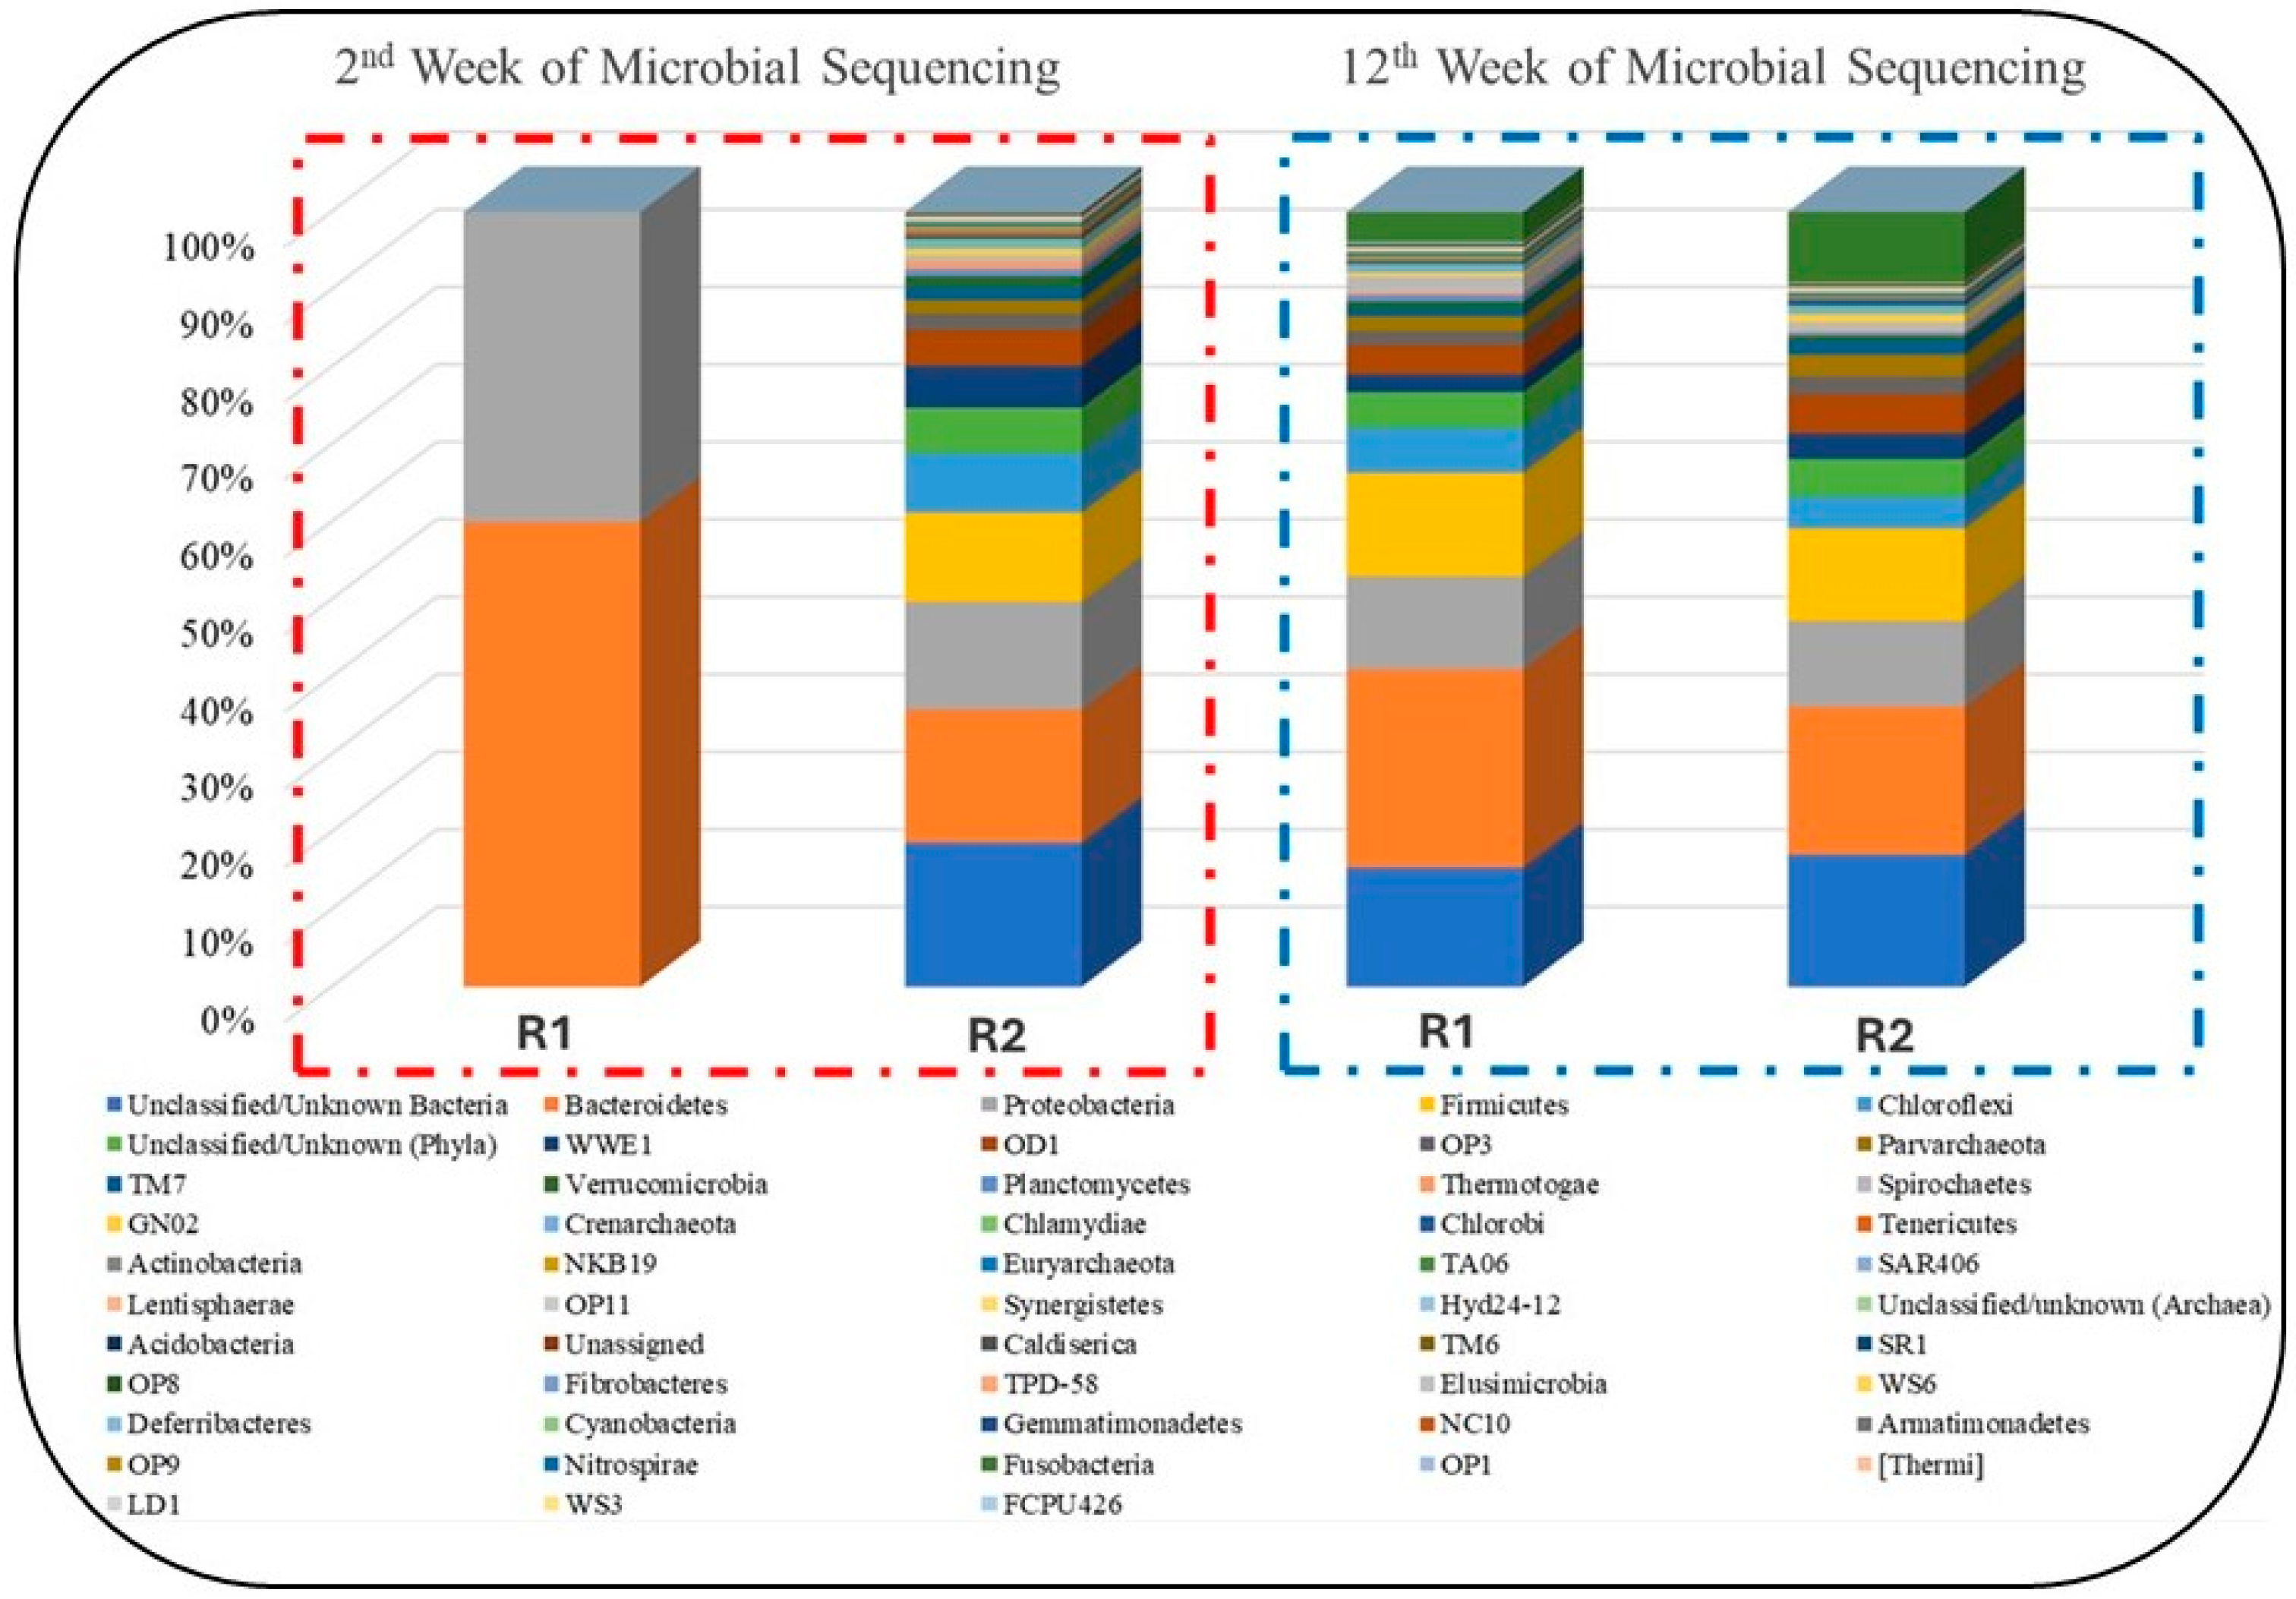
In this study, microbial analysis was carried out at two different stages of anaerobic digestion, such as at weeks 2 and 12 as shown in Figure 10. The analysis results revealed that during the week digestion, the reactors started adopting anaerobic conditions and stabilized. However, in week 12, the results during that the reactors have been stabilized and the impact of NPs on microbial growth is witnessed. Based on the study, shown in Figure 10, the distribution of four significant methane-producing microbes (Proteobacteria, Firmicutes, Bacteroidetes, and Actinobacteria) was totally different in R1 and R2 [58]. These four groups are of major importance in the microbial analysis of any AD process for methane generation. Furthermore, most of the members belonging to the Firmicutes phylum are syntrophic bacteria that can degrade various VFAs [59].
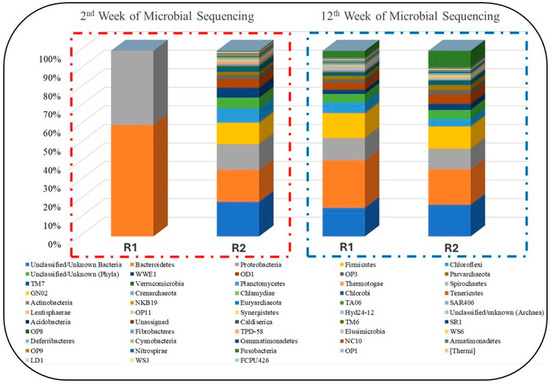
Figure 10.
Intermittent taxonomic analysis of microbial populations.
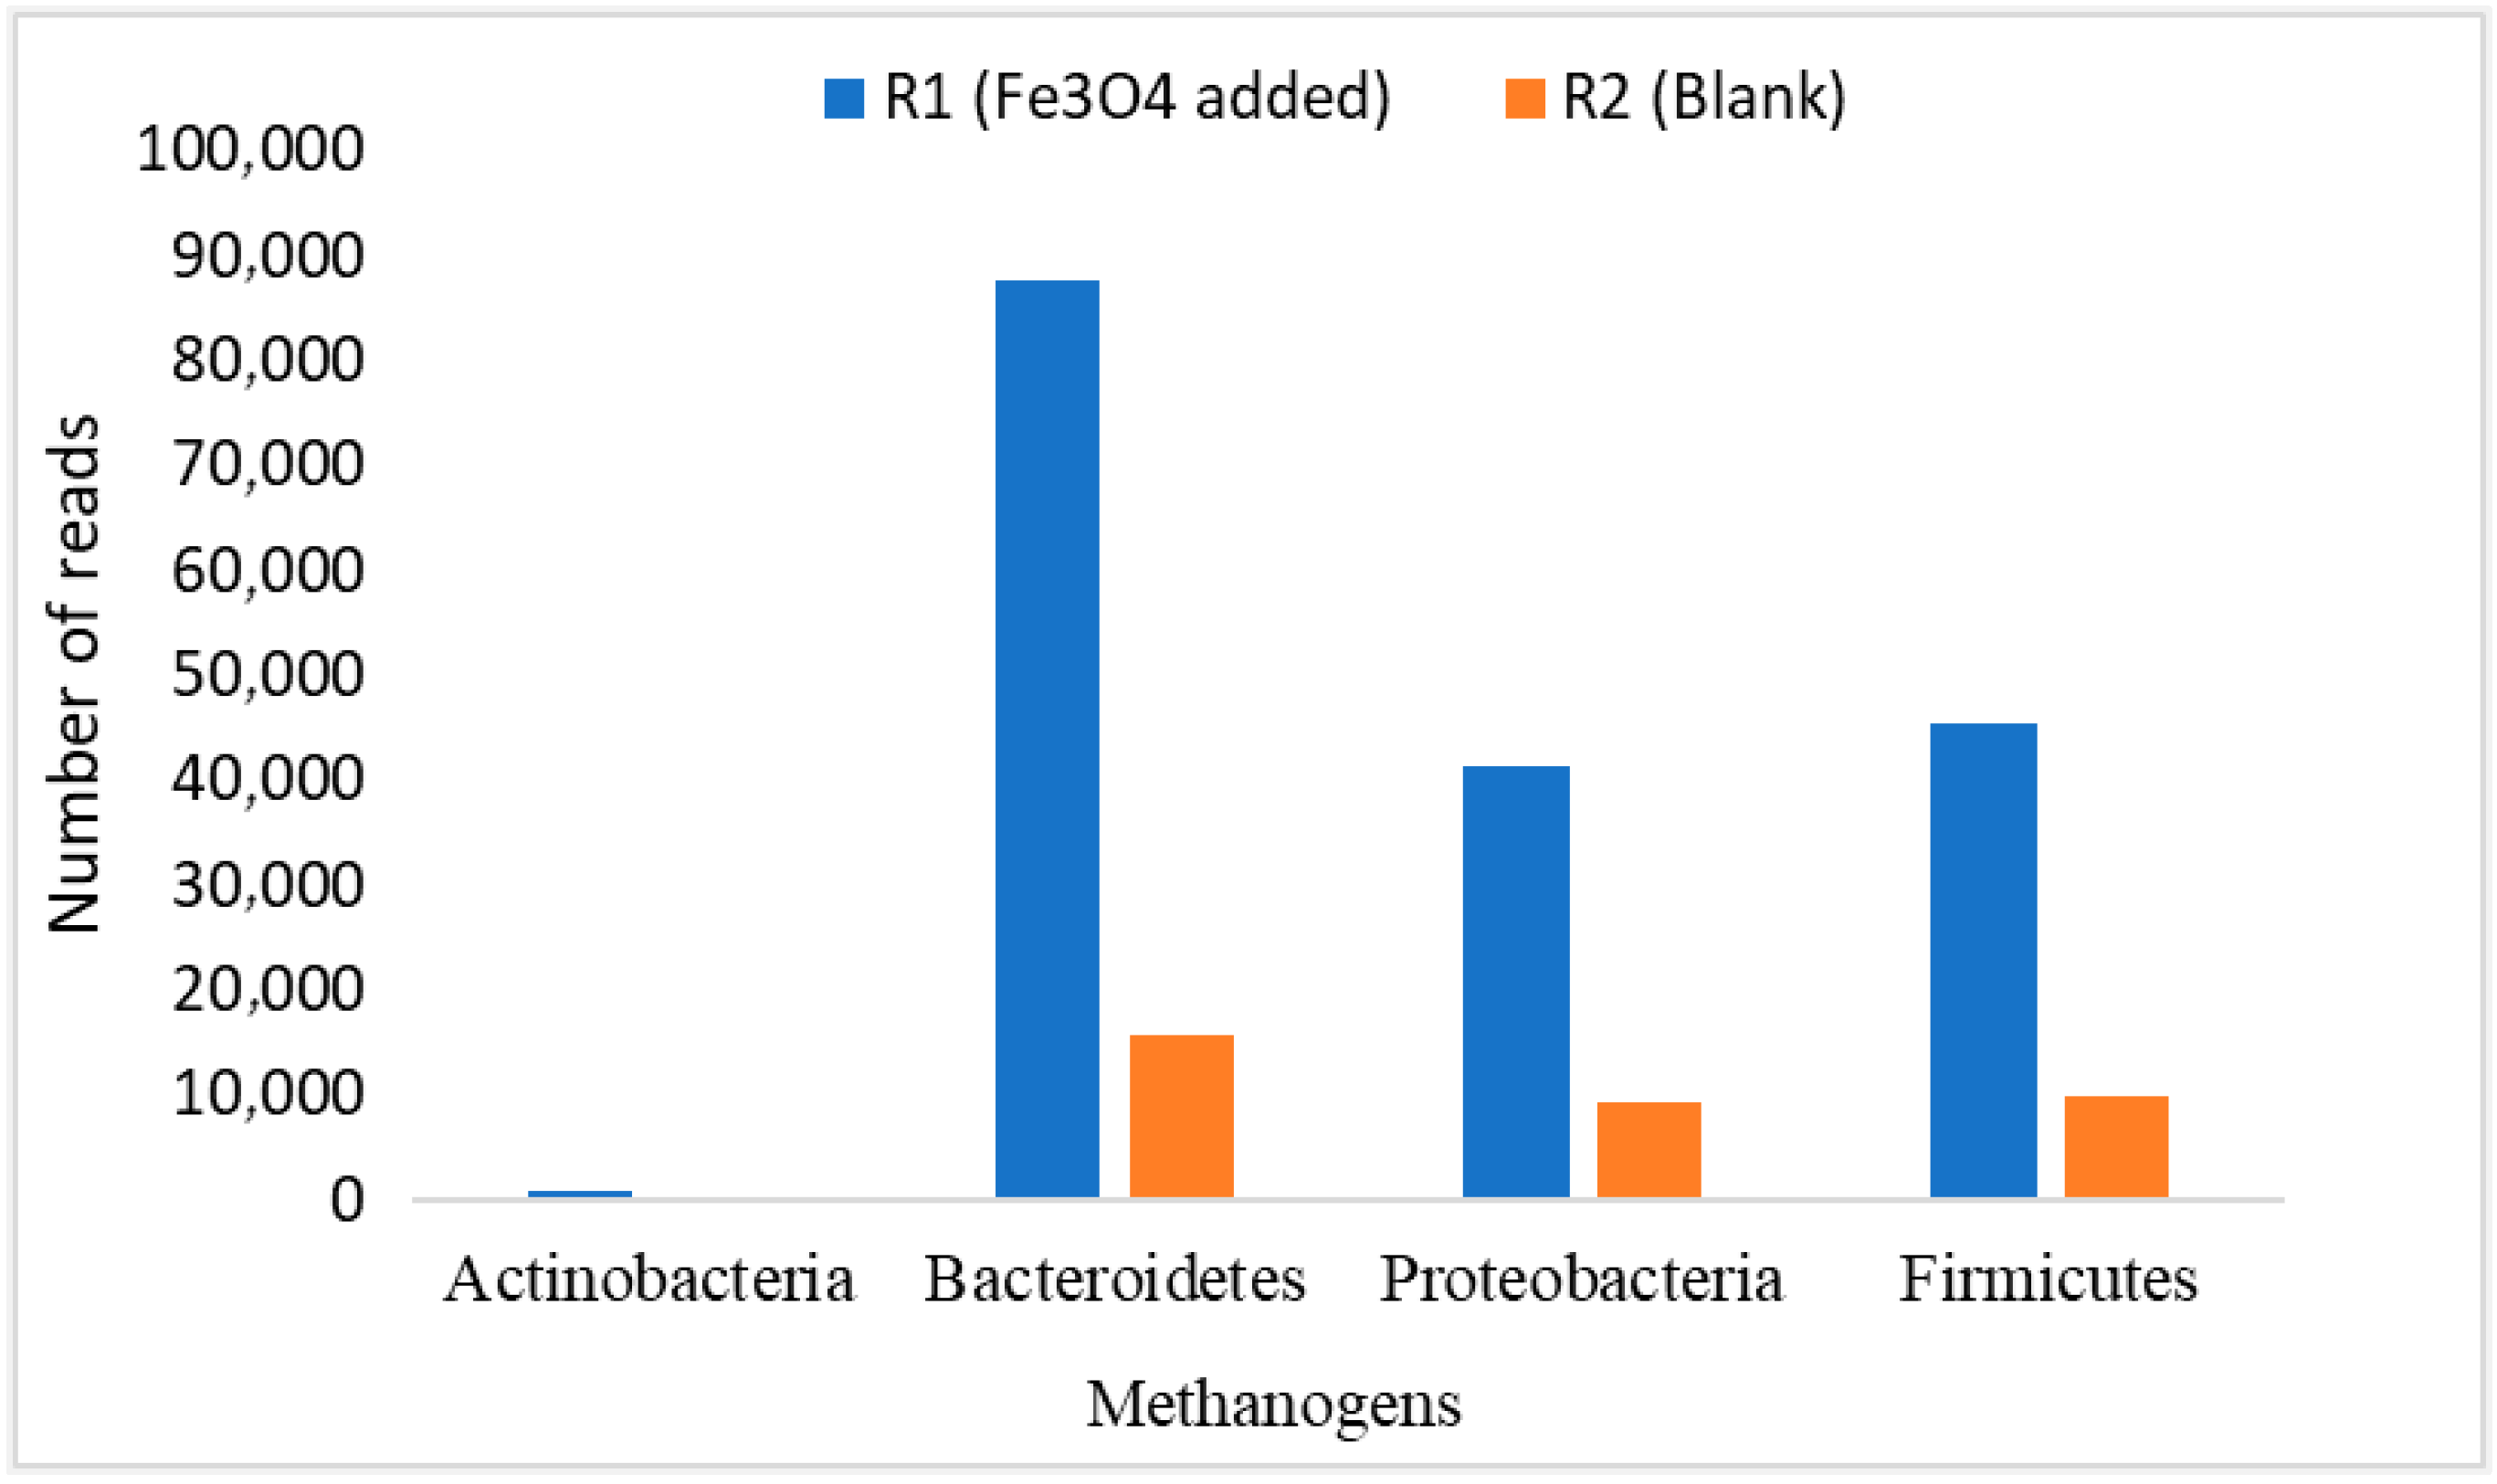
The average relative abundance of these Bacteroidetes, Firmicutes, and Proteobacteria was estimated as 33.85%, 31.36%, and 34.79% of bacteria, respectively [60]. Whereas, in another study, the microbial community in the effluent from digesters was dominated by representatives from the phyla Proteobacteria (77.8%) and Firmicutes (19.5%). In addition, the phyla Actinobacteria and Bacteroidetes were present at lower abundance, 1.5 and 0.6%, respectively [43,44]. Figure 10 shows the number of reads of these microbes in our study. It can be seen in Figure 11 that the three microbial communities (i.e., Bacteroidetes, Firmicutes, and Proteobacteria) significantly increased in R1, to which NPs were added, compared to R2. Their numbers of reads were about 10,000, 45,000, and 41,000, respectively. That is the way R1 yielded better performance in terms of CH4 generation and VS reduction rates. Perhaps, this stabilized performance of R1 might be because of a proper DIET mechanism among the microbes, enhanced enzymatic activation, good resistance against the inhibitory compounds (such as sCOD and TVFAs) and boosted hydrolysis and metabolism [25,42]. Hence, it was observed that the addition of NPs showed biocompatibility during the 120 days of digestion, but their efficiency decreased as OLR increased.
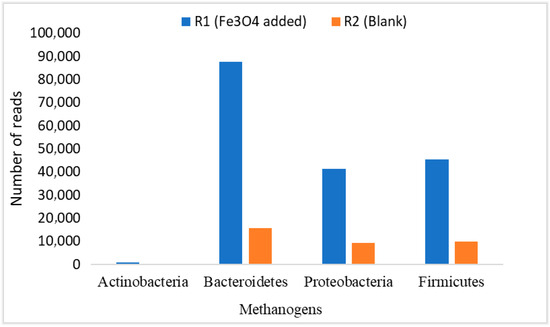
Figure 11.
Dominant methanogenic bacteria population.
3.8. Kinetic Modeling
Equation (1), as utilized by [43], was used to observe the kinetic behavior of CSTR. Equation (2), on the other hand, was used to estimate the rate of biodegradation (k). Mähnert and Linke [61] studied the kinetic behavior of the CSTR based on the mass balance equation of the substrate. A steady state was considered, and it was assumed that the feeding of the substrate was equal to the sum of removal and substrate disintegration.
where Mt represents the methane yield (in mL/gVS at STP) at time t (in days), Mmax is the maximum methane yield (mL at STP), and kC is the first-order conversion-rate constant (per day). Table 2 enlists the kinetic parameters and statistical checks.
Table 2.
Kinetic and statistical parameters of both reactors.
The value of kc was estimated using Equation (2) and plugged into Equation (1) to estimate the model-based methane yield (Mt). It can be seen from Table 2 that the model yielded the optimum methane yield in R1 as 724.611 mL/gVS. The observed (experimental) CH4 yield was 725.901 mL/gVS with a higher rate of kc 0.057 per day. Further model prediction suggested that, in R2, the model predicted the experimental data quite well, with the coefficient of determination (R2) of 0.872. The rate of biodegradation (kc) was found to be 0.021 (d−1), which is less than the rate observed in R1. In the literature, the kc was also reported as 0.089 per day when the CSTR was run for about 250 days. Furthermore, Lin et al. [62] reported the k value as 0.07 (d−1) during the 140 days in the CSTR. In contrast to these results, ref. [61] reported 0.032–0.0316 (d−1).
Based on the above discussion, the first-order model predicted experimental data with a high goodness of fit of more than 80%, as reported by [63]. The kinetic parameters suggest that the addition of NPs enhanced the biodegradation rate, allowing us to achieve more yield with the same OLRs, which were used to compare in terms of R1 and R2. Adebayo et al. [40] suggested that the kinetic parameters such as Mt of Mmax and k are the deciding factors in bioreactor design.
Ref. [61] reported R2 in the range of 8 to 65%. However, our study showed a much better R2 analysis, which was observed in more than 80% of the cases. Ref. [40] reported the R2 at the mesophilic AD conditions as 0.860. Moreover, rMSE analysis showed very little deviation when the results were simulated with the model results. From Table 2, it can be seen that the rMSE in terms of both reactors was in the range of 0.238 to 0.317%. This deviation was way better than the rMSE results reported by [34]. In his study, the rMSE with a value of 0.59 was considered great and 2.01 was referred to as a very poor prediction during the univariate analysis.
4. Conclusions
The study evaluated the efficiency of Fe3O4-NPs as a supplement for anaerobic digestion (AD) in two concurrent CSTRs. The OLR ranged from 0.3 to 1.3, and the concentration of NPs demonstrated efficient biocompatibility. The R1 dramatically enhanced sCOD removal, as well as TVFA conversion and creation rates. The maximal TVFAs, sCOD, and VS elimination rates were 215.45 mg/L, 756.68 mg/L, and 92.2%, respectively, at 0.3 gVS/Ld of OLR. In R2, CH4 generation rose from 372.8 to 424.4 mL/gVS at 0.3 to 1.3 gVS/Ld of OLR, respectively. The reduction in VS, sCOD, and TVFAs was further improved by enhancing the OLR in R2. In R2, the VS reduction was consistent at 1.3 gVS/Ld of OLR, reaching around 80% at its peak. However, pH variation was shown to be much more prominent in R2 than in R1, indicating the existence of NPs greatly reduces pH dips. So, in R1, the maximum removal of sCOD, TVFAs, and VS was achieved at 90%, 74%, and 93%, respectively, as compared to R2. The results support the use of green and biodegradable NPs for large-scale AD treatment.
Author Contributions
A.A. and H.A.K.: methodology, writing, original draft preparation, supervision, and editing. S.P. and R.B.M.: methodology, writing—original draft preparation and editing. A.M.A., A.A. and A.W.: reviewing, validation, and editing. All authors have read and agreed to the published version of the manuscript.
Funding
This research received no external funding.
Data Availability Statement
The authors confirm that the data supporting the findings of this study are available within the article.
Acknowledgments
The authors would also like to thank the US-Pakistan Center for Advanced Studies in Water at Mehran UET, Jamshoro, Pakistan, for supporting the experimental work, and NUST Balochistan Campus, Quetta, for its valuable institutional support.
Conflicts of Interest
The authors declare no conflict of interest.
References
- Ferguson, R.M.; Coulon, F.; Villa, R. Organic loading rate: A promising microbial management tool in anaerobic digestion. Water Res. 2016, 100, 348–356. [Google Scholar] [CrossRef] [PubMed]
- Ali, A.; Mahar, R.B.; Sheerazi, S.T.H. Renewable electricity generation from food waste through anaerobic digestion in Pakistan: A mini-review. Earth Syst. Environ. 2019, 3, 95–100. [Google Scholar] [CrossRef]
- Zhu, X.; Blanco, E.; Bhatti, M.; Borrion, A. Impact of metallic nanoparticles on anaerobic digestion: A systematic review. Sci. Total Environ. 2021, 757, 143747. [Google Scholar] [CrossRef] [PubMed]
- Ye, M.; Liu, J.; Ma, C.; Li, Y.Y.; Zou, L.; Qian, G.; Xu, Z.P. Improving the stability and efficiency of anaerobic digestion of food waste using additives: A critical review. J. Clean. Prod. 2018, 192, 316–326. [Google Scholar] [CrossRef]
- Thi, N.B.D.; Lin, C.Y.; Kumar, G. Waste-to-wealth for valorization of food waste to hydrogen and methane towards creating a sustainable ideal source of bioenergy. J. Clean. Prod. 2016, 122, 29–41. [Google Scholar] [CrossRef]
- Pellera, F.M.; Gidarakos, E. Chemical pretreatment of lignocellulosic agroindustrial waste for methane production. Waste Manag. 2018, 71, 689–703. [Google Scholar] [CrossRef]
- Fei, X.; Jia, W.; Chen, T.; Ling, Y. Life cycle assessment of food waste anaerobic digestion with hydrothermal and ionizing radiation pretreatment. J. Clean. Prod. 2022, 338, 130611. [Google Scholar] [CrossRef]
- Ariunbaatar, J.; Panico, A.; Esposito, G.; Pirozzi, F.; Lens, P.N. Pretreatment methods to enhance anaerobic digestion of organic solid waste. Appl. Energy 2014, 123, 143–156. [Google Scholar] [CrossRef]
- Wagner, A.O.; Lackner, N.; Mutschlechner, M.; Prem, E.M.; Markt, R.; Illmer, P. Biological pretreatment strategies for second-generation lignocellulosic resources to enhance biogas production. Energies 2018, 11, 1797. [Google Scholar] [CrossRef]
- Lohani, S.P.; Havukainen, J. Anaerobic digestion: Factors affecting anaerobic digestion process. In Waste Bioremediation; Springer: Singapore, 2018; pp. 343–359. [Google Scholar] [CrossRef]
- Chae, K.J.; Jang, A.M.; Yim, S.K.; Kim, I.S. The effects of digestion temperature and temperature shock on the biogas yields from the mesophilic anaerobic digestion of swine manure. Bioresour. Technol. 2008, 99, 1–6. [Google Scholar] [CrossRef]
- Ryue, J.; Lin, L.; Kakar, F.L.; Elbeshbishy, E.; Al-Mamun, A.; Dhar, B.R. A critical review of conventional and emerging methods for improving process stability in thermophilic anaerobic digestion. Energy Sustain. Dev. 2020, 54, 72–84. [Google Scholar] [CrossRef]
- Vandevivere, P.; De Baere, L.; Verstraete, W. Types of anaerobic digester for solid wastes. In Biomethanization of the Organic Fraction of Municipal Solid Wastes; Iwa Publishing: London, UK, 2003; pp. 111–140. [Google Scholar]
- Ali, A.; Keerio, H.A.; Panhwar, S.; Ahad, M.Z. Experimental Investigation of Methane Generation in the Presence of Surface and Un-Surface Nanoparticles of Iron Oxide. AgriEngineering 2022, 4, 134–140. [Google Scholar] [CrossRef]
- Ali, A.; Mahar, R.B.; Panhwar, S.; Keerio, H.A.; Khokhar, N.H.; Suja, F.; Rundong, L. Generation of green renewable energy through anaerobic digestion technology (ADT): Technical insights review. Waste Biomass Valorization 2023, 14, 663–686. [Google Scholar] [CrossRef]
- Abdelsalam, E.; Samer, M.; Attia, Y.A.; Abdel-Hadi, M.A.; Hassan, H.E.; Badr, Y. Influence of zero valent iron nanoparticles and magnetic iron oxide nanoparticles on biogas and methane production from anaerobic digestion of manure. Energy 2017, 120, 842–853. [Google Scholar] [CrossRef]
- Lee, Y.J.; Lee, D.J. Impact of adding metal nanoparticles on anaerobic digestion performance—A review. Bioresour. Technol. 2019, 292, 121926. [Google Scholar] [CrossRef]
- Casals, E.; Barrena, R.; García, A.; González, E.; Delgado, L.; Busquets-Fité, M.; Font, X.; Arbiol, J.; Glatzel, P.; Kvashnina, K.; et al. Programmed iron oxide nanoparticles disintegration in anaerobic digesters boosts biogas production. Small 2014, 10, 2801–2808. [Google Scholar] [CrossRef]
- Ali, A.; Mahar, R.B.; Soomro, R.A.; Sherazi, S.T.H. Fe3O4 nanoparticles facilitated anaerobic digestion of organic fraction of municipal solid waste for enhancement of methane production. Energy Sources Part A Recovery Util. Environ. Eff. 2017, 39, 1815–1822. [Google Scholar] [CrossRef]
- Tratnyek, P.G.; Johnson, R.L. Nanotechnologies for environmental cleanup. Nano Today 2006, 1, 44–48. [Google Scholar] [CrossRef]
- Ali, A.; Mahar, R.B.; Sherazi, S.T.H. Methane augmentation of anaerobic digestion of food waste in the presence of Fe3O4 and carbamide capped Fe3O4 nanoparticles. Waste Biomass Valorization 2020, 11, 4093–4107. [Google Scholar] [CrossRef]
- Dalla Vecchia, C.; Mattioli, A.; Bolzonella, D.; Palma, E.; Viggi, C.C.; Aulenta, F. Impact of magnetite nanoparticles supplementation on the anaerobic digestion of food wastes: Batch and continuous-flow investigations. Chem. Eng. Trans. 2016, 49, 1–6. [Google Scholar] [CrossRef]
- Ugwu, S.N.; Biscoff, R.K.; Enweremadu, C.C. A meta-analysis of iron-based additives on enhancements of biogas yields during anaerobic digestion of organic wastes. J. Clean. Prod. 2020, 269, 122449. [Google Scholar] [CrossRef]
- Wo, D.; Bi, G.; Li, L.; Kong, X.; Jiang, E.; Xie, J. Iron-fortified Anaerobic Co-digestion Performance of Kitchen Waste and Pennisetum Hybrid. BioEnergy Res. 2022, 16, 651–659. [Google Scholar] [CrossRef]
- Alavi-Borazjani, S.A.; da Cruz Tarelho, L.A.; Capela, M.I. Biohythane production via anaerobic digestion process: Fundamentals, scale-up challenges, and techno-economic and environmental aspects. Environ. Sci. Pollut. Res. 2024, 31, 49935–49984. [Google Scholar] [CrossRef] [PubMed]
- Popp, J.; Lakner, Z.; Harangi-Rákos, M.; Fari, M. The effect of bioenergy expansion: Food, energy, and environment. Renew. Sustain. Energy Rev. 2014, 32, 559–578. [Google Scholar] [CrossRef]
- Young, J.C.; Clesceri, L.S.; Kamhawy, S.M. Changes in the biochemical oxygen demand procedure in the 21st edition of Standard Methods for the Examination of Water and Wastewater. Water Environ. Res. 2005, 77, 404–410. [Google Scholar] [CrossRef]
- Wang, Q.; Noguchi, C.; Hara, Y.; Sharon, C.; Kakimoto, K.; Kato, Y. Studies on anaerobic digestion mechanism: Influence of pretreatment temperature on biodegradation of waste activated sludge. Environ. Technol. 1997, 18, 999–1008. [Google Scholar] [CrossRef]
- Kalia, V.C.; Sonakya, V.; Raizada, N. Anaerobic digestion of banana stem waste. Bioresour. Technol. 2000, 73, 191–193. [Google Scholar] [CrossRef]
- Zamanzadeh, M.; Hagen, L.H.; Svensson, K.; Linjordet, R.; Horn, S.J. Anaerobic digestion of food waste—Effect of recirculation and temperature on performance and microbiology. Water Res. 2016, 96, 246–254. [Google Scholar] [CrossRef]
- Panhwar, S.; Keerio, H.A.; Khokhar, N.H.; Muqeet, M.; Ali, Z.; Bilal, M.; Ul Rehman, A. Magnetic nanomaterials as an effective absorbent material for removal of fluoride concentration in water: A review. J. Water Health 2024, 22, 123–137. [Google Scholar] [CrossRef]
- Panhwar, S.; Keerio, H.A.; Ali, A.; Aftab, A.; Chang, M.A.; Khokhar, N.H.; Khokhar, H. Synthesis and characterization approaches of silver nano particles for various novel applications. Adv. Mater. Process. Technol. 2022, 8, 4106–4121. [Google Scholar] [CrossRef]
- Mata-Alvarez, J.; Llabrés, P.; Cecchi, F.; Pavan, P. Anaerobic digestion of the Barcelona central food market organic wastes: Experimental study. Bioresour. Technol. 1992, 39, 39–48. [Google Scholar] [CrossRef]
- Fagundes, D.S.; Orrico Junior, M.A.P.; Orrico, A.C.A.; Seno, L.O. Mathematical models of anaerobic digestion for the treatment of swine effluents. Pesqui. Agropecu. Trop. 2015, 45, 172–179. [Google Scholar] [CrossRef]
- Karidio Daouda Idrissa, O.K.; Tsuanyo, D.; Kouakou, R.A.; Konaté, Y.; Sawadogo, B.; Yao, K.B. Analysis of the criteria for improving biogas production: Focus on anaerobic digestion. Environ. Dev. Sustain. 2023, 26, 27083–27110. [Google Scholar] [CrossRef]
- Panhwar, S.; Hassan, S.S.; Mahar, R.B.; Carlson, K.; Talpur, M.Y. Highly sensitive and selective electrochemical sensor for detection of escherichia coli by using L-cysteine functionalized iron nanoparticles. J. Electrochem. Soc. 2019, 166, B227. [Google Scholar] [CrossRef]
- Yew, Y.P.; Shameli, K.; Miyake, M.; Khairudin, N.B.B.A.; Mohamad, S.E.B.; Naiki, T.; Lee, K.X. Green biosynthesis of superparamagnetic magnetite Fe3O4 nanoparticles and biomedical applications in targeted anticancer drug delivery system: A review. Arab. J. Chem. 2020, 13, 2287–2308. [Google Scholar] [CrossRef]
- Lee, J.H.; Park, S.Y.; Choi, I.G.; Choi, J.W. Investigation of molecular size effect on the formation of lignin nanoparticles by nanoprecipitation. Appl. Sci. 2020, 10, 4910. [Google Scholar] [CrossRef]
- Batstone, D.J. Mathematical modelling of anaerobic reactors treating domestic wastewater: Rational criteria for model use. Rev. Environ. Sci. Bio/Technol. 2006, 5, 57–71. [Google Scholar] [CrossRef]
- Adebayo, A.O.; Jekayinfa, S.O.; Linke, B. Effects of organic loading rate on biogas yield in a continuously stirred tank reactor experiment at mesophilic temperature. Br. J. Appl. Sci. Technol. 2015, 11, 1–9. [Google Scholar] [CrossRef]
- Fitamo, T.; Boldrin, A.; Boe, K.; Angelidaki, I.; Scheutz, C. Co-digestion of food and garden waste with mixed sludge from wastewater treatment in continuously stirred tank reactors. Bioresour. Technol. 2016, 206, 245–254. [Google Scholar] [CrossRef]
- Wang, W.; Yin, F.; Sun, Y.; Yu, Q.; Wang, X. Effects of carbon-based materials on methane production during anaerobic digestion: A review. J. Hazard. Mater. 2018, 350, 21–30. [Google Scholar] [CrossRef]
- Nagao, N.; Tajima, N.; Kawai, M.; Niwa, C.; Kurosawa, N.; Matsuyama, T.; Toda, T. Maximum organic loading rate for the single-stage wet anaerobic digestion of food waste. Bioresour. Technol. 2012, 118, 210–218. [Google Scholar] [CrossRef] [PubMed]
- Akturk, A.S.; Demirer, G.N. Petroleum Coke Supplementation Improves Biogas Production from Food Waste at a Level Comparable to Commercial Carbon-based Conductive Materials. BioEnergy Res. 2022, 15, 1482–1490. [Google Scholar] [CrossRef]
- Facchin, V.; Cavinato, C.; Fatone, F.; Pavan, P.; Cecchi, F.; Bolzonella, D. Effect of trace element supplementation on the mesophilic anaerobic digestion of foodwaste in batch trials: The influence of inoculum origin. Biochem. Eng. J. 2013, 70, 71–77. [Google Scholar] [CrossRef]
- Keerio, H.A.; Bae, W.; Park, J.; Kim, M. Substrate uptake, loss, and reserve in ammonia-oxidizing bacteria (AOB) under different substrate availabilities. Process Biochem. 2020, 91, 303–310. [Google Scholar] [CrossRef]
- Keerio, H.A.; Bae, W.; Panhwar, S. Nitrite Accumulation at Low Ammonia Concentrations in Wastewater Treatment Plants. Sustainability 2022, 14, 16449. [Google Scholar] [CrossRef]
- Kumari, D.; Singh, R. Pretreatment of lignocellulosic wastes for biofuel production: A critical review. Renew. Sustain. Energy Rev. 2018, 90, 877–891. [Google Scholar] [CrossRef]
- Zhou, J.; Zhang, R.; Liu, F.; Yong, X.; Wu, X.; Zheng, T.; Jiang, M.; Jia, H. Biogas production and microbial community shift through neutral pH control during the anaerobic digestion of pig manure. Bioresour. Technol. 2016, 217, 44–49. [Google Scholar] [CrossRef]
- Cai, C.; Leu, A.O.; Xie, G.J.; Guo, J.; Feng, Y.; Zhao, J.X.; Tyson, G.W.; Yuan, Z.; Hu, S. A methanotrophic archaeon couples anaerobic oxidation of methane to Fe (III) reduction. ISME J. 2018, 12, 1929–1939. [Google Scholar] [CrossRef]
- Kim, J.; Baek, G.; Lee, C. Inhibition of methanogenesis by metal and metal oxide nanoparticles. Environ. Sci. Nano 2015, 2, 632–646. [Google Scholar]
- Pavlostathis, S.G.; Giraldo-Gomez, E. Kinetics of anaerobic treatment: A critical review. Crit. Rev. Environ. Sci. Technol. 1991, 21, 411–490. [Google Scholar] [CrossRef]
- Agyeman, F.O.; Han, Y.; Tao, W. Elucidating the kinetics of ammonia inhibition to anaerobic digestion through extended batch experiments and stimulation-inhibition modeling. Bioresour. Technol. 2021, 340, 125744. [Google Scholar] [CrossRef] [PubMed]
- De Bere, L. Anaerobic digestion of solid waste: State-of-the-art. Water Sci. Technol. 2000, 41, 283–290. [Google Scholar] [CrossRef]
- Zeb, I.; Ma, J.; Mehboob, F.; Kafle, G.K.; Amin, B.A.Z.; Nazir, R.; Ndegwa, P.; Frear, C. Kinetic and microbial analysis of methane production from dairy wastewater anaerobic digester under ammonia and salinity stresses. J. Clean. Prod. 2019, 219, 797–808. [Google Scholar] [CrossRef]
- Li, D.; Liu, S.; Mi, L.; Li, Z.; Yuan, Y.; Yan, Z.; Liu, X. Effects of feedstock ratio and organic loading rate on the anaerobic mesophilic co-digestion of rice straw and cow manure. Bioresour. Technol. 2015, 189, 319–326. [Google Scholar] [CrossRef]
- Jang, H.M.; Kim, J.H.; Ha, J.H.; Park, J.M. Bacterial and methanogenic archaeal communities during the single-stage anaerobic digestion of high-strength food wastewater. Bioresour. Technol. 2014, 165, 174–182. [Google Scholar] [CrossRef]
- Guo, J.; Liu, W.; Zhu, C.; Luo, G.; Kong, Y.; Ling, N.; Wang, M.; Dai, J.; Shen, Q.; Guo, S. Bacterial rather than fungal community composition is associated with microbial activities and nutrient-use efficiencies in a paddy soil with short-term organic amendments. Plant Soil 2018, 424, 335–349. [Google Scholar] [CrossRef]
- Garcia-Peña, E.I.; Parameswaran, P.; Kang, D.W.; Canul-Chan, M.; Krajmalnik-Brown, R. Anaerobic digestion and co-digestion processes of vegetable and fruit residues: Process and microbial ecology. Bioresour. Technol. 2011, 102, 9447–9455. [Google Scholar] [CrossRef]
- Duan, N.; Zhang, D.; Lin, C.; Zhang, Y.; Zhao, L.; Liu, H.; Liu, Z. Effect of organic loading rate on anaerobic digestion of pig manure: Methane production, mass flow, reactor scale and heating scenarios. J. Environ. Manag. 2019, 231, 646–652. [Google Scholar] [CrossRef]
- Mähnert, P.; Linke, B. Kinetic study of biogas production from energy crops and animal waste slurry: Effect of organic loading rate and reactor size. Environ. Technol. 2009, 30, 93–99. [Google Scholar] [CrossRef]
- Lin, Y.; Wang, D.; Li, Q.; Huang, L. Kinetic study of mesophilic anaerobic digestion of pulp & paper sludge. Biomass Bioenergy 2011, 35, 4862–4867. [Google Scholar] [CrossRef]
- Ali, A.; Keerio, H.A.; Abro, O.A.; Noor, M.; Panhwar, S.; Mahar, R.B. A Study of Mathematical Models Used in Anaerobic Digestion of Organic Refuse. VFAST Trans. Math. 2024, 12, 150–163. [Google Scholar] [CrossRef]


Disclaimer/Publisher’s Note: The statements, opinions and data contained in all publications are solely those of the individual author(s) and contributor(s) and not of MDPI and/or the editor(s). MDPI and/or the editor(s) disclaim responsibility for any injury to people or property resulting from any ideas, methods, instructions or products referred to in the content. |
© 2025 by the authors. Licensee MDPI, Basel, Switzerland. This article is an open access article distributed under the terms and conditions of the Creative Commons Attribution (CC BY) license (https://creativecommons.org/licenses/by/4.0/).