Article

Spatial Risk Prediction of Coal Seam Gas Using Kriging Under Complex Geological Conditions

1
Guizhou Institute of Mine Safety Science Co., Ltd., Guiyang 550025, China
2
Guizhou Coal Mine Design and Research Institute Co., Ltd., Guiyang 550025, China
3
College of Resources and Environmental Engineering, Guizhou University, Guiyang 550025, China
4
Guizhou Shui Kuang Holding Group Co., Ltd., Shuicheng City, Liupanshui 553000, China
5
School of Mining Engineering, Guizhou Institute of Technology, Guiyang 550025, China
*
Author to whom correspondence should be addressed.
Processes 2025, 13(7), 2110; https://doi.org/10.3390/pr13072110
Submission received: 14 April 2025 / Revised: 30 May 2025 / Accepted: 16 June 2025 / Published: 3 July 2025

Abstract

Coal and gas outbursts are one of the major hidden hazards in coal mine production safety. To achieve the effective prevention and control of this type of disaster, detailed measurements of relevant parameters are conducted based on the No. 9 coal seam in Longfeng Coal Mine, Guizhou Province. Using the obtained data and combining it with the Kriging algorithm, the gas content in the coal seam is accurately predicted and analyzed, taking into account the spatial location of the prediction points and the prediction level. This investigation reveals the regional occurrence characteristics of gas under complex geological conditions and enables the early identification of regional gas hazards. The main findings are as follows: (i) There is a significant relationship between gas content, elevation, and burial depth in the studied coal seam. The relationship between gas content and elevation can be expressed by the following formula: y = −0.0406x + 54.845, R2 = 0.9202. The relationship between gas content and burial depth can be expressed by the following formula: y = 0.0269x + 5.1801, R2 = 0.8925. (ii) The gas content reaches a critical value of 8 m/t when the coal seam burial depth reaches 105 m, and the area below 105 m is identified as the outburst hazard zone. (iii) The gas content prediction function formula for coal seam No. 9 based on the Kriging algorithm is derived as y = 0.84x + 1.840, with an average prediction accuracy of 90.44%.

1. Introduction

Coal is the most important primary energy source in China, and it plays a pivotal role in promoting economic development, social progress, and national rejuvenation. Coal mine safety plays a critical role in national industrial operations. With the continuous increase in the depth of coal mining in China and the complex geological conditions, the occurrence of coal and gas outburst accidents has become more frequent [1]. To ensure the sustainability of deep mining, an effective method for preventing and controlling gas disasters is needed. Researchers at home and abroad have conducted extensive studies on the theories and technologies for preventing and controlling gas disasters and have made significant progress [2,3]. Among them, monitoring and prediction technology for gas disasters has become a major research direction [4,5].
To identify the characteristics of gas occurrence and enable the proactive prediction and early warning of gas outbursts, considerable research and analysis have been carried out by experts worldwide [6,7]. Based on their respective national conditions, countries have developed comprehensive coal mine disaster prevention and control systems. Notable achievements in this regard include the efforts of Australia, the United States, and Germany. The Australian Coal Mine Research Center has integrated underground monitoring data to establish an efficient data analysis and early warning mechanism. In the United States, a comprehensive mine management and safety early warning information system has been established via internet technology and GIS software, along with the establishment of remote control and command centers to enhance disaster monitoring and management [8,9]. In addition, domestic researchers, such as the team led by Wang Enyuan, have examined the characteristics of big data of gas disasters and hazard risks and proposed suitable approaches for gas disaster risk identification and early warning based on the safety monitoring big data [10]. Li et al. [11] established a precursor feature recognition model for outbursts based on Faster R-CNN and AE-EMR two-dimensional time–frequency signals and constructed a transfer belief model (TBM)-based early warning model for sudden incidents, revealing the early warning criteria for heterogeneous signal fusion [12,13].
Despite these advances, a spatially continuous, visualized regional detection and early warning system for coal and gas outbursts has not yet been developed appropriately [14,15,16]. The Kriging algorithm, a statistical branch developed by the French statistician G. Matheron in the 1960s, is essentially based on the theory of regionalized variables and the variogram [17,18,19]. Such an algorithm is mainly employed to investigate natural phenomena that exhibit both randomness and structure or spatial correlation and dependence. As a complex dynamic disaster, the occurrence of coal and gas outbursts is the result of multiple influencing factors. From a geostatistical perspective, these factors possess the characteristics of regional variables and exhibit different quantitative features depending on the location [20,21].
Kriging, as a spatial interpolation or estimation method, derives the data for any given point or region based on the data from known points or areas [22]. By considering the spatial relationships between sample points and prediction points, Kriging provides unbiased optimal estimations and estimates the prediction accuracy. This study is mainly focused on the No. 9 coal seam of the Longfeng Coal Mine in Guizhou Province, using the Kriging algorithm to examine the characteristics of gas occurrence and early warning of danger in the presence of complex geological conditions [22,23]. By measuring key parameters (such as gas content and gas pressure) of the No. 9 coal seam, analyzing the influential factors (i.e., geological structures, gas outbursts, coal body structure, and coal quality), and considering the spatial positions of prediction points or surfaces, this study aims to achieve more reliable predictions and early warnings [22,24,25]. This provides a scientific basis and guarantee for realizing the sustainability of deep mining, predicting and preventing coal and gas outburst events, and ensuring the safety of coal mine production.

2. Engineering Geological Overview

The understudy region is located on the southern flank of the Upper Yangzi Plateau’s Daloushan Dorsal Slope, and the tectonics are dominated by folds, as presented in Figure 1.
The general structure of the mining area is a monocline with a southeast–northwest trend with few faults. A total of 11 faults have been identified within the mine area, all of which are hidden faults. Among them, no fault with a length of more than 30 m was identified. In particular, fault F1 was traced based on the mine engineering plan for the tunnels and borehole data from wells 3-1, 4-1, and 5-1, as well as from the mine tunnels. It was determined to be a minor fault that runs through the mine area from north to south. The direction of normal faults generally tends to be north–south with a dip to the east, whereas the reverse faults usually trend east–west with a dip to the south.
This description identifies structural characteristics and fault distribution in the region, which is of great importance in understanding gas occurrence and migration patterns, as well as the stability of mining operations.

3. Coal Seam Parameter Determination

3.1. Gas Properties

Coal gas, primarily methane (over 90%), also contains small amounts of ethane, propane, butane, hydrogen sulfide, carbon dioxide, nitrogen, water vapor, and traces of inert gases like helium and argon. With a relative density of 0.554 compared to air and a density of 0.716 kg/m3 at standard conditions, coal gas is 1.6 times more permeable than air, insoluble in water, and highly diffusible in air.
The adsorption of coal gas by coal is physical under a certain pressure, with an adsorption heat below 20 kJ/mol. The force between coal and coal gas molecules comes from Debye induction and London dispersion. Adsorption releases heat, while desorption absorbs heat. Increased coal gas pressure raises adsorption speed, and higher temperatures reduce adsorption. At the same temperature, higher pressure boosts adsorption; at the same pressure, higher temperatures lower it.
Coal gas, lighter than air, tends to accumulate in the upper parts of mining spaces. Its diffusion ability exceeds that of air, allowing it to spread quickly in mines and potentially cause explosions upon reaching a certain concentration and encountering a heat source.

3.2. Gas Pressure

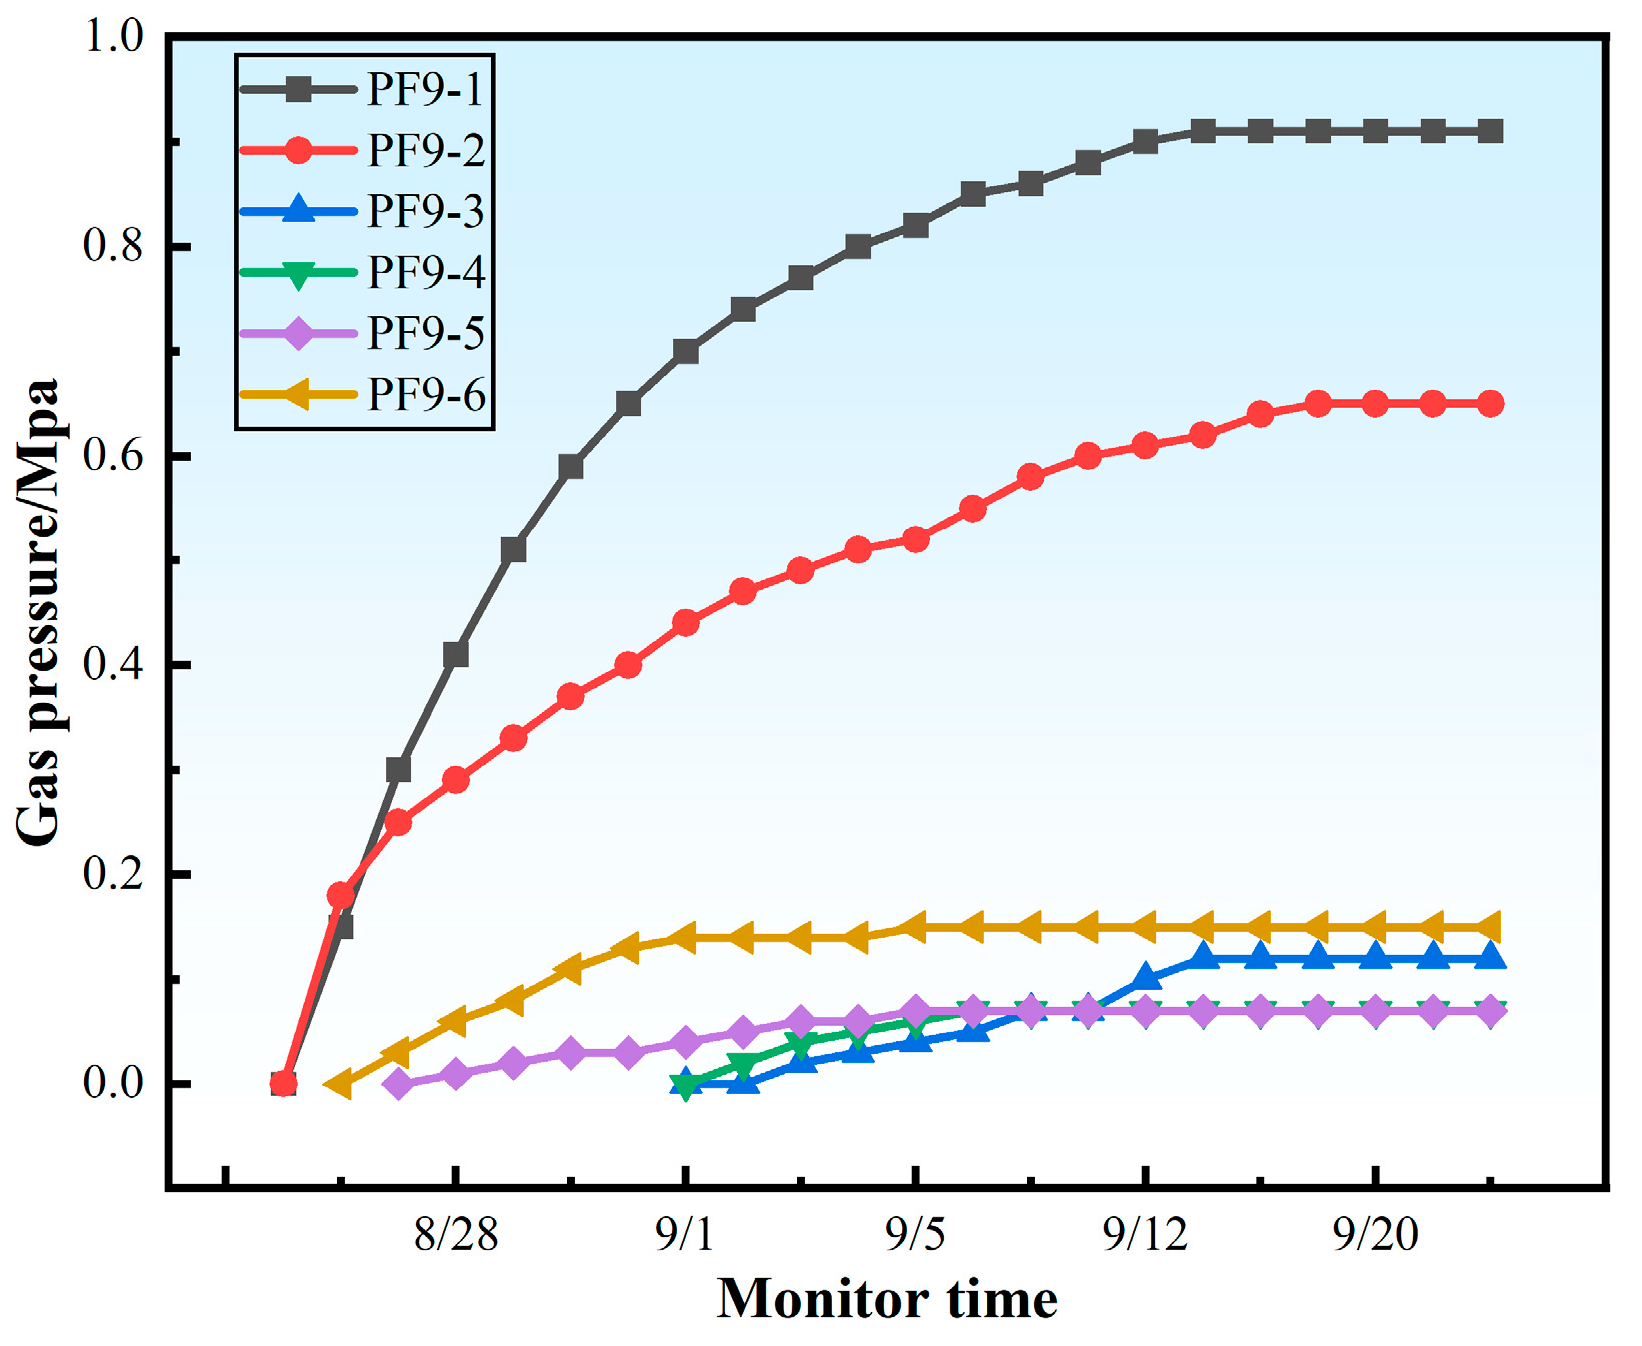
According to the “Direct Determination Method of Coal Seam Gas Pressure in Underground Coal Mines” (AQ/T1047-2007) [26], the passive pressure measurement methodology was adopted for the No. 9 coal seam in the second mining area of Longfeng Coal Mine. This measurement approach is essentially based on exposing the coal seam by drilling a hole to balance the gas pressure after the pressure measurement drilling hole has been sealed and then to determine the gas pressure of the coal seam. The measurement locations are provided in Table 1 and the measurement results are illustrated in Figure 2.

3.3. Gas Content

Considering the development status of the No. 9 coal seam in the No. 2 mining area, and after consulting with the relevant technical staff of the mining company, it was decided to organize 6 core-sampling boreholes around the pressure measurement borehole. The collected samples were sealed and checked for in situ air-tightness; without detecting gas leakage, gas desorption tests were carried out on coal samples in the field. The desorbed coal samples were then transferred to the laboratory for further analysis of the residual gas content. The obtained results are provided in Figure 3.

3.4. Gas Flow Decay Coefficient in Boreholes

The natural gas emission characteristics of boreholes can be essentially represented by two parameters: the initial gas emission intensity (q0) and the gas flow attenuation coefficient (α). This coefficient is a crucial indicator for assessing the difficulty of pre-draining gas from the coal seam. The boreholes were drilled at representative locations, where the initial gas flow rate (q0) was first measured [27,28]. After a period of time (t), the gas flow rate (qt) was measured again. The natural gas flow attenuation coefficient (α) can be calculated through regression analysis using Equation (1):
q t = q 0 e a t ,
where qt represents the natural gas flow rate from the borehole at time (t) after the start of production (unit: m3/min);
q0 denotes the natural gas flow rate from the borehole at time (t = 0) (note: m3/min); α signifies the drilling natural gas flow attenuation coefficient (unit: d−1); and t is the drilling gas flow self-flushing time (unit: d).
The values of the factors q0 and α can be determined by measuring the natural gas flow rate from the borehole at various times and performing regression analysis on the above formula. By integrating from both sides of Equation (1), the total natural gas flow from the borehole (Qt) at any time is yielded as follows:
Q t = 1440 0 t q t d t = 1440 0 t q 0 e a t d t = 1440 q 0 1 e a t α
where Qt represents the total natural gas flow from the borehole at any arbitrary time t (unit: m3), and QJ denotes the maximum natural gas flow from the borehole (unit: m3) (Table 2).

3.5. Determination of the Coal Seam Permeability Coefficient

The permeability coefficient of the coal seam represents a crucial index for measuring the difficulty of both gas flow and gas pre-drainage in the coal seam. Its physical meaning is as follows: in a coal body of 1 m length, when the square difference of pressure is 1 MPa2, the volume of gas in cubic meters flows through the coal seam section of 1 square meter every day.
This measurement employs the radial flow approach to directly measure the permeability coefficient of the underground coal seam, and its calculation is essentially based on the unsteady radial flow model. After the pressure of the measuring borehole becomes stable, the pressure gauge is removed, and the flow rate of the coal seam borehole is measured at various time intervals by a flowmeter or gas meter. According to the unsteady radial flow model, the formulas listed in Table 3 are effectively utilized for the sake of experimental calculations and possible checking. The obtained results are provided in Table 3.
In Table 3, the presented factors are defined as follows: Y—flow number, dimensionless; F0—time criterion, Q dimensionless; P0—the original gas pressure of the coal seam (table pressure plus 0.1), MPa; P1—the gas pressure in the borehole, which is generally equal to 0.1 MPa; r1—the radius of the drill hole, (r1 = 0.0375 m); λ—coal seam permeability coefficient, m2/(MPa2·d); q—at the time t of gas drainage time, the gas flow rate per unit area of borehole coal wall, m3/(m2·d), can be determined by the formula: q = Q/2πr1L; Q—borehole flow rate measured at time t, m3/d; L—the borehole’s length, which is generally set as the thickness of the coal seam, m; t—time from borehole pressure relief to the measurement of borehole gas flow, d; α—coal seam gas content coefficient, m3/(m3·MPa0.5), α = X / P ; X—the volume content of the coal seam gas, which is calculated as the product of the coal seam gas content (the maximum value calculated by the direct method and indirect method) and the coal seam bulk density, m3/m3; and P—the gas pressure when determining the gas content of coal seam, MPa.
This time, the hole with a larger gas pressure is selected for measurement (Table 4).

3.6. Determination of Other Parameters of Coal Seam

Given the No. 9 coal seam of Longfeng Coal Mine, the bulk density, firmness coefficient (f), failure type, initial velocity of the gas emission, adsorption constant, and industrial analysis of coal are also measured. The obtained results are presented in Table 5.

4. Application of the Kriging Algorithm for Advanced Identification Prediction

4.1. Exploratory Spatial Data Analysis

The linear unsteady universal Kriging method (UK) is employed here for the sake of an exploratory spatial analysis of data. To apply the universal Kriging approach for unbiased linear estimation, the trend in the data is fitted, and then the original data are subtracted from the fitted data for Kriging analysis. Finally, the results of trend analysis and residual analysis are added to form the estimators obtained by the universal Kriging method. As the most basic data collected, the gas content data provide supplementary data with reliable analytical insights [29,30,31]. Therefore, the gas content data with the most complete data are selected as the analysis data for exploratory data analysis.

4.1.1. Frequency Analysis

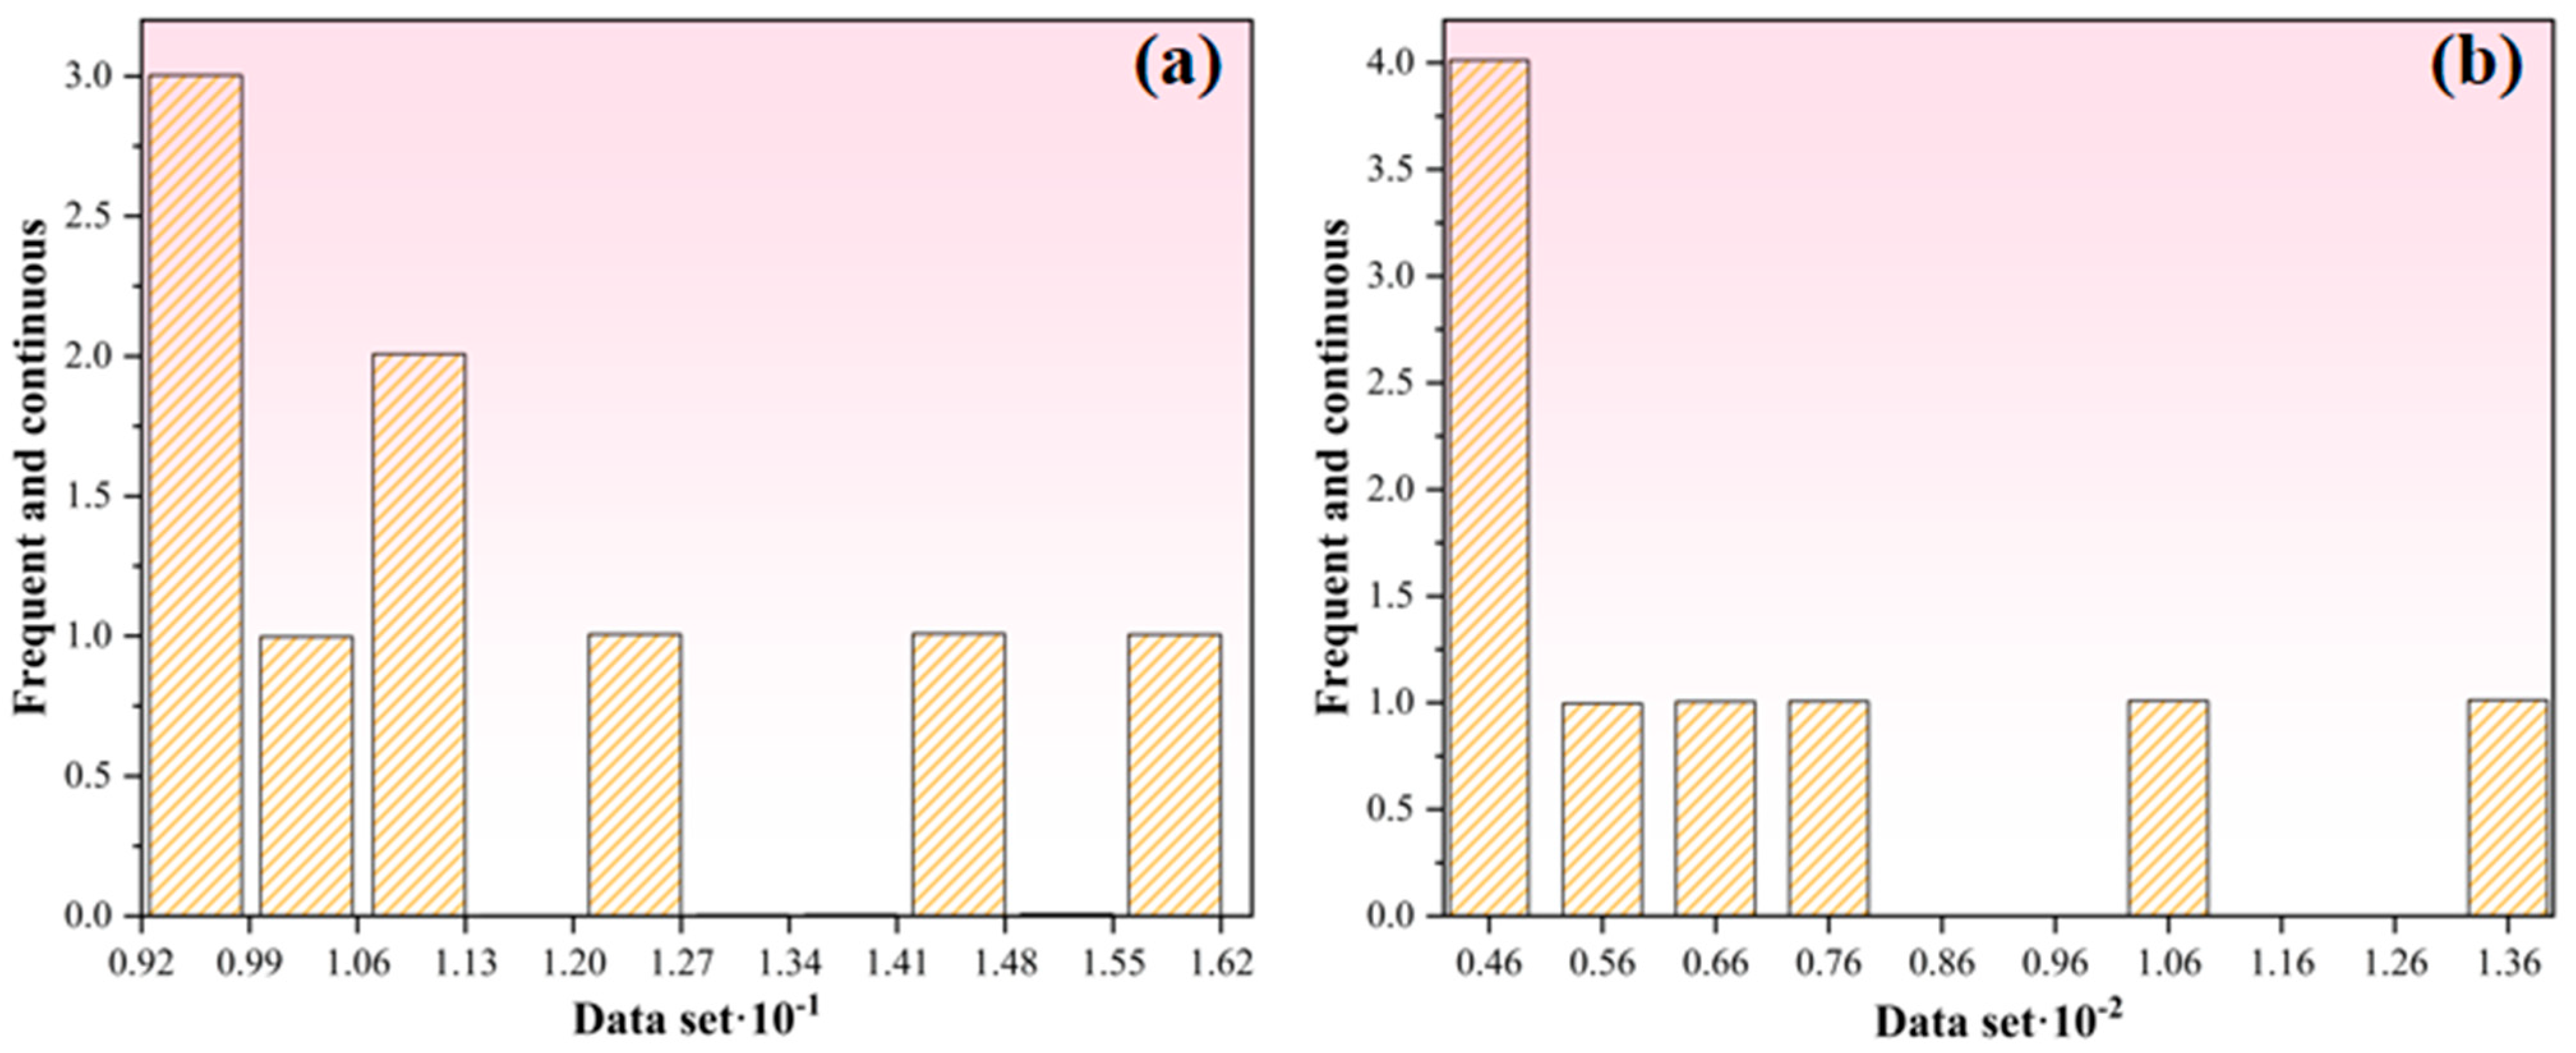
Frequency analysis is the most basic step in the exploratory data analysis process, which can effectively distinguish datasets. Basic statistics such as the number of variables, minimum value, maximum value, arithmetic mean, standard deviation, quartile, three quartile, and median can be obtained directly from the histogram. The skewness and kurtosis determine whether the data conform to a normal distribution, and pave the way for the subsequent selection of the Kriging model. Using the untransformed histogram of gas content, we can arrive at the data results provided in Table 6. The presented data demonstrate that the kurtosis of the histogram of the untransformed gas content data is 2.62, and only when the kurtosis is close to 3, the data conform to a normal distribution, so the dataset can be transformed so that the data conform to a normal or near-normal distribution.
This method of transforming the data can be applied to the problem by log variation and Box–Cox power function variation, which represent a specific approach for changing the form of the data by a transformation parameter (λ), which could improve the characteristics of the normality, symmetry, and the equality of variance of the data to some extent. For this purpose, the variation formula is defined as follows:
y λ = y λ 1 λ ,     λ 0 ln y ,     λ = 0
where y λ represents the new data after transformation, y is the original data, and λ denotes the transformation parameter.
After the application of the inverse transformation (λ = 2) to obtain Figure 4, from the above table, the transformed histogram of the gas content data kurtosis is predicted to be 3.04. At this time, the transformed data are more consistent with the near-normal distribution, and the required predictions can be carried out after the linear smooth ordinary Kriging approach. To intuitively observe the characteristics of the normal distribution, the normal QQ distribution plot can be derived, as illustrated in Figure 5. According to the plotted results, if the data points and the 45° line become closer, the data under investigation are closer to the normal distribution, as presented in the figure, (λ = 2).

4.1.2. Outlier Analysis

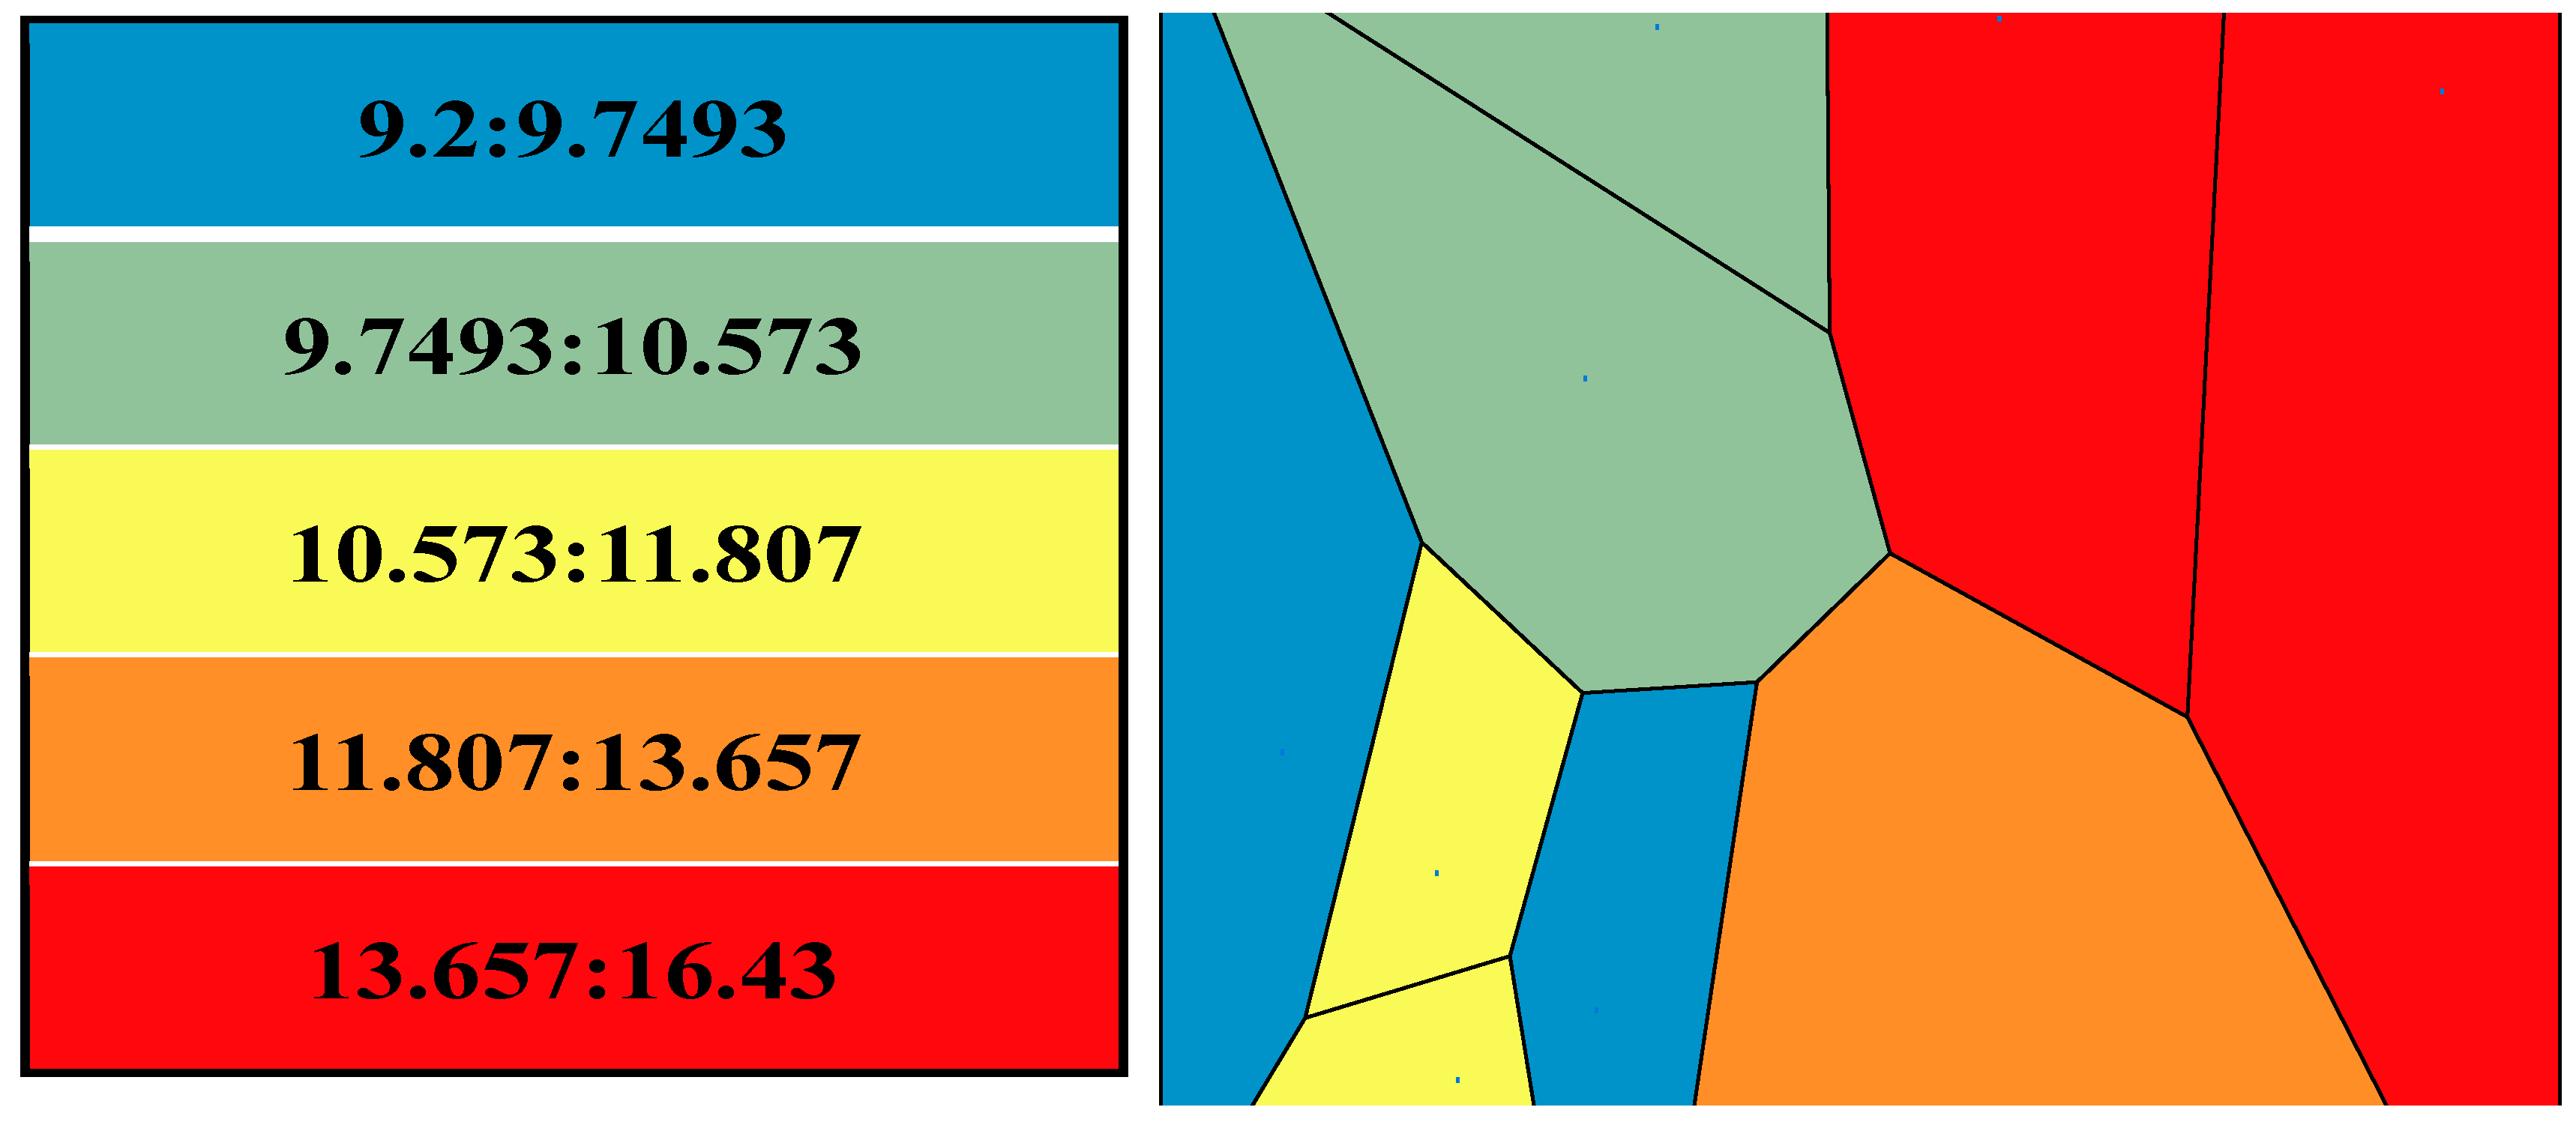
An outlier is a value in a dataset that deviates by about 1/2 from the observed value. An outlier may be an extreme value that occurs in the entire population and is part of the overall population along with the rest of the values, but if it is the result of anobservation, measurement, or calculation error, it represents an abnormal value and should be discarded. Therefore, if outliers occur in a dataset, they should be retained, modified, or excluded in conjunction with the professional analysis. The outliers are generally classified into two categories according to the data, global outliers and local outliers, and the polygonal calculation approach of cluster analysis is utilized to calculate the gas content data, with the results provided in Figure 6. The histograms of gas content are of the steep-wall type, and the values from 9.9 to 16.4 m3/t can be considered as outliers of the whole group; however, in the context of professional analysis, these data belong to the measured data of research mines with small sample dimensions and normal data, so they should not be eliminated. In other words, there are no outliers in all of the gas content data.

4.1.3. Global Trends

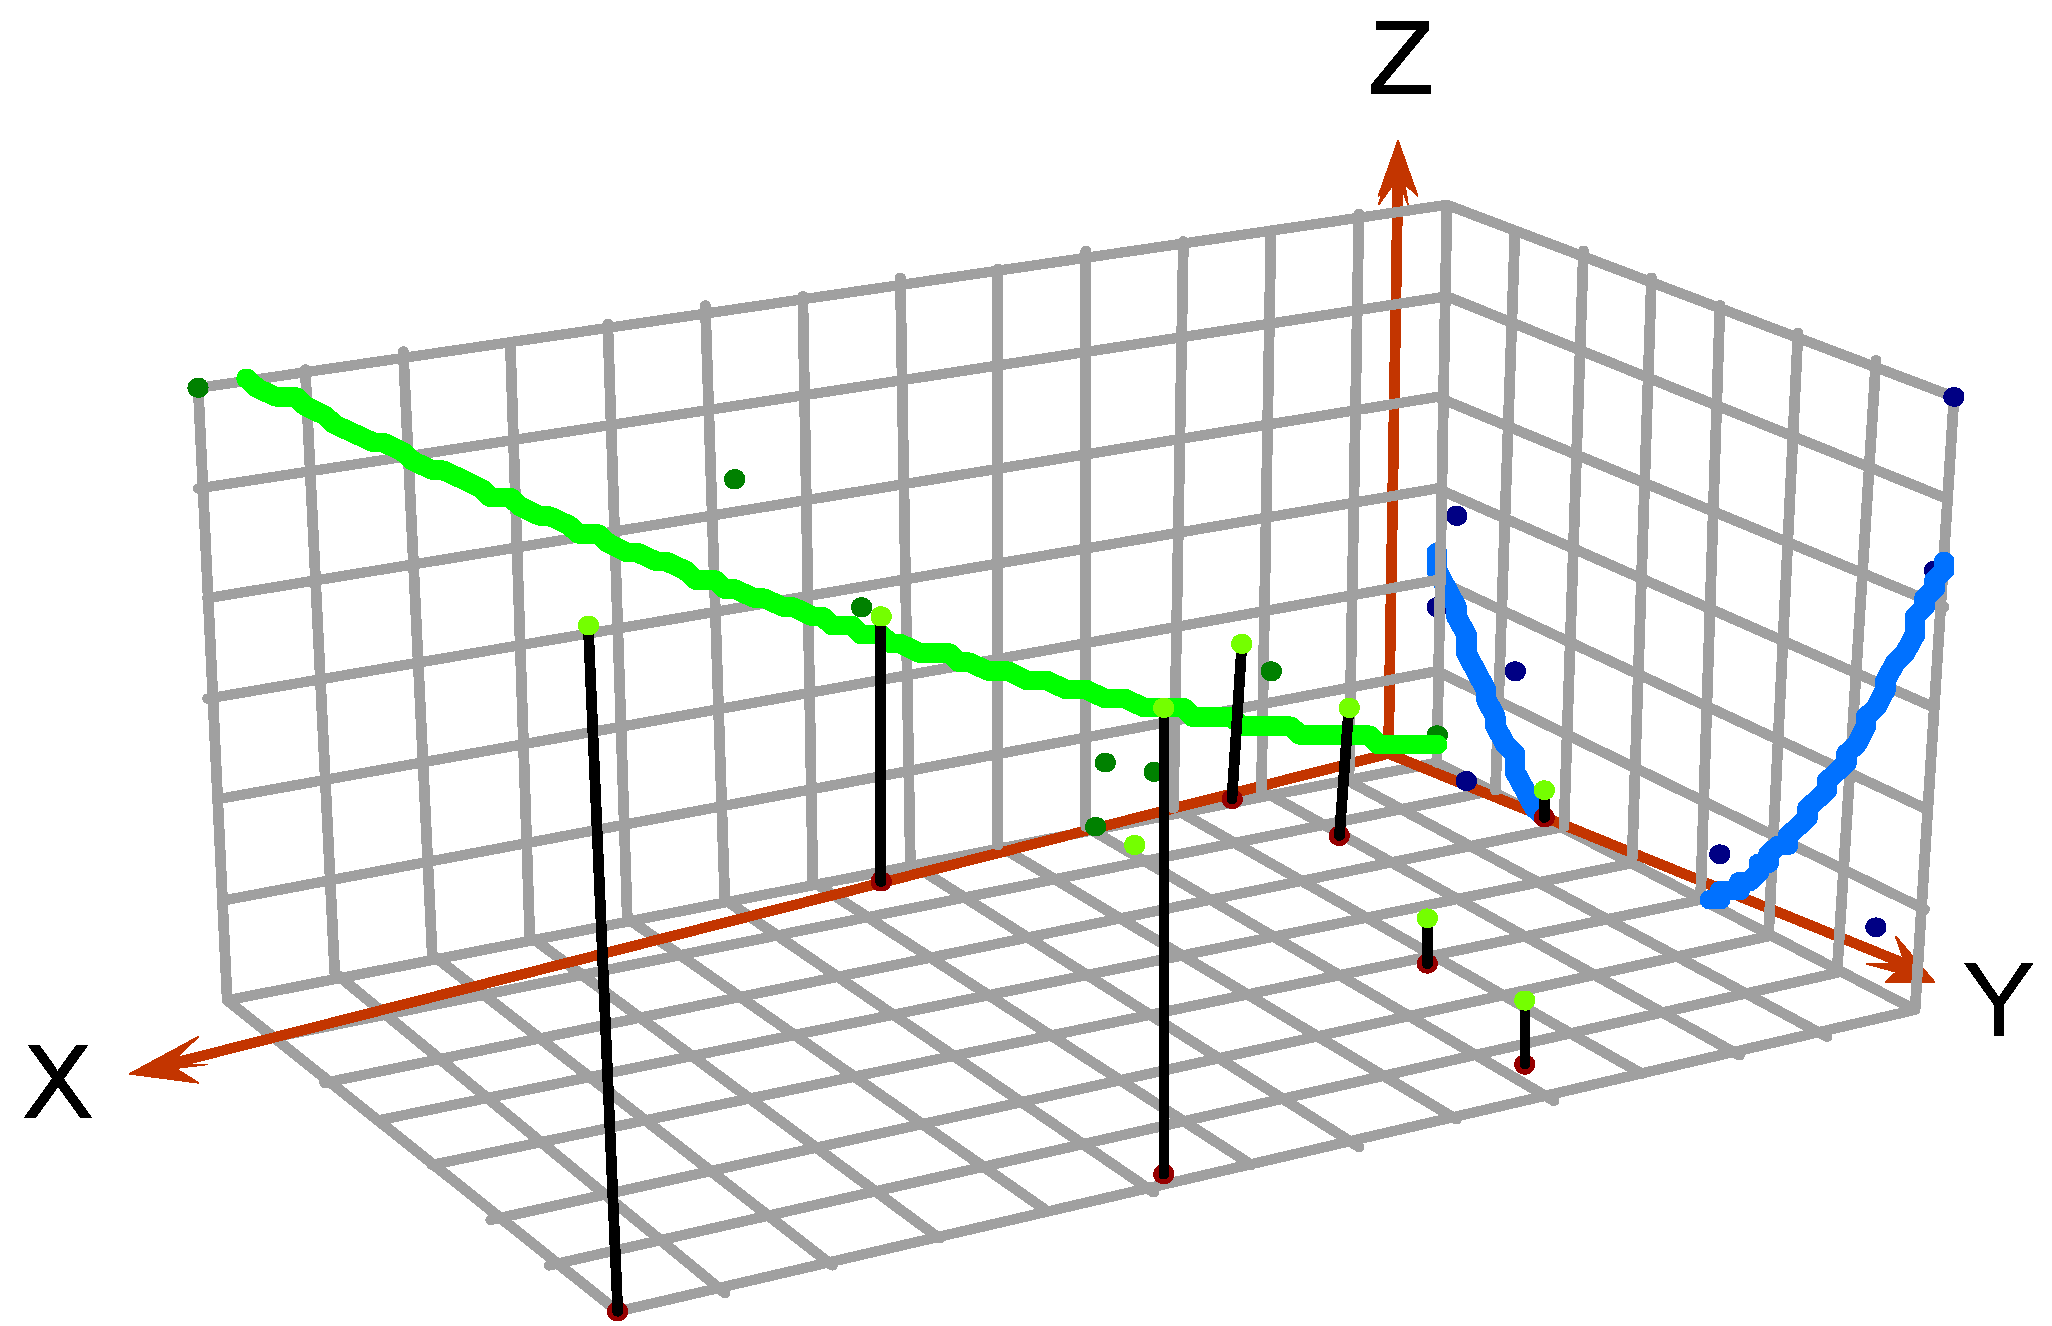
The global trend plot is obtained by projecting the dataset onto two two-dimensional planes in a three-dimensional plot and fitting the data points via a polynomial function. If the fitted curve is flat, there is no global trend in the dataset, and if not, there is a global trend in the dataset in a certain direction. The projection of the size of the gas content data points yields Figure 7, where the positive Z-axis represents the north direction. From the figure, it can be seen that the gas content data points show a gentle upward trend from the south to the north (green line in the figure), whereas the blue line demonstrates a trend from large to small and then large from the west to the east. This indicates that the maximum value is in the northeast direction and the minimum value is located in the center of the region. The maximum is predicted to be 16.43 m3/ton, which is located in 2021-4, 1200 m from the wind gate on the bottom extraction line of wind line 59210. From the global trend analysis, we can obtain the trend of the second-order polynomial function of the gas content data, and when predicting, we should pay attention to the linear relationship with the second-order function. Since there are no outliers, there is no need to eliminate the trend of the second-order polynomial function.

4.2. Variation Function

As a tool, the variogram can describe the correlation and variability of data in space, helping us understand how the continuity and scale of data change across different regions. As a basic tool of geostatistics for describing regionalized variables, the variogram is the basis of Kriging algorithm estimation. It is commonly utilized to represent the variance between the increments of two regionalized variable values, Z(X) and Z(X + h), from h (the modulus of vector h) and the change of a point in one-dimensional, two-dimensional, or three-dimensional spaces. This can be mathematically stated by the following:
γ X , h = 1 2 V a r Z X Z X + h = 1 2 E Z X Z X + h 2 1 2 E Z X E Z X + h 2
If the regionalized variable satisfies the second-order stationary assumption or the intrinsic assumption, then for any h, there exists the following:
E Z X + h = E Z X
γ X , h = 1 2 E Z X Z X + h 2

4.2.1. Theoretical Model Selection

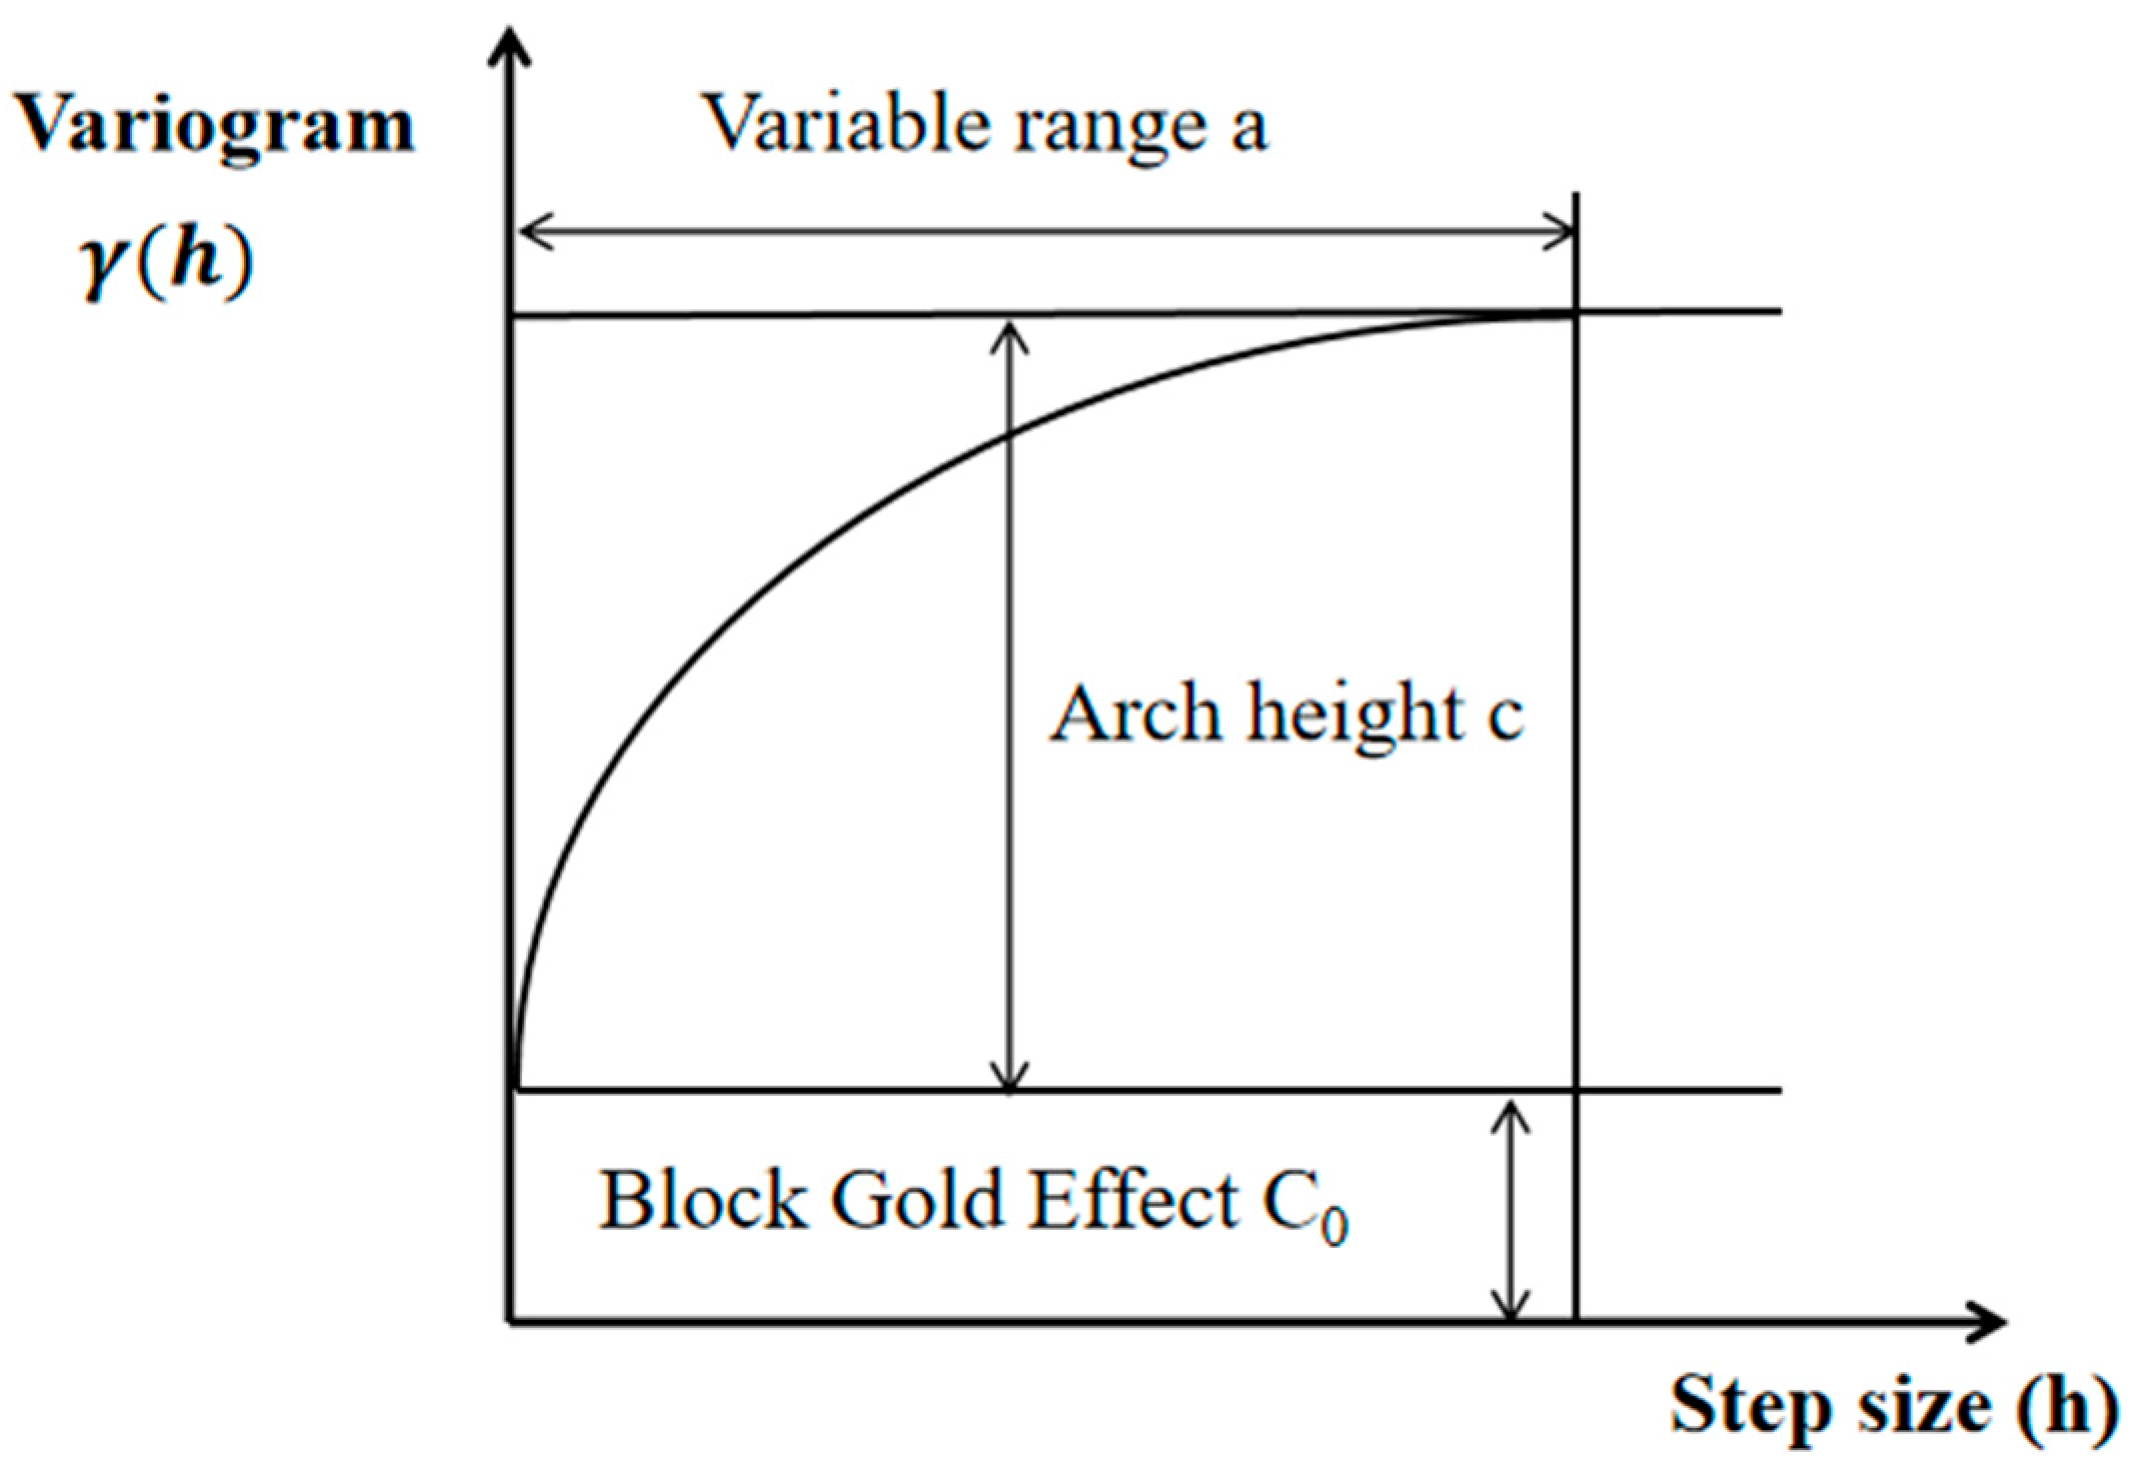
To quantitatively describe the characteristics of the entire regionalized variable, it is necessary to select an appropriate theoretical model that could truly reflect the variation law of the experimental variogram, as illustrated in Figure 8.
As presented in Figure 8, the variation function γ (h) increases monotonically with the growth of h, but when the step size h is larger than α, γ (h) is stabilized at α, which is called the ‘leapfrog phenomenon’. In this statement, α represents the variation range and γ (α) denotes the abutment value. In the figure, there are three important features of the variational function, the range α, the arch height c, and the nugget effect C0. It should be noted that the range of α is the size of the range of influence of the regionalized variable, which reflects the size of the autocorrelation range of the variable, i.e., the spatial variability scale or the spatial autocorrelation scale of the variable. The arch height (c) represents the part of the variable where the variable structure has been changed; in addition, the nugget effect C0 reflects the size of the randomness within the regionalized vectors, which may be the size of the microscale, where such a scale is smaller than the internal variability that occurs at the h scale, or it may be caused by errors. C0 + c is the abutment value, which indicates the value of the variability function at the largest scale [30,32,33].
The experimental variability function should be calculated for various hi before selecting the model. According to the distribution of gas content data points in the plan view and the specific values, the formula in the two-dimensional direction is adopted for calculation in the following form:
γ * h = 1 2 N h i = 1 N h Z x i Z x i + h 2
The theoretical models of the variational function are classified into models with and without abutment values according to the abutment value classification, among which the traditional linear smooth models are classified as spherical (8), exponential (9), and Gaussian (0). The model formulas can be expressed as follows:
γ h = 0 C 0 + C 3 2 × h α - 1 2 × h 3 α 3 C 0 + C h = 0 0 < h α h > α
γ h = 0 C 0 + C ( 1 e h α ) h = 0 h > 0
γ h = 0 C 0 + C ( 1 e - h 2 α 2 ) h = 0 h > 0
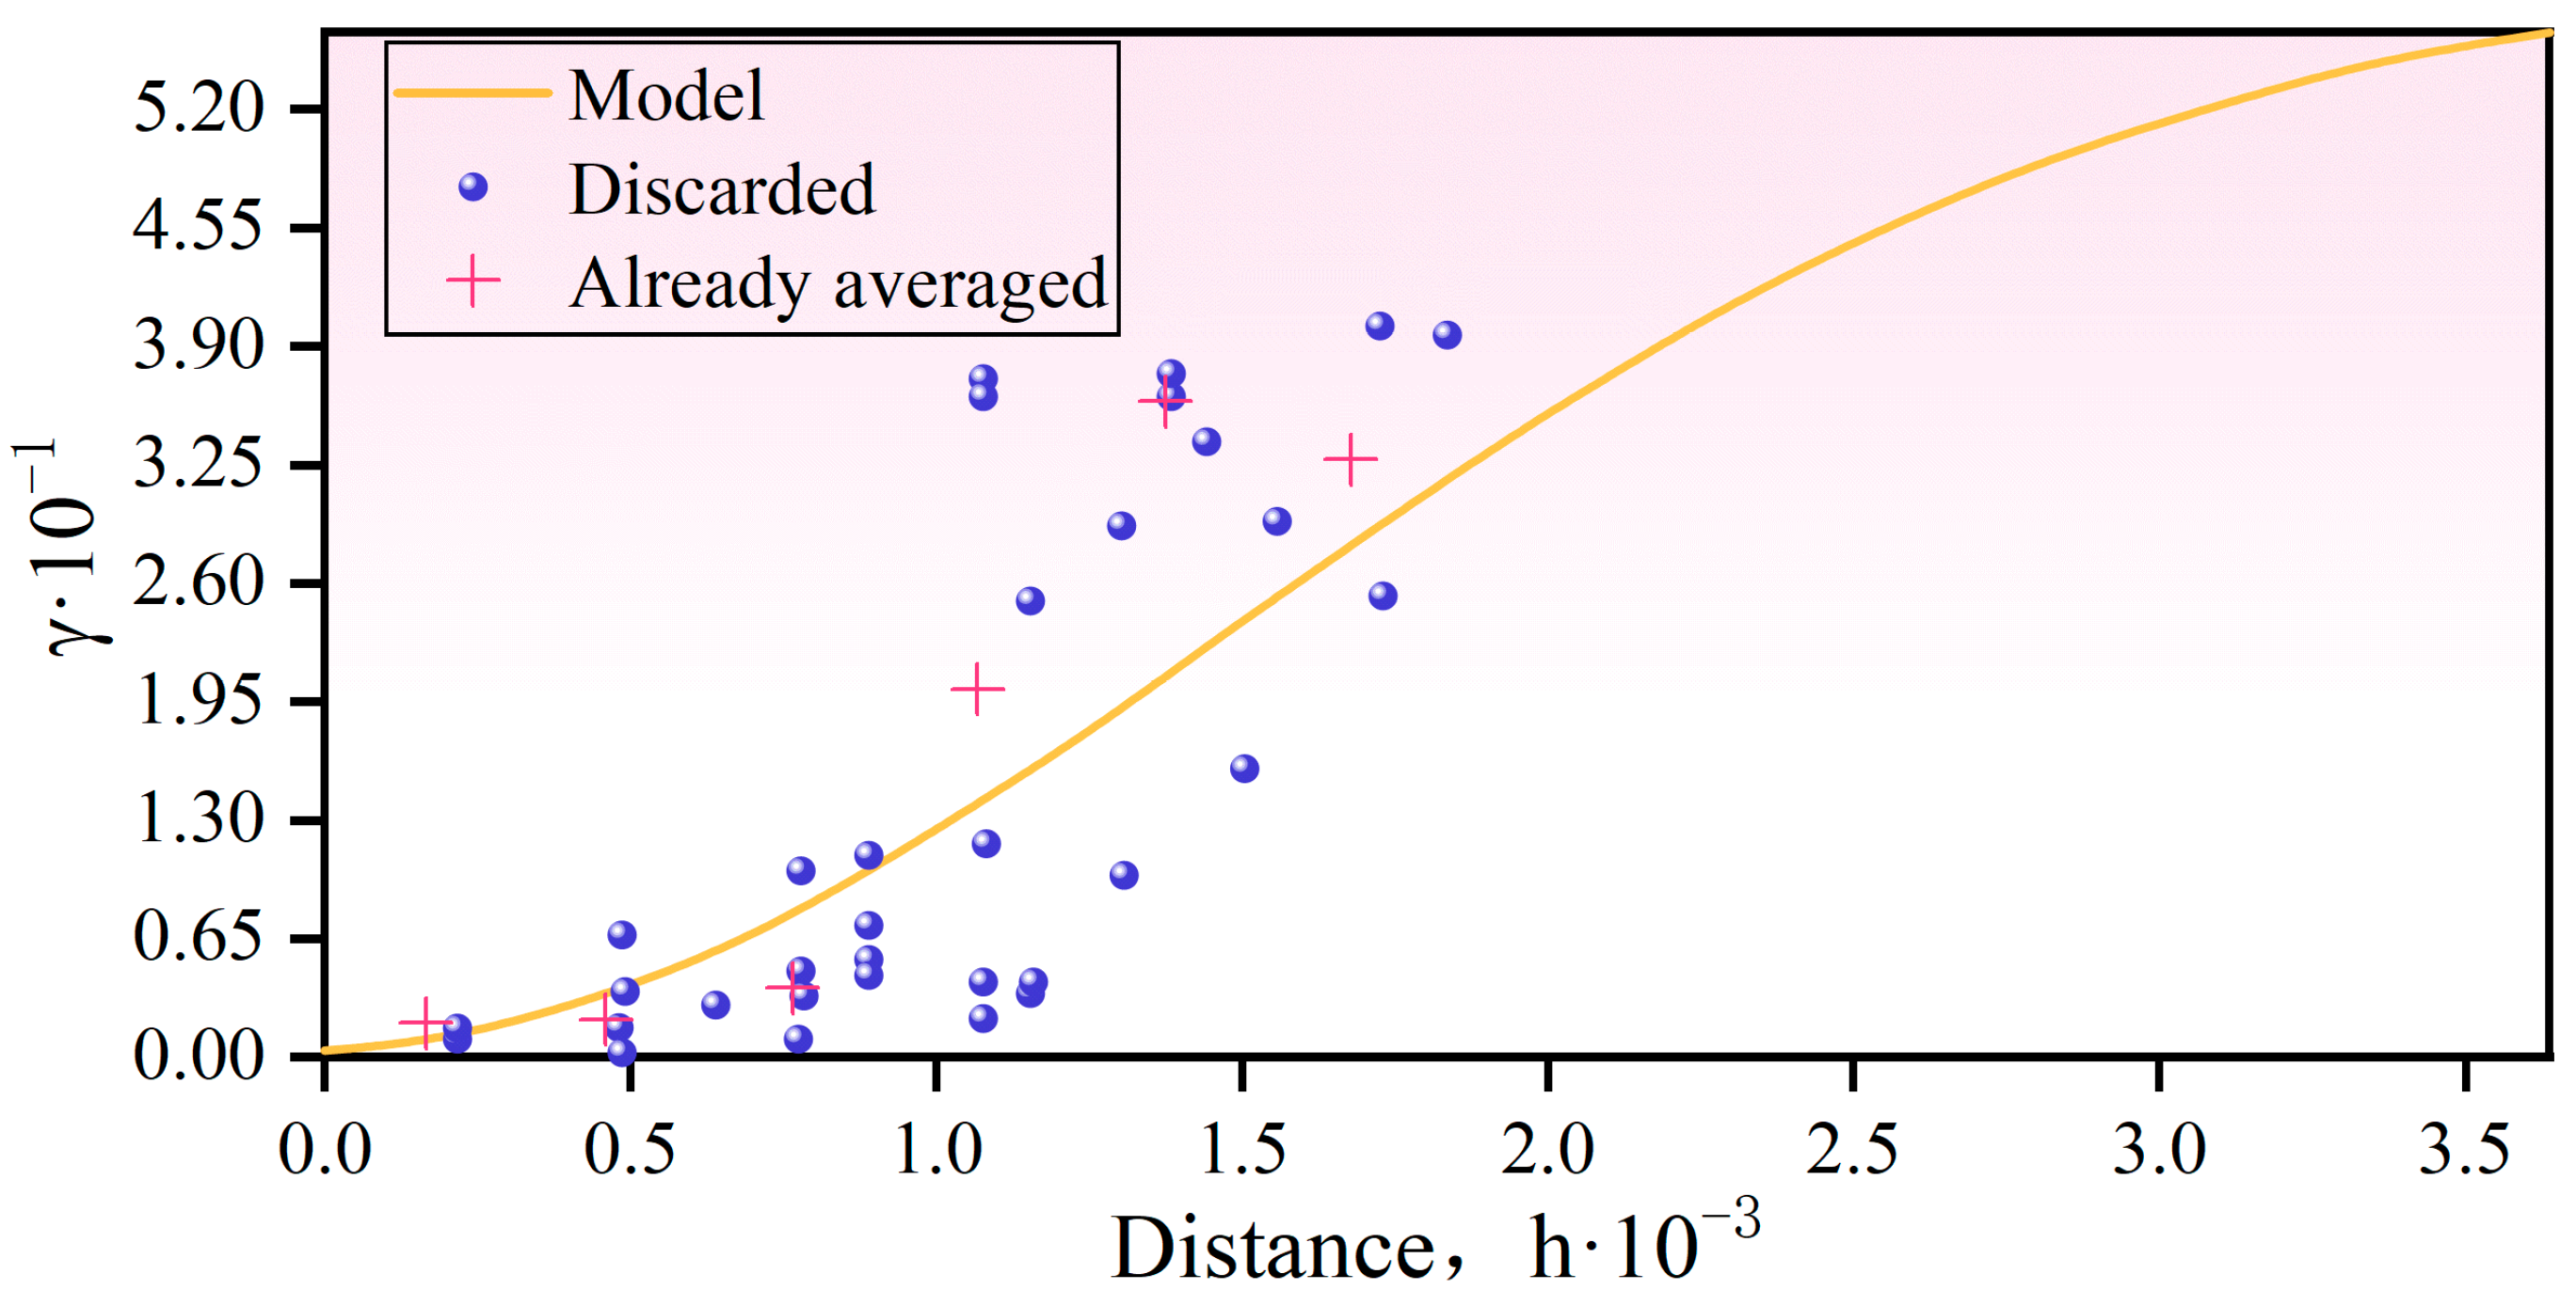
The selection of the theoretical model is often judged based on the calculated experimental variogram of the variogram function, and a suitable theoretical model is initially identified based on the variogram trend. For the theoretical model for the gas content data, we assumed that the regionalized variable dataset conforms to second-order linear smoothness, and we used ordinary Kriging to empirically analyze the semivariance function. The boundary conditions for the model comparison were set to a search angle in the east direction (rightward in the figure), a tolerance of 45, and a bandwidth of 3. The data stability model was then implemented to analyze the stability of the semivariance function to obtain the step size, and the number of steps, with the base value without the gold value of the piece, and the step size was unchanged when changing other models. The model with the smallest arch height among the three theoretical models was selected as the more suitable theoretical model for the dataset.
The parameters of each theoretical model of the variational function are presented in Table 7. The results presented in this table reveal that under the condition of no nugget of gold value, the Gaussian model has the smallest variance value, indicating that the variability in the dataset has the least impact, and so the chosen theoretical model was the Gaussian model.

4.2.2. Variogram Model

The previous analysis steps were only performed without changing the data or removing the data trend. However, the previous analysis showed that the gas content dataset should change the Box–Cox power function. Therefore, after these two data processing steps, the variation function was still solved according to the previous analysis steps, and the summary in Table 8 was obtained. The mutation function model is presented in Figure 9.

4.3. Forecast Algorithm

4.3.1. Search Field

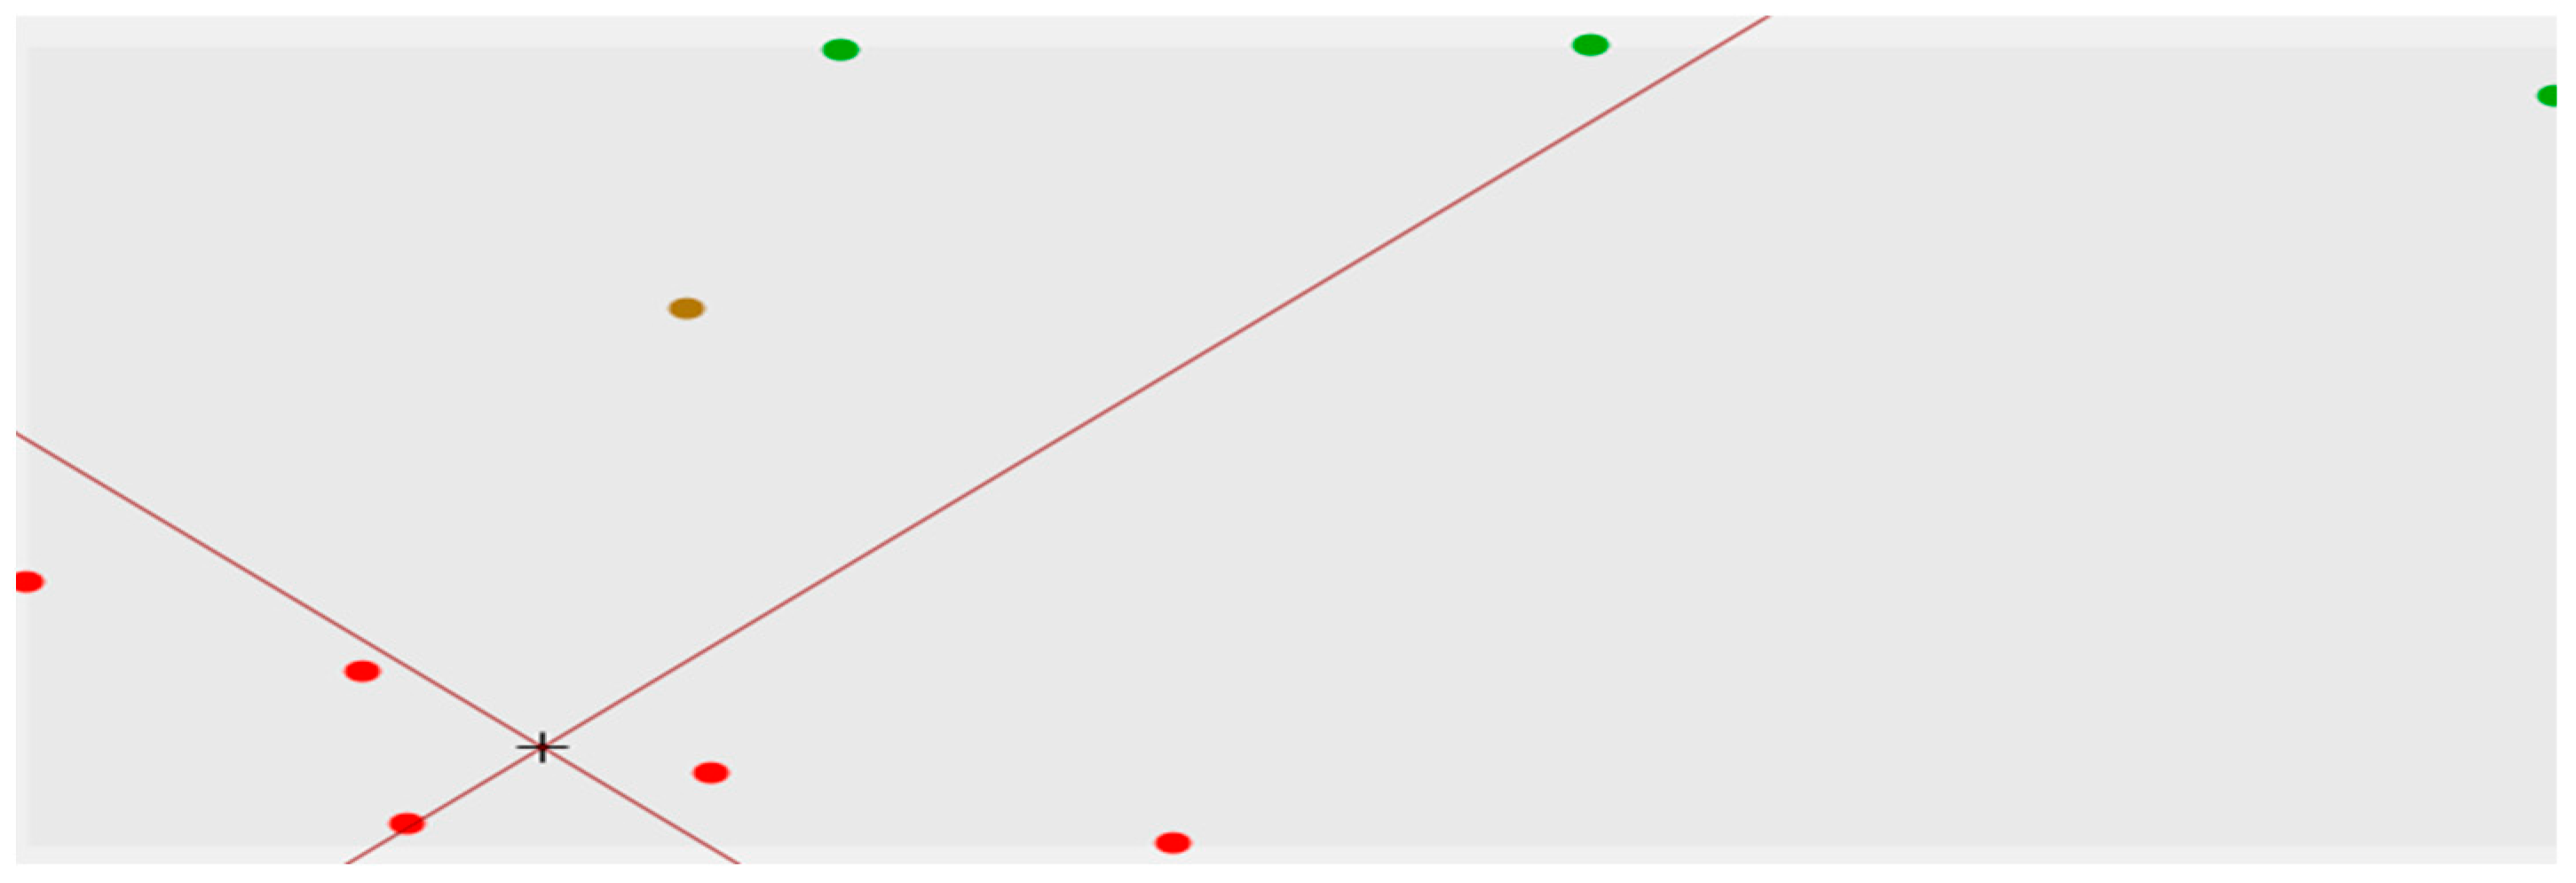
The prediction should set the range of the search field. If the range is set as too large, it will not cause the data to be automatically correlated. On the contrary, if the range is set as too small, it will cause the data to be overly concentrated and have no mutation characteristics. As a result, it is necessary to set the search field of the prediction range. Combined with the content of the previous section, the mutation function characteristics are replicated, and the search field is divided into four partitions. Each partition deviates from 45°, and there are up to seven points in the partition, with at least two points. If there is no point in the partition, then to find the nearest anisotropic long half-axis as the main range value, the short half-axis is the sub-range value, and an elliptical search field is formed. As illustrated in Figure 10, let us take a certain area of the dataset as an example to find the sampling point data. The intersection point of the prediction point and the red point is denoted by the search point.
As illustrated in Figure 10, the search field can be divided into four partitions by the four-direction search method. According to the nearest known data points, the unknown cross points can be appropriately predicted. The XY coordinates and the values of the known data are presented in Table 9.

4.3.2. Ordinary Kriging Prediction

When the dataset meets the second-order stationary hypothesis or the intrinsic hypothesis, the mathematical expectation can be taken as an unknown constant (m) and a variation function,   γ ( h ) . When it exists and is stable, the ordinary Kriging method can be utilized for prediction. Under the condition of satisfying the second-order stationary assumption, there are ordinary Kriging Equation (11) and an ordinary Kriging estimation variance Equation (12):
j = 1 n λ i γ x i , x j + μ = γ - x i , V   i = 1 , 2 , 3 , n i = 1 n λ i = 1
σ o k 2 = i = 1 n λ i γ - x i , V γ - V , V + μ
where λ i are the Lagrange multipliers. To facilitate the calculation, the equations and the estimated variance are expressed by a matrix as follows:
K = γ x 1 , x 1 γ x 2 , x 1 γ x 1 , x 2 γ x 2 , x 2 γ x 1 , x n 1 γ x 2 , x n 1 γ x n , x 1 1 γ x n , x 2 1 γ x n , x n 1 1 0 ,   λ = λ 1 λ 2 λ n μ ,   M =   γ - x 1 , V   γ - x 2 , V   γ - x n , V 1
That is, the expression of a set of linear equations is stated by the following:
K · λ = M
The estimated variance expression is given by the following:
σ o k 2 = λ T M γ - V , V
After the Box–Cox transformation data in Table 6, the Gaussian model is chosen to evaluate the gas content value at 0 points. Hence, the corresponding model takes the following form:
γ h = 0 59.85 + 5885 ( 1 - e - h 2 a i 2 ) h = 0 h > 0 i = ( 1 , 2 )
According to Equation (13), one can now arrive at the following:
γ 11 γ 12 γ 13 γ 14 γ 15 1 γ 21 γ 22 γ 23 γ 24 γ 25 1 γ 31 γ 41 γ 51 1 γ 32 γ 42 γ 52 1 γ 33 γ 43 γ 34 γ 44 γ 35 1 γ 45 1 γ 53 1 γ 54 1 γ 55 1 1 0 λ 1 λ 2 λ n μ = γ 01 γ 02 γ 03 γ 04 γ 05 1
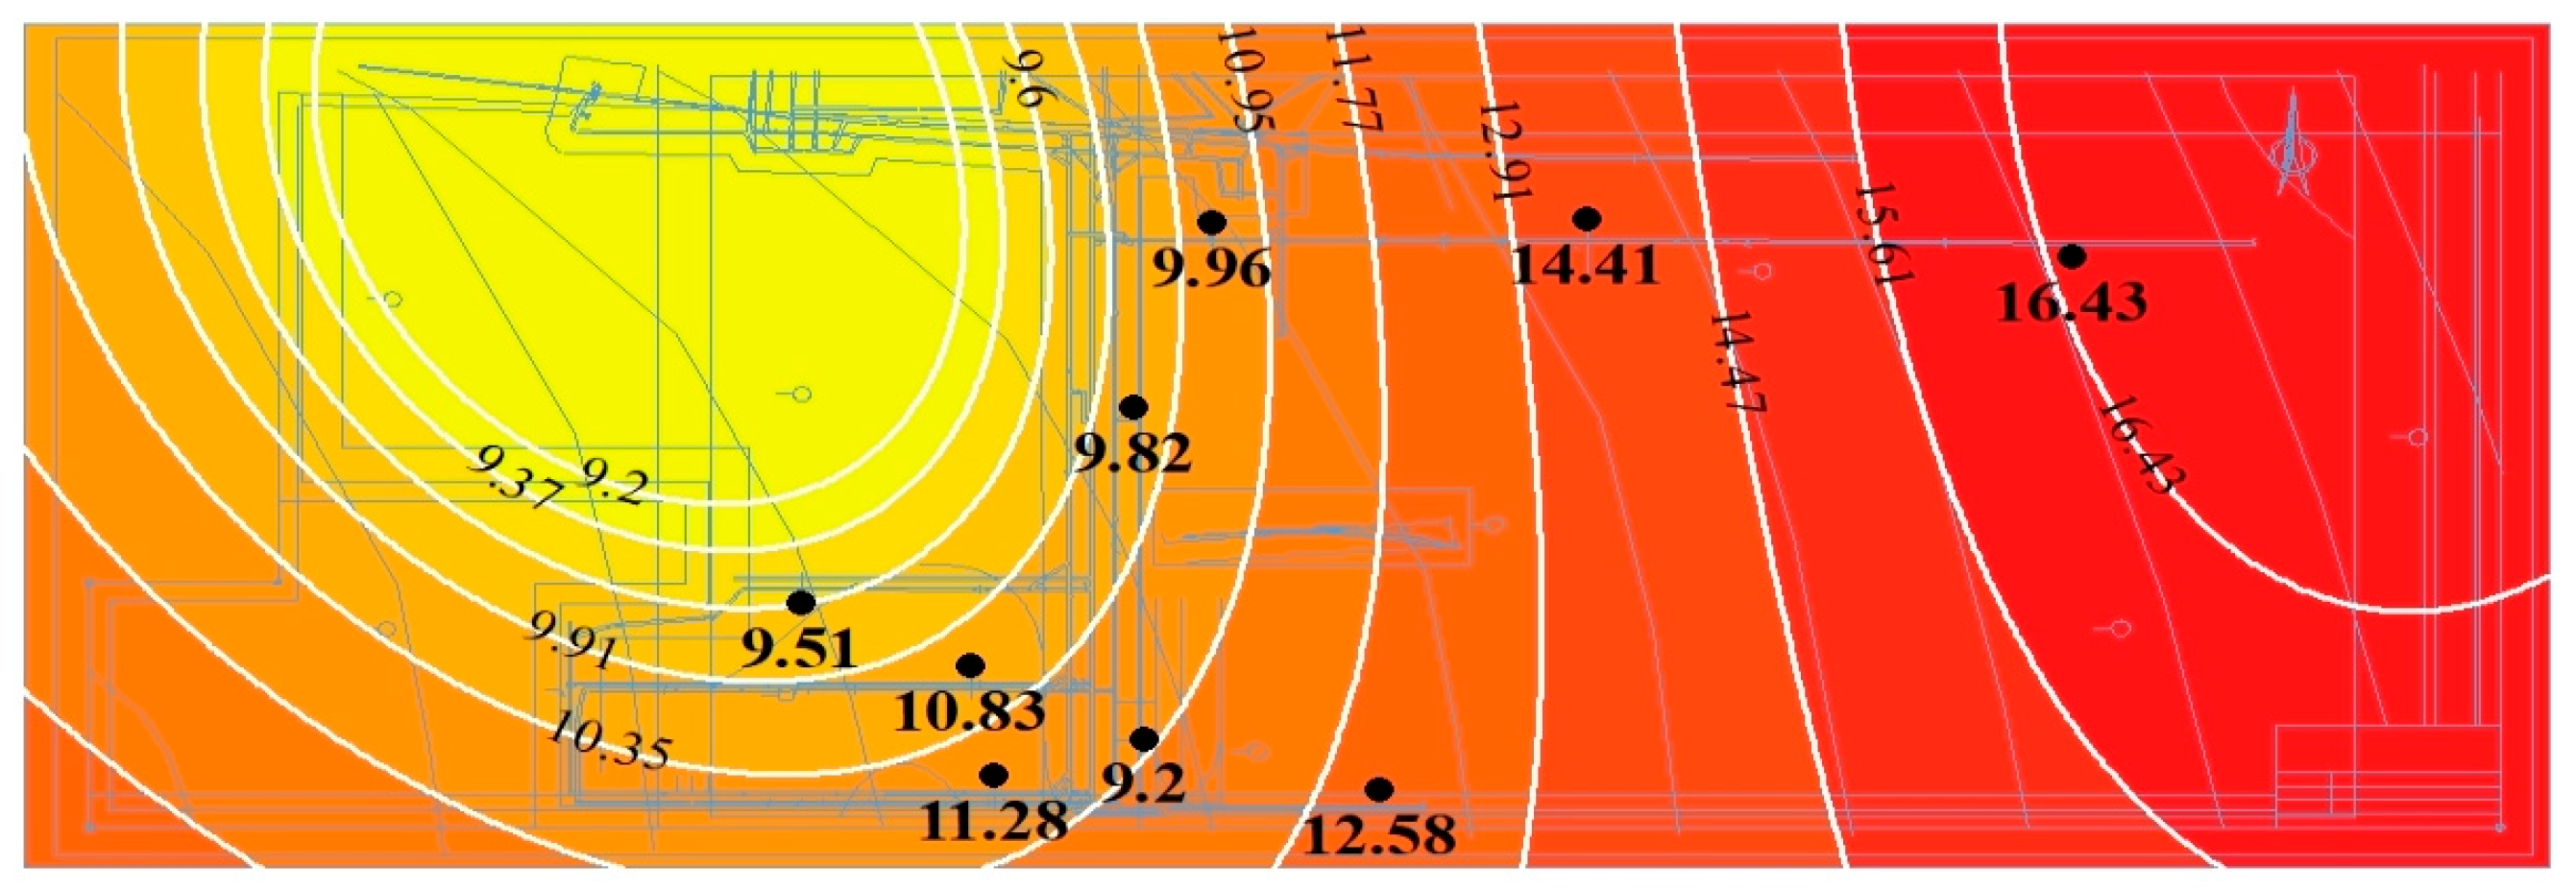
The obtained results are substituted into Equations (11) and (12) to obtain the Kriging estimator and estimated variance of the number 0 point, and the ordinary Kriging prediction surface is then obtained. Using ArcGIS software version 10.8, the gas content prediction surface under the ordinary Kriging method has been presented in Figure 11. The black spots in the figure demonstrate the measured gas content values, while the white lines represent the gas content contours.

4.3.3. Cross-Validation Comparison

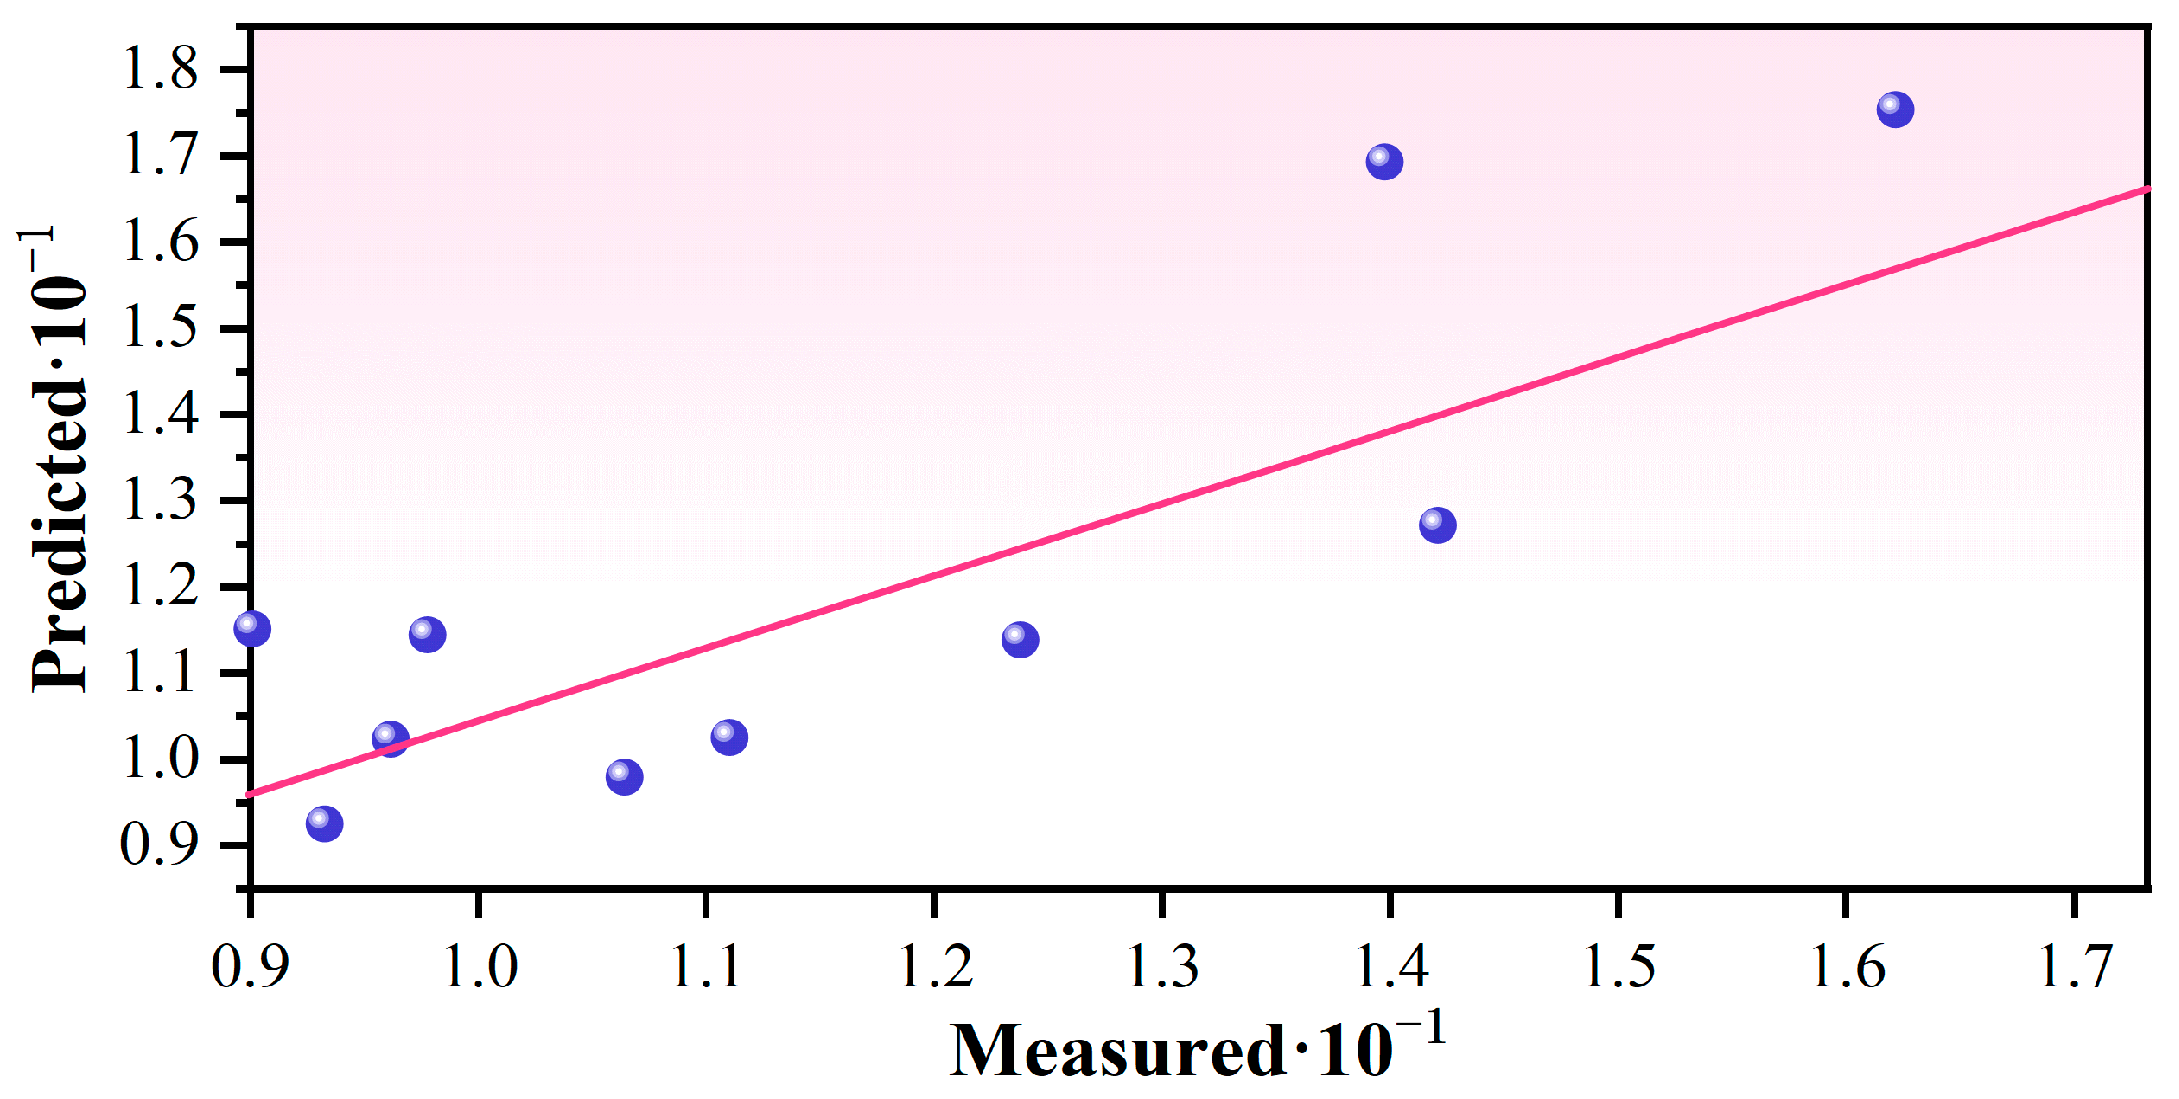
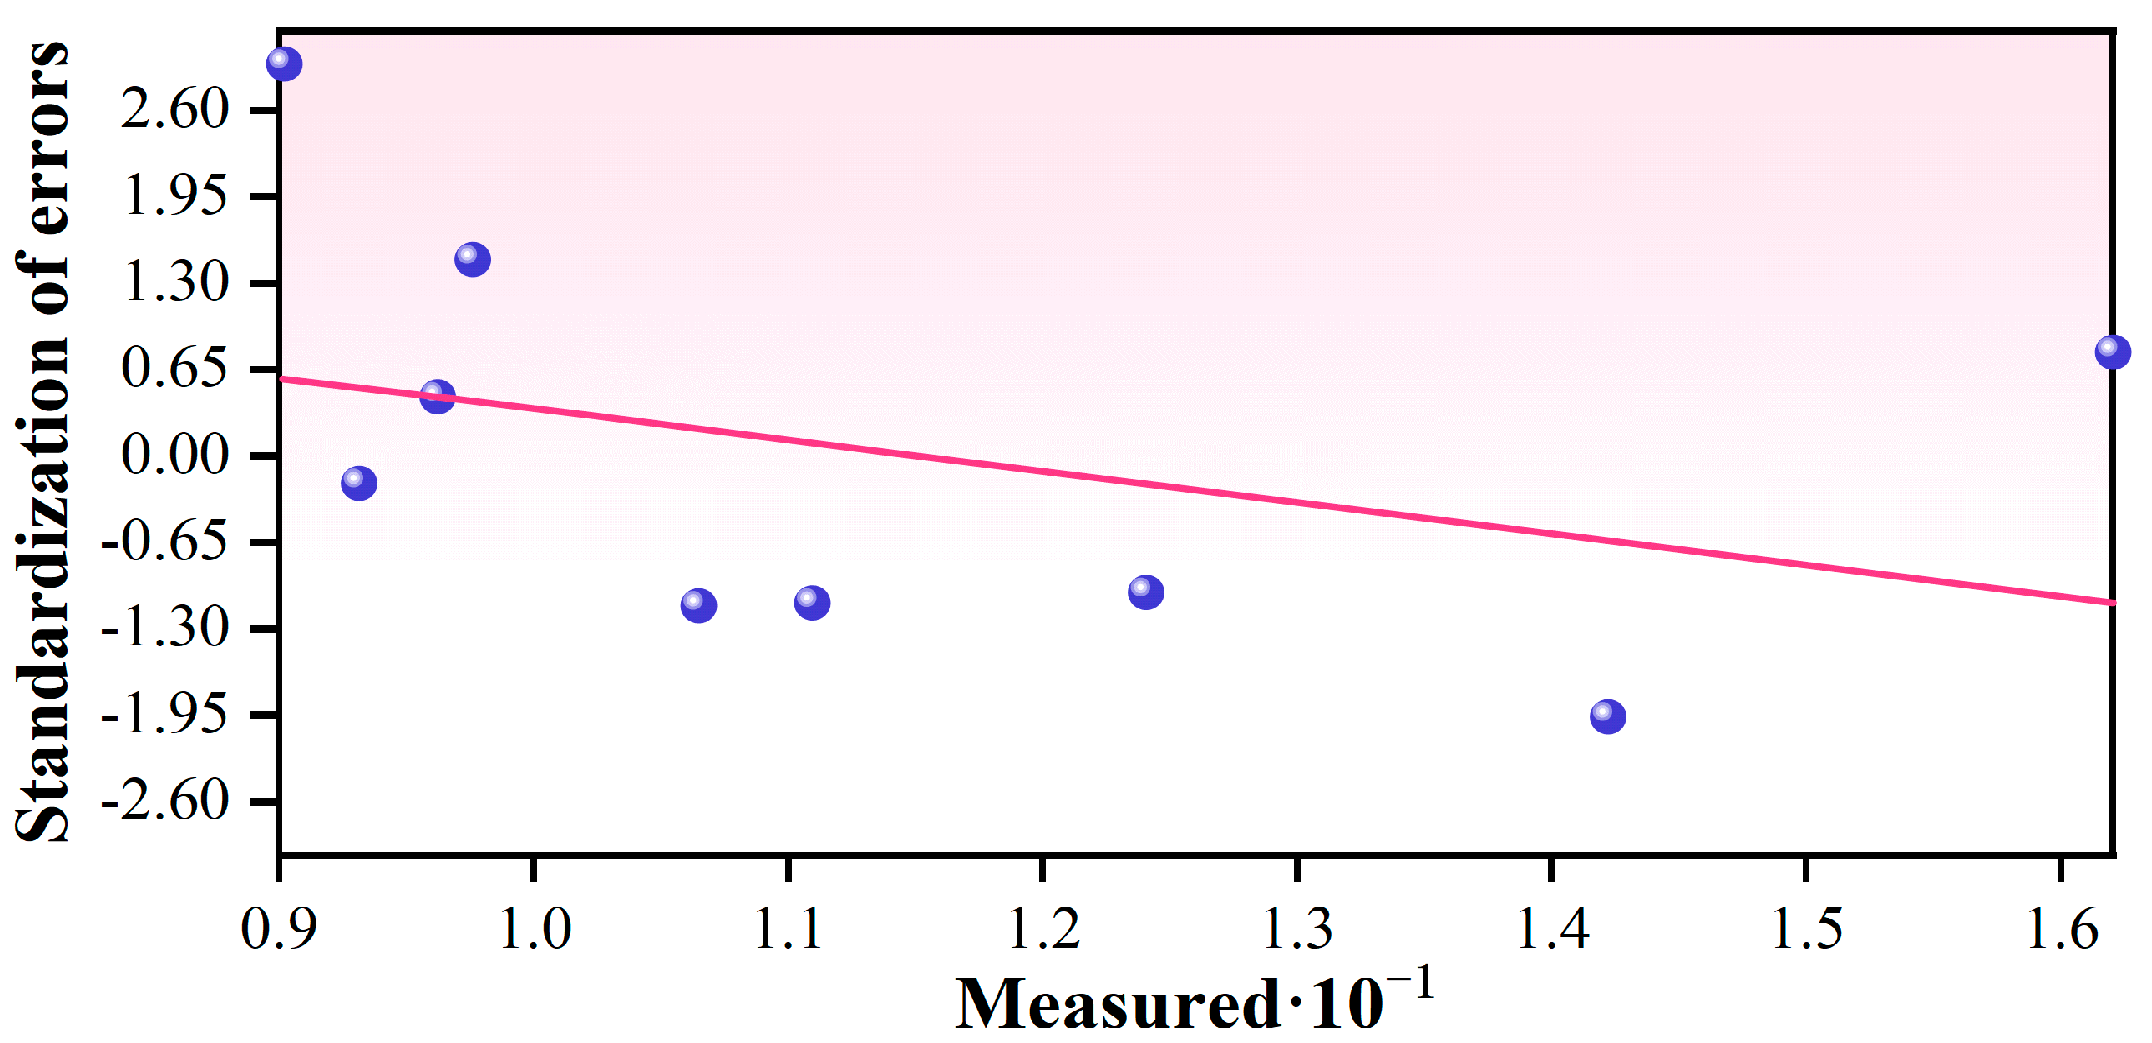
Cross-validation is to take out a point from the dataset, use other points to predict the value of the unknown point, compare the predicted value with the measured value, and then take out the next point from the dataset for prediction and comparison. To this end, let us repeat this until all points are taken once. Finally, the measured values and the predicted values are compared to obtain the scatter diagram of the regression function, and the accuracy analysis is performed. The ordinary Kriging method in the previous section is capable of predicting the regression function diagram and the standardized error diagram, as illustrated in Figure 12 and Figure 13.
By comparing the predicted data with the measured data, one can arrive at Table 10. The table’s results indicate that the average prediction rate reaches 90.44%, which indicates that the Kriging algorithm is an effective approach in predicting the gas content distribution of the No. 9 coal seam.

4.4. Discussion

At present, China’s shallow coal mine resources are gradually being exhausted, and coal mines in various regions are gradually beginning to exploit deep coal mine resources. However, the worse geological conditions and gas storage conditions in deep coal seams lead to more frequent gas accidents, which seriously affects coal mine production safety [32,33,34].
In this paper, the No. 9 coal seam in Longfeng Coal Mine, Guizhou Province, is taken as the research object, and the occurrence characteristics and risk identification of gas areas under complex geological conditions are studied. Through the on-site measurement of gas content, gas pressure, and other key parameters, combined with the Kriging algorithm, the spatial distribution prediction model of gas content is constructed, and the early identification of dangerous gas outburst areas is realized. Combining the Kriging algorithm with complex geological conditions (such as faults and folds), a spatial continuous prediction model of gas content is constructed, which breaks through the limitations of traditional methods in spatial visualization and continuous prediction. Considering multi-dimensional parameters such as the elevation, buried depth, permeability coefficient, and gas flow attenuation coefficient, a dynamic division standard for gas outburst danger zones (critical value of buried depth of 105 m) is established, which improves the level of risk identification, and the Kriging algorithm is optimized through Box–Cox data transformation. Optimizing the algorithm and model provides a new technical means for the sustainable development of deep coal seams, reduces the occurrence of gas disasters in deep mining, and ensures the safe production of coal mines.

5. Conclusions

This study focuses on the No. 9 coal seam of Longfeng Coal Mine in Guizhou Province. Using the Kriging algorithm, it investigated gas distribution and the early identification of hazardous areas under complex geological conditions. It measured parameters like gas content and pressure, analyzed factors such as geological structure and coal quality, and obtained the following key findings based on the location of prediction points or surfaces:
(1)
Based on the relationships among the gas content, elevation, and buried depth measured in the No. 9 coal seam of Longfeng Coal Mine, the gas content as a function of the elevation conforms to the following formula: y = −0.0406x + 54.845, R2 = 0.9202. The relationship between the gas content and the buried depth follows the following relation: y = 0.0269x + 5.1801, R2 = 0.8925.
(2)
According to the relationship between the buried depth (or height) and the parameters, the outburst danger area can be divided according to the buried depth (or elevation). The gas content of the No. 9 coal seam reaches a critical value of 8 m3/t at a buried depth of 105 m, so the area below 105 m is defined as the outburst danger area.
(3)
Based on the Kriging algorithm, the spatial position of the prediction points or prediction surface is considered. Through the analysis of the measured samples, the prediction function of the gas content of the No. 9 coal seam could be represented by Y = 0.84X + 1.840, where X and Y are the measured value and the predicted value, respectively, while the average prediction rate was obtained as 90.44%.
(4)
Deep coal seams have more complex geological and gas conditions. The sustainable exploitation of deep coal seam resources requires new technologies for safe mining, with further research needed on deep coal seam geology. Our study integrates complex deep geological conditions with gas prediction. The results are directly applicable in production, offering a reusable technical framework for similar geological coal mines. This shifts gas disaster prevention from “passive response” to “active prediction”, aiding deep resource development.

Author Contributions

Q.L.: Writing—original draft and Investigation. Y.W.: Writing—review and editing, Supervision, and Funding acquisition. W.L.: Writing—review and editing and Validation. X.Z.: Formal analysis and Data curation. H.L.: Resources and Project administration. Z.D.: Visualization and Conceptualization. All authors have read and agreed to the published version of the manuscript.

Funding

This work was supported by the Guizhou Provincial High-Level Innovative Talent Program (No. GCC [2023]102), the Guizhou Provincial Basic Research Program (Natural Science) QKHJC [2023]199, the Guizhou Provincial Science and Technology Program (QKHFQ [2024]006), and Guizhou Provincial Science and Technology Projects (Qianke Support [2023] General 360).

Data Availability Statement

The original contributions presented in this study are included in the article. Further inquiries can be directed to the corresponding author.

Conflicts of Interest

Authors Qingsong Li, Hongsheng Li and Zhengpeng Duan were employed by the Guizhou Institute of Mine Safety Science Co., Ltd. Author Weidong Luo was employed by the Guizhou Coal Mine Design and Research Institute Co., Ltd. Author Yanjun Wei was employed by the Guizhou Shui Kuang Holding Group Co., Ltd. The remaining authors declare that the research was conducted in the absence of any commercial or financial relationships that could be construed as a potential conflict of interest.

Abbreviations

Symbol or AbbreviationDescriptionUnit or Parameter
PF9-1 to PF9-6Different borehole location numbers for measuring coal seam gas pressure-
AzimuthBorehole azimuth-
Dip angleBorehole dip angle-
Predicted coal seam lengthPredicted coal seam lengthm
Seal hole lengthSeal hole lengthm
XCoal seam gas contentm3/t
yDependent variable in the formula for the relationship between gas content and elevation or burial depth-
xIndependent variable in the formula for the relationship between gas content and elevation or burial depth-
R2Coefficient of determination in the relationship formula-
q0Initial gas flow ratem3/min
αGas flow decay coefficientd−1
qtGas flow rate at time tm3/min
tGas flow decay timed
QtTotal gas flow at any time tm3
QJMaximum total gas flowm3
λCoal seam permeability coefficientm2/(MPa2·d)
P0Original gas pressure of the coal seamMPa
P1Gas pressure in the boreholeMPa
r1Borehole radiusm
qGas flow rate per unit area of borehole coal wall at gas drainage time tm3/(m2·d)
QBorehole gas flow rate at time tm3/d
LBorehole length, generally taken as coal seam thicknessm
XCoal seam gas volume contentm3/m3
A and BConstants in the formula-
YFlow number-
F0Time criterion-
a and bCoefficients in the formula-
hModulus of vector h, indicating the distance between two regionalized variable values Z(X) and Z(X + h)-
αRange value of the variogram-
C0Nugget effect, reflecting the size of randomness within the regionalized vector-
cSill, representing the part of the variable where the variable structure has changed-
NumberingData point numbering-
X and YCoordinates of data pointsm
Gas contentCoal seam gas contentm3/t
mMathematical expectation, unknown constant-
λLagrange multipliers-

References

  1. Lyu, P.; He, L.; He, Z.; Liu, Y.; Deng, H.; Qu, R.; Wang, J.; Zhao, Y.; Wei, Y. Research on remote sensing prospecting technology based on multi-source data fusion in deep-cutting areas. Ore Geol. Rev. 2021, 138, 104359. [Google Scholar] [CrossRef]
  2. Kang, H.P. Temporal scale analysis on coal mining and strata control technologies. J. Min. Strat. Control Eng. 2021, 3, 5–27. [Google Scholar]
  3. Li, J.; Wang, Y.; Nguyen, X.; Zhuang, X.; Li, J.; Querol, X.; Li, B.; Moreno, N.; Hoang, V.; Cordoba, P.; et al. First insights into mineralogy, geochemistry, and isotopic signatures of the Upper Triassic high-sulfur coals from the Thai Nguyen Coal field, NE Vietnam. Int. J. Coal Geol. 2022, 261, 104097. [Google Scholar] [CrossRef]
  4. Liu, Y.J.; Yuan, L.; Xue, J.H.; Tian, Z.C.; Duan, C.R.; Chen, B.L. Research status and development trend of mechanism and simulation test of coal and gas outburst. Ind. Mine Autom. 2018, 44, 43–50. [Google Scholar]
  5. Sun, J.; Cheng, J. Study on the perception and alarm method of coal mine rock burst and coal and gas outburst. Ind. Mine Autom. 2022, 48, 2236–2248. [Google Scholar]
  6. Yuan, L. Research progress of mining response and disaster prevention and control in deep coal mines. J. China Coal Soc. 2021, 46, 716–725. [Google Scholar]
  7. Tarkowski, R.; Uliasz-Misiak, B.; Tarkowski, P. Storage of hydrogen, natural gas, and carbon dioxide–Geological and legal conditions. Int. J. Hydrogen Energy 2021, 46, 20010–20022. [Google Scholar] [CrossRef]
  8. Yuan, L. Risk identification, monitoring and early warning of typical coal mine dynamic disasters during the 13th Five-Year Plan period. J. Min. Sci. Technol. 2021, 6, 1–8. [Google Scholar]
  9. Yang, Y.Z.; Wu, L.Y.; He, J. Theory and Application of Major Disaster Warning in Coal Mine Gas; Beijing Normal University Press: Beijing, China, 2010. [Google Scholar]
  10. He, X.; Wang, A.; Dou, L.; Song, D.; Zu, Z.; Li, Z. Technology of microseismic dynamic monitoring on coal and gas outburst-prone zone. J. China Coal Soc. 2018, 43, 3122–3129. [Google Scholar]
  11. Li, B.; Wang, E.; Shang, Z.; Liu, X.; Li, Z.; Dong, J. Deep learning and heterogeneous signal fusion approach to precursor feature recognition and early warning of coal and gas outburst. Process Saf. Environ. Prot. 2023, 178, 995–1008. [Google Scholar] [CrossRef]
  12. Shu, L.; Liu, Z.; Wang, K.; Zhu, N.; Yang, J. Characteristics and classification of microseismic signals in heading face of coal mine: Implication for coal and gas outburst warning. Rock Mech. Rock Eng. 2022, 55, 6905–6919. [Google Scholar] [CrossRef]
  13. Li, B.; Wang, E.; Shang, Z.; Liu, X.; Li, Z.; Li, B.; Wang, H.; Niu, Y.; Song, Y. Optimize the early warning time of coal and gas outburst by multi-source information fusion method during the tunneling process. Process Saf. Environ. Prot. 2021, 149, 839–849. [Google Scholar] [CrossRef]
  14. Dou, L.; Feng, L.; Cai, W.; Wang, H.; He, H.; Jiao, B.; Zhang, M. Seismo-acoustic precursor identification and comprehensive warning model for the catastrophic failure process of coal and rock. J. Min. Saf. Eng. 2020, 37, 960–976. [Google Scholar]
  15. Dou, L.; Zhou, K.; Song, S.; Cao, A.; Cui, H.; Gong, S.; Ma, X. Occurrence mechanism, monitoring and prevention technology of rockburst in coal mines. J. Eng. Geol. 2021, 29, 917–932. [Google Scholar]
  16. Huang, X.; Sun, D. Coal and gas outburst status and early warning technology in China coal mine. Coal Sci. Technol. 2011, 39, 61–69. [Google Scholar]
  17. Wang, E.; Li, Z.; Li, B.; Qin, B.; Xu, J.; Li, N.; Xia, H.; Zhang, G.; Li, Y.; Feng, X.; et al. Big data monitoring and early warning cloud platform for coal mine gas disaster risk and potential danger and its application. Coal Sci. Technol. 2022, 50, 142–150. [Google Scholar]
  18. Montero, J.M.; Fernández-Avilés, G. Functional kriging prediction of atmospheric particulate matter concentrations in Madrid, Spain: Is the new monitoring system masking potential public health problems? J. Clean. Prod. 2018, 175, 283–293. [Google Scholar] [CrossRef]
  19. Kemala, P.N.; Hakam, D.F. Optimizing final investment decision with real options valuation: A case study of offshore natural gas development project in Indonesia. Energy 2025, 316, 134363. [Google Scholar] [CrossRef]
  20. Zhang, Z.G.; Zhang, Q.H.; Liu, J. Research progress and prospects of coal and gas outburst and composite dynamic disaster warning systems in China. J. China Coal Soc. 2024, 49, 1–13. [Google Scholar]
  21. Zyrianova, M.; Collett, T.; Boswell, R. Characterization of the Structural–Stratigraphic and Reservoir Controls on the Occurrence of Gas Hydrates in the Eileen Gas Hydrate Trend, Alaska North Slope. J. Mar. Sci. Eng. 2024, 12, 472. [Google Scholar] [CrossRef]
  22. Xue, S.; Zheng, X.; Yuan, L.; Lai, W.; Zhang, Y. A review on coal and gas outburst prediction based on machine learning. J. China Coal Soc. 2024, 49, 664–694. [Google Scholar]
  23. Bashir, T.A.; Zubairu, A.A.; Dadet, W.P.; Eletta, O.A.A. Parametric analysis of operating conditions on compressed natural gas production in Nigeria. J. Eng. Appl. Sci. 2025, 72, 1–18. [Google Scholar] [CrossRef]
  24. Krasnovyd, S.; Konchits, A.; Shanina, B.; Valakh, M.; Yukhymchuk, V.; Skoryk, M.; Molchanov, O.; Kamchatny, O. Coal from the outburst hazardous mine seams: Spectroscopic study. Min. Miner. Depos. 2023, 17, 93–100. [Google Scholar] [CrossRef]
  25. Tamaki, M.; Fujimoto, A.; Boswell, R.; Collett, T.S. Geological reservoir characterization of a gas hydrate prospect associated with the Hydrate-01 stratigraphic test well, Alaska North Slope. Energy Fuels 2022, 36, 8128–8149. [Google Scholar] [CrossRef]
  26. AQ/T1047-2007; Direct Measurement Method of Coal Seam Gas Pressure in Coal Mine. State Administration of Work Safety: Chongqing, China, 2007.
  27. Liu, G.; Li, B.; Zhang, Z.; Liu, H.; Guan, W.; Si, N. Gas expansion energy of coals with different metamorphic degrees: Evolutionary characteristics and their implications for the outburst prediction. Coal Geol. Explor. 2023, 51, 1–8. [Google Scholar]
  28. Zhao, X.; Hu, B.; Nie, B.; Liu, X.; Zhao, D.; Li, H.; Deng, C.; Duan, Z. Experimental study and field application of hydraulic flushing technology in soft coal seam. Sci. Rep. 2025, 15, 3304. [Google Scholar] [CrossRef]
  29. Liang, Y.; Zheng, M.; Li, Q.; Mao, S.; Li, X.; Li, J.; Zhou, J. A review on prediction and early warning methods of coal and gas outburst. J. China Coal Soc. 2023, 48, 2976–2994. [Google Scholar]
  30. Qiu, L.; Dang, J.; Zhang, J.; Wang, M.; Liu, Q.; Si, L.; Jiang, Z.; Khan, M. Investigating nonlinear resistivity characteristics and mechanisms of coal during various loading stages. J. Appl. Geophys. 2025, 238, 105705. [Google Scholar] [CrossRef]
  31. Fan, C.; Li, S.; Luo, M.; Du, W.; Yang, Z. Coal and gas outburst dynamic system. Int. J. Min. Sci. Technol. 2017, 27, 49–55. [Google Scholar] [CrossRef]
  32. Fan, C.; Xu, L.; Elsworth, D.; Luo, M.; Liu, T.; Li, S.; Zhou, L.; Su, W. Spatial–temporal evolution and countermeasures for coal and gas outbursts represented as a dynamic system. Rock Mech. Rock Eng. 2023, 56, 6855–6877. [Google Scholar] [CrossRef]
  33. Ren, Z.; Yu, Q. Gas concentration pre-warning system based on fuzzy structured element. J. Coal Sci. Eng. 2008, 14, 581–584. [Google Scholar] [CrossRef]
  34. Dazhao, S.; Qiang, L.; Liming, Q.; Jianguo, Z.; Khan, M.; Yujie, P.; Yingjie, Z.; Man, W.; Minggong, G.; Taotao, H. Experimental study on resistivity evolution law and precursory signals in the damage process of gas-bearing coal. Fuel 2024, 362, 130798. [Google Scholar] [CrossRef]
Figure 1. Regional geological sketch map.
Processes 13 02110 g001
Figure 2. Gas pressure evolution in No. 9 coal seam.
Processes 13 02110 g002
Figure 3. Graphs of the elevation and burial depth in terms of the gas content.
Processes 13 02110 g003
Figure 4. Histogram graphs: (a) unconverted histogram plot and (b) Box–Cox ( λ = 2 ) transformed histogram.
Processes 13 02110 g004
Figure 5. Normal QQ graphs: (a) untransformed normal QQ plots and (b) Box–Cox ( λ = 2 ) transformed normal QQ plots.
Processes 13 02110 g005
Figure 6. Voronoi diagram of the gas content.
Processes 13 02110 g006
Figure 7. Global trend analysis chart.
Processes 13 02110 g007
Figure 8. Variation function model diagram.
Processes 13 02110 g008
Figure 9. Variation function of the Gaussian model after Box–Cox transformation.
Processes 13 02110 g009
Figure 10. Spatial distribution map.
Processes 13 02110 g010
Figure 11. Prediction diagram of the Kriging gas content distribution in the No. 9 coal seam.
Processes 13 02110 g011
Figure 12. Y = 0.84X + 1.840 regression function diagram.
Processes 13 02110 g012
Figure 13. Standardized error diagram.
Processes 13 02110 g013
Table 1. Measurement locations and basic parameters of the designed boreholes.
Coal SeamDrilling Location IDTesting LocationAzimuth
(°)
Dip Angle (°)Predicted Coal Seam Length
(m)
Seal Hole Length (m)Remark (s)
No. 9PF9-159210
Bottom pumping roadway of wind roadway
0203520Pressure measurement
PF9-2180204020Pressure measurement content
PF9-3The second mining area belt up the mountain90205520Pressure measurement
PF9-490204020Pressure measurement content
PF9-55923
Transportation roadway bottom pumping roadway
0202820Pressure measurement
PF9-6180202820Pressure measurement content
Table 2. The values of q0 and α for various drilling locations of the No. 9 coal seam in the second mining area of Longfeng Coal Mine.
Drilling
Location ID
Testing LocationInitial Gas Flow Rate from the Borehole (q0)Drilling Natural Gas
Flow Attenuation Coefficient (α)
P9-159210 Bottom pumping roadway of wind roadway9.4820.068
P9-259210 Bottom pumping roadway of wind roadway4.7090.084
P9-3The second mining area belt up the mountain0.3490.124
P9-4The second mining area belt up the mountain0.7920.097
P9-55921 Transportation roadway bottom pumping roadway1.1870.084
P9-65921 Transportation roadway bottom pumping roadway0.8920.045
Table 3. Formula table used for calculating the coal seam permeability coefficient via the unsteady radial flow methodology.
Flow
Number
(Y)
Time Criterion
(F0 = )
Coefficient (a) Coefficient
(b)
Coal Seam Permeability Coefficient
(λ)
Constant
(A)
Constant
(B)
Y = A/λ = aF0b10−2~11−0.38λ = A1.61B1/1.64 A = q r 1 p 0 2 p 1 2 B = 4 t p 0 1.5 a r 1 2
1~101−0.28λ = A1.39B1/2.56
10~1020.93−0.20λ = 1.1A1.25B0.25
102~1030.588−0.12λ = 1.83A1.14B1/7.3
103~1050.512−0.10λ = 2.1A1.11B1/9
105~1070.344−0.065λ = 3.14A1.07B1/14.4
Table 4. Calculation results of the permeability coefficient of the No. 9 coal seam in the No. 2 mining area of the Longfeng Coal Mine.
Drilling Location
ID
Coal Seam Gas Volume Content
X (m3/t)
Absolute Gas Pressure
P0 (MPa)
Coal Seam Gas Content Coefficient α
(m3/m3.MPa0.5)
Borehole Length
L (m)
Radius of Drill Hole
r1 (m)
Drilling Pressure Relief Time
t (d)
Gas Flow in the Borehole
Q
(m3/d)
Gas Pressure When Drilling Pressure Relief
P1 (MPa)
Gas Permeability Coefficient
λ
m2/(MPa2·d)
P9-114.640.3624.413.50.037590.8000.10.178
P9-27.950.5113.8211.250.037593.2000.10.636
P9-310.710.5913.943.00.037590.4780.10.358
P9-49.980.5213.843.00.037590.1890.10.155
P9-515.920.6426.536.750.037590.8730.10.193
P9-612.360.7813.996.750.037590.8730.10.140
Table 5. No. 9 coal seam parameter determination results.
Coal SeamM9
Bulk density of coalTrue density TRD (t/m3)1.55
Apparent density TRD (t/m3)1.47
Average of the firmness coefficient (f)1.71
Type of damageClass II (fractured coal)
Initial velocity of gas diffusion Δp (mmHg)21
Adsorption constantsA (m3/t.r)35.619
B (MPa−1)1.493
Industrial analysisAd (%)11.27
Mab (%)3.27
Vdaf (%)7.54
Porosity (%)5.16
Table 6. Histogram statistics of the gas contents.
TotalMinimumMaximumAverageStandard DeviationBias AngleKurtosis1/4 Digits3/4
Digits
Median
Unconverted99.216.4311.562.470.952.629.7413.0410.83
Log converts92.222.802.430.20.752.272.282.572.38
λ = 2 90.490.50.50.0010.371.810.490.500.50
λ = 1 90.890.940.910.0170.561.990.900.920.91
λ = 1 98.215.4310.562.470.952.628.7412.049.83
λ = 2 941.82134.476931.401.143.0446.9684.8058.14
λ = 3 9259.231478.1581.6409.91.333.51308.1746.7423.1
Table 7. Summary of the model parameters.
ModelNumber of StepsMaximum Step SizeRange ValueNuggetArch Rise
Stable form123033318.7Nil17.87
Spherical model123033635.6017.28
Exponential model123033635.6011.94
Gaussian model123032411.8022.34
123033635.60.8233.99
Table 8. Summary table of the variogram model parameters.
Data TypeGlobal TrendTheoretical ModelRange ValueNuggetArch Rise
MonotonyNot eliminatedGaussian model3635.60.8233.99
Box–Cox transformationNot eliminatedGaussian model3635.659.855885
Table 9. Gas content data.
NumberingXYGas Content (m3/t)
017,676.1429,518.6-
117,619.09129,430.2689.51
217,808.53829,481.56510.83
317,591.72529,590.76311.28
417,380.45029,681.7629.2
518,098.94129,408.76712.58
Table 10. Comparison between the predicted value and the measured value.
Measured
Value
Predicted
Value
DifferentialsStandard
Error
Standardized
Error
Standard
Value
Prediction
Ratios (%)
9.211.532.330.782.971.5979.83
12.5811.38−1.201.17−1.02−0.2890.45
11.2810.24−1.040.96−1.08−0.5990.81
10.839.83−1.000.90−1.12−0.9790.74
9.8210.250.430.930.460.2895.84
9.9611.461.501.011.490.9786.94
14.4112.73−1.680.87−1.93−1.5988.35
9.519.26−0.251.26−0.200.0097.32
16.4317.541.111.400.790.5993.69
Disclaimer/Publisher’s Note: The statements, opinions and data contained in all publications are solely those of the individual author(s) and contributor(s) and not of MDPI and/or the editor(s). MDPI and/or the editor(s) disclaim responsibility for any injury to people or property resulting from any ideas, methods, instructions or products referred to in the content.