Article

Enhancing Biomethane Yield from Microalgal Biomass via Enzymatic Hydrolysis: Optimization and Predictive Modeling Using RSM Approach

1
Department of Process Engineering, Polytechnic School of Constantine, Constantine 2500, Algeria
2
Higher Normal School of Constantine, Constantine 25000, Algeria
3
Department of Engineering and Computer Science, Pegaso Telematic University, 80143 Napoli, Italy
4
Department of Engineering, University of Campania “Luigi Vanvitelli”, 81100 Caserta, Italy
5
LERMAB-ENSTIB, University of Lorraine, 27 Rue Philippe Seguin, 88051 Épinal, France
*
Author to whom correspondence should be addressed.
Processes 2025, 13(7), 2086; https://doi.org/10.3390/pr13072086
Submission received: 14 May 2025 / Revised: 22 June 2025 / Accepted: 24 June 2025 / Published: 1 July 2025
(This article belongs to the Special Issue Advanced Biofuel Production Processes and Technologies)

Abstract

This study investigates the optimization of enzymatic hydrolysis for enhancing carbohydrate release from microalgal biomass and its subsequent impact on methane production during anaerobic digestion. Using Response Surface Methodology with a Box–Behnken design comprising 15 experimental runs, the effects of enzyme loading (20–40 mg/gVS), pH (4.5–5.5), and incubation time (24–72 h) were evaluated. A quadratic regression model was developed to predict carbohydrate release, revealing significant interactions between these factors. The optimal conditions for enzymatic hydrolysis were determined to be a cellulase dose of 20 mg/gVS, pH 5.0, and an incubation period of 72 h. The model demonstrated excellent predictive accuracy, with an R2 value of 0.9894 and an adjusted R2 of 0.9704. Enzymatic hydrolysis significantly improved methane and biogas yields, with cumulative production reaching 52.50 mL/gVS and 95.62 mL/gVS, respectively, compared to 6.98 mL/gVS and 20.94 mL/gVS for untreated samples. The findings highlight the importance of optimizing enzyme loading and reaction time, while pH variations within the studied range had minimal impact. This study underscores the potential of enzymatic hydrolysis to enhance the bioavailability of organic matter, thereby improving the efficiency of anaerobic digestion for biogas production.

1. Introduction

Anaerobic digestion (AD) is widely recognized as an effective technology for treating organic waste. It offers high energy recovery and a relatively low environmental impact compared to other waste management methods [1]. Through the microbial degradation of organic substrates, AD generates biogas, a renewable energy carrier primarily composed of methane and carbon dioxide; whose overall environmental performance depends on the type of feedstock, operational conditions, and the efficiency of downstream gas upgrading processes [1,2].
In recent years, attention has increasingly turned to microalgae as a potential bioenergy feedstock due to their rapid biomass productivity, high photosynthetic efficiency, and their ability to synthesize and store considerable amounts of lipids, carbohydrates, and proteins within their cells under optimized conditions [3]. Unlike terrestrial energy crops, microalgae can be cultivated on non-arable land and in non-potable water sources, including saline or wastewater, making them an attractive candidate for sustainable biomass production without competing with food or feed agriculture [4].
Despite these advantages, several biological and technical challenges limit the application of microalgae in anaerobic digestion. Microalgae are characterized by tough cell walls that consist mainly of cellulose, hemicellulose, and glycoproteins, which impede the hydrolytic microbial access to intracellular organic substrates. This structural recalcitrance slows the hydrolysis step the rate-limiting phase of the AD process ultimately reducing methane yields. Additionally, extracellular polymeric substances (EPS) are high-molecular-weight compounds released by microalgae. They lead to the formation of dense clumps within the biomass, making it harder for hydrolytic enzymes and microorganisms to degrade the materials inside [5]. Overcoming these challenges is crucial for improving the digestibility and energy recovery efficiency of microalgal biomass in AD systems.
In recent years, several pretreatment methods have been widely explored to overcome hydrolysis limitations in anaerobic digestion, particularly for complex substrates like lignocellulosic and algal biomass. These include physical methods (thermal, ultrasound, microwave), chemical treatments (acid, alkaline, oxidative), physicochemical processes (steam explosion, thermal-alkaline), and biological approaches involving microbial consortia or enzymatic hydrolysis [6,7]. Among the various pretreatment methods available, biological approaches are widely considered the most environmentally favorable. This is primarily because they function under mild operational conditions and avoid the generation of harmful byproducts. In comparison, thermal and steam-based pretreatments demand substantial energy inputs and are often associated with increased environmental burdens, including greenhouse gas emissions and the formation of inhibitory compounds that can hinder subsequent digestion processes [7,8]. In a related study, Mahdy et al. [9] reported that protease pretreatment of Chlorella vulgaris resulted in a 50–70% increase in methane yield. This improvement was attributed to enhanced solubilization of organic matter and improved biodegradation rates. Similarly, Córdova et al. [10] found that cellulase pretreatment of Chlorella sorokiniana significantly boosted methane production: pretreated biomass incubated at pH 7 for 24 h with a 1% enzyme-to-substrate ratio yielded 537 mL CH4/g VS, compared to 307 mL CH4/g vs. in untreated controls, which represents a 75% increase. Importantly, the maximum methane production rate (Rm) was 2.65 times higher in pretreated samples, and methane content reached approximately 66.7%, as determined by the modified Gompertz model.
Cellulase, the cornerstone enzyme in biochemical technology, has a central role in converting lignocellulosic biomass to chemicals and biofuels such as fuels, biogas, and ethanol. In addition, this is commonly employed in different biotechnological processes of food and the textile industry [11]. The addition of enzymes plays a crucial role in enhancing biodegradability by optimizing factors such as enzyme activity, substrate specificity, enzyme concentration, temperature, pH, and stability. These factors are often treated as key drivers influencing cropping and feedstock prices [12].
Among the various process optimization approaches, Response Surface Methodology (RSM) has gained increasing attention in recent years, particularly in process and chemical engineering applications. This empirical, data-driven technique uses quantitative data and multiple regression analysis to explore the relationships between independent and dependent variables. RSM provides graphical representations illustrating both the individual and combined effects of experimental variables on process responses. When coupled with factorial designs, it enhances the estimation accuracy of the response surface, making it highly effective for optimizing process variables while reducing the number of required experiments [13].
In the context of anaerobic digestion enhancement, several studies have previously investigated enzymatic hydrolysis of microalgal biomass to improve biogas production [14,15]. However, most of these works assessed methane yields under fixed or limited pretreatment conditions, without applying comprehensive statistical optimization frameworks or systematically examining the interaction effects between critical operational factors such as enzyme loading, pH, and reaction time. To address this limitation, the present study applies a detailed RSM approach based on a Box–Behnken Design (BBD) implemented using Minitab software version 19.1.0 [16]. This design allows efficient quantitative manipulation of the main enzymatic hydrolysis parameters such as pH, enzyme concentration, and incubation time with a minimal number of experimental runs. The aim was to maximize the solubilization of organic matter, thereby improving substrate biodegradability, digestion efficiency, and ultimately increasing cumulative biogas and methane yields. By quantitatively modeling the combined effects of these variables on both carbohydrate release and biomethane potential, this study provides a more statistically rigorous and process-integrated assessment than typically reported in earlier works, contributing valuable predictive tools and insights for optimizing biogas production from microalgal biomass.

2. Material and Methods

2.1. Substrate, Inoculum and Used Enzyme

Microalgae, predominantly a mixed natural community, were collected from a freshwater riverine environment in El Hadjar, Annaba, Algeria. No specific species identification was conducted. The inoculum used in this study was sludge collected from the returned activated sludge (RAS) line of a wastewater treatment plant in Oued El Athmania, Mila, Algeria, after secondary treatment. After collection, the sludge was then concentrated by simple sedimentation for a sufficient period to allow biomass settling. Both substrate and inoculum were then stored at 4 °C of temperature to preserve its characteristics. The main characteristics of the inoculum and substrate were evaluated in triplicate and are reported in Table 1.
The enzyme utilized in this study is a commercial cellulase derived from Trichoderma reesei (aqueous solution, 700 U/g), One unit (U) of cellulase activity is defined as the amount of enzyme required to release 1 µmol of glucose equivalent per minute from carboxymethyl cellulose (CMC) under assay conditions of pH 4.8 and 50 °C. The enzyme was supplied by the Laboratory of Environmental Engineering at the National Polytechnic School of Constantine.

2.2. Experimental Setup

2.2.1. Enzymatic Hydrolysis and Experimental Design

Enzymatic hydrolysis experiments were conducted in duplicate using 120 mL sterilized incubation flasks. Each flask contained 20 mL of raw microalgal slurry with a volatile solids (VS) concentration of 43.12 g/L. This raw slurry served as the substrate for enzymatic hydrolysis (see Figure 1). The operational parameters, including enzyme loading, pH, and incubation time, were varied according to a three-level, three-factor Box–Behnken Design (BBD) generated using Minitab software version 19.1.0 [16]. This design was selected for its efficiency in evaluating individual and interactive effects of process variables with a reduced number of experimental runs. A total of 15 experimental runs were performed based on the BBD matrix. This matrix included 6 factorial points, 6 axial points, and 3 replicates at the center point to estimate experimental error and confirm model validity. The ranges for the independent variables were as follow: pH: 4.5, 5.0, and 5.5; Enzyme loading: 20, 30, and 40 mg/g volatile solids (VS); Incubation time: 24, 48, and 72 h. Table 2 details the independent variables, coded as −1 for the lowest level, 0 for the intermediate level, and +1 for the highest level. X1, X2, and X3 refer to the coded factors for pH, enzyme loading, and time, respectively.
After preparing the mixtures according to the BBD design, flasks were sealed with a rubber stopper, purged with nitrogen gas for 4 min to establish anaerobic conditions, and incubated in a temperature-controlled shaker (MEMMERT GmbH + Co.KG, Büchenbach, Germany) at 50 °C for optimal cellulase activity [15]. At the end of the incubation period, 1 mL samples were collected from each flask and analyzed for carbohydrate concentration as an indicator of hydrolysis efficiency. The experimental design and parameter ranges are summarized in Table 3. After enzymatic incubation, no separation step was performed. The entire hydrolyzed mixture, containing both liquid and residual solids, was directly used for the BMP tests to maintain consistency in substrate handling and to prevent organic matter loss.

2.2.2. Experimental Procedure for Biomethane Production (BMP Test)

Batch reactors for anaerobic digestion experiments were conducted using 150 mL serum bottles, each with a working volume of 90 mL, containing a mixture of inoculum and substrate. The reactors were incubated under mesophilic conditions at 37 ± 0.5 °C in a temperature-controlled incubator (MEMMERT GmbH + Co. KG, Germany). Since the methanogenic bacteria are very sensitive to changes in pH, pH of the samples was brought to 7 using 0.02 N sulfiric acid or 0.5 N sodium hydroxide where necessary. Methanogens prefer to exist at a near neutral pH; however, a deviation from this can greatly affect their action and consequently the amount of biogas produced [17]. The initial substrate-to-inoculum (S/I) ratio for all assays was set at 3 gVS waste/gVS inoculum [18]. The starting volume of inoculum was 10 mL, and an additional 10 mL of nutrient solution was added, comprising 0.5 g/L glucose, 0.5 g/L yeast extract, 0.075 g/L calcium chloride, 0.5 g/L ammonium dihydrogen phosphate, 1.12 g/L dipotassium hydrogen phosphate, and 1.2 g/L potassium dihydrogen phosphate [19]. The remaining volume was filled with tap water.
Two experimental conditions were tested in this study:
  • The pretreated substrate: microalgal biomass subjected to the optimized enzymatic hydrolysis conditions determined earlier in this study;
  • The control: microalgal biomass under the same operational conditions (pH, temperature, S/I ratio, inoculum, nutrient solution, incubation time) but without adding any enzyme, so no enzymatic pretreatment was applied.
Each condition was run in triplicate, resulting in a total of six batch tests. This setup allowed for the assessment of how enzymatic pretreatment improved anaerobic digestion compared to untreated biomass. To create anaerobic conditions, all reactors were sealed with rubber septa and purged with nitrogen gas for 5 min. Biogas production and composition were measured daily until gas production ceased.

2.3. Analytical Methods

The total biogas volume was measured using the water displacement method. Its composition was determined using a saturated potassium hydroxide (KOH) solution, as described by Ergüder et al. [20], and a portable gas analyzer (GA 5000; Geotech, Leamington, UK) equipped with infrared and electrochemical sensors.
The total solids (TS) content, total volatile solids (TVS) content, total chemical oxygen demand (tCOD), soluble chemical oxygen demand (sCOD), carbohydrates, total alkalinity, and partial alkalinity were analyzed following the procedures outlined in Standard Methods [21]. TS and TVS were determined by oven drying at 105 °C and 550 °C, respectively, using a (Carbolite Ltd., Derbyshire, UK). oven (Type AX120; Hope Valley, UK) and a muffle furnace (LE muffle furnace, 1100–1600 °C; Nabertherm, Lilienthal, Germany). pH values were measured with an SX-610 Pen pH meter (JENWAY Type 3540, Camlab, Cambridge, UK). All analyses were performed in duplicate, and the average results are reported to ensure reproducibility.

2.4. Data Analysis

Following the experimental runs, the data were analyzed using Response Surface Methodology (RSM). A quadratic polynomial regression model was constructed to describe the relationship between the independent variables (enzyme loading, pH, and incubation time) and carbohydrate release.
The adequacy and predictive ability of the model were evaluated based on several statistical parameters, including the coefficient of determination (R2), adjusted R2, predicted R2, adequate precision, Fisher’s F-value, and the p-values of each model term. A significance level of 0.05 was applied in all analyses, and model terms with a p-value below this threshold were considered statistically significant, following conventional practices in RSM optimization studies [22]. Analysis of Variance (ANOVA) was conducted to evaluate the overall significance of the regression model, as well as to determine the individual and interactive effects of the independent variables and assess the lack of fit. In addition, diagnostic checks including residual analysis, normal probability plots for assessing the normality of residuals, and residuals versus fitted values plots to evaluate homoscedasticity were performed to verify the adequacy of the model and confirm that the assumptions required for response surface analysis were satisfied. Finally, main effects plots were generated to show the influence of each factor within its tested range, which helped to identify the optimal process conditions for maximizing carbohydrate release prior to conducting the biomethane potential (BMP) tests.

3. Results and Discussion

3.1. Experimental Results of Enzymatic Hydrolysis

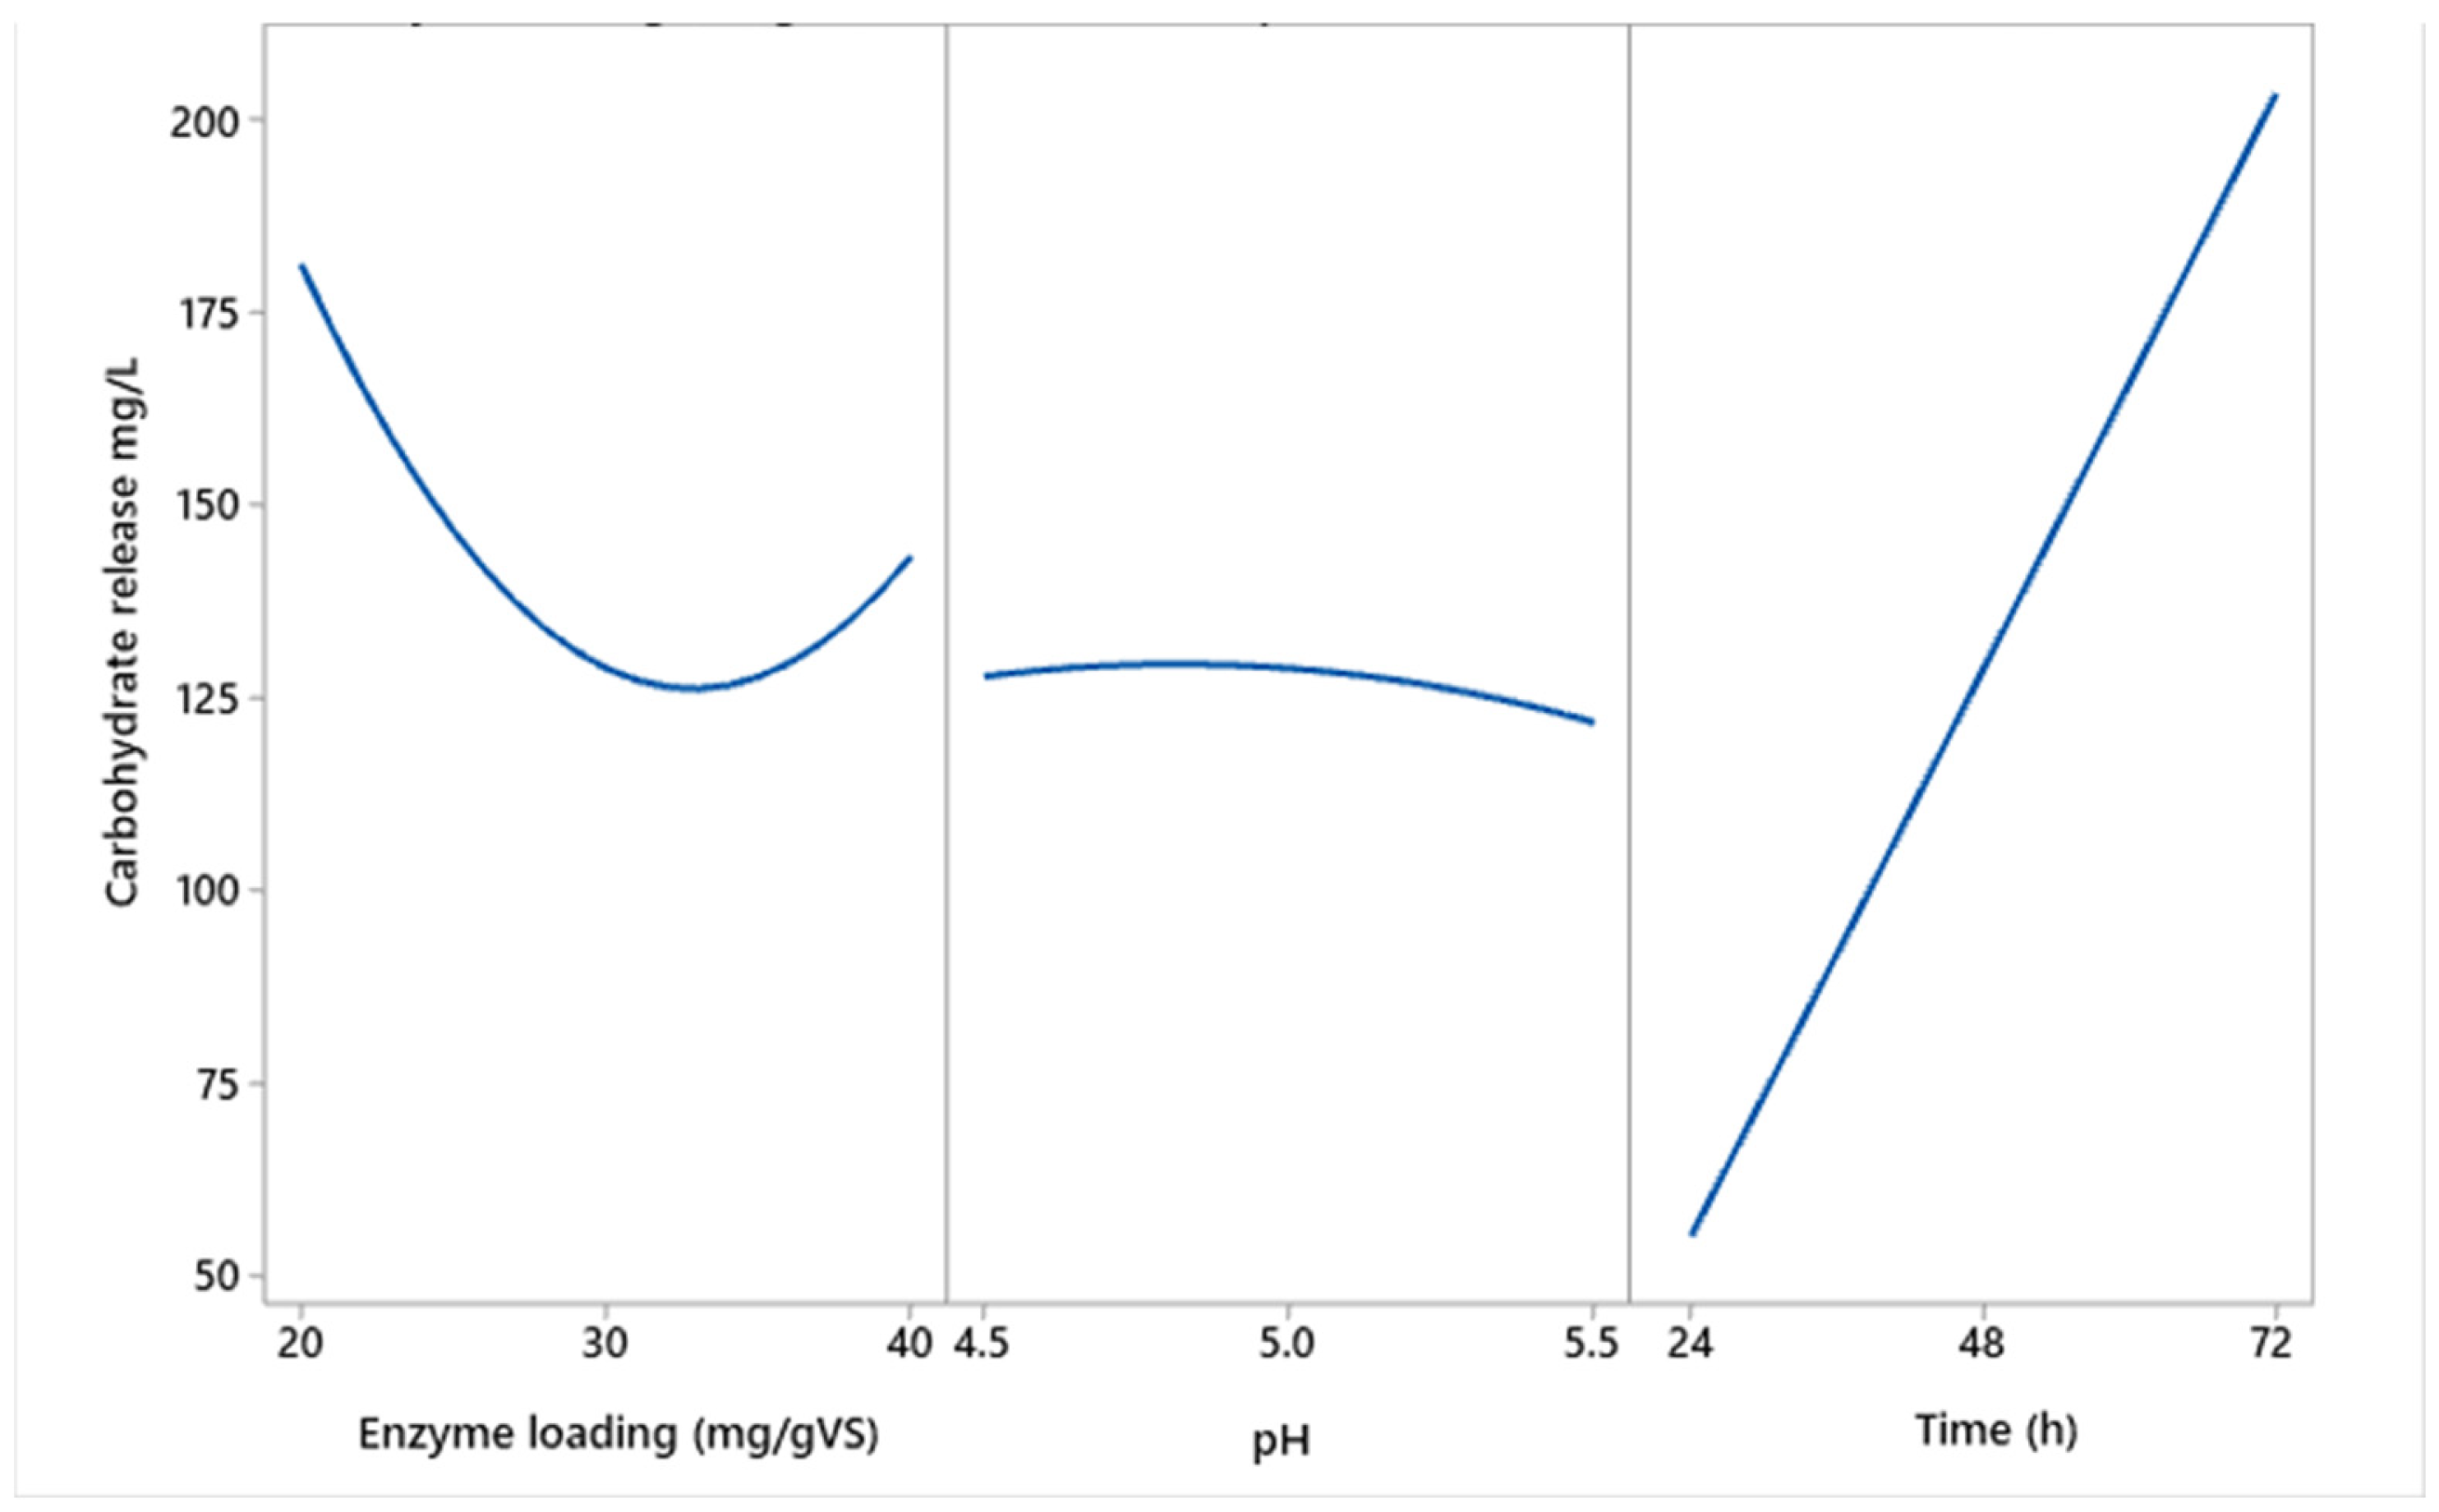
Effect of Enzymatic Hydrolysis and Main Process Factors on Carbohydrate Release

In the present study, enzymatic hydrolysis of microalgal biomass resulted in a progressive increase in carbohydrate concentration over time, with the highest concentration observed at 72 h, as depicted in Figure 2 and Figure 3. Among the examined variables, incubation time exerted the most substantial influence, demonstrating a nearly linear enhancement in carbohydrate release as the reaction proceeded. This outcome indicates that extending hydrolysis duration promotes continuous polysaccharide degradation. Nevertheless, to mitigate risks associated with microbial contamination and potential enzyme deactivation, incubation was limited to 72 h, in accordance with recommendations from previous investigations [23,24].
Regarding the effect of enzyme concentration, a nonlinear response was observed. As illustrated in Figure 2, increasing the enzyme dosage up to 20 mg/gVS led to a corresponding rise in carbohydrate release, beyond which a noticeable decline occurred at 30 mg/gVS. This reduction is likely attributable to substrate inhibition phenomena or competitive interactions among enzyme molecules at elevated concentrations. Interestingly, at even higher enzyme loadings, a secondary increase in carbohydrate solubilization was detected, suggesting that excessive enzyme levels may, in certain cases, overcome substrate saturation or enhance catalytic efficiency. Similar behaviors have occasionally been reported in enzymatic hydrolysis processes involving structurally complex biomass substrates.
These findings are in agreement with recent literature that highlights the effectiveness of enzymatic hydrolysis in facilitating carbohydrate recovery from microalgae. For instance, Padil et al. [25] documented a glucose yield of 90.03% from Tetraselmis chuii under optimized saccharification conditions of 55 °C and pH 4.5 using α-amylase and glucoamylase. Likewise, Kassim et al. [26] achieved a maximum sugar concentration of 413.42 ± 7.62 mg/g biomass, corresponding to an 84.3% hydrolysis yield, from alkali-pretreated Chlorella sp. following 96 h of enzymatic treatment at 45 °C and pH 5.0. Collectively, these comparative findings reinforce the potential of enzymatic hydrolysis as a practical and efficient strategy for the solubilization of carbohydrates from diverse microalgal species.
Regarding pH, carbohydrate solubilization remained relatively stable across the tested range (4.5–5.5), with an optimum at pH 5.0. This finding corresponds with established cellulase performance characteristics, where catalytic activity exhibits maximum efficiency near pH 5.0 [27].
Under optimized conditions (20 mg/gVS enzyme loading, pH 5.0 and 72 h of incubation), the maximum carbohydrate release achieved was 313.01 mg/L. These outcomes provide strong evidence that enzymatic hydrolysis is an effective strategy for carbohydrate solubilization from microalgal biomass, with reaction time exerting the most substantial influence, followed by enzyme loading and pH.

3.2. Model Development and Statistical Analysis

3.2.1. Model Fitting and ANOVA Results

The experimental data obtained from the Box–Behnken Design were first compared to the values predicted by the quadratic polynomial regression model. The observed and predicted values for carbohydrate release under different combinations of pH, enzyme loading, and incubation time are summarized in Table 3. The close agreement between these values, with relative errors consistently below 3%, indicated a high level of accuracy and reliability for the model in predicting the experimental outcomes.
Following this, the model’s adequacy was evaluated through analysis of variance (ANOVA), with results presented in Table 4 and Table 5.
The regression analysis of ANOVA provides an empirical relationship between pH, time, and enzyme loading expressed in a quadratic equation. This equation is as follows:
Y = 128.90 − 3.10·X1 − 24.30·X2 + 68.64·X3 + 1.30·X12 + 26.87·X22 − 3.37·X32 + 1.42·X1·X2 − 17.76·X1·X3 − 59.32·X2·X3.
The coefficient of determination (R2) was 98.94%, indicating that the model accounts for nearly all of the variability in carbohydrate release. An adjusted R2 of 97.04% and a predicted R2 of 83.08% further demonstrated the model’s predictive capability and reliability. The adequate precision value of 7.21, well above the minimum threshold of 4, confirmed the model’s suitability for navigating the design space.
Among the linear terms, enzyme loading X2 and time X3 were statistically significant, with p-values of 0.006 and 0.000, respectively. The linear effect of pH X1 was not significant (p = 0.579), indicating limited influence on carbohydrate release within the tested range. Quadratic effects showed that enzyme loading X22 had a significant effect (p = 0.018), while other quadratic and interaction terms, such as X12 and X1 × X2, were statistically insignificant.
Despite the insignificance of certain terms, all were retained in the final model to preserve the hierarchical structure, which ensures that estimates of significant higher-order interaction and quadratic terms remain unbiased. This practice is recommended in RSM modeling to maintain the validity and interpretability of regression equations [24,28]. A stepwise selection technique was considered but not applied, as eliminating lower-order terms while retaining their corresponding higher-order or interaction terms would violate model hierarchy and could distort the prediction surface.

3.2.2. Response Surface Analysis and Factors Interactions

The influence of pH, enzyme loading, and reaction time on carbohydrate release was visualized using three-dimensional response surface plots (Figure 3a–c). These plots illustrate the interaction effects of two variables on the response while holding the third variable constant at its central level. The surface and contour plots provide insights into the nature and extent of interactions between factors, where elliptical contour lines suggest significant interaction effects, while circular ones indicate minimal interactions [27].
The plots reveal that carbohydrate release increased linearly with enzyme loading up to approximately 20 mg/gVS. Beyond this concentration, the relationship became nonlinear, indicating a saturation effect where further increases in enzyme concentration did not proportionally enhance carbohydrate release. Optimal performance was observed at 20 mg/gVS and pH 5.0, particularly at the maximum incubation time of 72 h. This confirms the importance of balancing enzyme loading to avoid diminishing returns potentially associated with substrate or enzyme inhibition at higher concentrations.
The effect of pH on carbohydrate release was comparatively minor within the tested range of 4.5–5.5. Carbohydrate solubilization remained relatively constant, with the highest values observed near pH 5.0. This behavior aligns with the known optimal activity range for cellulase enzymes, where slight variations within this interval have limited impact on catalytic efficiency [27].
Reaction time demonstrated a consistent positive linear effect, with carbohydrate release increasing steadily up to 72 h. Extending the reaction period beyond this point may further improve yields, as suggested by the trend, but practical considerations such as enzyme stability and contamination risks justified capping the incubation at 72 h, in line with prior studies [29]. Taken together, these findings underscore the central importance of enzyme loading and reaction time in maximizing carbohydrate release from microalgal biomass, with pH exerting a comparatively limited effect within the parameters evaluated. The trends observed here reflect the particular hydrolysis characteristics of microalgal substrates subjected to the optimized conditions developed in this study, offering further validation for the suitability of enzymatic hydrolysis in improving carbohydrate solubilization from microalgae.

3.2.3. Model Validation

The accuracy and reliability of the regression model were assessed by comparing the experimental carbohydrate release values with those predicted by the model, as illustrated in Figure 4. The close clustering of data points around the diagonal line indicates an excellent agreement between observed and predicted outcomes, with relative errors consistently remaining below 3%, reflecting a high level of predictive accuracy. Furthermore, the residual values between measured and predicted responses were minimal, reinforcing the adequacy of the model in capturing the experimental trends. This conclusion is further supported by the lack-of-fit test, which yielded a non-significant result (p = 0.064), confirming the suitability of the quadratic model in representing the relationships between pH, enzyme loading, reaction time, and carbohydrate release across the tested conditions.
These findings collectively confirm the statistical soundness of the regression model and its capacity to accurately predict carbohydrate release under varying treatment conditions.

3.3. Enzymatic Hydrolysis Anaerobic Digestion Tests

The biochemical methane potential (BMP) tests revealed that cumulative biogas and methane production significantly increased in the enzymatically pre-treated samples compared to the untreated controls. In particular, the pre-treated algae exhibited no discernible lag phase, whereas methane production from untreated samples began only after approximately one day. This outcome highlights the capacity of enzymatic hydrolysis to accelerate substrate biodegradability and stimulate earlier microbial activity during anaerobic digestion. The cumulative production profiles for total biogas and methane obtained from both untreated and pre-treated microalgal biomass are illustrated in Figure 5. As shown in Figure 5a, total biogas production was markedly higher in pre-treated samples throughout the digestion period. Similarly, Figure 5b demonstrates a substantial improvement in cumulative methane production following enzymatic hydrolysis under optimized conditions.
These findings are consistent with previous studies conducted under comparable operational parameters. In this study, enzymatic hydrolysis increased methane yield to 52.50 mL/gVS, compared to 6.98 mL/gVS in untreated samples. Similarly, cumulative biogas production increased from 20.94 to 95.62 mL/gVS as a result of enzymatic pretreatment. This aligns with the work of Wieczorek et al. [29], who observed a 69% increase in methane yield from Chlorella vulgaris after enzymatic hydrolysis, and Mahdy et al. [30], who reported a 1.5-fold rise in biogas production from Scenedesmus sp. using a combination of Viscozyme and Celluclast. Comparable improvements have been reported by Passos et al. [31] and Yang et al. [23], further supporting the effectiveness of enzymatic hydrolysis in enhancing anaerobic digestion performance by improving substrate accessibility and reducing digestion lag phases.
Additionally, Gavala et al. [23] noted that enzyme pretreatment improved digestion performance and shortened the time lag until biological methane production commenced. Moreover, Taherzadeh and Karimi [24] discussed the significance of enzymatic pretreatment to enhance the anaerobic biodegradability of lignocellulosic and algal biomasses in increasing methane yields. The consistent trend across studies underscores the effectiveness of enzymatic hydrolysis in enhancing anaerobic digestion. The substantial increases in gas production, elimination of the lag phase, and consistency with literature evidence underscore the robustness of the experimental setup employed. These findings provide a solid basis for developing and validating a predictive model for biogas production optimization.

4. Conclusions

The study showed that enzymatic hydrolysis could effectively improve the release of carbohydrates and methane production from microalgal biomass. Optimization in the present study was conducted through RSM, which gave optimum conditions such as 20 mg/gVS enzyme loading, pH 5.0, and incubation for 72 h. Under optimized conditions, methane and biogas yields increased significantly, that is, 52.50 mL/gVS and 95.62 mL/gVS, respectively, in comparison to the untreated samples. The most influential parameters were enzyme loading and reaction time, while pH was less important. Enzymatic hydrolysis improved the bioavailability of organic matter, which increased anaerobic digestion. In this respect, the present study offers a green approach to enhancing biogas production, for renewable energy.

Author Contributions

Conceptualization, S.H., G.P. and K.D., methodology, S.H., A.B., K.D., G.P. and A.P. (Antonio Panico); formal analysis, S.H. and A.P. (Antonio Panico); investigation, S.H. and K.D.; data curation, S.H., A.B., K.D., G.P. and A.P. (Antonio Panico); writing—original draft preparation, S.H., A.B., K.D. and A.P. (Antonio Panico); writing—review and editing, S.H., K.D. and G.P.; supervision, K.D. and A.P. (Antonio Pizzi); project administration, K.D. All authors have read and agreed to the published version of the manuscript.

Funding

This research received no external funding.

Data Availability Statement

The data that support the findings of this study are available on request from the corresponding author.

Acknowledgments

This work was supported by the National Polytechnic School of Constantine (Algeria) and University of Campania “Luigi Vanvitelli”, Italy.

Conflicts of Interest

The authors declare no conflicts of interest.

Abbreviations

TSTotal solids
TVSTotal volatile solids
SSubstrate
IInoculum
CODtTotal chemical oxygen demand
CODsSoluble chemical oxygen demand
TKNTotal Kjeldahl nitrogen
RSMResponse surface methodology
BBDBox–Behnken Design
ADAnaerobic digestion

References

  1. Ariunbaatar, J.; Panico, A.; Esposito, G.; Pirozzi, F.; Lens, P.N.L. Pretreatment Methods to Enhance Anaerobic Digestion of Organic Solid Waste. Appl. Energy 2014, 123, 143–156. [Google Scholar] [CrossRef]
  2. Kumar, A.; Samadder, S.R. Performance Evaluation of Anaerobic Digestion Technology for Energy Recovery from Organic Fraction of Municipal Solid Waste: A Review. Energy 2020, 197, 117253. [Google Scholar] [CrossRef]
  3. Threedeach, S.; Chiemchaisri, W.; Watanabe, T.; Chiemchaisri, C.; Honda, R. Antibiotic Resistance of Escherichia coli in Leachates from Municipal Solid Waste Landfills: Comparison between Semi-Aerobic and Anaerobic Operations. Bioresour. Technol. 2012, 113, 253–258. [Google Scholar] [CrossRef] [PubMed]
  4. Sriwuryandari, L.; Priantoro, E.A.; Sintawardani, N.; Astuti, J.T.; Nilawati, D.; Putri, A.M.H.; Mamat; Sentana, S.; Sembiring, T. The Organic Agricultural Waste as a Basic Source of Biohydrogen Production. AIP Conf. Proc. 2016, 1711, 080002. [Google Scholar] [CrossRef]
  5. Pecorini, I.; Ferrari, L.; Baldi, F.; Albini, E.; Galoppi, G.; Bacchi, D.; Vizza, F.; Lombardi, L.; Carcasci, C.; Ferrara, G.; et al. Energy Recovery from Fermentative Biohydrogen Production of Biowaste: A Case Study Based Analysis. Energy Procedia 2017, 126, 605–612. [Google Scholar] [CrossRef]
  6. Zhao, C.H. Production of Cellulase by Trichoderma Reesei from Pretreated Straw and Furfural Residues. RSC Adv. 2018, 8, 36233–36238. [Google Scholar] [CrossRef]
  7. Hendriks, A.T.W.M.; Zeeman, G. Pretreatments to enhance the digestibility of lignocellulosic biomass. Bioresour. Technol. 2009, 100, 10–18. [Google Scholar] [CrossRef]
  8. Passos, F.; Ferrer, I. Microalgae conversion to biogas: Thermal pretreatment contribution on net energy production. Environ. Sci. Technol. 2014, 48, 7171–7178. [Google Scholar] [CrossRef]
  9. Mahdy, A.; Mendez, L.; Blanco, S.; Ballesteros, M.; González-Fernández, C. Protease cell wall degradation of Chlorella vulgaris: Effect on methane production. Bioresour. Technol. 2014, 171, 421–427. [Google Scholar] [CrossRef]
  10. Córdova, O.; Chamy, R.; Guerrero, L.; Sánchez-Rodríguez, A. Assessing the Effect of Pretreatments on the Structure and Functionality of Microbial Communities for the Bioconversion of Microalgae to Biogas. Front. Microbiol. 2018, 9, 1388. [Google Scholar] [CrossRef]
  11. Zhang, J.; Zhou, H.; Liu, D.; Zhao, X. Pretreatment of Lignocellulosic Biomass for Efficient Enzymatic Saccharification of Cellulose; INC: Singapore, 2019; ISBN 9780128159361. [Google Scholar]
  12. Quintero, R. Recent Advancements in Pretreatment Technologies of Biomass to Produce Bioenergy. In Bioenergy Research: Advances and Applications; Elsevier: Amsterdam, The Netherlands, 2014; pp. 57–69. [Google Scholar] [CrossRef]
  13. Hangri, S.; Derbal, K.; Policastro, G.; Panico, A.; Contestabile, P.; Pontoni, L.; Race, M.; Fabbricino, M. Combining Pretreatments and Co-Fermentation as Successful Approach to Improve Biohydrogen Production from Dairy Cow Manure. Environ. Res. 2024, 246, 118118. [Google Scholar] [CrossRef] [PubMed]
  14. Becker, E.W. Micro-algae as a source of protein. Biotechnol. Adv. 2007, 25, 207–210. [Google Scholar] [CrossRef] [PubMed]
  15. Kuhad, R.C.; Gupta, R.; Singh, A. Microbial cellulases and their industrial applications. Enzym. Res. 2011, 2011, 280696. [Google Scholar] [CrossRef]
  16. Minitab, LLC. Minitab Statistical Software, Release 19.1.0; Minitab, LLC.: State College, PA, USA, 2024; Available online: https://www.minitab.com (accessed on 10 March 2025).
  17. Appels, L.; Baeyens, J.; Degrève, J.; Dewil, R. Principles and potential of the anaerobic digestion of waste-activated sludge. Prog. Energy Combust. Sci. 2008, 34, 755–781. [Google Scholar] [CrossRef]
  18. Wang, Y.; Zhang, Y.; Wang, J.; Meng, L. Deeper insights into the effects of substrate to inoculum ratio selection on the relationship of kinetic parameters, microbial communities, and key metabolic pathways during the anaerobic digestion of food waste. Bioresour. Technol. 2022, 353, 127055. [Google Scholar] [CrossRef]
  19. Mahfouf Bouchareb, E.; Derbal, K.; Bedri, R.; Menas, S.; Bouchareb, R.; Dizge, N. Enhanced fermentative hydrogen production from potato waste by enzymatic pretreatment. Environ. Technol. 2024, 45, 1801–1809. [Google Scholar] [CrossRef]
  20. Ergüder, T.H.; Güven, E.; Demirer, G.N. Anaerobic Treatment of Olive Mill Wastes in Batch Reactors. Process Biochem. 2000, 36, 243–248. [Google Scholar] [CrossRef]
  21. Rice, E.W.; Baird, R.B.; Eaton, A.D.; American Public Health Association (APHA) (Eds.) Standard Methods for the Examination of Water and Wastewater, 22nd ed.; American Water Works Association (AWWA); Water Environment Federation (WEF): Washington, DC, USA, 2012; ISBN 978-087553-0130. [Google Scholar]
  22. Kumar, A.; Prasad, B.; Mishra, I.M. Optimization of process parameters for acrylonitrile removal by a low-cost adsorbent using Box-Behnken design. J. Hazard. Mater. 2008, 150, 174–182. [Google Scholar] [CrossRef]
  23. Gavala, H.N.; Yenal, U.; Skiadas, I.V.; Westermann, P.; Ahring, B.K. Mesophilic and thermophilic anaerobic digestion of primary and secondary sludge: Effect of pre-treatment at elevated temperature. Water Res. 2003, 37, 4561–4572. [Google Scholar] [CrossRef]
  24. Taherzadeh, M.J.; Karimi, K. Pretreatment of lignocellulosic wastes to improve ethanol and biogas production: A review. Int. J. Mol. Sci. 2008, 9, 1621–1651. [Google Scholar] [CrossRef]
  25. Padil, M.D.; Dharma Putra, M.; Hidayat, M.; Kasiamdari, R.S.; Mutamima, A.; Iwamoto, K.; Darmawan, M.A.; Gozan, M. Mechanism and kinetic model of microalgal enzymatic hydrolysis for prospective bioethanol conversion. RSC Adv. 2023, 13, 21403–21413. [Google Scholar] [CrossRef] [PubMed]
  26. Kassim, M.A.; Tan, K.M.; Serri, N.A. Enzymatic hydrolysis of dilute alkaline pretreated Chlorella sp. biomass for biosugar production and fed-batch bioethanol fermentation. Asia-Pac. J. Sci. Technol. 2022, 27, 134699. [Google Scholar] [CrossRef]
  27. Zhang, Y.-H.P.; Himmel, M.E.; Mielenz, J.R. Outlook for cellulase improvement: Screening and selection strategies. Biotechnol. Adv. 2006, 24, 452–481. [Google Scholar] [CrossRef] [PubMed]
  28. Wieczorek, N.; Kucuker, M.A.; Kuchta, K. Fermentative hydrogen and methane production from microalgal biomass (Chlorella vulgaris) in a two-stage combined process. Appl. Energy 2014, 132, 108–117. [Google Scholar] [CrossRef]
  29. Yang, J.; Xu, M.; Zhang, X.; Hu, Q.; Sommerfeld, M.; Chen, Y. Life-cycle analysis on biodiesel production from microalgae: Water footprint and nutrients balance. Bioresour. Technol. 2011, 102, 159–165. [Google Scholar] [CrossRef]
  30. Mahdy, A.; Mendez, L.; Tomás-Pejó, E.; Morales, M.M.; Ballesteros, M.; González-Fernández, C. Influence of enzymatic hydrolysis on the biochemical methane potential of Chlorella vulgaris and Scenedesmus sp. J. Chem. Technol. Biotechnol. 2015, 90, 2008–2014. [Google Scholar] [CrossRef]
  31. Passos, F.; Hom-Diaz, A.; Blánquez, P.; Vicent, T.; Ferrer, I. Improvement of microalgae anaerobic digestion by enzymatic pretreatment. Bioresour. Technol. 2016, 199, 347–351. [Google Scholar] [CrossRef]
Figure 1. Schematic representation of enzymatic hydrolysis setup.
Processes 13 02086 g001
Figure 2. The main effects of enzyme loading, pH, and time on carbohydrate release.
Processes 13 02086 g002
Figure 3. Three-dimensional response surface plots showing the interactive effects of (a) pH and enzyme loading, (b) pH and time, and (c) enzyme loading and time on carbohydrate release from microalgal biomass during enzymatic hydrolysis.
Processes 13 02086 g003
Figure 4. Normal Probability Plot of Residuals.
Processes 13 02086 g004
Figure 5. (a) Cumulative total biogas production (b) Cumulative methane production for untreated and enzymatic pretreatment.
Processes 13 02086 g005
Table 1. Characteristics of substrate and inoculum.
ParametersUnitSubstrateİnoculum
pH-6.77.5
Total alkalinitymg CaCO3/L12,0001429
Alkalintymg CaCO3/L4000NA
TSg/L83.7351.0
VSg/L43.1229.0
VS/TS%51.4956.86
CODtg/L17.7716.35
CODsg/LNA4.08
CODs/CODt%NA24.95
Carbohydrateg/L0.1960.72
Proteing/L0.0325NA
Table 2. Factors used in BBD.
Coded ValuesFactors Coded Level
Unit−10+1
X1pH-4.555.5
X2Enzyme loadingmg/gVS244872
X3Timehours203040
Table 3. Design matrix and experiments results.
Exp NoParametersResponse
pHEnzyme
Loading (mg/gVS)
Time
(h)
Carbohydrate Release
(mg/L)
Experimental
Carbohydrate Release
(mg/L)
Predicted
14.52048183.958180.211
25.52048183.180179.166
34.54048133.180143.582
45.54048133.013136.760
54.5302452.18034.149
65.5302479.18069.627
74.53072210.000221.375
85.53072160.000178.031
95202438.14759.924
1054024110.424118.053
1152072313.013305.385
1254072190.000168.222
1353048126.000128.898
144.52048134.513128.898
155.52048126.180128.898
Table 4. Estimated regression coefficients.
TermCoefficientStudent Test (T)Probability Value (p)
Constant128.9015.070.000
X1−3.10−4.650.579
X2−24.34−0.590.006
X368.6413.100.000
X1 × X11.300.170.873
X2 × X226.873.490.018
X3 × X3−3.37−0.440.680
X1 × X21.420.190.856
X1 × X3−17.76−2.400.062
X2 × X3−59.32−8.010.000
Table 5. Analysis of variance (ANOVA) for the quadratic model of carbohydrate release.
SourceDegree of FreedomSum of SquareMean SquareFisher Test (F)Probability Value (p)
Model960,631.66736.830.690.001
Linear342,509.914,170.064.560.000
Square32776.72666.44.220.078
Interactions315,345.05115.023.300.002
Error51097.4219.5
Lack of fit31050.1350.014.800.064
Total1424,560.9
Disclaimer/Publisher’s Note: The statements, opinions and data contained in all publications are solely those of the individual author(s) and contributor(s) and not of MDPI and/or the editor(s). MDPI and/or the editor(s) disclaim responsibility for any injury to people or property resulting from any ideas, methods, instructions or products referred to in the content.

