Enhancing Flexibility in Forest Biomass Procurement: A Matheuristic Approach for Resilient Bioenergy Supply Chains Under Resource Variability
Abstract
1. Introduction
2. Literature Review
2.1. Strategies to Enhance Flexibility in the Supply Chain
2.2. Implementing Dynamic Network Reconfiguration and Operation Postponement Strategies
| Reference | Flexibility | FLP Extensions | Solution Methods | |||||||||
|---|---|---|---|---|---|---|---|---|---|---|---|---|
| DNR | OP | MP | OA | ME | m | MS | Exacts | Heuristics | ||||
| Hinojosa et al. [42] | • | • | • | |||||||||
| Badri et al. [35] | • | • | • | • | • | • | ||||||
| Hammami and Frein [30] | • | • | • | • | • | |||||||
| Cortinhal et al. [31] | • | • | • | • | • | |||||||
| Halper et al. [36] | • | • | • | • | ||||||||
| Vahid Nooraie and Parast [25] | • | • | • | • | ||||||||
| de Keizer et al. [38] | • | • | • | • | • | |||||||
| Akhtari et al. [39] | • | • | • | • | ||||||||
| Rohaninejad et al. [33] | • | • | • | |||||||||
| Torabi et al. [34] | • | • | • | |||||||||
| Chauhan et al. [43] | • | • | ||||||||||
| Darvish et al. [24] | • | • | • | • | • | |||||||
| Jabbarzadeh et al. [17] | • | • | • | • | ||||||||
| Raghavan et al. [37] | • | • | • | • | ||||||||
| Sanci and Daskin [16] | • | • | • | • | ||||||||
| Weskamp et al. [41] | • | • | • | • | • | |||||||
| Yu and Solvang [23] | • | • | • | • | ||||||||
| Budiman and Rau [40] | • | • | • | • | • | |||||||
| Our problem | • | • | • | • | • | • | • | • | ||||
3. Modeling Approach
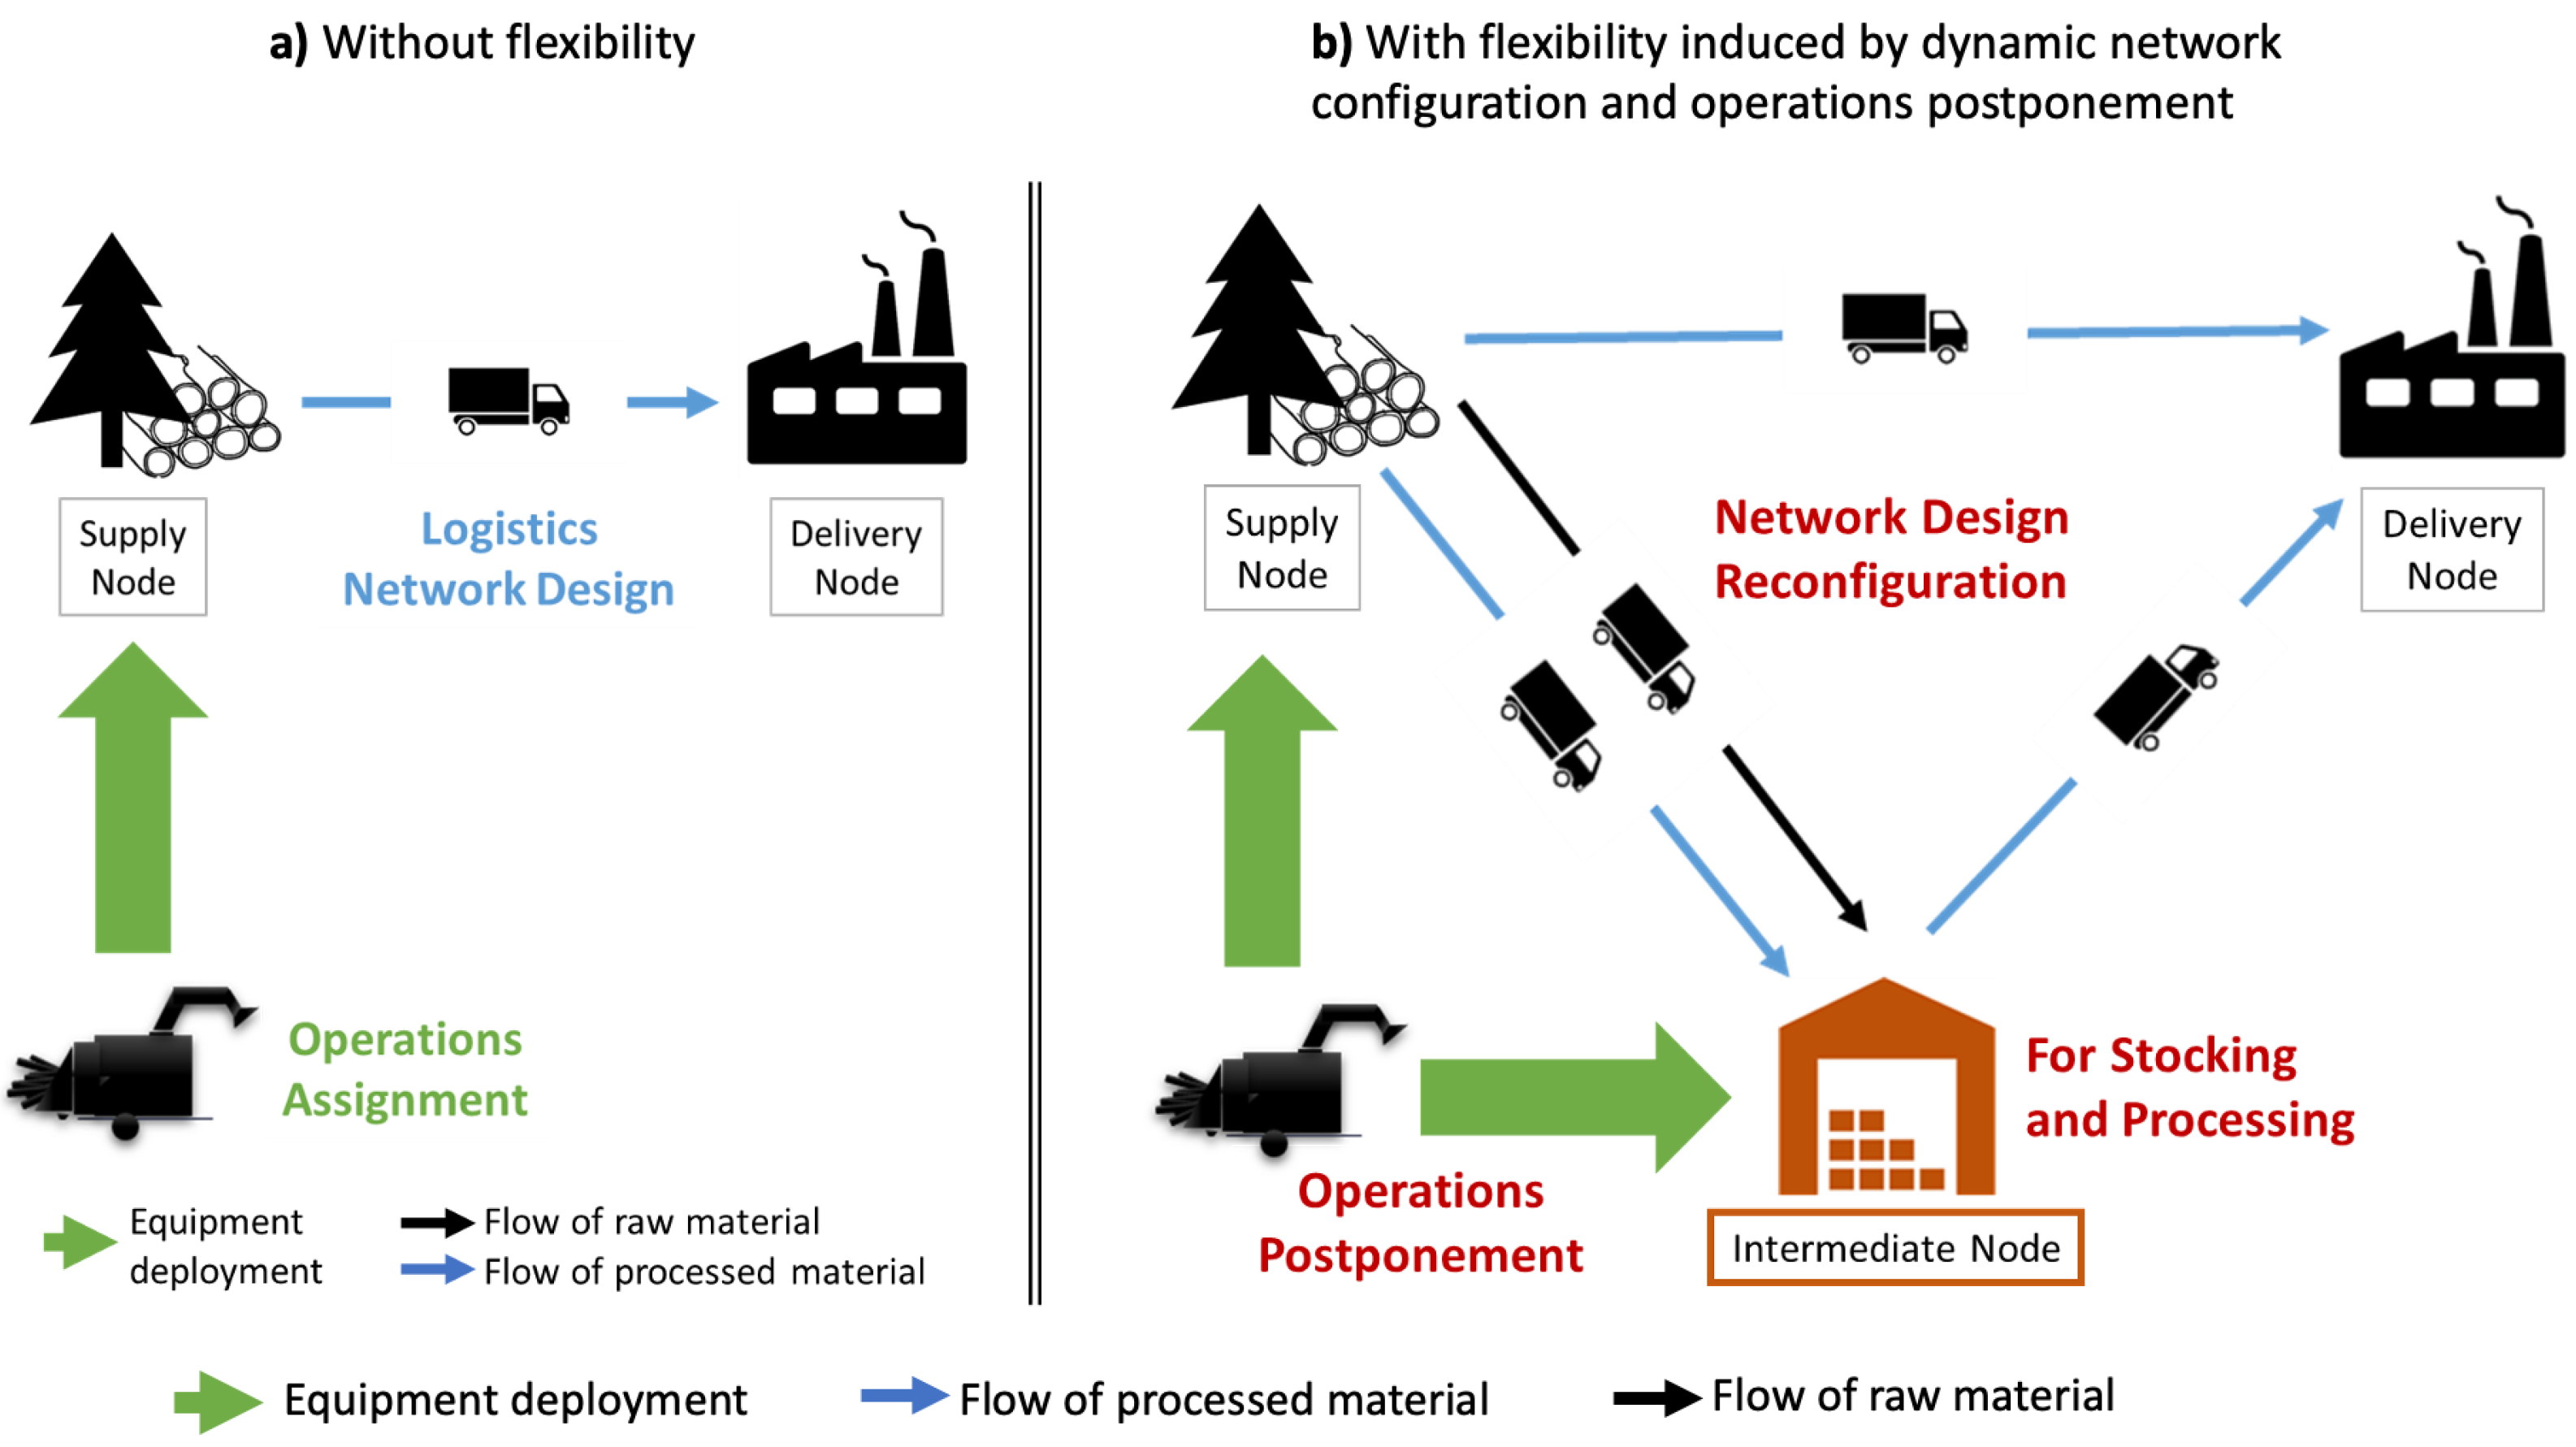
3.1. Combining Flexibility Strategies
- Without Intermediate Nodes (A): in this option there is no possibility to open intermediate nodes. Consequently, all operations are performed on supply nodes.
- Processing only in Permanent Intermediate Nodes (B): this option implies that operations are performed only on permanent intermediate nodes, which only have a processing function.
- Processing in Supply and Temporary Intermediate Nodes (C): this option represents the highest level of flexibility studied, processing can be done on both nodes, and temporary intermediate nodes have storage and/or a processing function.
3.2. Mobile Facility Location Problem Including Dynamic Operations Assignment (mFLP-dOA)
4. Solution Approach
4.1. Decomposition Strategies
- Period-based decomposition consists on selecting all the integer variables referring to a single macroperiod.
- Entities-based decomposition consists on randomly selecting the integer variables referring to a subset of timeperiods, locations, and machines.
- Random-based decomposition consists on randomly selecting a subset of integer variables (i.e., 25%, 50%, or 75% of all variables).
4.2. Matheuristic Procedure
4.2.1. Relax-and-Fix
| Algorithm 1 Relax-and-fix outline |
|
4.2.2. Fix-and-Optimize
| Algorithm 2 Fix-and-optimize outline |
|
5. Computational Experiments
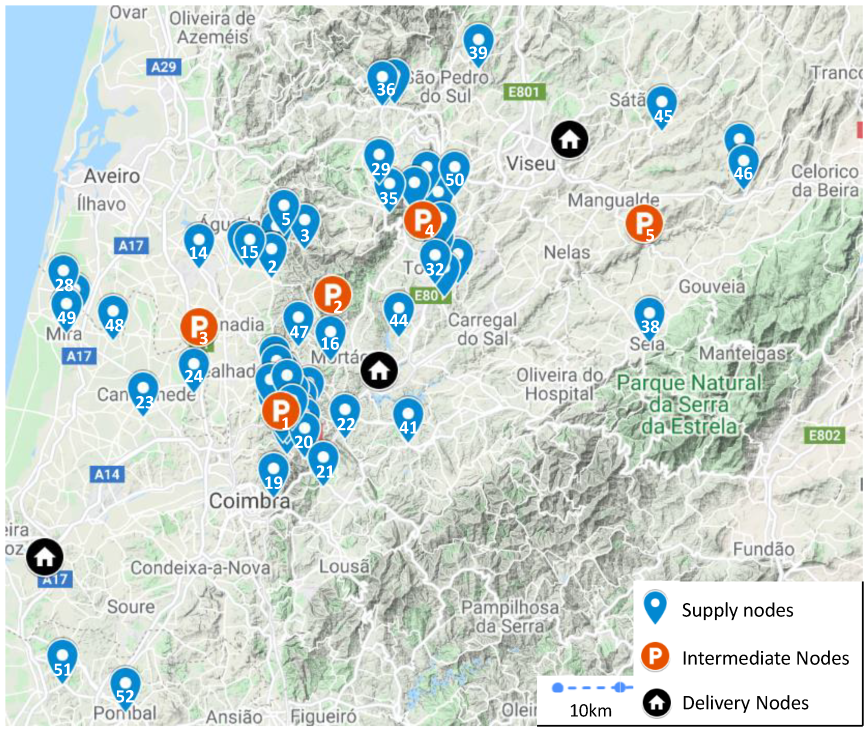
5.1. Case Study
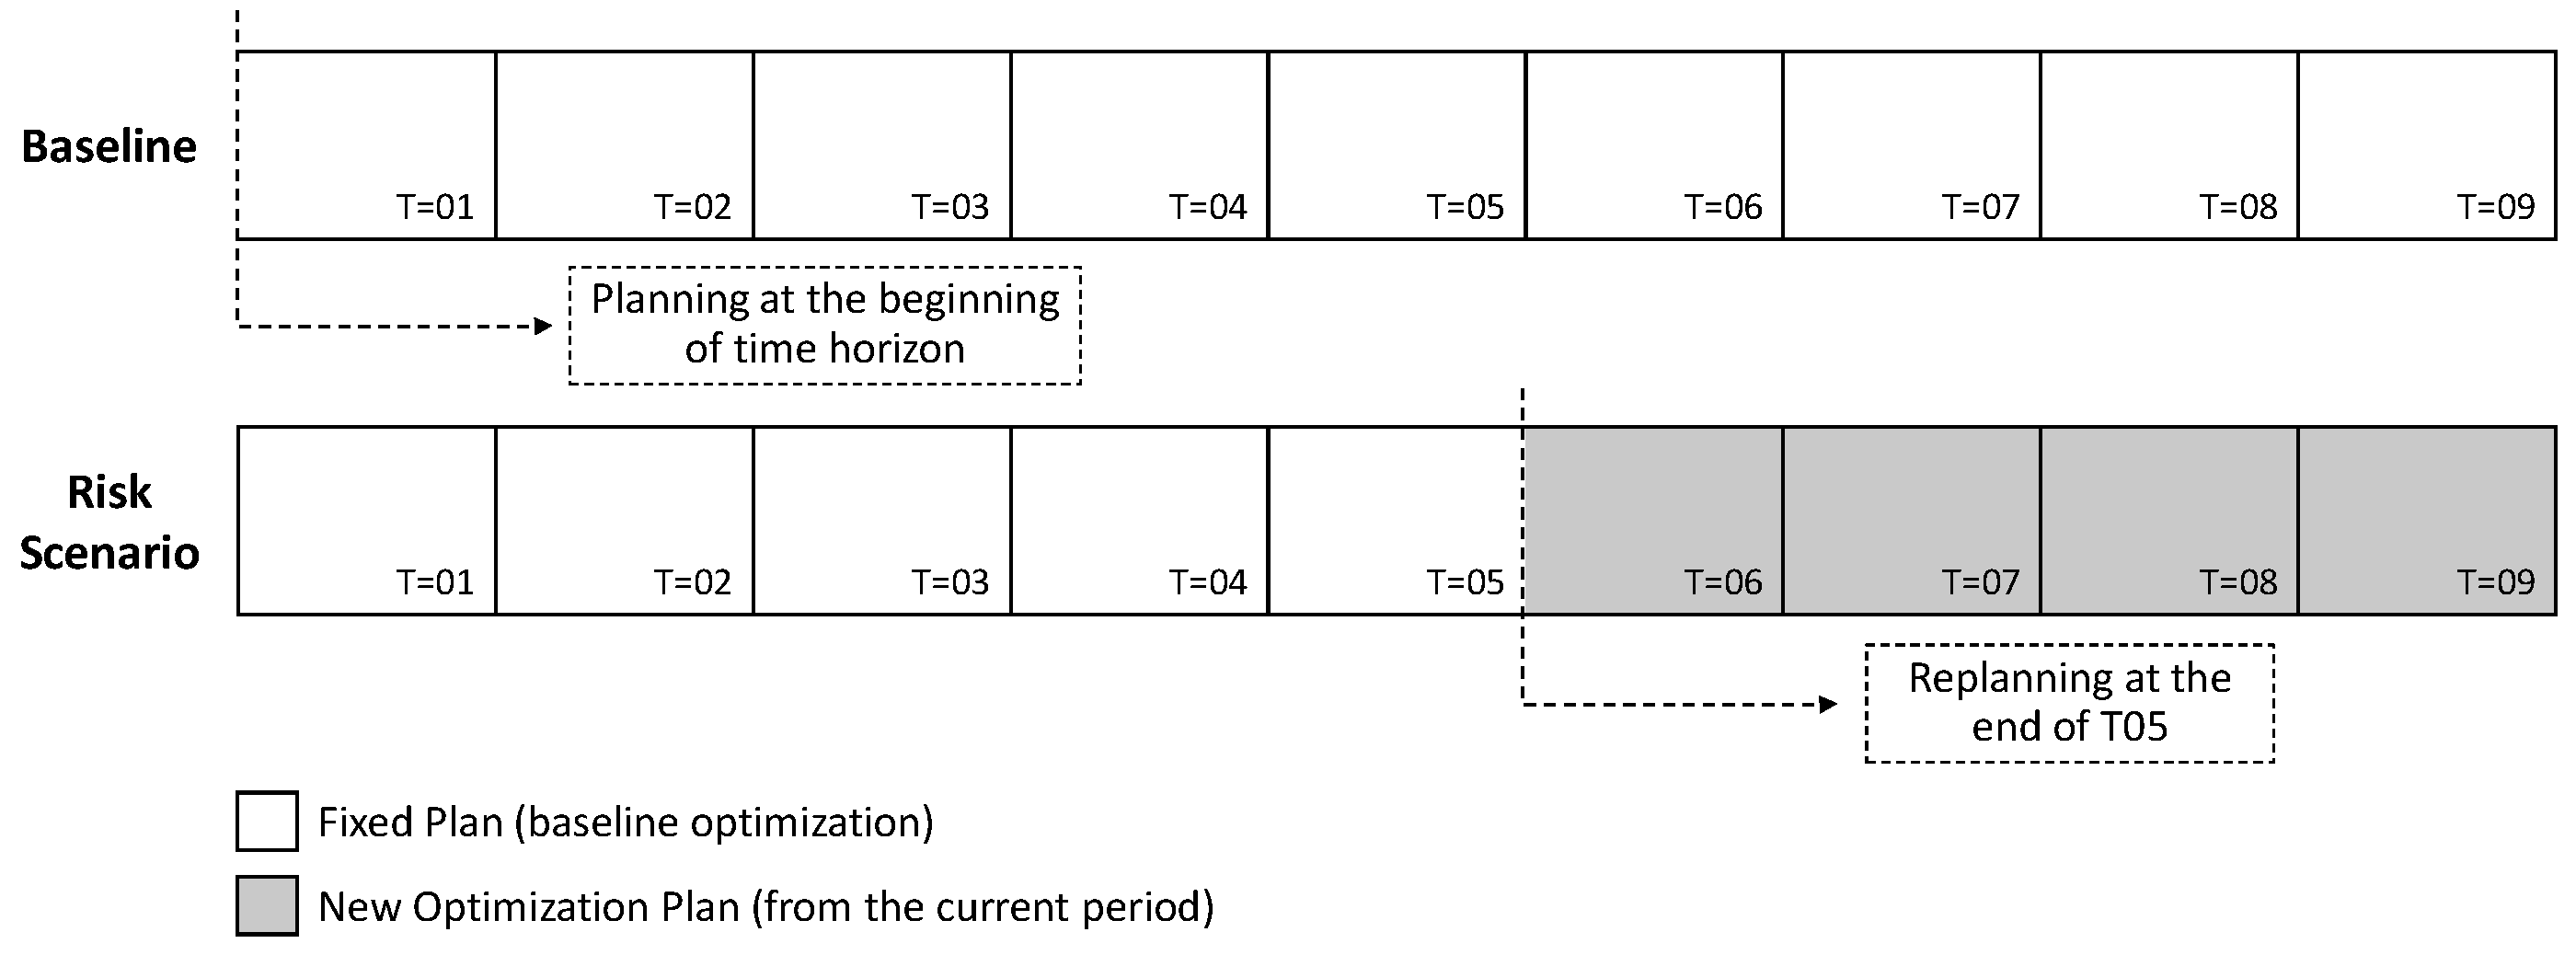
5.2. Experiments Design
- The optimistic scenario (baseline): corresponding to the baseline without incorporating variability in raw materials availability;
- Scenario (1): considers volumes more than 20% than the expected for all piles;
- Scenario (2): considers expected delays in all piles, resulting from the prohibition of any forestry operations during the month of August, as a preventive measure for fires;
- Scenario (3): results from the combination of the two previous scenarios, being the most pessimistic scenario.
5.3. Results Analysis
5.3.1. Solution Method Results
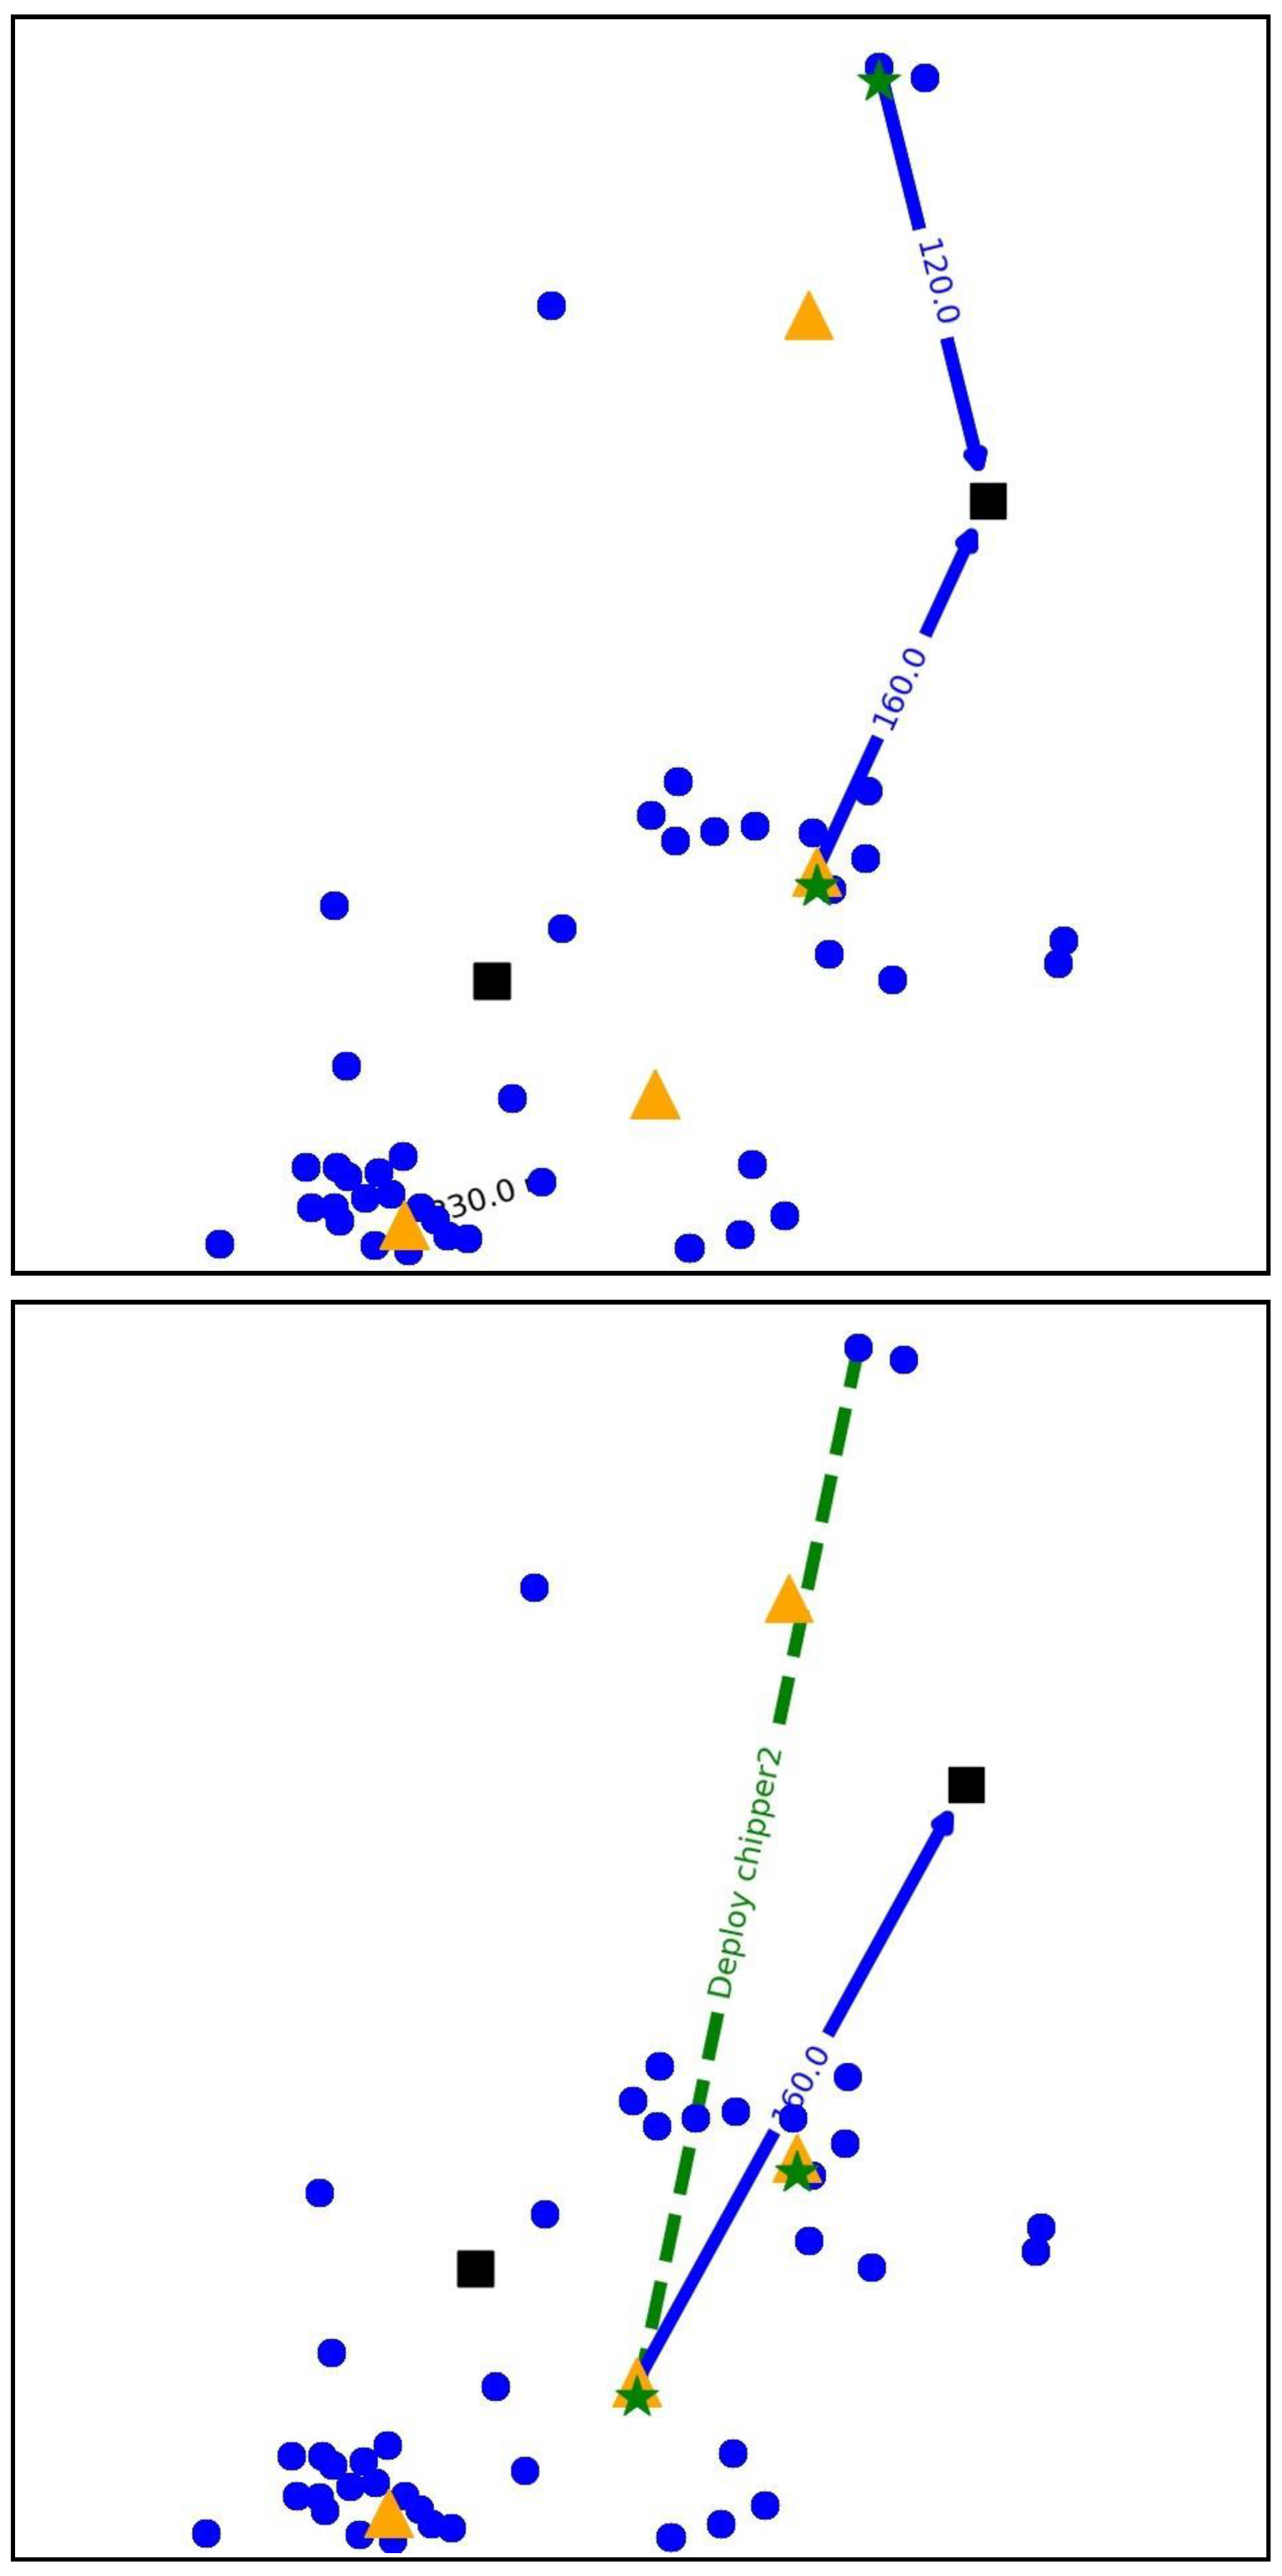
5.3.2. Results of Experiments Performed
6. Conclusions, Discussion and Future Work
Author Contributions
Funding
Data Availability Statement
Conflicts of Interest
Abbreviations
| Sets | |
| P | set of supply nodes |
| M | set of delivery nodes |
| O | set of intermediate nodes |
| N | set of destination nodes, |
| S | set of processing nodes, |
| A | set of possible arcs, |
| K | set of machines |
| I | set of possible allocations, |
| T | set of time macroperiods (months) |
| set of time microperiods (days) of a macroperiod | |
| Decision Variables | |
| flow of processed material traversing arc in microperiod (ton) | |
| flow of raw material from supply node to intermediate node in | |
| microperiod (ton) | |
| flow of processed material (in supply node ) from intermediate node | |
| to delivery node in microperiod (ton) | |
| number of hours worked by machine at location in microperiod | |
| number of extra hours worked by machine at location in | |
| microperiod | |
| quantity of unprocessed material at intermediate node in the end of | |
| microperiod (ton) | |
| quantity of processed material in intermediate node stored in | |
| intermediate node in the end of microperiod (ton) | |
| quantity of processed material in supply node stored in intermediate | |
| node in the end of microperiod (ton) | |
| Parameters | |
| availability of raw material in supply node in macroperiod | |
| storage capacity at intermediate node | |
| demand of processed material at delivery node in macroperiod | |
| machine productivity | |
| productivity conversion ratio | |
| travel distance when traversing arc | |
| conversion ratio of the transport capacity of a truck with unprocessed material | |
| q | transport capacity of a truck with processed material |
| hourly working cost for machine (€) at location | |
| s | truck distance cost (€) |
| e | average percentage of working time lost transporting a chipper |
| last timeperiod | |
| c | number of microperiod of timeperiod |
| total working time per microperiod | |
| monthly cost of keeping an intermediate node open (€) | |
| cost of deploying to location (€) |
References
- Sreedevi, R.; Saranga, H. Uncertainty and supply chain risk: The moderating role of supply chain flexibility in risk mitigation. Int. J. Prod. Econ. 2017, 193, 332–342. [Google Scholar] [CrossRef]
- Chopra, S.; Sodhi, M.M.S. Managing risk to avoid: Supply-chain breakdown. MIT Sloan Management Review, 15 October 2004; p. 46. [Google Scholar]
- Gomes, R.; Silva, R.G.; Amorim, P. Solving Logistical Challenges in Raw Material Reception: An Optimization and Heuristic Approach Combining Revenue Management Principles with Scheduling Techniques. Mathematics 2025, 13, 919. [Google Scholar] [CrossRef]
- Paulo, H.; Azcue, X.; Barbosa-Póvoa, A.P.; Relvas, S. Supply chain optimization of residual forestry biomass for bioenergy production: The case study of Portugal. Biomass Bioenergy 2015, 83, 245–256. [Google Scholar] [CrossRef]
- Maheshwari, P.; Singla, S.; Shastri, Y. Resiliency optimization of biomass to biofuel supply chain incorporating regional biomass pre-processing depots. Biomass Bioenergy 2017, 97, 116–131. [Google Scholar] [CrossRef]
- Auer, V.; Rauch, P. Wood supply chain risks and risk mitigation strategies: A systematic review focusing on the Northern hemisphere. Biomass Bioenergy 2021, 148, 106001. [Google Scholar] [CrossRef]
- Shabani, N.; Sowlati, T. A hybrid multi-stage stochastic programming-robust optimization model for maximizing the supply chain of a forest-based biomass power plant considering uncertainties. J. Clean. Prod. 2016, 112, 3285–3293. [Google Scholar] [CrossRef]
- Piqueiro, H.; Gomes, R.; Santos, R.; de Sousa, J.P. Managing Disruptions in a Biomass Supply Chain: A Decision Support System Based on Simulation/Optimisation. Sustainability 2023, 15, 7650. [Google Scholar] [CrossRef]
- Chidozie, B.; Ramos, A.; Vasconcelos, J.; Ferreira, L.P.; Gomes, R. Highlighting Sustainability Criteria in Residual Biomass Supply Chains: A Dynamic Simulation Approach. Sustainability 2024, 16, 9709. [Google Scholar] [CrossRef]
- Sánchez, A.M.; Pérez, M.P. Supply chain flexibility and firm performance: A conceptual model and empirical study in the automotive industry. Int. J. Oper. Prod. Manag. 2005, 25, 681–700. [Google Scholar] [CrossRef]
- Gunnarsson, H.; Rönnqvist, M.; Lundgren, J.T. Supply chain modelling of forest fuel. Eur. J. Oper. Res. 2004, 158, 103–123. [Google Scholar] [CrossRef]
- Silva, R.G.; Pimentel, C.; Gomes, R.; Ramos, A.L.; Matias, J.C.O. Sustainable Harvest/Collection Optimization of Residual Agro-Forestry Biomass §including Wildfire Risk. Procedia Comput. Sci. 2025, 253, 3037–3048. [Google Scholar] [CrossRef]
- Gautam, S.; LeBel, L.; Carle, M.A. Supply chain model to assess the feasibility of incorporating a terminal between forests and biorefineries. Appl. Energy 2017, 198, 377–384. [Google Scholar] [CrossRef]
- Ng, R.T.; Maravelias, C.T. Design of biofuel supply chains with variable regional depot and biorefinery locations. Renew. Energy 2017, 100, 90–102. [Google Scholar] [CrossRef]
- Malladi, K.T.; Sowlati, T. Biomass logistics: A review of important features, optimization modeling and the new trends. Renew. Sustain. Energy Rev. 2018, 94, 587–599. [Google Scholar] [CrossRef]
- Sanci, E.; Daskin, M.S. Integrating location and network restoration decisions in relief networks under uncertainty. Eur. J. Oper. Res. 2019, 279, 335–350. [Google Scholar] [CrossRef]
- Jabbarzadeh, A.; Haughton, M.; Pourmehdi, F. A robust optimization model for efficient and green supply chain planning with postponement strategy. Int. J. Prod. Econ. 2019, 214, 266–283. [Google Scholar] [CrossRef]
- Tang, C.; Tomlin, B. The power of flexibility for mitigating supply chain risks. Int. J. Prod. Econ. 2008, 116, 12–27. [Google Scholar] [CrossRef]
- Saghiri, S.S.; Barnes, S.J. Supplier flexibility and postponement implementation: An empirical analysis. Int. J. Prod. Econ. 2016, 173, 170–183. [Google Scholar] [CrossRef]
- Wong, H.; Potter, A.; Naim, M. Evaluation of postponement in the soluble coffee supply chain: A case study. Int. J. Prod. Econ. 2011, 131, 355–364. [Google Scholar] [CrossRef]
- Kamalahmadi, M.; Parast, M.M. An assessment of supply chain disruption mitigation strategies. Int. J. Prod. Econ. 2017, 184, 210–230. [Google Scholar] [CrossRef]
- Silva, H.; Gomes, R.; Sousa, C. Classifying Forest Supply Chain Traceability Data with an Ontological Approach. Procedia Comput. Sci. 2025, 253, 3049–3058. [Google Scholar] [CrossRef]
- Yu, H.; Solvang, W.D. A fuzzy-stochastic multi-objective model for sustainable planning of a closed-loop supply chain considering mixed uncertainty and network flexibility. J. Clean. Prod. 2020, 266, 121702. [Google Scholar] [CrossRef]
- Darvish, M.; Archetti, C.; Coelho, L.C.; Speranza, M.G. Flexible two-echelon location routing problem. Eur. J. Oper. Res. 2019, 277, 1124–1136. [Google Scholar] [CrossRef]
- Vahid Nooraie, S.; Parast, M.M. Mitigating supply chain disruptions through the assessment of trade-offs among risks, costs and investments in capabilities. Int. J. Prod. Econ. 2016, 171, 8–21. [Google Scholar] [CrossRef]
- Chan, A.T.; Ngai, E.W.; Moon, K.K. The effects of strategic and manufacturing flexibilities and supply chain agility on firm performance in the fashion industry. Eur. J. Oper. Res. 2017, 259, 486–499. [Google Scholar] [CrossRef]
- Moon, K.K.L.; Yi, C.Y.; Ngai, E.W. An instrument for measuring supply chain flexibility for the textile and clothing companies. Eur. J. Oper. Res. 2012, 222, 191–203. [Google Scholar] [CrossRef]
- Merschmann, U.; Thonemann, U.W. Supply chain flexibility, uncertainty and firm performance: An empirical analysis of German manufacturing firms. Int. J. Prod. Econ. 2011, 130, 43–53. [Google Scholar] [CrossRef]
- Manders, J.H.; Caniëls, M.C.; Ghijsen, P.W. Exploring supply chain flexibility in a FMCG food supply chain. J. Purch. Supply Manag. 2016, 22, 181–195. [Google Scholar] [CrossRef]
- Hammami, R.; Frein, Y. Redesign of global supply chains with integration of transfer pricing: Mathematical modeling and managerial insights. Int. J. Prod. Econ. 2014, 158, 267–277. [Google Scholar] [CrossRef]
- Cortinhal, M.J.; Lopes, M.J.; Melo, M.T. Dynamic design and re-design of multi-echelon, multi-product logistics networks with outsourcing opportunities: A computational study. Comput. Ind. Eng. 2015, 90, 118–131. [Google Scholar] [CrossRef]
- Ortiz-Astorquiza, C.; Contreras, I.; Laporte, G. Multi-level facility location as the maximization of a submodular set function. Eur. J. Oper. Res. 2015, 247, 1013–1016. [Google Scholar] [CrossRef]
- Rohaninejad, M.; Sahraeian, R.; Tavakkoli-Moghaddam, R. An accelerated Benders decomposition algorithm for reliable facility location problems in multi-echelon networks. Comput. Ind. Eng. 2018, 124, 523–534. [Google Scholar] [CrossRef]
- Torabi, S.A.; Shokr, I.; To, S.; Heydari, J. Integrated relief pre-positioning and procurement planning in humanitarian supply chains. Transp. Res. Part E Logist. Transp. Rev. 2018, 113, 123–146. [Google Scholar] [CrossRef]
- Badri, H.; Bashiri, M.; Hejazi, T.H. Integrated strategic and tactical planning in a supply chain network design with a heuristic solution method. Comput. Oper. Res. 2013, 40, 1143–1154. [Google Scholar] [CrossRef]
- Halper, R.; Raghavan, S.; Sahin, M. Local search heuristics for the mobile facility location problem. Comput. Oper. Res. 2015, 62, 210–223. [Google Scholar] [CrossRef]
- Raghavan, S.; Sahin, M.; Salman, F.S. The capacitated mobile facility location problem. Eur. J. Oper. Res. 2019, 277, 507–520. [Google Scholar] [CrossRef]
- De Keizer, M.; Akkerman, R.; Grunow, M.; Bloemhof, J.M.; Haijema, R.; van der Vorst, J.G. Logistics network design for perishable products with heterogeneous quality decay. Eur. J. Oper. Res. 2017, 262, 535–549. [Google Scholar] [CrossRef]
- Akhtari, S.; Sowlati, T.; Griess, V.C. Integrated strategic and tactical optimization of forest-based biomass supply chains to consider medium-term supply and demand variations. Appl. Energy 2018, 213, 626–638. [Google Scholar] [CrossRef]
- Budiman, S.D.; Rau, H. A stochastic model for developing speculation-postponement strategies and modularization concepts in the global supply chain with demand uncertainty. Comput. Ind. Eng. 2021, 158, 107392. [Google Scholar] [CrossRef]
- Weskamp, C.; Koberstein, A.; Schwartz, F.; Suhl, L.; Voß, S. A two-stage stochastic programming approach for identifying optimal postponement strategies in supply chains with uncertain demand. Omega 2019, 83, 123–138. [Google Scholar] [CrossRef]
- Hinojosa, Y.; Puerto, J.; Fernández, F.R. A multiperiod two-echelon multicommodity capacitated plant location problem. Eur. J. Oper. Res. 2000, 123, 271–291. [Google Scholar] [CrossRef]
- Chauhan, D.; Unnikrishnan, A.; Figliozzi, M. Maximum coverage capacitated facility location problem with range constrained drones. Transp. Res. Part C Emerg. Technol. 2019, 99, 1–18. [Google Scholar] [CrossRef]
- Khatami, M.; Mahootchi, M.; Farahani, R.Z. Benders’ decomposition for concurrent redesign of forward and closed-loop supply chain network with demand and return uncertainties. Transp. Res. Part E Logist. Transp. Rev. 2015, 79, 1–21. [Google Scholar] [CrossRef]
- Helber, S.; Sahling, F. A fix-and-optimize approach for the multi-level capacitated lot sizing problem. Int. J. Prod. Econ. 2010, 123, 247–256. [Google Scholar] [CrossRef]
- Karimi Dastjerd, N.; Ertogral, K. A fix-and-optimize heuristic for the integrated fleet sizing and replenishment planning problem with predetermined delivery frequencies. Comput. Ind. Eng. 2019, 127, 778–787. [Google Scholar] [CrossRef]
- Chen, H. Fix-and-optimize and variable neighborhood search approaches for multi-level capacitated lot sizing problems. Omega 2015, 56, 25–36. [Google Scholar] [CrossRef]
- Neves-Moreira, F.; Almada-Lobo, B.; Cordeau, J.F.; Guimarães, L.; Jans, R. Solving a large multi-product production-routing problem with delivery time windows. Omega 2019, 86, 154–172. [Google Scholar] [CrossRef]
- Sahling, F.; Buschkühl, L.; Tempelmeier, H.; Helber, S. Solving a multi-level capacitated lot sizing problem with multi-period setup carry-over via a fix-and-optimize heuristic. Comput. Oper. Res. 2009, 36, 2546–2553. [Google Scholar] [CrossRef][Green Version]
- Larrain, H.; Coelho, L.C.; Cataldo, A. A Variable MIP Neighborhood Descent algorithm for managing inventory and distribution of cash in automated teller machines. Comput. Oper. Res. 2017, 85, 22–31. [Google Scholar] [CrossRef]
- Neves-Moreira, F.; Amorim-Lopes, M.; Amorim, P. The multi-period vehicle routing problem with refueling decisions: Traveling further to decrease fuel cost? Transp. Res. Part E Logist. Transp. Rev. 2020, 133, 101817. [Google Scholar] [CrossRef]
- Neves-Moreira, F.; Veldman, J.; Teunter, R.H. Service operation vessels for offshore wind farm maintenance: Optimal stock levels. Renew. Sustain. Energy Rev. 2021, 146, 111158. [Google Scholar] [CrossRef]


| Parameters | Sets | Size |
|---|---|---|
| Months | 9, 18 | |
| Supply Nodes | 9, 52 | |
| Intermediate Nodes | 1, 5, 10 | |
| Delivery Nodes | 1, 3, 6 |
| Solver | MH | |||||||||
|---|---|---|---|---|---|---|---|---|---|---|
|
Objective
Function |
Runtime
(s) |
Relative
Gap (%) |
Objective
Function |
Runtime
(s) |
Relative
Gap (%) * | |||||
| 9 | 9 | 1 | 1 | 553,847.93 | 7200.01 | 0.15 | 553,717.05 | 2330.35 | 0.13 | |
| 9 | 9 | 1 | 3 | 549,765.13 | 7200.01 | 0.14 | 549,752.03 | 2432.09 | 0.14 | |
| 9 | 9 | 1 | 6 | 555,184.11 | 7200.02 | 0.14 | 555,095.81 | 3501.87 | 0.12 | |
| 9 | 9 | 5 | 1 | 529,288.05 | 7200.02 | 0.66 | 529,520.00 | 3641.23 | 0.70 | |
| 9 | 9 | 5 | 3 | 518,873.09 | 7200.01 | 0.68 | 518,925.23 | 3622.50 | 0.69 | |
| 9 | 9 | 5 | 6 | 521,178.95 | 7200.01 | 1.29 | 520,297.62 | 3607.83 | 1.12 | |
| 9 | 9 | 10 | 1 | 622,649.74 | 7211.08 | 0.61 | 622,693.07 | 3633.66 | 0.62 | |
| 9 | 9 | 10 | 3 | 606,805.31 | 7200.05 | 0.75 | 607,096.73 | 3613.53 | 0.80 | |
| 9 | 9 | 10 | 6 | 610,618.67 | 7200.01 | 0.53 | 610,667.11 | 3628.00 | 0.54 | |
| 9 | 52 | 1 | 1 | 635,041.10 | 7200.02 | 1.71 | 634,280.48 | 3653.11 | 1.59 | |
| 9 | 52 | 1 | 3 | 611,725.06 | 7200.02 | 1.83 | 611,011.81 | 3658.77 | 1.72 | |
| 9 | 52 | 1 | 6 | 606,131.71 | 7200.10 | 1.88 | 606,426.89 | 3621.01 | 1.93 | |
| 9 | 52 | 5 | 1 | 568,983.80 | 7200.03 | 1.92 | 569,949.46 | 3664.82 | 2.09 | |
| 9 | 52 | 5 | 3 | 543,465.03 | 7200.02 | 2.34 | 542,138.18 | 3689.01 | 2.10 | |
| 9 | 52 | 5 | 6 | 525,380.86 | 7200.03 | 1.70 | 525,057.04 | 3655.24 | 1.64 | |
| 9 | 52 | 10 | 1 | 571,641.66 | 7200.20 | 5.21 | 562,510.44 | 3700.82 | 3.67 | |
| 9 | 52 | 10 | 3 | 529,835.53 | 7200.05 | 2.88 | 532,010.33 | 3709.56 | 3.28 | |
| 9 | 52 | 10 | 6 | 512,531.02 | 7200.16 | 2.97 | 514,212.18 | 3807.73 | 3.29 | |
| 18 | 9 | 1 | 1 | 938,648.01 | 7200.01 | 0.30 | 938,494.04 | 3634.13 | 0.28 | |
| 18 | 9 | 1 | 3 | 934,996.83 | 7200.01 | 0.35 | 934,871.24 | 3612.04 | 0.34 | |
| 18 | 9 | 1 | 6 | 945,297.50 | 7200.04 | 0.26 | 945,098.08 | 3609.77 | 0.24 | |
| 18 | 9 | 5 | 1 | 907,544.17 | 7200.02 | 0.90 | 909,560.83 | 3638.64 | 1.12 | |
| 18 | 9 | 5 | 3 | 891,157.58 | 7200.02 | 1.24 | 891,676.44 | 3673.48 | 1.30 | |
| 18 | 9 | 5 | 6 | 891,084.76 | 7200.03 | 1.17 | 894,228.84 | 3629.90 | 1.52 | |
| 18 | 9 | 10 | 1 | 1,090,724.04 | 7200.04 | 1.19 | 1,095,425.26 | 3663.81 | 1.61 | |
| 18 | 9 | 10 | 3 | 1,059,652.16 | 7200.04 | 1.26 | 1,061,530.02 | 3689.54 | 1.43 | |
| 18 | 9 | 10 | 6 | 1,063,266.35 | 7200.04 | 0.99 | 1,071,277.55 | 3678.92 | 1.73 | |
| 18 | 52 | 1 | 1 | 1,057,280.53 | 7200.37 | 2.36 | 1,054,537.18 | 3723.53 | 2.11 | |
| 18 | 52 | 1 | 3 | 987,761.67 | 7200.25 | 2.85 | 982,798.01 | 3675.99 | 2.36 | |
| 18 | 52 | 1 | 6 | 1,008,946.07 | 7200.08 | 2.86 | 1,005,725.70 | 3775.94 | 2.55 | |
| 18 | 52 | 5 | 1 | 963,079.44 | 7200.16 | 3.14 | 961,984.82 | 3730.12 | 3.03 | |
| 18 | 52 | 5 | 3 | 893,390.10 | 7200.09 | 4.02 | 890,047.28 | 3809.39 | 3.66 | |
| 18 | 52 | 5 | 6 | 888,691.77 | 7200.11 | 3.26 | 904,531.68 | 3874.60 | 4.95 | |
| 18 | 52 | 10 | 1 | 1,122,240.25 | 7200.13 | 17.89 | 1,025,798.93 | 4117.14 | 10.17 | |
| 18 | 52 | 10 | 3 | 2,215,538.52 | 7200.16 | 61.93 | 972,681.67 | 4177.44 | 13.29 | |
| 18 | 52 | 10 | 6 | 1,190,927.33 | 7200.24 | 29.07 | 1,058,480.10 | 4225.87 | 20.19 | |
| Avg. | 811,754.83 | 7200.38 | 4.51 | 771,225.25 | 3641.98 | 2.72 | ||||
| Combined Flexibility Strategies | |||||
|---|---|---|---|---|---|
| Scenario | A | B | Imp. B | C | Imp. C |
| Baseline | 652,050.95 | 643,661.96 | 1.29% | 618,130.11 | 5.20% |
| Scenario 1 | 863,877.44 | 780,245.11 | 9.68% | 714,351.75 | 17.31% |
| Scenario 2 | 706,398.23 | 679,195.71 | 3.85% | 616,452.97 | 12.73% |
| Scenario 3 | 922,421.46 | 839,765.11 | 8.96% | 771,237.90 | 16.39% |
| Indicators | Option A | Option B | Option C |
|---|---|---|---|
| Total cost | EUR 652,051 | EUR 643,662 | EUR 618,130 |
| Cost reduction | EUR 0 | EUR 8389 | EUR 33,921 |
| Savings % | 0% | 1.29% | 5.20% |
| Deployments | 140 | 2 | 48 |
| Average IN open/month | 0 | 1 | 2.22 |
| Extra hours | 0 | 0 | 0 |
| Indicators | Option A | Option B | Option C |
|---|---|---|---|
| Total cost | EUR 922,421 | EUR 839,765 | EUR 771,238 |
| Cost reduction | EUR 0 | EUR 82,656 | EUR 151,183 |
| Savings % | 0% | 8.96% | 16.39% |
| Deployments | 194 | 2 | 25 |
| Average IN open/month | 0 | 1 | 2.44 |
| Extra hours | 1412.87 | 406.25 | 493.10 |
Disclaimer/Publisher’s Note: The statements, opinions and data contained in all publications are solely those of the individual author(s) and contributor(s) and not of MDPI and/or the editor(s). MDPI and/or the editor(s) disclaim responsibility for any injury to people or property resulting from any ideas, methods, instructions or products referred to in the content. |
© 2025 by the authors. Licensee MDPI, Basel, Switzerland. This article is an open access article distributed under the terms and conditions of the Creative Commons Attribution (CC BY) license (https://creativecommons.org/licenses/by/4.0/).
Share and Cite
Gomes, R.; Marques, A.; Neves-Moreira, F.; Netto, C.A.; Silva, R.G.; Amorim, P. Enhancing Flexibility in Forest Biomass Procurement: A Matheuristic Approach for Resilient Bioenergy Supply Chains Under Resource Variability. Processes 2025, 13, 2074. https://doi.org/10.3390/pr13072074
Gomes R, Marques A, Neves-Moreira F, Netto CA, Silva RG, Amorim P. Enhancing Flexibility in Forest Biomass Procurement: A Matheuristic Approach for Resilient Bioenergy Supply Chains Under Resource Variability. Processes. 2025; 13(7):2074. https://doi.org/10.3390/pr13072074
Chicago/Turabian StyleGomes, Reinaldo, Alexandra Marques, Fábio Neves-Moreira, Carlos Amaral Netto, Ruxanda Godina Silva, and Pedro Amorim. 2025. "Enhancing Flexibility in Forest Biomass Procurement: A Matheuristic Approach for Resilient Bioenergy Supply Chains Under Resource Variability" Processes 13, no. 7: 2074. https://doi.org/10.3390/pr13072074
APA StyleGomes, R., Marques, A., Neves-Moreira, F., Netto, C. A., Silva, R. G., & Amorim, P. (2025). Enhancing Flexibility in Forest Biomass Procurement: A Matheuristic Approach for Resilient Bioenergy Supply Chains Under Resource Variability. Processes, 13(7), 2074. https://doi.org/10.3390/pr13072074


