1. Introduction
With the growing global energy demand, the need to use alternative energy sources to mitigate climate change and environmental impacts arises. In this context, nuclear energy represents a significant yet controversial source in the sustainability debate. Current technology, based on the fission of uranium and plutonium isotopes, presents several critical issues, such as the management of radioactive waste and the safety of nuclear plants.
Fusion technology can serve as a promising alternative in this scenario. By using light isotopes (deuterium and tritium) as fuel, nuclear fusion reduces the problem of producing highly radioactive waste; furthermore, it is inherently safer since accidents due to uncontrolled chain reactions are not possible.
One of the challenges in nuclear fusion involves the supply of tritium, which is subject to natural radioactive decay; therefore, ensuring its replenishment inside the reactor to guarantee efficiency will be essential. In the fusion fuel cycle, the technology based on the PbLi alloy for tritium generation appears promising. The Water-Cooled Lithium Lead Breeding Blanket concept (WCLL-BB), which is a candidate for the EU-DEMO (European Demonstration Power Plant), uses water as the coolant and the eutectic PbLi alloy (15.7 at. % Li) as the breeder and neutron multiplier.
The main functions of the WCLL-BB are to remove the heat generated in the plasma, generate tritium to sustain the fusion reactions, compensate for losses toward the environment and other systems, and shield the superconducting magnets [
1].
PbLi also plays a tritium carrier role: the system dedicated to circulating the alloy via the Breeding Blanket (BB) to the Tritium Extraction Unit (TEU) allows tritium to be extracted from PbLi and routed to the Tokamak Exhaust Processing (TEP) unit; this is known as the Tritium Extraction and Removal (TER) system. From this perspective, the international project EU-DEMO represents a crucial step in developing a fusion power plant operating with a closed fuel cycle. The project aims to verify technical feasibility and demonstrate the potential for commercially distributing the generated electrical energy.
2. Challenges in PbLi Management for Tritium Generation
From an engineering perspective, designing PbLi loops for tritium generation and supply introduces several technical challenges due to the alloy’s characteristics: corrosivity, opacity, a melting temperature of 235 °C, and electrical conductivity [
2]. However, the ‘materials science’ approach suggests that several uncertainties regarding the physiochemistry properties of this alloy and its application remain unresolved.
The evolution of tritium starting from PbLi has been studied recently under neutron irradiation. Based on the following reactions studied at the IVG1.M research reactor (Kurchatov, Kazakhstan):
Tazhibayeva I.L. et al. [
3] demonstrated that the most significant process affecting the tritium desorption from the PbLi eutectic alloy is its interaction with lithium atoms, as a result of which lithium tritide (LiT) is formed:
The authors also asserted that a small deviation in the lithium/lead ratio from the eutectic composition will lead to significant changes in the properties of the alloy regarding the tritium evolution, being its content between 15 at% to 17 at%. In light of this, the PbLi employed during the R&D activities has to be carefully evaluated.
Garcinuño B. et al. [
4] characterized several samples from three different suppliers using multiple techniques, such as inductively coupled plasma mass spectrometry, X-ray diffraction, and thermogravimetry. The authors found a lithium discrepancy from 3 at% to 18 at% and an impurity content up to 400 ppm, therefore suggesting, for the sake of reproducibility, the need for preliminary characterization of the physicochemistry properties of a complex matrix such as the Pb-Li-H system. Moreover, further deep investigations would be beneficial in order to perform the following:
Clarify, primarily, the solubility and the diffusivity coefficient of the H2 and its isotopes (Q = atom of H, 2H, or 3H) in the melted alloy.
Validate the Siverts’ law assumption for the system Pb-Li-Q, then match the experimental data.
Harmonize the several methods used for studying the interaction between the hydrogen and the melted alloy.
Investigate the compatibility with the structural materials that host the multiphase system Pb-Li-Q.
Match the theory of the nuclear processes with formal analysis and move to introduce new criteria for determining measurable quantities.
A solid physiochemistry theory of tritium release could follow the approach commonly used in chemical processes: it would start from balanced quantities for reactants, products, and energy absorption or release.
Under these hypotheses, reactions (1) and (2) should be rewritten considering the preliminary assumptions on the physical phase involving each species during the transmutation phenomena and treating finite quantities instead of nuclei (or atoms) as usual in the literature:
Taking into account reaction (1), having the best cross-section, and applying that to the chemical process mole balance, reactants and products will be correlated by the Avogadro constant (N
A) so, under the hypothesis that all nuclear transmutation will occur successfully or, in other words, the yield of the process reaches an efficiency (η) equal to 1 (0 ≤ η ≤ 1), reaction (1) should be rewritten as follows:
So, taking into account the rest mass of each species, the mass balance (in grams) would be
where the ratio E c
-2 correlates, by the Einstein equation, the reaction energy release and its mass defect (Δm). Due to the well-known difficulties (radioactivity, poor isotope abundance) in tritium management for R&D, the use of H
2 or
2H
2 for experimentation is quite consolidated. Thus, the technologies under investigation for hydrogen isotope extraction (H
2,
2H
2 3H
2) are mainly focused on the well-known processes based on Gas–Liquid Contactor systems (GLC, i.e., bubble, packed or spray columns) or exploiting hydrogen permeation phenomena by using dense metallic membranes (PAV, Permeation Against Vacuum).
In recent years, Tosti S. et al. [
5,
6] proposed a new concept, namely a Membrane Gas–Liquid Contactor, that combines the prerogatives of the Permeation Against Vacuum and Gas–Liquid Contactors technologies useful for the extraction of hydrogen and its isotopes from the melted PbLi alloy.
3. Technologies for Tritium Extraction in the Molten PbLi Alloy: An Overview
3.1. Gas–Liquid Contactor Systems
In the 2000s, Alpy N. et al. [
7] described their work in the Melodie loop, an experimental facility dedicated to the technological assessment of gas/liquid Pb–17Li contactors.
The authors proposed two solutions: an immersed and a non-immersed configuration, using hydrogen to simulate tritium. The dual investigation (in immersed and in a non-immersed configuration) carried out on the 800 mm high packed contactor at 673 K confirmed the suitability of the liquid flow division via packing for the mass transfer. The effect of the liquid load and the impact of the hydrogen pressure in the inlet Pb–17Li flow on the extraction efficiency was experimentally assessed, and according to the authors, the best results are achieved with a reduced liquid load on the packing: an efficiency of up to 30% was reached at 673 K for an inlet hydrogen pressure in Pb–17Li of 1000 Pa.
More recently, Kinjo M. et al. [
8] proposed the hydrogen recovery from the PbLi eutectic alloy employing a bubbling tower. To predict tritium recovery rates, mass-transfer coefficients are experimentally determined when Ar and Ar+H
2 gas bubbles are injected into PbLi through an I-shaped nozzle at temperature 573–773 K and H
2 partial pressure of 1 Pa–0.1 MPa. The authors fitted the results with an analytical equation based on diffusion and solution in PbLi and summarized their results as follows:
The first stage of the experimental desorption was well simulated by considering H diffusion as the rate-determining step at the PbLi boundary, later near the bubble surface. The latter stage, in the low hydrogen concentration region, was well simulated, taking into account the surface reaction at the bubble and PbLi interphase as the rate-determining step.
The value of the mass-transfer coefficient is nearly independent of temperature in the present conditions. However, a slight difference in the mass-transfer coefficient value was determined between absorption and desorption due to the difference in the surface reaction process.
The gas flow rate has a negligible effect on the mass-transfer efficiency.
Following their previous study [
8], Fukada S. et al. [
9] proposed the extraction of hydrogen from a PbLi using a counter-current Ar flowrate in a small-scale tower (57.2 mm diameter and 300 mm height) randomly packed with SS304 Raschig rings. Liquid PbLi was previously saturated with hydrogen at 5.06 kPa at the top of the tower.
Overall mass-transfer rates are experimentally determined as a function of PbLi and Ar flow rates at a constant temperature of 673 K, while overall mass-transfer capacity coefficients are determined as a function of space velocity of liquid or gas by fitting the experimental hydrogen concentration variations with a transfer equation for a randomly packed tower. The hydrogen recovery ratios between the top and bottom of the tower were nearly independent of the PbLi flow rate, showing values between 20% and 30%. Further, according to the authors, their work clarified the following understandings:
The overall hydrogen transfer rate increased with the increase in the PbLi flow rate or space velocity, and the relation between the two is linear in a wide double-logarithmic graph range.
The rate-determining step in the overall transfer process is H diffusion in the liquid PbLi film.
In 2022, Utili et al. [
10] designed and installed a facility called TRIEX-II at the ENEA Brasimone Research Centre dedicated to qualifying several technologies for simulating the tritium extraction from PbLi alloy at different hydrogen isotope concentrations, mass flow rates, and temperatures.
The GLC mock-up’s efficiency calculation was presented using two different methods. The first method can be applied to several technologies to be tested in TRIEX-II, based on the definition of efficiency, considering the partial pressure measured by permeable helical-shaped components (HPSs) immersed in PbLi.
The second one is based on the mass balance and relates the extraction efficiency to the concentrations measured by the quadrupole mass spectrometer.
In this way, it is possible to obtain a value that is independent of the Sieverts’ constant of hydrogen isotopes solubilized in the PbLi.
The authors asserted that both tests were conducted by solubilizing deuterium in the PbLi and using a mixture of helium plus hydrogen as stripping gas. The first test showed an efficiency of 26% for L/G = 4.4 lPbLiNl−1 He+H2, which was increased to 44% by reducing the L/G ratio to 1.4 lPbLiNl−1 He+H2.
3.2. Permeation Against Vacuum Systems
Due to their physiochemistry properties, the capability of transition and noble metals to absorb and trap a large amount of hydrogen isotopes is well known.
Even though the properties could lead to a huge tritium inventory in the metal, thus quickly becoming a radioactive source, the PAV technology is quite consolidated for studying the selective permeation of the hydrogen isotopes in several gas mixtures, thanks to the high permeability and, in some cases, an almost infinite selectivity.
It is the case, for example, of palladium and its alloys, which can trap a huge amount of H
2 in their lattice, even to hundreds of times their volume (close to 900), giving rise to hydride phases [
11,
12].
Recently, the PAV technology was taken into account for overcoming several open issues related to tritium extraction in liquid blankets, starting from their first application as hydrogen-sensitive sensors.
Ciampichetti et al. [
13] developed a sensor for measuring the concentration of hydrogen (and its isotopes) in liquid Pb–17Li using a permeable niobium capsule. The first experimental results carried out in the gas phase showed a permeating flow rate much lower than the predicted one, likely due to the formation of an oxide layer on the capsule surface or the formation of metal hydrides.
To solve this problem, before extending the operation of niobium capsule in the liquid metal phase, the authors suggested the following:
Testing the niobium capsule sensor in dynamic mode;
Deposit a thin platinum layer on the niobium surface to prevent oxidation and then increase the hydrogen adsorption kinetics on the capsule walls;
Screening a different material for the sensor.
A few years later, following their preliminary R&D activity, Ciampichetti et al. [
14] compared the use of two permeating capsules made with niobium and pure iron in contact with the liquid metal Pb–17Li.
The experimental results demonstrated that the Nb-sensor is not suitable for the foreseen application because the observed low permeating flow rates prevent operating the Nb-sensor in equilibrium mode, while in dynamic mode, the sensor proved to operate with poor reproducibility.
On the contrary, the Fe-sensor could not be operated in equilibrium mode due to the very long time needed to reach the hydrogen equilibrium pressure (several hours in the used experimental conditions). However, the authors asserted the problem could be solved by optimizing the sensor geometry, by the reduction in the ratio of ‘total sensor volume/permeation surface’ and the membrane wall thickness.
According to the authors, these promising assertions concerning the optimized solutions have been supported by simulations.
By operating the dynamic mode, the authors verified that it is possible to link the permeation fluxes to the test pressure at each temperature by means of a simple power equation so, once the steady state condition of the permeating flow rate (few seconds) in the dynamic mode is reached, the Fe-sensor could exhibit a fast response and the ability to follow rapid changes in the hydrogen concentration on the high-pressure side.
More recently, Sircar A. et al. [
15] proposed a capsule-shaped sensor made of an iron membrane coated with Pd from the inside (downstream side).
Despite their work being purely theoretical, the authors asserted the selection of proper material, its thickness and surface conditions, everything supported by numerical calculations for the optimization of the permeation flux, the quickness response and the fabricability.
The simulation has applied a physical model including the recombination of two hydrogen isotope atoms at the surface and atomic diffusion through the bulk.
Finally, to estimate the permeation flow rate, the authors emphasized the need to identify different surface conditions between the side walls. In the case in which the upstream and downstream sides of the sensor are oxidized, the permeation flow rate would be too low to measure. Conversely, calculations related to a sensor fabricated with a 125 µm thick iron foil, oxidized upstream and bare (i.e., unoxidized) downstream, would provide a sufficient flow rate to be measured by the available analytic techniques.
In 2017, Kumar S. et al. [
16] reviewed hydrogen storage materials, focusing on vanadium. The authors asserted that metallic vanadium provides high hydrogen solubility and diffusivity at nominal temperature and pressure conditions. Consequently, vanadium is under consideration for the cost-effective hydrogen permeation membrane to replace palladium.
The issues that arise with vanadium are poor reversibility and pulverization of the solid phase. The poor reversibility is due to the high thermal stability of the β (VH/V2H) phase, which eventually restricts the cyclic hydrogen storage capacity up to 2 wt% at room temperature. The pulverization is given by the large crystal misfit between the metal and metal hydride phases.
The hydrogen solubility, phase stability, hydrogenation–dehydrogenation kinetics, and pulverization are highly influenced by the typology of the alloying elements.
Therefore, worldwide efforts are ongoing to explore and optimize vanadium alloys, aiming to enhance the hydrogen solubility, destabilize the β phase, improve the hydrogenation–dehydrogenation kinetics, and finally prevent pulverization.
4. A Novel Concept for Hydrogen Isotope Extraction in Liquid Metals: The Membrane Gas–Liquid Contactor
A Membrane Gas–Liquid contactor combines the functionalities of the Permeation Against Vacuum and Gas–Liquid Contactor technologies by replacing the dense metal membranes of a typical PAV with porous ones.
By means of porous elements, this system realizes a non-wettable interface between the liquid metal enriched with H2 isotopes and a noble gas acting as a purge phase in which the mass transfer takes place driven by the difference in the H2 isotopes’ partial pressure between the phases, thus, theoretically enhancing the kinetics of the mass transfer.
In their first work, Tosti S. et al. [
5] described the preliminary design of the MGLC device and its experimental characterization at 613–643 K and 270 kPa.
The device is realized using a porous AISI 316 L stainless-steel membrane immersed in the PbLi molten alloy, where isotopes are first bubbled into the liquid metal and then extracted through the same membrane purging with a noble gas.
In such a device, the liquid metal penetrates the pores of the porous element, realizing a gas–liquid interface in which the hydrogen isotope mass transfer takes place. The porous element can be realized by sintering proper material such as pure metals, alloys, or ceramic compounds, therefore starting from a selected material particle size.
The membrane pore size can be selected according to the Washburn Equation (6), establishing the equilibrium between the forces resulting from the pressure and the surface tension acting over the liquid into the pores:
where
PL and
PG are the pressure (Pa) of liquid and gas phase on the lumen side, respectively,
γ is the surface tension of the liquid metal (N m
−1),
θ is the contact angle of the intrusion liquid over the porous material, and
D is the pore diameter (m). The value of 140° is assumed for the contact angle between liquid metals over solids, while at 673 K, the surface tension of the eutectic Pb-Li alloy is 0.446 N m
−1 [
17].
So, the PbLi behaves as a “non-wetting liquid”, not penetrating the inert gas phase where leaks of liquid metal are not allowed. In such a way, a direct gas–liquid interface is realized inside the membrane pores where the transport of hydrogen isotopes takes place with mass transfer resistance lower than in the PAV.
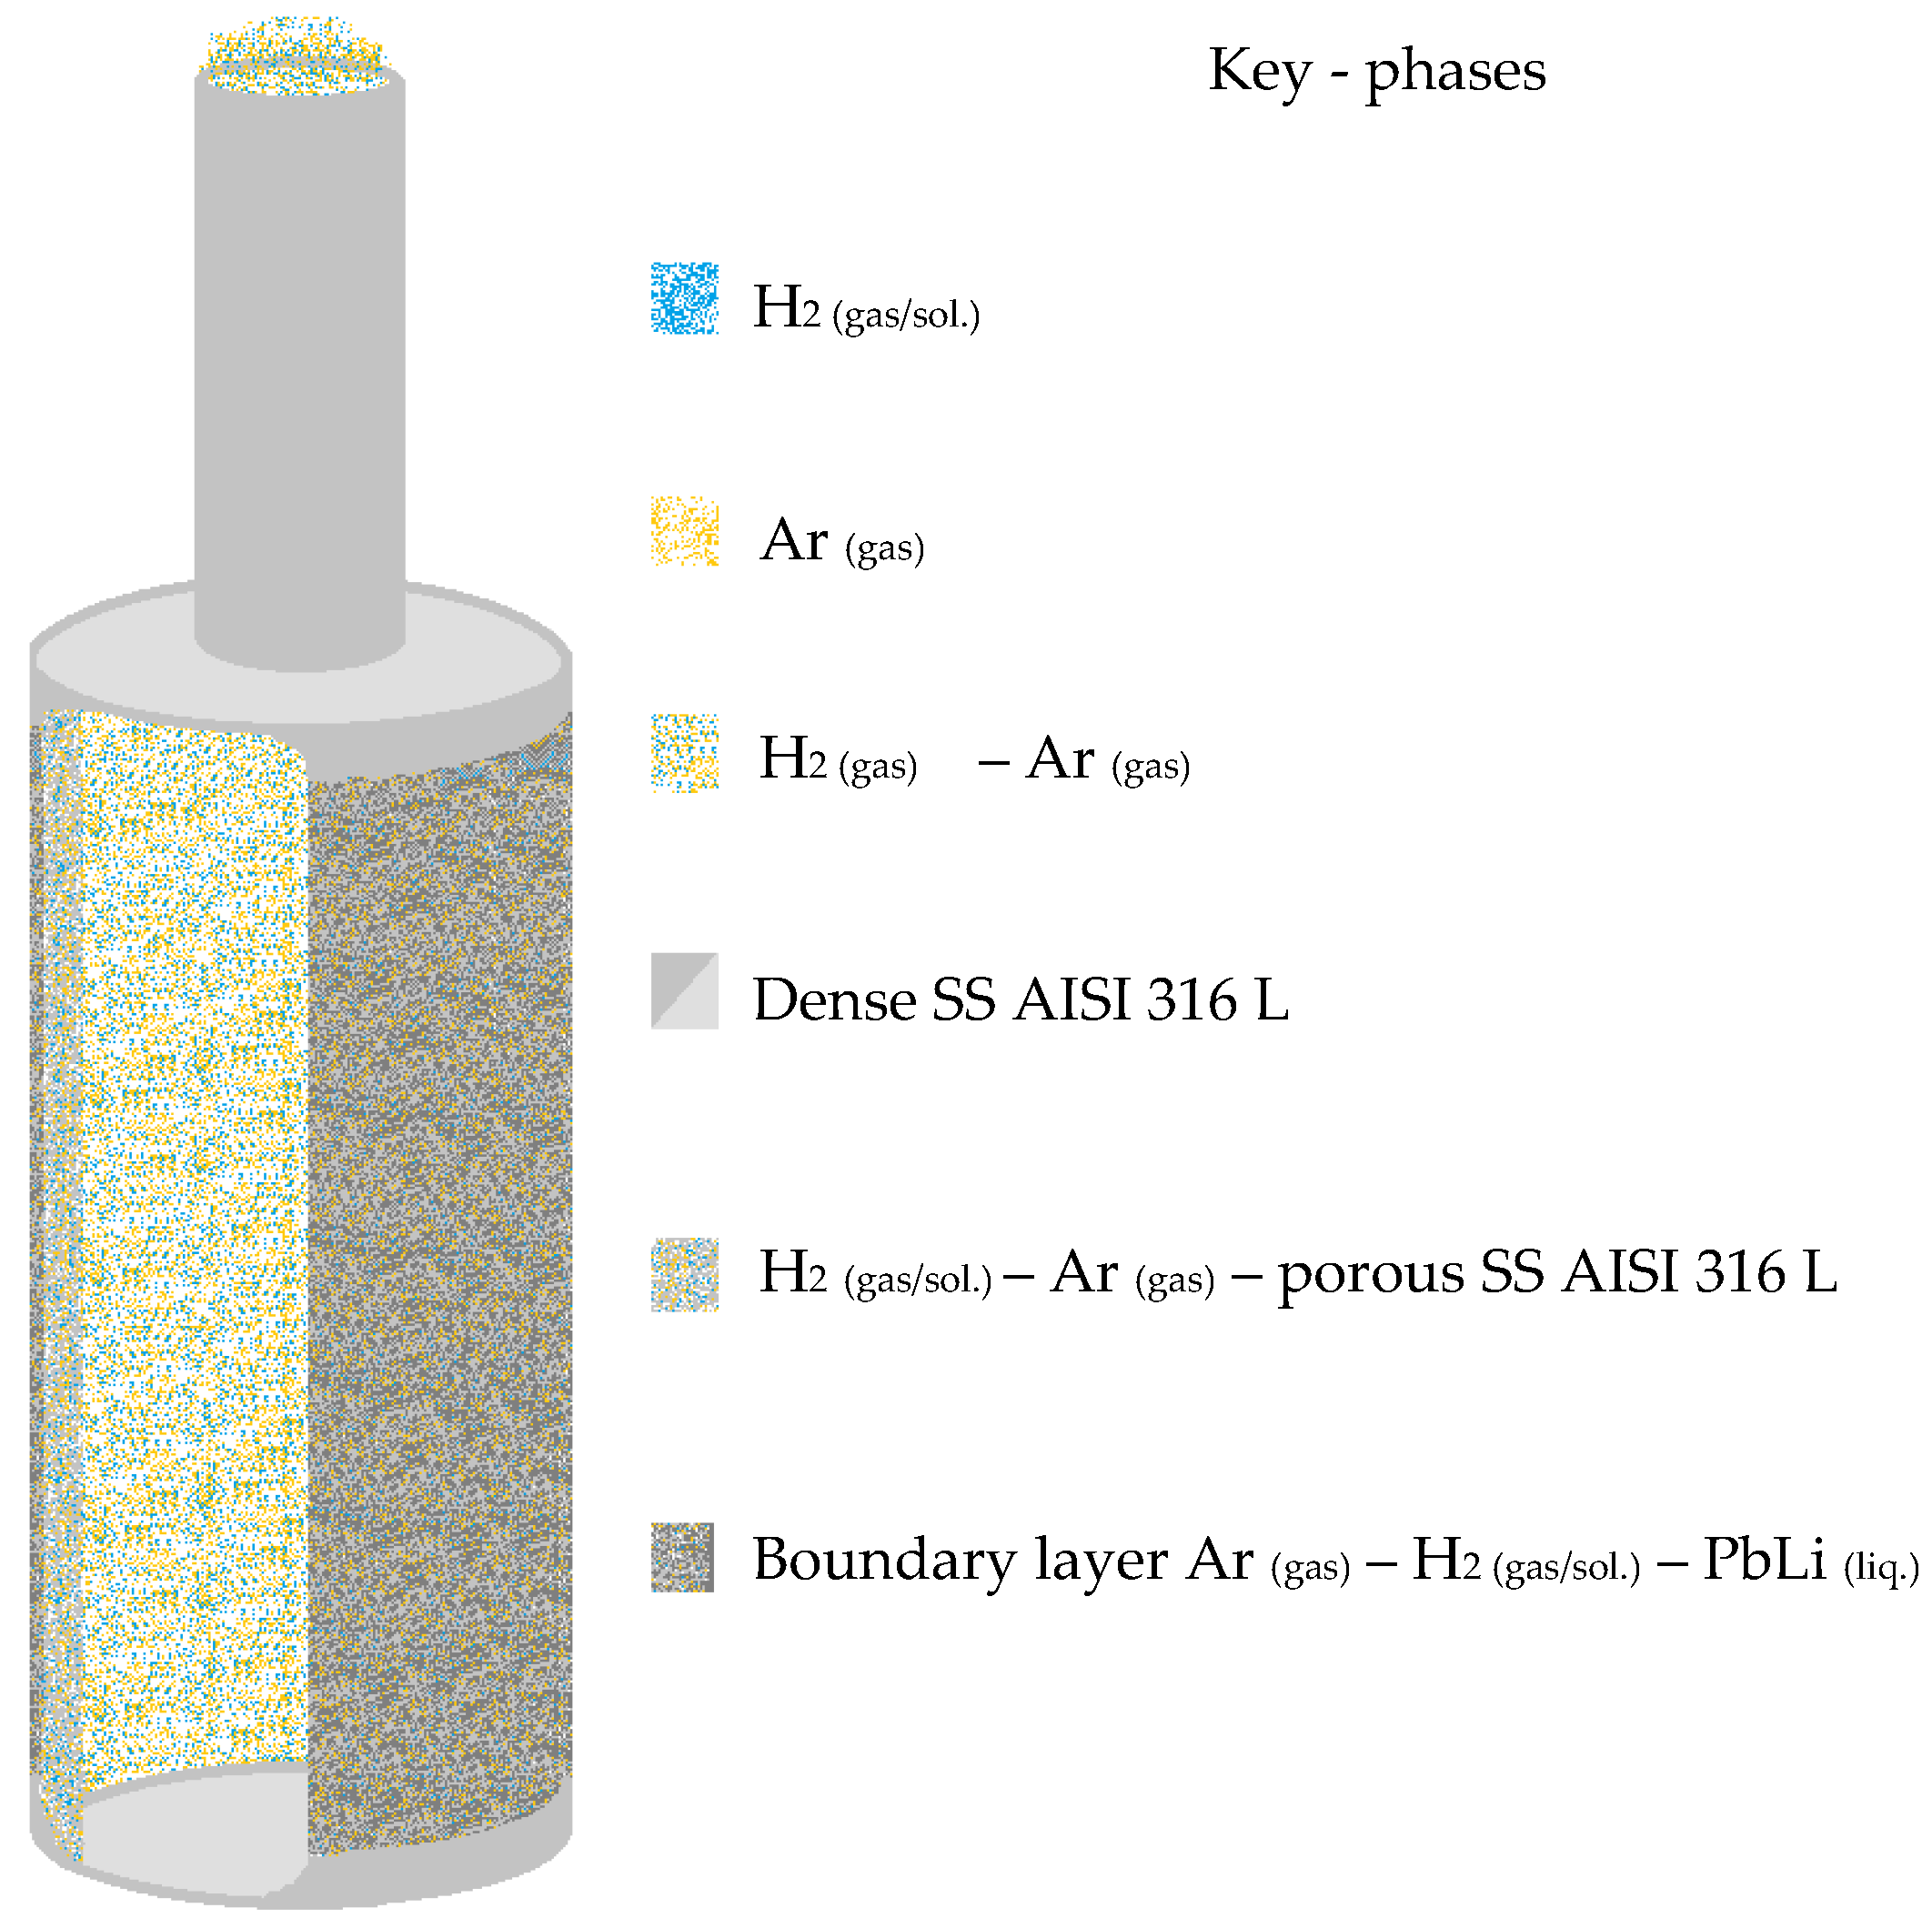
During the preliminary tests, a single porous membrane having an average pore size of 0.1 μm was used for the operations into the liquid metal: the original dimension included inner/outer diameters 8.6/12.9 mm, respectively, and a total length of 42 mm.
The porous element (see
Figure 1—sketch not in scale) was arc-welded to a dense stainless steel tube of similar dimensions (ID = 8 and OD = 10 mm) and used once for the gas bubbling into the melted phase and then, after purging the membrane lumen with inert gas, for sampling the hydrogen, later detected via gas chromatography.
Figure 1.
Front section sketch of a porous stainless steel membrane applied in the MGLC concept.
Figure 1.
Front section sketch of a porous stainless steel membrane applied in the MGLC concept.
Once hydrogen was uploaded, fixing a delay time longer than 1h before the gas sampling at 613–643 K, all measurements shown a very reproducible hydrogen recovery rate around 0.80 mol m−2 ± 1.5%, thus demonstrating a very stable behavior of the system along the experimental campaign and negligible change in transport parameters for these conditions.
Thus, the commercial 316 L stainless steel porous membrane achieved steady-state conditions in less than 1 h and shown a high permeation flow rate, estimated at around 10−4 mol m−2 s−1. Particularly, experimental results outlined no degradation of the MGLC and very reproducible values of hydrogen flow rate during the several days of the experimental campaign.
The overall mass transfer coefficient for MGLC was evaluated to be larger than other PAV membranes (α-Fe, V, or Ni) by a factor from 1.3 to 3.0 when the temperature theoretically ranged from 573 to 1073 K.
Based on the data collected during the experimental campaign at 643 K, the next study carried out by Tosti S. et al. [
6] outlined that hydrogen extraction consists of diverse steps, although it is mainly controlled by the recombination of hydrogen atoms and their desorption from the gas–liquid interface. The overall permeation exhibited mass transfer resistance values in the range 10
−7–10
−6 m
2 s Pa mol
−1, while hydrogen transport through the gas phase inside the MGLC pores occurred with mass transfer resistances significantly smaller (around 10
−4 m
2 s Pa mol
−1).
This analysis shows good agreement of the permeation model compared with the mass transport data available from literature: in particular, the experimental value of the hydrogen overall mass transfer coefficient, 7.249 × 10
−8 mol m
−2 s
−1 Pa
−1, lies between the curves calculated with the Sieverts’ constant proposed by Aiello A. et al. [
18] and Schumacher R. et al. [
19] and it is much higher than that proposed by Reiter F. et al. [
20].
This analysis has neglected the hydrogen diffusion into the molten metal, i.e., from the liquid bulk to the boundary layer of the PbLi in contact with the membrane, while just the following steps of hydrogen permeation have been considered:
The hydrogen atoms recombine into molecules over the liquid metal surface and release into the gas phase of the membrane pores.
The hydrogen diffuses into the pores of the membrane up to reach the membrane lumen.
The mass transfer resistance of the first step (hydrogen recombination and desorption) is larger than the second one (hydrogen diffusion into liquid PbLi) by at least 2–3 orders of magnitude.
Particularly, hydrogen diffusion through the gas phase inside the membrane pores takes place via a mixed regime Poiseuille–Knudsen, and it is characterized by values of gas permeance (permeability/thickness) estimated around 10−5 mol m−2 s−1 Pa−1.
Thus, in principle, a noticeable mass resistance acts on the atoms diffusion phenomenon through a dense metal wall (α-Fe, Nb, V) of a Permeator Against Vacuum (PAV), while the gas diffusion in the purge phase becomes relevant in a porous media.
Considering the overall mass transfer coefficient estimated in their previous studies, Tosti et al. [
21] recently compared the Tritium Extraction and Removal (TER) systems based on MGLC, PAV, and GLC (Packed Columns) for the water-cooled lithium–lead (WCLL) blanket of the European DEMO Tokamak Reactor. Their work designs the preliminary DEMO WCLL tritium extraction system using MGLC membranes in comparison with the most promising technologies, namely GLC and vanadium-based or niobium-based PAV, currently under development [
1]. According to the authors, the MGLC unit has a permeation area that is smaller by a factor of 2 and 9 than that of the Nb-PAV (U-shaped tube configuration), as assessed for the surface and diffusion-limited regimes, respectively. Furthermore, the MGLC unit has a permeation area 30 times smaller than that of the V-PAV (plate configuration). When considering the overall sizes, the MGLC extraction unit shows the smallest volume, significantly smaller than that of the Nb-PAV, 2.8 times smaller than that of the GLC, and 1.4 times smaller than that of the V-PAV.
5. Experimental Section
5.1. Apparatus’ Layout
For a deep confirmation of the parameters found during the previous tests, an upgrade of the MGLC concept is proposed in the present work.
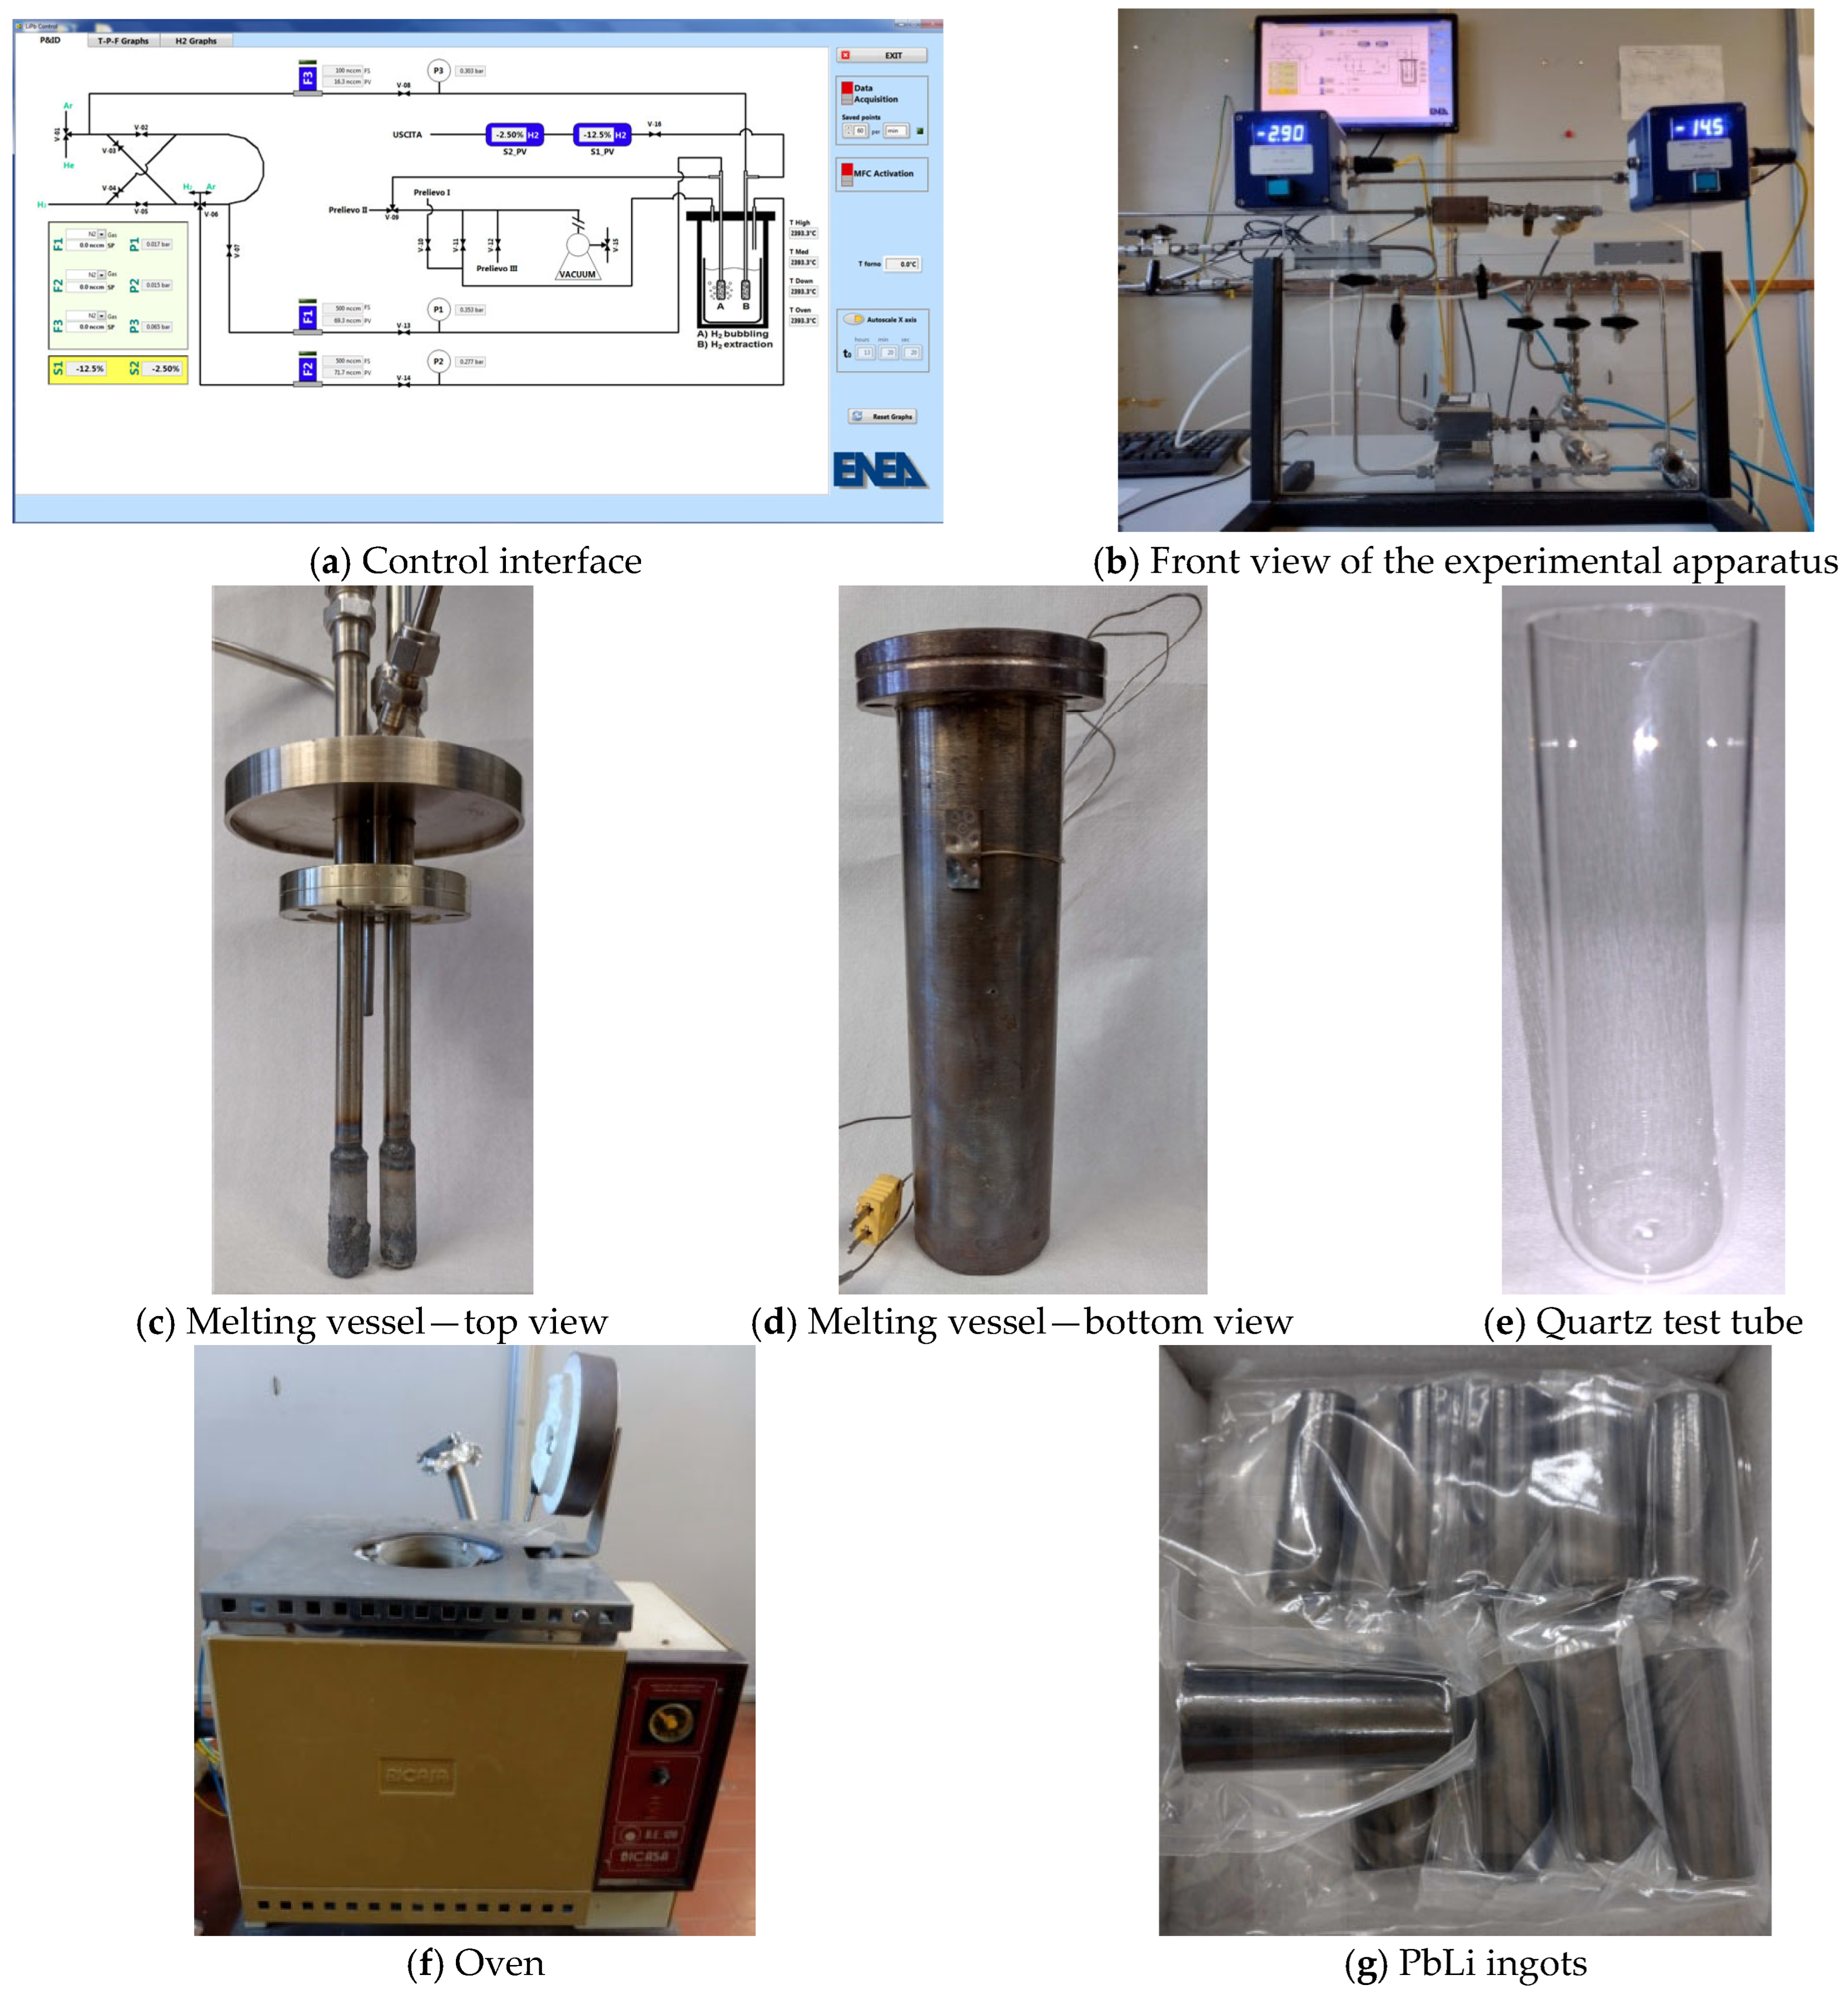
Figure 2 shows the P&ID of the experimental facility hosted in ENEA Frascati’s laboratory, namely ‘Pb-Li PLANT’.
Figure 2.
Instrumentation and piping in the Pb-Li PLANT.
Figure 2.
Instrumentation and piping in the Pb-Li PLANT.
In the experimental apparatus, the gases (Ar, H2) are fed via three mass flow controllers MKS (F1, F2, F3—mod. MKS GE50A), having an accuracy of 1% of full scale.
Three pressure gauges (mod. MKS 1179B) have been installed for monitoring, respectively, the pressure of hydrogen into the membrane A lumen (P1), then into the gas phase upon the melted alloy inside the stainless-steel vessel (P2), and of Argon into the membrane B lumen (P3). These instruments have a full scale of 10,000 mbar and an accuracy of 1% of full scale.
The hydrogen mass transfer from the liquid alloy and the gas phase into the lumen of membrane B is revealed via two hydrogen detectors (SH2—mod. BlueSens BCP-H2 thermal conductivity detector) having an accuracy < 0.2% of full scale ± 3% reading.
Asco Filtri S.p.A. (a Mott Corp. Company-Farmington, CT, USA) provided the ANSI 316 L stainless steel porous membranes useful for the experiments. This kind of membrane presents an average pore size of 0.1 μm: original dimensions of the porous membranes include inner/outer diameters 8.6/12.9 mm, respectively, and a total length of 42 mm. Each membrane was arc-welded to a dense stainless steel tube of similar dimensions (ID = 8 and OD = 10 mm) and immersed in the liquid PbLi, which was molten in a quartz test tube of ID = 35.8 mm. The test tube is sealed in a stainless steel vessel capable of operating under pressure. Finally, the experimental device was introduced into an oven to control the working temperature at 640 K (see
Figure 3a–g).
The PbLi alloy with a Li nominal content of 0.615 ± 0.016 wt.% (15.7 at.% Li) has been provided in the form of cylindrical ingots having a diameter equal to 35 mm (Øtolerance +0.1/−0.5 mm) and length equal to 87 mm (±1 mm) by CAMEX spol. s r.o. (Měšice, Czech Republic).
Before starting the experimentation, a leak test at RT (TM = 301.89 K) lasting around 23 h was conducted, moving the Ar gas phase from ambient pressure to 400 kPa and then monitoring its drop. At 301.89 K, no significant leakages were found, leading to the estimation of the losses in 2.00 × 10⁻⁸ mol s−1.
Figure 3.
(a–g) View of the experimental setup.
Figure 3.
(a–g) View of the experimental setup.
The testing procedure can be summarized in the following steps:
A PbLi ingot of mass equal to 879.5 g (5.00 moles) is allocated in the quartz test tube and sealed in the stainless-steel vessel heated by the oven.
Before starting the operation, the gas phase over the PbLi and inside the membranes A and B lumen has to be purged with Ar at 100 kPa.
Once the PbLi is liquefied and heated at 650–660 K, the porous membranes A and B are immersed in the liquid metal at 0.045 m from the bottom of the quartz test tube.
Finally, hydrogen at 100 kPa is used for purging the gas phases over the PbLi and into the membrane lumen A; afterward, a continuous Ar flow rate ranging from 25 and 50 cm3 min−1 at 100 kPa can flow through the membrane lumen B using F3.
By operating the feed line connected to membrane A, hydrogen is bubbled into the liquid alloy till its pressure in the gas phase over the liquid metal reaches a conservative value ranging from 300 to 400 kPa. At this point, the hydrogen mass transfer from the liquid metal to the Ar gas phase purging the lumen of membrane B may be detected continuously, at ambient pressure, by the hydrogen sensors (S1H2, S2H2).
5.2. Result and Discussion
The present section describes the basic operation of the MGLC in the experimental campaign that lasted 4 days.
Figure 4a shows the hydrogen flow rate (F1—dark yellow data) fed into the melted alloy by bubbling via membrane A (see
Figure 4).
In the first operational phase, the pressure of the gas phase over the liquid metal has been kept at around 150 kPa by discontinuously feeding the hydrogen: in particular, 19 pulses of 50 sccm (sccm: standard cubic centimeter per minute, 1sccm = 7.42 × 10
−7 mol s
−1) (3.71 × 10
−5 mol s
−1) of hydrogen were necessary as outlined in
Figure 4a (F1—dark yellow data). Further,
Figure 4b shows the hydrogen pressure inside the lumen of membrane A (P1—dark yellow data): its quick decrease, in some cases lowering close to 100 kPa, is likely due to the hydrogen uploading in the melted alloy.
Along almost 4.5 h of experimentation at 650–660 K (T
M—pink data), the Ar flow rate inside the membrane B was kept at 50 sccm (3.71 × 10
−5 mol s
−1) and 100 kPa as shown by the red line trends in all the charts of
Figure 4.
Afterward, in the second operation phase lasted 50 min, a hydrogen bubbling flow rate equal to 18 sccm was fed in the membrane lumen (F1—dark yellow data) by reaching the constant pressure in the lumen-side of 320 kPa (P1—dark yellow data).
During the first and second operation phases, no hydrogen was detected, as outlined by
Figure 4c, which shows the baseline signal of the hydrogen detectors close to zero (S1H
2, S2H
2—violet and green data). At the end of the first day, the experimental apparatus was switched off, cooling the alloy at room temperature under an H
2 atmosphere and keeping the Ar flow rate constant in membrane B (at ambient pressure). At a pressure of around 150 kPa in the melting vessel, the solid alloy surrounding both porous membranes ensured their gas tightness until the operations restarted the next day.
Figure 4.
(a–c) Trends of gas flow rates, pressures, and temperature during the MGLC’s first-day operation.
Figure 4.
(a–c) Trends of gas flow rates, pressures, and temperature during the MGLC’s first-day operation.
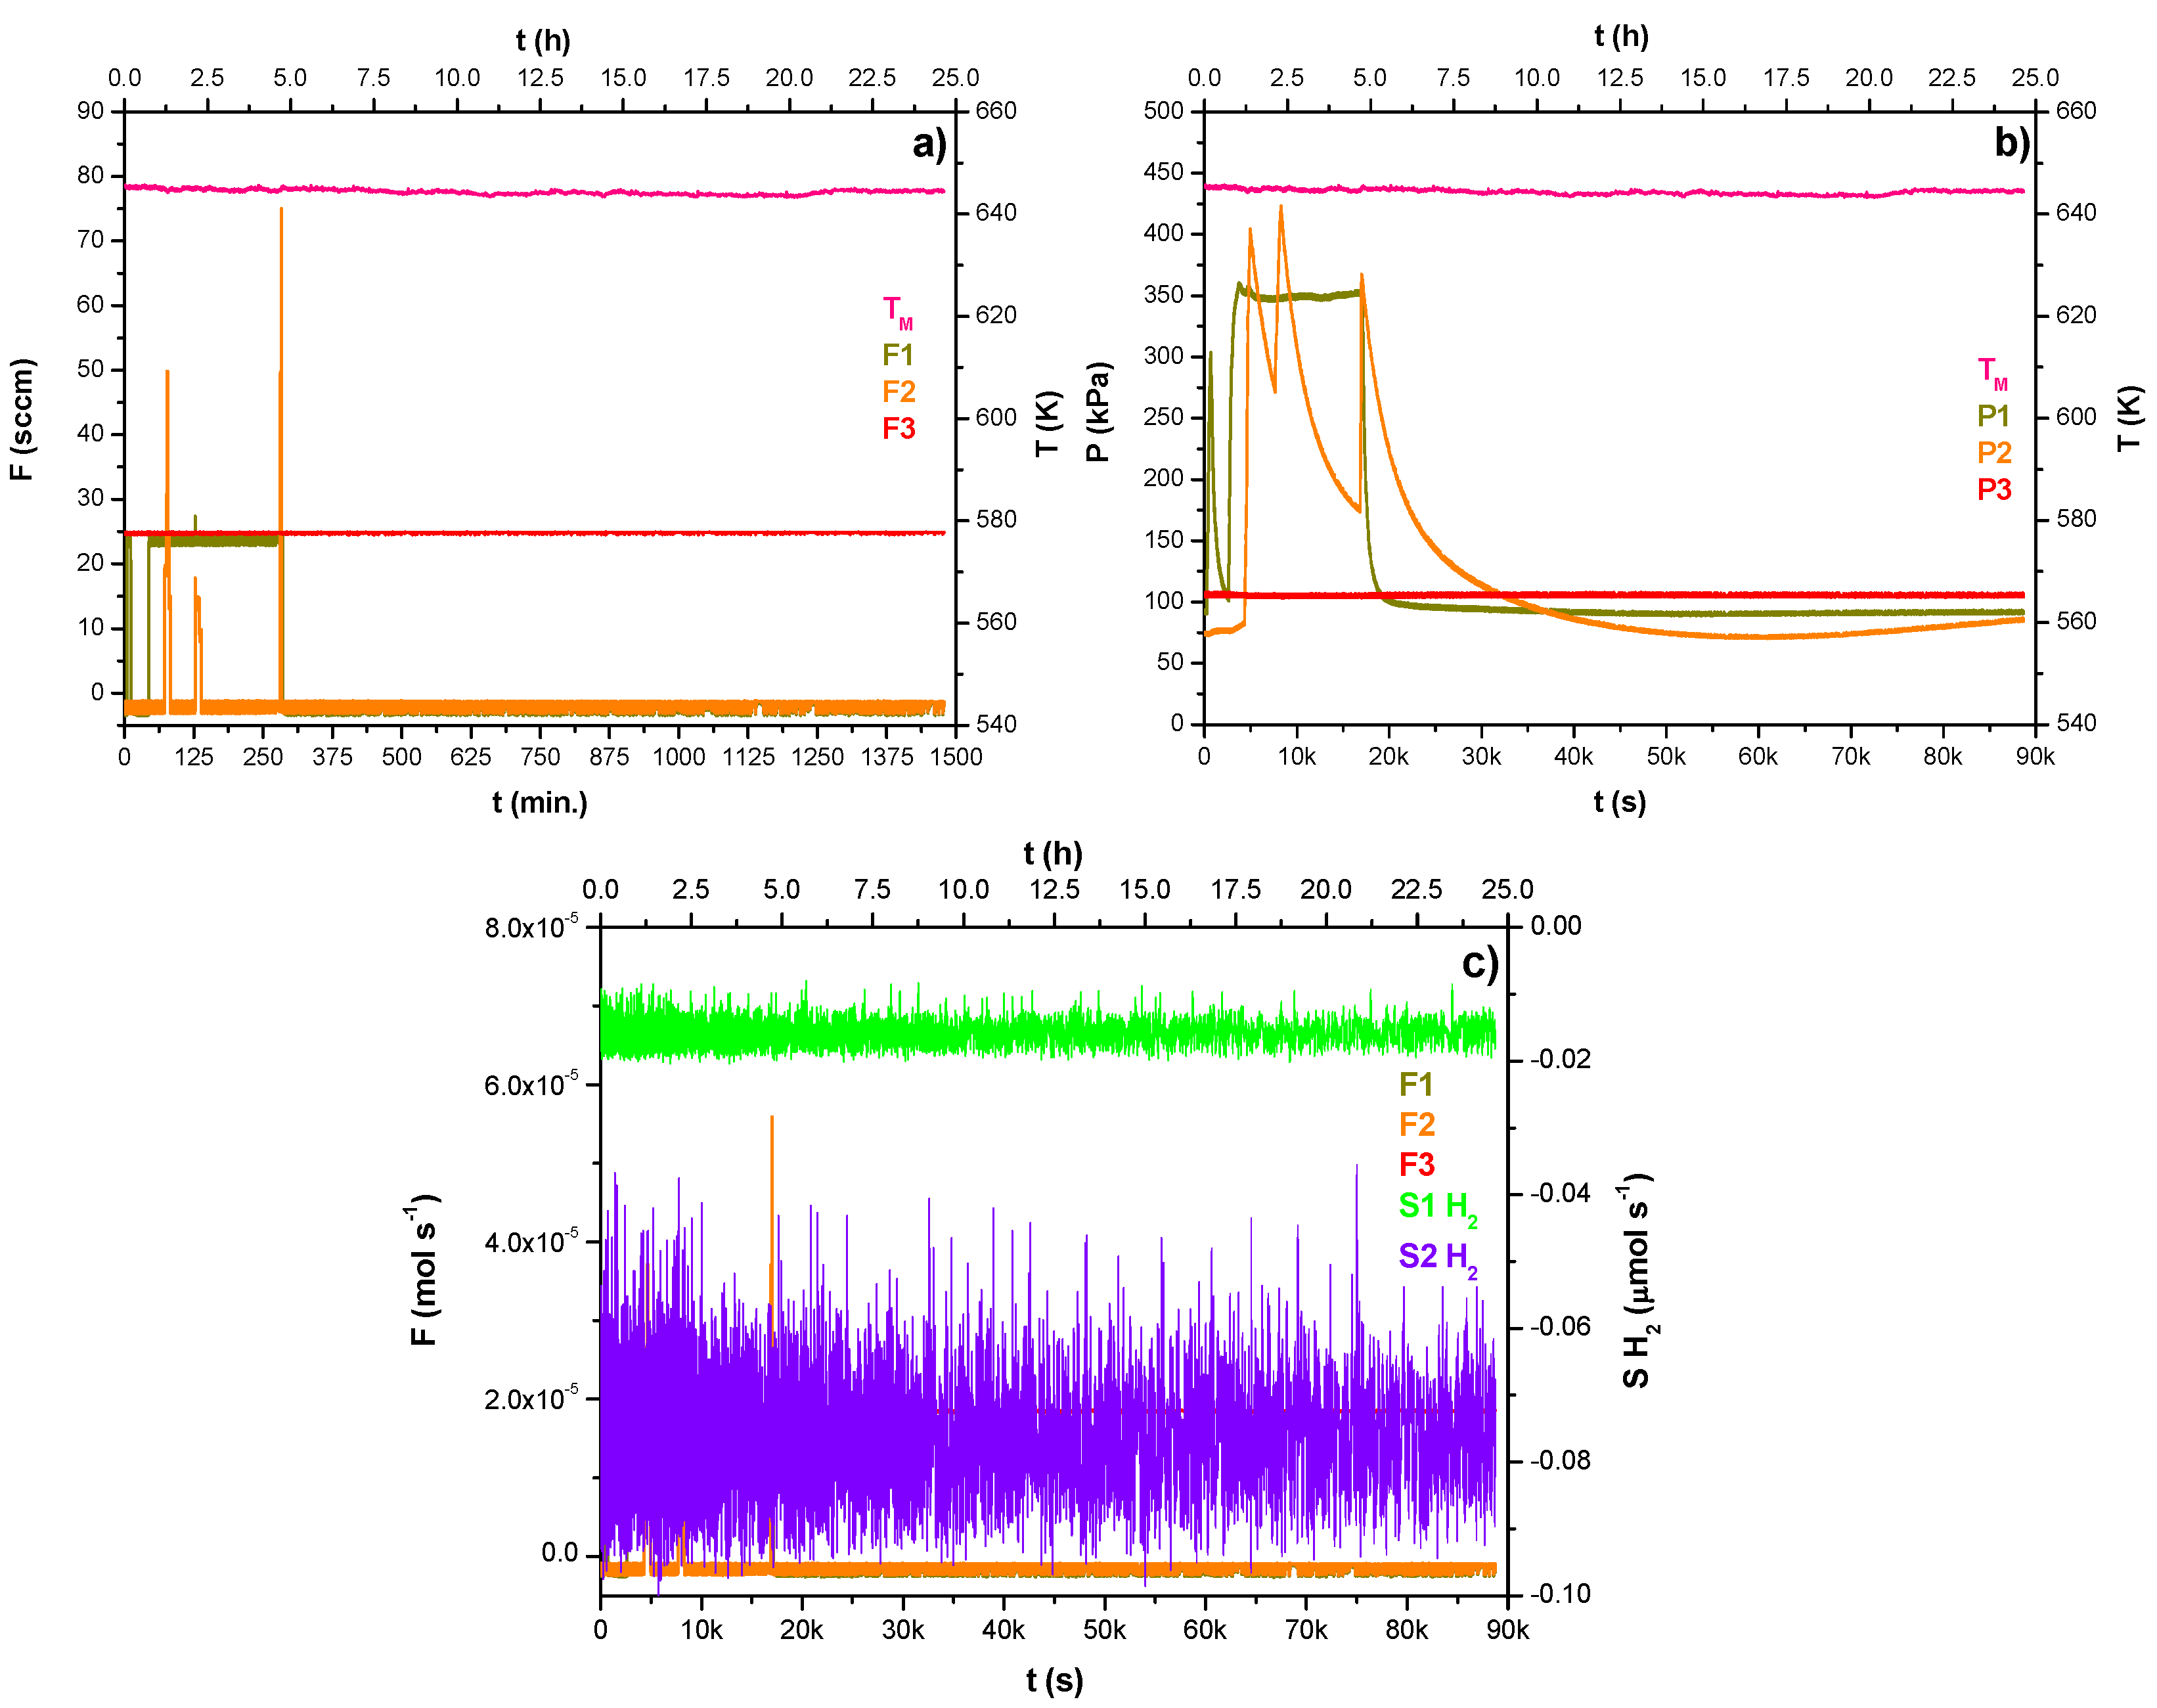
Figure 5a–f summarizes the operations conducted during the second day of the experimentation, which is divided into two phases.
The first one is described by the data shown in
Figure 5a–c recorded following the melting operation. The experimentation started by setting the Ar purge flow rate at 25 sccm and 100 kPa in the lumen-side of membrane B (F3—red data) and feeding the hydrogen bubbling at 18 sccm as outlined in
Figure 5a (F1—dark yellow data). This phase lasted three hours and quickly led to the equilibrium of the hydrogen pressure in the lumen-side A close to 315 kPa as outlined in
Figure 5b (P1—dark yellow data). One hour later, using feed line F2 (
Figure 5a—orange data), the pressure of the gas phase over the liquid metal was increased at 315 kPa by feeding 50 sccm of hydrogen (
Figure 5b—orange data). The trend shown in
Figure 5b outlines a very quick decrease in the gas phase pressure (P2—orange data), likely due to the sorption phenomenon. In any case, no hydrogen was detected by analyzing the detectors’ baseline signal outlined in
Figure 5c (S1H
2, S2H
2—violet and green data).
Figure 5d describes the beginning of the second experimental phase, which started by increasing both the hydrogen feed flow rates in the gas phase and into the melted alloy (F1, F2—dark yellow and orange data). The pressure trends in the lumen-side A and the gas phase outlined in
Figure 5e indicate the equilibrium between the values approximately at 400 kPa: after ten minutes, the interruption of the feed flow rates led to a quick pressure decrease (P1, P2—dark yellow and orange data).
No hydrogen was detected here as well, by analyzing
Figure 5f (S1H
2, S2H
2—violet and green data). Then, the test concluded, leaving the alloy heated and maintaining the Ar purge phase on the lumen side of membrane B throughout the night.
Figure 5.
(a–f) Trends of gas flow rates, pressures, and temperature during the MGLC second-day operation.
Figure 5.
(a–f) Trends of gas flow rates, pressures, and temperature during the MGLC second-day operation.
Figure 6a–c summarize the third day of experimentation, where the metal is already melted from the previous activities. During the test, the liquid metal was initially enriched through hydrogen bubbling for five minutes at 25 sccm and then for one minute at 20 sccm. Subsequently, a continuous flow rate of 25 sccm was fed for hydrogen enrichment, as outlined in
Figure 6a (F1—dark yellow data). This phase lasted 4 h, leading to an equilibrium pressure in the membrane lumen A of approximately 350 kPa (
Figure 6b, P2—dark yellow data). During this phase, hydrogen was also introduced via the feed line F2 into the gas phase three times pulsing: first at 50, then at 20, and finally at 75 sccm, leading the pressure between 370 and 420 kPa, as shown in
Figure 6b (P2—orange data).
Even in this case, no hydrogen was detected, as outlined in
Figure 6c (S1H
2, S2H
2—violet and green data). Consequently, as performed the previous day, the test concluded, leaving the alloy heated while flowing the Ar purge phase throughout the night in the lumen of membrane B.
Figure 6.
(a–c) Trends of gas flow rates, pressures, and temperature during the MGLC third-day operation.
Figure 6.
(a–c) Trends of gas flow rates, pressures, and temperature during the MGLC third-day operation.
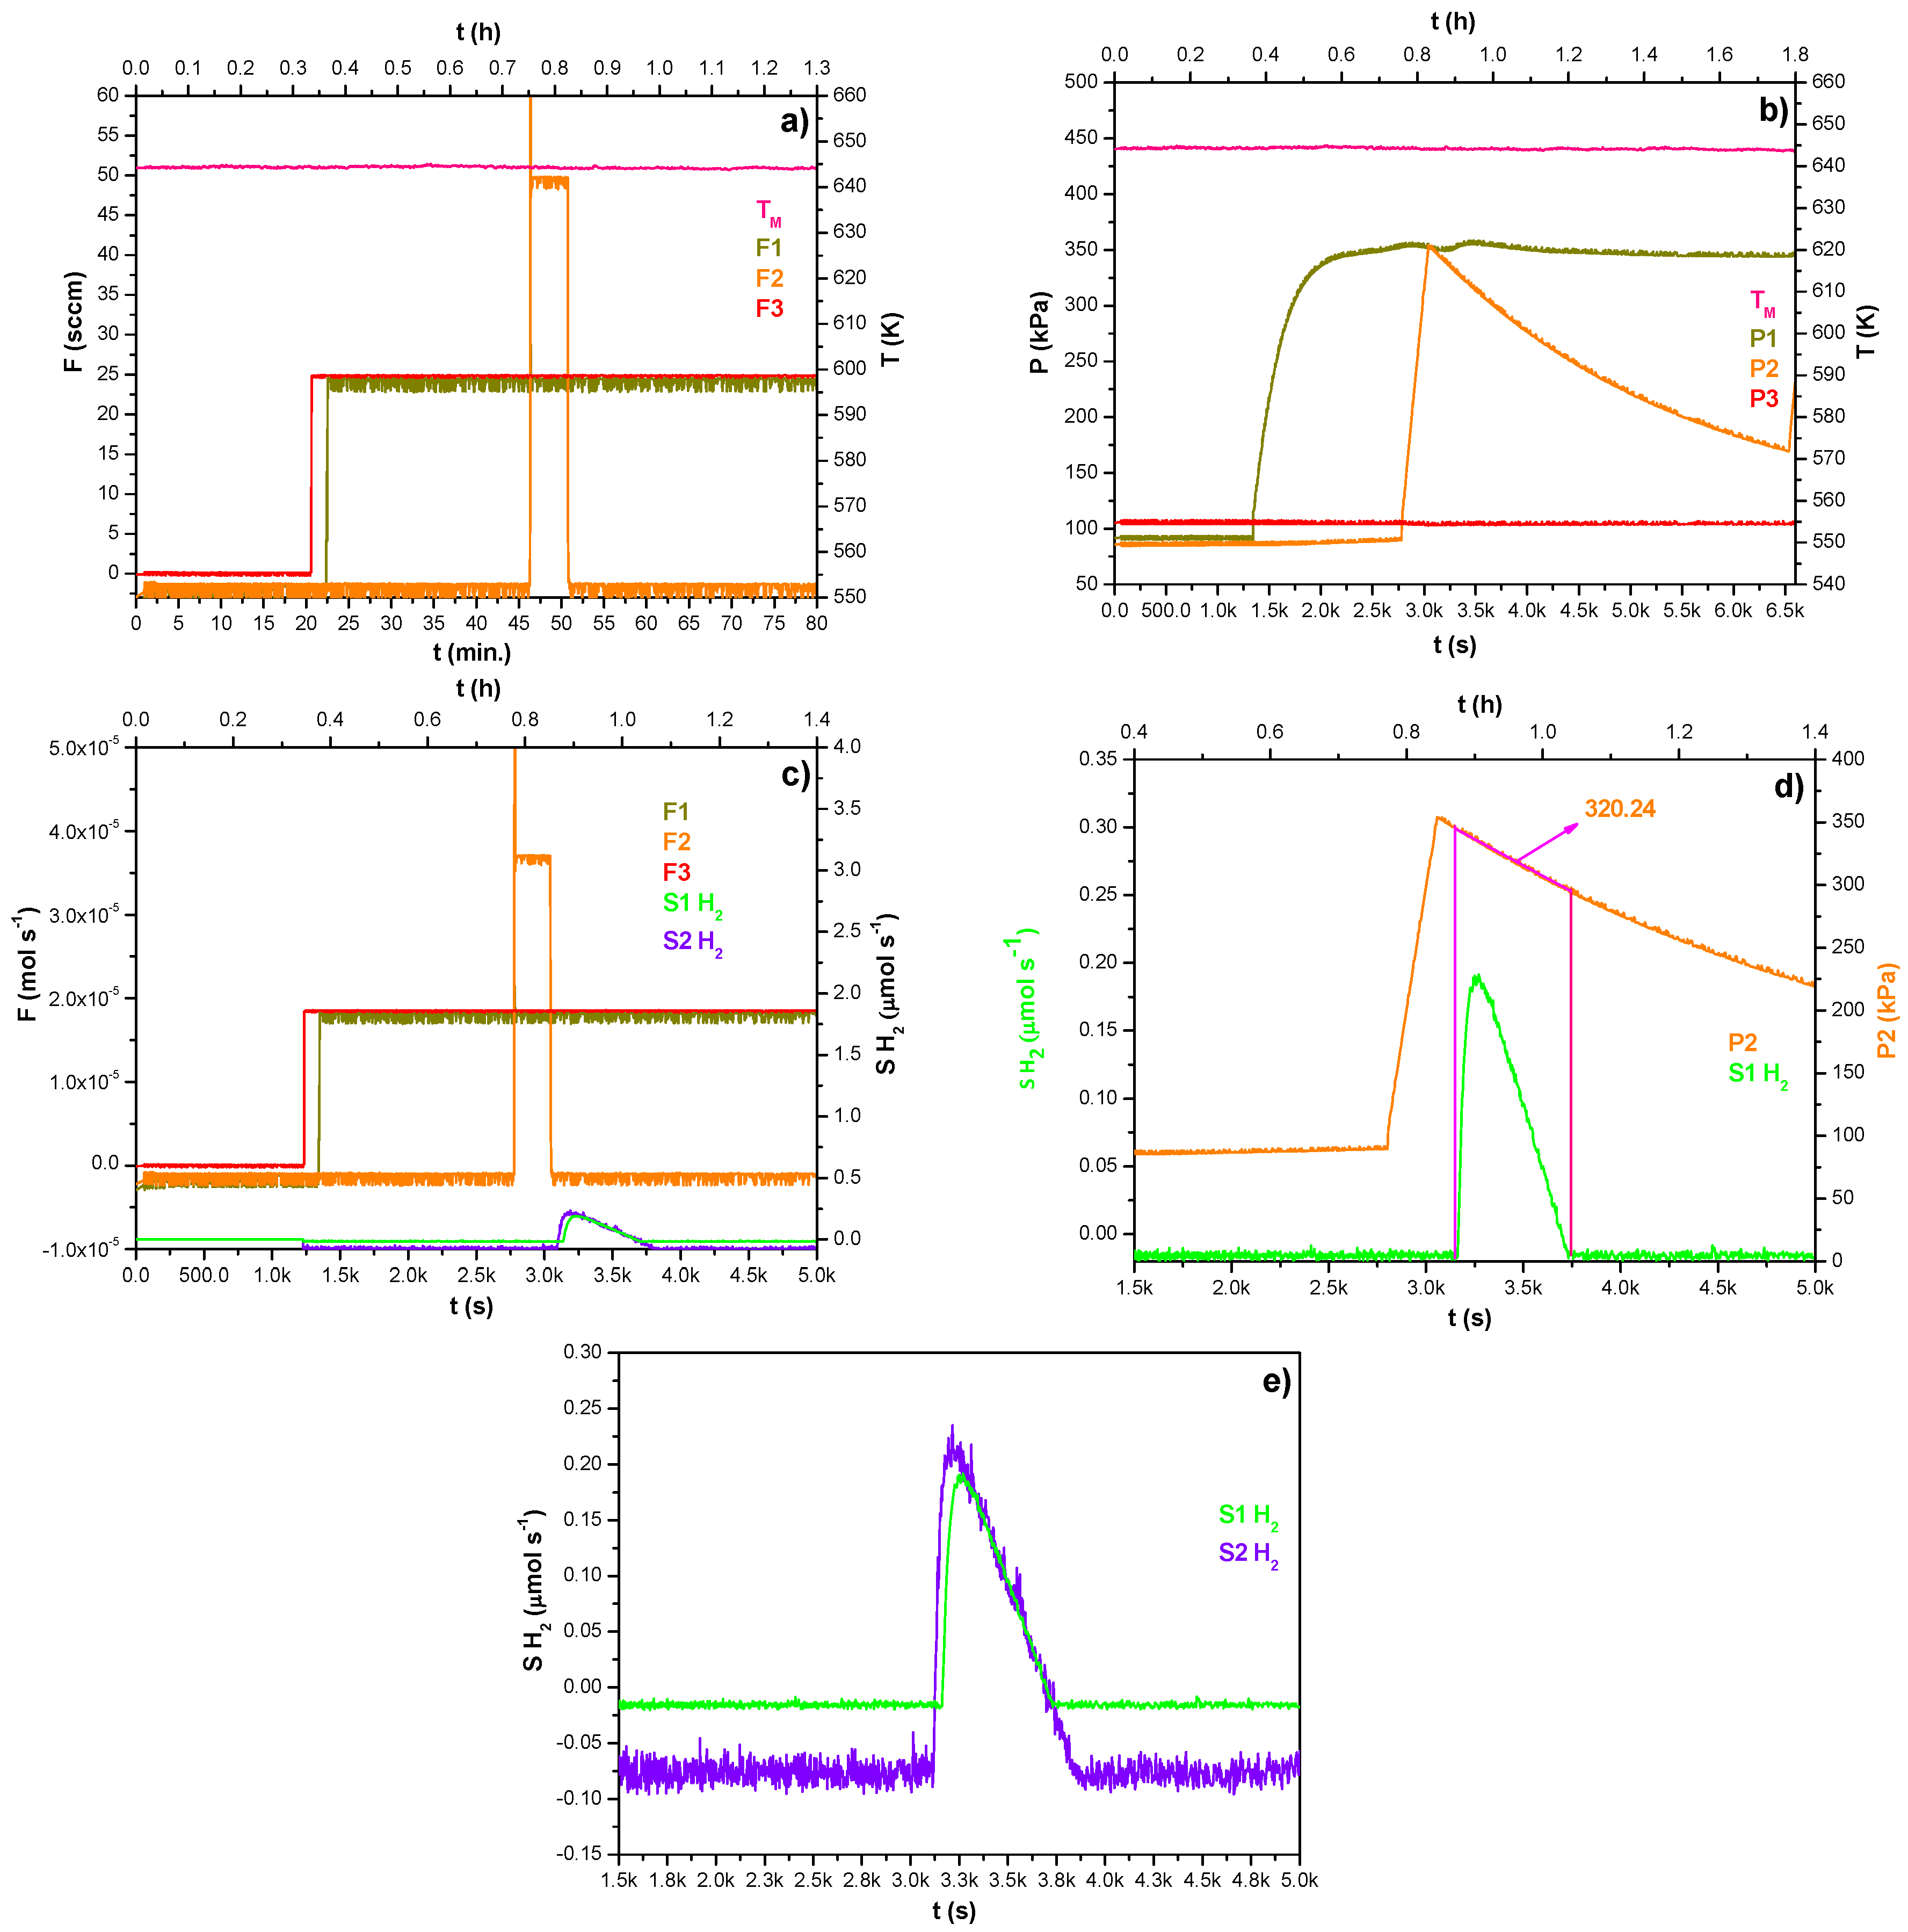
Figure 7a–e summarizes the operations concluded during the fourth day of the experimentation. It is worth noting that in the first fifteen minutes of the experimentation, the Ar purge flow rate was zero just for replacing the gas tank that fed the facility, so once restored (F3—red data), a continuous hydrogen bubbling flow rate was fed at 25 sccm as outlined in
Figure 7a (F1—dark yellow data). This phase lasted approximately twenty-five minutes. Afterward, using the feed line F2, the hydrogen was fed in the gas phase at 50 sccm till it reached the same feed pressure by bubbling.
Figure 7b shows the trend of the pressure both in the lumen-side of membrane A (P1—dark yellow data) and in the gas phase over the melted alloy (P2—orange data): these operations allowed the desorption of hydrogen and its mass transfer across the porous membrane B where the Ar purge phase lead the mixture to the detection system as shown in
Figure 7c (S1H
2, S2H
2—violet and green data). The phenomenon depicted is well shown in
Figure 7d, in which the magenta box identifies the boundary condition, including the average pressure value of the gas phase (320.24 kPa).
Finally,
Figure 7e shows the hydrogen signals’ magnification recorded by the detectors having different degrees of accuracy.
Figure 7.
(a–e) Trends of gas flow rates, pressures, and temperature during the MGLC fourth-day operation.
Figure 7.
(a–e) Trends of gas flow rates, pressures, and temperature during the MGLC fourth-day operation.
5.3. Data Analysis
The hydrogen mass balance of the experimental system was used to assess the hydrogen mass transfer coefficient through the MGLC. The hydrogen mass entering the system was calculated by the integral of the F1 and F2 flow rates along all the testing time, while the hydrogen mass leaving the system was given by the integral of the hydrogen flow rate detected by the sensors (see
Table 1). The difference between the hydrogen masses entering and leaving the system accounts for the hydrogen uploaded into the PbLi.
5.4. Assessment of the MGLC Mass Transfer Performances
The mathematics for characterizing the MGLC in terms of mass transfer performance is proposed, taking into account the hydrogen recovered:
where
, moles of hydrogen detected;
t1 − t0, time interval of hydrogen detection (s);
, hydrogen flow rate detected between t1 − t0 (µmol s−1).
Then, the overall mass transfer coefficient,
h (mol m
−2 s
−1 Pa
−1), related to the transport of hydrogen from the PbLi boundary layer into the membrane lumen, can be given by the following expression:
Taking into account the difference of hydrogen pressures between the gas phase over the PbLi (P2) and that in the lumen-side of the membrane B (P3), the overall mass transfer coefficient results in the following:
where
The terms and indicate the hydrogen moles detected during a given time (Δt, s) and their mole fraction recovered through the geometrical surface of the membrane B (S = 0.0017 m2).
P2 and P3 are, respectively, gas phase pressure over the melted alloy and the Ar purge phase pressure in the lumen side of membrane B (ambient pressure—100 kPa).
This permeation flow rate expression uses the difference of hydrogen partial pressures as the driving force and leads to the evaluation of the overall mass transfer coefficient equal to 1.84 × 10⁻⁷ mol m−2 s−1 Pa−1.
The comparison between the overall mass transfer coefficient calculated in the present work and that previously assessed (7.249 × 10
−8 mol m
−2 s
−1 Pa
−1 [
6]) shows a discrepancy factor of around 2.54. However, slight leakages in the pipelines, as well as the various operations carried out during the four-day experimentation, likely under non-steady-state conditions of absorption/desorption, which could have affected the accuracy of the hydrogen mass balance calculation, especially if the alloy exhibited a substantial H
2 inventory. Under these hypotheses, a reliable calculation of the system efficiency η (0 ≤ η ≤ 1) is not given.
Finally, as outlined in the previous work [
6], the dependence of the overall mass transfer coefficient on the temperature could be further obtained by applying the extrapolation assumptions behind the following formula:
So, the calculation gives a value equal to 3.26 × 10⁻⁸ mol m−2 s−1 Pa−1, which is 5.65 times larger than the experimental one.
6. Conclusions
This paper provides an overview of the technologies being explored for recovering hydrogen isotopes from liquid metals, focusing on the PbLi alloy as a candidate for tritium production in the fusion fuel cycle.
Beginning with the more established systems based on GLC and PAV, the work describes the engineering foundation and operations of the novel Membrane Gas–Liquid Contactor (MGLC) technology developed at the Nuclear Technology Laboratory of ENEA Frascati.
The experimental campaign, which lasted four testing days, established the basis for extracting hydrogen isotopes from the molten alloy. Data analysis during the experiment outlines the performance of the MGLC in terms of the overall mass transfer coefficient (1.84 × 10⁻⁷ mol m−2 s−1 Pa−1).
Thus, the direct contact between the purge phase and the hydrogen-enriched liquid metal, facilitated by the MGLC as a feature of a GLC system, could enhance the performance of a PAV where transport phenomena across the metal wall influence the mass transfer.
It is important to note that the resistance related to mass transfer is significantly lower in the porous membrane than in a dense one, especially in the presence of inhibitor species inside the metal lattice (such as surface or interstitial oxides).
Future work could be beneficial in fostering a complete understanding of the physiochemistry interactions within the complex Pb-Li-H system, particularly focusing on the role of Pb in hydrogen solubility and clarifying whether the assumptions of Siverts’ law align with the experimental analysis.


