Article

The Flow Field Characteristics and Separation Performance of the Compact Series Gas–Liquid Separator

1
School of Mechanical Science and Engineering, Northeast Petroleum University, Daqing 163318, China
2
Laboratory of Oilfield Water System Simulation and Control, Northeast Petroleum University, Daqing 163318, China
3
Heilongjiang Key Laboratory of Petroleum and Petrochemical Multiphase Treatment and Pollution Prevention, Daqing 163318, China
*
Author to whom correspondence should be addressed.
Processes 2025, 13(7), 2063; https://doi.org/10.3390/pr13072063
Submission received: 25 May 2025 / Revised: 21 June 2025 / Accepted: 24 June 2025 / Published: 29 June 2025
(This article belongs to the Section Separation Processes)

Abstract

Digitalization is leading the development direction of oilfields in the future. And the precise measurement of produced fluids is the core component supporting the construction of digital oilfields. To mitigate the adverse effects of liquid carryover from gas wells on metering devices at the wellhead, this paper proposed a compact tandem-type gas–liquid separator structure (CTGLS) based on the principle of cyclone separation. The internal flow field characteristics and separation performance of the gas–liquid separator were analyzed through numerical simulation and experimental methods. The influence of various liquid concentrations, inlet flow rates, and overflow split ratios on the velocity field, medium distribution, and separation efficiency of gas–liquid separators was obtained. The optimal regulatory relationship of the underflow split ratio under different operating parameters was elucidated. The results indicate that, as the liquid concentration increases, the axial velocity changes significantly within the underflow region of the secondary separator, while the liquid volume fraction in the cyclone chamber increases gradually. Increasing the inlet flow rate and the split ratio can enhance the axial velocity at the overflow outlet, but it will reduce the liquid phase separation efficiency. The mathematical model correlating the operating parameters with the separation efficiency was established using the response surface method. And the best operation regulation mechanism of the split ratio was obtained under different inlet flow rates and liquid concentrations.

1. Introduction

In the development and production of gas fields, ground metering devices play a pivotal role in single-well production monitoring and production dynamic analysis [1]. Accurate production data from gas wells not only serves as the fundamental basis for production planning but also constitutes a key enabler for the digital management and economic optimization of gas fields [2]. However, as the production of gas wells continues, the phenomenon of liquid carryover at the wellhead becomes increasingly prevalent. The liquid carried in the produced gas not only corrodes pipelines and equipment [3] but also seriously affects the measurement accuracy of metering devices, resulting in distorted production data [4]. This poses severe challenges to the digital management of gas fields. Therefore, achieving precise measurement for produced gas by wellhead metering devices is a critical factor to ensure production stability and in realizing the digital management of oilfields [5].
Under this working situation, achieving precise and stable measurement of metering devices through efficient gas–liquid separation has become an inevitable requirement in industrial production. Based on the separation principle, regular gas–liquid separation methods mainly include gravity sedimentation, filtration separation, coalescence separation, and cyclone separation [6]. Among them, cyclone separation has gained widespread application in industries such as petroleum refining, marine engineering, food processing, and aviation, owing to its simple structure, high efficiency, and low operational cost [7]. Scholars have conducted systematic research on the internal flow field distribution, velocity characteristics, and the influence mechanism of structural design on separation performance in gas–liquid separators. Erdal [8] conducted Laser Doppler Velocimetry (LDV) experiments to measure the axial and tangential velocity distributions at various positions inside gas–liquid separators with different inlet structures. Yang [9] studied the laws of changing of the gas volume fraction distribution, velocity field, and pressure drop with or without a thimble in the underflow port and under different underflow pipe shapes. They found that a truncated cone thimble helps the dense liquid move to the sidewall and the low-density gas gathers toward the central axis. Based on the CFD numerical simulation method, Wang [10] et al. studied the internal flow field of the gas–liquid cylindrical cyclone by using the Reynolds Stress Model (RSM) and achieved droplet movement trajectory tracking through the integration of the RSM and discrete phase model (DPM). The research not only revealed the distribution characteristics of the three-dimensional velocity field inside the separator, but also analyzed the influence laws of key structural parameters on the separation efficiency. Furthermore, researchers have conducted optimization analyzes on the effects of operating conditions, structural parameters, and working condition adaptability of gas–liquid separators on the separation efficiency through a complementarity of experimental and simulation. Gupta [11] discovered that the presence of gas significantly increases the pressure drop inside a hydrocyclone by enhancing the turbulence intensity. Meng et al. [12] investigated the effect of operating parameters on the performance of a novel downhole gas–liquid hydrocyclone through systematic experiments. The research shows that, when the inlet gas volume fraction changes, the separator has an optimal split ratio, and its value is approximately equal to the inlet liquid content rate. The increase in liquid viscosity will lead to a significant rise in the gas content at the liquid phase outlet. This study provides important theoretical support for optimizing the operating parameters of downhole gas–liquid hydrocyclones. Miao et al. [13] took the gas–liquid hydrocyclone as the research object. Using the Plackett–Burman (PB) design and combining numerical simulation with laboratory experiments, they conducted a significance analysis for the structural parameters of the hydrocyclone with the gas phase separation efficiency as the response factor. The study identified the structural parameters that significantly affect separation performance. Their research methodology provides valuable references for further improving the separation performance of gas–liquid cyclones.
The above study reveals the influence law of structural and operational parameters on the flow field characteristics and separation performance of the gas–liquid hydrocyclone. It provides theoretical support for the performance improvement and engineering design of gas–liquid separators. Therefore, for the demands of specific industrial scenarios, researchers have developed various new gas–liquid separation devices and verified their engineering applicability. Li et al. [14] proposed a novel cascade gas–liquid cyclone separator for natural gas dehydration and purification. The internal flow field, droplet particle motion, and liquid film distribution were simulated. The cyclone was then optimized using different structural parameters. The optimized structure achieved a separation efficiency of over 80% for 1 μm droplets. Zheng et al. [15] designed a novel downhole gas–liquid cyclone separation device. Through experimental research, the influence laws of different working condition parameters on the separation performance were deeply analyzed. The results show that this device exhibits excellent self-adaptive capabilities, being able to accommodate inlet gas volume fraction fluctuations ranging from 30% to 90%. This research achievement provides an effective technical solution for the long-term stable operation of offshore high-gas-content electric pump wells. Wang et al. [16] innovatively developed a cylindrical gas–liquid cyclone separator suitable for high-gas-content conditions and successfully applied it to the exploitation system of submarine oil and gas fields with high gas characteristics. Experimental results and field applications demonstrate that this separator not only significantly improves gas–liquid separation efficiency but also plays a crucial role in ensuring the stable operation of submarine oil and gas exploitation systems, exhibiting excellent engineering application value.
The above scholars have conducted a lot of research on the internal flow characteristics and performance analysis of gas–liquid cyclone separators and reasonably designed and optimized the corresponding gas–liquid separator structure according to different working conditions, which provides a theoretical foundation and technical support for the production and application of gas–liquid cyclone separators. However, despite these advances, critical gaps remain in addressing the specific challenges of ground wellhead applications. Conventional separators, while effective in large-scale industrial settings, often exhibit excessive spatial requirements that are incompatible with the limited footprint available in ground metering facilities. This limitation is particularly problematic given the stringent space constraints and variable operating conditions encountered in field operations.
To address these problems, a compact tandem-type gas–liquid separator structure (CTGLS) suitable for ground wellheads is proposed. The CTGLS design integrates a cascaded cyclone configuration that synergistically combines structural compactness with high separation efficiency, overcoming the inherent trade-offs observed in conventional separator designs. The flow field characteristics and separation performance of the CTGLS under different liquid concentrations, different inlet flow rates, and different primary overflow split ratios were studied through numerical simulation and laboratory experiments. Furthermore, the regulation method of the optimal underflow split ratio obtained through the study achieved an efficient gas–liquid two-phase separation under different gas–liquid ratios. The research results ensure highly efficient gas–liquid separation while achieving significant reduction in spatial volume. This performance enhancement effectively guarantees the operational stability and measurement accuracy of subsequent metering devices, thereby substantially improving the reliability and precision of wellhead data acquisition. These advancements hold critical importance for the construction of surface measurement systems with stringent spatial optimization requirements and the development of digitalized oilfield management systems.

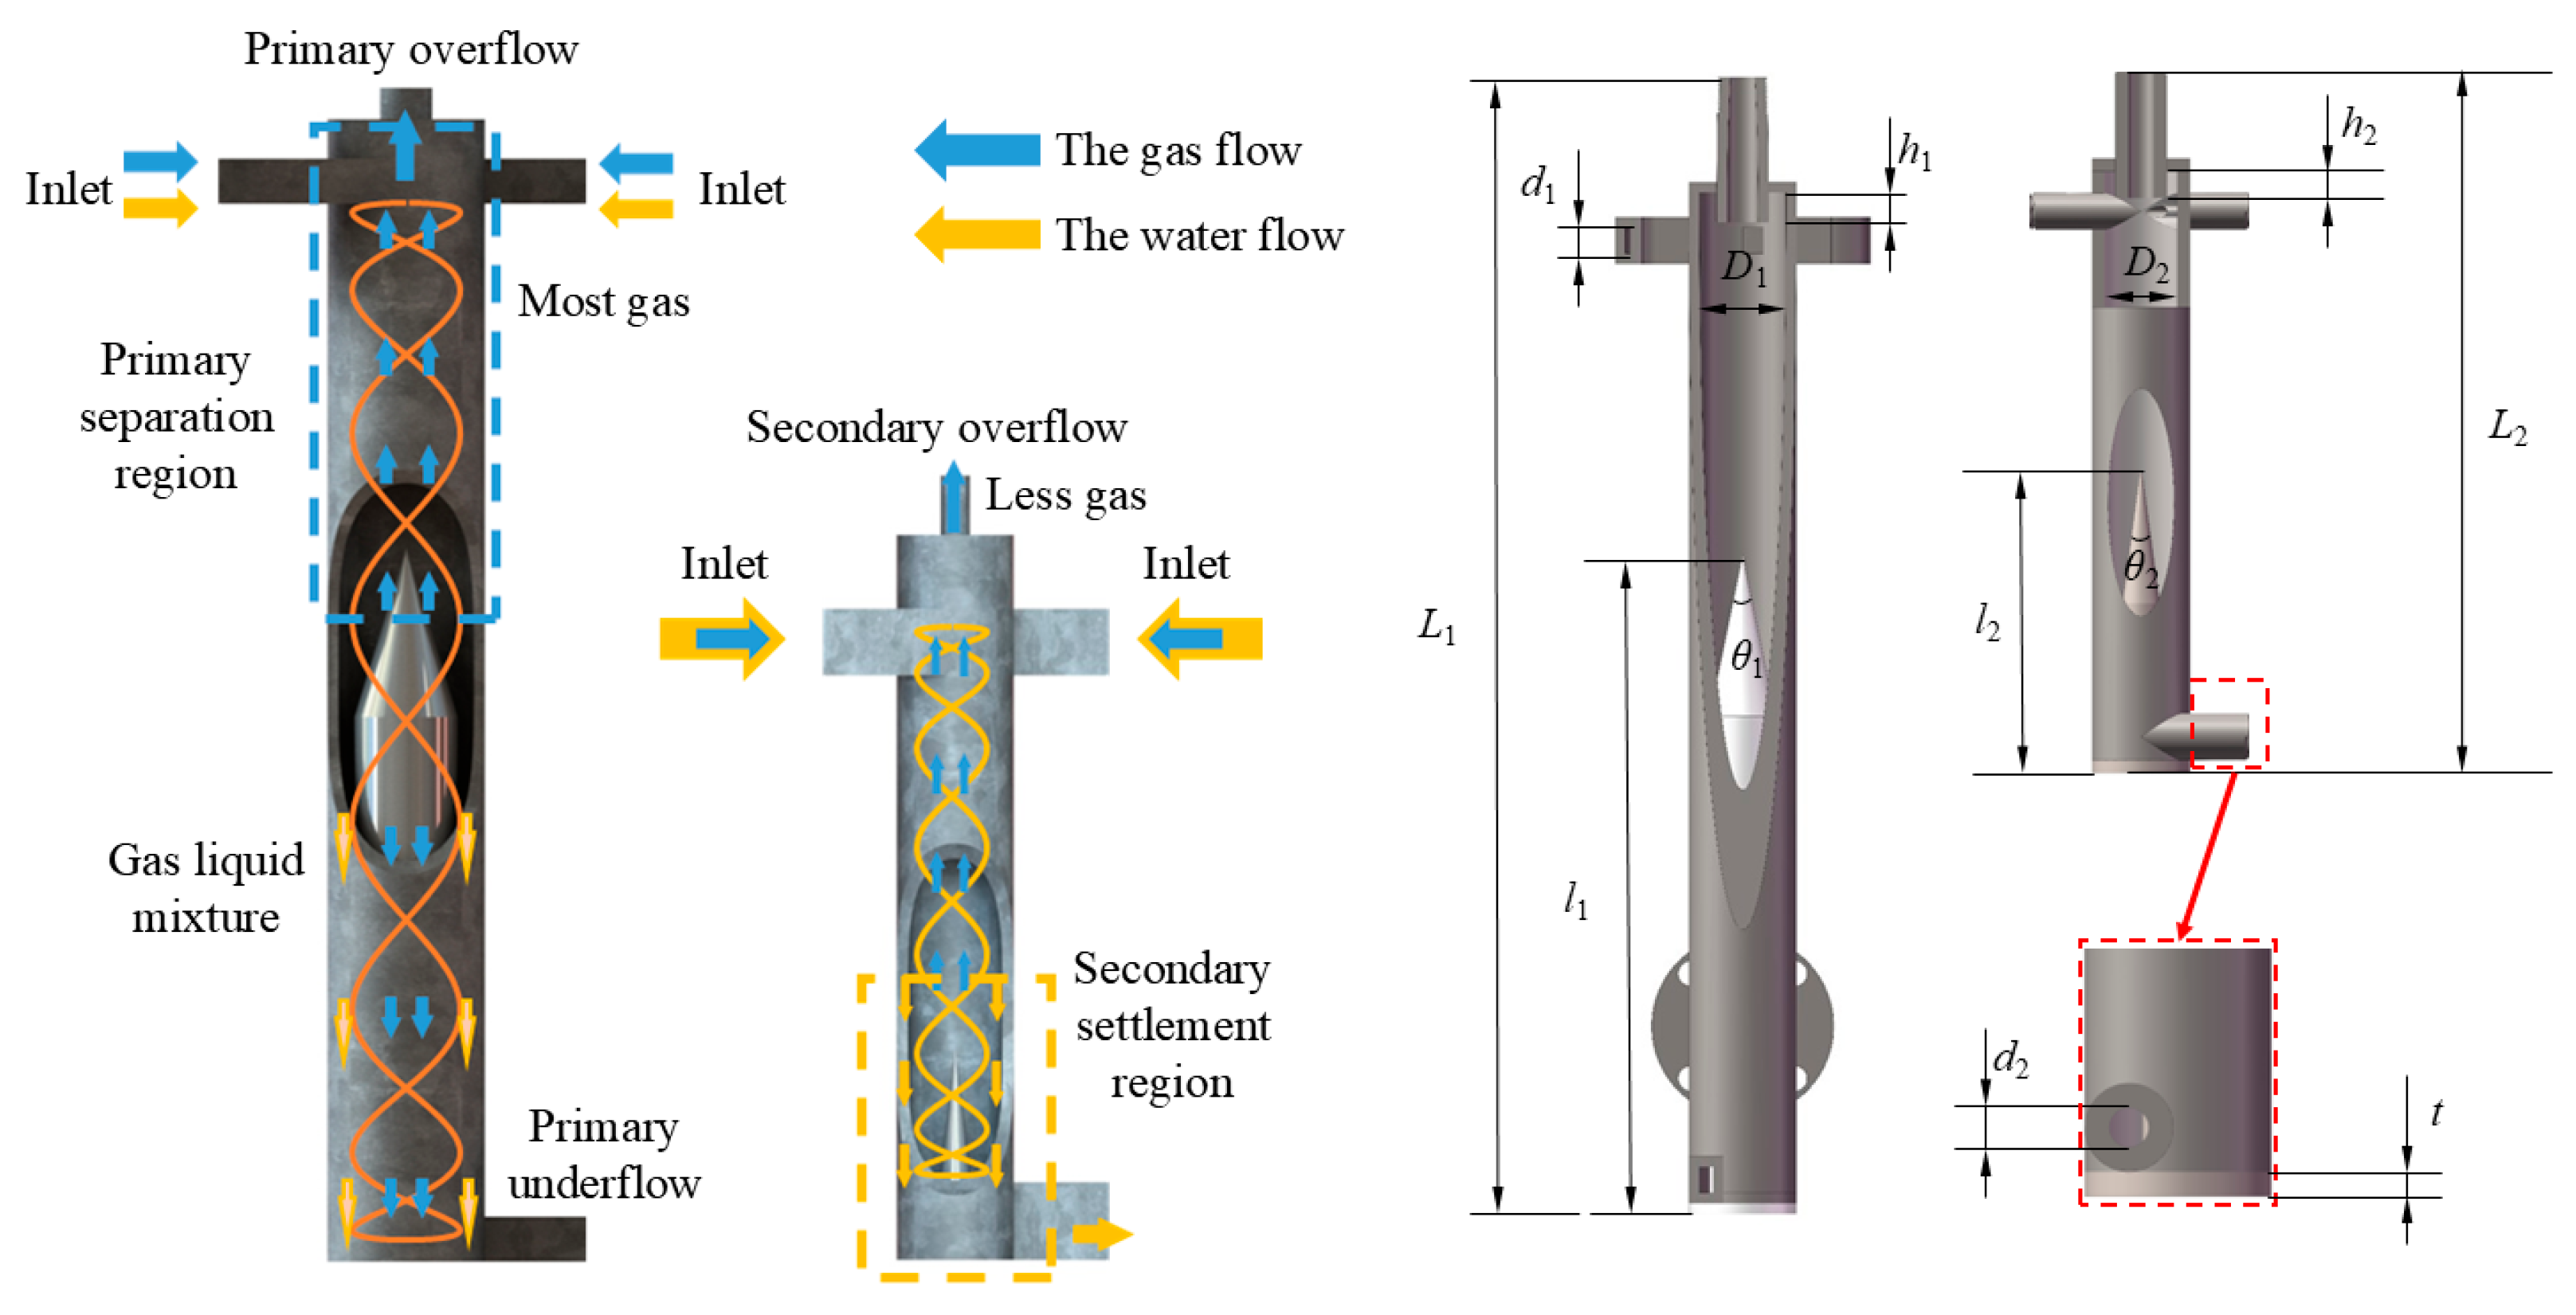
2. Structure and Working Principle

The structure and working principle of the CTGLS was shown in Figure 1, which consists of a primary and a secondary gas–liquid hydrocyclone connected in series. The main structural parameters are listed in Table 1. The migration of the gas is indicated by the blue arrow, while that of the liquid is indicated by the yellow arrow. During operation, the gas–liquid mixed phase carrying liquid enters the primary gas–liquid hydrocyclone through a dual tangential inlet at a certain pressure and velocity, where it undergoes rotational tangential motion within the cyclone chamber. Under the action of the centrifugal field, the majority of the gas phase accumulates at the center of the separation area and exits through the primary gas overflow outlet, while the unseparated residual gas is carried by the liquid phase into the secondary gas–liquid hydrocyclone. After the same separation process, the remaining gas is separated out through the secondary gas overflow outlet, and the liquid phase settles at the secondary underflow outlet before finally exiting through the liquid outlet.

3. Methods

3.1. Numerical Methods

3.1.1. Numerical Models

Common computational models used in numerical simulations include the Volume of Fluid (VOF) model, Mixture multiphase flow model, Discrete Phase Model (DPM), and Eulerian multiphase flow model. The VOF model is suitable for free-surface flow problems with distinct interfaces but has limited capability in handling phase slip effects [17]. The DPM model is mainly used for simulating the motion trajectory of discrete phases (such as particles or droplets) in the continuous phase [18]. The Mixture model can simulate multiphase flow, but its description accuracy for interphase interfaces is relatively low, and its processing of interphase interactions is limited, thus limiting its application scope [19]. In contrast, the Euler multiphase flow model has obvious advantages. It can precisely describe the phase interface and accurately handle the interphase interactions, including momentum, energy transfer and chemical reactions, etc. Its application scope is wider, and it is suitable for multiphase flow problems of various phase states and flow states [20].
Therefore, in this paper, the Euler multiphase flow model is selected as the calculation model, and its basic control equation [21] is as follows:
  • Continuity equation:
t ( α m ρ m ) + ( α m ρ m v m ) = 0
where m represents the continuous phase (c) and the discrete phase (d); αm is the volume fraction of each phase, %; ρm is the density of each phase, kg/m3; and vm is the velocity of each phase, m/s.
  • The momentum equation is as follows:
Continuous phase:
t ( α c ρ c v c ) + ( α c ρ c v c v c ) = α c p + τ c + α c ρ c g + K d c ( v d v c )
Discrete phase:
t ( α d ρ d v d ) + ( α d ρ d v d v d ) = α d p p d + τ d   + α d ρ d g + K c d ( v c v d ) + S v d
where p represents the pressure of the continuous phase; pa represents the pressure of the discrete phase, calculated when the volume fraction of the discrete phase αd is below its maximum allowable value; Kcd = Kdc is the interphase momentum exchange coefficient; Svd represents the source term of the discrete phase; τd is the shear stress tensor; and g is the gravitational acceleration vector.

3.1.2. Turbulence Models

The turbulence model is essential for capturing the turbulent flow characteristics in gas–liquid two-phase flows. Common turbulence models mainly include the Spalart–Allmaras model, standard k-ε model, RNG k-ε model, Large Eddy Simulation (LES), and Reynolds Stress Model (RSM) [22]. Among these, the Reynolds Stress Model (RSM) directly solves the turbulent stress transport equations, enabling more accurate consideration of the anisotropy of turbulent stresses. It improves the treatment of anisotropic effects in flows by accounting for the transport characteristics of turbulent shear stresses based on the standard k-ε model [23]. Therefore, RSM demonstrates particular advantages in handling complex turbulent flow problems, such as those involving strong swirling flows and intricate flow patterns. Consequently, this study selects the Reynolds Stress Model as the computational model for subsequent analysis. Its transport equations [24] are presented as follows:
Reynolds stress transport equations:
t ( ρ u i u j ¯ ) + x k ( ρ U k u i u j ¯ ) = D i j + P i j + G i j + φ i j ε i j + F i j
where ρ represents the density of the mixed phase, ui is the component of the fluid velocity vector in the i-th direction, uj is the component of the fluid velocity vector in the j-th direction, Uk is the component of the average velocity in the xk direction, xk is the spatial coordinate variable (k = 1, 2, 3), Dij represents the diffusion term, Pij denotes the stress production term, Gij indicates the buoyancy production term, φij signifies the pressure-strain redistribution term, εij corresponds to the dissipation term, and Fij accounts for the rotational system generation term.

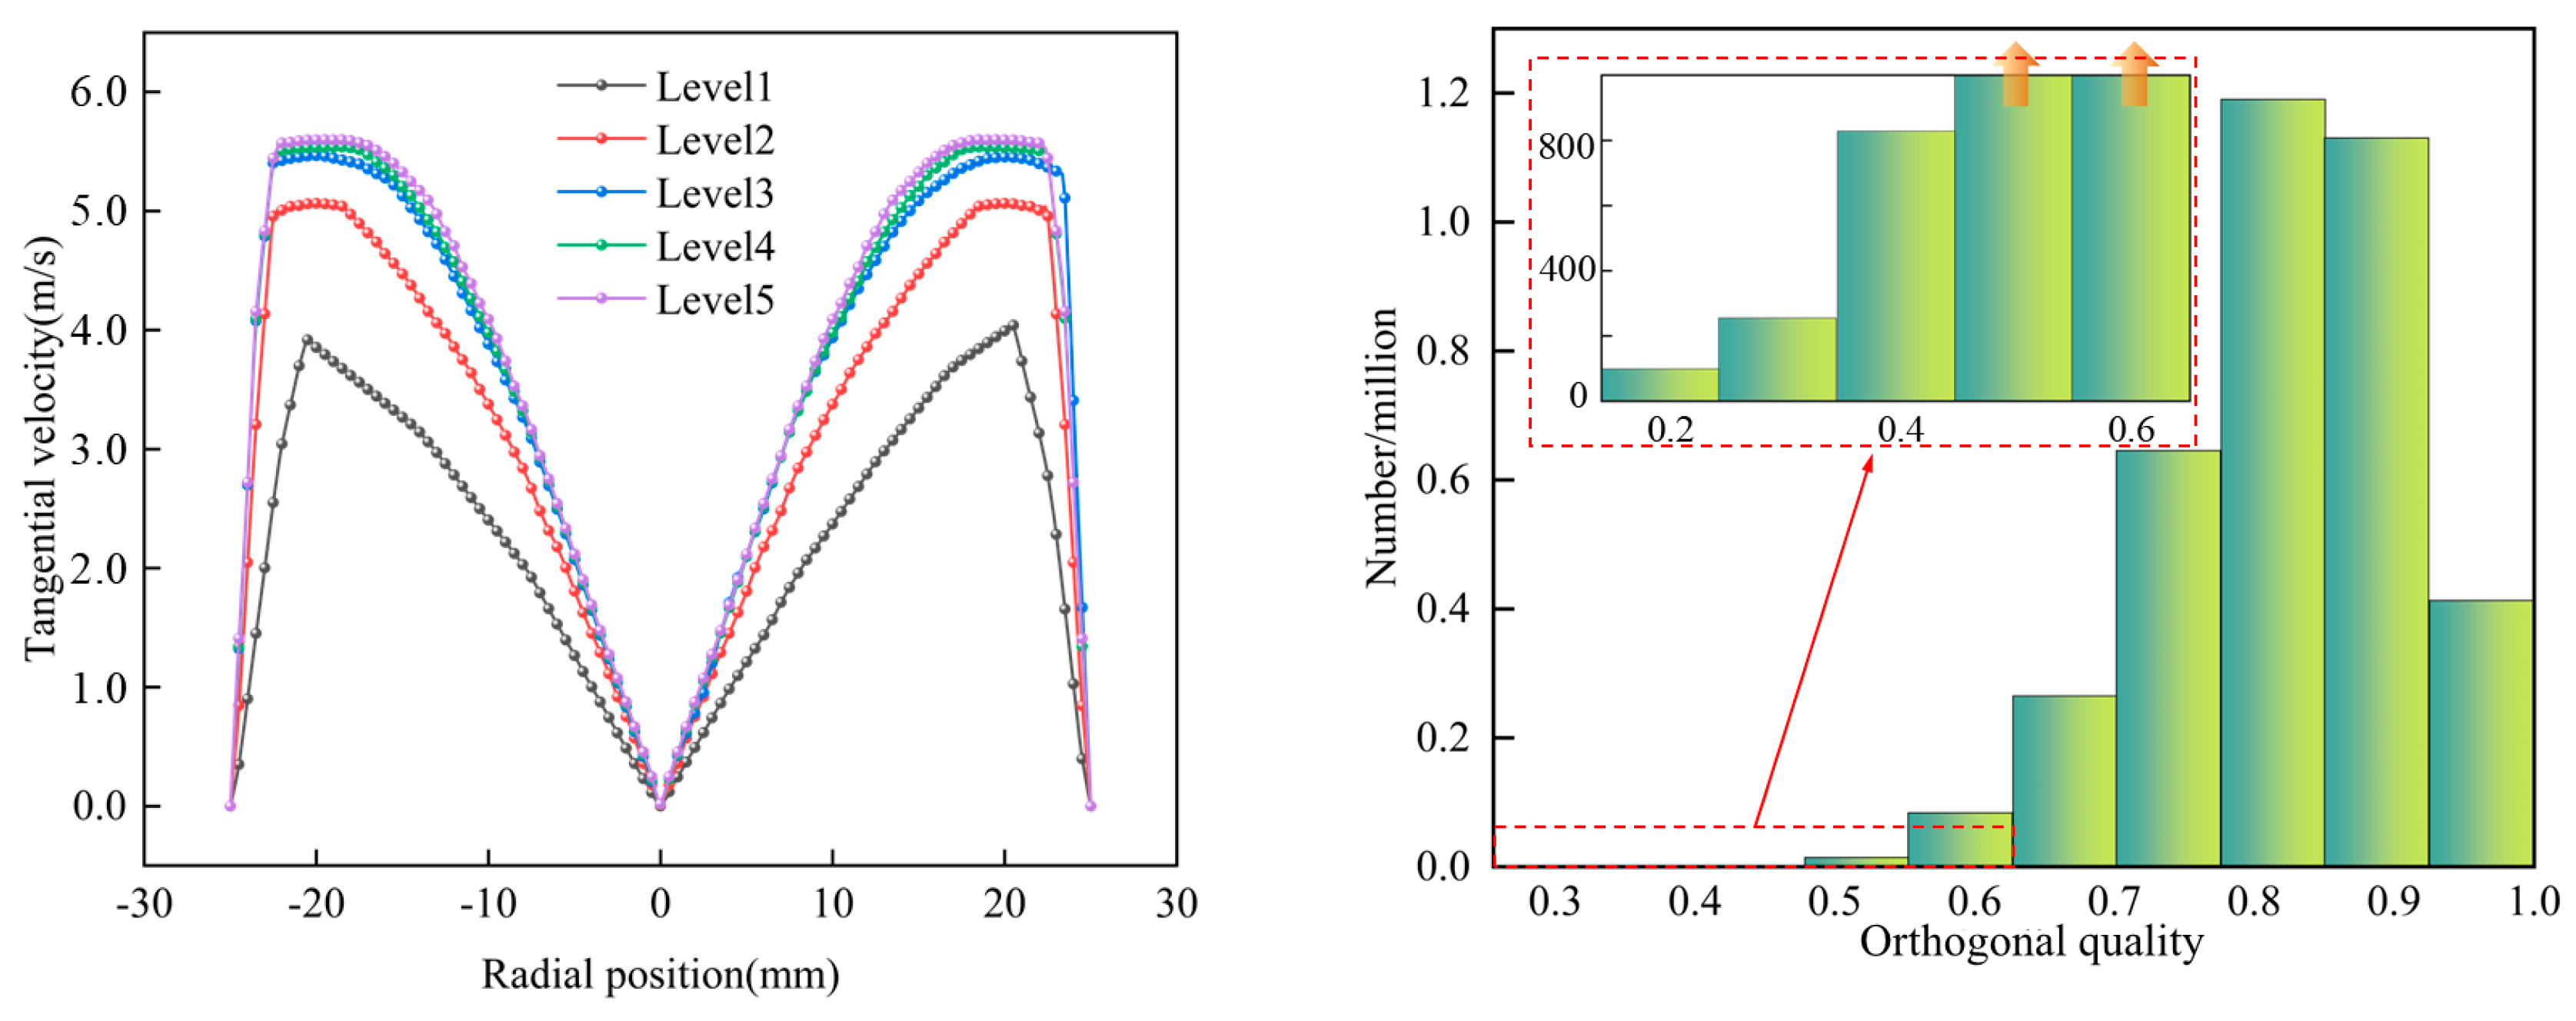
3.2. Grid Generation and Grid Independence Verification

Standard mesh generation methods include hexahedral and tetrahedral meshing techniques. Among them, the hexahedral mesh is widely used in the calculation of complex aggregates because of its high computational efficiency, numerical stability, and favorable convergence characteristics. Due to the complex flow conditions and flow characteristics in the flow field of the designed CTGLS, in this paper, hexahedral grids are adopted for numerical simulation and applies node refinement to critical regions of the fluid domain. Meanwhile, grid independence verification was conducted with the following grid resolutions: Level 1 = 578,204, Level 2 = 984,501, Level 3 = 1,280,697, Level 4 = 1,576,371, and Level 5 = 1,990,725. Taking the tangential velocity profile at the mid-section of the primary hydrocyclone chamber as the evaluation factor, numerical simulations were conducted across different grid resolutions, followed by grid orthogonal quality verification. The verification results are shown in Figure 2. It can be seen from the data in the figure that when the grid level is low, the tangential velocities at the same positions in the cyclone vary greatly. However, when the grid level reaches Level 3 to Level 5, the differences between the tangential velocities become smaller, and the distribution of the tangential velocities no longer changes significantly with the increase in the grid level. Therefore, the grid level subsequently calculated is Level 3.

3.3. Boundary Conditions and Performance Indicators

According to the specific working conditions of the oilfield site, the continuous phase in the simulation is set to be the gas phase with a density of 1.225 kg/m3 and a viscosity of 1.789 × 10⁻⁵ Pa∙s, and the discrete phase is the water phase, in which the density of the water phase is 998.2 kg/m3 and the viscosity is 1.003 × 10⁻³ Pa∙s. The inlet was configured as a velocity inlet, and both the overflow outlet and underflow outlet were set as free outlets. The simulation employed a double-precision pressure-based implicit solver, with velocity–pressure coupling implemented through the Coupled algorithm. The convergence criterion was set at 10−6, with no-penetration and no-slip boundary conditions applied to all walls.
To quantitatively analyze the separation performance of the gas–liquid separator, separation efficiency was introduced as the evaluation metric. Separation efficiency is primarily categorized into mass efficiency, simplified efficiency, and comprehensive efficiency. Among these, mass efficiency [25] not only reflects the actual flow conditions of the medium but also incorporates the impact of the split ratio on efficiency. Therefore, the subsequent separation efficiency results were all obtained using the calculation method for mass separation efficiency. The calculation formula for mass separation efficiency Ez is presented as Equation (5).
E i = m = 1 n M m M i
where Ei represents the mass separation efficiency, %; Mi is the mass flow rate of the medium at the inlet, kg/s; Mm is the mass flow rate of the medium at the outlet, kg/s; and n denotes the number of medium outlets, where n = 2 for the gas phase and n = 1 for the liquid phase in this study.

3.4. Laboratory Experimental and Numerical Simulation Reliability Verification

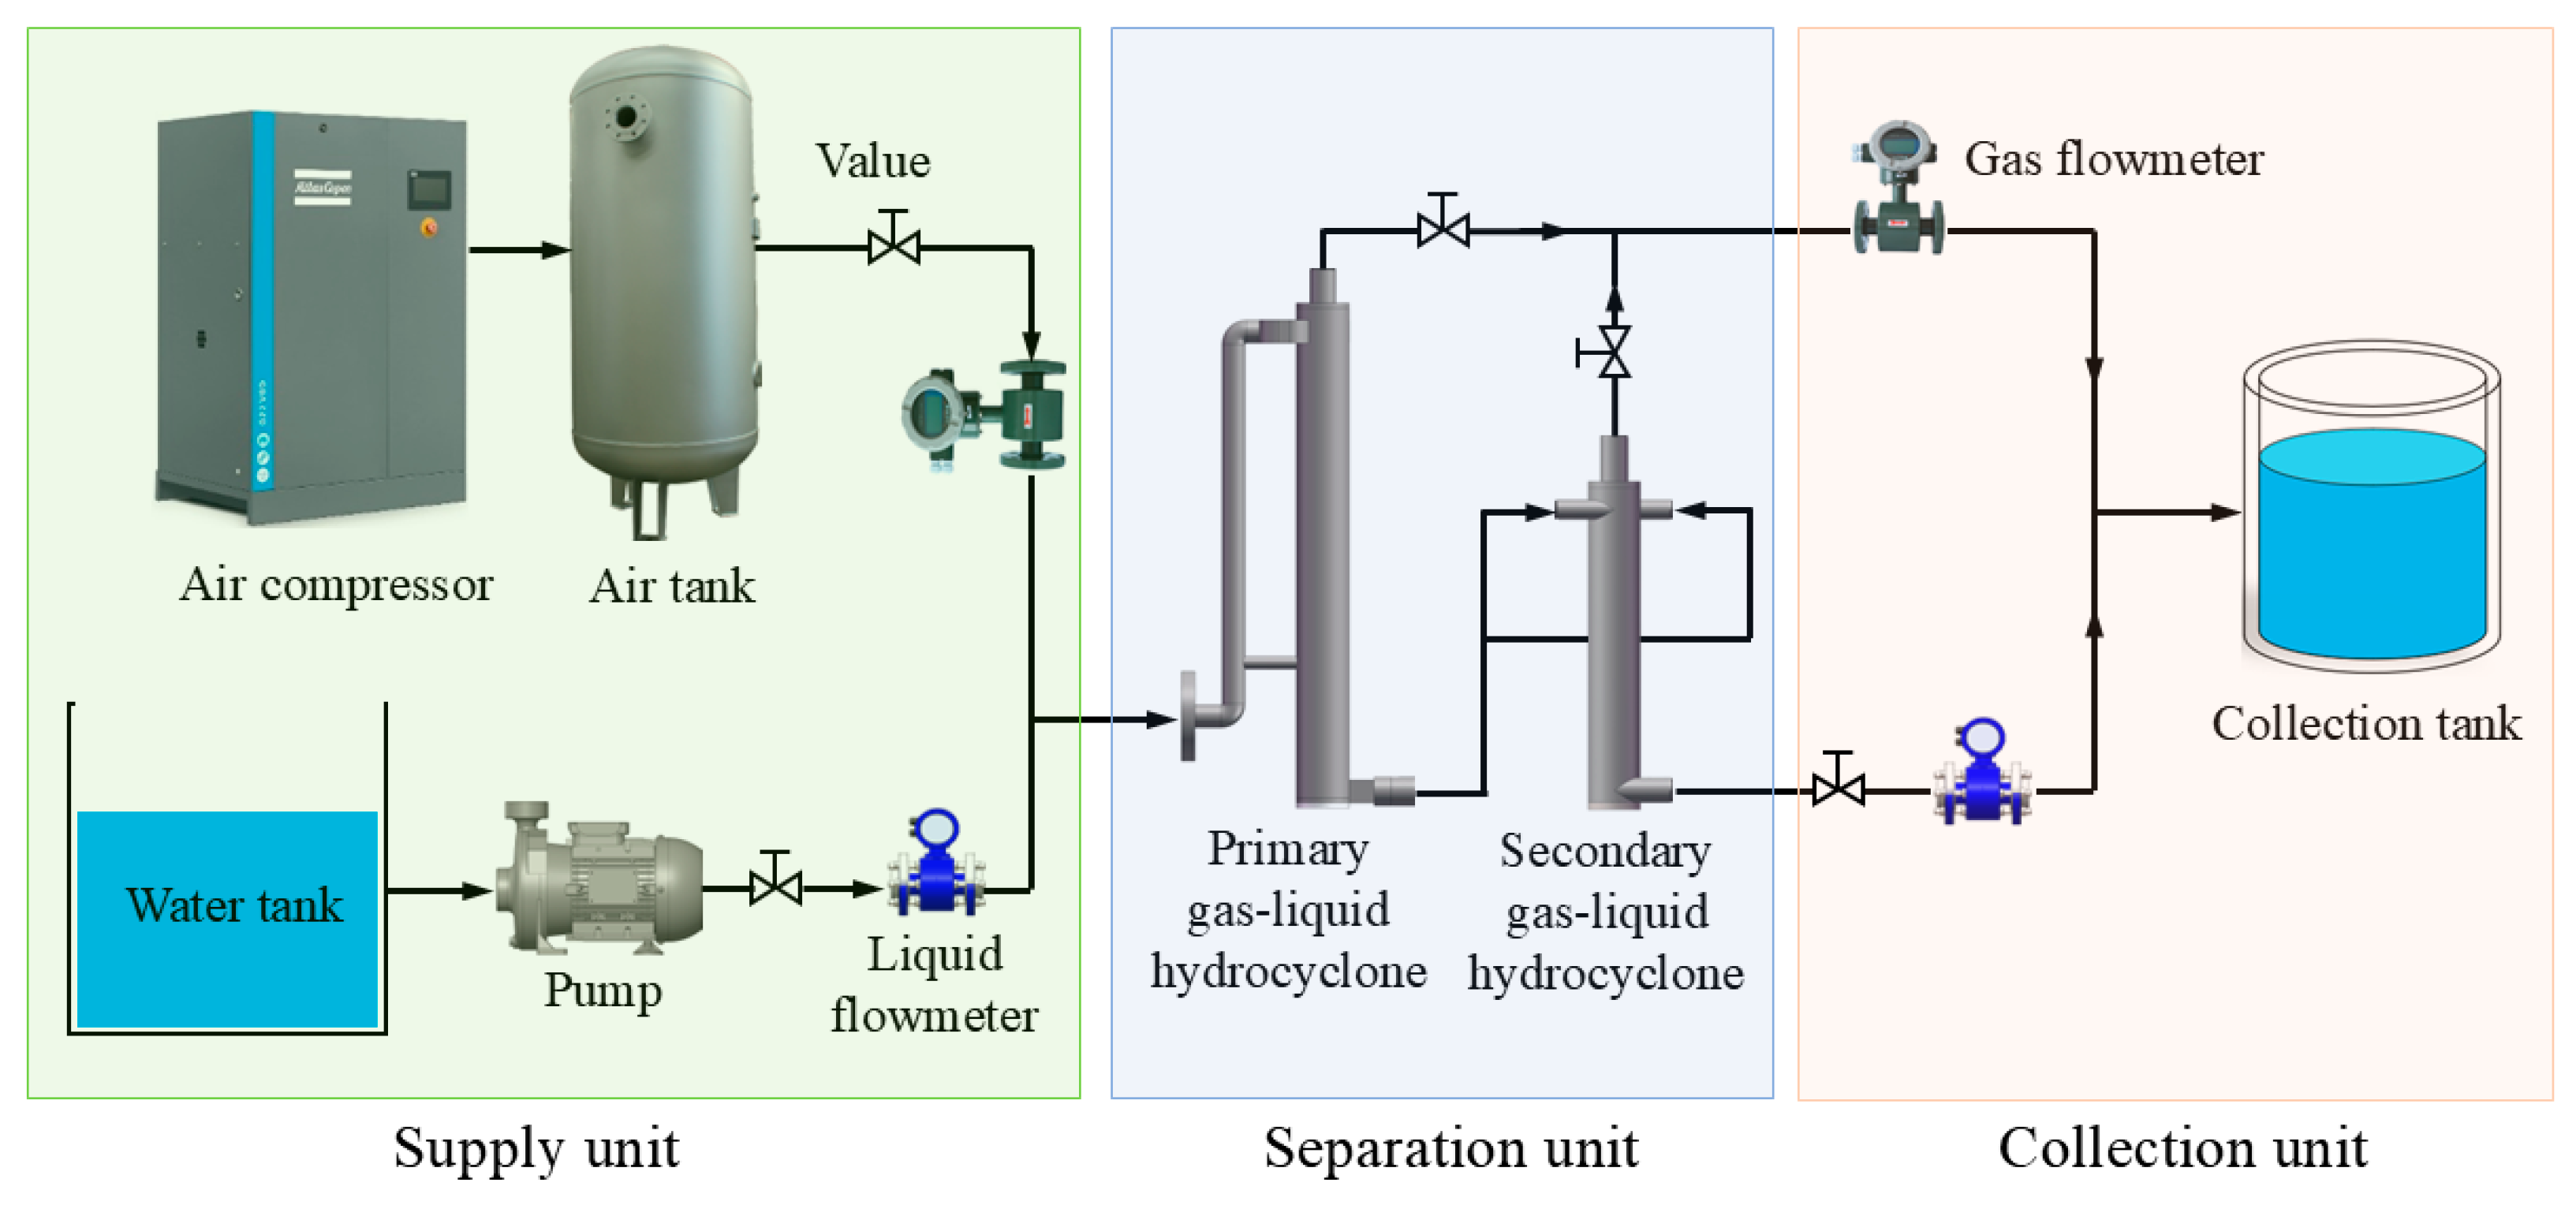
3.4.1. Laboratory Experimental

To simulate actual field conditions and verify the accuracy of numerical simulation results, a laboratory experimental test platform was constructed as shown in Figure 3.
The gas and liquid phases used in the experiment were air and water, respectively. Among them, the density of air was 1.225 kg/m3, and the viscosity was 1.789 × 10⁻⁵ Pa∙s. The density of water is 998.2 kg/m3, and its viscosity is 1.003 × 10⁻³ Pa∙s at 25 °C. To guarantee the corrosion resistance of the structure, 304 stainless steels were selected for the machining of the gas–liquid separator. The experimental test platform mainly consists of the supply unit, the separation unit, and the collection unit. During the experiment, the gas was compressed into the air tank by controlling the air compressor, and the inlet volume was controlled by adjusting the valve and observing the gas electronic flowmeter. The liquid water stored in the water tank is pressed into the process piping by a centrifugal pump, and the inlet flow rate is adjusted by the frequency control device of the centrifugal pump and measured by the corresponding liquid electronic flowmeters. After the completion of the measurement of both, they were mixed uniformly through a static mixer and then entered the gas–liquid separator for separation. The presence of gas solubility has been taken into account in this process, so the experiment will not suffer from errors in this regard. After entering the gas–liquid separator, the vast majority of the gas is rapidly discharged from the overflow outlet through the cyclone separation in the two-stage cyclones, while the liquid phase settles along the inner wall of the cyclones towards the underflow outlet, thereby achieving efficient separation of the gas–liquid phases.

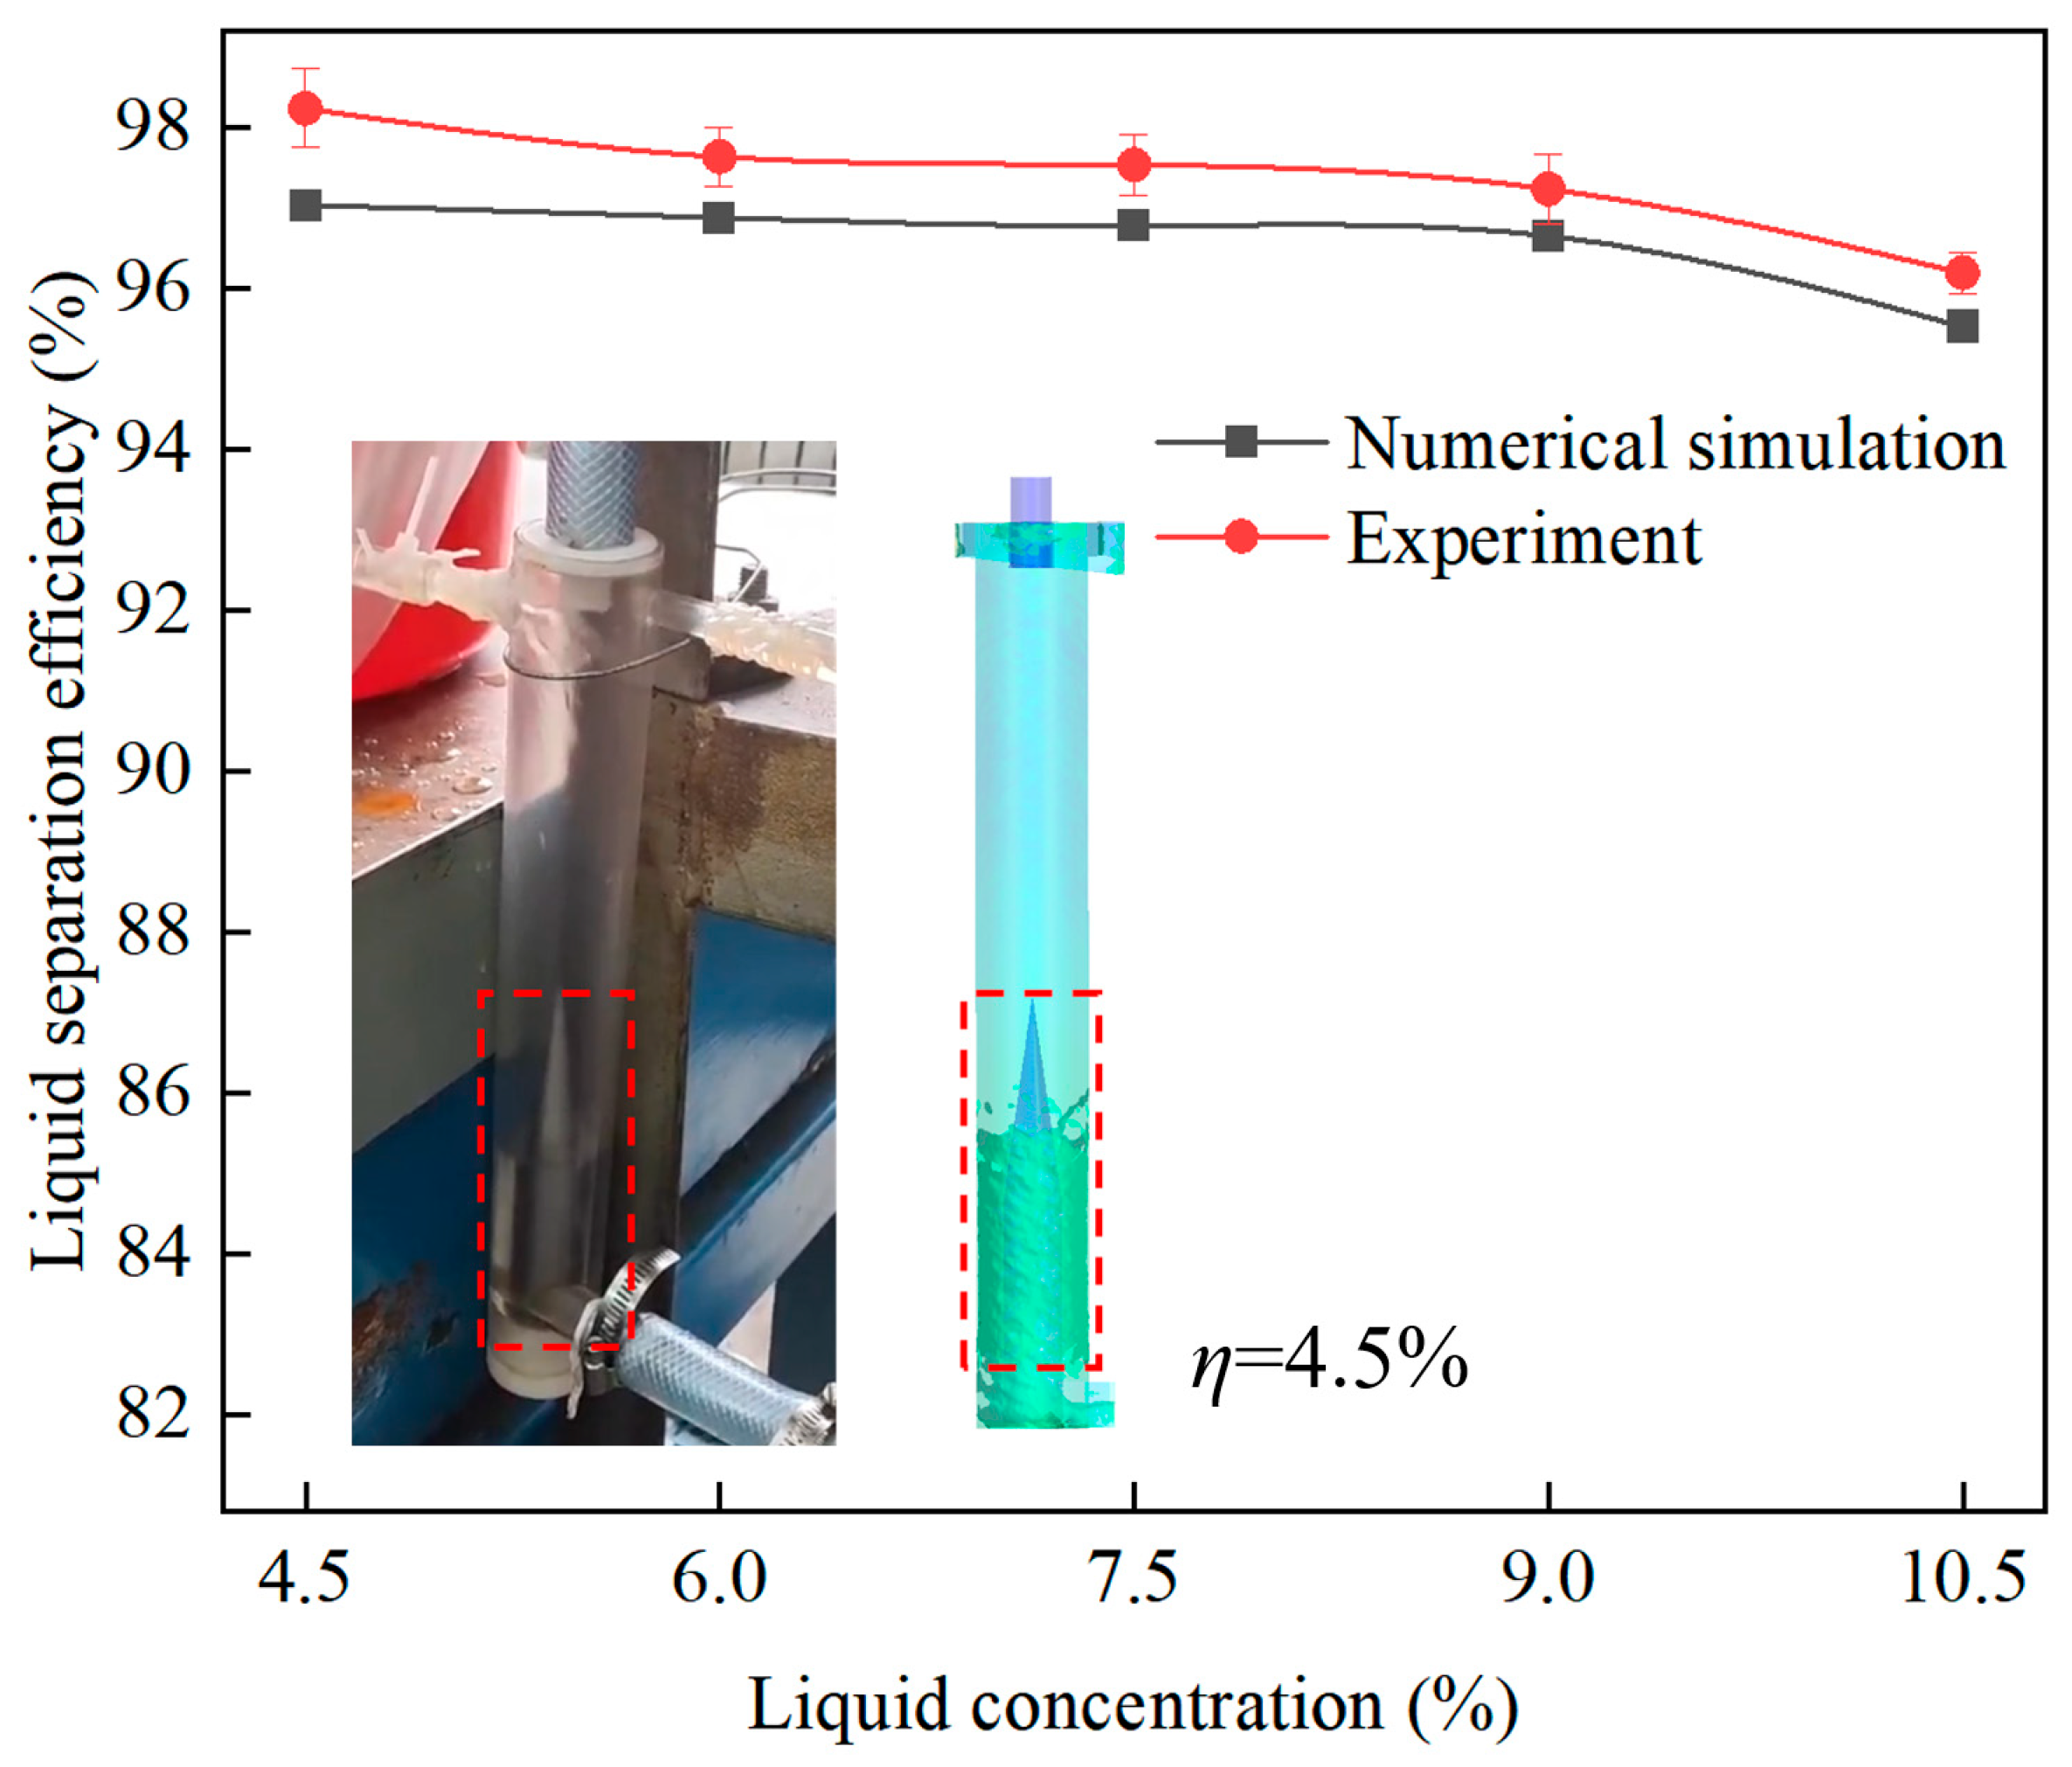
3.4.2. Numerical Simulation Reliability Verification

Five verification groups under different liquid concentration conditions were randomly selected for numerical simulation and experimental tests. The liquid concentration (η) was defined based on the liquid volume fraction, and the comparison diagram of gas–liquid separation efficiency under different liquid concentrations was obtained as shown in Figure 4. By comparing the gas–liquid separation performance of the numerical simulation and experimental results, it is found that, as the liquid concentration gradually increased, the separation efficiencies of both the simulation and the experiment showed a gradually decreasing trend. The simulation separation efficiency decreased from 97.04% to 95.5%, and the experimental separation efficiency decreased from 98.23% to 96.19%. The average error between the numerical simulation results and the experimental results is only 0.97%, verifying the reliability of the numerical simulation results. The liquid concentration η is defined based on the liquid volume fraction.

4. Results

4.1. Effect of Liquid Concentration on Flow Field Characteristics

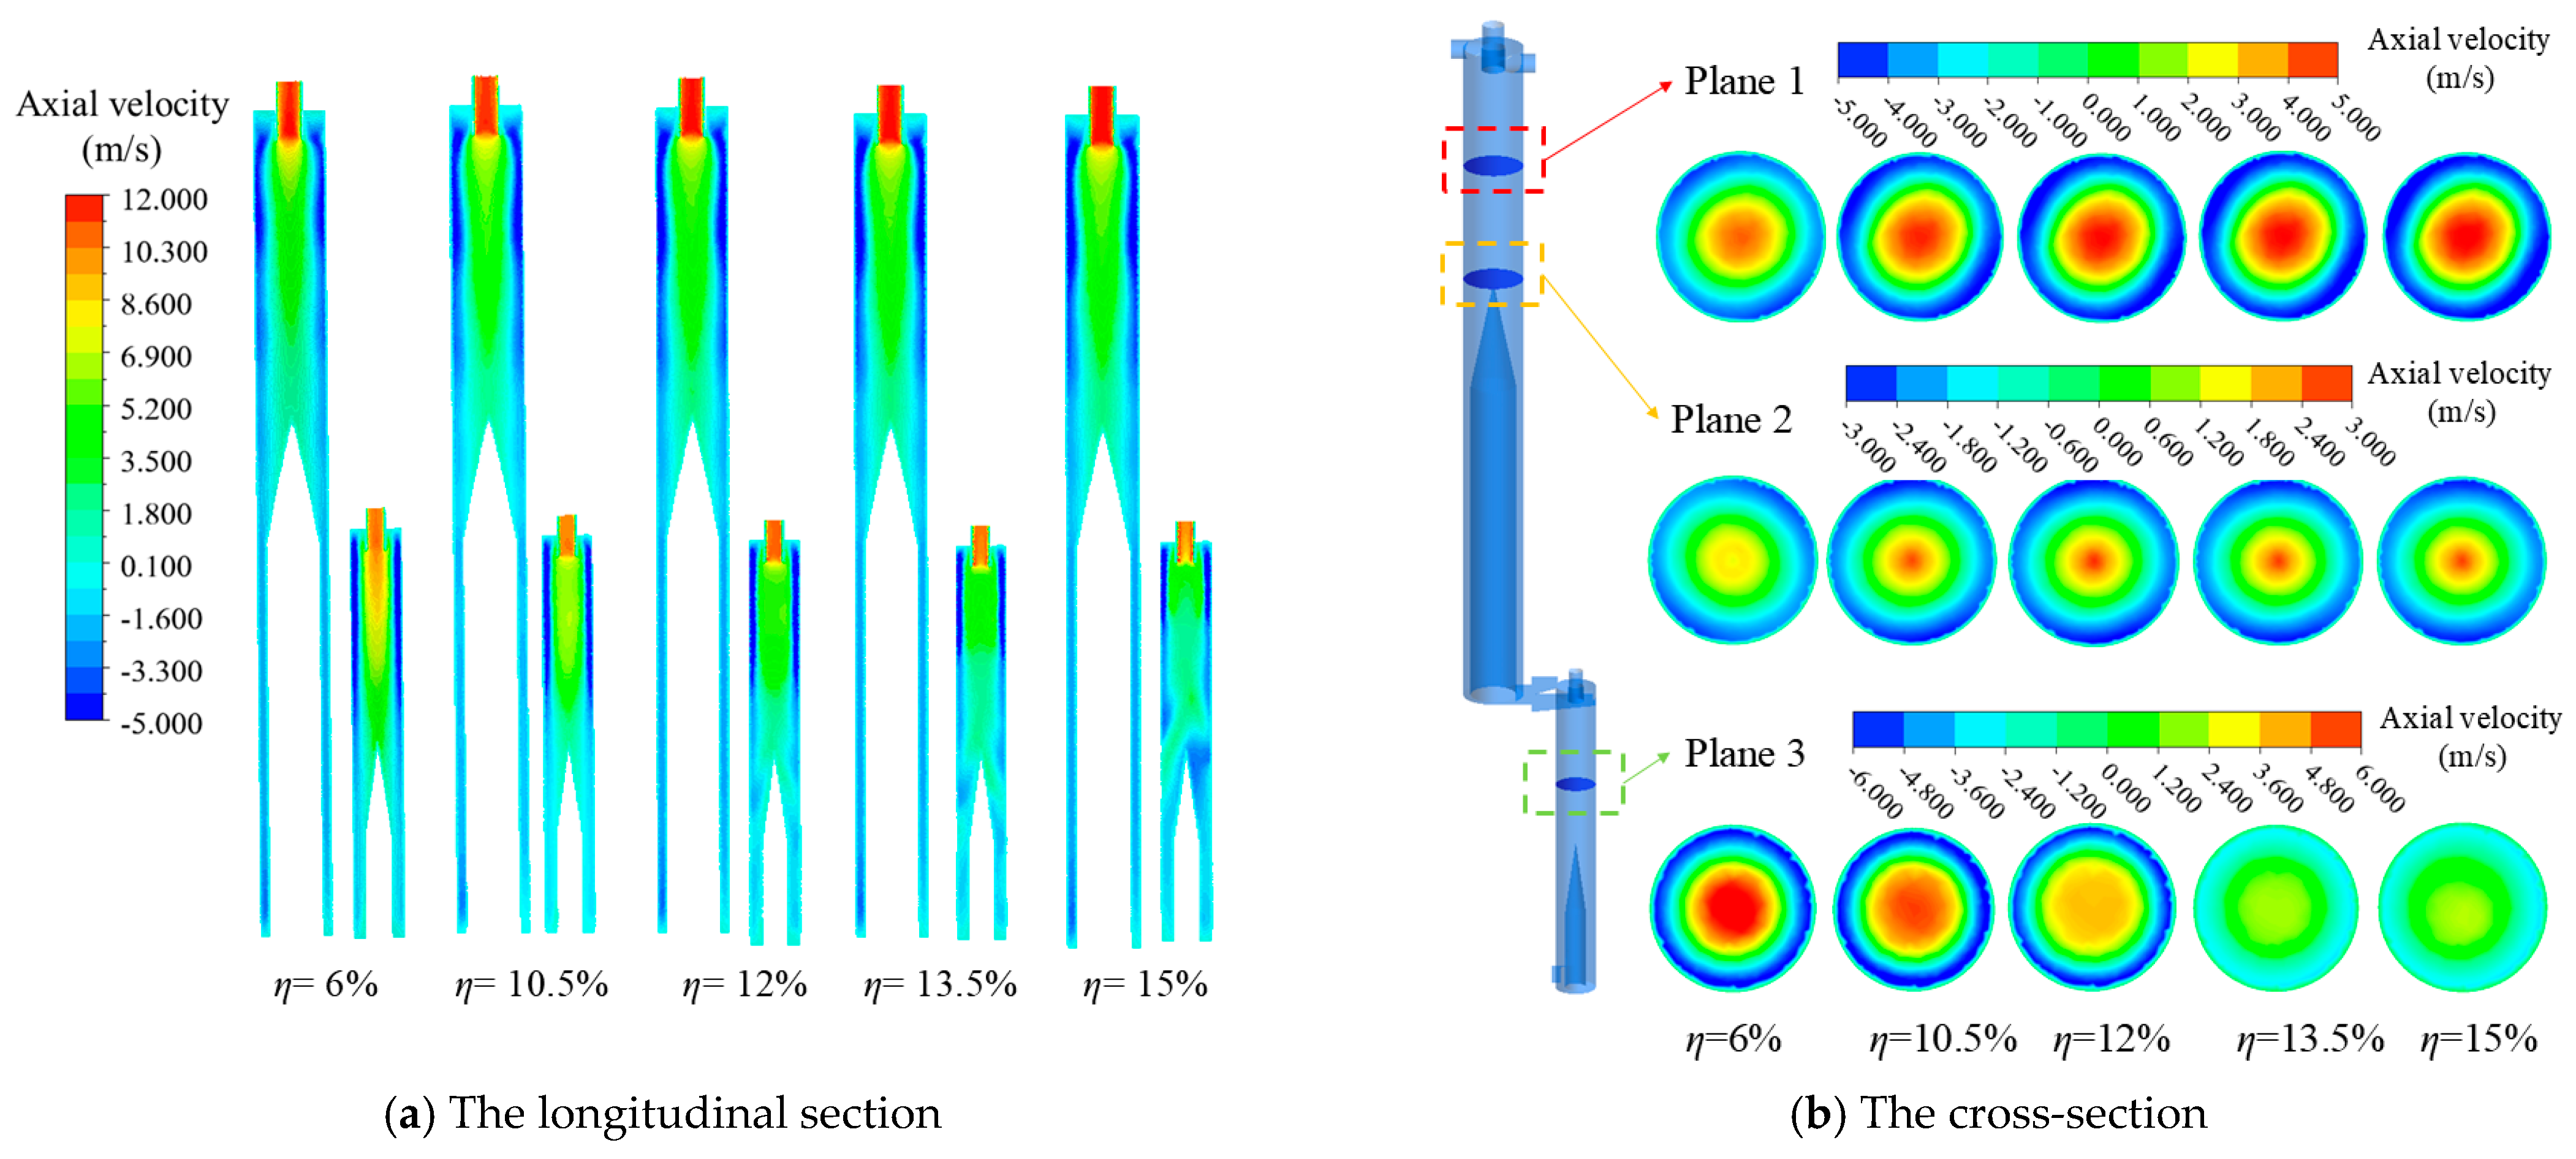
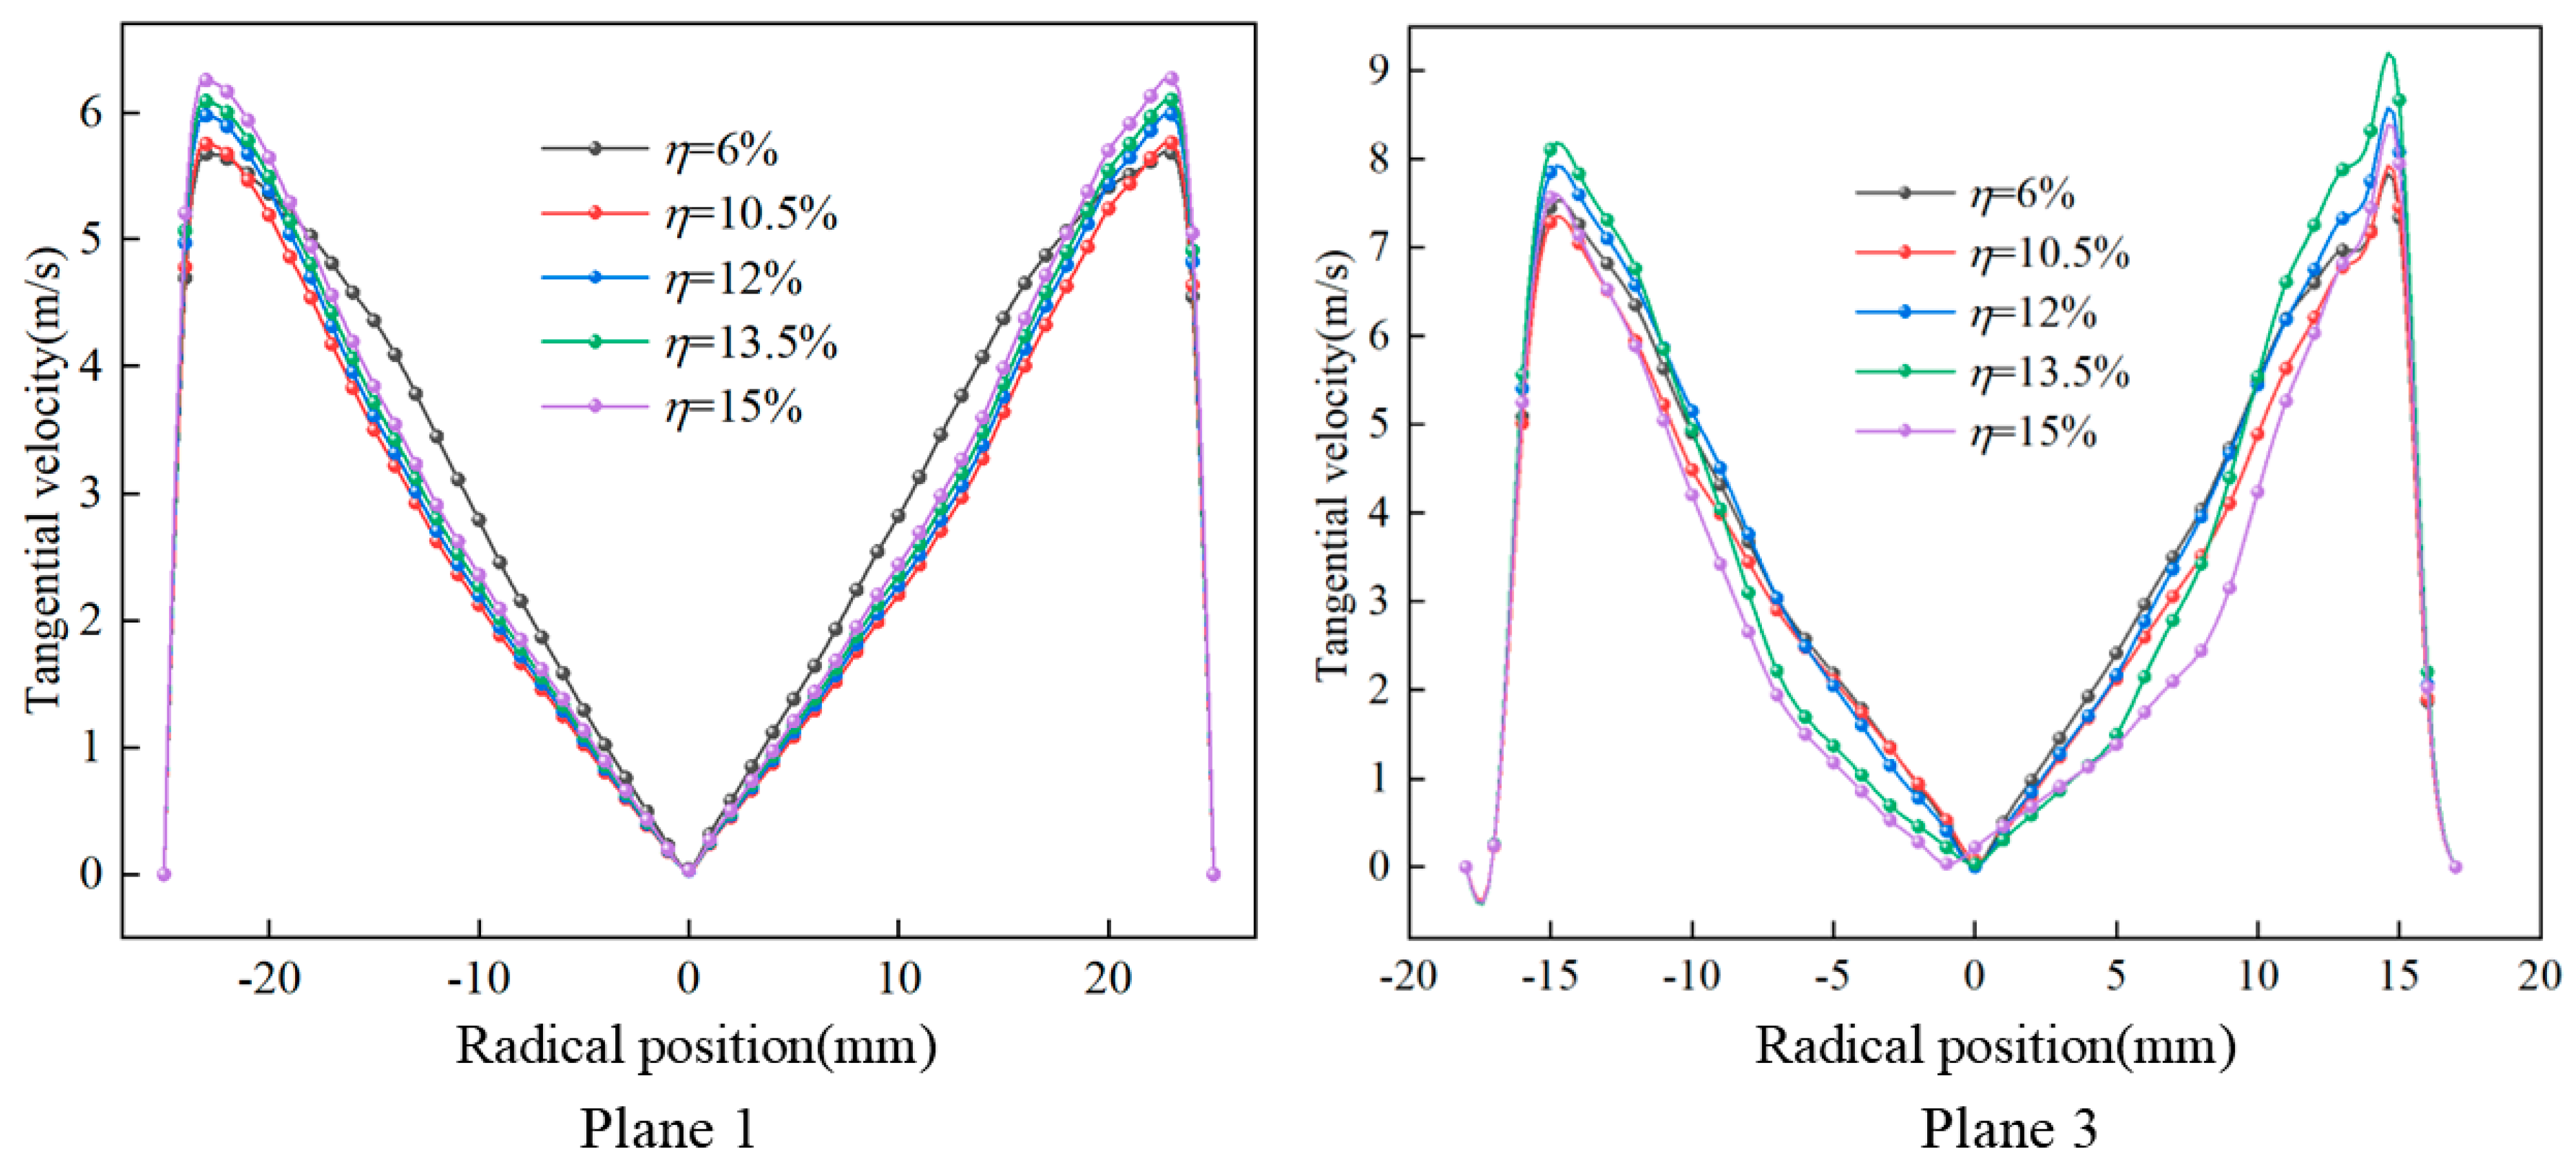
4.1.1. Velocity Field Analysis at Different Liquid Concentrations

During the study including different liquid concentrations, the inlet flow rate was set to be 1200 m3/h, the primary split ratio to be 60%, and the secondary split ratio to be 25%. The axial velocity distribution of the mixed fluid in the gas–liquid separator under different liquid concentrations is shown in Figure 5. Among them, Figure 5a shows the distribution of the axial velocity of the mixed fluid on the longitudinal section at the center of the gas–liquid separator, and Figure 5b shows the distribution of the axial velocity of the mixed fluid at different cross-sections of the gas–liquid separator (the axial positions are 720 mm, 620 mm, and 180 mm, starting from the bottom plane of the secondary separator). Among them, a positive velocity indicates upward flow, and a negative velocity indicates downward flow. It can be seen from the figure that the axial velocity shows an axisymmetric distribution. Moreover, as the liquid concentration increases, the axial velocity in the primary separator gradually increases, while the range of the axial velocity in the secondary separator gradually decreases. The overall variation range of the axial velocity is not significant. Among them, the axial velocities at the overflow outlet are all greater than 10 m/s, and the axial velocities at the side wall are all greater than 3 m/s. The axial velocity distribution in the secondary separator changes to a certain extent with the increase in the liquid concentration. As can be seen from Figure 5b, the axial velocity distribution in the secondary cyclone chamber becomes increasingly uniform as the liquid concentrations rise. Specifically, the region with axial velocities exceeding 8.6 m/s gradually contracts towards the overflow outlet, while the axial velocity distribution at the bottom of the reverse cone becomes progressively non-uniform. This phenomenon occurs because, with the rise of the liquid concentration, the liquid concentration in the secondary separator gradually increases, resulting in the gas–liquid interface at the bottom of the inverted cone gradually moving upward, causing axial velocity disorder. The inherent disparity in density and viscosity between gas and liquid phases results in differential velocity responses under identical cyclonic flow fields, with gas phases attaining substantially higher velocities than liquid phases [26,27]. This hydrodynamic behavior implies that axial velocity attenuation at the secondary overflow port may induce liquid phase leakage through this outlet, thereby compromising liquid separation efficiency.
Figure 6 shows the distribution characteristics of tangential velocity on the cross-section of Plane 1 and Plane 3 under different liquid concentrations. It can be found that the distribution of tangential velocity in the gas–liquid separator shows a strong stability to the change of liquid concentration. With the increase in liquid concentration, the distribution law of the tangential velocity is the same, which first increases from the side wall to the center to the peak (Plane 1 about 20 mm and Plane 3 about 13 mm) and then gradually decreases to zero. Among them, when the liquid concentration increases to 15%, the peak increase in tangential velocity in the two sections was only 0.3 m/s and 0.2 m/s, respectively, and the relative change rate was less than 5%. This indicates that the change in liquid concentration has no significant effect on the tangential velocity in the cyclone field. However, since the inner diameter of the secondary cyclone cavity is smaller than that of the primary cyclone cavity, the maximum tangential velocity in the secondary cyclone is greater than that in the primary cyclone.

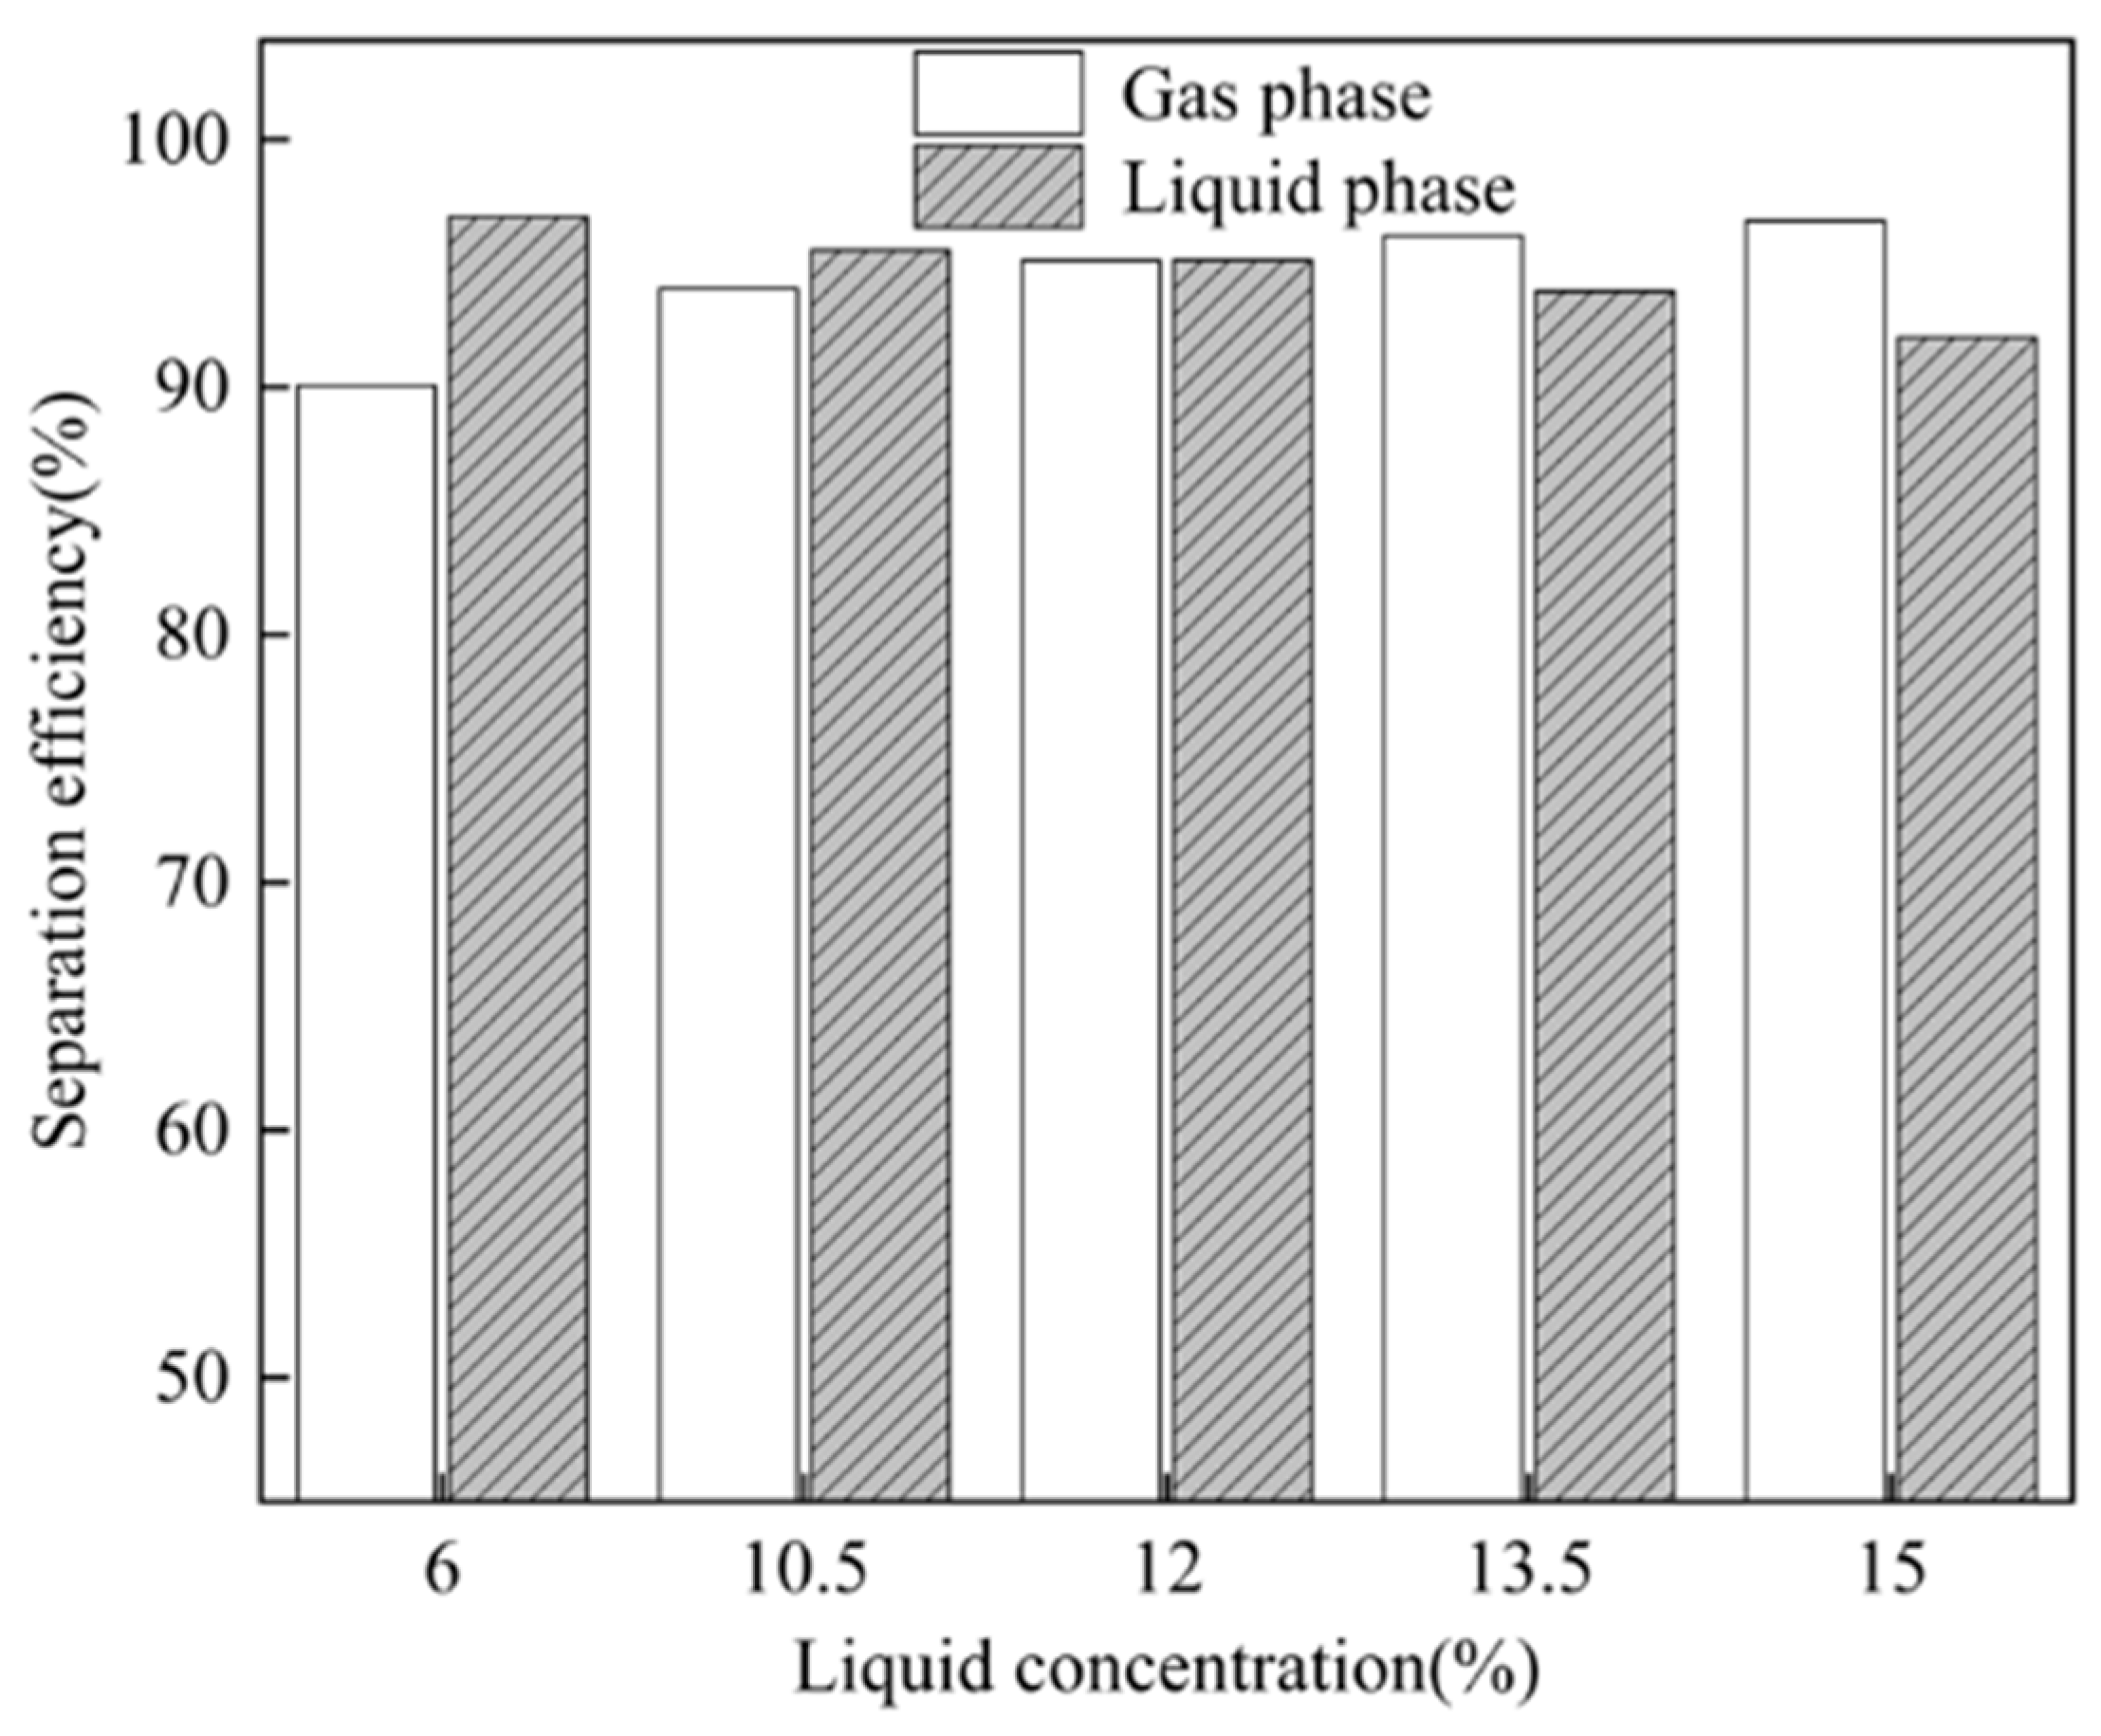
4.1.2. Separation Performance Analysis Under Different Liquid Concentrations

The research on the spatial concentration distribution of the liquid phase in the gas–liquid separator and the variation law of the gas–liquid two-phase separation efficiency was carried out by using numerical simulation. Figure 7 shows the spatial concentration distribution of the liquid phase of the gas–liquid separator under different liquid concentrations with a liquid concentration of 40% as the interface. With the continuous increase in the liquid concentration, the volume fraction of the liquid phase in the cyclone gradually rises. At the critical threshold of a 40% liquid volume fraction, a distinctive phase interface dynamically evolved from the base of the secondary separator to the mid-section of the primary cyclonic chamber, demonstrating axial migration characteristics proportional to initial liquid concentration. Substantial liquid accumulation was observed at the secondary separator base, while the primary chamber showed moderate liquid holdup elevation compared to baseline conditions. This indicates that, as the liquid concentration increases, the liquid phase deposits and gradually fills the secondary separator. When the liquid concentration reaches 15%, excessive liquid phase enters the primary separator and begins to deposit, which will affect the separation efficiency of the gas and liquid phases.
Figure 8 shows the separation performance of the gas–liquid separator for different liquid concentrations. As can be seen from the data in Figure 8, when the liquid concentration increases in the range of 6% to 15%, the gas phase separation efficiency shows a gradually increasing trend, and the liquid phase separation efficiency shows a gradually decreasing trend. This is because, under the combined influence of the cyclone field and gravitational field, the liquid phase primarily accumulates at the bottom region of the cyclone and accumulates near the cyclone’s sidewalls. As the liquid concentration increases, the liquid phase no longer exists in the form of droplets. Most of the droplets aggregate to form a certain height of the page, which is manifested as the gradual expansion of the liquid phase deposition area. This will lead to the gradual rise of the gas–liquid interface distributed in the side wall area, so that more liquid phase will flow out with the gas at the overflow of the secondary separator, resulting in the decrease in the liquid phase separation efficiency, whereas under the action of the gravity field, the gas is difficult to deposit and flows out from the bottom of the underflow of the secondary separator, so more gas will flow out of the overflow in the same time, which leads to a gradual increase in the gas phase separation efficiency.

4.2. Effect of Inlet Flow Rate on Flow Field Characteristics

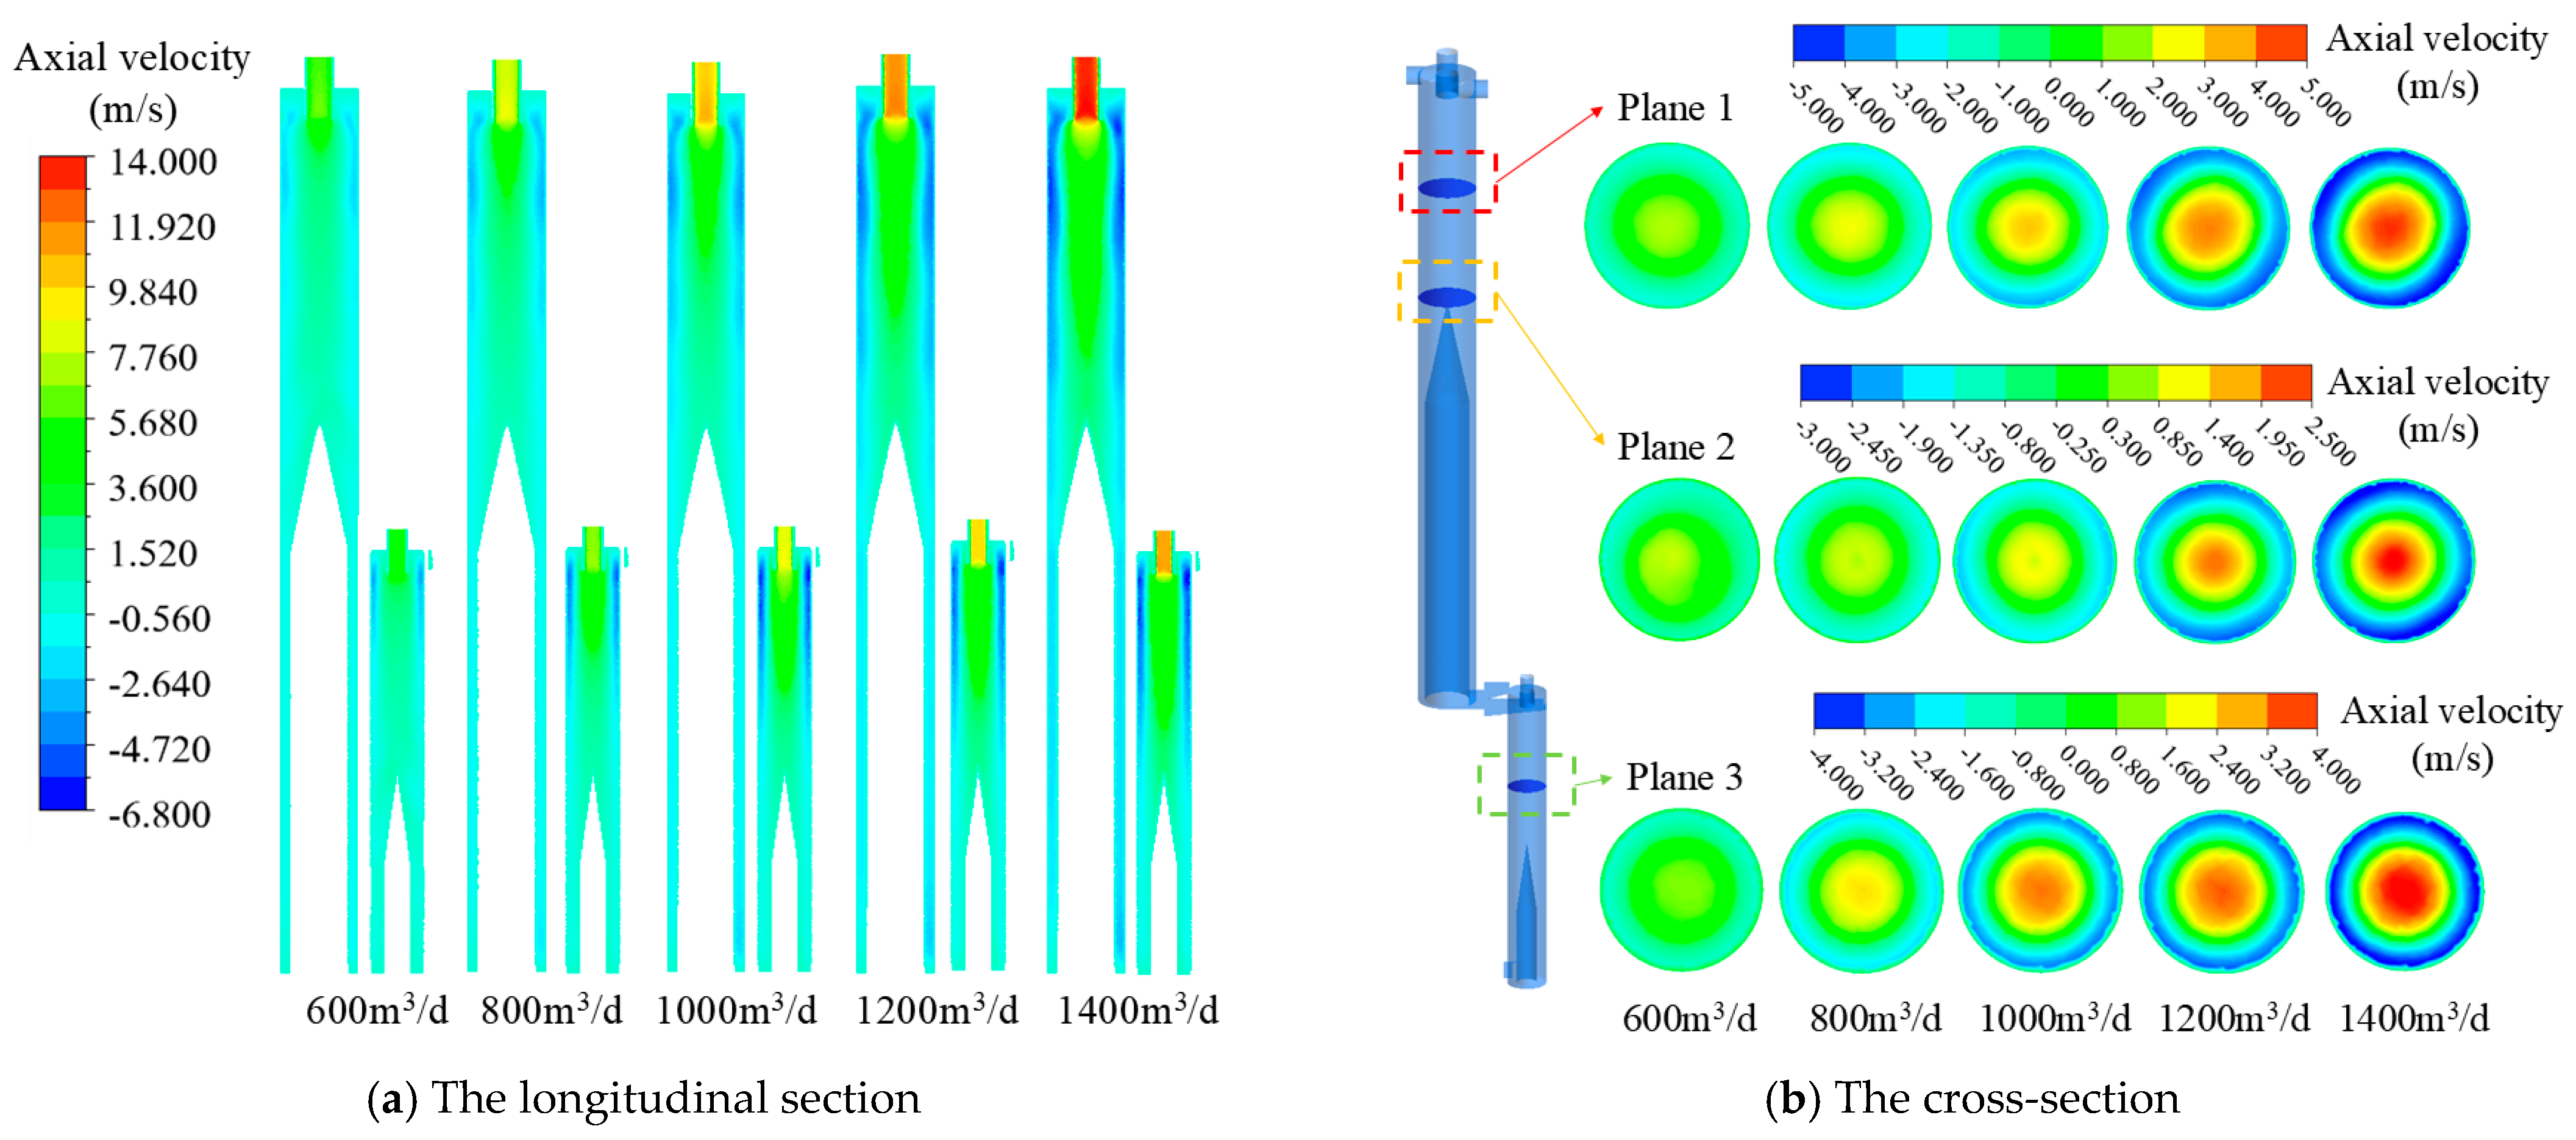
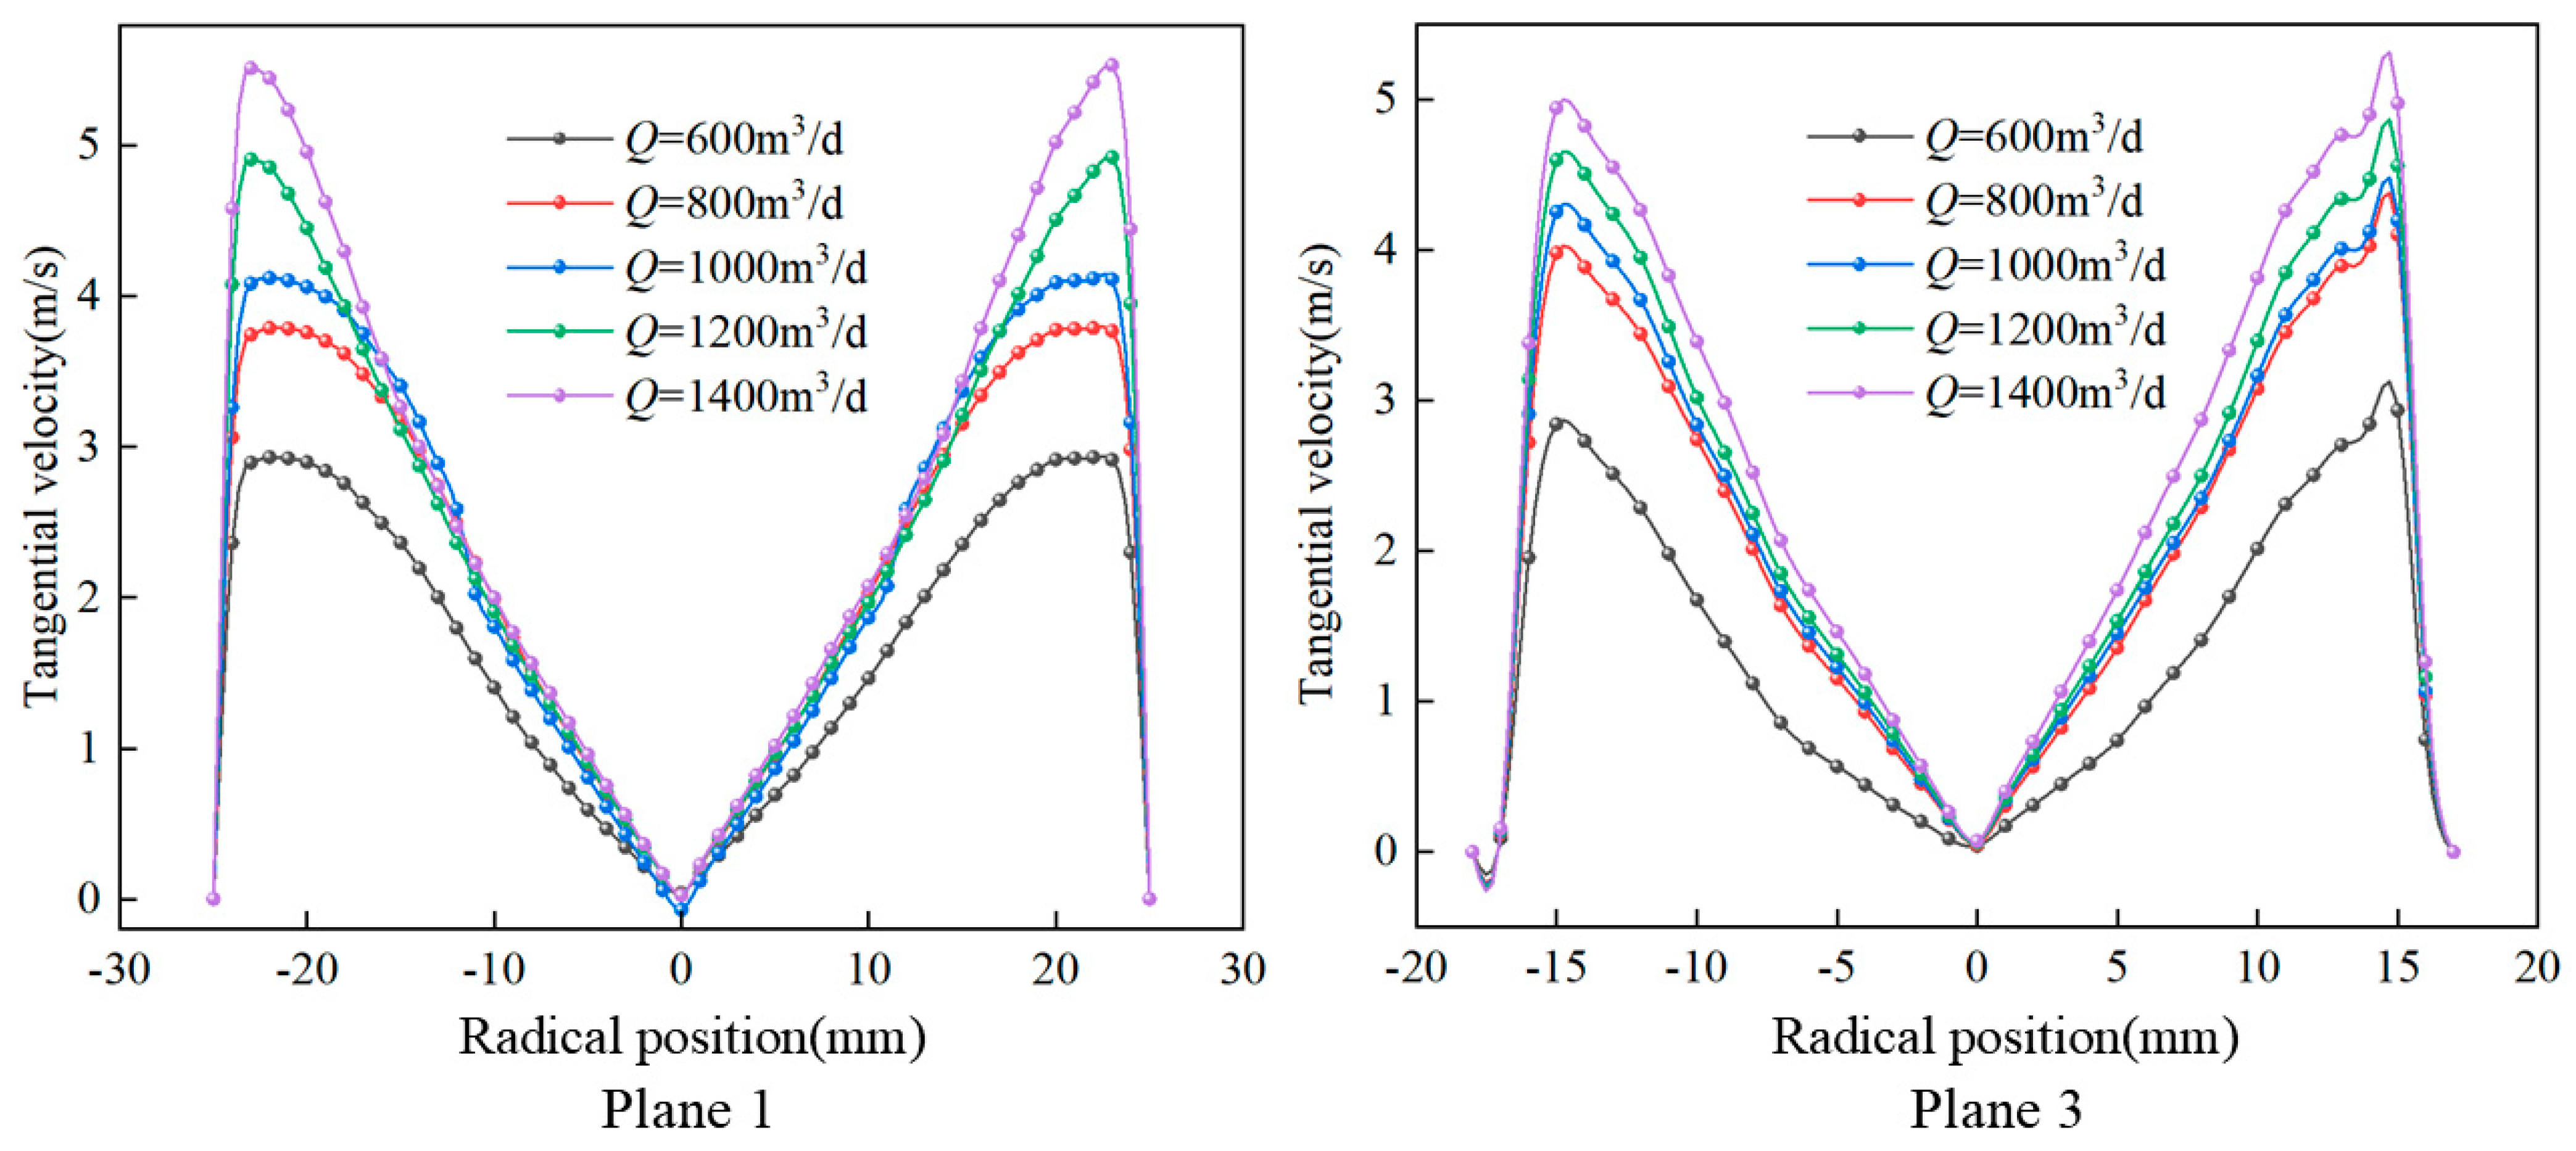
4.2.1. Velocity Field Analysis at Different Inlet Flow Rates

During the study at different inlet flow rates, the liquid concentration was set to be 12%, the primary split ratio to be 60% and the secondary split ratio to be 25%. The distribution of the axial velocity of the gas-liquid separator under different inlet flow rate is shown in Figure 9. Among them, Figure 9a shows the distribution of the axial velocity on the longitudinal section of the center of the gas-liquid separator, and Figure 9b shows the distribution of the axial velocity on different cross-sections of the gas-liquid separator. As can be seen from the Figure 9, the axial velocities in the longitudinal section at different inlet flow rates show an axisymmetric distribution, in which the axial velocities in the area of the overflow reach the maximum value. As the inlet flow rate increases from 600 m3/d to 1400 m3/d, the velocity change in the flow field gradually intensifies, and the velocities along the side wall downward and along the overflow opening of the gas-liquid separator gradually increase. The enhanced effect of this velocity field not only promotes the separation rate of gas-liquid two-phase media in the cyclone cavity, but also enhances the axial transport rate of the media to the overflow and underflow, thus significantly improving the separation performance of the gas-liquid separator.
Figure 9b illustrates the axial velocity distribution characteristics across three distinct cross-sections. As shown in Figure 9b, the axial velocity exhibits significant non-uniform distribution characteristics across different sections, with notable differences in the velocity ranges among the sections. When the inlet flow rate reaches 1000 m3/d, the axial velocity at the axis center of the secondary separator increases significantly. When the flow rate reaches 1200 m3/d, the axial velocity at the axis center of the primary separator shows a marked increase. This phenomenon indicates that there are significant differences in the responses of the two-stage separators to flow rate changes, and the secondary separator exhibits a faster dynamic response characteristic. This difference was explained in the study of Zhou [28], mainly due to the differences in the structural parameters of the two-stage separator: the smaller diameter of the secondary separator makes it more sensitive to the changes in the flow rate in the flow field.
To further analyze the impact of different inlet flows on the velocity field, the tangential velocity distribution characteristics on different cross-sections under different inlet flows are obtained as shown in Figure 10. The results show that the tangential velocity exhibits a typical distribution pattern, increasing radially to a peak value before decreasing. Specifically, the primary separator reaches its tangential velocity peak at a radial distance of 20 mm from the center, while the secondary separator attains its maximum value at 13 mm from the center. As the inlet flow rate increases, the tangential velocity peaks of both separators demonstrate a monotonically increasing trend, consistent with the flow field characteristics of conventional hydrocyclones [29]. It is worth noting that the secondary separator not only has a tangential velocity peak position closer to the center, but also has a more significant velocity gradient, which further explains why it is more sensitive to flow rate changes.

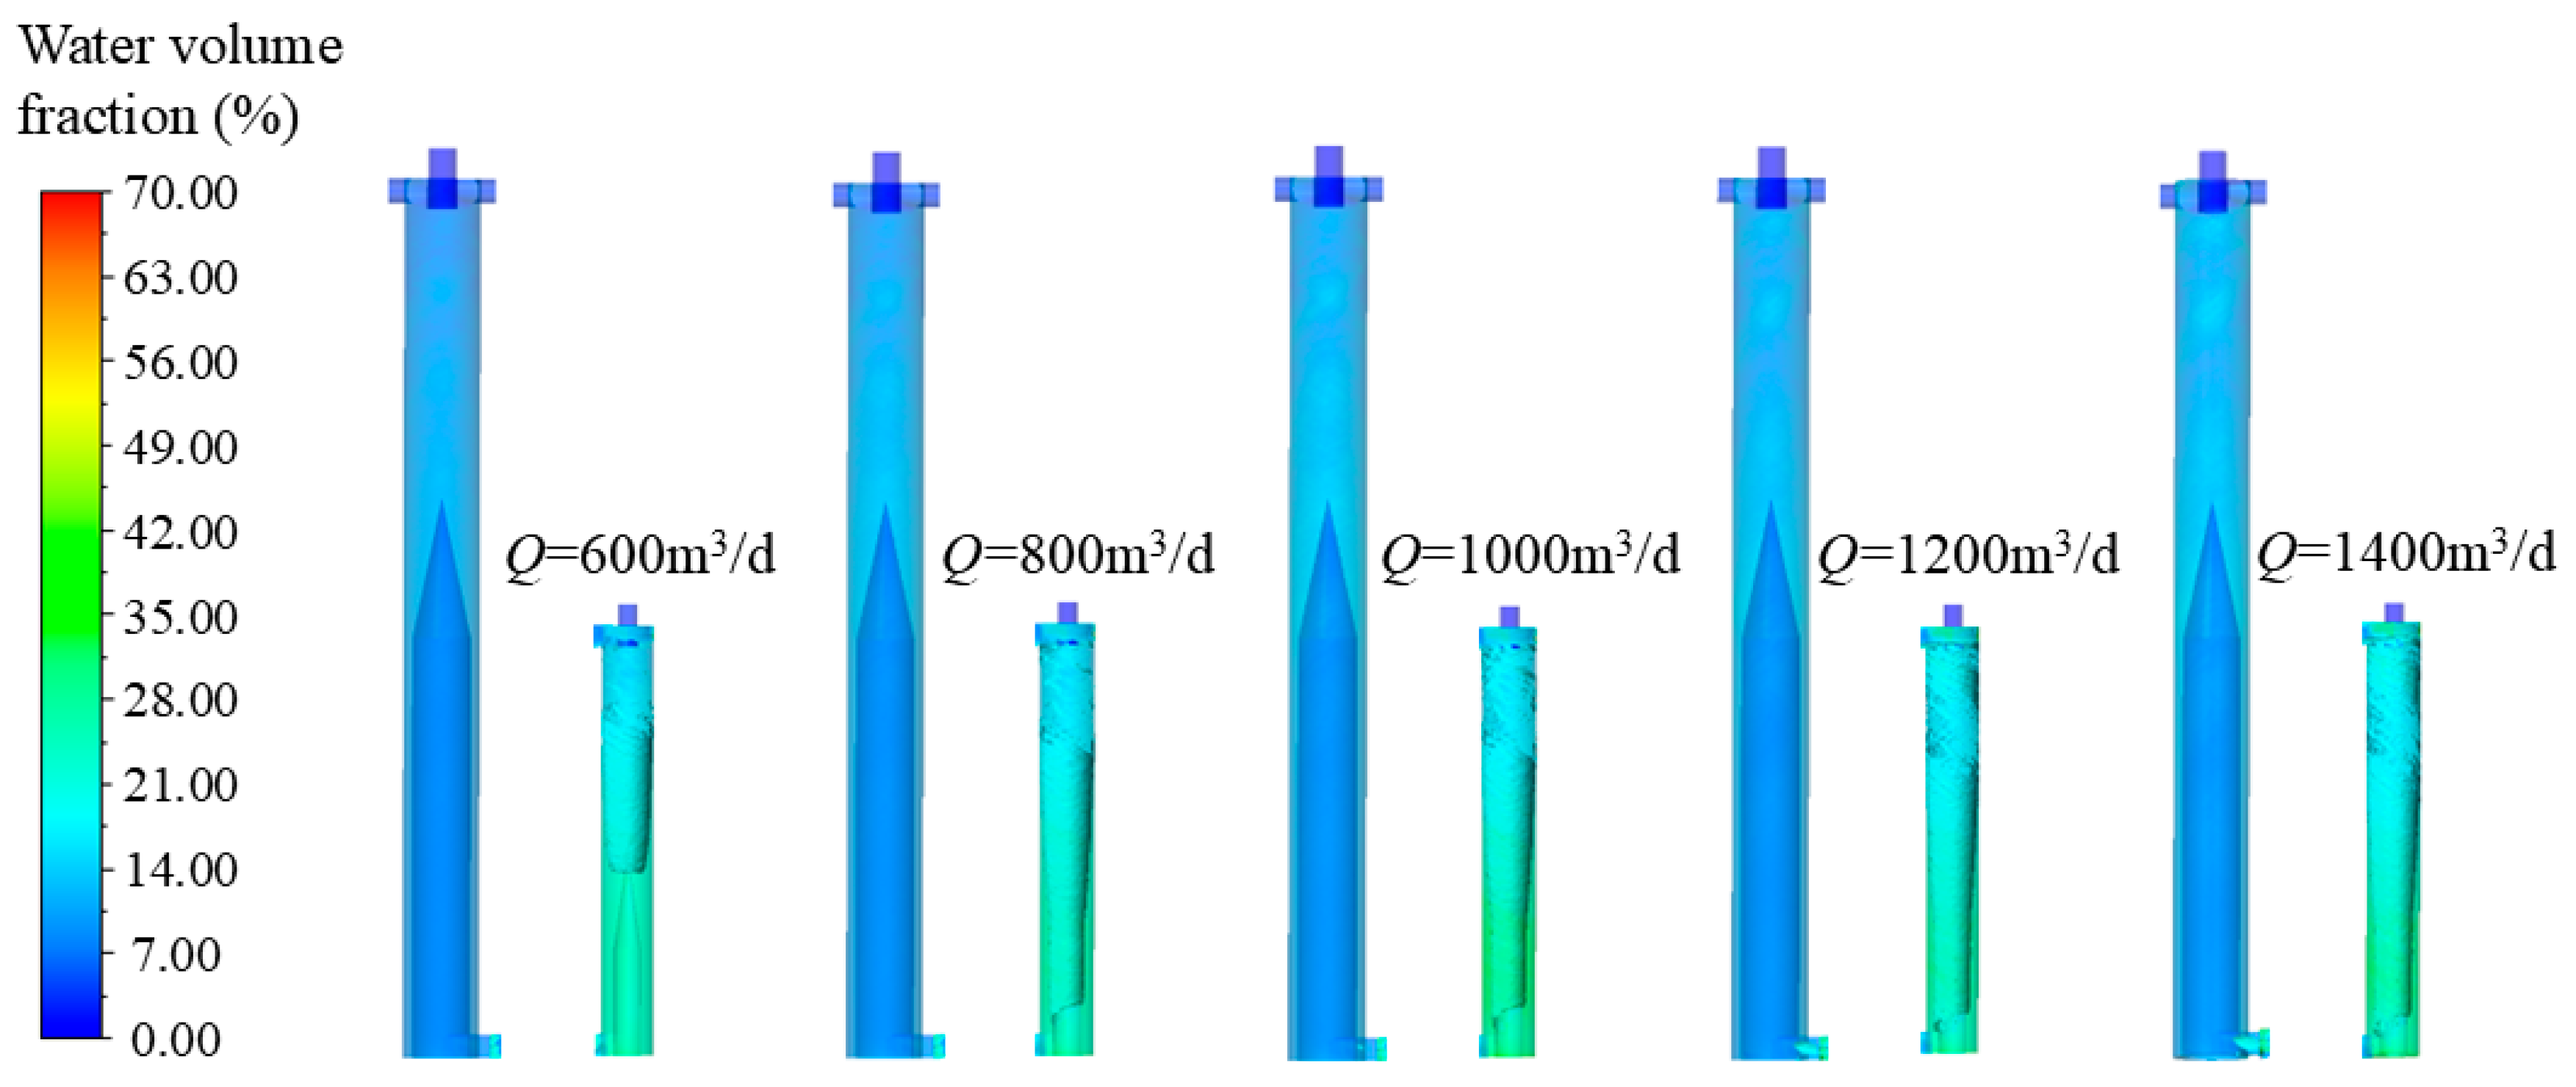
4.2.2. Separation Performance Analysis Under Different Inlet Flow Rates

The influence law of the liquid concentration distribution characteristics of the gas-liquid separator at different inlet flow rates was obtained through numerical simulation. As shown in Figure 11, although the overall liquid phase volume fraction has not changed significantly, the gas-liquid interface with a liquid concentration of 20% gradually expands towards the overflow and underflow areas of the secondary separator as the inlet flow rate increases. This indicates that with the increase of the inlet flow rate, the distribution characteristics of the liquid phase during the gas-liquid separation process have significantly changed. The residence time and movement trajectory of the liquid phase in this secondary separator have become more complex, which may lead to some of the liquid phase cannot be separated in time and effectively, thus affecting the overall gas-liquid separation performance.
The simulation data were analyzed and summarized to obtain the separation performance of the gas–liquid separator under different inlet flow rates, as shown in Figure 12. When the inlet flow rate increases in the range of 600 m3/d to 1400 m3/d, the change of the gas phase separation efficiency is not significant, and the overall liquid phase separation efficiency shows a decreasing trend. This is because, as the inlet flow rate increases, the velocity inside the gas–liquid separator gradually increases. Among them, the increase in axial velocity will decrease the resident time of the two phases in the separator, and the medium to the overflow and underflow outflow speeds up, which leads to the insufficient gas–liquid separation, affecting the liquid phase separation efficiency.

4.3. Effect of Split Ratio on Flow Field Characteristics

The overflow split ratio, defined as the volumetric flux ratio between the overflow stream and feed inlet, serves as a critical operational parameter for evaluating gas–liquid separation performance [30]. Given that the gas–liquid separator designed in this study consists of two tangentially inlet cyclones connected in series, the overflow split ratio is accordingly divided into primary overflow split ratio (F1) and secondary overflow split ratio (F2). This study focuses on investigating the impact of varying the primary overflow split ratio on the flow field characteristics of the gas–liquid separator, while maintaining a fixed underflow split ratio of 15%, a liquid concentration of 12%, and an inlet flow rate of 1200 m3/d.

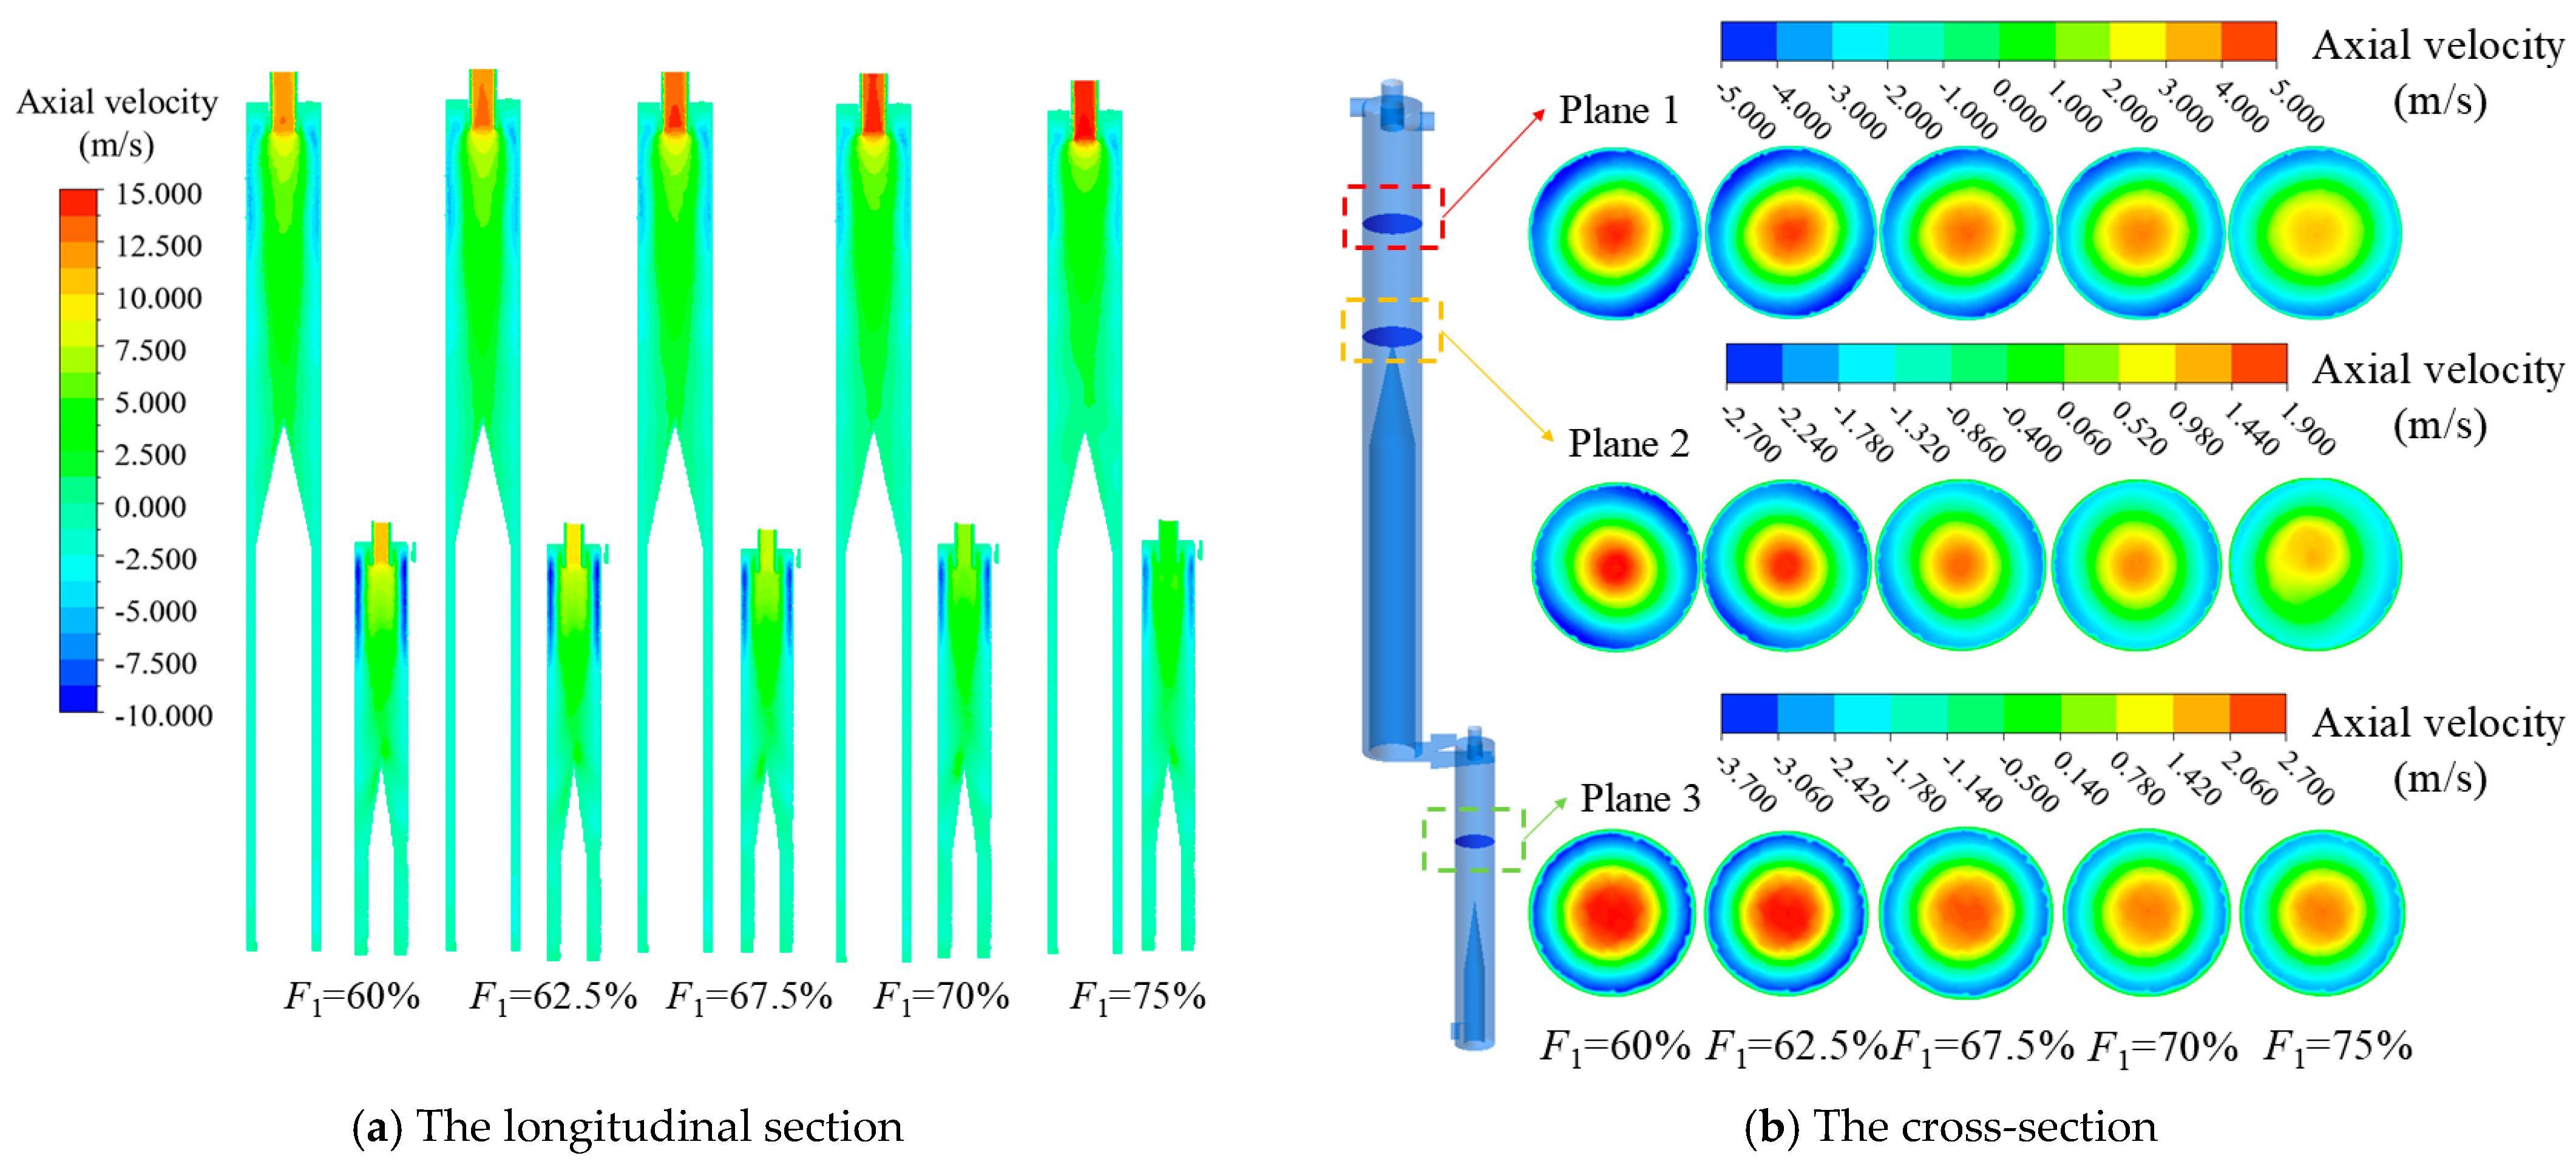
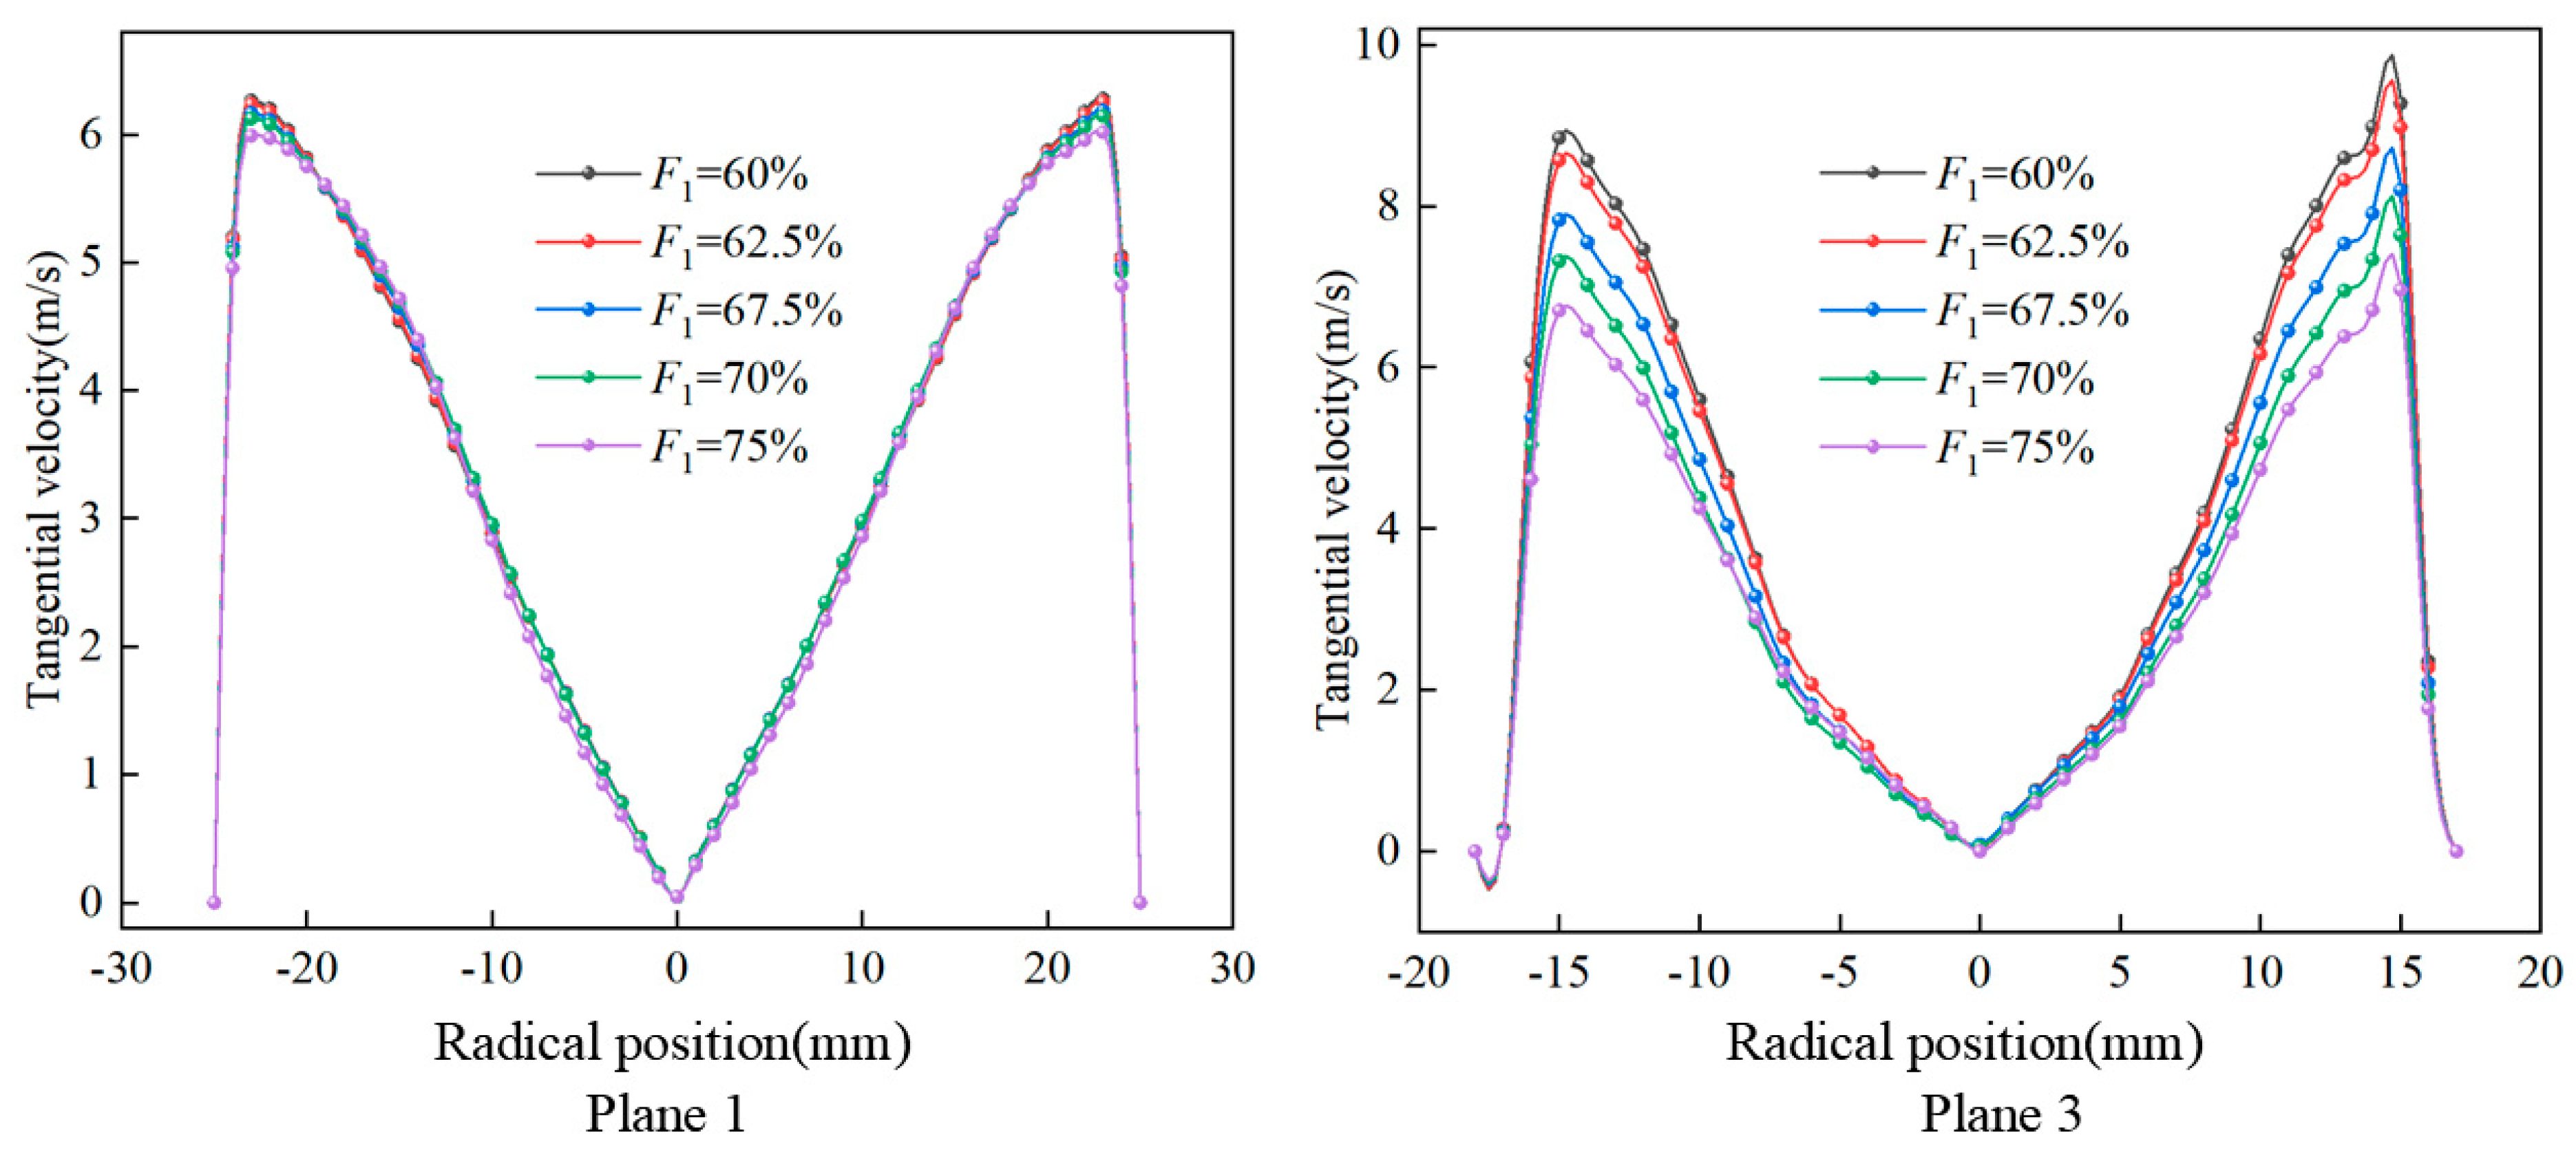
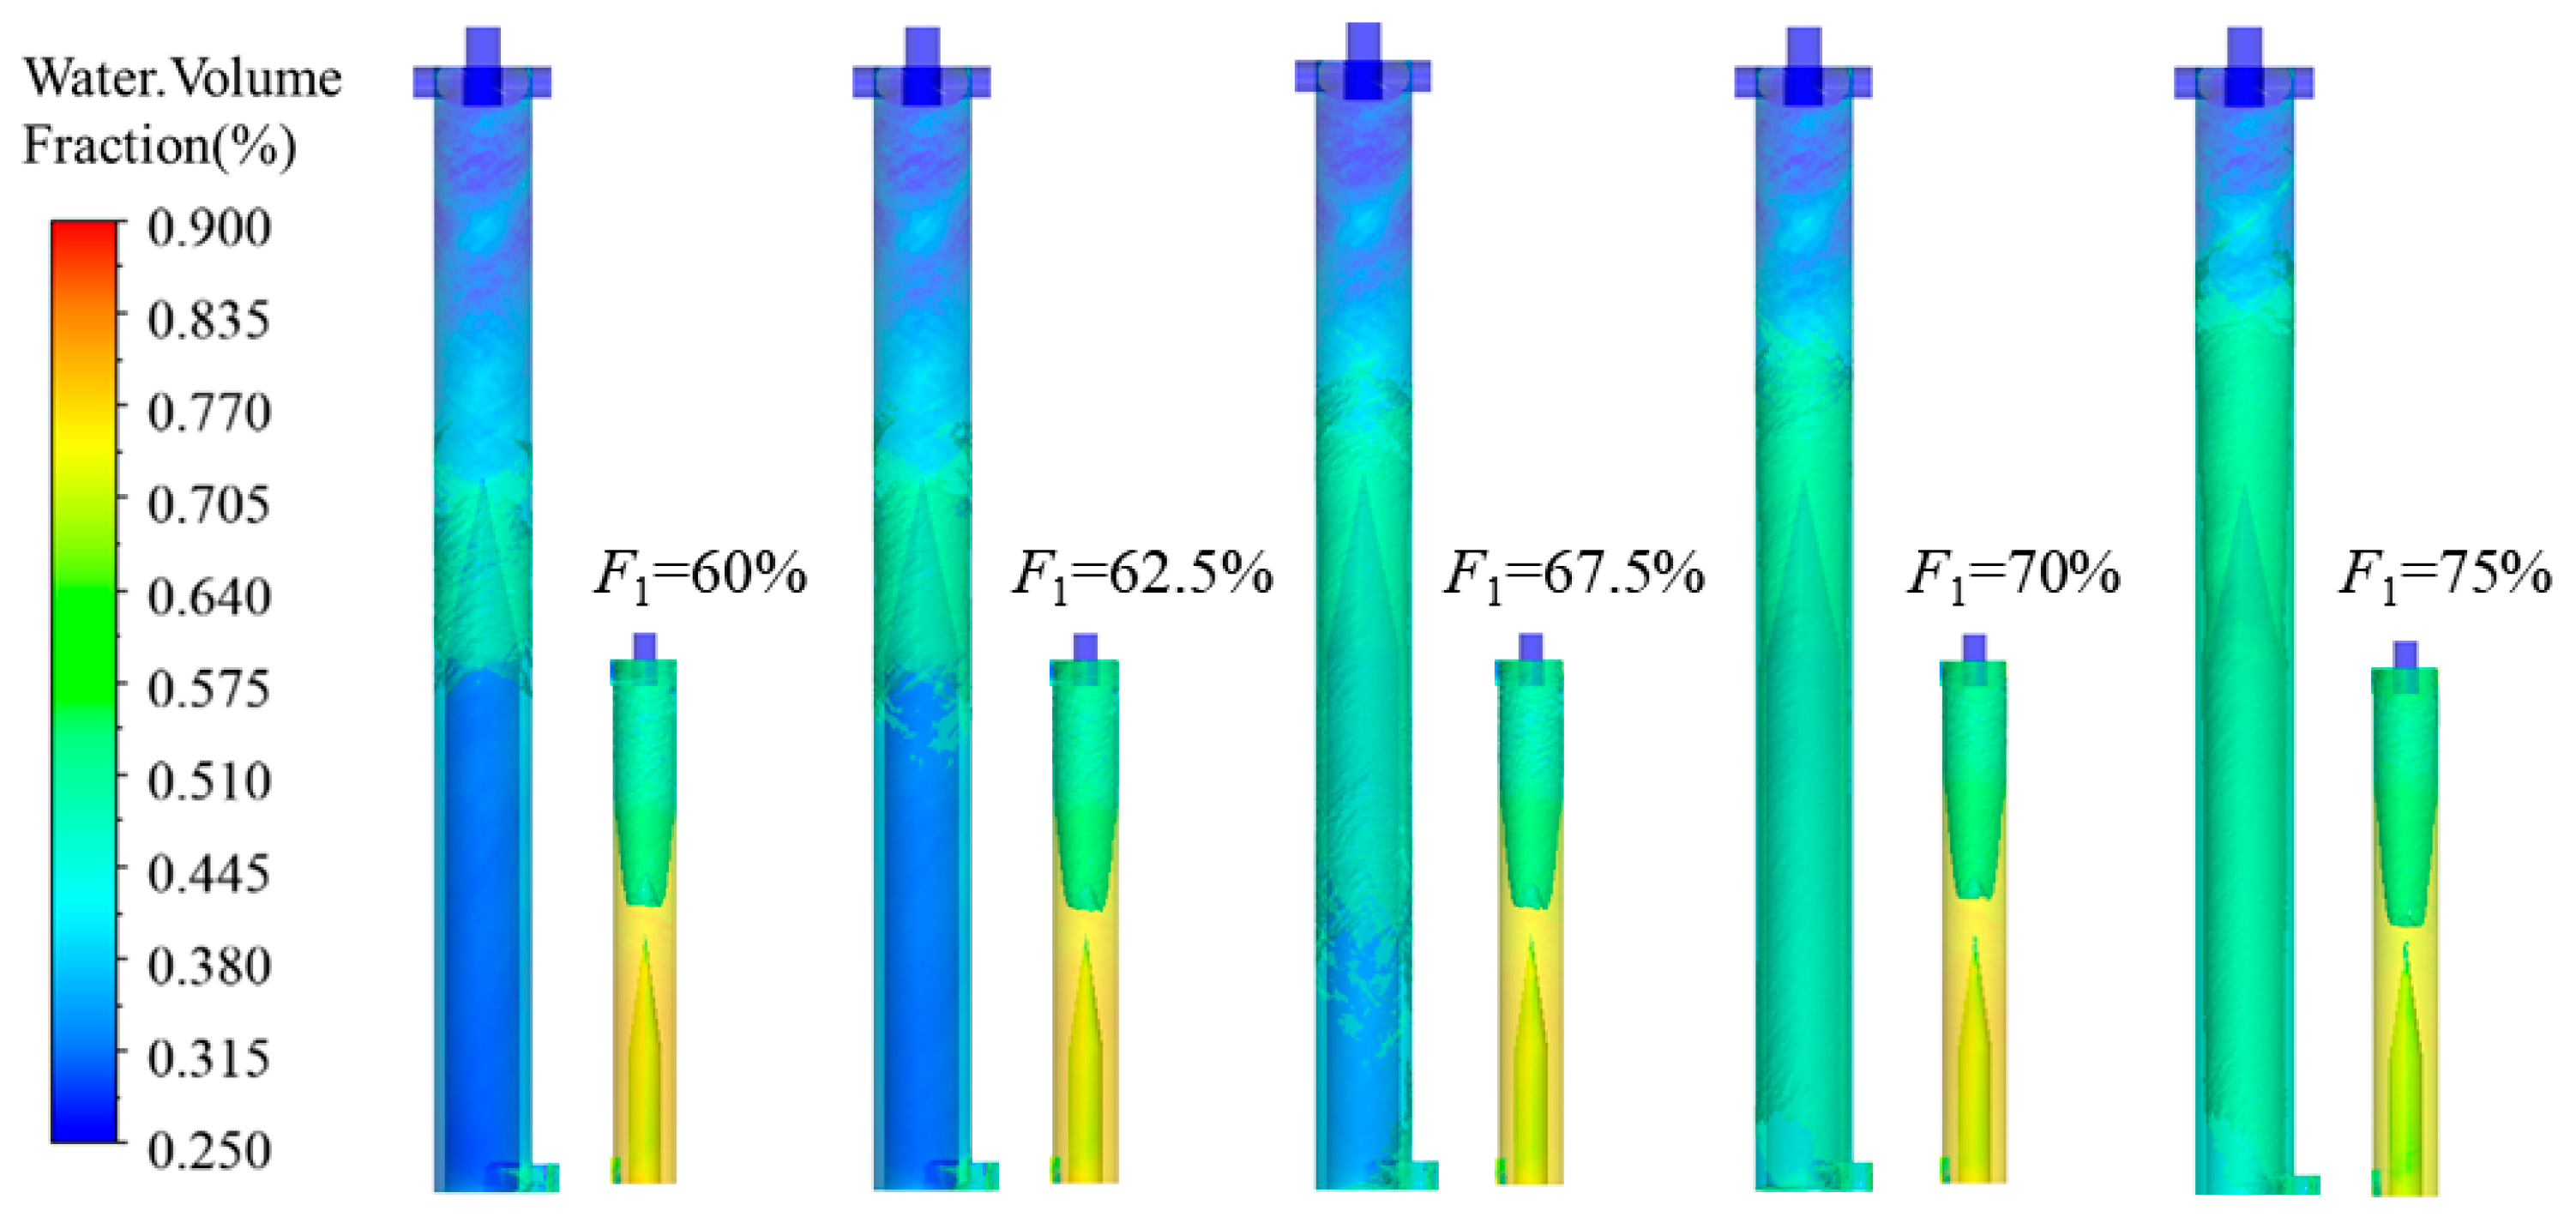
4.3.1. Velocity Field Analysis at Different Primary Overflow Split Ratios

The simulation reveals the influence of different primary overflow split ratios on the axial velocity distribution characteristics within the gas–liquid separator, as shown in Figure 13. The results indicate that, under various primary overflow split ratio conditions, the axial velocity field consistently maintains an axisymmetric distribution pattern, with the maximum velocity consistently occurring in the overflow outlet region. As the primary overflow split ratio gradually increases, the axial velocity within the primary separator exhibits significant variation patterns: the axial velocity in the overflow outlet region continuously rises, while the area with axial velocity exceeding 7.5 m/s progressively diminishes towards the overflow outlet. Simultaneously, the velocity gradient at Plane 1 and Plane 2 decreases with increasing primary overflow split ratios, resulting in a more uniform axial velocity distribution. This is because, with the gradual increase in the primary overflow split ratio, the flow rate at the primary overflow gradually rises, the velocity of the medium near the primary overflow gradually increases, and the residence time of the medium in the cyclone cavity decreases, so that it can flow out of the overflow more quickly. The velocity gradient of the side wall near the secondary overflow decreases with the increase in the primary overflow split ratio, which indicates that the increase in the primary overflow split ratio can reduce the complexity of the flow field in the secondary separator, which is conducive to the deposition of the liquid phase in the secondary separator. Therefore, by reasonably setting the primary overflow split ratio, the gas–liquid separator can not only ensure that the gas flows out of the primary separator rapidly, but also create a more stable deposition environment for the separated liquid phase.
The distribution of tangential velocity on the cross-section of Plane 1 and Plane 3 is obtained by simulation. As shown in Figure 14, with the continuous increase in the primary overflow split ratio, the distribution laws of the tangential velocities on the two cross-sections are the same, both showing a trend of first increasing and then decreasing. The maximum tangential velocity within the primary separator occurs about 20 mm from the center, and the maximum tangential velocity within the secondary separator occurs about 13 mm from the center. However, the tangential velocity change on the Plane 1 section is not obvious, while the tangential velocity change on the Plane 3 section is relatively obvious. Moreover, with the increase in the primary overflow split ratio, the maximum tangential velocity in the secondary separator continuously decreases. This is because the increase in the primary overflow split ratio directly reduces the medium flux entering the secondary separator, and the flow conditions at the inlet of the secondary separator have been changed. It can be seen that the change of the primary overflow split ratio will have a certain impact on the flow field characteristics of the secondary separator, and thus, in the practical operation, it is essential to maintain the primary overflow split ratio within an optimized control range. This ensures both efficient gas separation in the primary separator and stable liquid phase deposition in the secondary separator, ultimately achieving an optimal balance in overall separation performance.

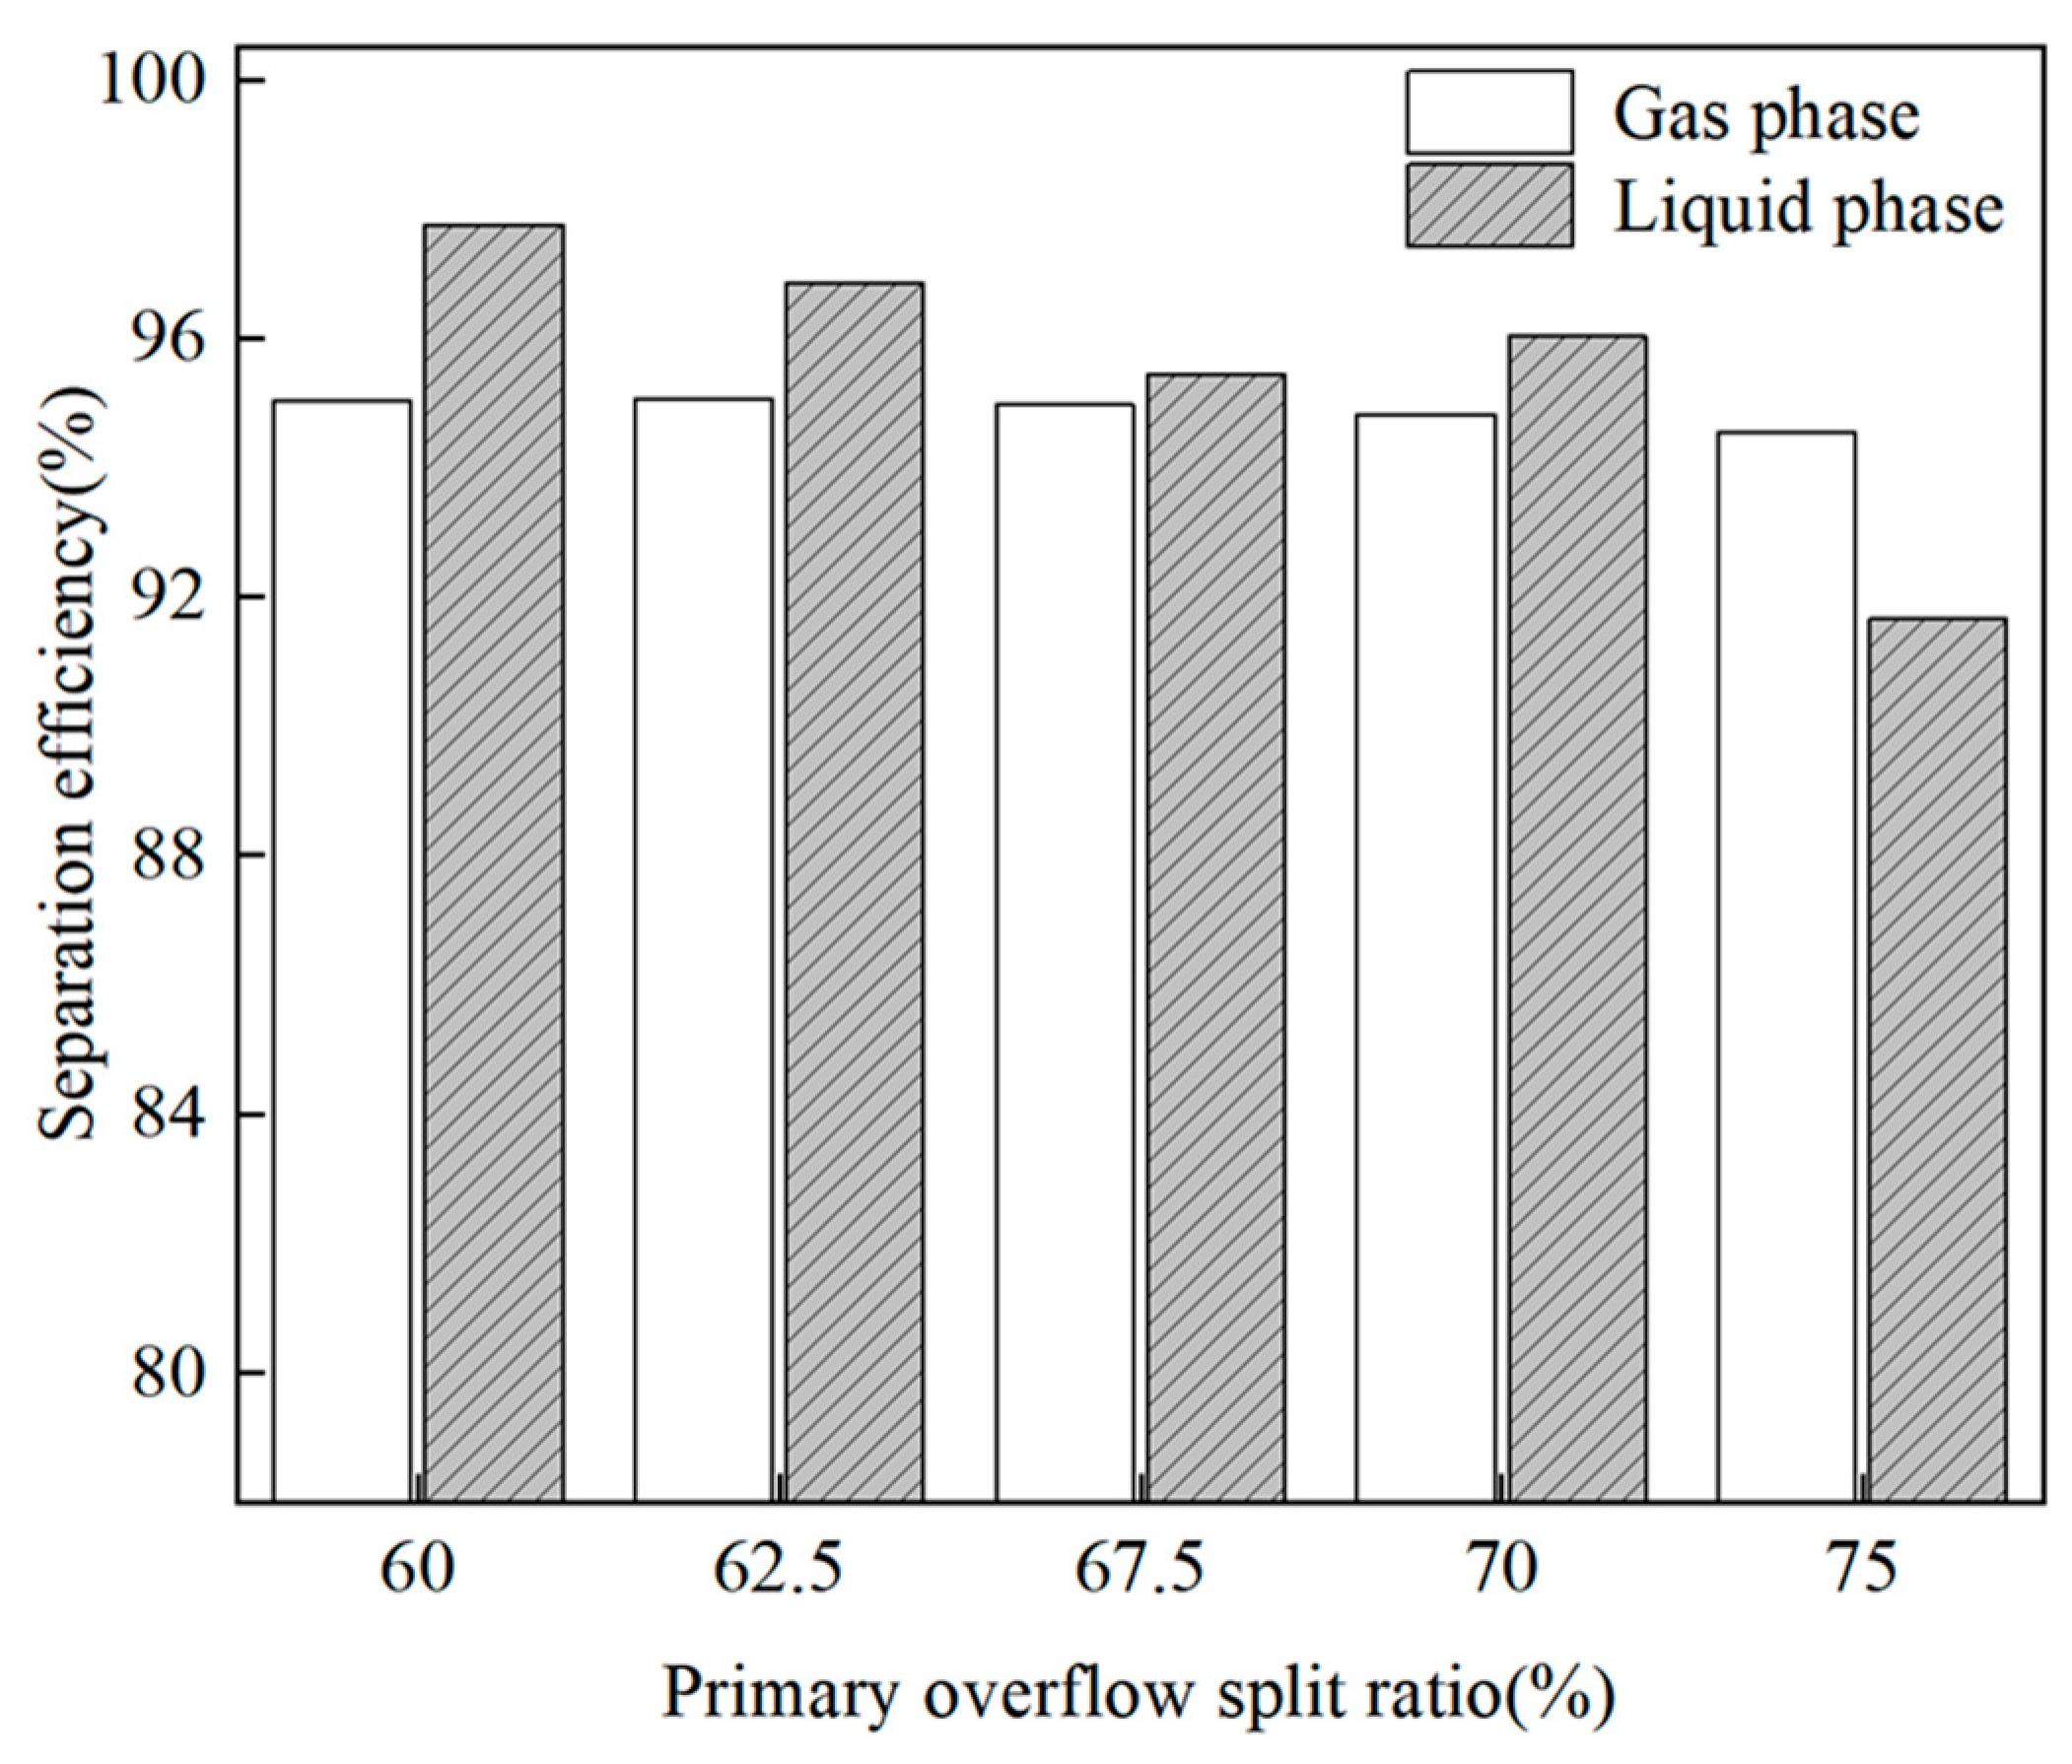
4.3.2. Separation Performance Analysis Under Different Primary Overflow Split Ratios

Numerical simulation reveals the influence of different inlet flow rates on the liquid concentration distribution characteristics within the gas–liquid separator, as shown in Figure 15. The results indicate that, as the primary overflow split ratio gradually increases, the 40% liquid concentration gas–liquid interface in the primary separator expands progressively from the cyclone chamber center towards both the overflow and underflow outlets. In contrast, no significant changes are observed in the 40% liquid concentration gas–liquid interface within the secondary separator. This indicates that the primary and secondary separators exhibit different sensitivities to variations in the primary overflow split ratio. Due to the increase in the primary overflow split ratio, more medium will flow out from the primary overflow outlet, causing the gas–liquid interface with a liquid concentration of 40% to gradually expand in the primary separator, while the concentration of the liquid phase deposited in the secondary separator gradually decreases. When the primary overflow split ratio reaches 75%, a portion of the liquid phase enters the primary separator, which will reduce the separation efficiency of the liquid phase. Therefore, in the actual operation and running of it, it is necessary to reasonably control the regulation range of the primary overflow split ratio.
The analysis and summary for the simulation data can obtained from the separation performance of the gas–liquid separator under different inlet flow rates, as shown in Figure 16. As can be seen from the figure, when the primary overflow split ratio increases from 60% to 75%, the gas separation efficiency remains stable at approximately 95%, and the liquid separation efficiency shows an overall downward trend. This is because, under the combined action between the cyclonic and gravitational fields, the majority of the gas exits through both the primary and secondary overflow outlets. Adjusting the primary overflow split ratio causes liquid to enter the primary separator, which reduces the gas volume exiting through the secondary overflow outlet. However, gas still effectively separates through the primary overflow outlet. As the primary overflow split ratio increases, the liquid phase gradually migrates upwards into the primary separator, resulting in a portion of the liquid exit through the secondary overflow outlet. This migration is the primary reason for the decline in liquid separation efficiency.

4.4. Operating Parameter Optimization Based on Response Surface Method

4.4.1. Optimization Design Based on Box–Behnken Response Surface Method

To achieve efficient gas–liquid separation and determine the regulated law of the underflow split ratio under different operating conditions—thereby ensuring the stability and accuracy of subsequent oilfield measurement devices—a Box–Behnken response surface method (BBD) optimization design was conducted. The gas phase separation efficiency (y) was selected as the response variable, while the inlet flow rate (x1), underflow split ratio (x2), and liquid concentration (x3) were chosen as the influential factors. Based on actual operating parameters from oilfields, the high and low level of these influencing factors were determined as shown in Table 2.
Based on the factor levels specified in Table 2, a total of 17 experimental runs were designed, as shown in Table 3, including 5 replicated center-point experiments. Using the gas separation efficiency (y) data from these 17 runs (as presented in Table 3), a second-order polynomial regression model was developed. Through multiple linear regression analysis, the following regression Equation (6) was established to describe the relationship between the independent variables (inlet flow rate x1, underflow split ratio x2, and liquid concentration x3) and the response variable (gas separation efficiency y):
y = 95.08472 + 0.007003 x 1 0.531000 x 2 + 0.112685 x 3 0.000033 x 1 x 2 + 0.000298 x 1 x 3 + 0.058667 x 2 x 3 3.32716 × 10 6 x 1 2 0.028650 x 2 2 0.035247 x 3 2
To validate the significance of the regression equation and evaluate its predictive accuracy, an Analysis of Variance (ANOVA) was conducted. The results are presented in Table 4. The F value is a statistic used to determine whether the type is associated with the response target. The p-value represents the probability of differences between samples caused by sampling errors. The larger the F value and the smaller the p-value, the more significant the constructed mathematical model is [31]. The p-value of the model is less than 0.0001, which is significantly below the 0.05 threshold, indicating statistical significance. That is, the functional relationships between the three operating parameters and the gas phase separation efficiency are all significant, and the regression equation within the range demonstrated in Table 2 can predict the gas phase separation efficiency under different operating parameter conditions.
To verify the feasibility of the test results, an error statistical analysis of the regression equation was carried out, and the error statistical analysis results as shown in Table 5 were obtained. Among them, the correlation coefficient R-Squared of the regression equation was 0.9939, close to 1, indicating a good correlation. The larger and closer the values of Adj. R-Squared and Pred. R-Squared of the model are, the better the correlation between the independent variable and the dependent variable is. The coefficient of the variation C.V. of the model is 0.3904%, which is less than 10%, indicating that the mathematical model has high accuracy and credibility. From this, it can be judged that the regression mathematical model between each influence factor and the response factor fitted by using BBD response surface design has good applicability and accuracy within the range of each factor.

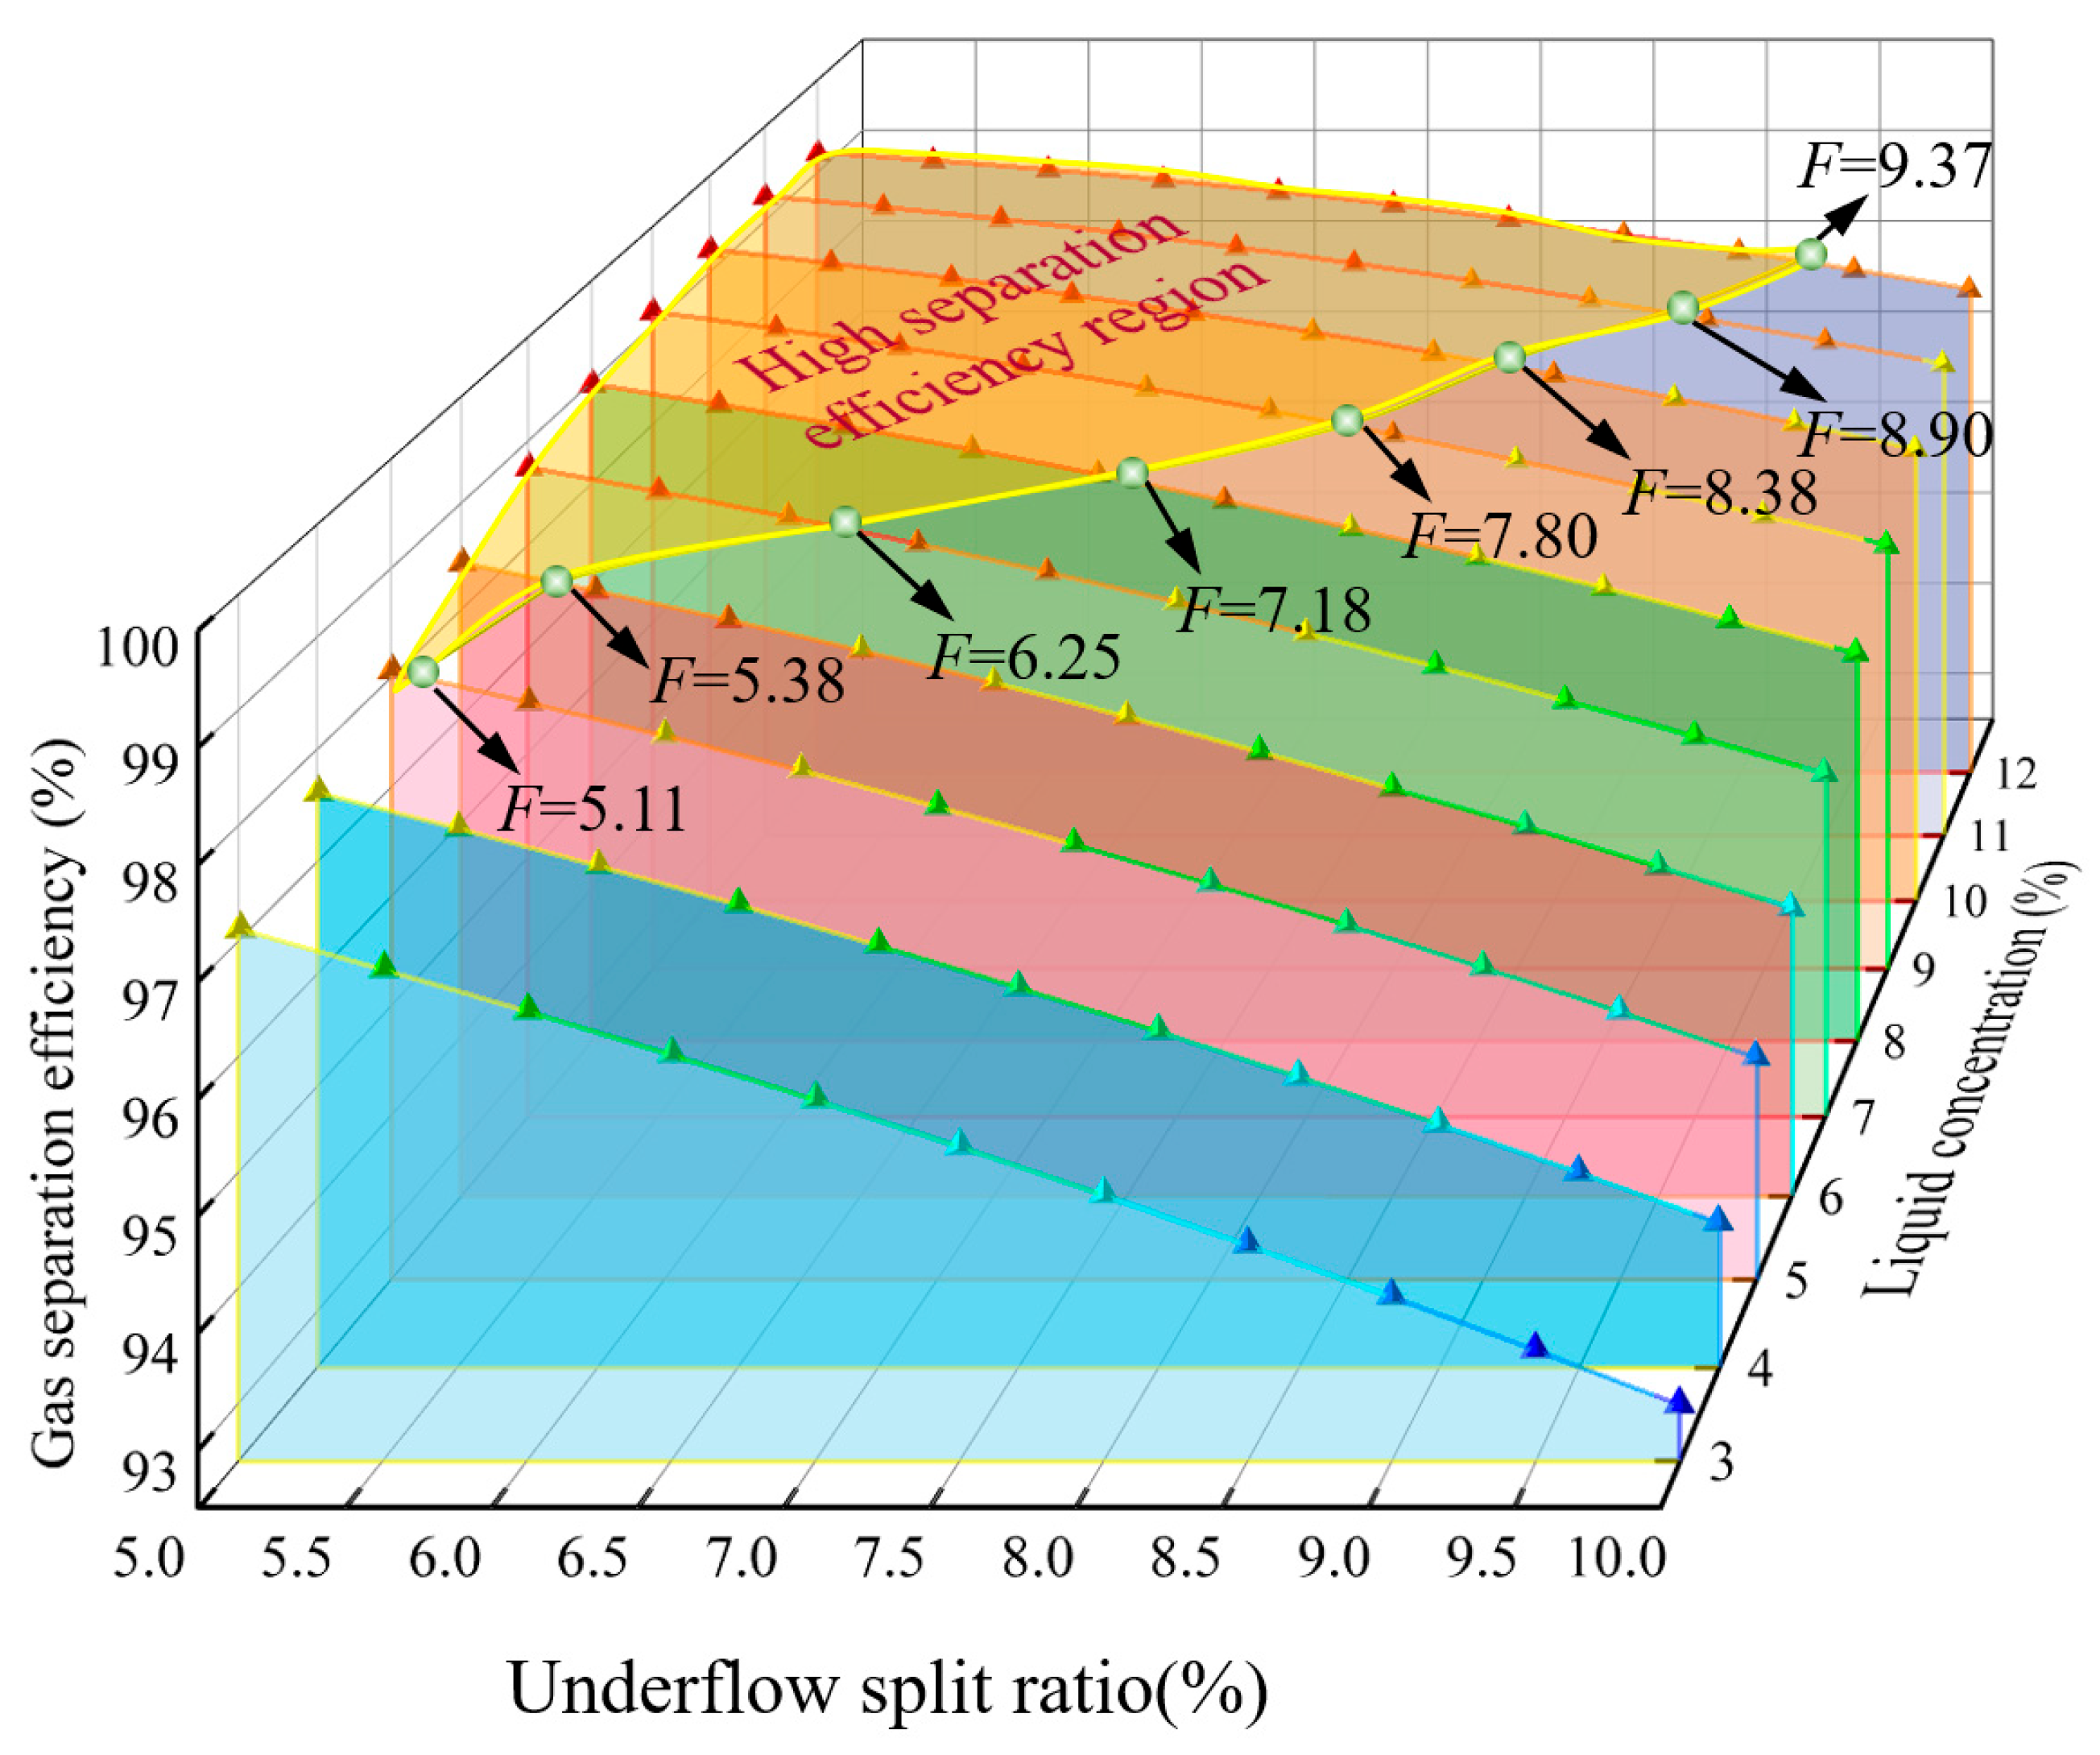
4.4.2. The Regulation Law Analysis of the Underflow Under Different Operating Parameters

Based on the parameter range shown in Table 2, under a fixed inlet flow rate of 1200 m3/d, the optimal control scheme for the underflow split ratio, to achieve the maximum separation efficiency under varying liquid concentration conditions, is analyzed. The schematic diagram of the distribution law between the underflow split ratio and the separation efficiency under different liquid concentrations as shown in Figure 17 is obtained. When the liquid concentration increases from 3% to 12%, the gas phase separation efficiency decreases with the increase in the underflow split ratio. Taking the gas phase separation efficiency of 98% as the target value, the split ratio of the underflow corresponding to different liquid concentrations is shown in Figure 17. Under liquid concentration conditions ranging from 5% to 12%, the gas phase separation efficiency consistently exceeds 98% when the underflow split ratio F is maintained below 5.11%, 5.38%, 6.25%, 7.18%, 7.80%, 8.38%, 8.90%, and 9.37%. When the liquid concentration is less than 5%, the gas phase separation efficiency is all lower than 98%, indicating that, within the specified range of the underflow split ratio, efficient gas separation cannot be achieved by adjusting the underflow split ratio. This is because a lower liquid concentration means a higher gas concentration, and some of the gas will flow out from the underflow, resulting in a reduced gas–liquid separation effect. Therefore, in actual operation, a smaller underflow split ratio parameter, that is, less than 5%, needs to be adopted to achieve gas–liquid separation under a low liquid concentration.
Based on the parameter range shown in Table 2, under the fixed liquid concentration of 12%, the analysis of the regulation scheme for the optimal underflow split ratio that can achieve the maximum separation efficiency under different inlet flow rates is carried out. The schematic diagram of the distribution law between the underflow diversion ratio and the separation efficiency under different inlet flow rates as shown in Figure 18 is obtained. When the inlet flow rate increases from 600 m3/d to 1500 m3/d, the gas separation efficiency decreases with the increase in the underflow split ratio. Taking the gas phase separation efficiency of 98% as the target value, the underflow port diversion corresponding to different inlet flow rates is shown in Figure 18. When the inlet flow rate is greater than 1300 m3/h, the gas separation efficiency is all greater than 98%. When the inlet flow rate is 900 m3/d−1300 m3/d, and the split ratio of the underflow F is less than 6.08%, 7.67%, 8.68%, 9.37%, and 9.83%, respectively, the gas separation efficiency is all above 98%. When the inlet flow rate is less than 900 m3/d, the gas separation efficiency is all less than 98%. This indicates that if the inlet flow rate is small, within the specified range of the underflow split ratio, it is impossible to achieve efficient separation of the gas by adjusting the underflow split ratio. Therefore, in actual operation, a smaller underflow split ratio parameter, that is, less than 5%, needs to be adopted to achieve gas–liquid separation at a low liquid concentration.

5. Conclusions

This paper proposed a CTGLS suitable for wellheads. Utilizing numerical simulations and experimental methods, the gas–liquid separation process under wellhead operating conditions was simulated to analyze the influence of various operating parameters on flow field characteristics and separation performance. Furthermore, the response surface method was employed to investigate regulatory strategy for the underflow split ratio under different working conditions. The following conclusions were drawn:
(1)
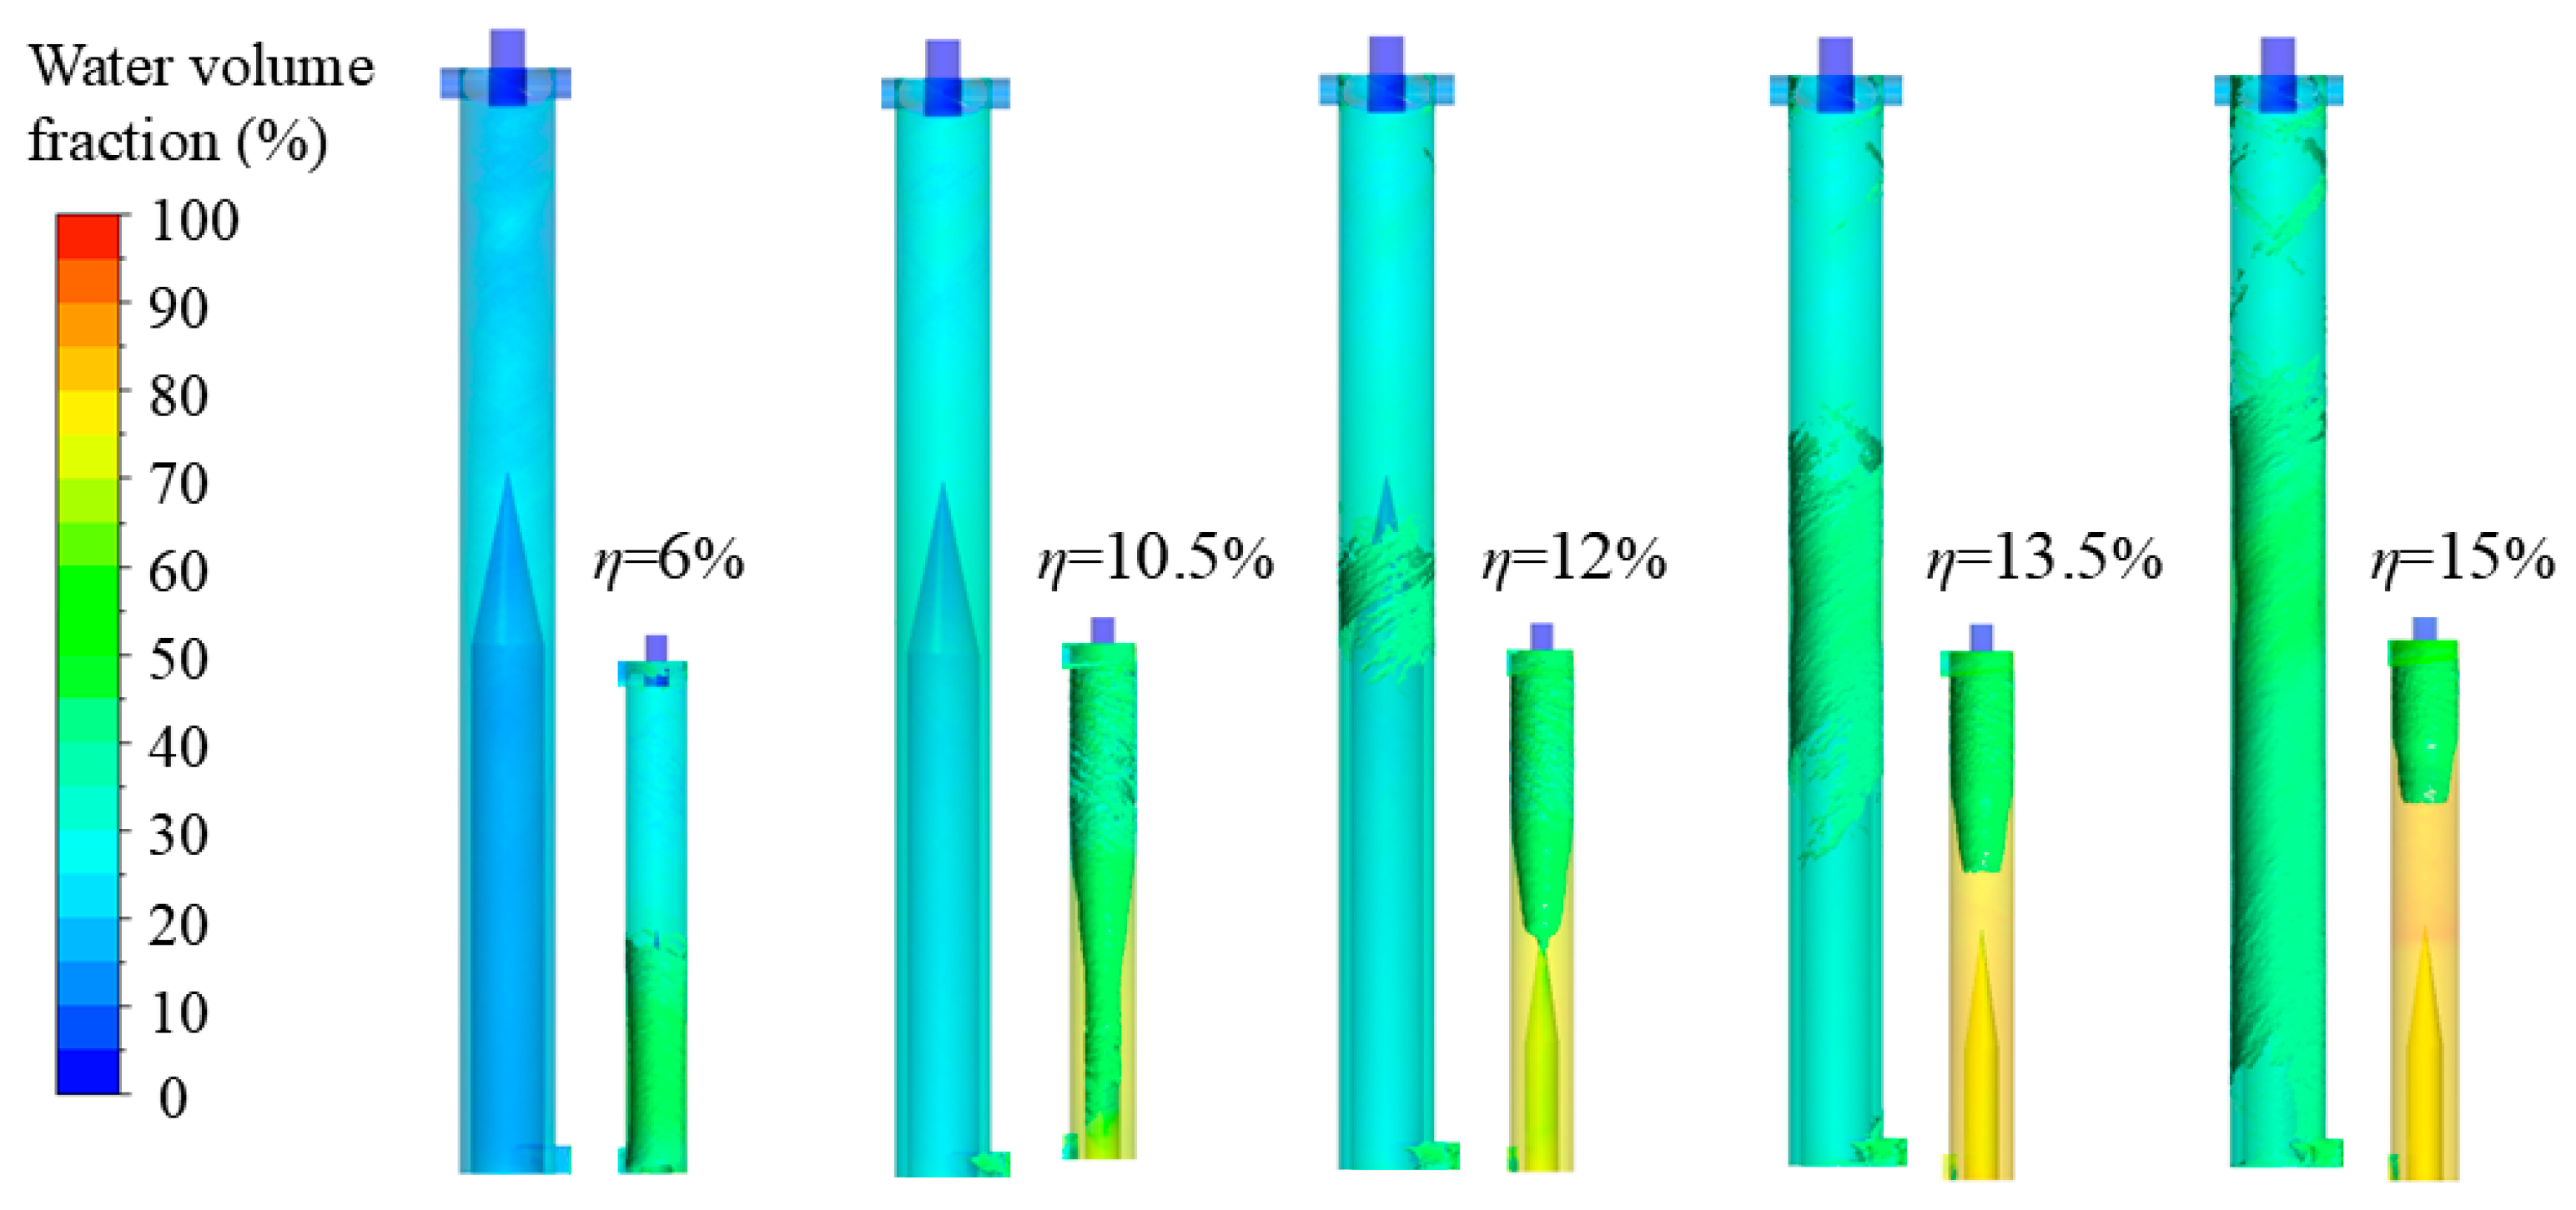
Taking the axial velocity and liquid concentration as indicators for analyzing flow field characteristics, the flow field characteristics of the CTGLS were analyzed using the single-factor method under various operating parameters. The increase in liquid concentration has no significant impact on the axial velocity of the gas–liquid separator as a whole, with localized fluctuations only in the underflow region of the secondary separator. With the increase in the inlet flow rate and the primary overflow split ratio, the axial velocity at the overflow gradually increases, the velocity gradient gradually increases, and the morphology of the gas–liquid interface changes significantly with the increase in the liquid concentration and the inlet flow rate.
(2)
Using mass separation efficiency as the evaluation index for separation performance, the separation performance analysis of the CTGLS under different operating parameters was conducted. As the liquid concentration, inlet flow rate, and primary overflow split ratio increased, the liquid separation efficiency exhibited a consistently decreasing trend. Among them, the liquid separation efficiency shows the maximum decline of 16.41% within the liquid concentration range of 4.5% to 15%. The gas separation efficiency only shows a significant upward trend with the increase in the liquid concentration, peaking at 96.71% when the liquid concentration reaches 15%.
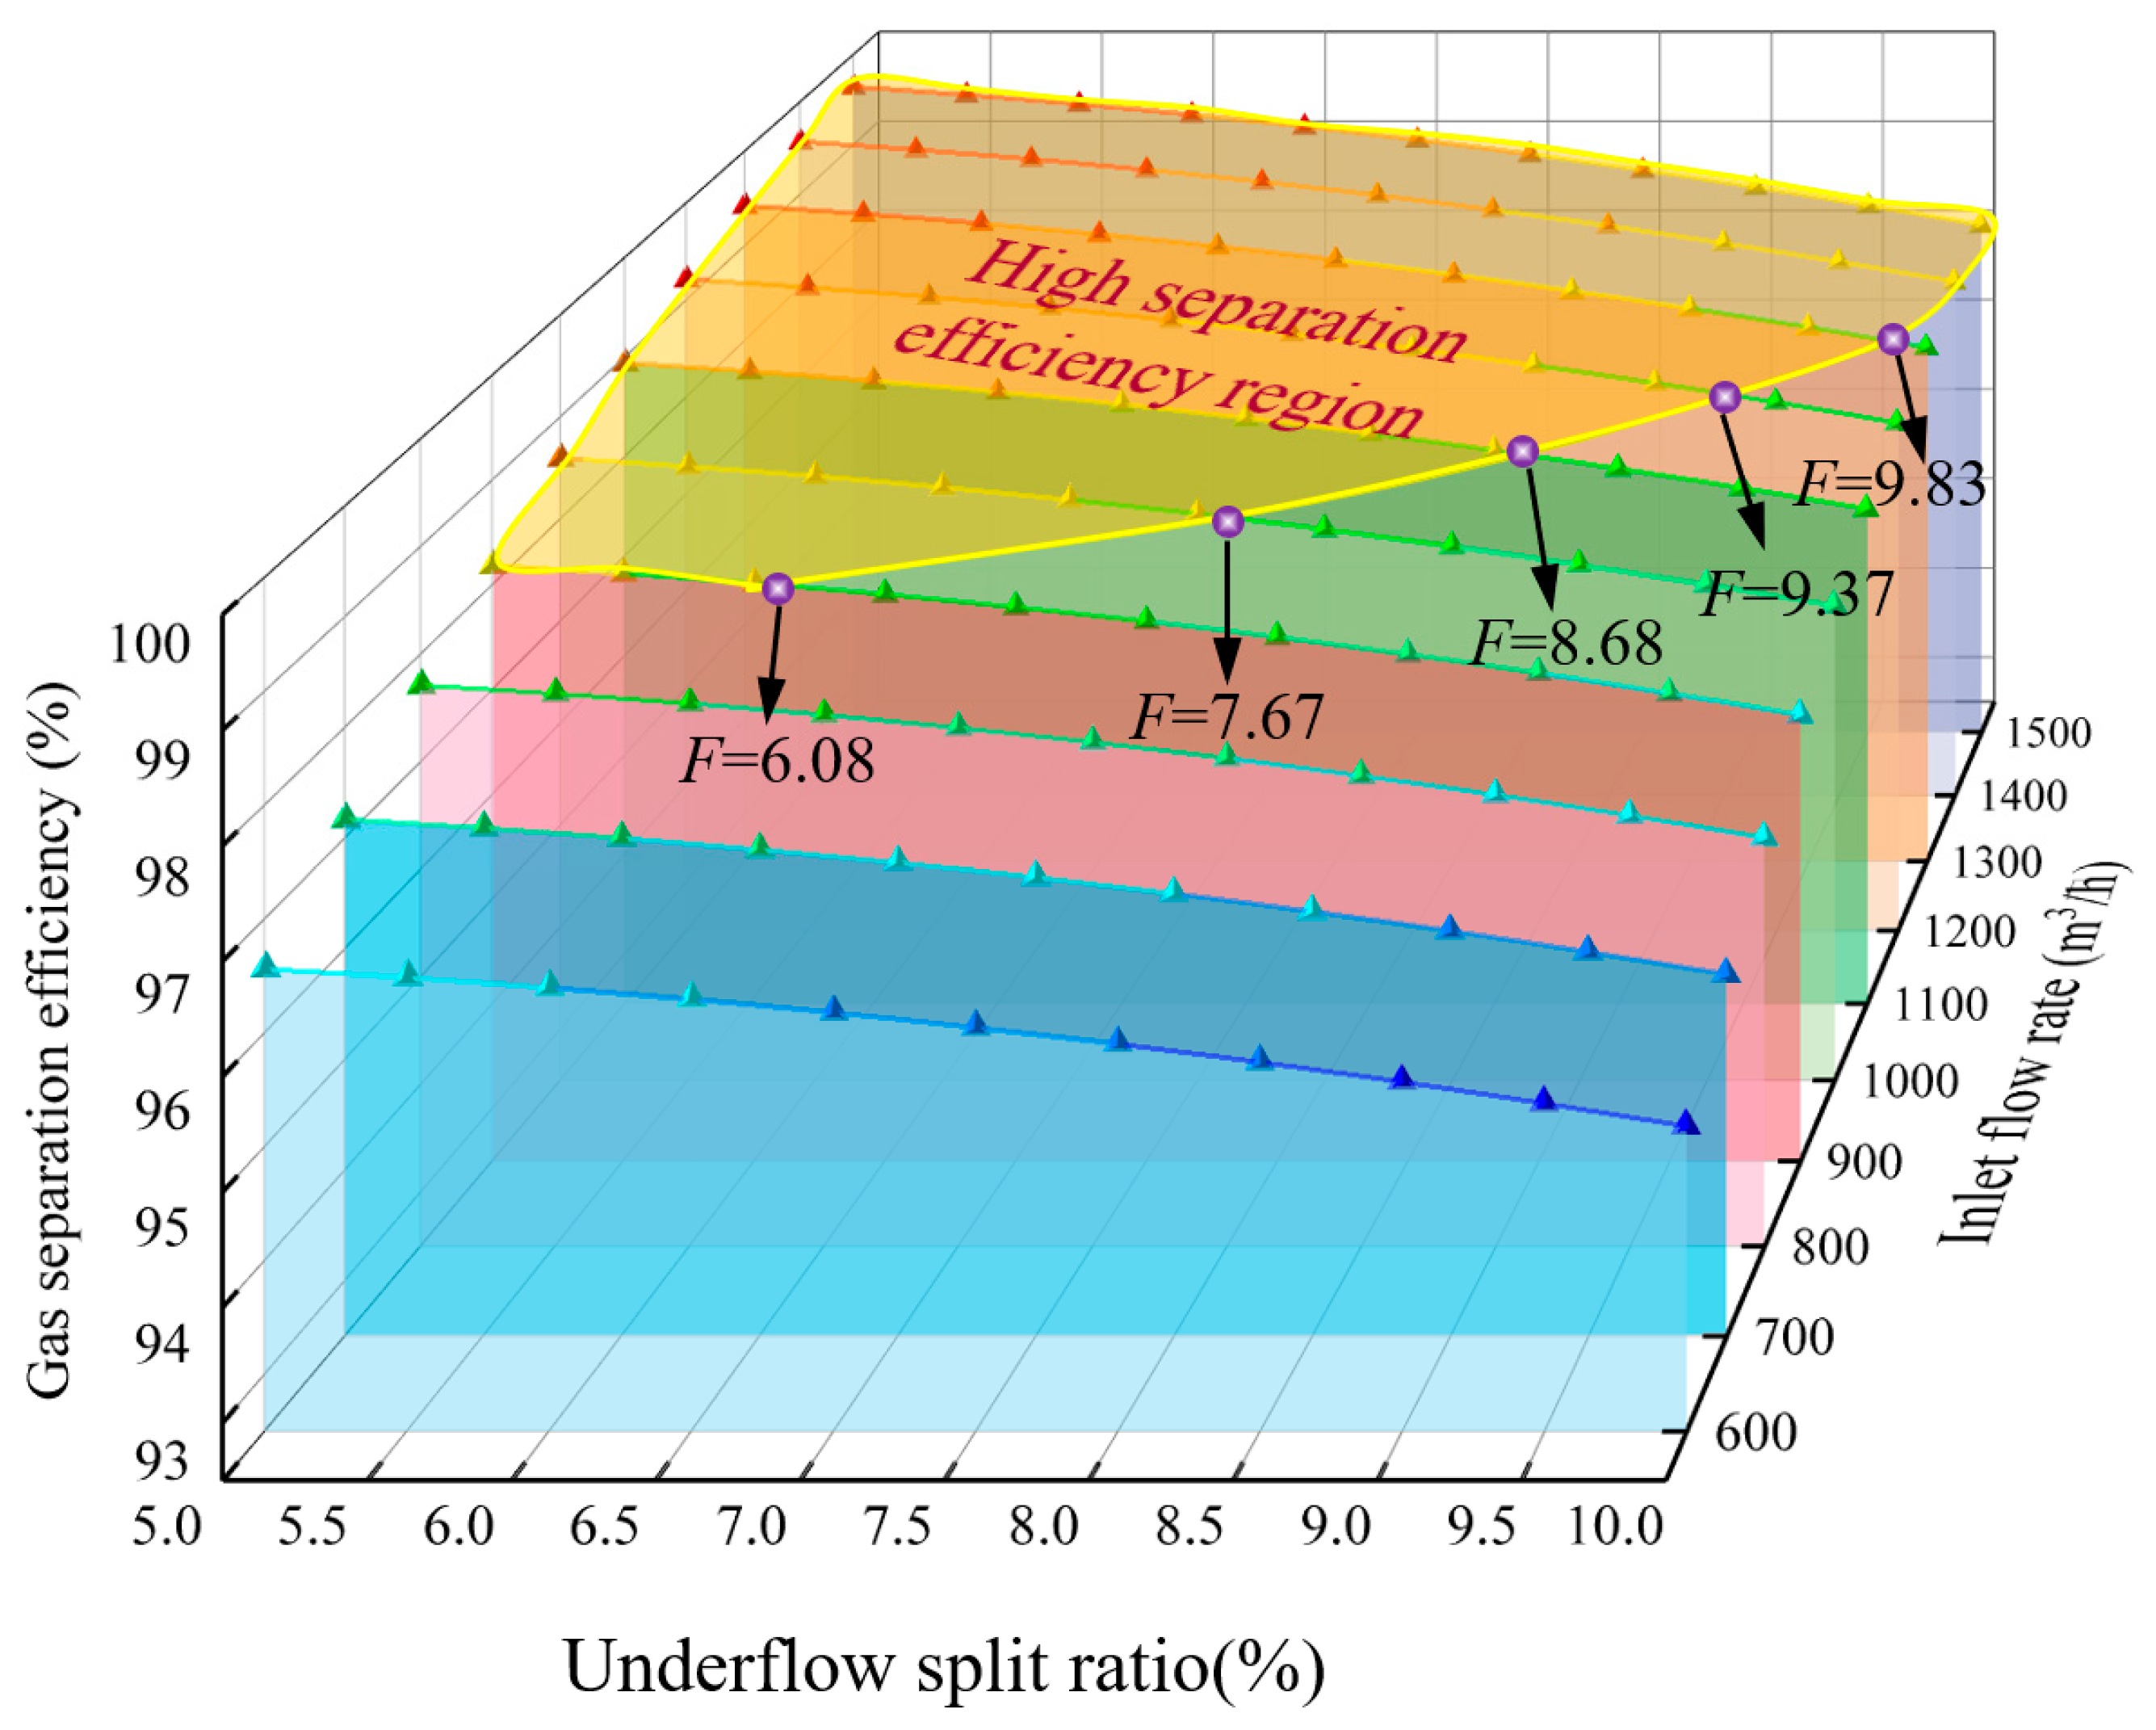
(3)
Using the response surface methodology, a quadratic polynomial regression model was obtained to describe the relationship between the liquid concentration of 3~12%, the inlet flow rate of 600~1500 m3/d, the underflow split ratio of 5~15%, and the gas separation efficiency. Furthermore, the numerical simulation method was employed to construct an optimal split ratio regulatory scheme under different inlet flow rates and liquid concentration conditions.

Author Contributions

R.Z.: Conceptualization, Methodology, Funding Acquisition, and Writing—review and editing. Y.L.: Data Curation and Writing—original draft. L.X.: Funding Acquisition, Project Administration, and Supervision. J.W.: Supervision and Formal Analysis. S.G.: Resources and Investigation. All authors have read and agreed to the published version of the manuscript. All authors have read and agreed to the published version of themanuscript.

Funding

This research was financially sponsored by the US-China Clean Energy Research Centre Joint Work Plan for Research Projects on Water Energy Technologies: Non Traditional Water Resources Treatment and Management (No. 2018YFE019600), Project of National Natural Science Foundation of China (Grant No. 52304064), and CNPC Innovation Found (2024DQ02-0102).

Data Availability Statement

Data will be made available on request.

Conflicts of Interest

The authors declare that they have no known competing financial interests or personal relationships that could have appeared to influence the work reported in this paper.

References

  1. Yang, S.H. Measurements in Oilfields. Meas. Control 2010, 43, 175. [Google Scholar] [CrossRef]
  2. Choi, H.O.; Park, H. “Oil is the New Data”: Energy Technology Innovation in Digital Oil Fields. Energies 2020, 13, 5547. [Google Scholar] [CrossRef]
  3. Soomro, A.A.; Mokhtar, A.A.; Kurnia, J.C.; Lashari, N.; Lu, H.; Sambo, C. Integrity assessment of corroded oil and gas pipelines using machine learning: A systematic review. Eng. Fail. Anal. 2022, 131, 105810. [Google Scholar] [CrossRef]
  4. Zhang, K.P.; Ku, H.C.; He, X.G.; Lu, H.L.; Zhang, M.; Guo, C.B. Measurement of gas and liquid flow rates in two-phase pipe flows with distributed acoustic sensing. Measurement 2025, 250, 117137. [Google Scholar] [CrossRef]
  5. Knobelspies, S.; Bierer, B.; Perez, A.O.; Wöllenstein, J.; Kneer, J.; Palzer, S. Low-cost gas sensing system for the reliable and precise measurement of methane, carbon dioxide and hydrogen sulfide in natural gas and biomethane. Sens. Actuators B Chem. 2016, 236, 885–892. [Google Scholar] [CrossRef]
  6. Stewart, M.; Arnold, K. Gas-Liquid and Liquid-Liquid Separators; Gulf Professional Publishing: Houston, TX, USA, 2008. [Google Scholar]
  7. Wang, J.Z.; Wang, Y.C.; Han, J.Z.; Xu, Q.; Xie, X.; Pan, Y.; Guo, L. Experimental investigation on separation characteristics of axial cyclone separator. Sci. China Technol. Sci. 2023, 66, 3231–3244. [Google Scholar] [CrossRef]
  8. Erdal, F.M.; Shirazi, S.A. Effect of the Inlet Geometry on the Flow in a Cylindrical Cyclone Separator. J. Energy Resour. Technol. 2006, 128, 62–69. [Google Scholar] [CrossRef]
  9. Rui, Y.; Lei, Z.; Chao, L.; Zhu, B. The structure design and the flow field analysis of the gas-liquid separation cyclone. IOP Conf. Ser. Earth Environ. Sci. 2021, 657, 012080. [Google Scholar] [CrossRef]
  10. Wang, Q.; Li, Z.; Li, K.; Hao, S. Research on separation performance of gas-liquid cylindrical cyclone under the condition of high gas liquid ratio. Fluid Mach. 2018, 46, 32–35+19. [Google Scholar]
  11. Gupta, R.; Kaulaskar, M.D.; Kumar, V.; Sripriya, R.; Meikap, B.C.; Chakraborty, S. Studies on the understanding mechanism of air core and vortex formation in a hydrocyclone. Chem. Eng. J. 2008, 144, 153–166. [Google Scholar] [CrossRef]
  12. Meng, F.; Shi, S.; Ma, N. Study of the performance of a new kind of downhole gas-liquid separation with high gas content. J. Energy Nat. Resour. 2019, 8, 45. [Google Scholar] [CrossRef]
  13. Miao, C.; Xing, L.; Li, F.; Jiang, M.; Li, X. Significance analysis of structural parameters of the compact gas-liquid hydrocyclone. China Pet. Mach. 2023, 51, 86–93. [Google Scholar]
  14. Li, T.; Sun, Z.; Geng, K.; Sun, M.; Wang, Z. Numerical analysis of a novel cascading gas–liquid cyclone separator. Chem. Eng. Sci. 2023, 270, 118518. [Google Scholar] [CrossRef]
  15. Zheng, C.; Yang, W.; Meng, X.; Li, A.; Shen, Q.; Zhao, J.; Xuan, D. Design and performance evaluation of a novel downhole gas-liquid separator for offshore high gas bearing wells. China Offshore Oil Gas 2020, 32, 128–135. [Google Scholar]
  16. Wang, S.; Luis, G.E.; Ram, M.S.; Petroleum, O.S. Gas-liquid cylindrical cyclone (GLCC) compact separators for wet gas applications. J. Energy Resour. Technol. 2003, 125, 43–50. [Google Scholar] [CrossRef]
  17. Wang, Y.; Chen, J.; Yang, Y.; Han, M.; Zhou, Y.; Ye, S.; Yan, C.; Yue, T. Experimental and numerical performance study of a downward dual-inlet gas-liquid cylindrical cyclone (GLCC). Chem. Eng. Sci. 2021, 238, 116595. [Google Scholar] [CrossRef]
  18. Fu, P.; Zhu, J.; Li, Q.; Cheng, T.; Zhang, F.; Huang, Y.; Ma, L.; Xiu, G.; Wang, H. DPM simulation of particle revolution and high-speed self-rotation in different pre-self-rotation cyclones. Powder Technol. 2021, 394, 290–299. [Google Scholar] [CrossRef]
  19. Lan, W.; Wang, H.; Li, Y.; Feng, K.; Zhang, X.; Liu, Y.; Zhu, X.; Chen, S. Numerical and experimental investigation on a downhole gas-liquid separator for natural gas hydrate exploitation. J. Pet. Sci. Eng. 2022, 208, 109743. [Google Scholar] [CrossRef]
  20. Chen, G.; Fan, J.; Zhang, P.; Wang, W. Experimental and CFD investigation on effects of internals on the flow pattern and performance of a divergent cyclone separator. J. Taiwan Inst. Chem. Eng. 2020, 115, 160–168. [Google Scholar] [CrossRef]
  21. Yuan, Q.; Zhao, M.; Ge, T.; Wang, C. The numerical simulation of sediment scour based on a Eulerian model. J. Harbin Eng. Univ. 2019, 40, 47–53. [Google Scholar]
  22. Nguyen, X.; Ma, K.; Lai, H. Numerical study of internal flow field of a centrifugal pump impeller using different turbulence models. J. East China Univ. Sci. Technol. 2014, 40, 798–803. [Google Scholar]
  23. Zeng, X.; Xu, Y.; Zhao, L.; Fan, G.; Yan, C. Numerical investigation on axial liquid-liquid separators with different swirl chambers. Chem. Eng. Process. Process Intensif. 2021, 161, 108324. [Google Scholar] [CrossRef]
  24. Xing, L.; Guan, S.; Jiang, M.; Zhao, L.; Cai, M.; Liu, H.; Chen, D. Study on structure optimization and performance of downhole gas-liquid hydrocyclone under high gas-liquid ratio. CIESC J. 2024, 75, 900–913. [Google Scholar]
  25. Zhang, M.; Sun, H.; Wang, Q.; Chen, J.; Shang, C.; Li, X.; Wang, C.; Kong, L. Study of flow field characteristics and separation performance of inline cyclone gas-liquid separator. Chin. J. Process Eng. 2024, 24, 772–782. [Google Scholar]
  26. Fang, X.; Chen, J.; Liu, M.; Ji, Y. Numerical simulation research of bubble enhanced hydrocyclone. J. Petrochem. Univ. 2016, 29, 82–88. [Google Scholar]
  27. Zhao, Q. Study on Hydrocyclone Separation Process Based on the Characteristics of Axial Velocity Wave Zone. PhD Thesis, Northeast University, Boston, MA, USA, 2022. [Google Scholar]
  28. Zhou, Y.; Chen, J.; Wang, Y.; Zhang, D.; Ma, H.; Li, Z. Experimental and numerical study on the performance of a new dual-inlet gas–liquid cylindrical cyclone (GLCC) based on flow pattern conditioning. Chem. Eng. J. 2023, 453, 139778. [Google Scholar] [CrossRef]
  29. Zeng, X.; Zheng, C.; Li, A.; Fan, G.; Xiao, Y.; Yan, C. Numerical study on a new separator for downhole gas-liquid separation. Chem. Eng. Res. Des. 2025, 214, 317–326. [Google Scholar] [CrossRef]
  30. Chen, T.; Pan, Z.; Chen, Y.; Liu, M.; Chen, T.; Zhong, Y. Effect of hydrocyclone split ratio on carbon release performance of excess sludge. CIESC J. 2021, 72, 5761–5769. [Google Scholar]
  31. Kumar, V.; Jha, K. Multi-objective shape optimization of vortex finders in cyclone separators using response surface methodology and genetic algorithms. Sep. Purif. Technol. 2019, 215, 25–31. [Google Scholar] [CrossRef]
Figure 1. Structure and working principle diagram of the CTGLS.
Processes 13 02063 g001
Figure 2. Grid independence test and grid quality. The meaning of the arrows in the diagram represents that they have been exceeded.
Processes 13 02063 g002
Figure 3. Laboratory experimental test platform.
Processes 13 02063 g003
Figure 4. Comparison diagram of gas–liquid separation efficiency between simulation and experiment under different liquid concentrations.
Processes 13 02063 g004
Figure 5. Schematic diagram of axial velocity distribution of gas–liquid separators with different liquid concentrations.
Processes 13 02063 g005
Figure 6. Comparison of tangential velocities of different sections with different liquid concentrations.
Processes 13 02063 g006
Figure 7. Comparison diagram of liquid concentration in gas–liquid separators with different liquid concentrations.
Processes 13 02063 g007
Figure 8. Comparison diagram of separation efficiency under different liquid concentrations.
Processes 13 02063 g008
Figure 9. Diagram of axial velocity distribution of gas–liquid separators with different inlet flow rates.
Processes 13 02063 g009
Figure 10. Comparison of tangential velocities of different sections with different inlet flow rates.
Processes 13 02063 g010
Figure 11. Comparison diagram of liquid concentration in gas–liquid separators with different inlet flow rates.
Processes 13 02063 g011
Figure 12. Comparison diagram of separation efficiency under different inlet flow rates.
Processes 13 02063 g012
Figure 13. Diagram of axial velocity distribution of gas–liquid separators with different split rates.
Processes 13 02063 g013
Figure 14. Comparison of tangential velocities of different sections with different primary overflow split ratios.
Processes 13 02063 g014
Figure 15. Comparison diagram of liquid concentration in gas–liquid separators with different primary overflow split ratios.
Processes 13 02063 g015
Figure 16. Comparison diagram of separation efficiency under different primary overflow split ratios.
Processes 13 02063 g016
Figure 17. Effect of underflow split ratio on gas separation efficiency under different liquid concentrations.
Processes 13 02063 g017
Figure 18. Effect of underflow split ratio on gas separation efficiency under different inlet flow rates.
Processes 13 02063 g018
Table 1. Main structural parameters of the CTGLS.
Main StructureDimension
Diameter of the inlet pipe (d1)5 mm
Diameter of the outlet pipe (d2)9.6 mm
Length of primary cyclone (L1)640 mm
Length of secondary cyclone (L2)320 mm
Angle of primary reversed cone (θ1)12°
Angle of secondary reversed cone (θ2)
Insertion depth of primary overflow pipe (h1)15 mm
Primary body diameter (D1)60 mm
Length of primary reverse cone (l1)300 mm
Insertion depth of secondary overflow pipe (h2)12 mm
Secondary body diameter (D2)40 mm
Length of secondary reverse cone (l2)120 mm
Thickness of the base plate (t)12 mm
Table 2. Factor level design of response surface method.
FactorLevel
Low
(−1)
Central
(0)
High
(+1)
Inlet flow rate x1/m360010501500
Split ratio of underflow x2/%51015
Liquid concentration x3/%37.512
Table 3. The result of response surface method.
NumberFactorsy (%)
x1x2x3
11050107.595.65
21050107.595.65
310505396.90
460010392.01
5105015387.48
6600157.590.15
71050107.595.65
81050107.595.65
91050107.595.65
1060057.597.20
111500101298.12
12600101295.04
13150057.598.92
141500157.591.57
151050151294.58
16150010392.68
17105051298.87
Table 4. Results of variance analysis of regression.
SourceSum of SquaresMean SquaresF Valuep-Value
model156.8517.43127.07<0.0001
x15.935.9343.270.0003
x297.7297.72712.52<0.0001
x337.8037.80275.63<0.0001
x1x20.02250.02250.16410.6975
x1x31.451.4510.590.0140
x2x36.976.9750.820.0002
x121.911.9113.940.0073
x222.162.1615.750.0054
x322.152.1515.640.0055
Residual0.96000.1371--
Lack of fit0.16000.05330.26670.8469
Cor Total157.81---
Table 5. Results of error statistics of regression.
Std. Dev.0.3703R-Squared0.9939
Mean94.86Adj. R-Squared0.9861
C.V. %0.3904Pred. R-Squared0.9759
--Adep. Precision40.3475
Disclaimer/Publisher’s Note: The statements, opinions and data contained in all publications are solely those of the individual author(s) and contributor(s) and not of MDPI and/or the editor(s). MDPI and/or the editor(s) disclaim responsibility for any injury to people or property resulting from any ideas, methods, instructions or products referred to in the content.

