Article

Characteristics of Deep Coal Reservoirs Based on Logging Parameter Responses and Laboratory Data: A Case Study of the Logging Response Analysis of Reservoir Parameters Is Carried Out in Ordos Basin, China

1
Exploration and Development Research Institute, PetroChina Changqing Oilfield Company, Xi’an 710000, China
2
Geology Research Institute, PetroChina Log Company, Xi’an 710000, China
3
College of Geoscience and Surveying Engineering, China University of Mining and Technology (Beijing), Beijing 100083, China
4
College of Geoscience and Engineering, Shandong University of Science and Technology, Qingdao 266590, China
*
Author to whom correspondence should be addressed.
Processes 2025, 13(7), 2062; https://doi.org/10.3390/pr13072062 (registering DOI)
Submission received: 28 May 2025 / Revised: 24 June 2025 / Accepted: 27 June 2025 / Published: 29 June 2025

Abstract

The coal reservoir in the Ordos Mizhi block is buried at a depth of over 2000 m. This study aims to obtain the characteristics of the coal reservoir in the Mizhi block through various experimental methods and combine the gas-bearing characteristics obtained from on-site desorption experiments to analyze the gas content and logging response characteristics of the study area. On this basis, a reservoir parameter interpretation model for the study area is established. This provides a reference for the exploration and development of coal-rock gas in the Mizhi block. The research results show that: (1) The study area is characterized by the development of the No. 8 coal reservoirs of the Benxi Formation, with a thickness ranging from 2 to 11.6 m, averaging 7.2 m. The thicker coal reservoirs provide favorable conditions for the formation and storage of coal-rock gas. The lithotypes are mainly semi-bright and semi-dark. The coal maceral is dominated by the content of the vitrinite, followed by the inertinite, and the exinite is the least. The degree of metamorphism is high, making it a high-grade coal. In the proximate analysis, the moisture ranges from 0.36 to 1.09%, averaging 0.65%. The ash ranges from 2.34 to 42.17%, averaging 16.57%. The volatile ranges from 9.18 to 15.7%, averaging 11.50%. The fixed carbon ranges from 45.24 to 87.51%, averaging 71.28%. (2) According to the results of scanning electron microscopy (SEM), the coal samples in the Mizhi block have developed fractures and pores. Based on the results of the carbon dioxide adsorption experiment, the micropore adsorption capacity is 7.8728–20.3395 cm3/g, with an average of 15.2621 cm3/g. The pore volume is 0.02492–0.063 cm3/g, with an average of 0.04799 cm3/g. The specific surface area of micropores is 79.514–202.3744 m2/g, with an average of 153.5118 m2/g. The micropore parameters are of great significance for the occurrence of coal-rock gas. Based on the results of the desorption experiment, the gas content of the coal rock samples in the study area is 12.97–33.96 m3/t, with an average of 21.8229 m3/t, which is relatively high. (3) Through the correlation analysis of the logging parameters of the coal reservoir, the main logging response parameters of the reservoir are obtained. Based on the results of the logging sensitivity analysis of the coal reservoir, the interpretation model of the reservoir parameters is constructed and verified. Logging interpretation models for parameters such as industrial components, microscopic components, micropore pore parameters, and gas content are obtained. The interpretation models have interpretation effects on the reservoir parameters in the study area.

Coal-rock gas is a brand-new unconventional natural gas distinct from coalbed methane and shale gas. It is generally buried at a depth of over 2000 m and features the “five highs” of high pressure, high temperature, high gas content, high saturation, and high ionization [1,2,3,4]. China is one of the countries with the richest coal resources in the world. It has numerous coal-rich basins, including Ordos, Junggar, Sichuan, Tarim, Songliao, Bohai Bay, and Qinshui. The geological resources of coal-rock gas exceed 30 × 1012 m3, among which the resources of the Ordos Basin exceed 20 × 1012 m3. The resource reserves in basins such as Tarim, Sichuan, Bohai Bay, and Tuha all exceed 2 × 10¹² m3, providing a resource foundation for efficient development [5]. In recent years of development, the output of deep coal-rock gas has rapidly increased to 2.5 × 10⁹ m3 and has become a new highlight in the increase in natural gas production. Deep coal-rock gas is a new type of unconventional natural gas within the source. It was first explored and developed in the gas area of Changqing Oilfield. Subsequently, large gas fields such as Sulige, Mizhi, Zizhou, and Yulin were successively discovered in the Ordos Basin, playing an important role in supporting China’s energy security [6]. In 2019, the Daning-Jixian block in the southeast of the Ordos Basin became a typical block for coal-rock gas exploration and development, and this block gradually achieved large-scale development of deep coal-rock gas [7]. In 2023, the Shenfu Gas Field was successfully proven to have geological reserves exceeding 1143 × 108 m3, and in the Nalinhe-Mizhi North block, the predicted reserves exceeded one trillion cubic meters, and the proven reserves exceeded one hundred billion cubic meters [8]. During 2023, the Changqing Oilfield Branch of China National Petroleum Corporation deployed and implemented over 30 deep coal-rock gas exploration and development wells in blocks such as Naling, Mizhi North, and Suide within the basin. The initial daily production of many wells exceeded 10 × 104 m3 [9]. By 2025, the global output of coalbed methane is expected to exceed 55 billion cubic meters, with China accounting for 40% of it. It is worth noting that, compared with North America, which has mature mining technologies and complete pipeline infrastructure, China still has huge room for improvement. Driven by the policies of countries such as China, Australia, and Indonesia, the Asia-Pacific region has become the region with the fastest growth in global coal-rock gas production.
Establishing mathematical models is of great significance for solving actual oil and gas production problems [10,11,12]. Laboratory tests can control the experimental conditions and achieve the ideal state of research on the research goals [13,14]. This research is based on the test results of 21 coal samples from the No. 8 coal seam of the Benxi Formation in the Meizhi block of the Ordos Basin, including macroscopic coal types, microscopic components, microscopic identification, maximum mirror mass group reflectance, scanning electron microscopy, low-temperature carbon dioxide adsorption, industrial analysis, and on-site gas content tests. Combined with the logging data of the corresponding depth of the coal sample, the connection between reservoir parameters and logging parameters is established, and the response characteristics of logging parameters to reservoir parameters are analyzed. Finally, establish the explanatory model. By establishing an interpretation model of coal reservoir parameters based on logging parameters, various coal reservoir parameters in this area can be quickly understood. Unconventional reservoir evaluation using well logging data is a commonly used evaluation method [15,16]. By constantly improving the accuracy and reliability of the interpretation model to achieve a more accurate logging interpretation of the reservoir parameters in the target area and conducting regional reservoir evaluation, it can provide a reference basis for the subsequent planning of coal-rock gas production wells.

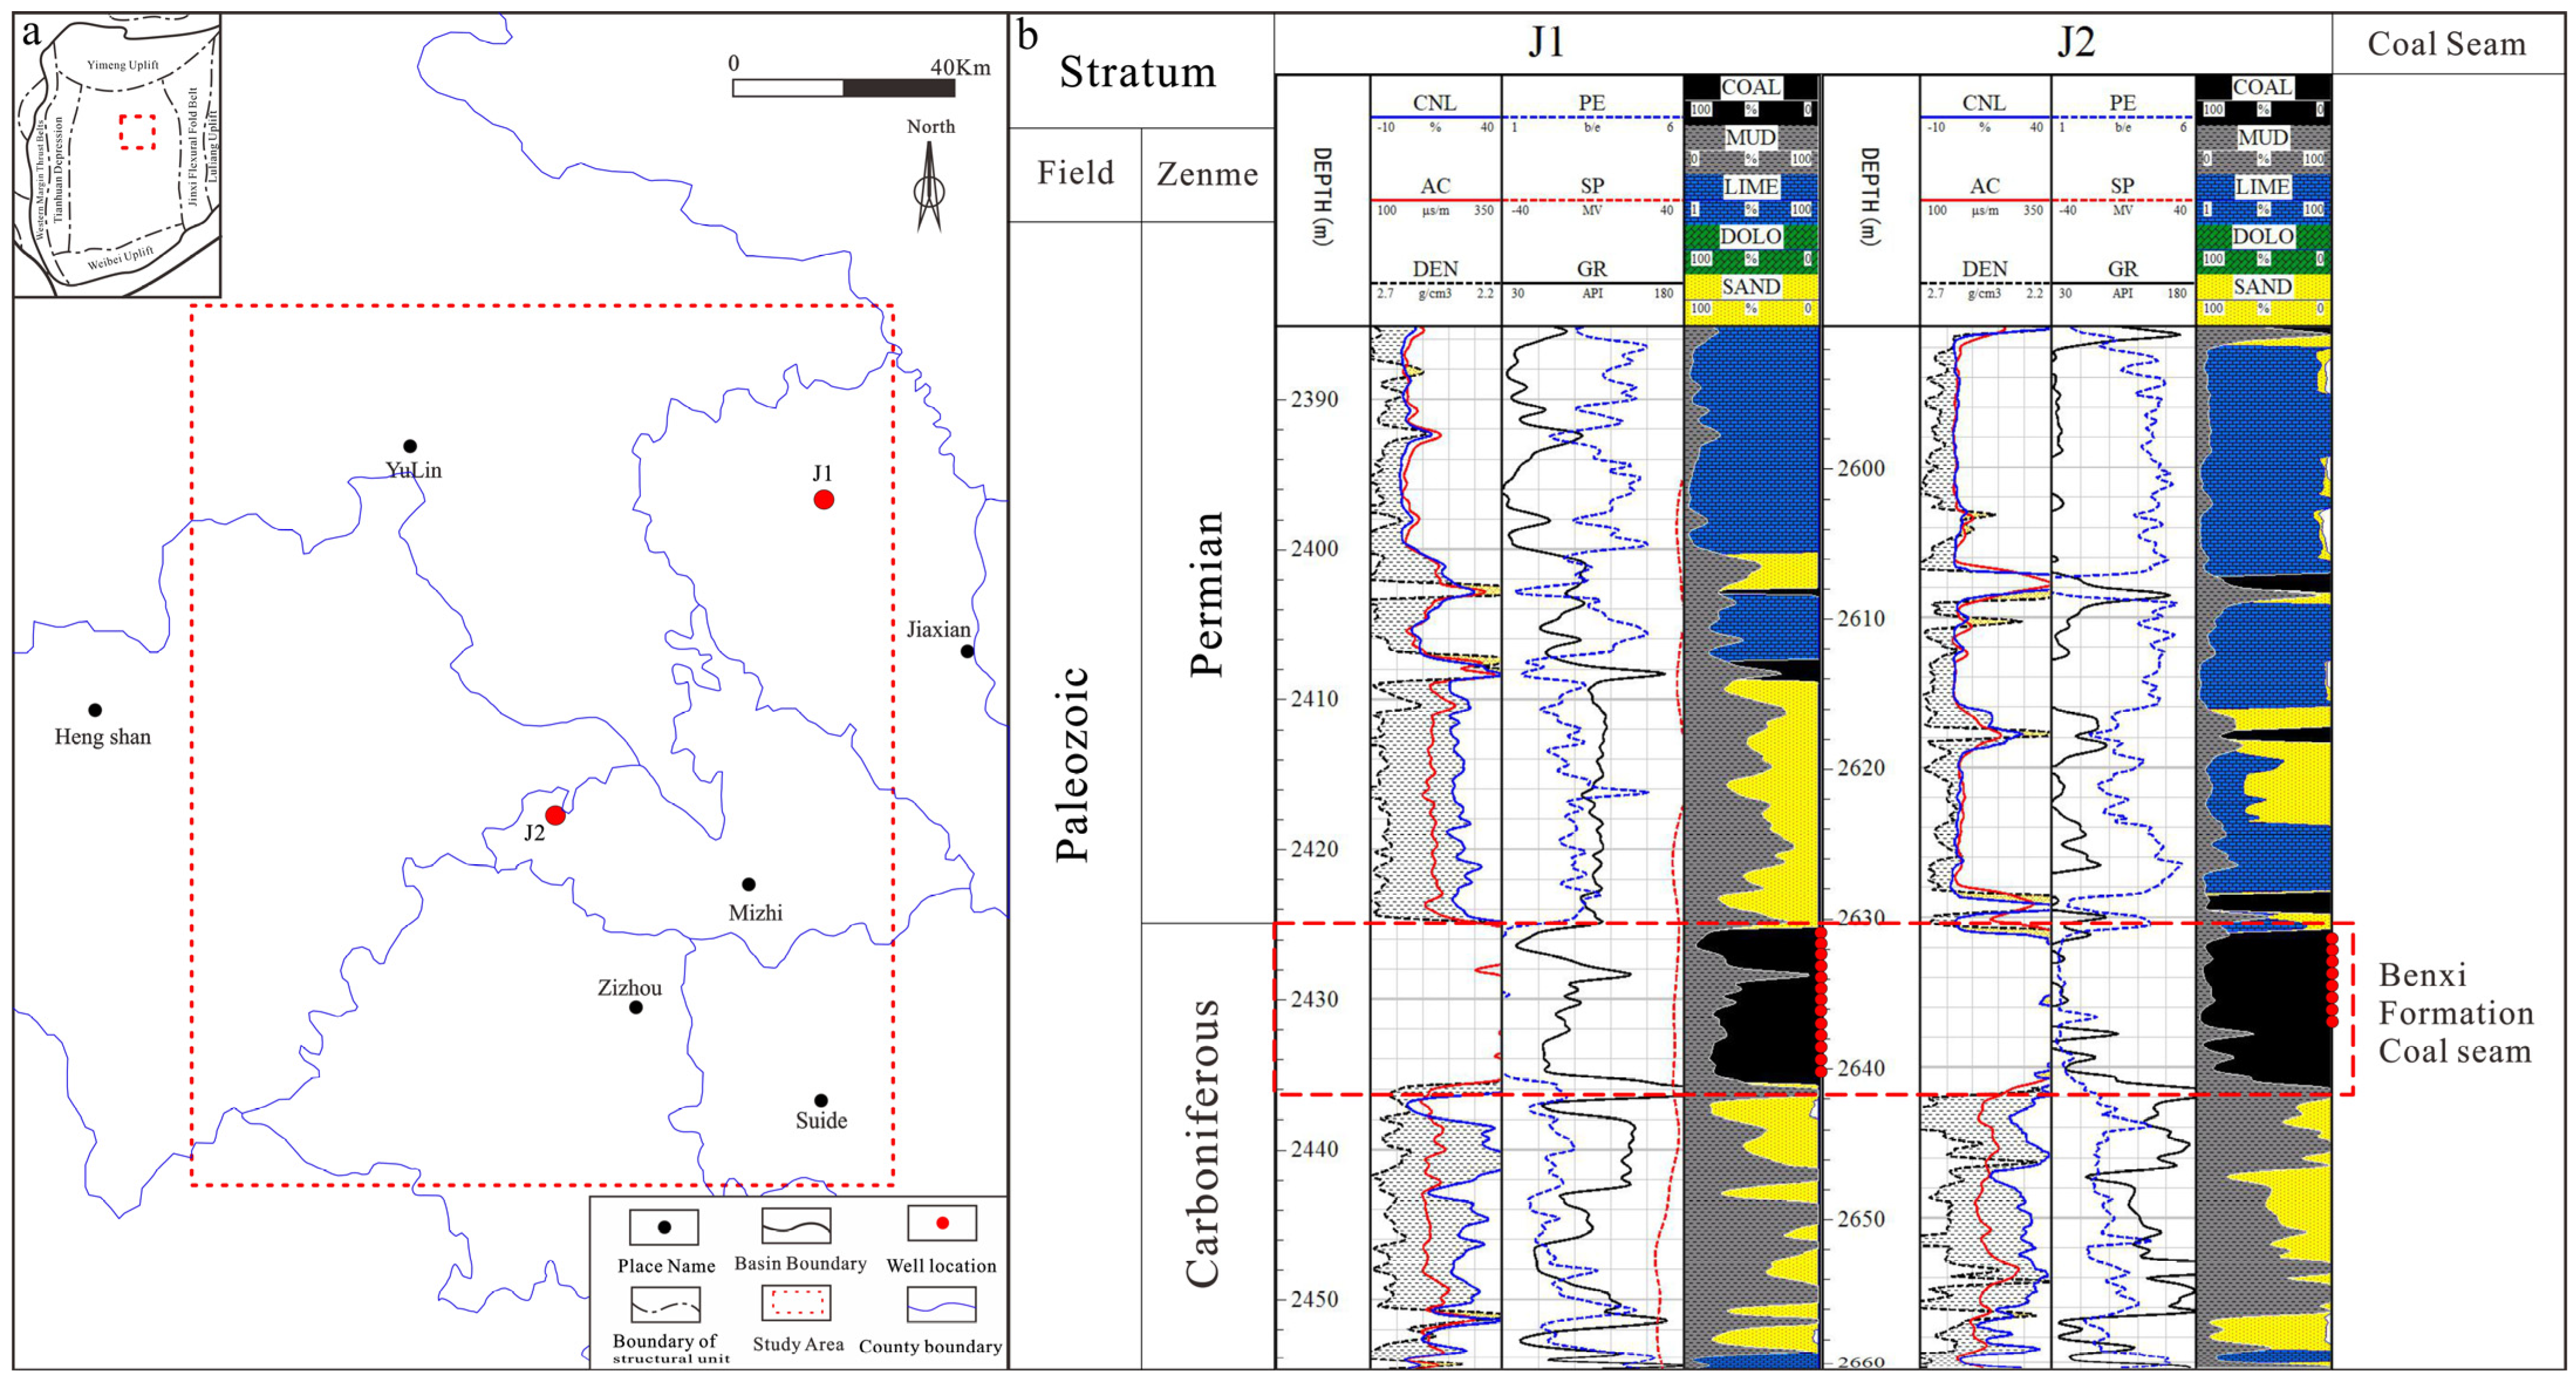
1. Geological Background

The Mizhi Block of the study area is located in the eastern part of the Ordos Basin, covering an area of 3019 km2 (Figure 1). It enjoys a superior geographical location and is an important part of the North China Craton [17,18,19]. The overall structure is characterized by stable settlement and depression migration. The stratigraphic sedimentation is stable and has obvious multi-cycle evolution characteristics [20,21,22]. The internal structure of the basin is relatively simple, and the stratum dip angle is generally 1° to 3° [23]. This area has developed multiple gas-bearing layers, among which the main layers are the Taiyuan Formation, the Shan 2 section, and the He 8 section. They belong to the gas reservoir type of low-pressure, tight, and constant-volume elastic drive. The basin can be divided into six secondary tectonic units: the thrust tectonic belt on the western margin, the Tianhuan Depression in the west, the Yishui slope in the middle, the Yimeng Uplift in the north, the Weibei Uplift in the south, and the Jinxi Fold belt on the eastern margin. These tectonic units together constitute the complex geological pattern of the Ordos Basin [24,25,26]. The interlayer structure in the study area has good inheritance. From the Taiyuan Formation to the Shan 2 section and the He 8 section, the structure has basically not undergone significant changes. This area belongs to the delta sedimentary system and mainly develops the delta leading edge zone [27,28]. The Taiyuan Formation in the Mizhi block is mainly composed of sandstone and mudstone. The main rock types include quartzite, sandstone, grayish-black mudstone, sandy mudstone, grayish-white quartz sandstone, while the thickness of the limestone is relatively thin. The delta plain diversion channel or the underwater diversion channel at the front edge of the delta of the Qiaotou sandstone is the main sedimentary facies, and the sand body scale is relatively large. In contrast, the limestone on the eastern side of the Mizhi block is more developed and mainly consists of mud-crystalline biological limestone. The sedimentary environment of the Taiyuan Formation has undergone changes in delta-tidal flat and river-controlled delta facies. From north to south, the delta front and the continental surface tidal flat sediments developed successively. In the south, the gray flat was dominant, and tidal sand DAMS could be seen locally [29]. The main coal seam in the study area is No. 8 coal of the Benxi Formation, with a burial depth generally exceeding 2000 m, belonging to deep coal. Overall, the thickness of coal seam No. 8 in the study area ranges from 2 to 11.6 m. The average is 7.2 m. The thickness of the No. 8 coal reservoirs in the study area is better developed compared with that of the No. 8 coal reservoirs in the Yan’an Gas Field, which is not much different from that of the No. 8 coal reservoirs in the Daji block [30]. Twenty-one coal samples of the Benxi Formation are from J1 and J2, which are respectively located in the north and middle of the study area.

2. Experimental Samples and Model Establishment Methods

To study the relationship between the parameter characteristics of coal reservoirs and logging parameters in the Mizhi block of the Ordos Basin, 21 coal samples with relatively complete logging data were selected for relevant tests (Table 1). The determination of macroscopic coal and rock types was carried out in accordance with the GB/T 18023-2000 standard [31]. When the samples were just collected, the macroscopic coal and rock types were observed, recorded, and photographed. The determination of microscopic coal and rock components was carried out in accordance with the GB/T 6948-2008 standard [32]. The prepared coal and rock samples were observed under a microscope. The random grid positioning method was adopted, and component identification was conducted under 400 times of orthogonal polarized light to obtain the microscopic components of the coal samples. The scanning electron microscope test was conducted in accordance with the SY/T 5162-2021 standard [33]. Under the scanning electron microscope, an electron beam was emitted by an electron gun and focused to perform a grating scan on the surface of the sample. The composition, morphology, and structure of the sample surface were observed and analyzed by detecting the signals generated by the interaction between electrons and the sample, and the corresponding scanning images were obtained. The maximum vitrinite reflectance test (Ro,max) was conducted in accordance with the GB/T 6948-2008 standard [32]. Under the oil-immersed objective lens of the microscope, the intensity of the reflected light (λ = 546 nm) of the vertically incident light within a limited area on the polished surface of the vitrinite was measured by an electric converter and compared with the intensity of the reflected light of the standard substance with known reflectance under the same conditions. Obtain the maximum reflectance of the mirror quality group. Industrial analysis was conducted on coal samples in accordance with the GB/T212-2008 standard to obtain their moisture content, ash content, volatile matter, and fixed carbon content [34]. The low-temperature carbon dioxide adsorption experiment was conducted in accordance with the GB/T 21650.3-2011 standard [35]. The treated samples were subjected to the carbon dioxide adsorption experiment using an isothermal adsorption instrument. The adsorption/desorption isotherms were collected by the staged pressure control method, and the pressure gradient covered the P/P0 range of 0.0001–1.0 d. The on-site gas content test was conducted in accordance with the GB/T 19559-2021 standard [36]. The collected coal and rock samples were tested for gas content on-site by traditional methods. Although there were certain errors, it was an effective way to obtain the gas content. To establish the logging interpretation model of coal reservoir parameters, firstly, the linear regression method is used to conduct a correlation analysis of reservoir parameters and determine the response of logging parameters to them. Then, based on the response of logging parameters, the main logging response parameters that respond to the parameters of coal reservoirs are determined. Finally, a logging parameter interpretation model corresponding to the parameters was established based on the multiple regression model, and the model was verified [37,38,39,40,41,42].

3. Results and Discussion

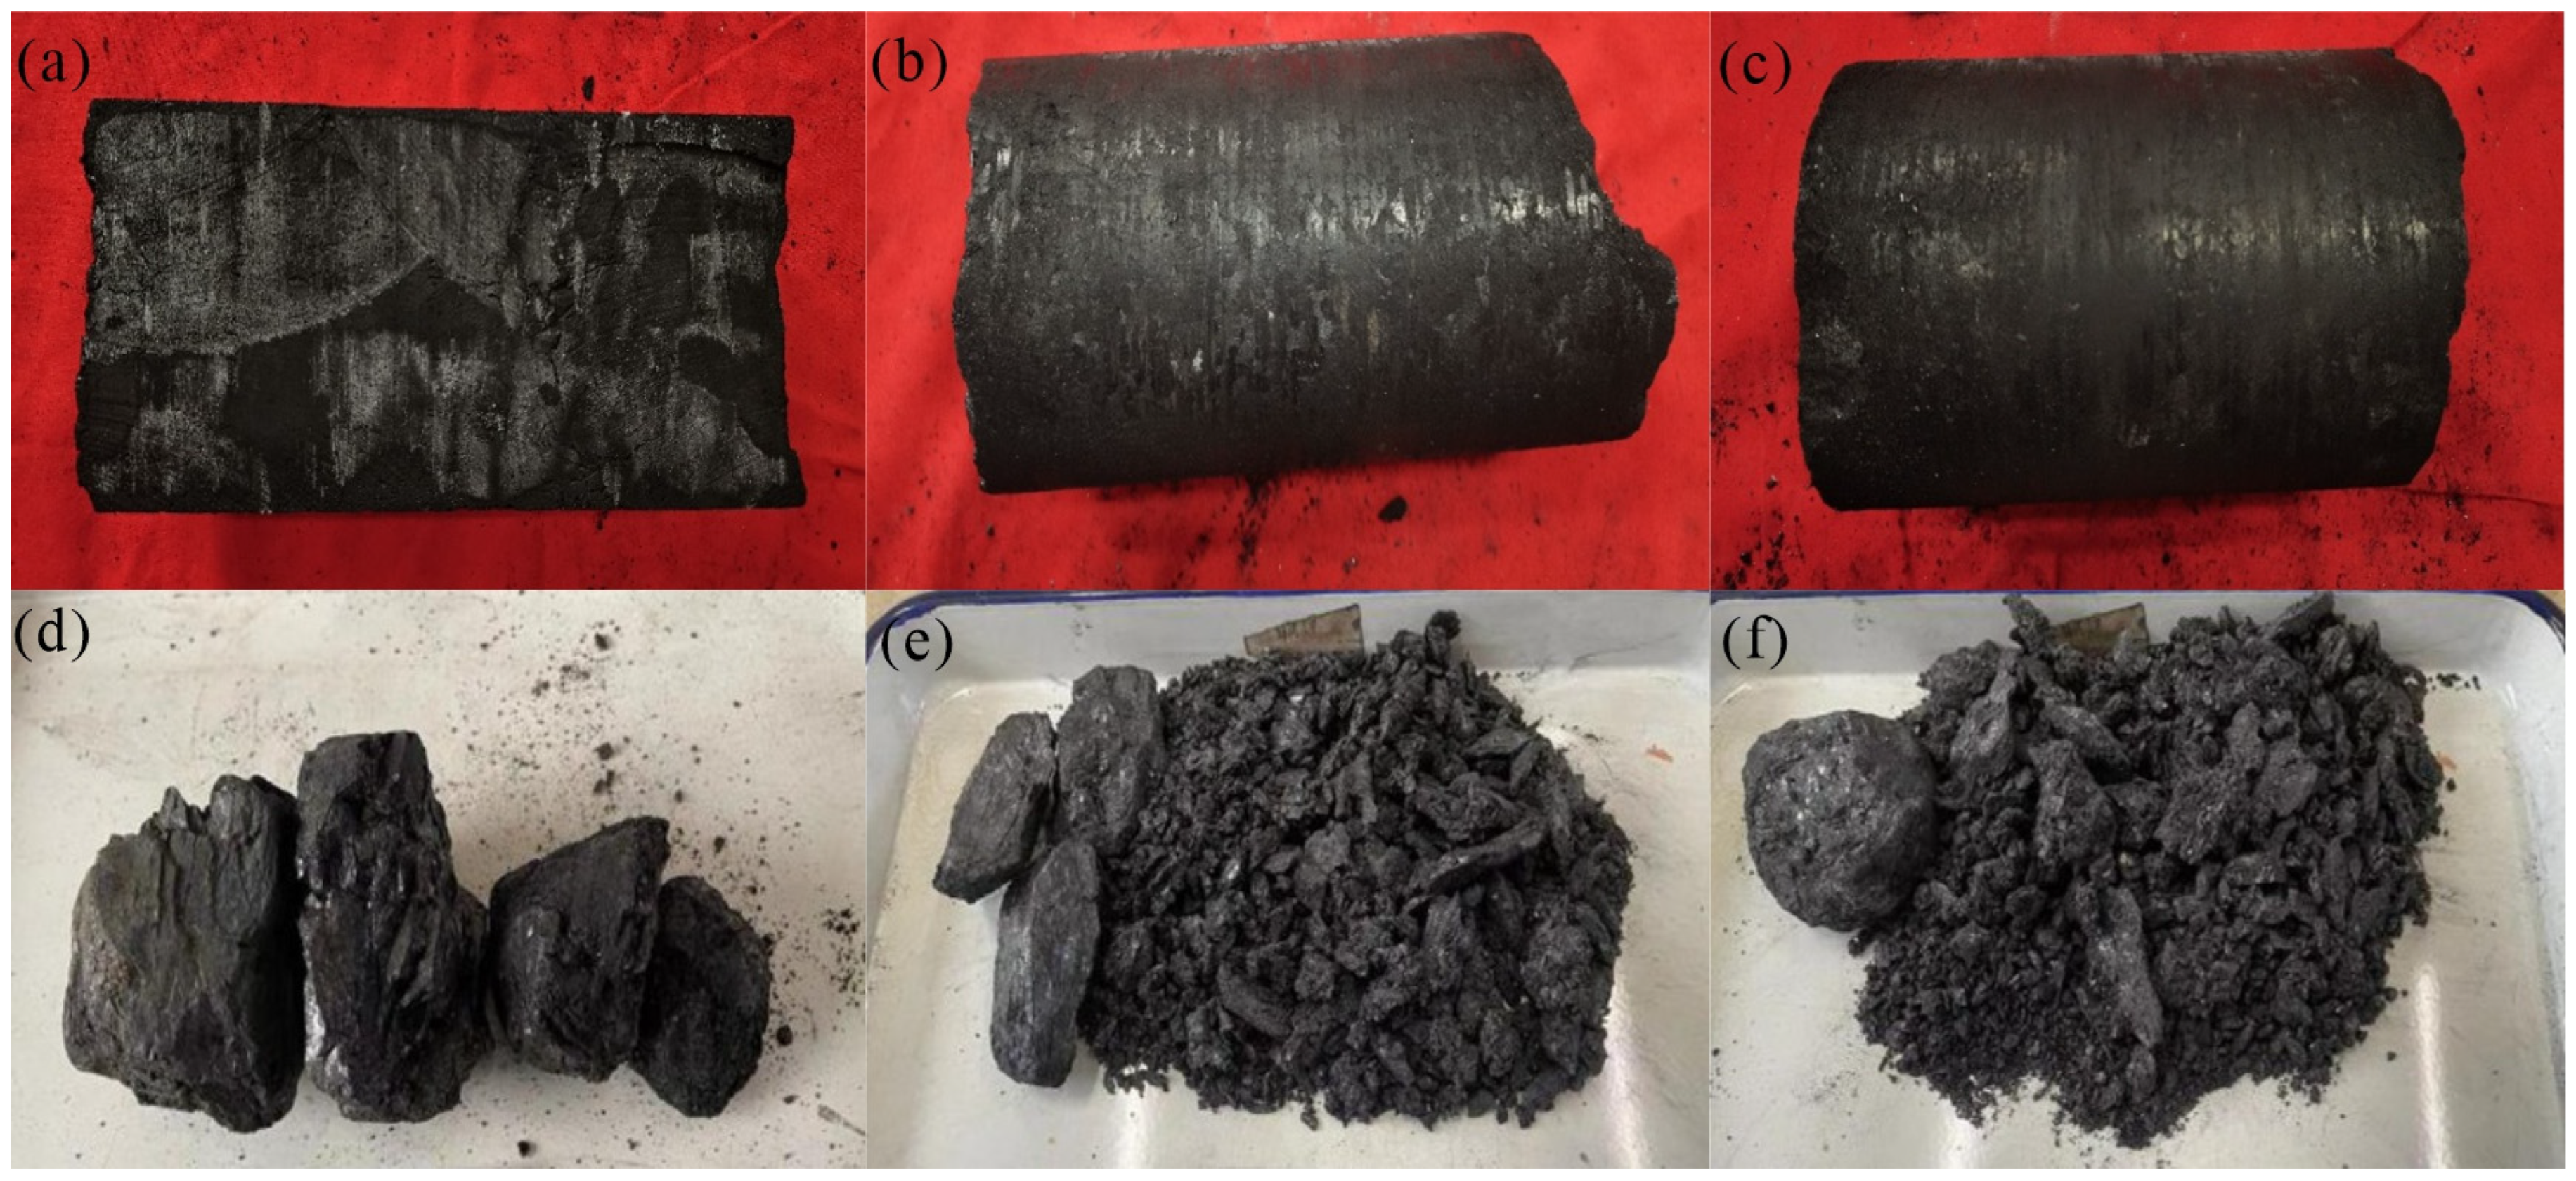
3.1. Coal Characteristics

Based on the results of the macrolitho type of coal identification, six representative coal samples from two wells were selected (Figure 2). Overall, the coal samples in the study area are mainly semi-dark coal and semi-bright coal, and there is also the development of some structural coal. The coal sample of S5 (Figure 2a) is semi-dark coal, and its coal core is short columnar. The overall color is grayish black with weak luster. It was observed that thin and medium strip-shaped vitrain was interspersed in the media. The fracture surface is stepped. The coal sample is in a block structure. The texture of coal is relatively hard. S7 (Figure 2b) is semi-bright coal with a short columnar core. The overall color is black, with an asphalt luster, but the luster is relatively weak. Similar to the S5 coal sample, fine and medium-banded vitrain was observed. Meanwhile, there exists a stepped, fractured surface. The coal sample has a block structure and is relatively hard in texture. S10 (Figure 2c) is semi-dark coal with a short columnar core. The coal sample is black but has a relatively weak luster. It is interspersed with fine strip-shaped vitrain. The overall structure is blocky, and the texture is relatively hard. S15 (Figure 2d) is semi-bright coal, with a blocky structure. It has angular fracture surfaces and a vitreous luster. It was observed that the coal sample had broken, and no filling was seen. The coal samples of S17 and S20 (Figure 2e,f) are crushed coals and eroded coals. The samples are in the form of 1 mm–2 cm elastic fragments. Larger fragments can be seen to have developed fissures and have an asphalt-like luster.

3.2. Coal Reservoir Parameters and Logging Responses
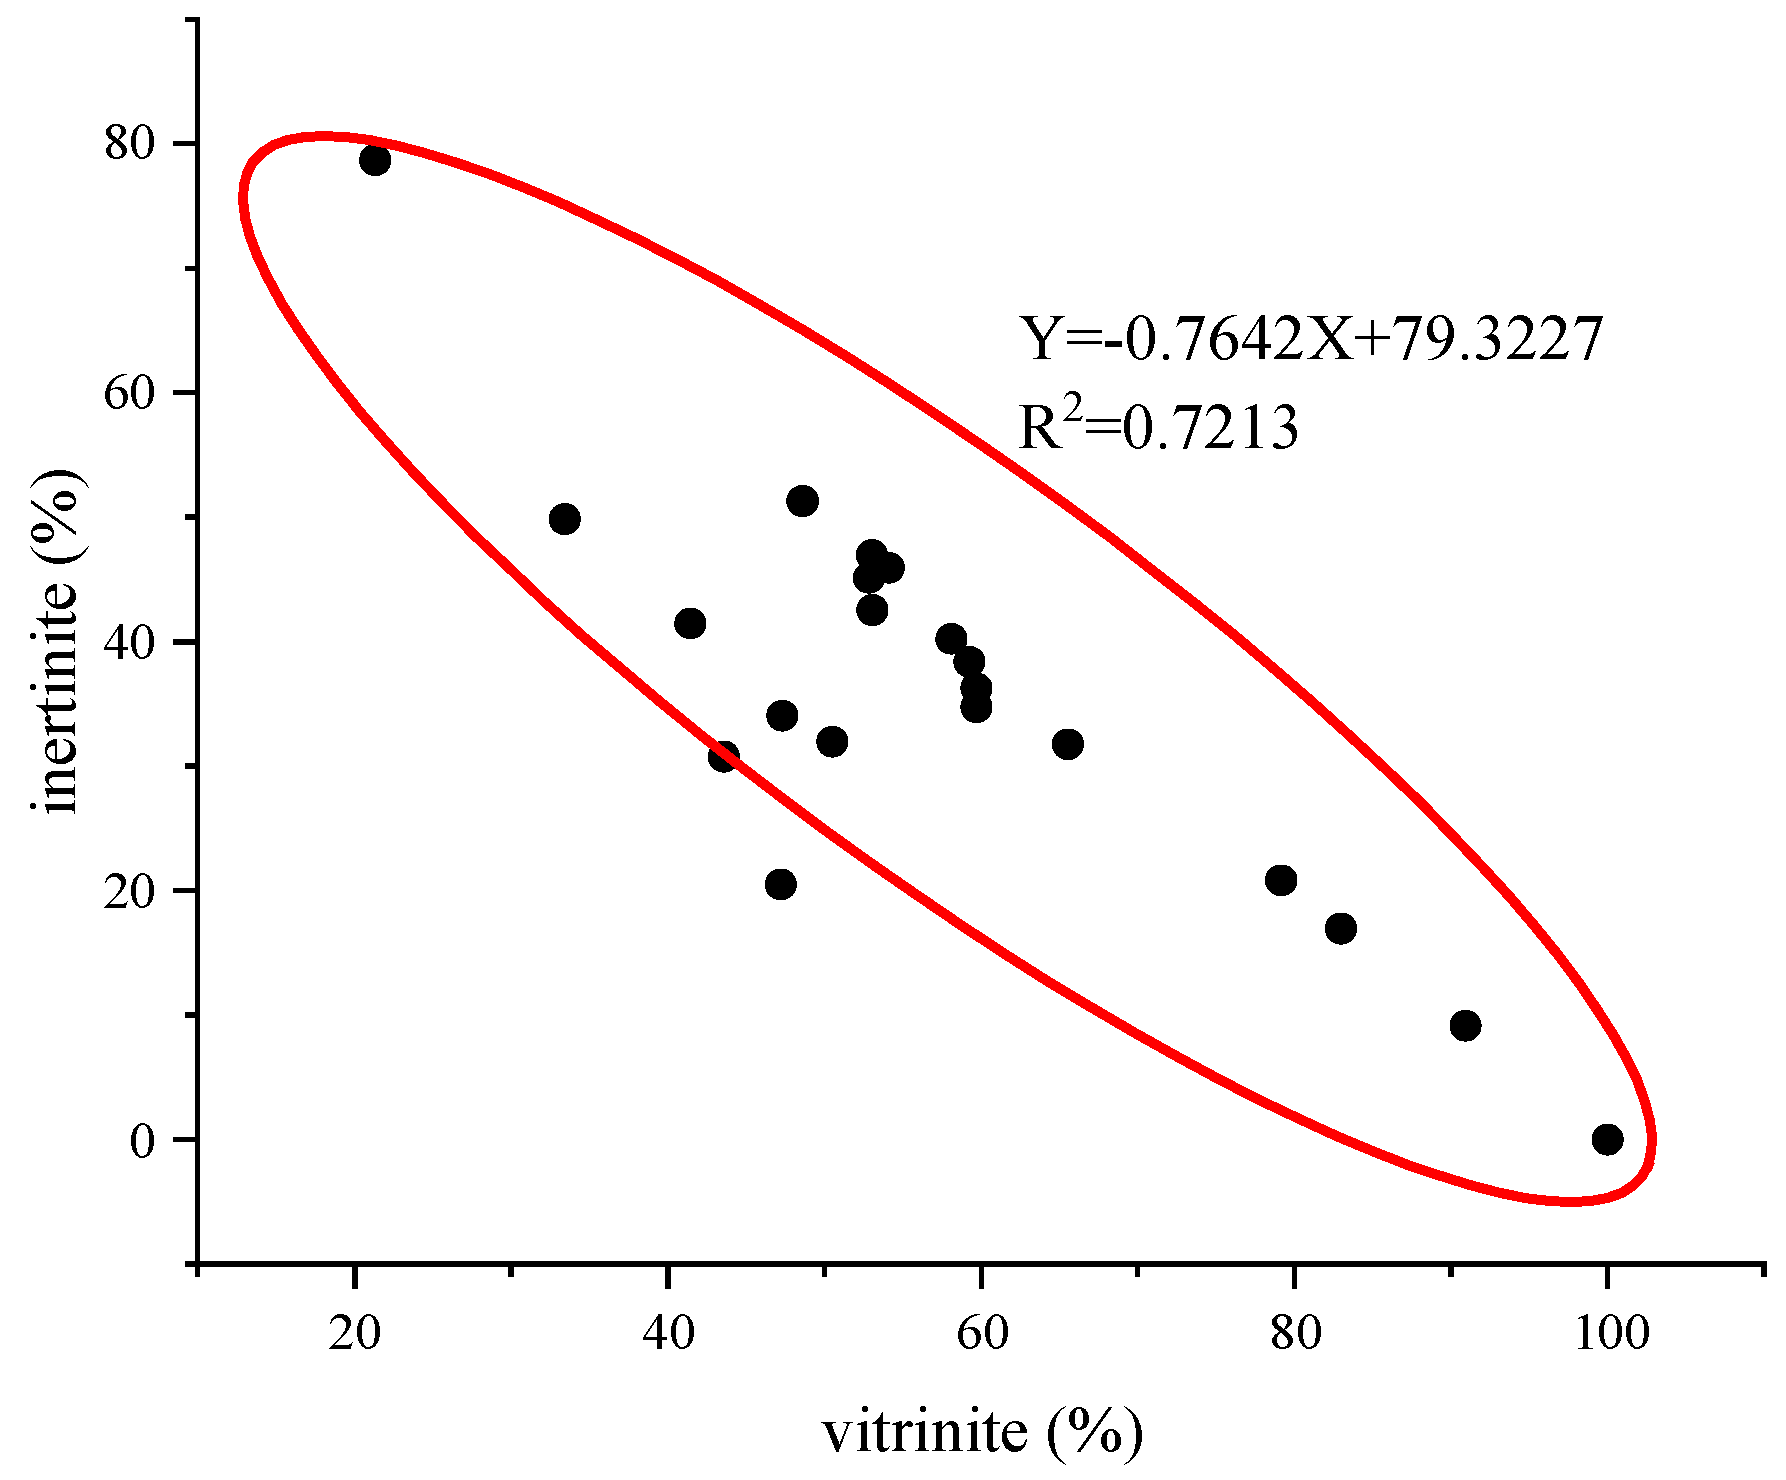
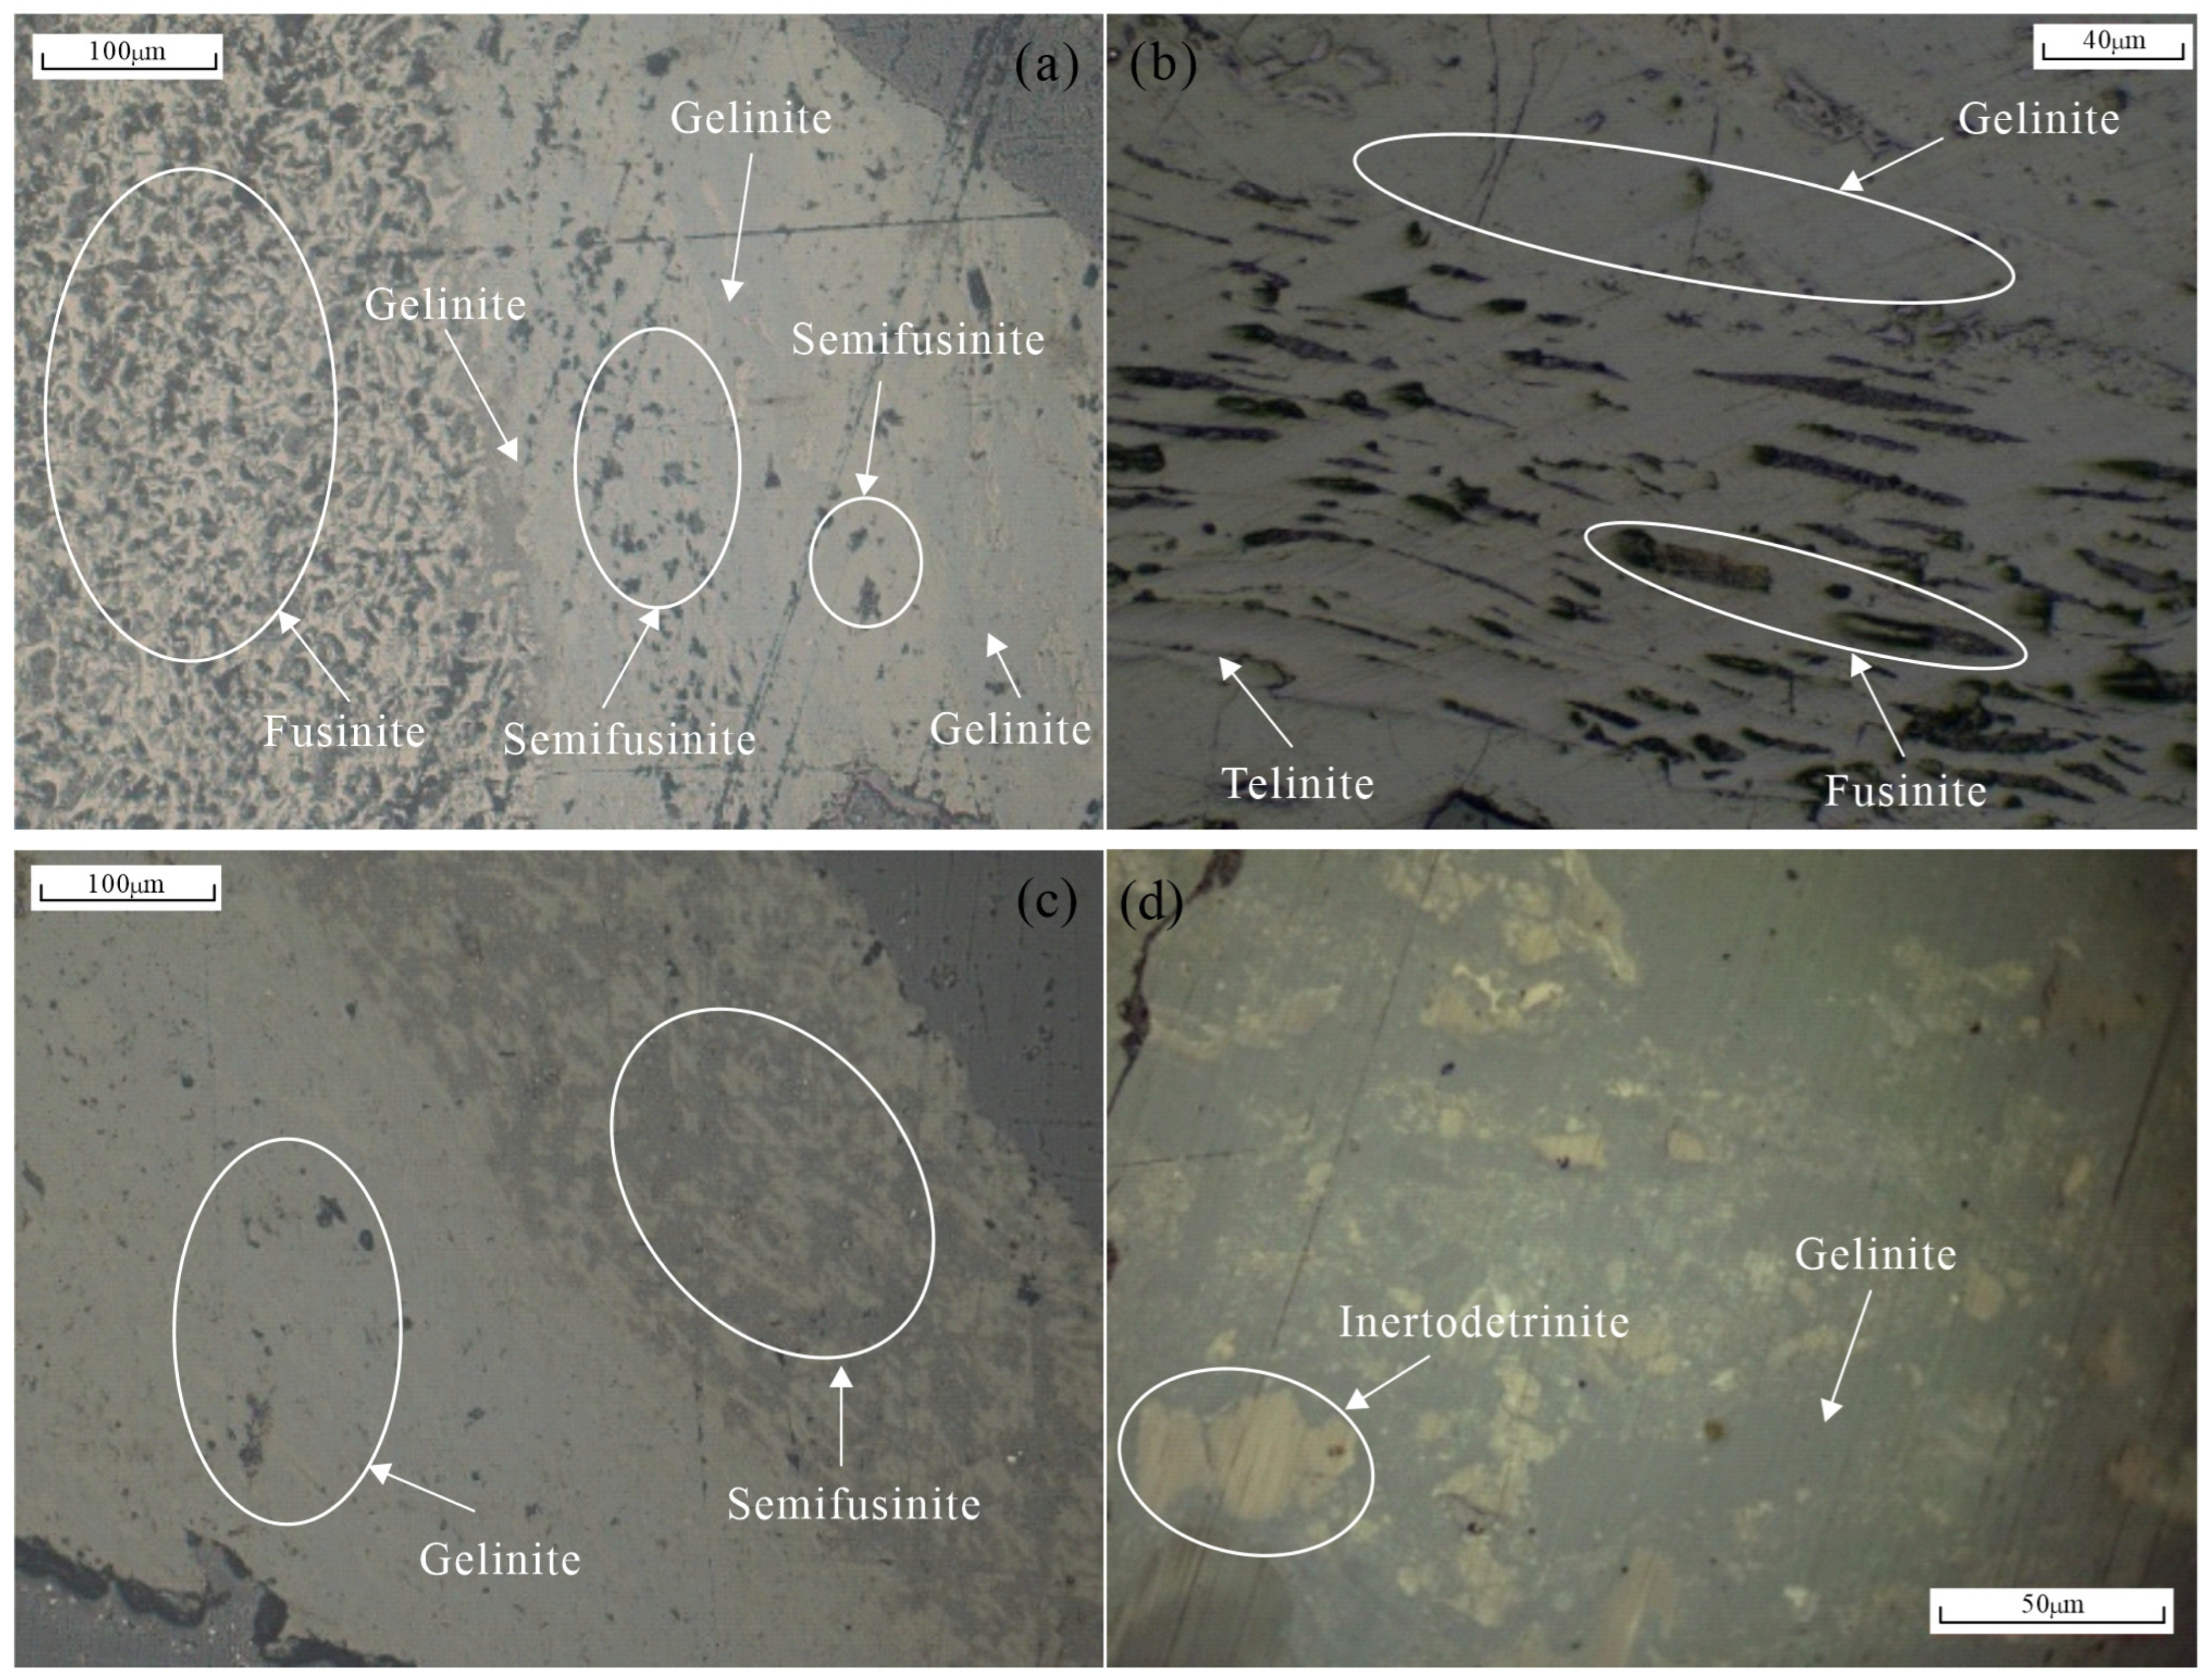
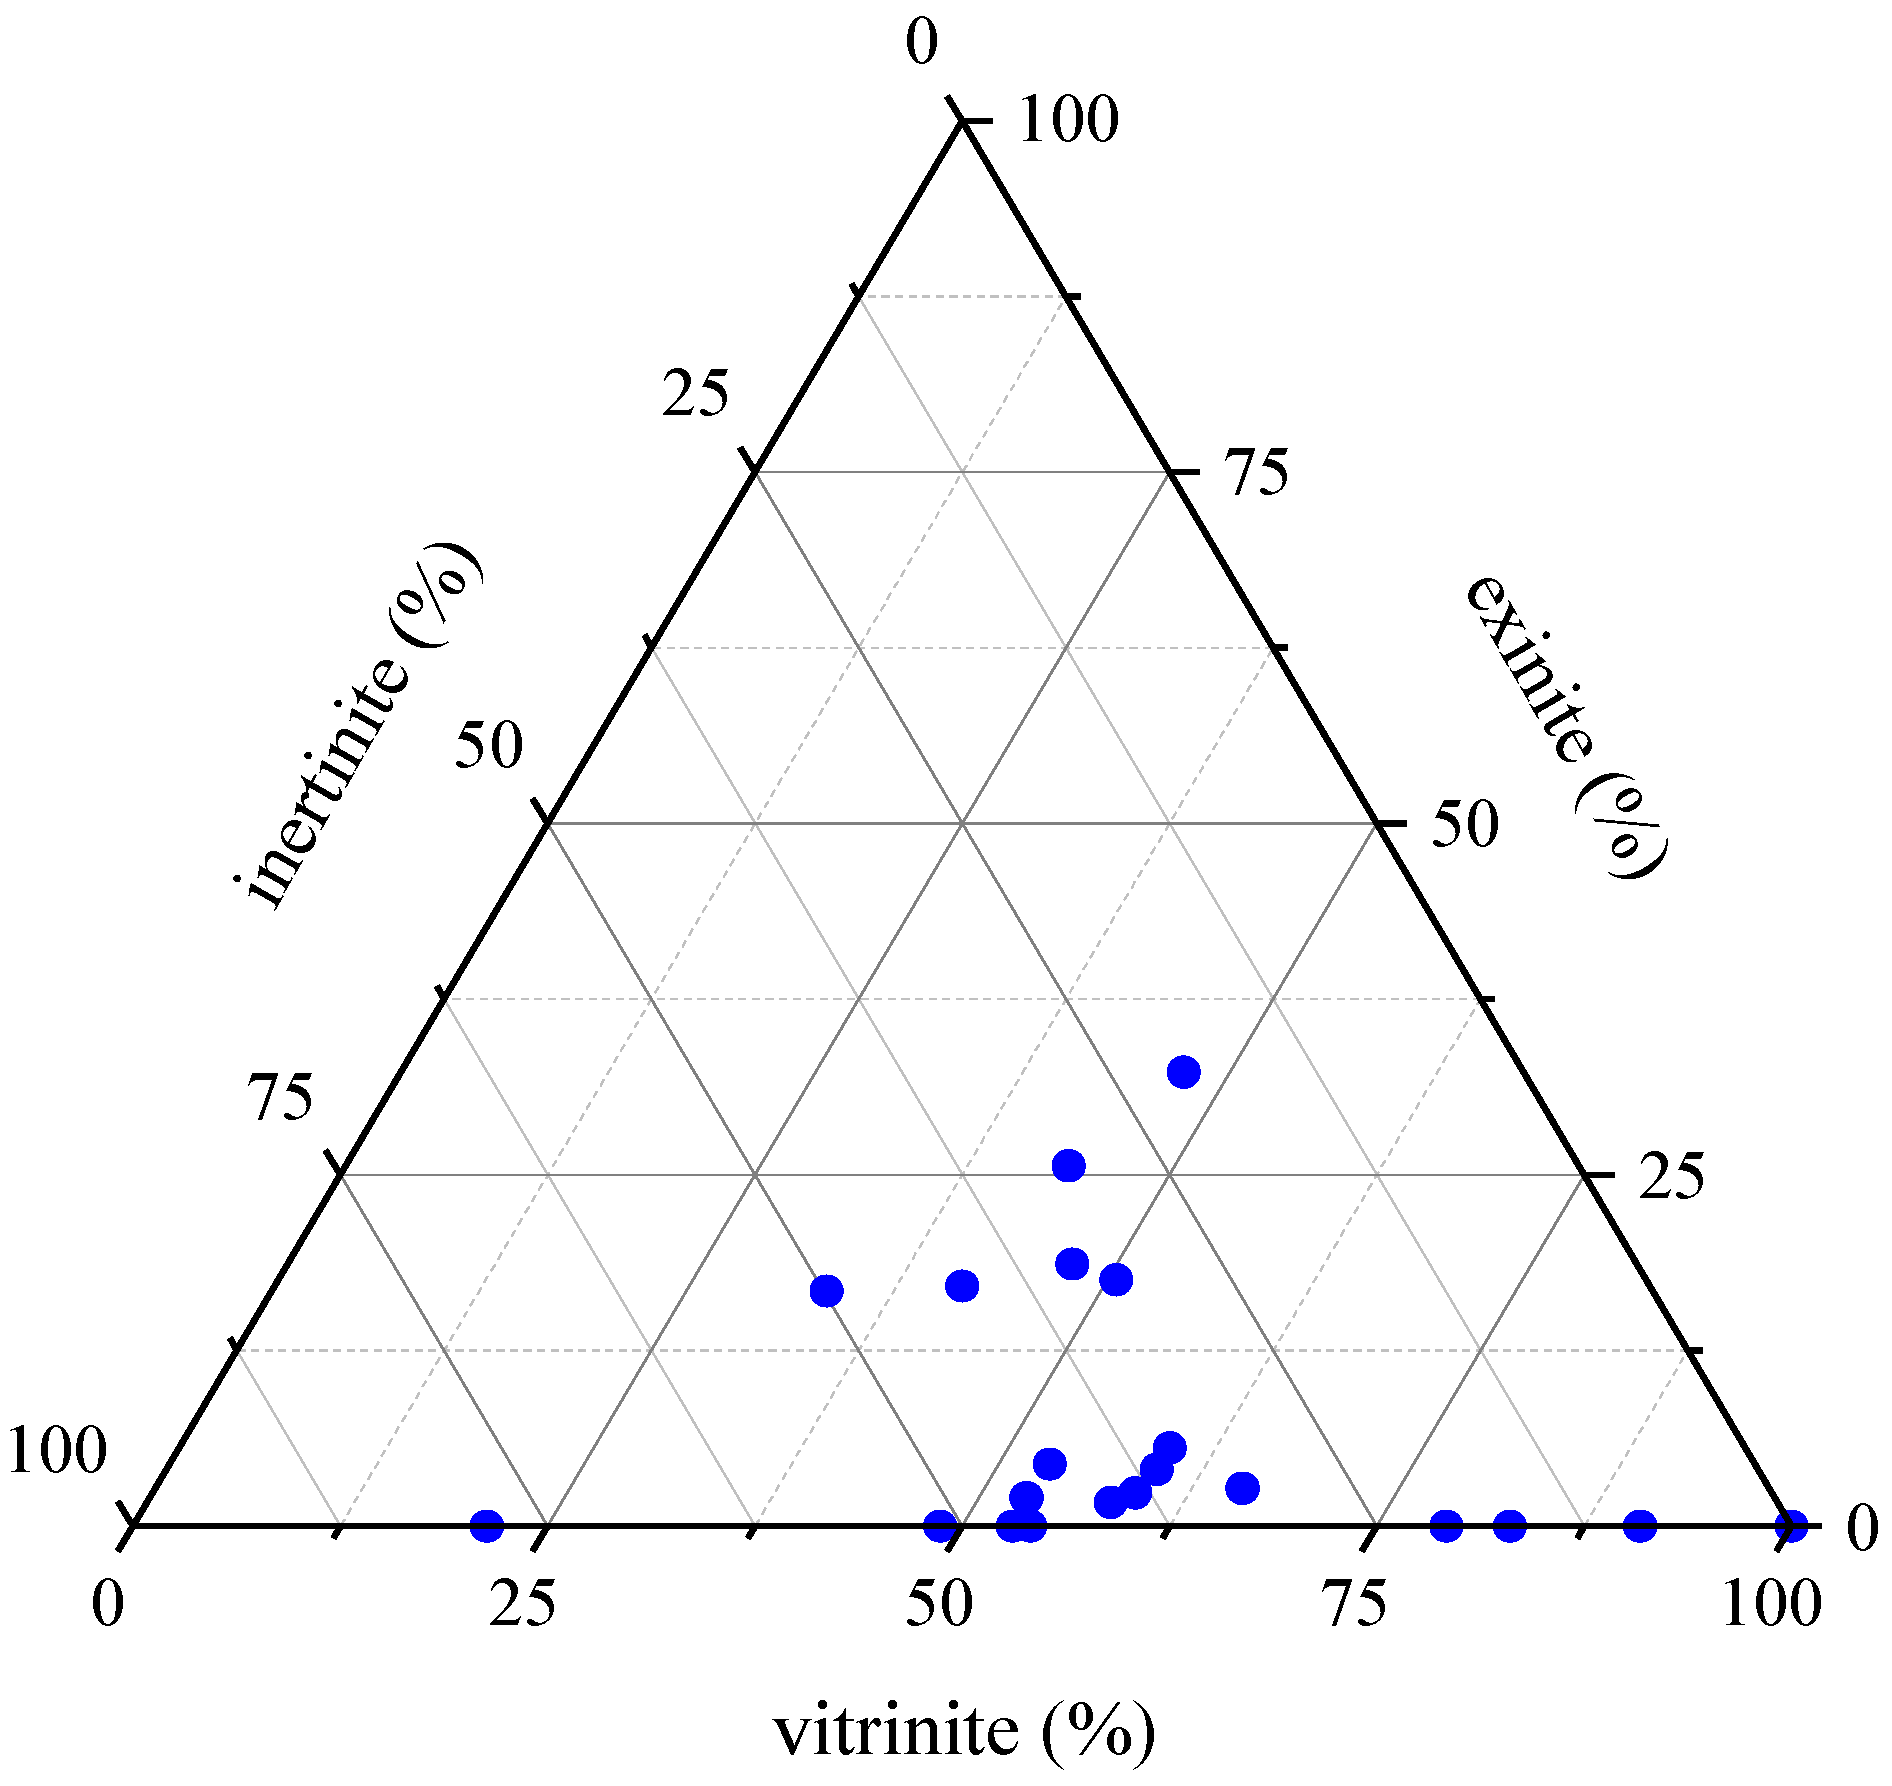
3.2.1. Coal Maceral

Under the microscope, it can be observed that S1 (Figure 3a) from left to right are filamentous bodies, matrix endoplasmic bodies, hemifilamentous bodies, matrix endoplasmic bodies, hemifilamentous bodies, and matrix endoplasmic bodies. In the matrix endoplasmic bodies, there are cementing microsomes, coarse particles, and inerting particles. The filamentous body cell cavity is filled with glial endoplasmic bodies and clay minerals. S3 (Figure 3b) The matrix endoplastids, filamentous bodies, and structural endoplastid 2 are distributed in a strip-like pattern. The matrix endoplastids are cementing coarse grains, microparticles, and clay minerals. The exudate asphaltenes filled the cell cavities of structural endoplastid 2 and filamentous bodies. Fissures develop. On the left side of S9 (Figure 3c) is the matrix endoplastid, and on the right side is the hemicellulosome. The matrix endoplastid cements coarse grains, microparticles, and clay minerals, while the hemicellulosome cell cavity is filled with clay minerals. S16 (Figure 3d) matrix vitrinite cementitious detrital inert body. In terms of the overall content (Figure 4), the content of the vitrinite ranged from 21.35 to 100%, with an average of 54.24%. The content of the exinite ranged from 0 to 32.29%, with an average of 7.1457%. The content of the inertinite ranged from 0 to 78.67%, with an average of 35.5824%. Overall, the contents of the vitrinite and the inertinite are the main components. Ro,max ranged from 1.87 to 2.35%, with an average of 1.9971%, belonging to the highly mature stage.
Based on the results of microscopic component determination, it can be known that the contents of the vitrinite and the inertinite occupy the main part of the microscopic components, and the sum of the contents of the two accounts for about 90% of the coal maceral. Meanwhile, based on the results of the correlation analysis (Figure 5), there is a strong negative correlation between the vitrinite and the inertinite, with an R2 as high as 0.7213. Therefore, the two can establish the following mutual calculation and explanation model:
I = 0.7642 V + 79.3227
I, inertinite conten, %; V, vitrinite content, %
Figure 5. The correlation between the vitrinite and the inertinite.
Processes 13 02062 g005
Based on the results of the correlation analysis of the content of microscopic components by logging parameters, the content of vitrinite has a certain negative correlation with AC, and the determination coefficient R2 can reach more than 0.5. However, DEN and PE have a certain positive correlation with the content of the vitrinite, with the determination coefficients R2 being 0.7242 and 0.6436, respectively. Both are above 0.5. It can be demonstrated that the three parameters of AC, DEN, and PE selected have an explanatory ability for the content changes of the vitrinite and are the main logging response parameters (Figure 6). Similarly, the preferred CNL and GR have two kinds of correlations, one positive and one negative, with the determination coefficient R2 of the two being around 0.5. These two logging parameters can be regarded as the main logging response parameters of the exinite content (Figure 7). The maturity of organic matter plays a very important role in the evaluation of oil and gas [43]. The maximum reflectance of vitrinite (Ro,max) can reflect the maturity of coal. The results of the logging response analysis of Ro,max (Figure 8) show that the two parameters DEN and PE have a strong positive correlation with Ro,max, and they are the main logging response parameters of Ro,max. The determination coefficients R2 of both for Ro,max are above 0.8.

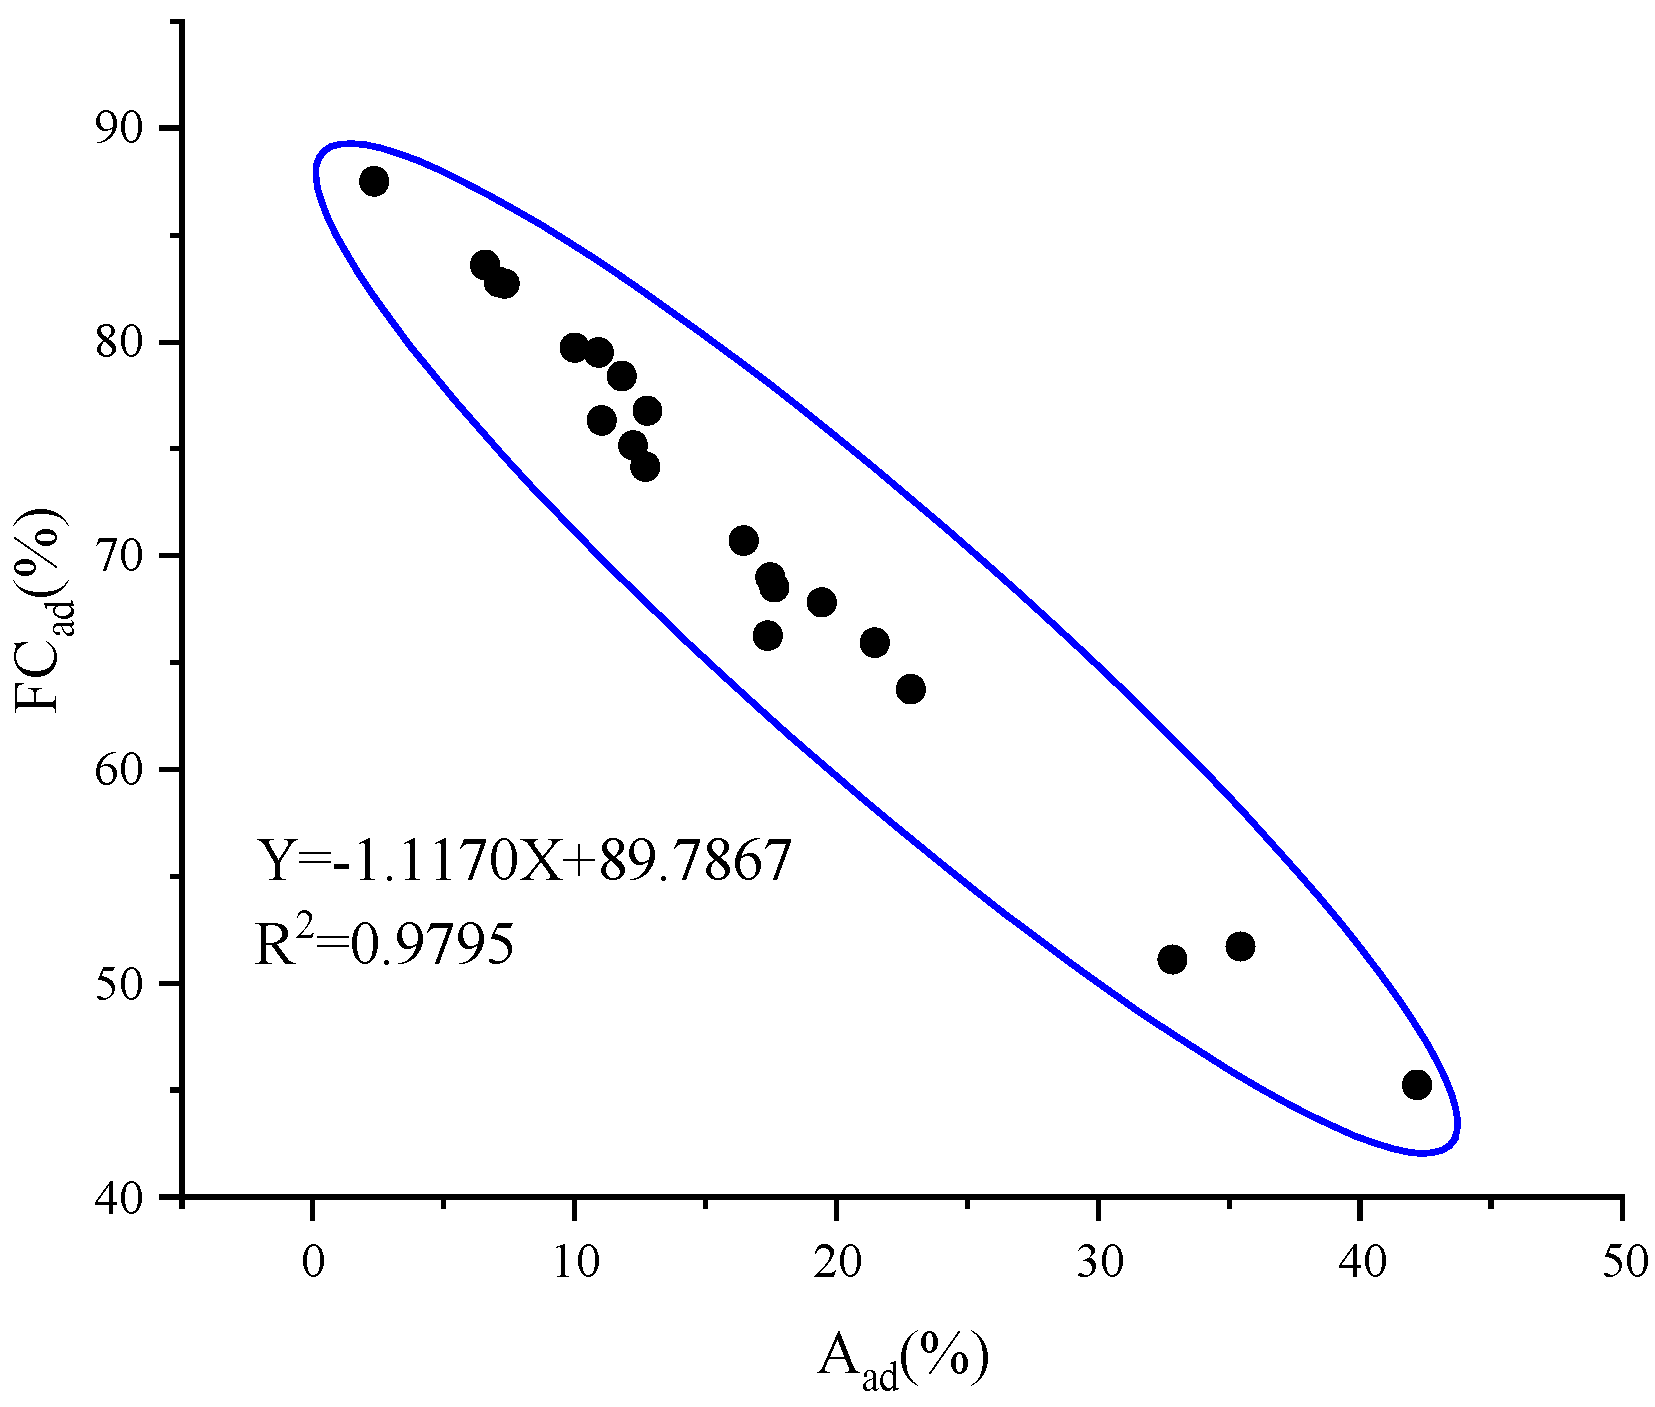
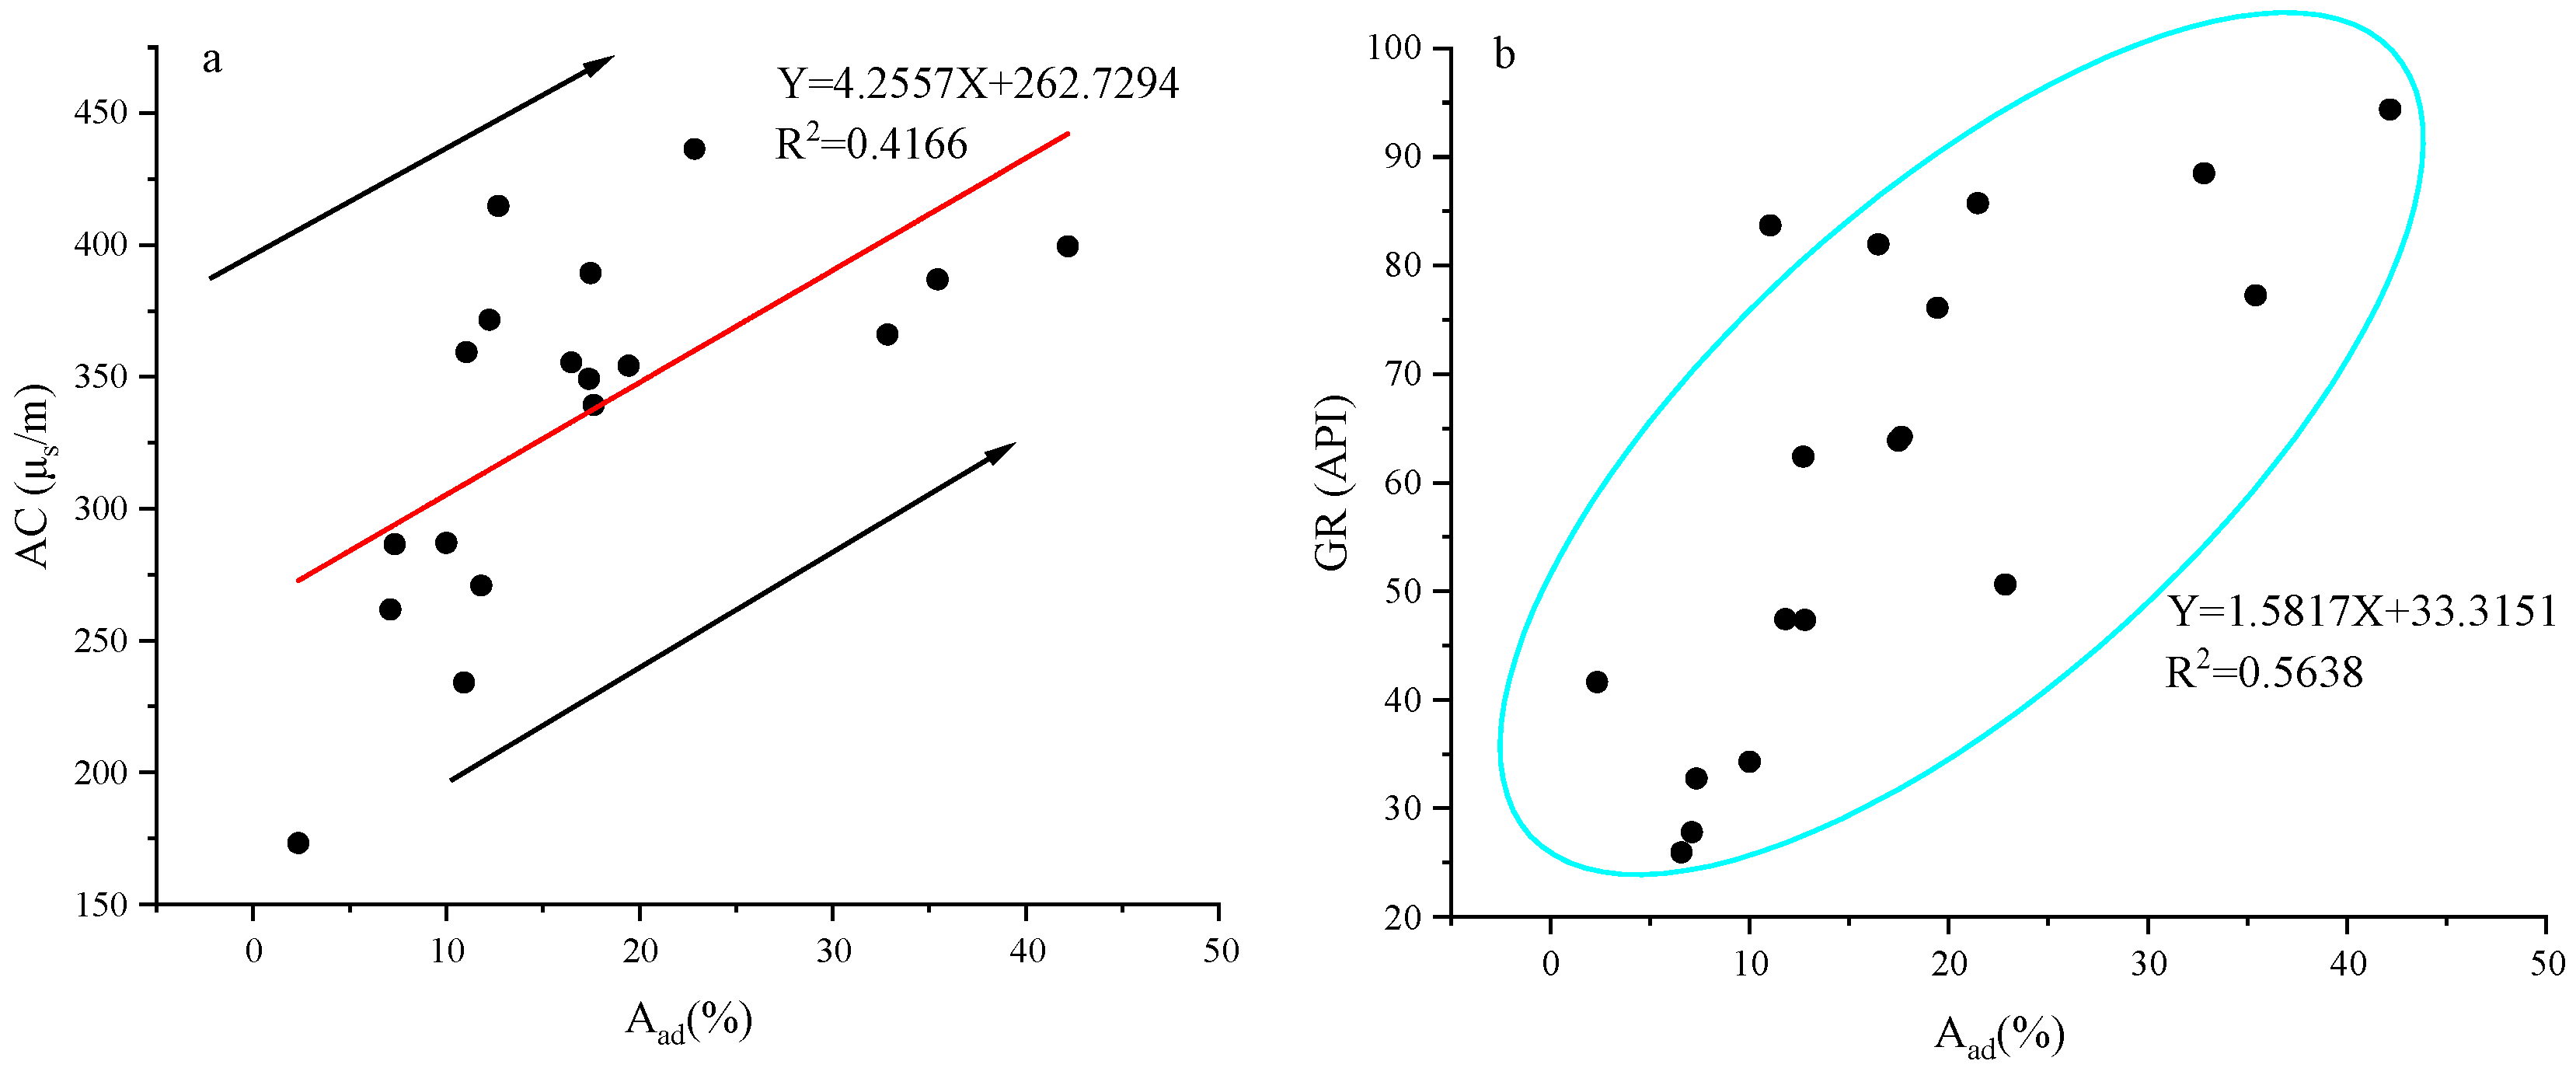
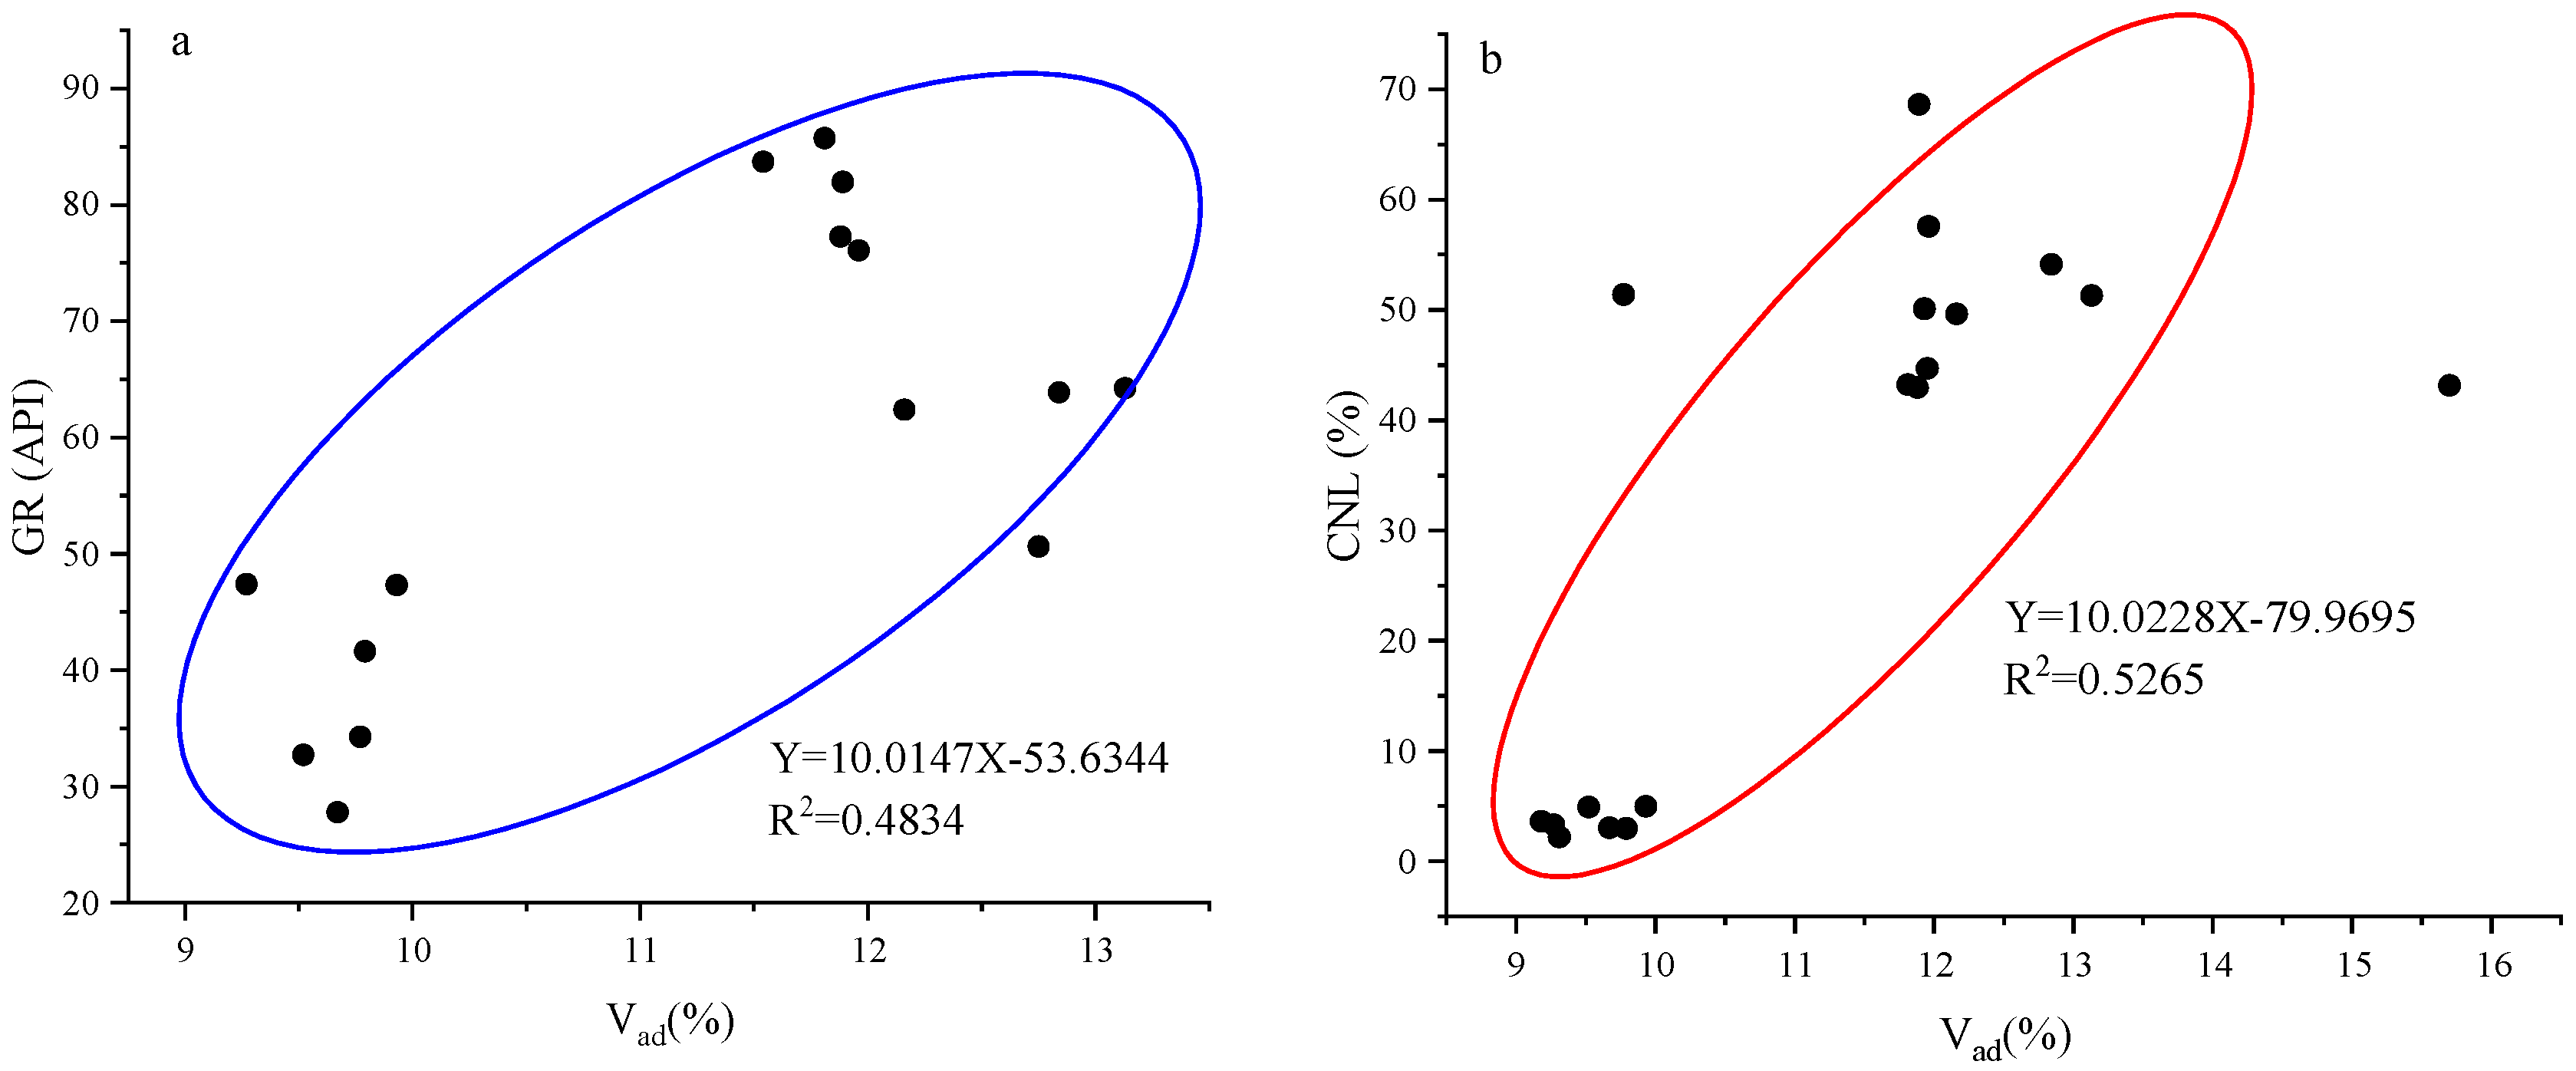
3.2.2. Industrial Components

The results of proximate analysis based on 21 collected samples show that the moisture content of coal samples in the study area ranges from 0.36 to 1.09%, with an average of 0.65%. The ash content ranged from 2.34 to 42.17%, with an average of 16.57%. The volatile matter content ranged from 9.48 to 15.7%, with an average of 11.5%. The fixed carbon ranged from 45.24% to 87.51%, with an average of 71.28%. The industrial components include moisture, volatile matter, ash, and fixed carbon. Among them, the ash content and fixed carbon content are the main components and have a strong negative correlation (Figure 9), with an R2 as high as 0.9795. The two can establish the following explanatory model:
F C a d = 1.117 A a d + 89.7867
Aad, ash content, %; FCad, fixed carbon content, %.
Figure 9. The relationship between ash and fixed carbon content.
Processes 13 02062 g009
According to the response results of proximate analysis and logging parameters, it can be observed that the ash content has a linear positive correlation with the two parameters AC and GR (Figure 10). The logging parameter responses of moisture are CNL, AC, DEN, and GR (Figure 11). As CNL, AC, and GR increase, the moisture content gradually increases, showing a certain positive correlation. However, the moisture content shows a negative correlation with DEN. The volatile matter content maintained a certain positive correlation with CNL and GR in the logging parameters (Figure 12).

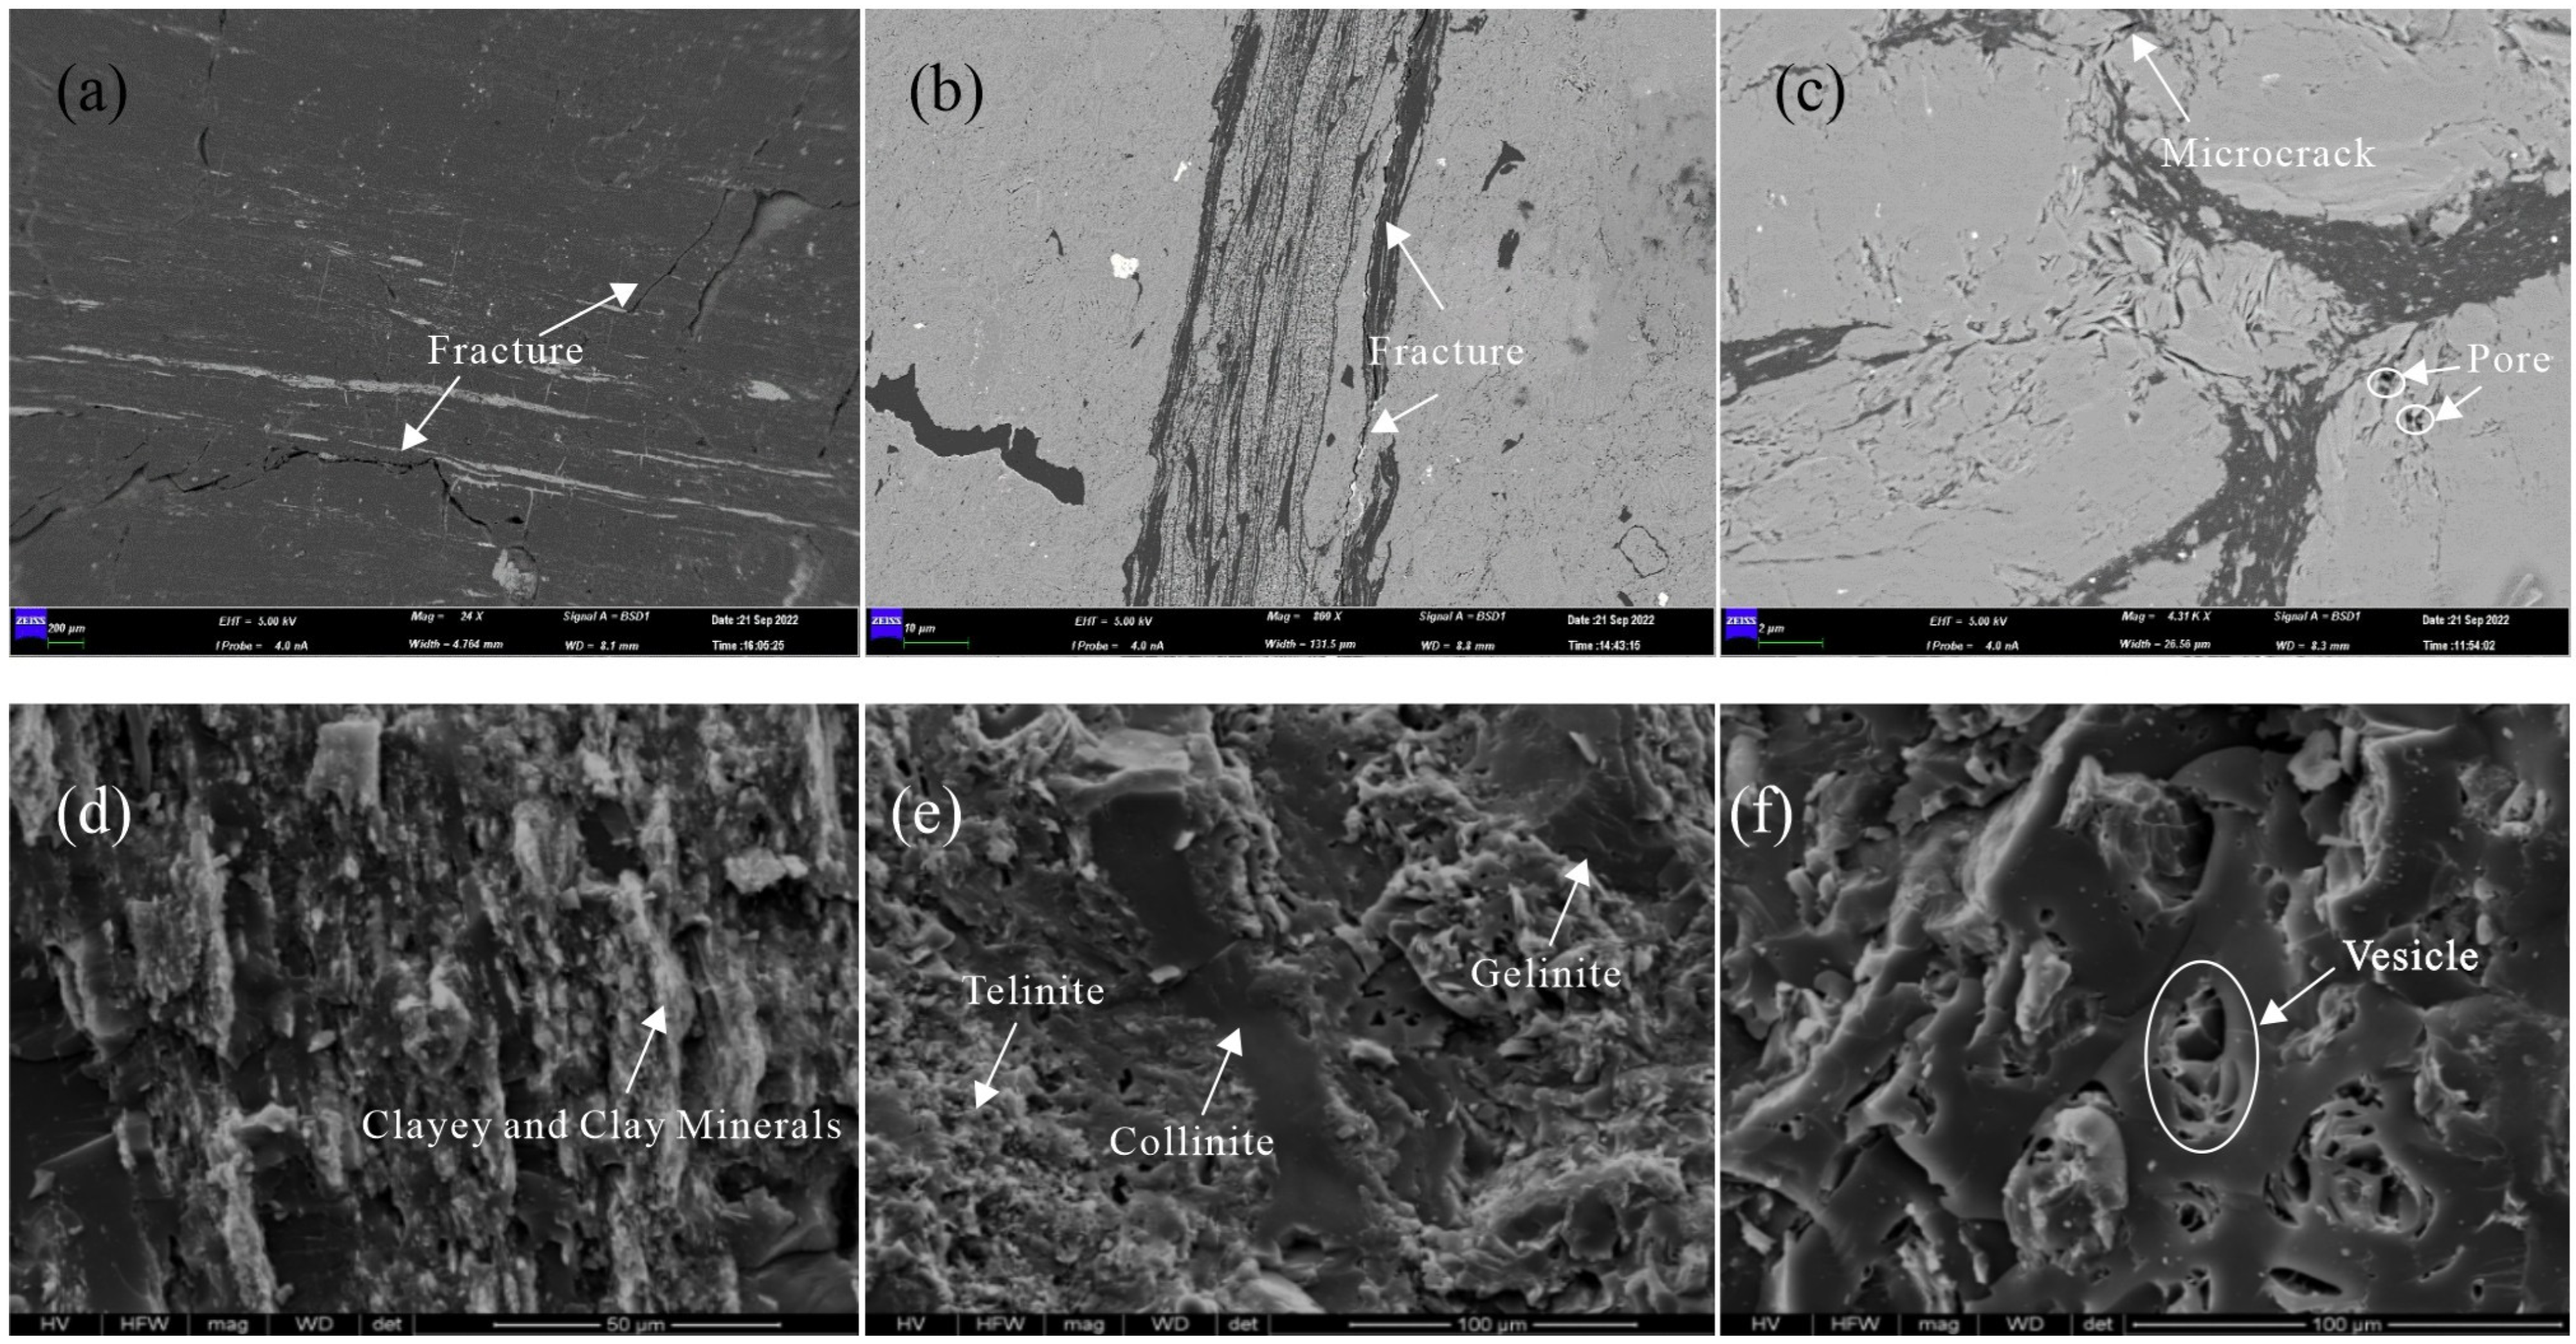
3.2.3. Development Characteristics of Pores and Fracture

Based on the results of SEM, it can be observed that in the coal samples of the study area, cracks can be developed, and minerals are distributed in strips (Figure 13a). In Figure 13b, the organic matter is distributed in strips and irregular blocks, and cracks also exist. In Figure 13c, it can be observed that the organic matter is distributed in a banded pattern, with a large amount of minerals filling it. A small number of organic matter pores and micro-cracks can also be seen. In Figure 13d, the mud is mainly composed of clay and clay minerals (mainly kaolinite), and the mud coexists with organic components. In Figure 13, there is a mixed layer where homogeneous endoplastids, matrix endoplastids, structural endoplastids, minerals, etc., can be observed. In Figure 13f, the cell cavity pores are filled with minerals, and sparse stomata can be seen.
Based on the test results of isothermal adsorption of carbon dioxide (Figure 14), the maximum adsorption capacity of S1–S7 coal samples in the coal samples of the study area ranged from 9.5928 to 15.748 cm3/g, with an average of 14.2711 cm3/g. The maximum adsorption capacity of the S8–S13 coal samples ranged from 7.8728 to 15.3119 cm3/g, with an average of 11.993 cm3/g. The maximum adsorption capacity of S14–S21 coal samples ranged from 18.0055 to 20.3395 cm3/g, with an average of 18.5811 cm3/g. Overall, the maximum adsorption capacity of coal samples ranged from 7.8728 to 20.3395 cm3/g, with an average of 15.2621 cm3/g. The adsorption curves of the samples mainly present a bimodal state, with the main pore diameters ranging from 0.5 to 0.7 nm (Figure 14b,d,f). The specific surface area (SSA) of pores in coal samples can provide occurrence conditions for adsorbed methane, and the pore volume (PV) can provide space for the occurrence of free gas (Table 2).
Previous studies have shown that micropores in coal reservoirs play a very important role in the storage of coal-rock gas [44]. By establishing the correlation among ash content, fixed carbon, and micropore volume (Figure 15), it can be observed that there is a very strong negative correlation between ash content and micropore volume, with R2 reaching 0.7116 (Figure 15a). The fixed carbon has a very strong positive correlation with the PV of micropores, and the fitting degree R2 can reach 0.7155 (Figure 15b), which is similar to that of ash and the pore volume of micropores. The SSA of micropores can provide adsorption sites for adsorbed methane and increase the gas-containing potential of deep coal-rock gas [44]. Based on the established correlation between the PV and SSA of micropores, it is shown that there is a strong correlation between the PV and SSA of micropores, and the determination coefficient R2 can reach 0.9948 (Figure 15c).

3.2.4. Gas-Bearing Logging Characteristics

Based on the results of the on-site desorption experiments in the study area, the gas content of the Mizhi Block ranged from 12.97 to 33.96 m3/t, with an average of 21.82 m3/t. The gas content is higher than that of the Yan’an Gas Field and the Daningji County block [30]. The response results of logging parameters to gas content show (Figure 16) that there is a certain positive correlation between gas content and DEN, and its R2 can reach 0.472 (Figure 16a). The R2 obtained by fitting AC with the gas content can reach 0.3327, which is smaller compared with DEN (Figure 16b). PE maintained a certain positive correlation with the gas content, with R2 being 0.4358 (Figure 16c).

3.3. Logging Interpretation Model and Verification of Coal Reservoir Parameters

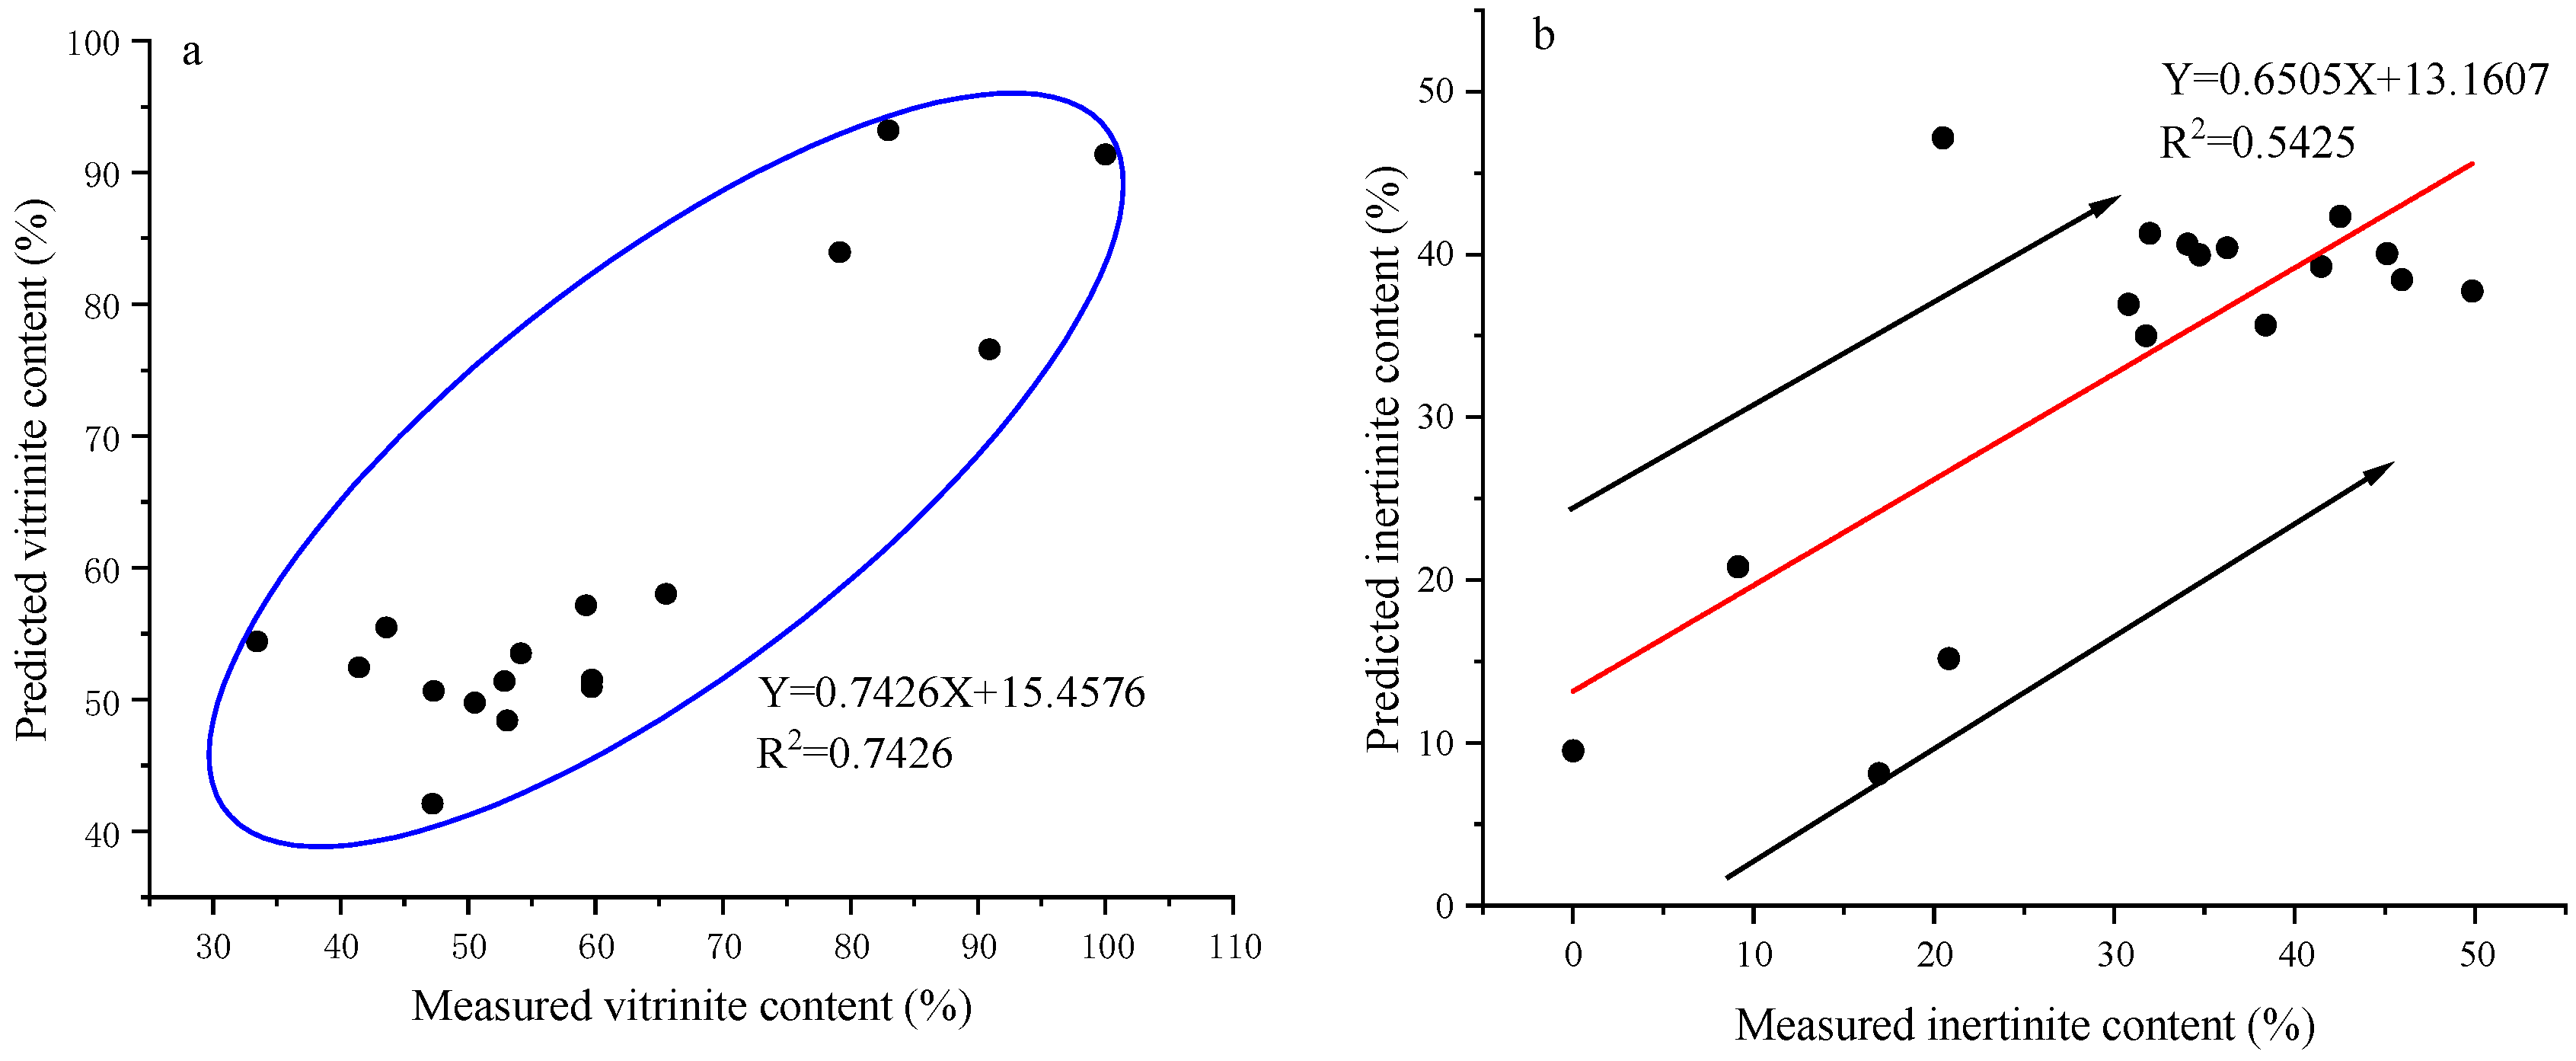
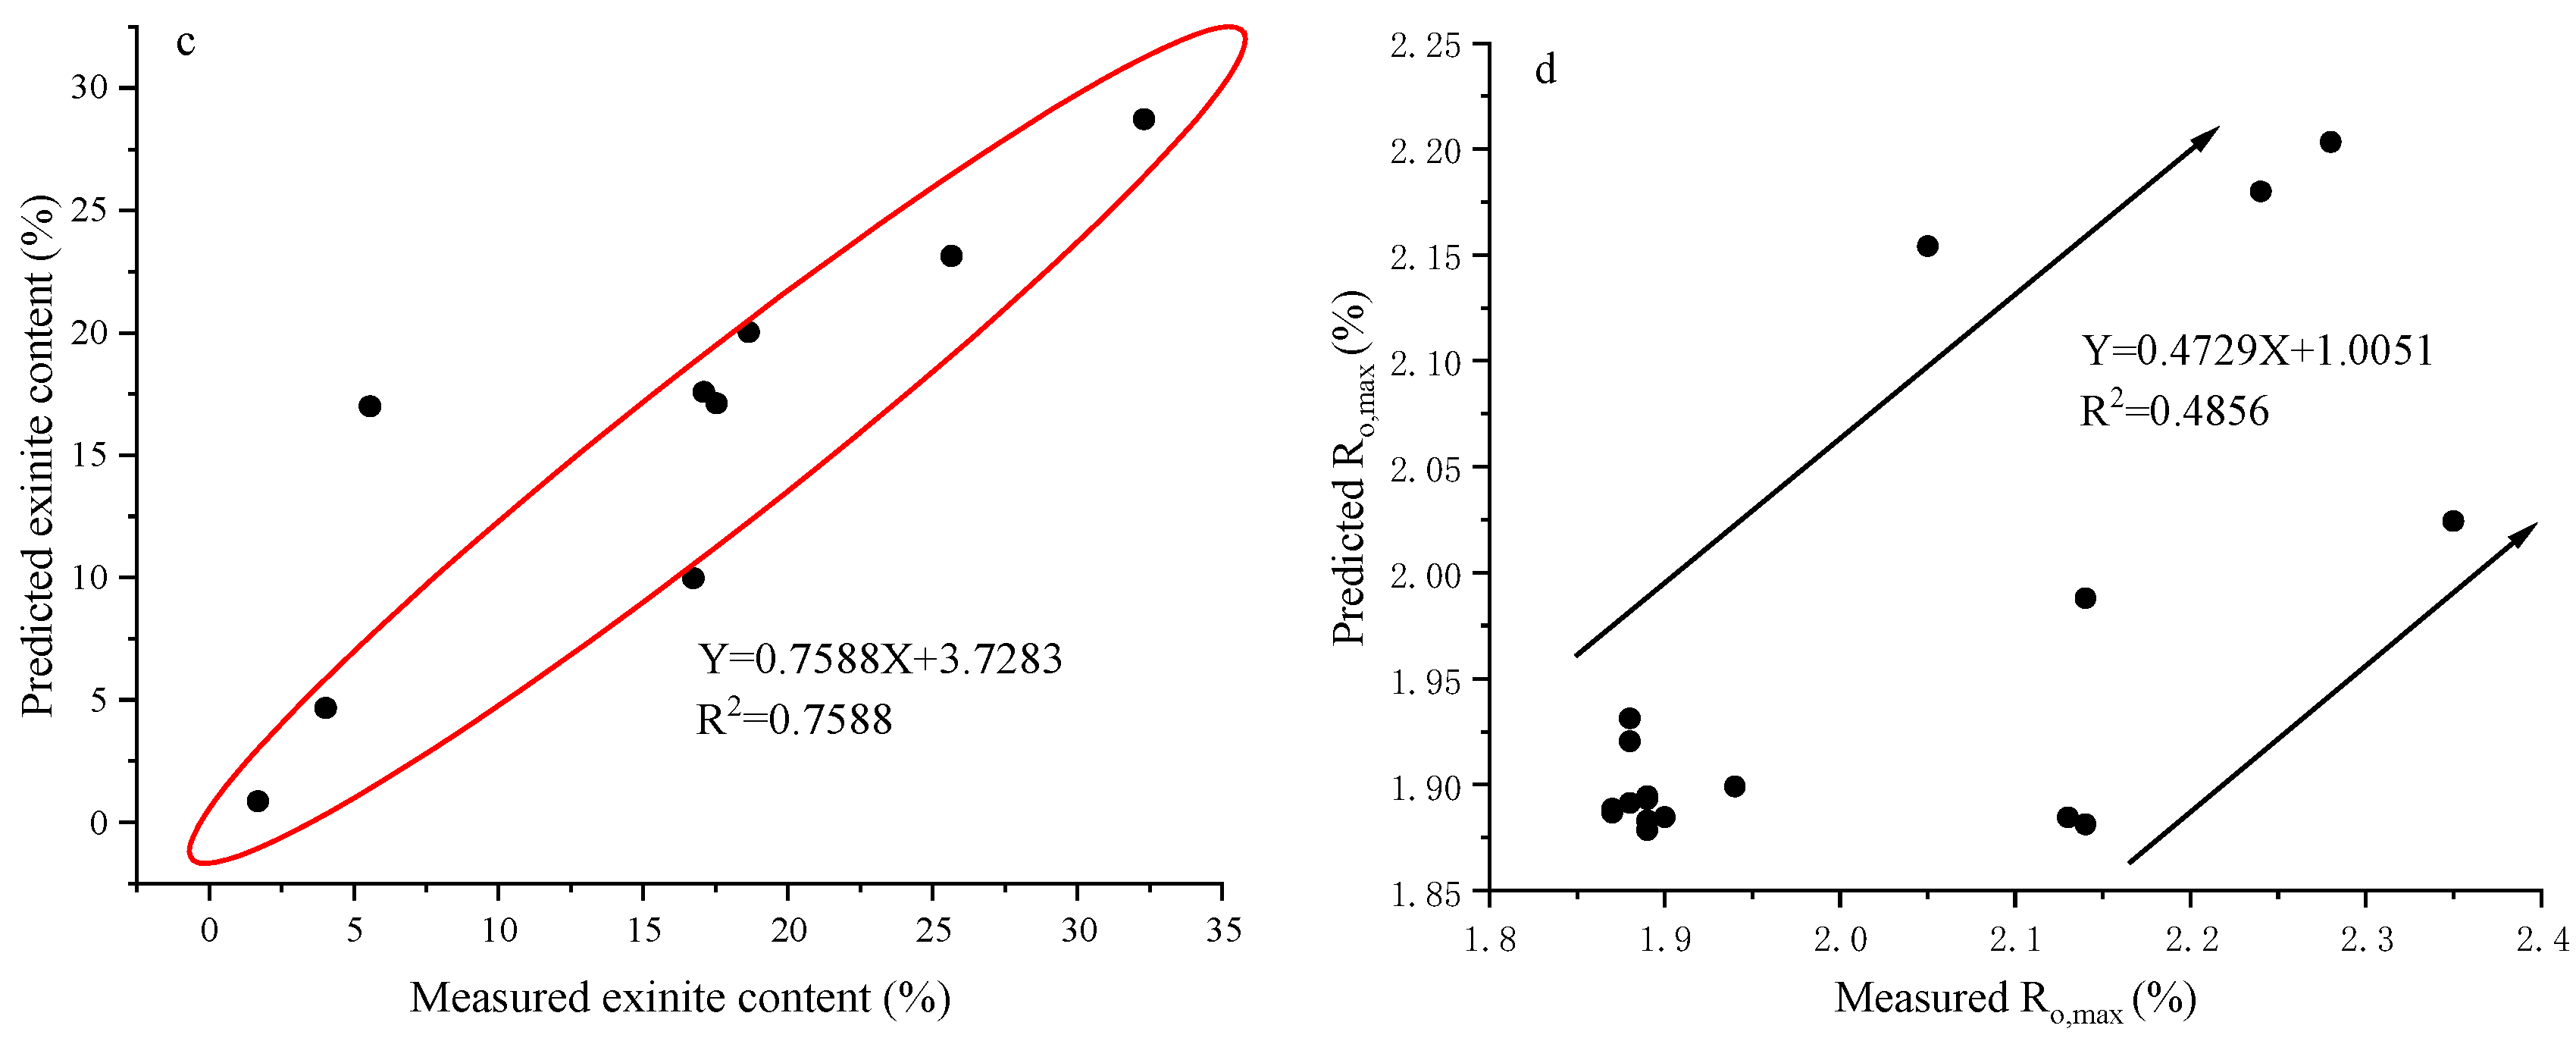
3.3.1. Microscopic Component Logging Interpretation Model

Based on the response results of logging parameters before this research, the selected logging parameters were subjected to multivariate linear fitting to obtain the following explanatory model of vitrinite content:
V = 0.01486 A C + 47.39822 D E N 3.8295 P E 12.4634
V, vitrinite content, %; AC, transit time interval, μs/m; DEN, density, g/cm3; PE, photoelectric absorption cross-sectional index, barns /e.
Meanwhile, the combined Formula (1) can be used to calculate the following explanatory model of the inertinite:
I = 0.0114 A C 36.22 D E N + 2.926 P E + 88.8467
I, inertinite content, %; AC, transit time interval, μs/m; DEN, density, g/cm3; PE, photoelectric absorption cross-sectional index, barns/e.
Similarly, the following exinite interpretation model can be obtained:
E = 0.8052 C N L 0.4749 G R + 6.775
E, exinite content, %; CNL, supplementary neutron, %; GR, Natural Gamma, API.
Based on the logging response situations of Ro,max mentioned earlier, the interpretation model is established as follows:
R o , m a x = 0.071 D E N + 0.0598 P E + 1.7349
Ro,max, maximum reflectance of vitrinite, %; DEN, density, g/cm3; PE, photoelectric absorption interface index, barns/e.
The verification was carried out based on the established interpretation model, and the obtained interpretation results were in high agreement with the actual data (Figure 17).

3.3.2. Industrial Component Logging Interpretation Model

Based on the response results of logging parameters before this paper, the interpretation models of ash content, moisture content, and volatile matter content obtained by multivariate linear fitting of the selected logging parameters are as follows:
A a d = 0.0424 A C + 0.2319 G R 12.0849
M a d = 0.0015 C N L + 0.0022 A C + 0.2192 D E N + 0.0108 G R 0.9836
V a d = 0.0303 G R + 0.0276 C N L + 8.3859
Aad, ash content, %; Mad, moisture content, %; Vad, Volatile matter content, %; AC, transit time interval, μs/m; GR, Natural Gamma, API; CNL, supplement neutrons, %.
The following fixed carbon content explanation model is jointly obtained based on Formulas (2) and (7):
F C a d = 0.00474 A C 0.2589 G R + 103.2855
FCad, fixed carbon content, %; AC, transit time interval, μs/m; GR, Natural Gamma, API.
The verification results of the explanatory model are shown in Figure 18. The results of the explanatory model indicate that this model can effectively explain ash content, moisture, volatile matter, and fixed carbon content. Especially for the content of moisture and volatile matter, it has an explanatory effect. The determination coefficients of the actual data and the explanatory results can reach above 0.90 and 0.60, respectively. The determination coefficients of the interpretation results and actual data of ash content and fixed carbon are both above 0.40. The higher the determination coefficient is, the better the data fits.

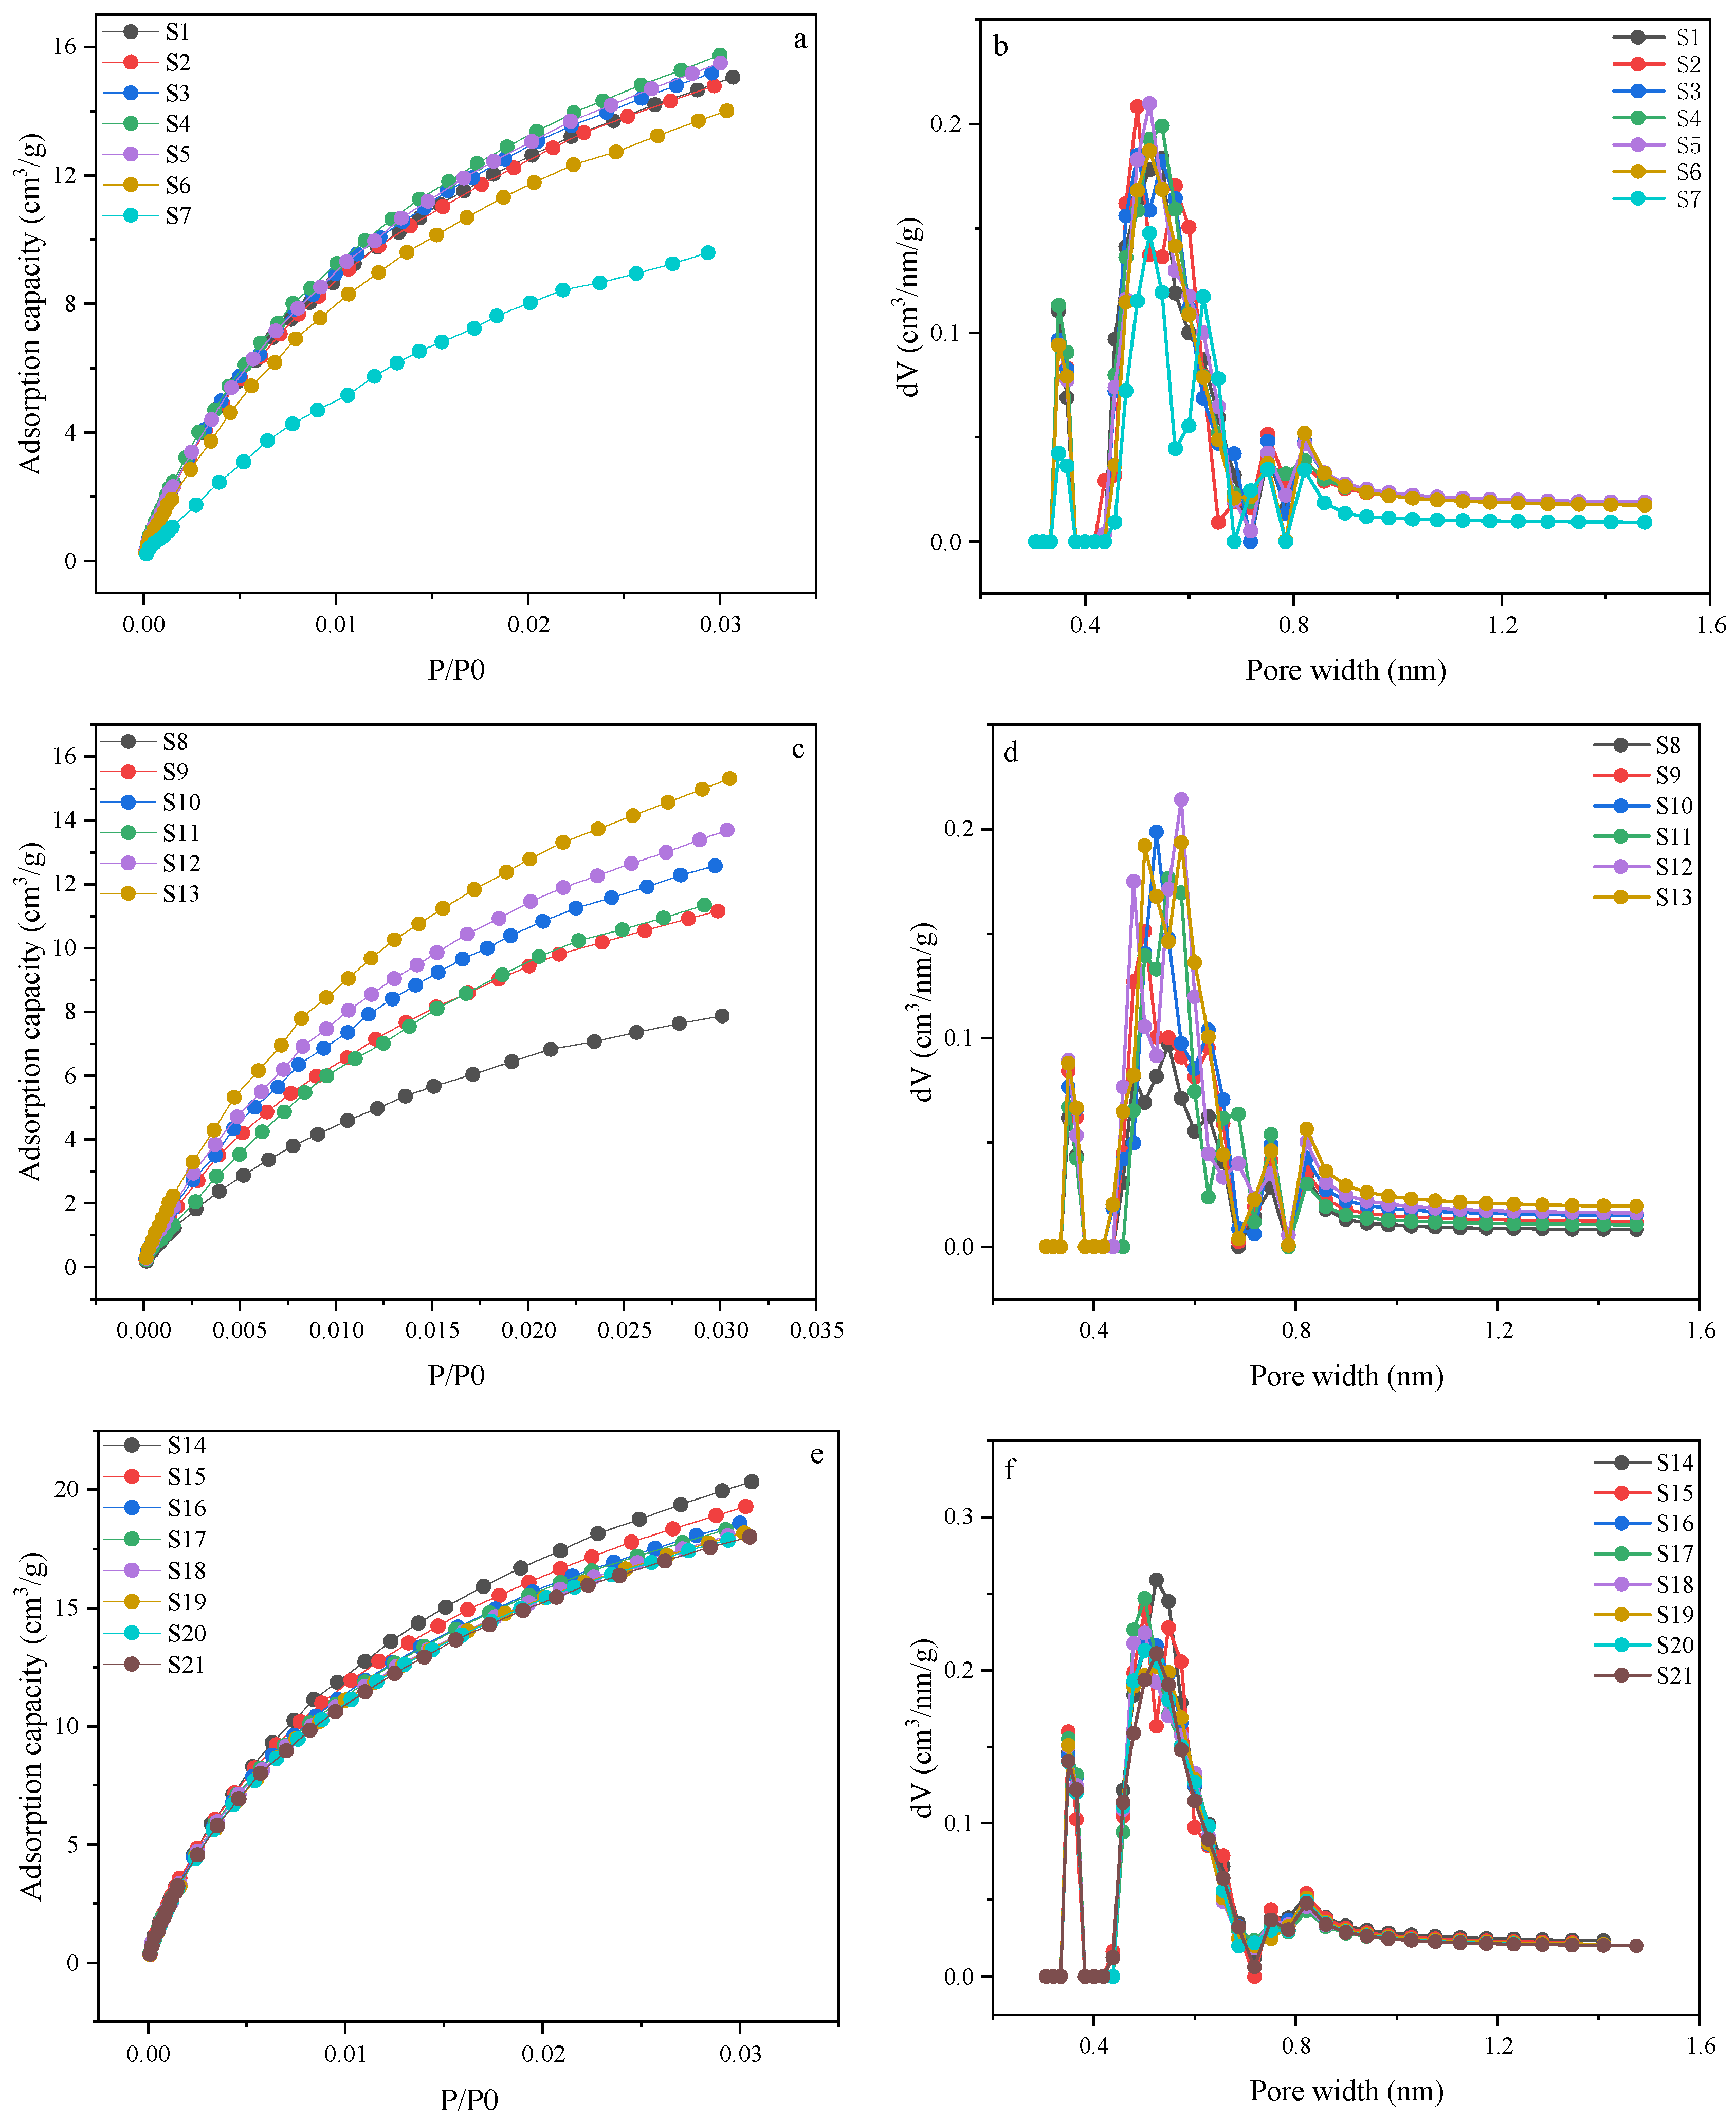
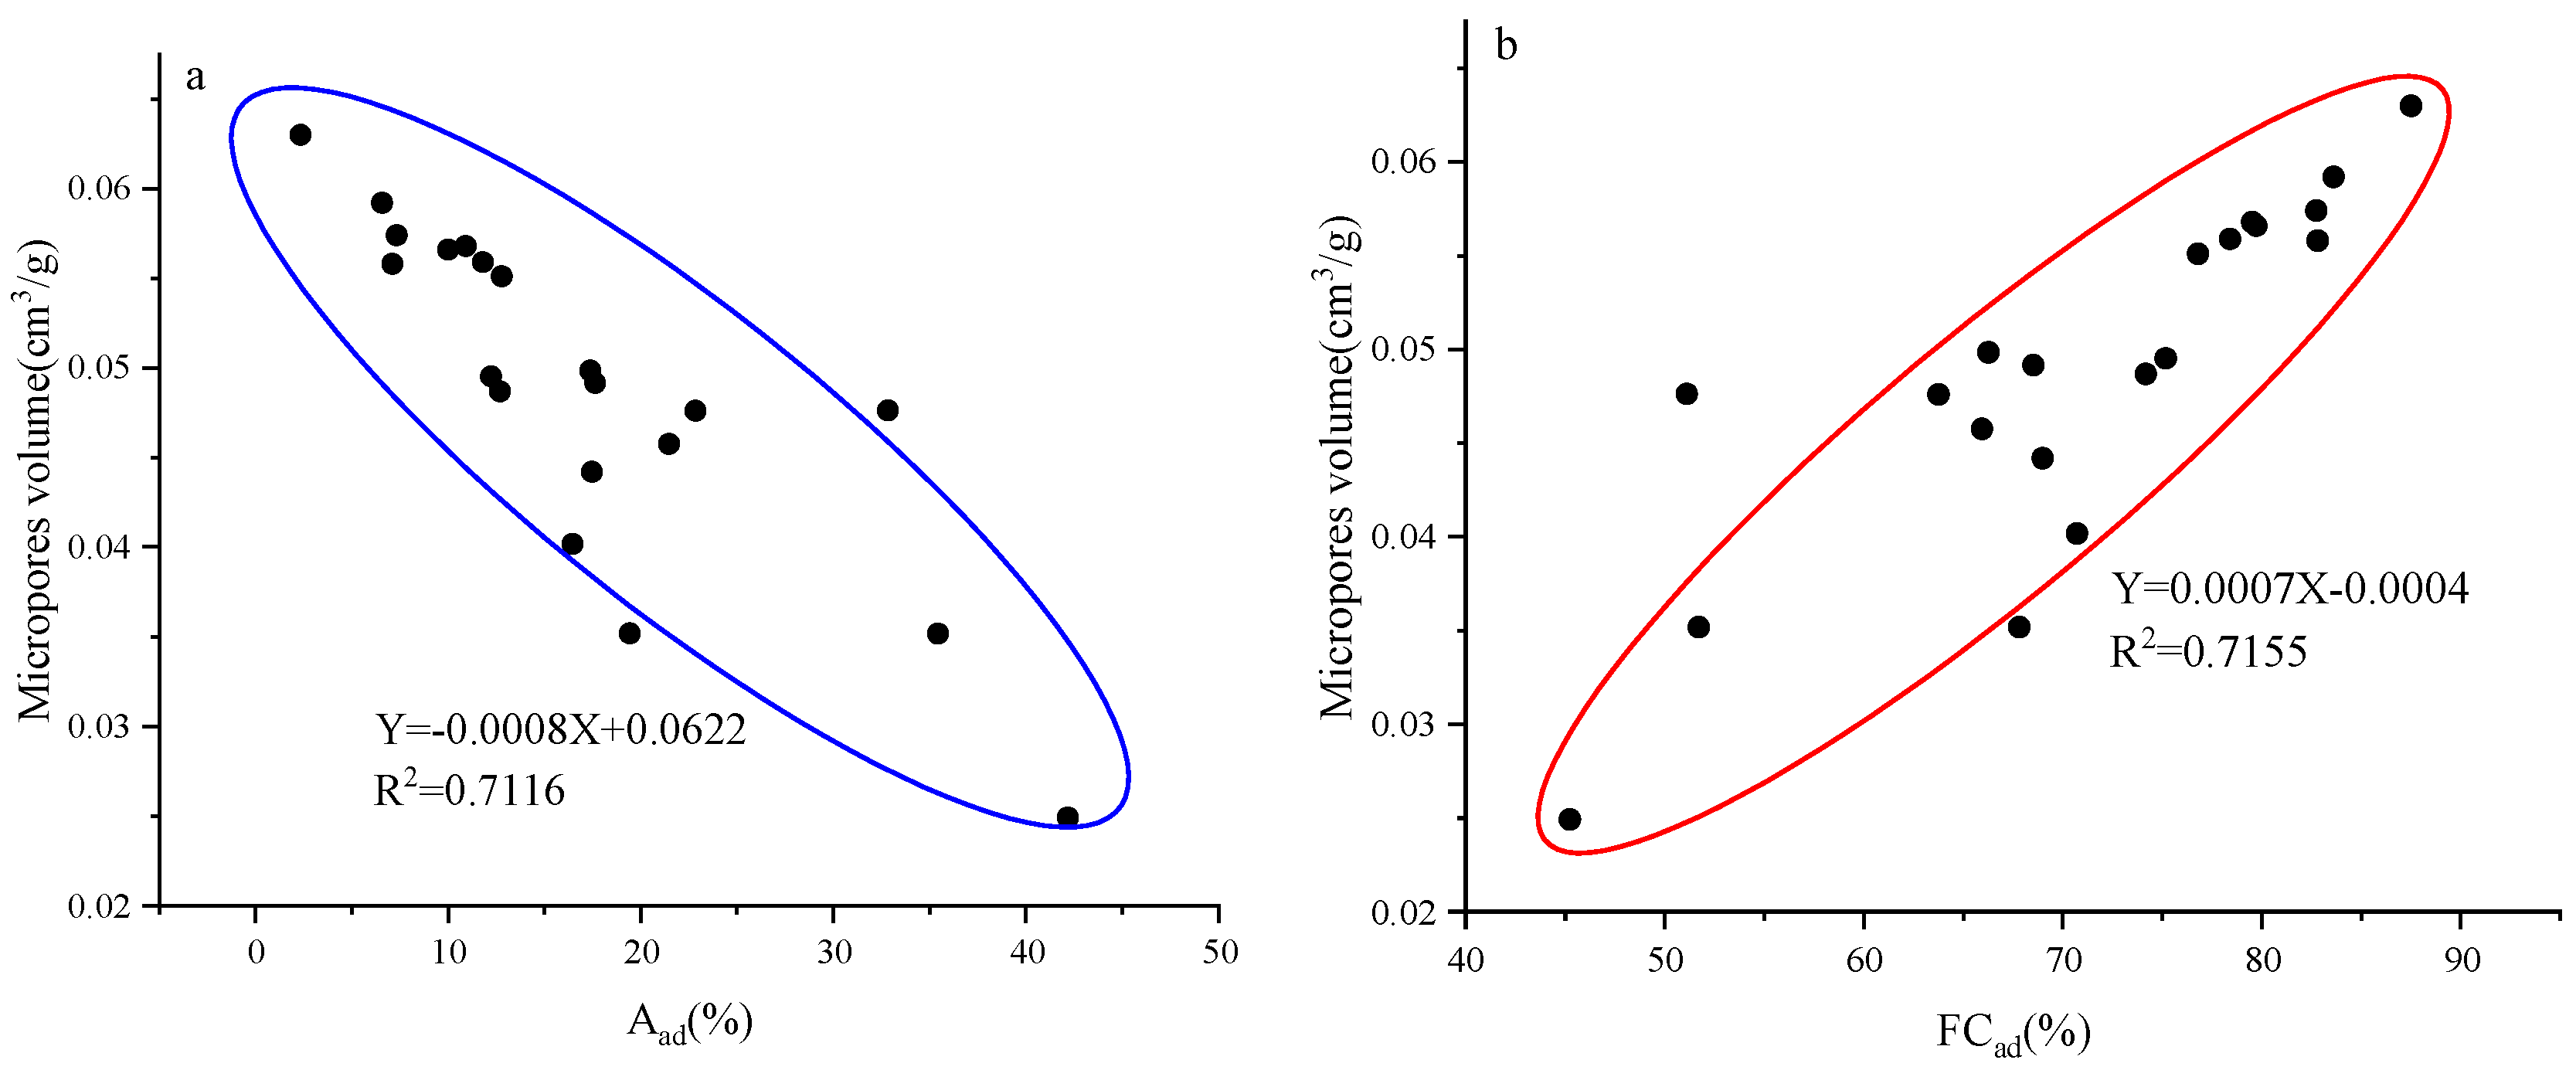
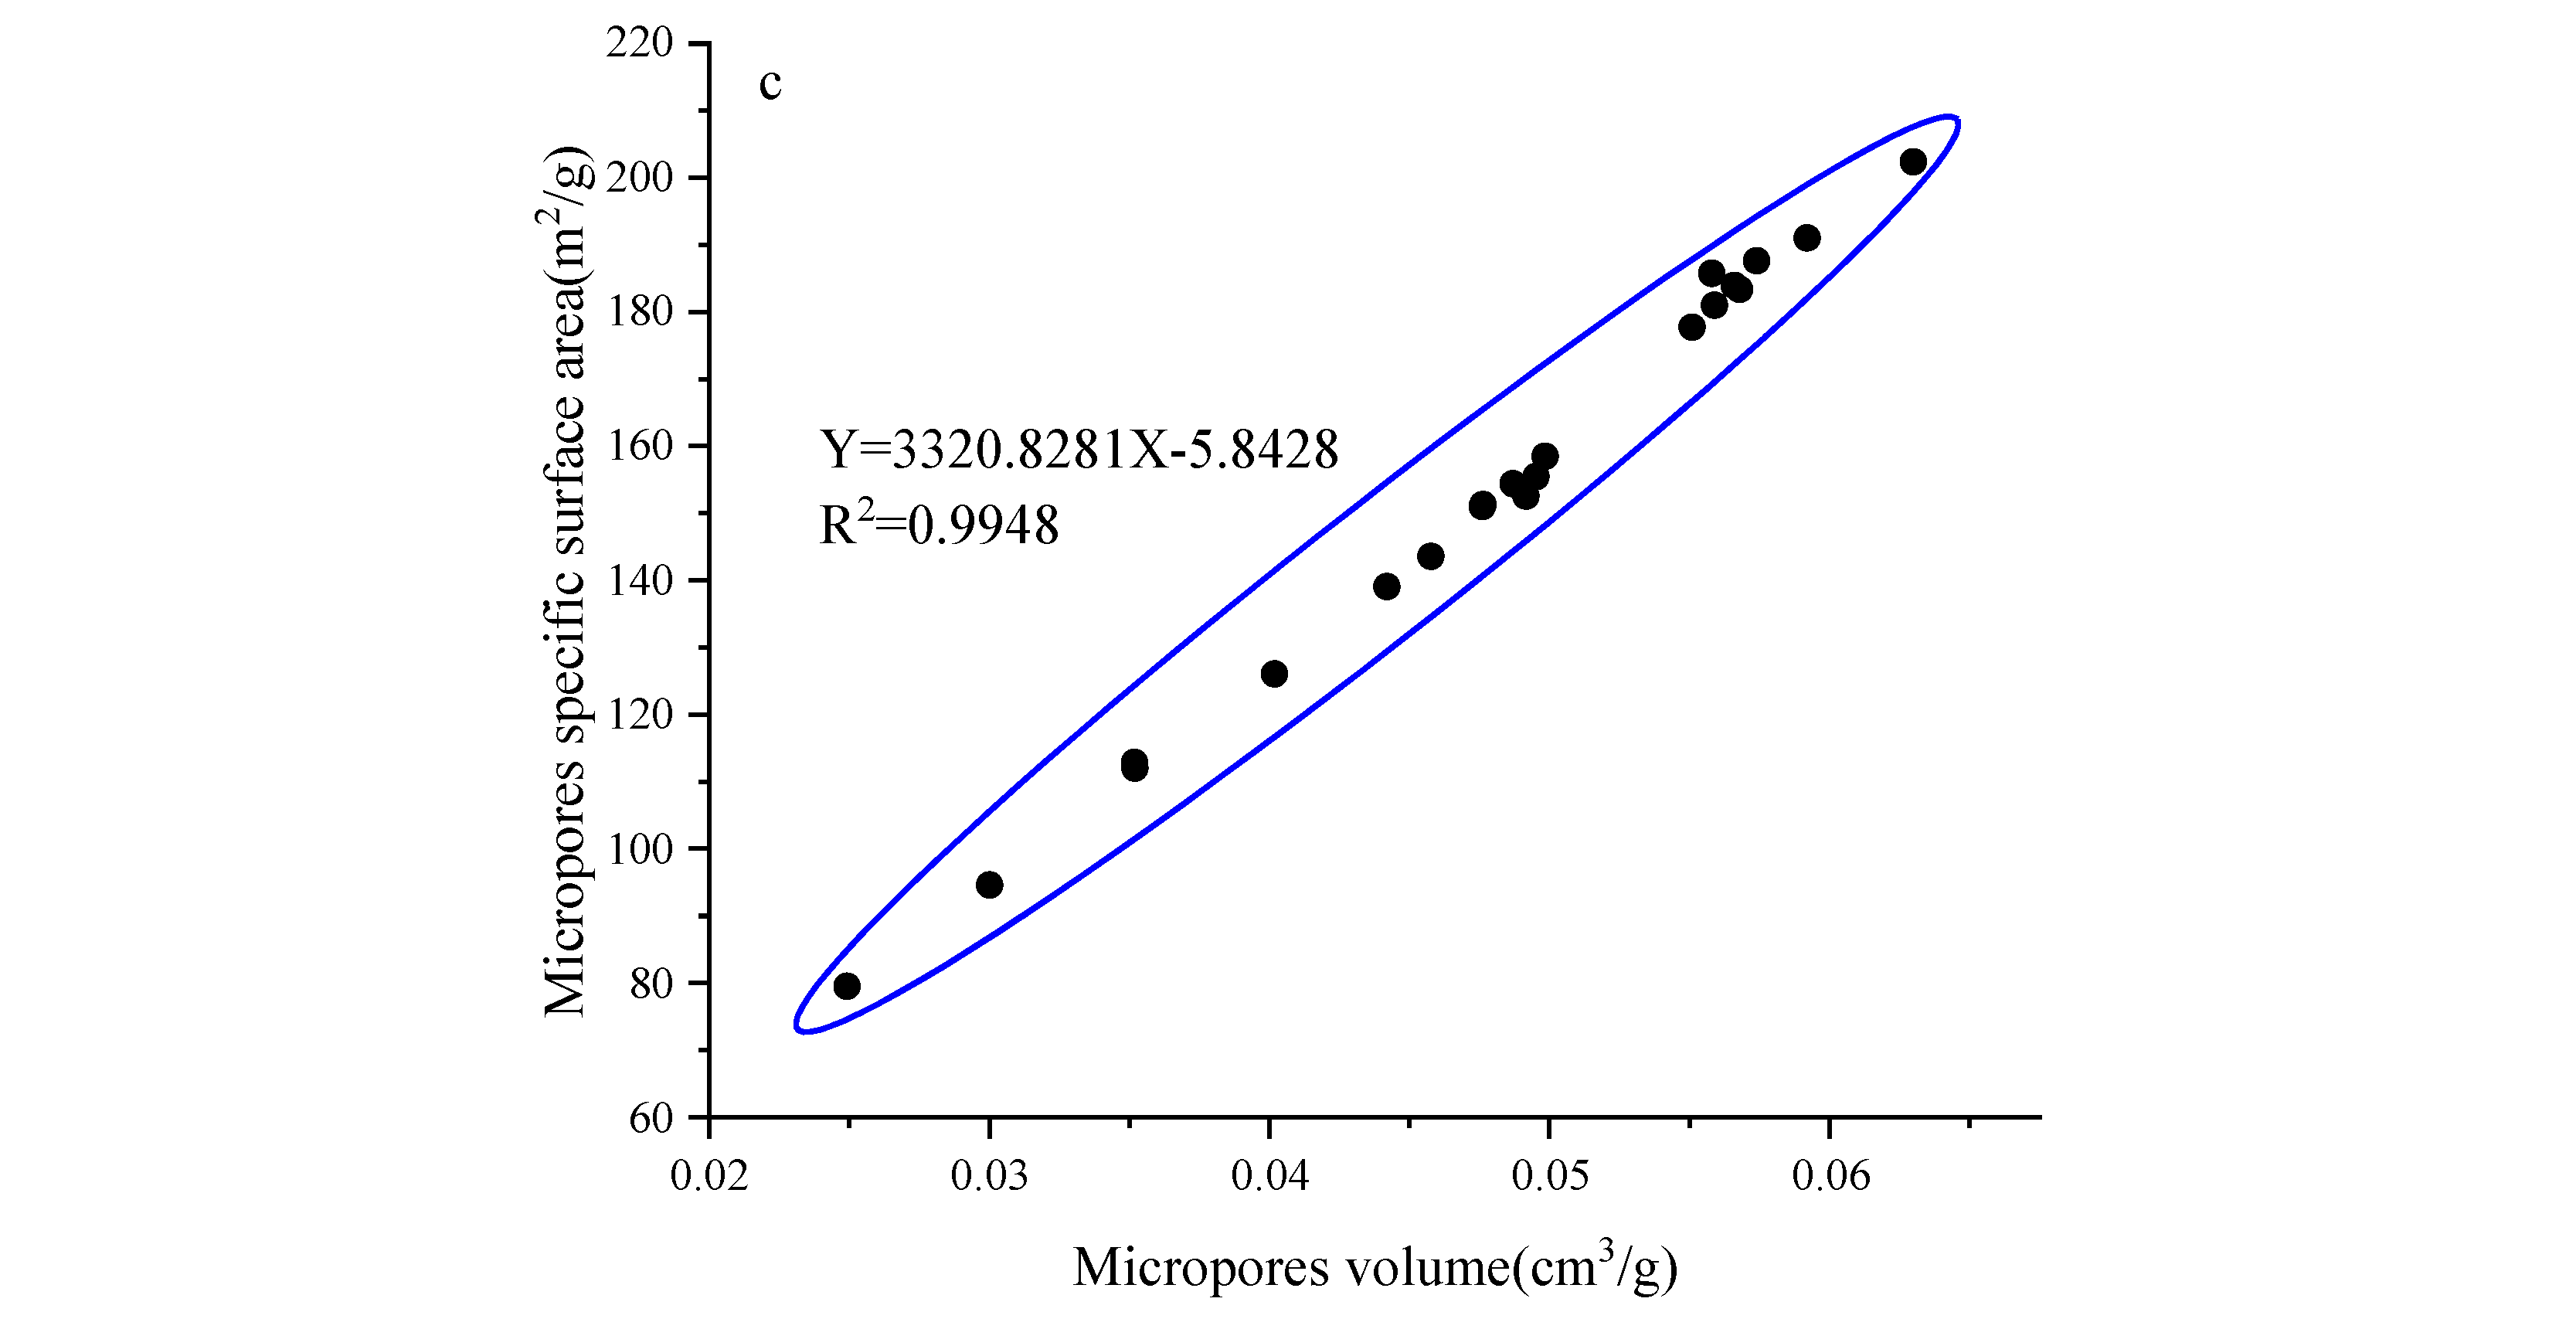
3.3.3. Micropore Pore Parameter Logging Interpretation Model

Based on the correlation studied in Section 3.2.2, the following explanatory model for the pore parameters of micropores based on ash content and fixed carbon can be established:
P V = 0.0547 0.0007 A a d + 0.0001 F C a d
PV, pore volume, cm3/g; Aad, Ash gas content, %; FCad, fixed carbon content, %.
On this basis, according to the logging response model established for ash and fixed carbon in Section 3.3.2, the interpretation model of micropore volume based on logging data can be established as follows:
P V = 0.0000344 A C 0.000188 G R + 0.0735
PV, pore volume, cm3/g; AC, transit time interval, μs/m; GR, Natural Gamma, API.
Similarly, the following explanatory model for specific surface area can be established:
S S A = 3320.8281 P V 5.8428
Combining Formulas (9) and (10) establishes the following logging parameter response interpretation model of SSA:
S S A = 0.1142 A C 0.6243 G R + 238.238
SSA, specific surface area, cm2/g; AC, transit time interval, μs/m; GR, Natural Gamma, API.
The interpretation results of the logging response model for the verified micropore pore parameters are effective (Figure 19). The interpretation model for the pore volume of micropores has a good fit between the interpreted data and the measured data, and the R2 can reach 0.8204. There is also a strong correlation between the measured data and the interpreted data of the specific surface area of micropores, and the determination coefficient R2 can reach 0.8643.

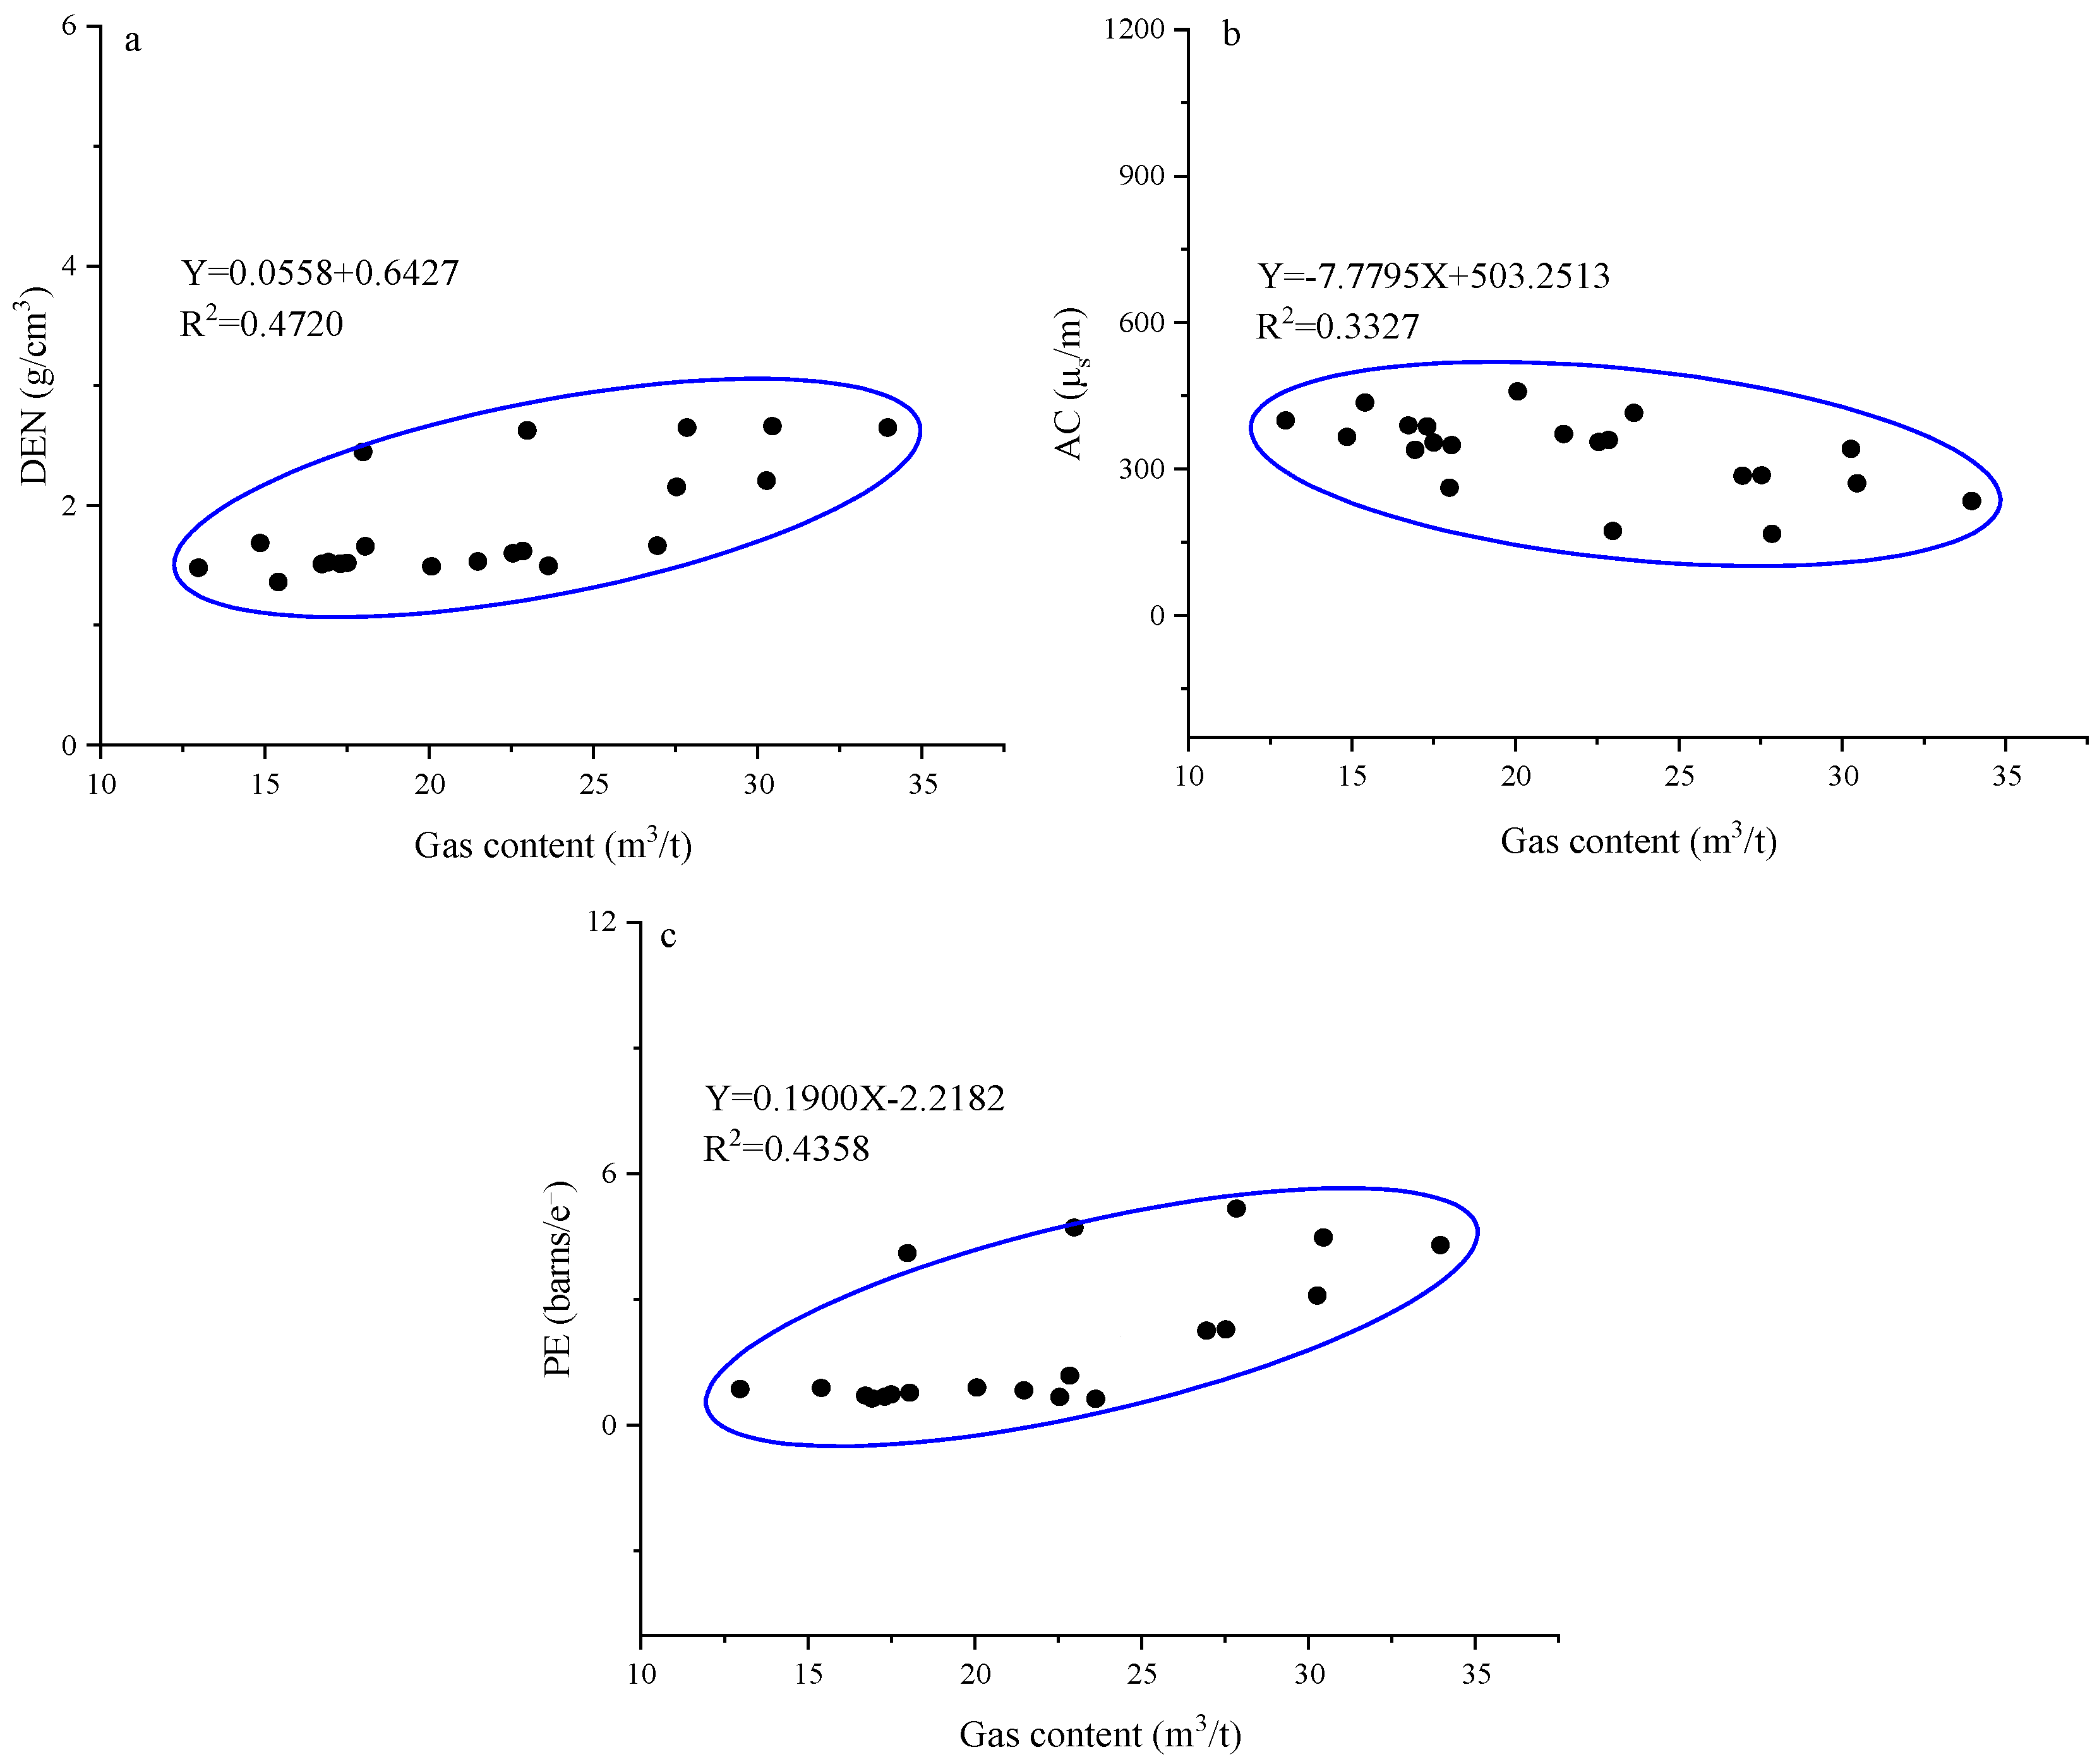
3.3.4. Gas Content Logging Interpretation Model

Based on the logging response of gas content in Section 3.2.4, AC, DEN, and PE were selected as the parameters of the gas content interpretation model in the study area. The gas content interpretation model based on multiple linear regression was established as follows:
G a s   c o n t e n t = 0.008 A C + 11.338 E N 0.497 P E 1.055
Gas content, cm3/g; AC, transit time interval, μs/m; DEN, density, g/cm3; PE, photoelectric absorption cross-sectional index, barns /e.
It has been verified that the gas content interpretation model has an interpretation effect on gas content (Figure 20). The determination coefficient between the interpretation results and the actual test results is approximately 0.48, indicating that the gas content interpretation model established based on logging response parameters can provide a certain reference value for the prediction of gas content in the study area.
In this study, the explanatory effect of some models is relatively weak, with R2 being around 0.5. Subsequently, advanced methods such as machine learning need to be utilized to further explore the potential connections among the data, thereby enhancing the reliability and accuracy of the model interpretation. This study was limited by the amount of data and methods, and the final established model had a relatively small applicable scope of interpretation. To better improve the accuracy and applicability of the model, more data needs to be collected.

4. Conclusions

Based on the coal samples from the Mizhi block in the Ordos Basin, tests such as macrolitho type of coal determination, coal maceral determination, proximate analysis, low-temperature carbon dioxide adsorption experiment, and on-site gas content test were first carried out to obtain the main reservoir parameters. Then, reservoir parameters are analyzed using the linear regression equation to identify their main logging responses. Finally, based on the main logging response parameters obtained previously, a multiple regression interpretation model is established. The research results are as follows:
(1) The study area is characterized by the development of the No. 8 coal reservoirs of the Benxi Formation, with a thickness ranging from 2 to 11.6 m, averaging 7.2 m. The thicker coal reservoirs provide favorable conditions for the formation and storage of coal-rock gas. The lithotypes are mainly semi-bright and semi-dark. The coal macerals are dominated by the content of the vitrinite, followed by the inertinite, and the exinite is the least abundant. The degree of metamorphism is high, making it a high-grade coal. In the proximate analysis, the moisture ranges from 0.36 to 1.09%, averaging 0.65%. The ash ranges from 2.34 to 42.17%, averaging 16.57%. The volatile ranges from 9.18 to 15.7%, averaging 11.50%. The fixed carbon ranges from 45.24 to 87.51%, averaging 71.28%.
(2) According to the results of scanning electron microscopy (SEM), the coal samples in the Mizhi block have developed fractures and pores. Based on the results of the carbon dioxide adsorption experiment, the micropore adsorption capacity is 7.8728–20.3395 cm3/g, with an average of 15.2621 cm3/g. The pore volume is 0.02492–0.063 cm3/g, with an average of 0.04799 cm3/g. The specific surface area of micropores is 79.514–202.3744 m2/g, with an average of 153.5118 m2/g. The micropore parameters are of great significance for the occurrence of coal-rock gas. Based on the results of the desorption experiment, the gas content of the coal rock samples in the study area is 12.97–33.96 m3/t, with an average of 21.8229 m3/t, which is relatively high.
(3) Through the correlation analysis of the logging parameters of the coal reservoir, the main logging response parameters of the reservoir are obtained. Based on the results of the logging sensitivity analysis of the coal reservoir, the interpretation model of the reservoir parameters is constructed and verified. Logging interpretation models for parameters such as industrial components, microscopic components, micropore pore parameters, and gas content are obtained. The interpretation models have interpretation effects on the reservoir parameters in the study area.
By establishing an interpretation model with higher accuracy and applicability, more precise logging interpretation and reservoir evaluation of the reservoir parameters in the target area can be achieved, thereby providing a reference basis for the planning of future coal, rock, and gas production wells. This move can improve the exploration and development efficiency of coal-rock gas in the target area.

Author Contributions

Supervision, X.Y. and Y.H.; Project administration, J.Z. and Y.H.; Conceptualization, D.L. and F.Z.; Writing—original draft preparation, J.Z. and H.G.; Writing—review and editing, H.G., X.Y. and Y.S.; Methodology, L.T. and F.Z.; Formal analysis, J.S. and L.T.; data curation, J.S. and D.L. All authors have read and agreed to the published version of the manuscript.

Funding

The project is supported by the Exploration and Development Research Institute, PetroChina Changqing Oilfield Company. “Research on deep coal-rock gas accumulation theory and benefit development technology” (Number 2023ZZ18).

Data Availability Statement

The original contributions presented in this study are included in the article. Further inquiries can be directed to the corresponding author.

Conflicts of Interest

Authors Jingbo Zeng, Yufei He, and Fengsheng Zhang were employed by the Geology Research Institute, PetroChina Log Company. Authors Xiaomin Yang, Die Liu, Yunhe Shi, and Lili Tian were employed by the Exploration and Development Research Institute, PetroChina Changqing Oilfield Company. The remaining authors declare that the research was conducted in the absence of any commercial or financial relationships that could be construed as a potential conflict of interest.

References

  1. Li, G.X.; Zhang, S.C.; He, H.Q.; He, X.X.; Zhao, Z.; Niu, X.B.; Xiong, X.Y.; Zhao, Q.; Guo, X.J.; Hou, Y.T.; et al. Coal-rock gas: Concept, connotation and classification criteria. Pet. Explor. Dev. 2024, 51, 897–911. [Google Scholar] [CrossRef]
  2. Li, G.X.; Jia, G.Z.; Zhao, Q.; Zhou, T.Q.; Gao, J.L. Coal-rock gas accumulation mechanism and the whole petroleum system of coal measures. Pet. Explor. Dev. 2025, 52, 33–49. [Google Scholar] [CrossRef]
  3. Li, G.; Wang, G.T.; Feng, N.C.; Chen, F.X.; Feng, Y.; Lu, C.G.; Tan, Y.N. Deep Coal-rock Gas in China: A Review of Distribution, Geological Characteristics, and Its Enrichment Conditions. ACS Omega 2025, 22, 23472–23491. [Google Scholar] [CrossRef] [PubMed]
  4. Liu, Q.Y.; Liu, W.H.; Qin, S.F.; Wang, W.C.; Gao, B. Gas-generating characteristics of coal rock and its marceral in thermal simulation. Pet. Geol. Explor. 2002, 24, 147–151. [Google Scholar]
  5. Ma, L. Unconventional Energy Moving Towards the “New”. China Petrochemical News, 9 December 2024. [Google Scholar]
  6. Zhao, Z.; Xu, W.L.; Zhao, Z.Y.; Yi, S.W.; Yang, W.; Zhang, Y.Q.; Sun, Y.S.; Zhao, W.B.; Shi, Y.H.; Zhang, C.L.; et al. Geological characteristics and exploration breakthroughs of coal rock gas in Carboniferous Benxi Formation, Ordos Basin, NW China. Pet. Explor. Dev. 2024, 51, 234–247+259. [Google Scholar] [CrossRef]
  7. Li, Y.; Xu, F.Y.; Tang, S.H.; Wang, Y.B.; Meng, S.Z.; Xu, Q. Progress and development direction of coalbed methane (coal-rock gas) exploration and development in the Ordos Basin. Nat. Gas. Ind. 2024, 44, 63–79. [Google Scholar]
  8. Li, M.R.; Shi, Y.H.; Fan, L.Y.; Dai, X.D.; Jing, X.Y.; Zhang, Y. Comparison of main reservoir characteristics between deep coal-rock gas of the No.8 coal seam of the Upper Paleozoic Benxi Formation and tight sand gas reservoirs, Ordos Basin. Pet. Nat. Gas. Geol. 2024, 45, 1590–1604. [Google Scholar]
  9. Huang, D.J.; Zhou, G.X.; Yang, Z.B.; Gu, J.Y.; Jing, X.Y.; Wang, J.A. Geochemical characterization of gas-water output from deep coalrock methane wells in the Ordos Basin and its geological responses. Pet. Nat. Gas. Geol. 2024, 45, 1617–1627. [Google Scholar]
  10. Al-Yaari, A.; Ching, D.L.C.; Sakidin, H.; Muthuvalu, M.S.; Zafar, M.; Alyousifi, Y.; Saeed, A.A.H.; Haruna, A. Optimum Volume Fraction and Inlet Temperature of an Ideal Nanoparticle for Enhanced Oil Recovery by Nanofluid Flooding in a Porous Medium. Processes 2023, 11, 401. [Google Scholar] [CrossRef]
  11. Al-Yaari, A.; Ching, D.L.C.; Sakidin, H.; Muthuvalu, M.S.; Zafar, M.; Haruna, A.; Merican, Z.M.A.; Yunus, R.B.; Al-dhawi, B.N.S.; Jagaba, A.H. The effects of nanofluid thermophysical properties on enhanced oil recovery in a heterogenous porous media. Case Stud. Chem. Environ. Eng. 2024, 9, 100556. [Google Scholar] [CrossRef]
  12. Yao, P.; Zhang, J.J.; Lv, D.W.; Vandeginste, V.; Chang, X.C.; Zhang, X.Y.; Wang, D.D.; Han, S.B.; Liu, Y. Effect of water occurrence in coal reservoirs on the production capacity of coalbed methane by using NMR simulation technology and production capacity simulation. Geoenergy Sci. Eng. 2024, 243, 213353. [Google Scholar] [CrossRef]
  13. Bondarenko, A.V.; Islamov, S.R.; Ignatyev, K.V.; Mardashov, D.V. Laboratory studies of polymer compositions for well-kill under increased fracturing. Perm J. Pet. Min. Eng. 2020, 20, 37–48. [Google Scholar] [CrossRef] [PubMed]
  14. Belousov, A.; Lushpeev, V.; Sokolov, A.; Sultanbekov, R.; Tyan, Y.; Ovchinnikov, E.; Shvets, A.; Bushuev, V.; Islamov, S. Experimental Research of the Possibility of Applying the Hartmann–Sprenger Effect to Regulate the Pressure of Natural Gas in Non-Stationary Conditions. Processes 2025, 13, 1189. [Google Scholar] [CrossRef]
  15. Han, S.B.; Bai, S.T.; Tang, Z.Y.; Rui, Y.R.; Gong, D.J.; Zhang, J.C. Nitrogen-rich gas shale logging evaluation and differential gas-bearing characterization of lower Cambrian formation in northern Guizhou, south China. Mar. Pet. Geol. 2020, 115, 104270. [Google Scholar] [CrossRef]
  16. Han, S.B.; Xiang, C.H.; Du, X.; Xie, L.F.; Bai, S.T.; Wang, C.S. Logging evaluation of deep multi-type unconventional gas reservoirs in the Songliao basin, northeast China: Implications from continental scientific drilling. Int. J. Coal Geol. 2023, 265, 104153. [Google Scholar] [CrossRef]
  17. Liu, C.Y.; Zhao, H.G.; Gui, X.J.; Yue, L.P.; Zhao, J.F.; Wang, J.Q. Space-Time Coordinate of the Evolution and Reformation and Mineralization Response in Ordos Basin. Acta Geol. Sin. 2006, 80, 617–638. [Google Scholar]
  18. Yu, X.H.; Wang, X.Z.; Wang, N.X.; Shan, X.; Zhou, J.S.; Han, X.Q.; Li, Y.L.; Du, Y.H.; Zhao, C.F. Sequence stratigraphic framework and sedimentary evolution characteristics of gas-bearing sandbody in the Upper Paleozoic in southeastern Ordos Basin. J. Palaeogeogr. 2017, 19, 935–954. [Google Scholar]
  19. Li, Q.M. Analysis on the Correlation of Different Types of oil and Gas Reservoirs in Mesozoic and Paleozoic in Ordos Basin. Master’s Thesis, Northwest University, Xi’an, China, 2021. [Google Scholar]
  20. Zhang, K. Tectonics and Resources of the Ordos Block; Shaanxi Science and Technology Press: Xi’an, China, 1989. [Google Scholar]
  21. Fu, J.H.; Luo, S.S.; Niu, X.B.; Lü, Q.Q.; Xu, L.M.; Feng, S.B.; Li, S.X. Sedimentary Characteristics of Channel Type Gravity Flow of the Member 7 of Yanchang Formation in the Longdong Area, Ordos Basin. Bull. Mineral. Petrol. Geochem. 2015, 34, 29–37. [Google Scholar]
  22. Li, D.S. Re—Understanding of Ordos Basin petroleum geology. Pet. Explor. Dev. 2004, 31, 1–7. [Google Scholar]
  23. Wang, R. Causes of Low Coalbed Methane Production Wells and Optimization of Reservoir Improvement Technology in A Block in the Eastern Ordos Basin. Master’s Thesis, Henan Polytechnic University, Jiaozuo, China, 2023. [Google Scholar]
  24. Chen, Q.H. Research on Sedimentary Systems and Hydrocarbons Enrichment of the Upper Palaeozoicof the Ordos Basin. Ph.D. Thesis, Northwest University, Xi’an, China, 2007. [Google Scholar]
  25. Tian, Y.; Zhong, J.H.; Wang, S.B.; Tao, H.S.; Liu, S.G.; Li, Y.; Sun, N.L.; Shao, Z.F.; Ni, L.T.; Mao, C.; et al. Seismites and their geological significances of the Triassic Yanchang Formation in Fuxian exploration area, Ordos Basin. J. Palaeogeogr. 2015, 17, 541–552. [Google Scholar]
  26. Li, Q.; Lu, H.; Wu, S.H.; Xia, D.L.; Li, J.S.; Qi, F.Q.; Fu, Y.P.; Wu, Y. Sedimentary origins and reservoir characteristics of the Triassic Chang 73 tuffs in the southern Ordos Basin. Pet. Nat. Gas. Geol. 2022, 43, 1141–1154. [Google Scholar]
  27. Li, J.; Luo, X.; Shan, X.Q.; Ma, C.H.; Hu, G.Y.; Yan, Q.T.; Liu, R.E.; Chen, H.H. Natural gas accumulation in the Upper Paleozoic of Ordos Basin, China. Pet. Explor. Dev. 2005, 32, 54–59. [Google Scholar]
  28. Yang, J.J. Tectonic Evolution and Oil-Gas Distribution Regularities in the Ordos Basin; Petroleum Industry Press: Beijing, China, 2002. [Google Scholar]
  29. Guo, S.L.; Meng, P.L.; Song, L.J.; Wang, S.C.; Shi, L.; Yang, G.P.; Fu, X.Y. Control effect of Taiyuan-based paleogeomorphology on the sand body in Mizhi Gasfield. Complex. Hydrocarb. Reserv. 2024, 17, 78–85. [Google Scholar]
  30. Wan, Y.P.; Wang, Z.C.; Han, S.B.; Qiao, Y.; Gao, H.T. Geological characteristics and resource potential of deep coalbed methane accumulation in Yan’an Gas Field, southeastern margin of Ordos Basin. Nat. Gas. Geosci. 2024, 35, 1724–1739. [Google Scholar]
  31. GB/T 18023-2000; Classification of Macrolithotype for Bituminous Coal. National Standard: Beijing, China, 2000.
  32. GB/T 6948-2008; Method of Determining Microscopically the Reflectance of Vitrinite in Coal. National Standard: Beijing, China, 2009.
  33. SY/T 5162-2021; Scanning Electron Microscope Analysis Method of Rock Samples. Petroleum Industry Standard: Beijing, China, 2021.
  34. GB/T 212-2008; Proximate Analysis of Coal. National Standard: Beijing, China, 2008.
  35. GB/T 21650.3-2011; Pore Size Distribution and Porosity of Solid Materials by Mercury Porosimetry and Gas Adsorption—Part 3: Analysis of Micropores by Gas Adsorption. National Standard: Beijing, China, 2011.
  36. GB/T 19559-2021; Method of Determining Coalbed Methane Content. National Standard: Beijing, China, 2021.
  37. Shi, Y.J.; He, Y.F.; Wan, J.B.; Guo, X.K.; Yu, H.G.; Yang, R.J. Research on logging evaluation methods for geological quality and gas content of deep coal measure gas. China Pet. Explor. 2024, 29, 126–141. [Google Scholar]
  38. Han, S.B.; Tang, Z.Y.; Bai, S.T.; Wan, L.; Rui, Y.R.; Gao, Y.; Huang, Y.J.; Wang, C.S. Application of elemental capture spectroscopy in deep tight reservoir evaluation: A case study of well SK-2. Earth Sci. Front. 2022, 29, 449–458. [Google Scholar]
  39. Han, S.B.; Du, X.; Bai, S.T.; Wang, C.S. Logging evaluation of deep lacustrine shale reservoir in Songliao Basin: A case study of international continental scientific drilling. J. Cent. South Univ. (Sci. Technol.) 2022, 53, 3271–3286. [Google Scholar]
  40. Wang, L.H.; Xiang, M. Study on Log Prediction Model of Coalbed Methane Content. Technol. Wind. 2018, 26, 144–145. [Google Scholar]
  41. Zhang, P.; Wang, K.; Yu, T.; Zhao, M.Z. Prediction of Coalbed Methane Content Based on Multiple Linear Regression Analysis. Coal Technol. 2016, 35, 112–115. [Google Scholar]
  42. Hu, Y.F.; Zhang, S.A.; Wu, Z.Y. Modeling Method of Coalbed Methane Content Based on Geological Multivariate Statistical Analysis: A Case Study of No. 3 Coal Seam in a Block in the Southern Qinshui Basin. Coal Geol. Explor. 2013, 41, 33–36. [Google Scholar]
  43. Han, S.B.; Xie, L.F.; Du, X.; Xiang, C.H.; Huang, J.; Tang, Z.Y.; Wang, C.S.; Brain, H.; Mahlstedt, N. Insights into organic metagenesis using Raman spectroscopy and high resolution mass spectrometry: A case study of the Shahezi formation, deep Songliao basin, China. Int. J. Coal Geol. 2023, 265, 104153. [Google Scholar] [CrossRef]
  44. Deng, Z.; Wang, H.Y.; Jiang, Z.X.; Ding, R.; Li, Y.Z.; Wang, T. Influence of deep coal pore and fracture structure on occurrence of coalbed methane: A case study of Daning-Jixian Block in eastern margin of Ordos Basin. Coal Sci. Technol. 2024, 52, 106–123. [Google Scholar]
Figure 1. Well location distribution and logging interpretation diagram in the study area of the Ordos Basin (a,b).
Processes 13 02062 g001
Figure 2. Macroscopic coal types of samples in the Mizhi area. (a) S5, semi-dull coal and primary structure coal; (b) S7, semi-bright coal and primary structure coal; (c) S10, semi-dark coal and primary structure coal; (d) S15, semi-bright coal and fragmented coal; (e) S17, fragmented coal; (f) S20, fragmented coal.
Processes 13 02062 g002
Figure 3. Macroscopic coal types of samples in the Mizhi area (ad).
Processes 13 02062 g003
Figure 4. Triangular diagram of microscopic coal components in the Mizhi block.
Processes 13 02062 g004
Figure 6. Logging response characteristics of vitrinite content (ac).
Processes 13 02062 g006
Figure 7. Logging response characteristics of exinite content (a,b).
Processes 13 02062 g007
Figure 8. Response analysis diagram of logging parameters for Ro,max (a,b).
Processes 13 02062 g008
Figure 10. Logging parameter response characteristics of ash (a,b).
Processes 13 02062 g010
Figure 11. Logging parameter response characteristics of moisture (ad).
Processes 13 02062 g011
Figure 12. Logging parameter response characteristics of volatile matter (a,b).
Processes 13 02062 g012
Figure 13. The pore types of the coal sample under SEM (af).
Processes 13 02062 g013
Figure 14. Experimental curves of carbon dioxide adsorption (af). (a,c,e) The adsorption capacity (measured in cm3/g) is divided into three groups of samples (S1–S7, S8–S13, S14–S21); (b,d,f) The contribution of pore width to the pore volume of micropores.
Processes 13 02062 g014
Figure 15. Correlation analysis diagram of micropore parameters (ac).
Processes 13 02062 g015aProcesses 13 02062 g015b
Figure 16. Response characteristics of gas content logging (ac).
Processes 13 02062 g016
Figure 17. Interpretation results of the microscopic components and Ro,max (ad).
Processes 13 02062 g017aProcesses 13 02062 g017b
Figure 18. Verification results of the industrial component logging interpretation model (ad).
Processes 13 02062 g018
Figure 19. Verification results of the micropore parameter interpretation model (a,b).
Processes 13 02062 g019
Figure 20. Verification results of the gas content logging interpretation model.
Processes 13 02062 g020
Table 1. Sample Basic Experimental Results Table.
SamplesDepth
(m)
Ro,max
(%)
Coal Maceral ComponentsProximate ComponentsGas Content
(m3/t)
Vitrinite
(%)
Exinite
(%)
Inertinite
(%)
Mad
(%)
Aad
(%)
Vad
(%)
FCad
(%)
S12425.451.9659.262.3638.380.4832.8315.5751.1214.85
S22426.221.947.2232.2920.490.6522.8412.7563.7615.4
S32427.271.8850.5217.5331.960.9812.6912.1674.1723.63
S42427.891.965.542.731.760.6517.3815.766.2718.05
S52428.651.8952.862.0245.120.6512.2311.9575.1721.48
S62429.291.9458.111.6940.20.7921.4611.8165.9420.07
S72429.91.8933.4516.7249.831.0911.0411.5476.3322.85
S82430.551.8953.064.4242.520.6642.1711.9345.2412.97
S92431.011.8859.714.0336.260.9835.4211.8851.7217.3
S102431.691.8843.5925.6430.770.9316.4611.8970.7222.55
S112432.61.8959.725.5634.720.7919.4311.9667.8217.5
S122433.251.8747.3118.6434.050.717.4712.8468.9916.73
S132434.081.8741.4517.0941.450.7217.6313.1368.5216.93
S142625.152.13100000.362.349.7987.5122.98
S152627.312.1453.05046.940.56.589.3183.6127.85
S162628.532.2879.17020.820.417.119.6782.8117.98
S172628.81.9754.14045.930.417.339.5282.7426.95
S182629.642.0590.9309.130.5109.7779.7327.53
S192630.352.1482.98016.950.3910.929.1879.5133.96
S202630.612.3548.62051.280.5111.819.2778.4130.45
S212630.942.2421.35078.670.512.789.9376.7930.27
Note: Mad is water content, %; Aad is ash content, %; Vad is volatile content, %; FCad is fixed carbon content, %.
Table 2. Micropore parameters.
SampleMicropore
Pore Volume (cm3/g)Specific Surface Area (m2/g)
S10.047626151.2911
S20.047607151.0338
S30.048696154.4125
S40.049852158.5131
S50.049521155.4454
S60.045764143.59
S70.03000994.586
S80.02491579.514
S90.035183112.8362
S100.04018126.0523
S110.035195112.02
S120.044203139.08
S130.049163152.5472
S140.063202.3744
S150.0592191.0065
S160.0558185.7854
S170.0574187.6201
S180.0566183.9549
S190.0568183.3466
S200.0559180.9863
S210.0551177.7513
Disclaimer/Publisher’s Note: The statements, opinions and data contained in all publications are solely those of the individual author(s) and contributor(s) and not of MDPI and/or the editor(s). MDPI and/or the editor(s) disclaim responsibility for any injury to people or property resulting from any ideas, methods, instructions or products referred to in the content.

